Headlines
|
|
Tech stocks have run over financials, industrials:
Tech stocks have been a darling among investors, who have shunned financials and industrials, heaping scorn on old school investors like Warren Buffett. This preference for tech has pushed those shares to a near-record weight of the S&P 500 relative to other sectors, exceeded only by 1999-2000.
Utilities stocks have come back after a sudden surge:
Earlier in June, utilities stocks enjoyed a surge that pushed all of them above their 50-day moving averages. That has since cooled and now less than a third of them are above average. The entire time, no more than 60% of them managed to climb above their 200-day averages. A similar surge-then-pause is seen in the McClellan Oscillator for the sector.
|
Smart / Dumb Money Confidence
|
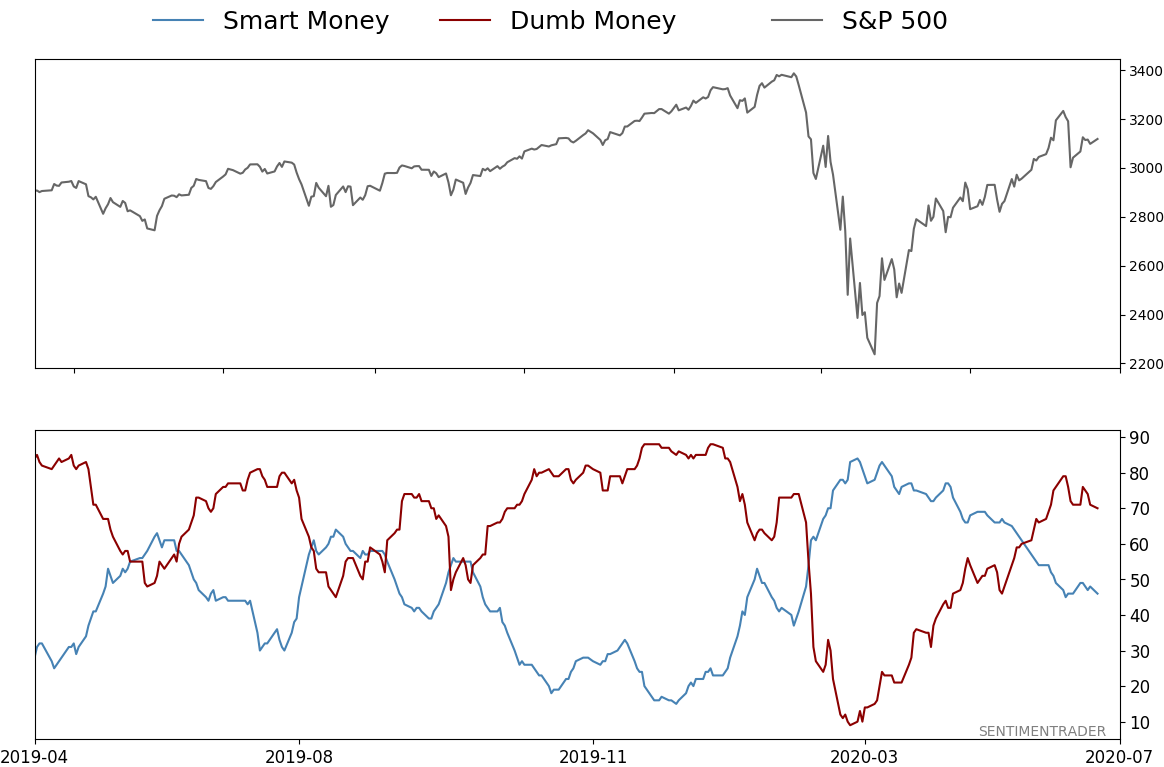
Smart Money Confidence: 46%
Dumb Money Confidence: 70%
|
|
Risk Levels
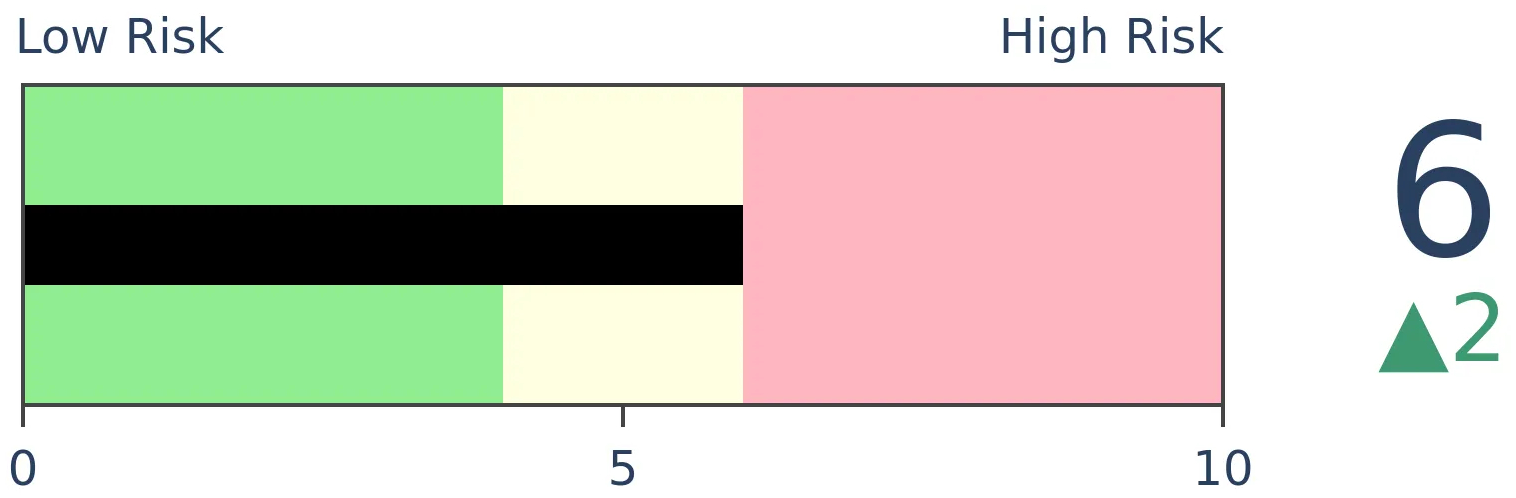
Stocks Short-Term
|
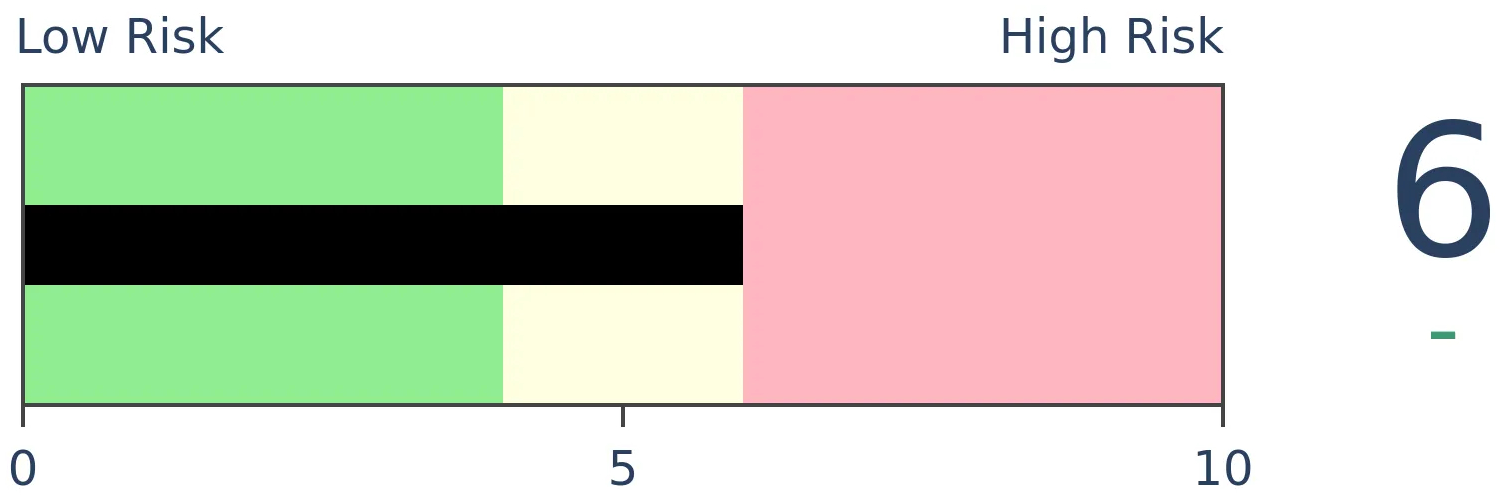
Stocks Medium-Term

|
|
Bonds
|
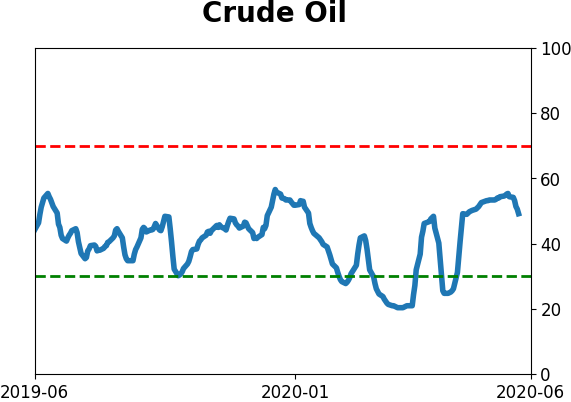
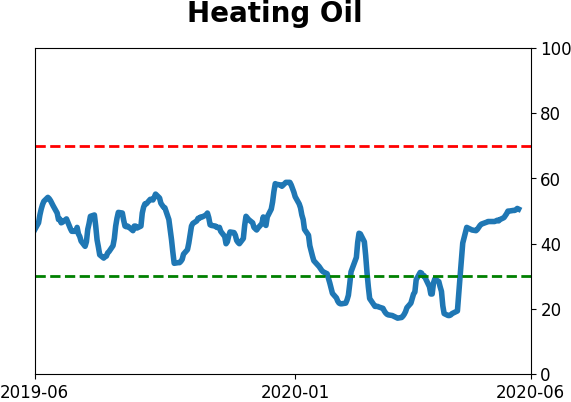
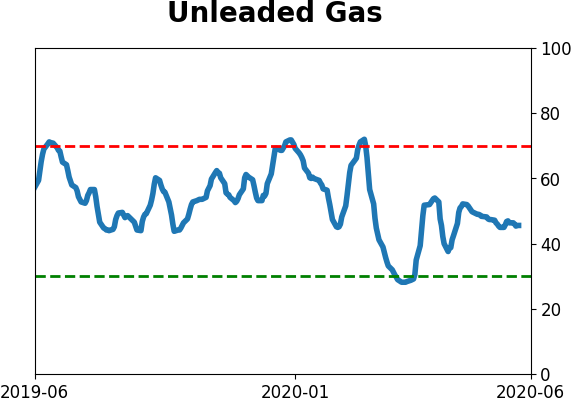
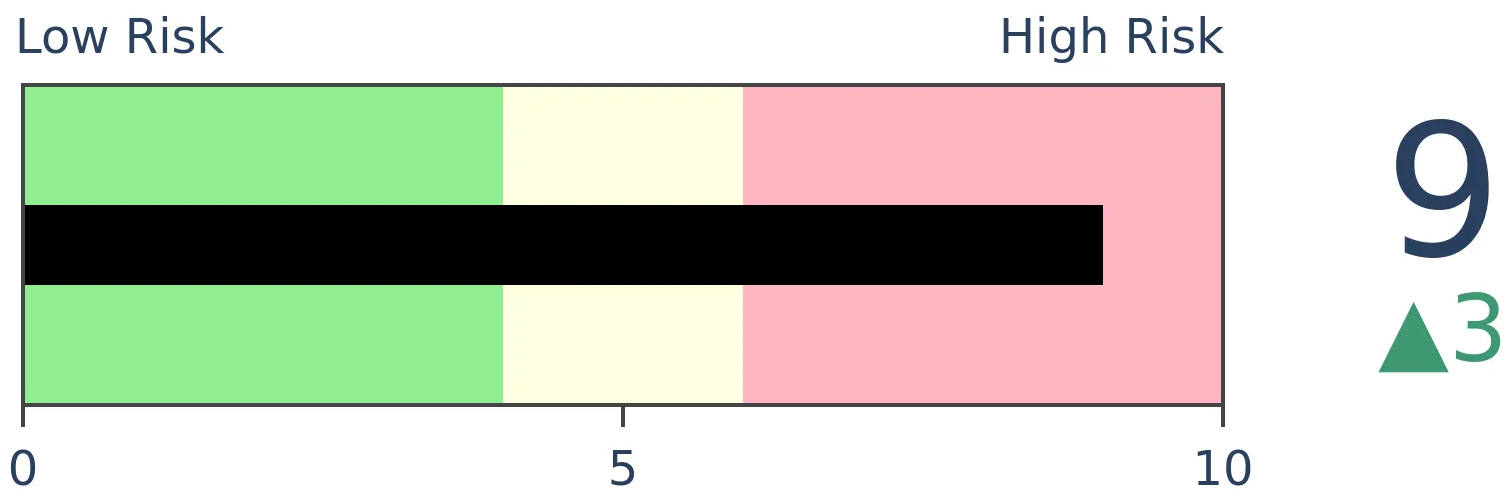
Crude Oil
|
|
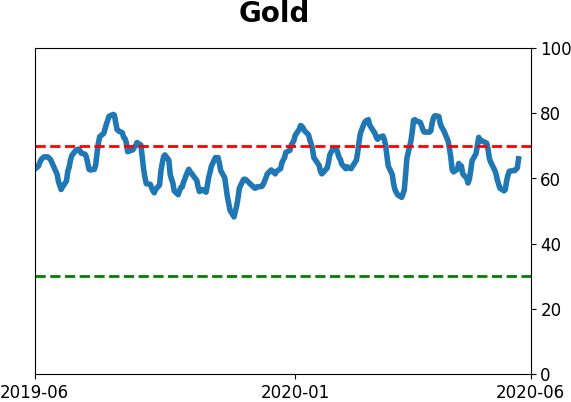
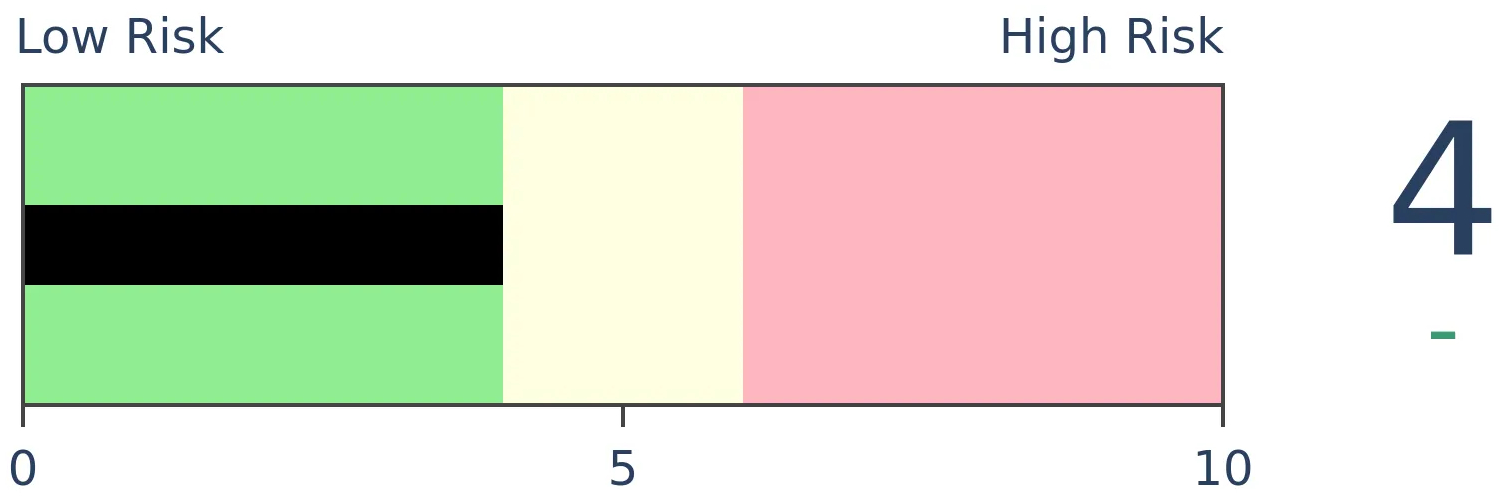
Gold

|
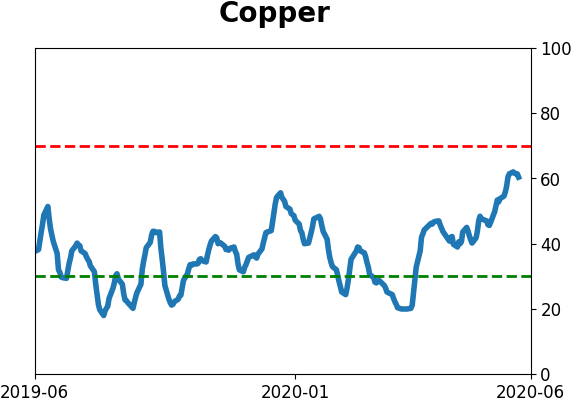
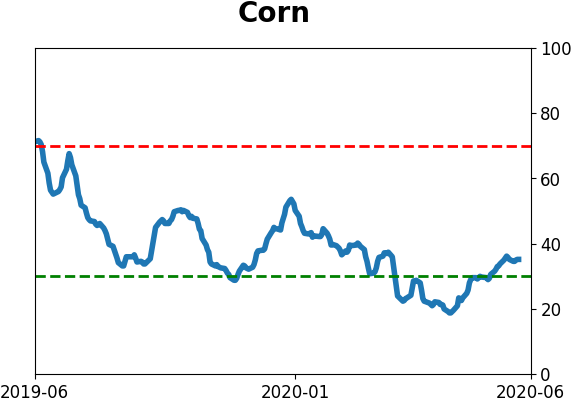
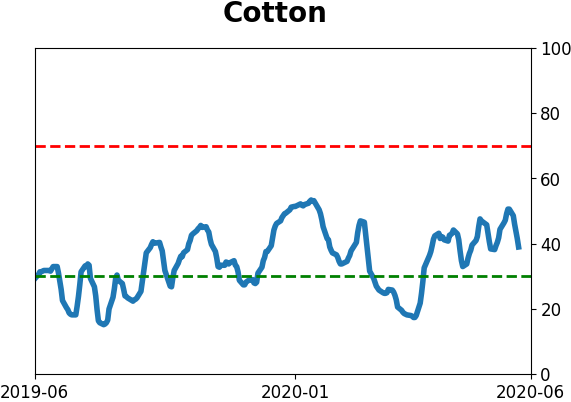
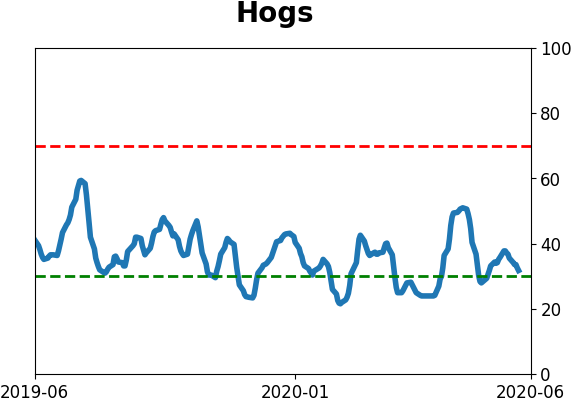
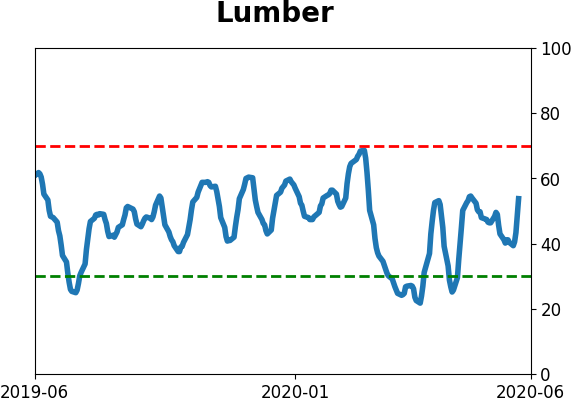
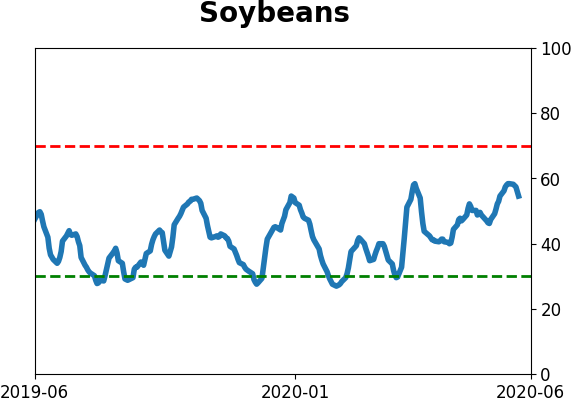
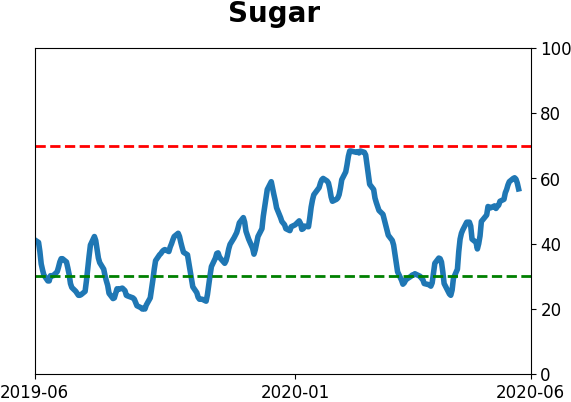
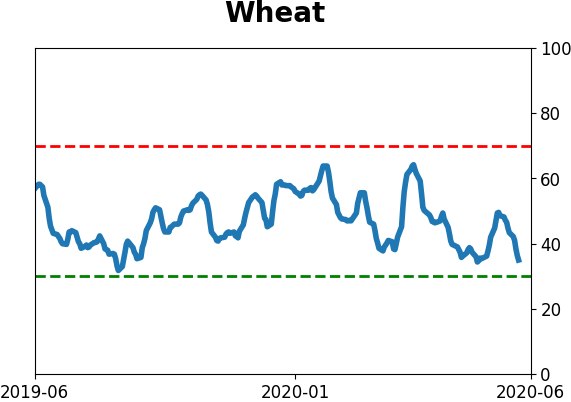
Agriculture
|
|
Research
BOTTOM LINE
Tech stocks have been a darling among investors, who have shunned financials and industrials, heaping scorn on old school investors like Warren Buffett. This preference for tech has pushed those shares to a near-record weight of the S&P 500 relative to other sectors, exceeded only by 1999-2000.
FORECAST / TIMEFRAME
None
|
There is no doubt that the pandemic panic has been good to some corners of the market, particularly technology-related stocks. And their share prices have reflected it.
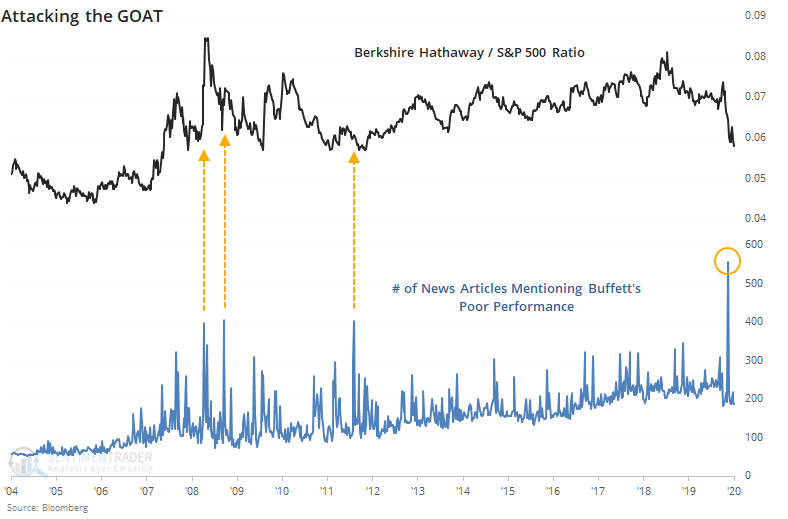
Other stocks, including industrials and financials, have struggled. It's no wonder that scorn heaped on Warren Buffett is the highest ever, thanks to conglomerates like Berkshire Hathaway being heavily invested in both sectors. Below, we can see the total number of news articles mentioning some kind of most likely derogatory mention of Buffett including terms like BAD YEAR, CRUSHED, LOSE, LOST, TOUCH, LOST TOUCH, OLD, RETIRE, PERFORMANCE, UNDERPERFORM.
The difference in investor preferences toward tech and away from other sectors has pushed the weights of these sectors to multi-decade extremes, or nearly so.
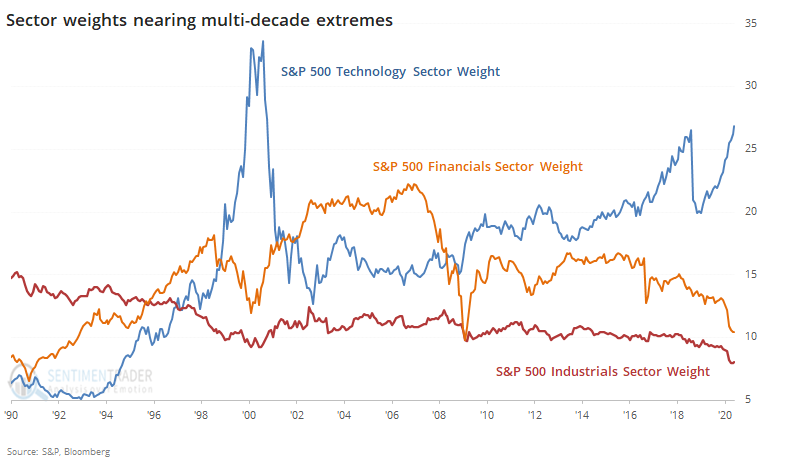
The tech sector now makes up 27% of the weight of the S&P 500. That has been exceeded only by the bubble stretch from late 1999 through the fall of 2000. Financials have sunk to barely 10% of the S&P, nearly the lowest since 1992, eclipsed only by February 2009 when it accounted for only 9.8% of the index. Industrials have been a consistently less important part of the S&P, but 2020 has been a real killer, and the sector now makes up only 8% of the index, the smallest influence in 30 years.
If we look at the spreads between the weight of technology versus financials, we can see just how stark the difference is relative to history.
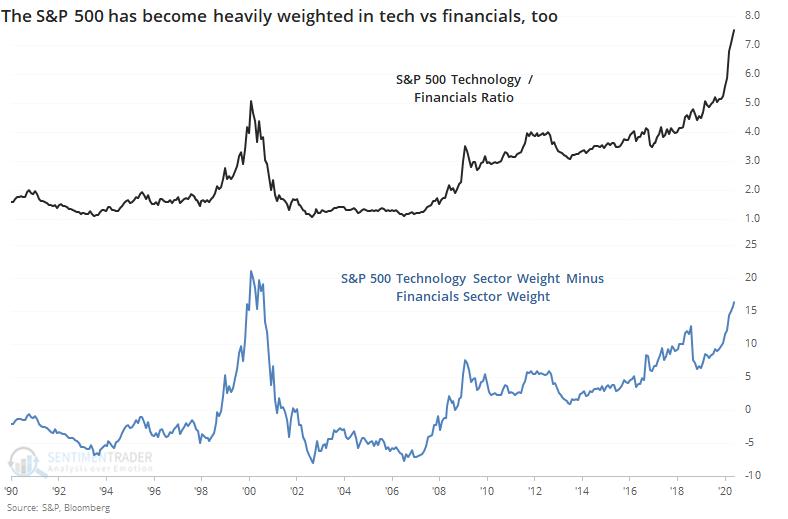
Tech stocks now have 16% more weight in the S&P than financials do, a spread that has been exceeded only once in 30 years, from December 1999 through October 2000.
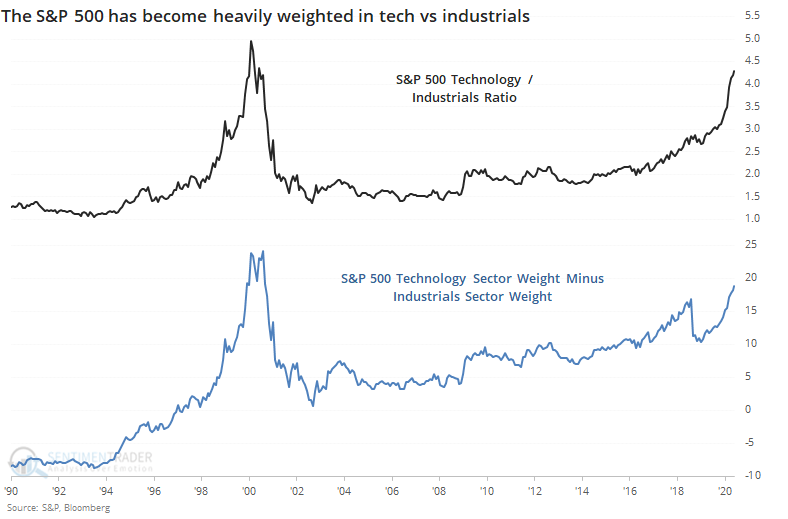
It's virtually the same picture for industrials.
If we just look at the ratio between the Nasdaq 100 (dominated by the big tech firms driving the broader Nasdaq indexes higher) versus the entire S&P 500, the monthly Relative Strength Index (RSI) has been exceeded only one other time, as Troy showed in a premium note. The current reading can only be matched by December 1999 through February 2000.
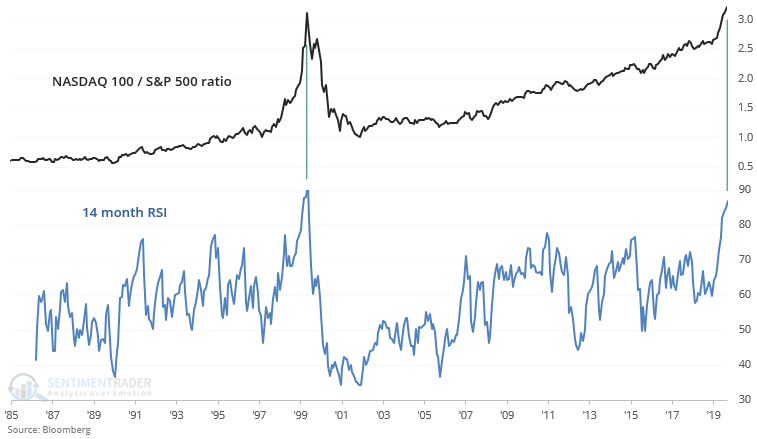
There is no guarantee that we have to repeat history, if only in rhyme. Maybe the pandemic has fundamentally altered how consumers and investors will view the world. We don't bet on "maybe", rather we'd prefer to let history be a guide and look for times when multiple factors line up. And they're lining up now to suggest that tech's run, relative to other parts of the market, in particular, is likely becoming exhausted.
BOTTOM LINE
Earlier in June, utilities stocks enjoyed a surge that pushed all of them above their 50-day moving averages. That has since cooled and now less than a third of them are above average. The entire time, no more than 60% of them managed to climb above their 200-day averages. A similar surge-then-pause is seen in the McClellan Oscillator for the sector.
FORECAST / TIMEFRAME
XLU -- Up, Long-Term
|
At various points this year, utilities stocks were market darlings, especially in January.
That shine has worn off. As the Wall Street Journal recently noted,
"That is because of concerns about falling power demand and the spike in unemployment following the lockdowns put in place to curb the outbreak, analysts said. Millions of people have lost their jobs in recent months, prompting concerns that they may stop paying their bills. As dozens of companies cut or suspended their dividends to preserve their cash piles, some investors wondered if the major utilities could be next."
Over the past few sessions, more and more utilities have declined, and now less than a third of them are trading above their 50-day moving averages. This comes quickly on the heels of a surge when all of them had been above their averages. Like we saw last week, though, all of this is in the context of what so far has been an unhealthy market. Less than 60% of utilities were able to move above their long-term 200-day moving averages, even during the medium-term surge.

Below, we can see every time when more than 85% of these stocks traded above their 50-day average, then there was a selloff so that fewer than 35% of them were above that average. The entire time, no more than 60% of them traded above their 200-day averages.
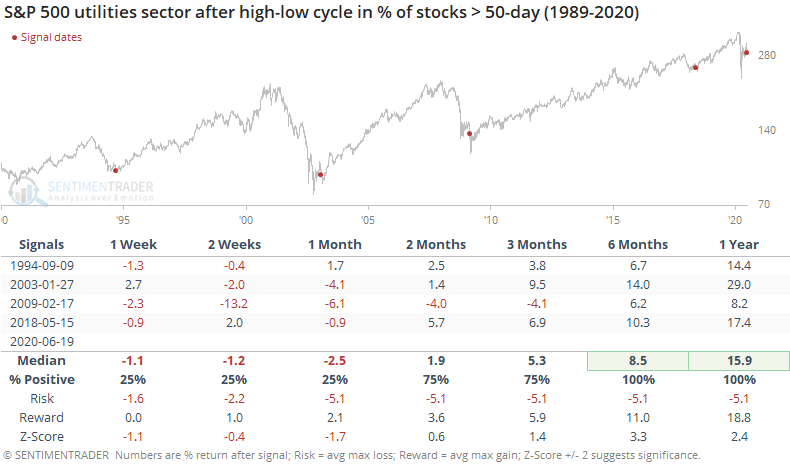
All four prior occurrences triggered during times of upheaval for utilities, and short-term returns were volatile, with a downside bias. But they were all excellent longer-term opportunities, as the sector gained consistently over the next 6-12 months.
There has been a similar reflection of this surge-then-pause when looking at the sector's McClellan Oscillator, an indication of the momentum in underlying breadth. It recently jumped above +150, the highest since 2013, and on Friday declined enough to become oversold.
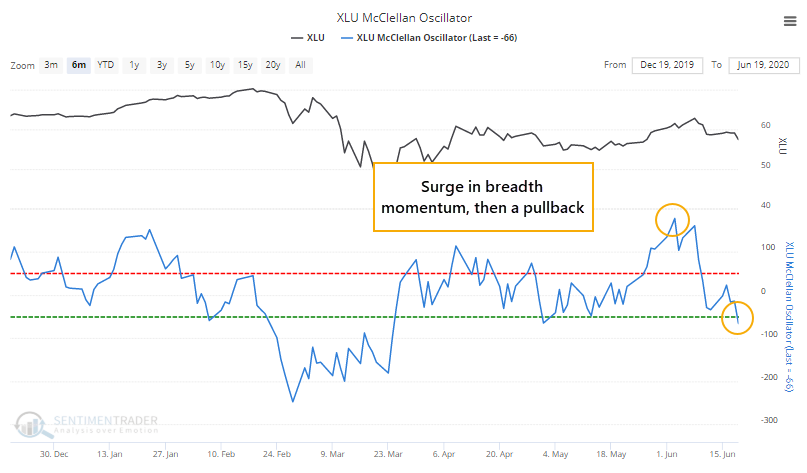
Like we saw above, when there has been a surge-then-pause, all within an "unhealthy" market where less than 60% of the stocks can move above their 200-day averages, it has preceded some rocky short-term returns, but positive longer-term ones.
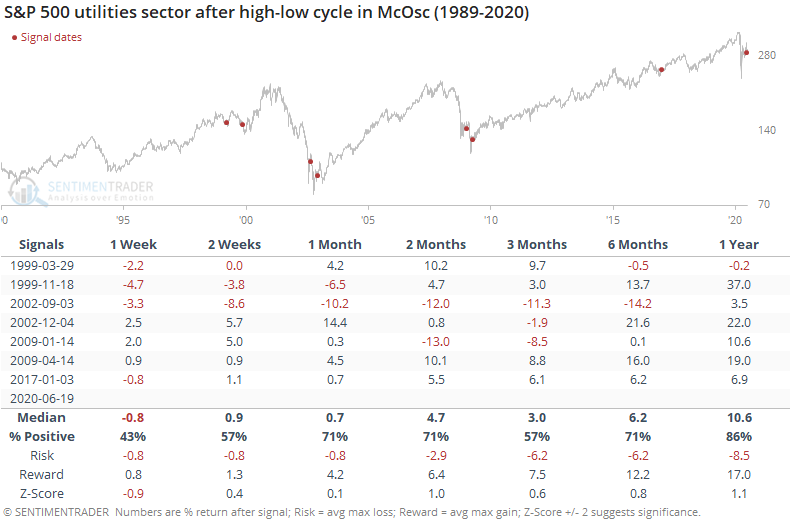
This kind of activity hasn't been enjoyable for investors in the short-term, with highly volatile swings in utilities. For those that held out, though, the sector tended to recover strongly.
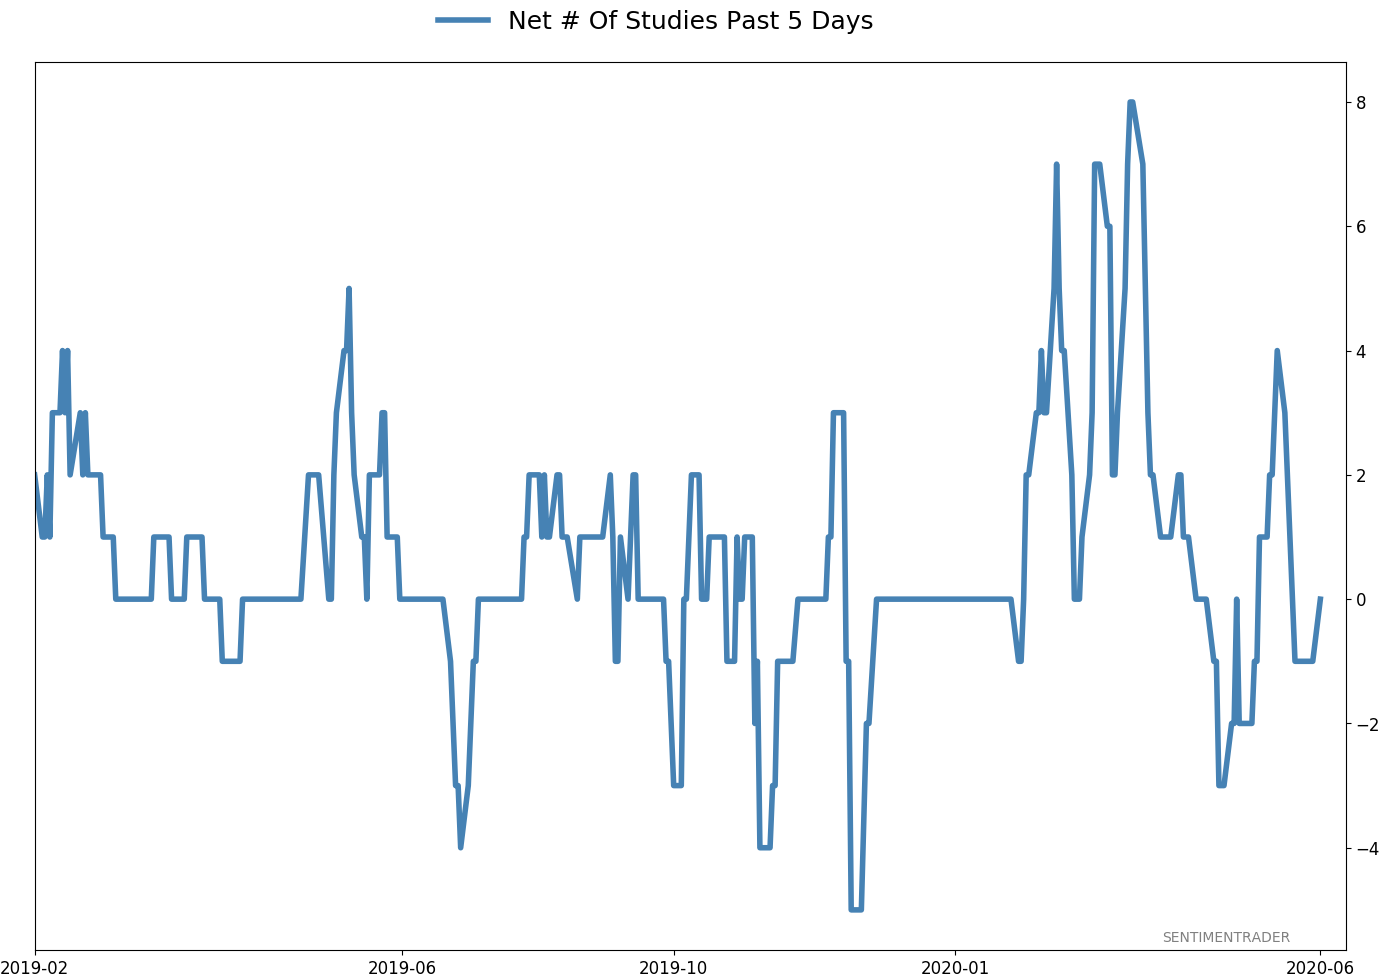
Active Studies
| Time Frame | Bullish | Bearish | | Short-Term | 0 | 1 | | Medium-Term | 8 | 6 | | Long-Term | 40 | 1 |
|
Indicators at Extremes
Portfolio
| Position | Weight % | Added / Reduced | Date | | Stocks | 29.8 | Reduced 9.1% | 2020-06-11 | | Bonds | 0.0 | Reduced 6.7% | 2020-02-28 | | Commodities | 5.2 | Added 2.4%
| 2020-02-28 | | Precious Metals | 0.0 | Reduced 3.6% | 2020-02-28 | | Special Situations | 0.0 | Reduced 31.9% | 2020-03-17 | | Cash | 65.0 | | |
|
Updates (Changes made today are underlined)
In the first months of the year, we saw manic trading activity. From big jumps in specific stocks to historic highs in retail trading activity to record highs in household confidence to almost unbelievable confidence among options traders. All of that came amid a market where the average stock couldn't keep up with their indexes. There were signs of waning momentum in stocks underlying the major averages, which started triggering technical warning signs in late January. After stocks bottomed on the 23rd, they enjoyed a historic buying thrust and retraced a larger amount of the decline than "just a bear market rally" tends to. Those thrusts are the most encouraging sign we've seen in years. Through early June, we were still seeing thrusts that have led to recoveries in longer-term breadth metrics. The longer-term prospects for stocks (6-12 months) still look decent given the above. On a short- to medium-term basis, it was getting harder to make that case. Dumb Money Confidence spiked and there were multiple signs of a historic level of speculation. Given that, I reduced my exposure a bit when stocks gapped down and failed to hold the lows of late last week. This is likely the lowest I will go given what I still consider to be compelling positives over a longer time frame. There is not a slam-dunk case to be made for either direction, so it will seem like a mistake whether stocks keep dropping (why didn't I sell more?) or if they turn and head higher (why did I let short-term concerns prevail?). After nearly three decades of trading, I've learned to let go of the idea of perfection.
RETURN YTD: -5.9% 2019: 12.6%, 2018: 0.6%, 2017: 3.8%, 2016: 17.1%, 2015: 9.2%, 2014: 14.5%, 2013: 2.2%, 2012: 10.8%, 2011: 16.5%, 2010: 15.3%, 2009: 23.9%, 2008: 16.2%, 2007: 7.8%
|
|
Phase Table
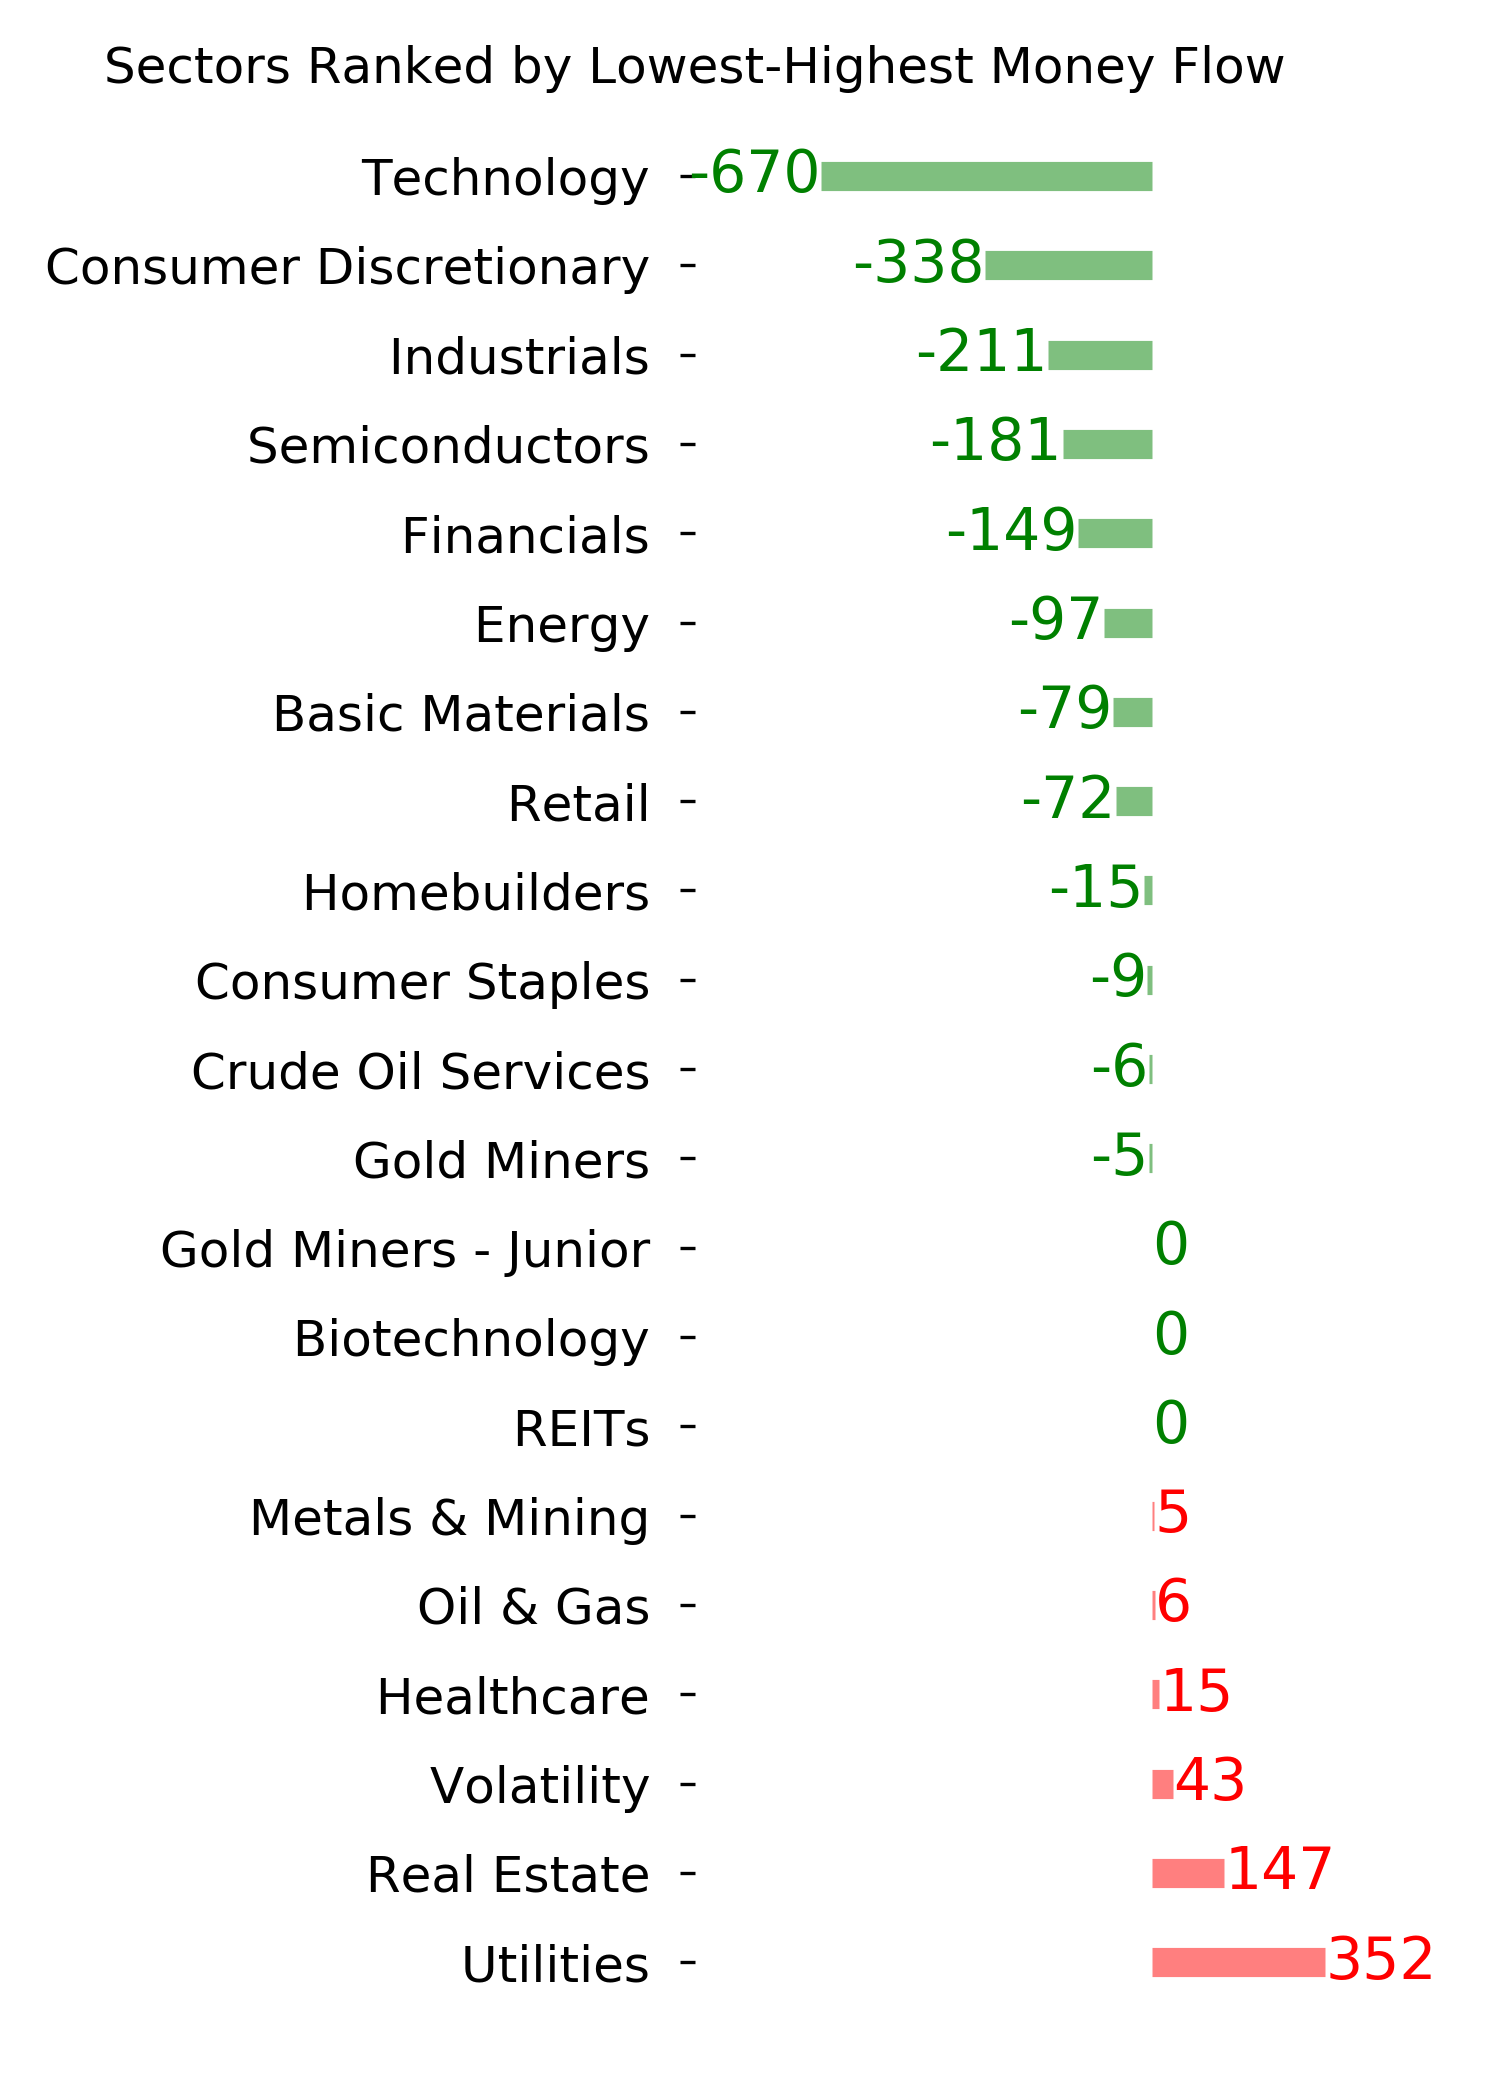
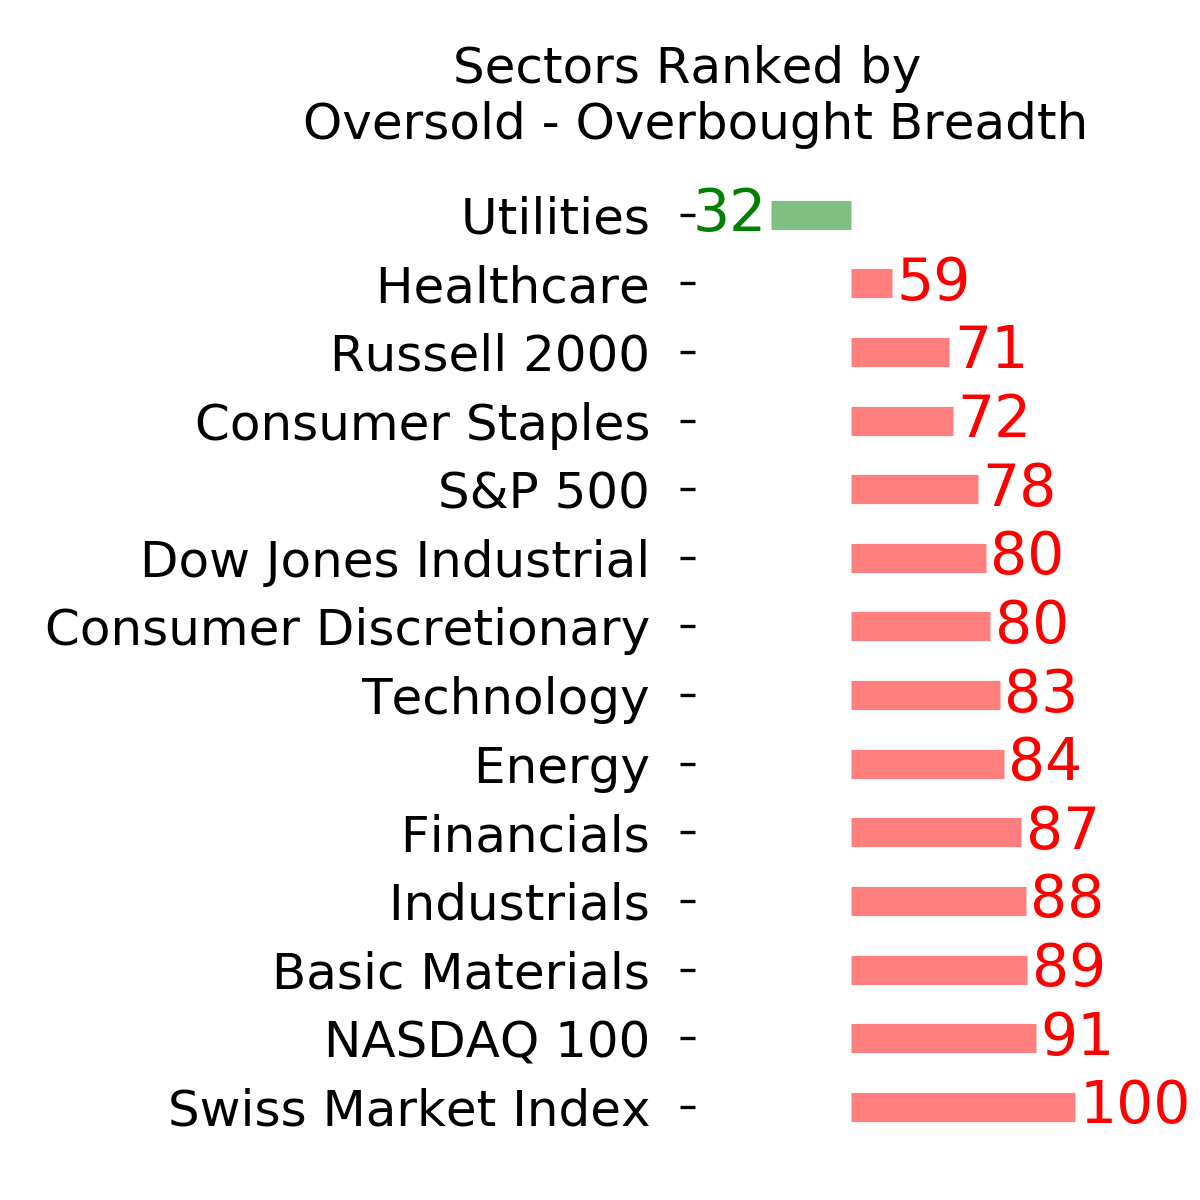
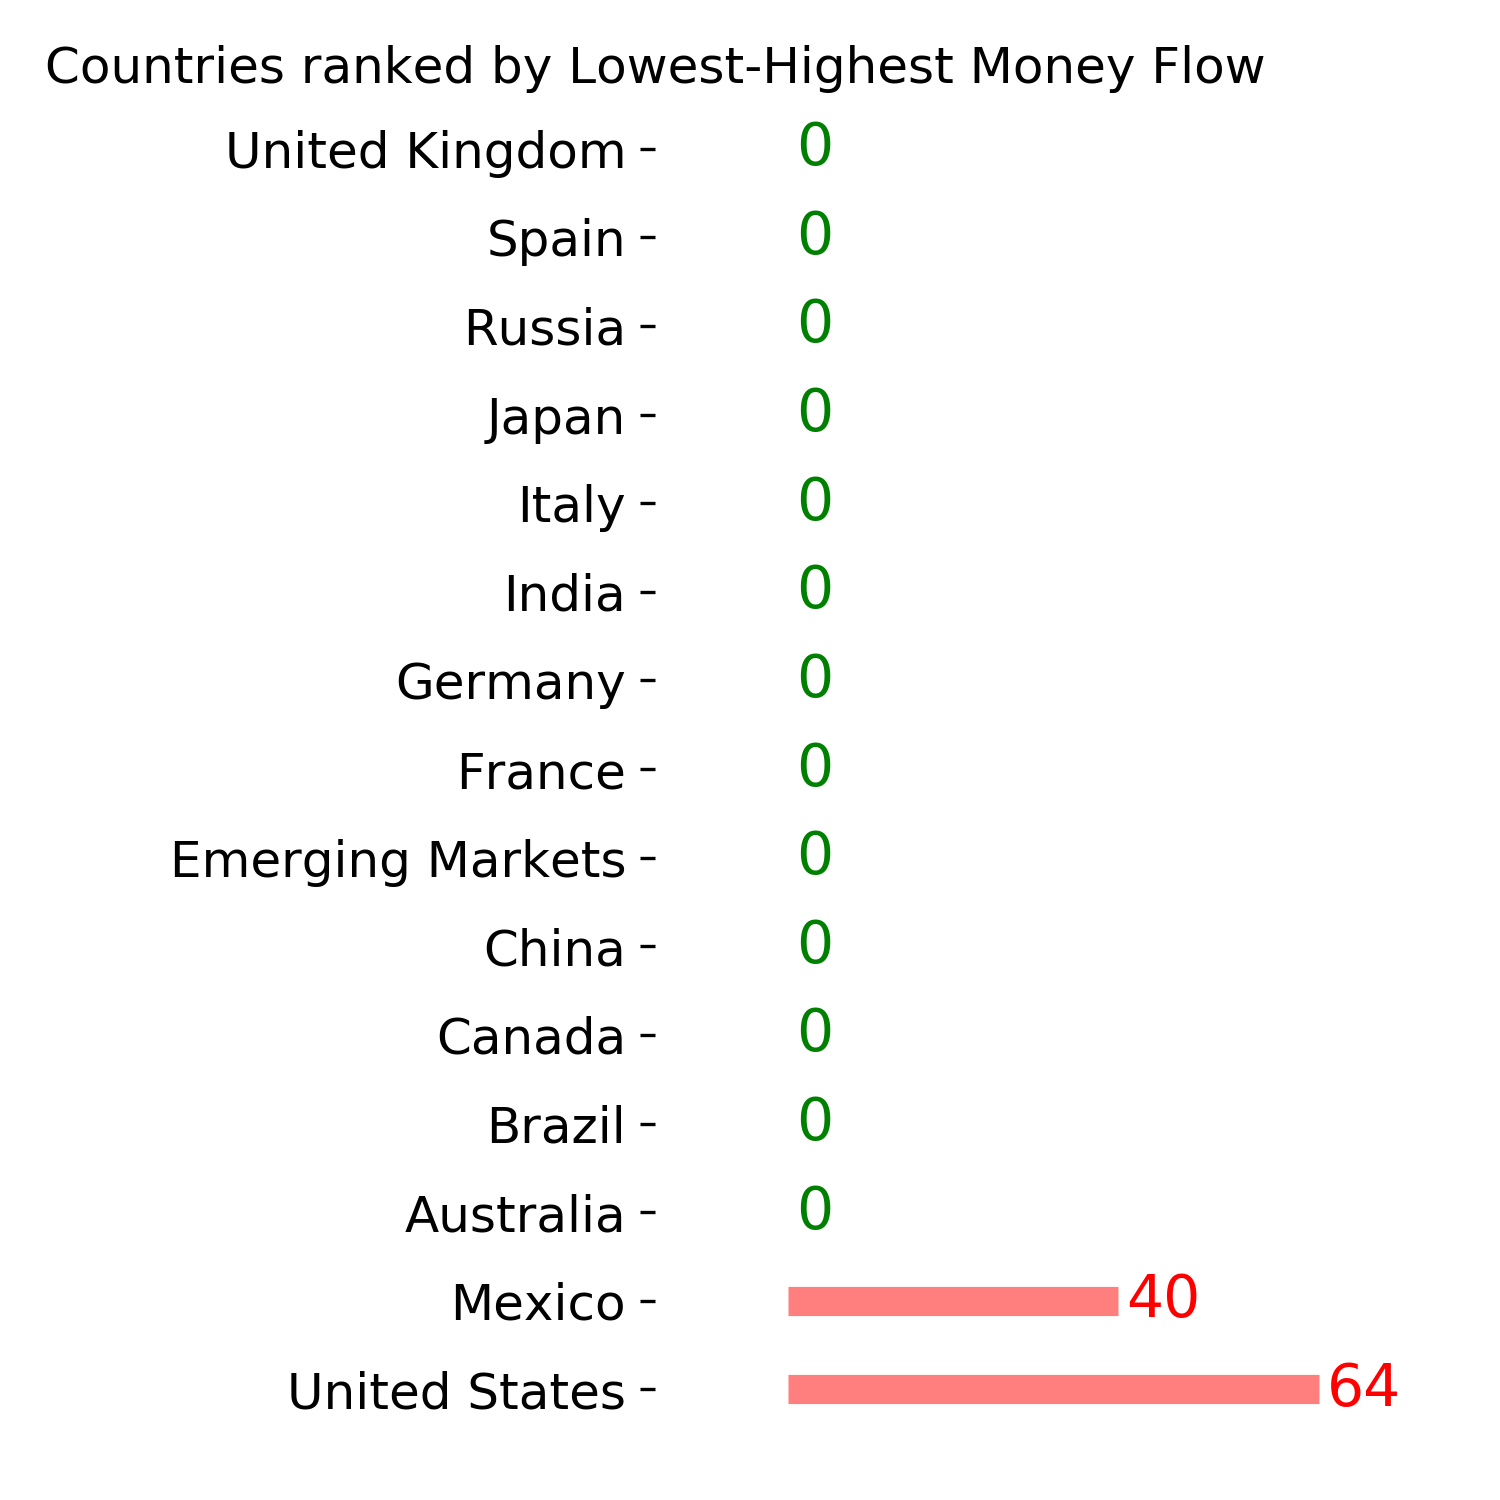
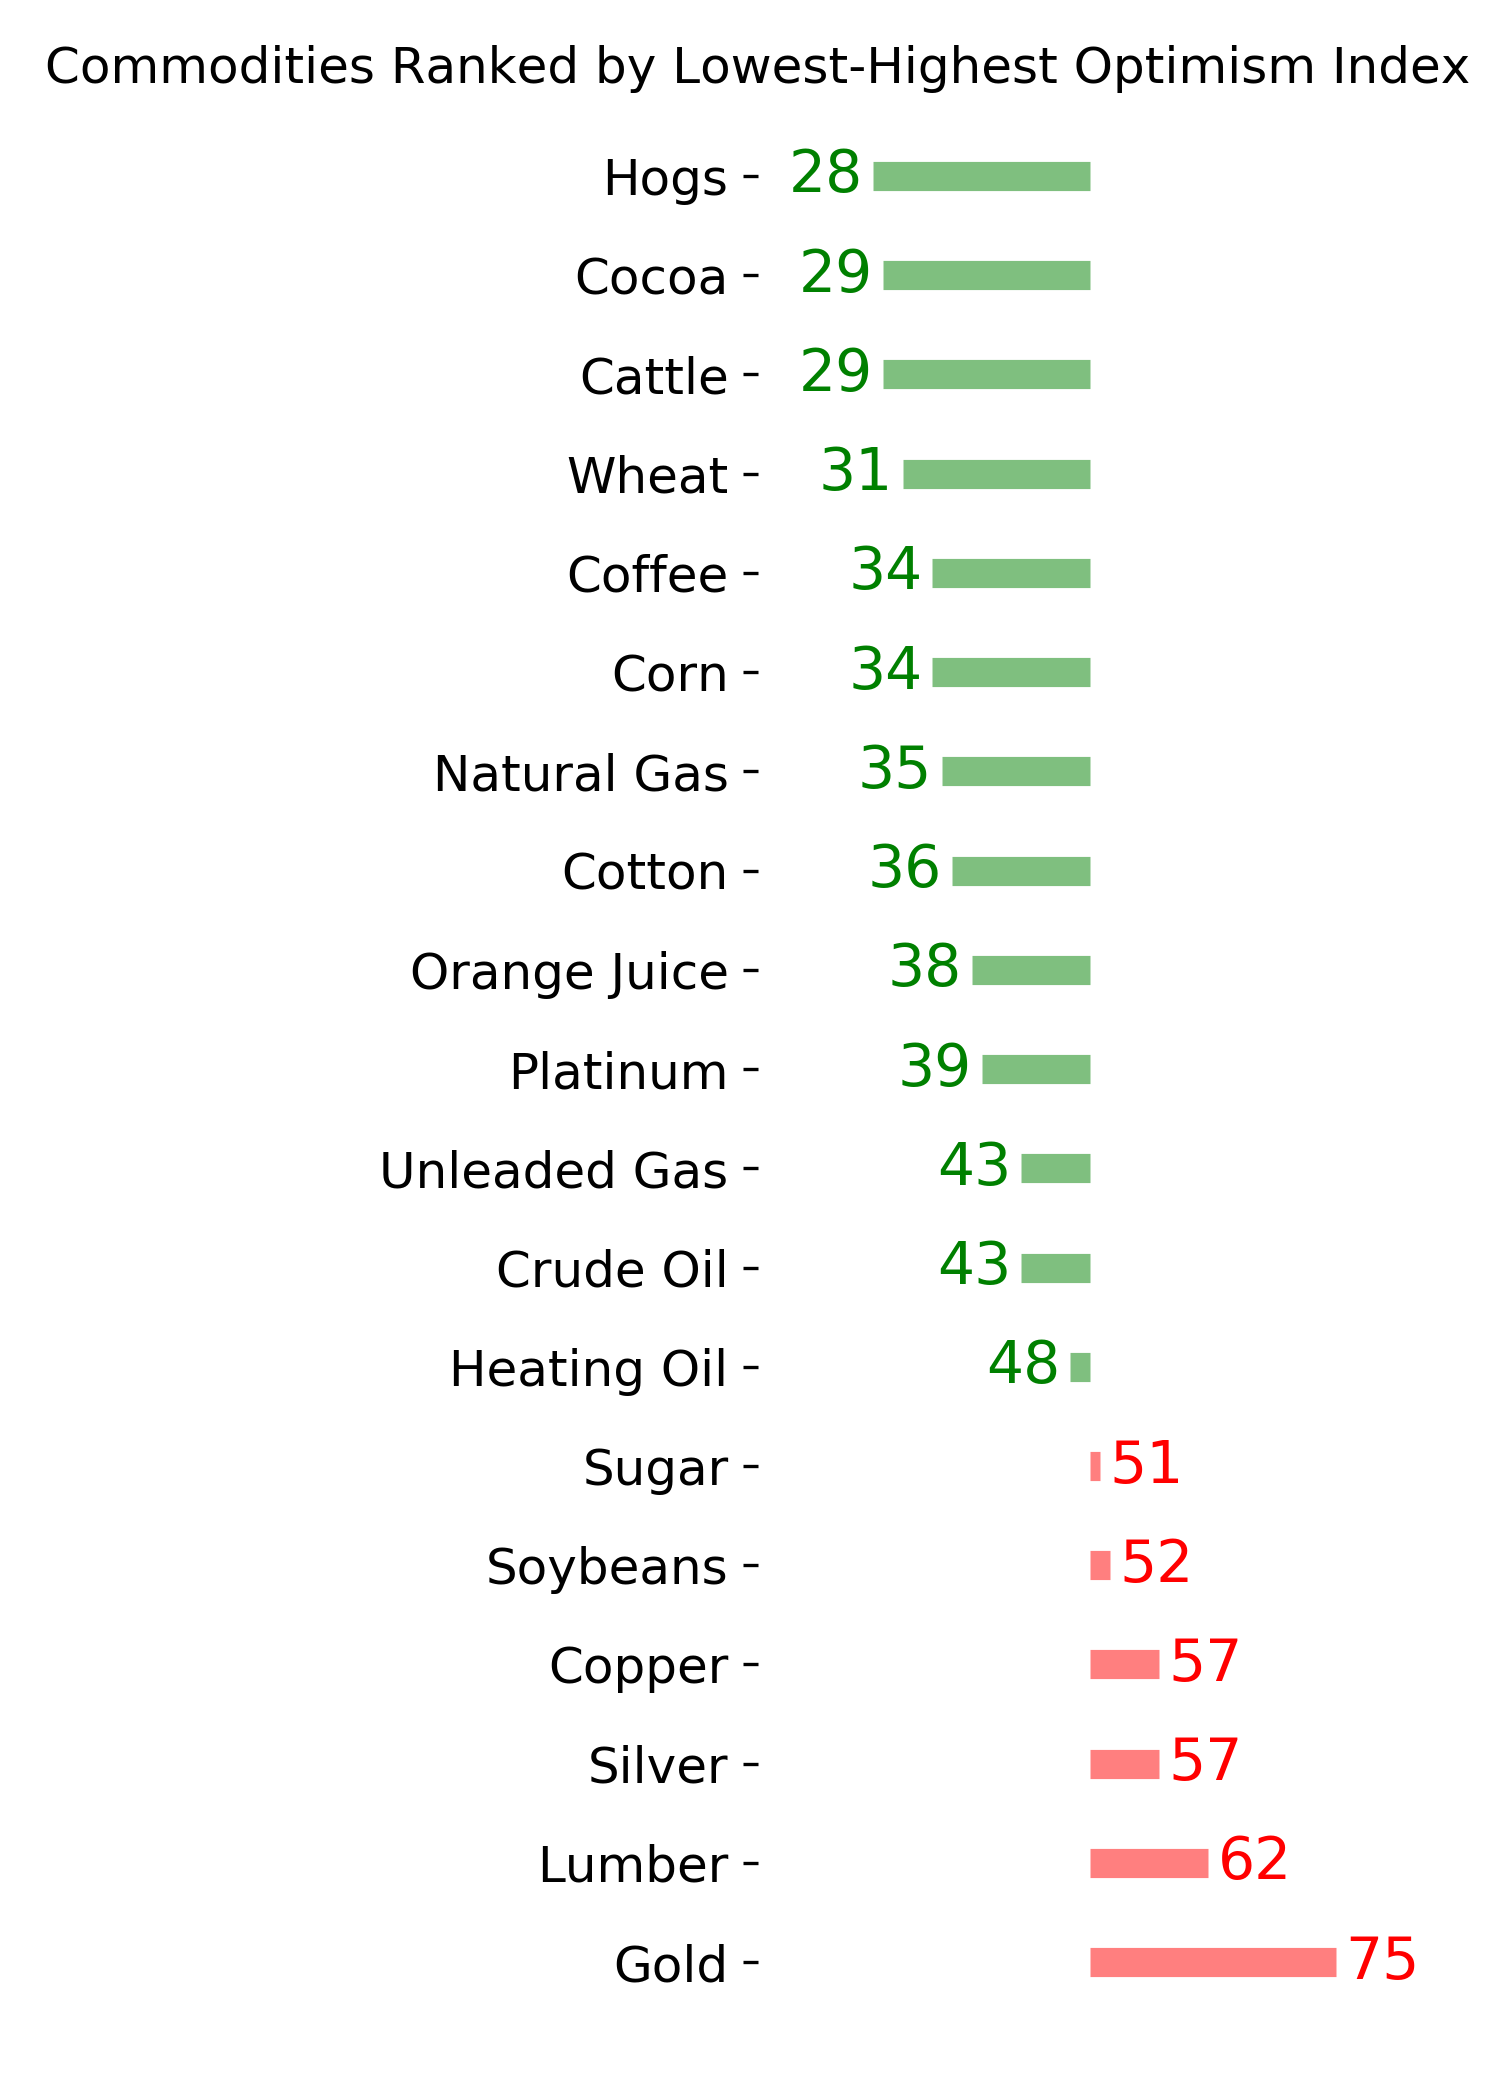
Ranks
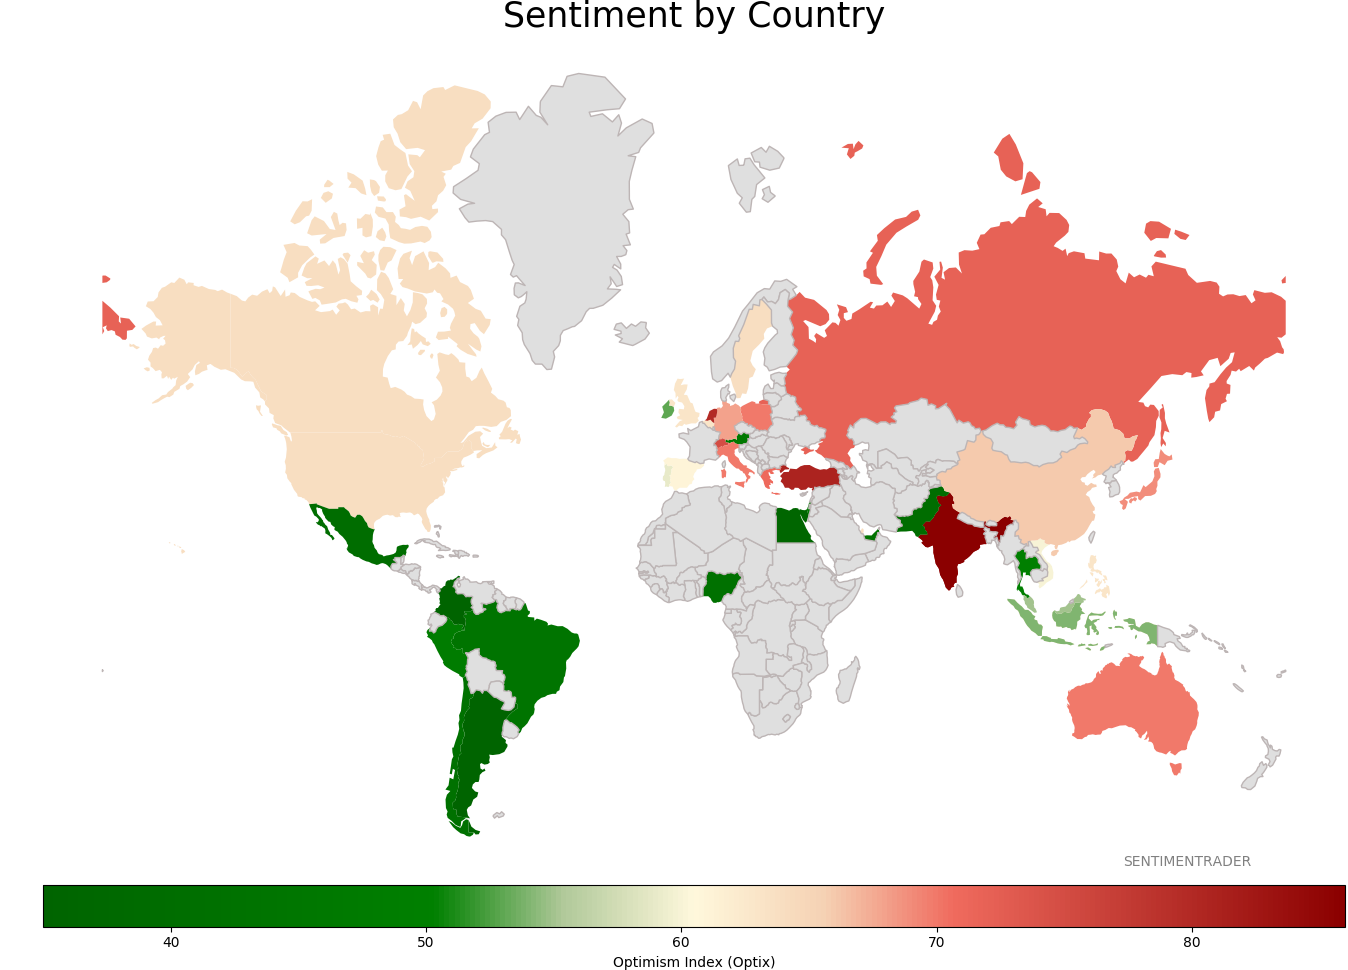
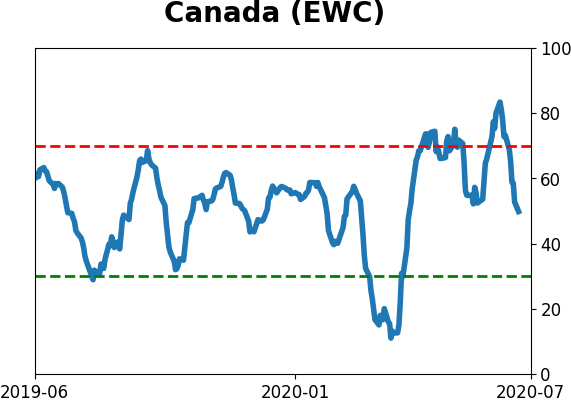
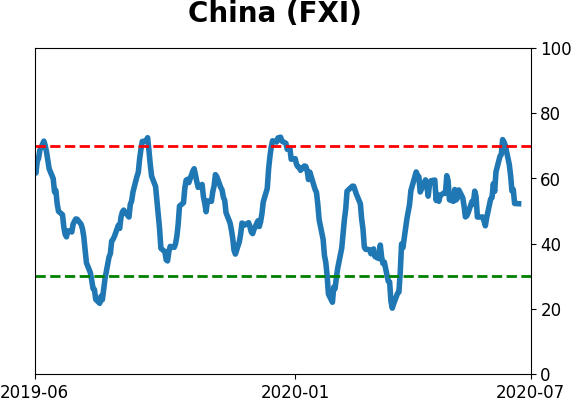
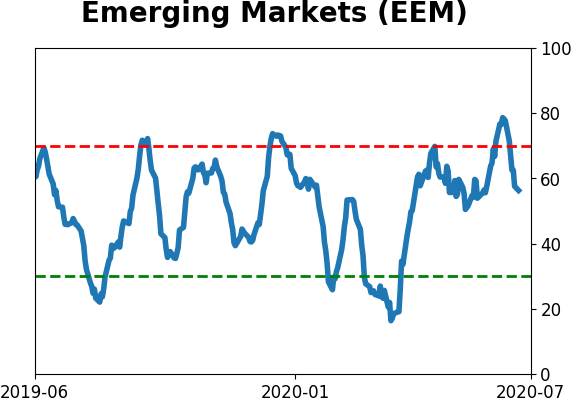
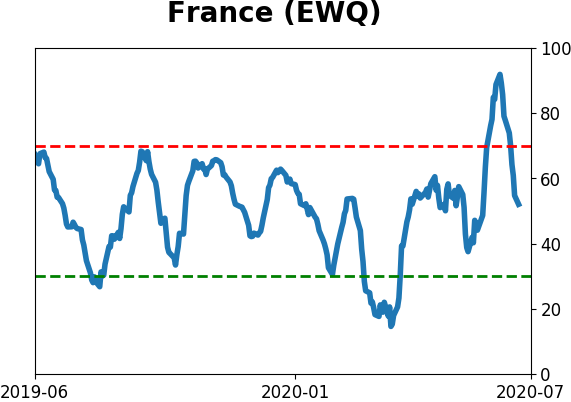
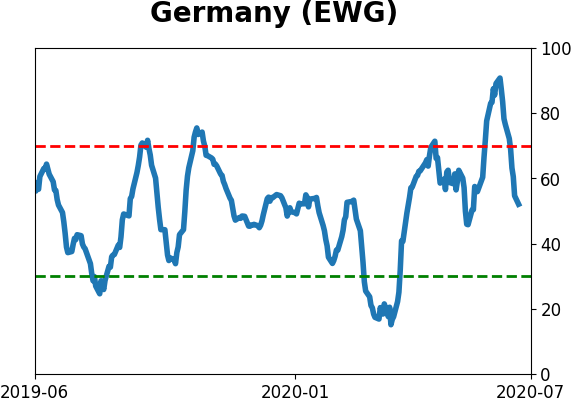
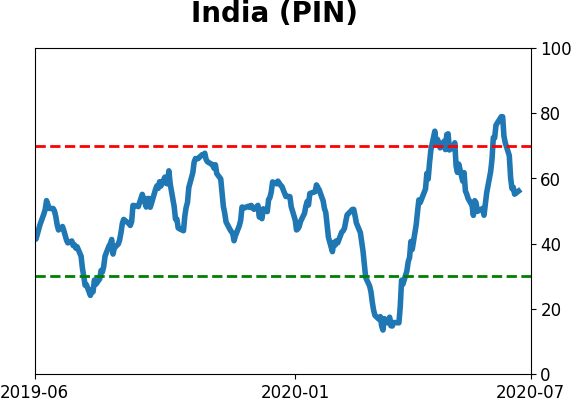
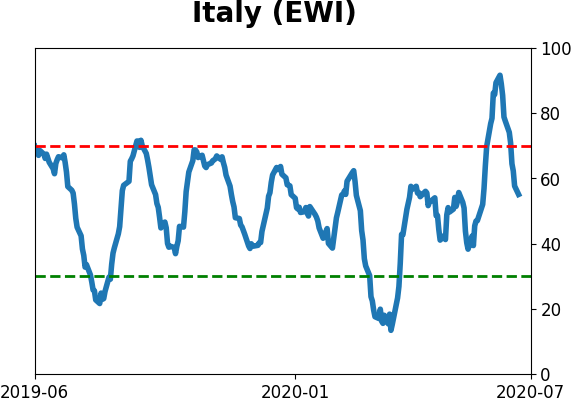
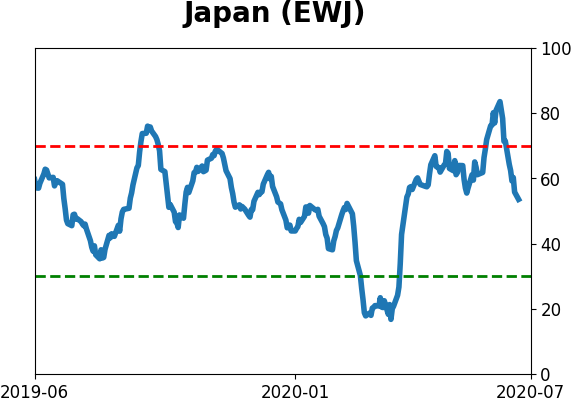
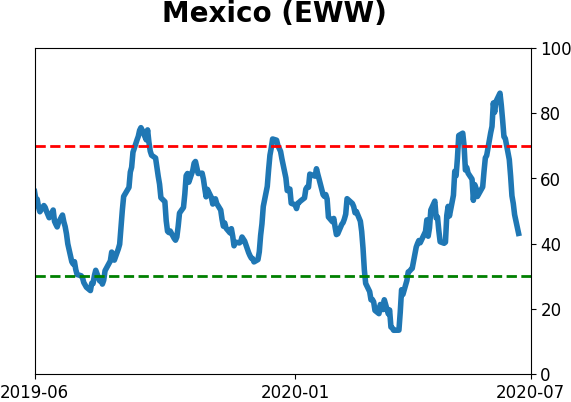
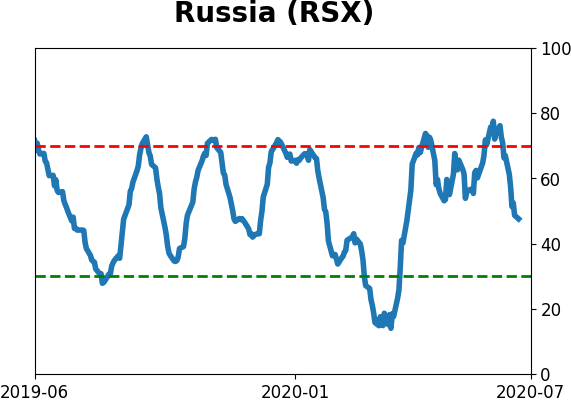
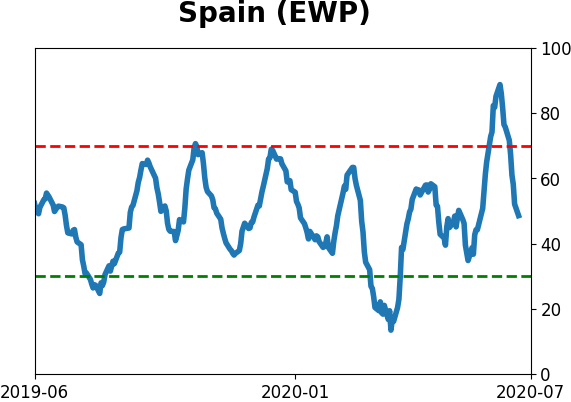
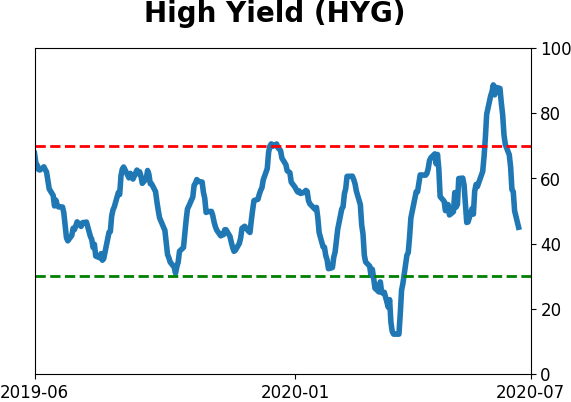
Sentiment Around The World
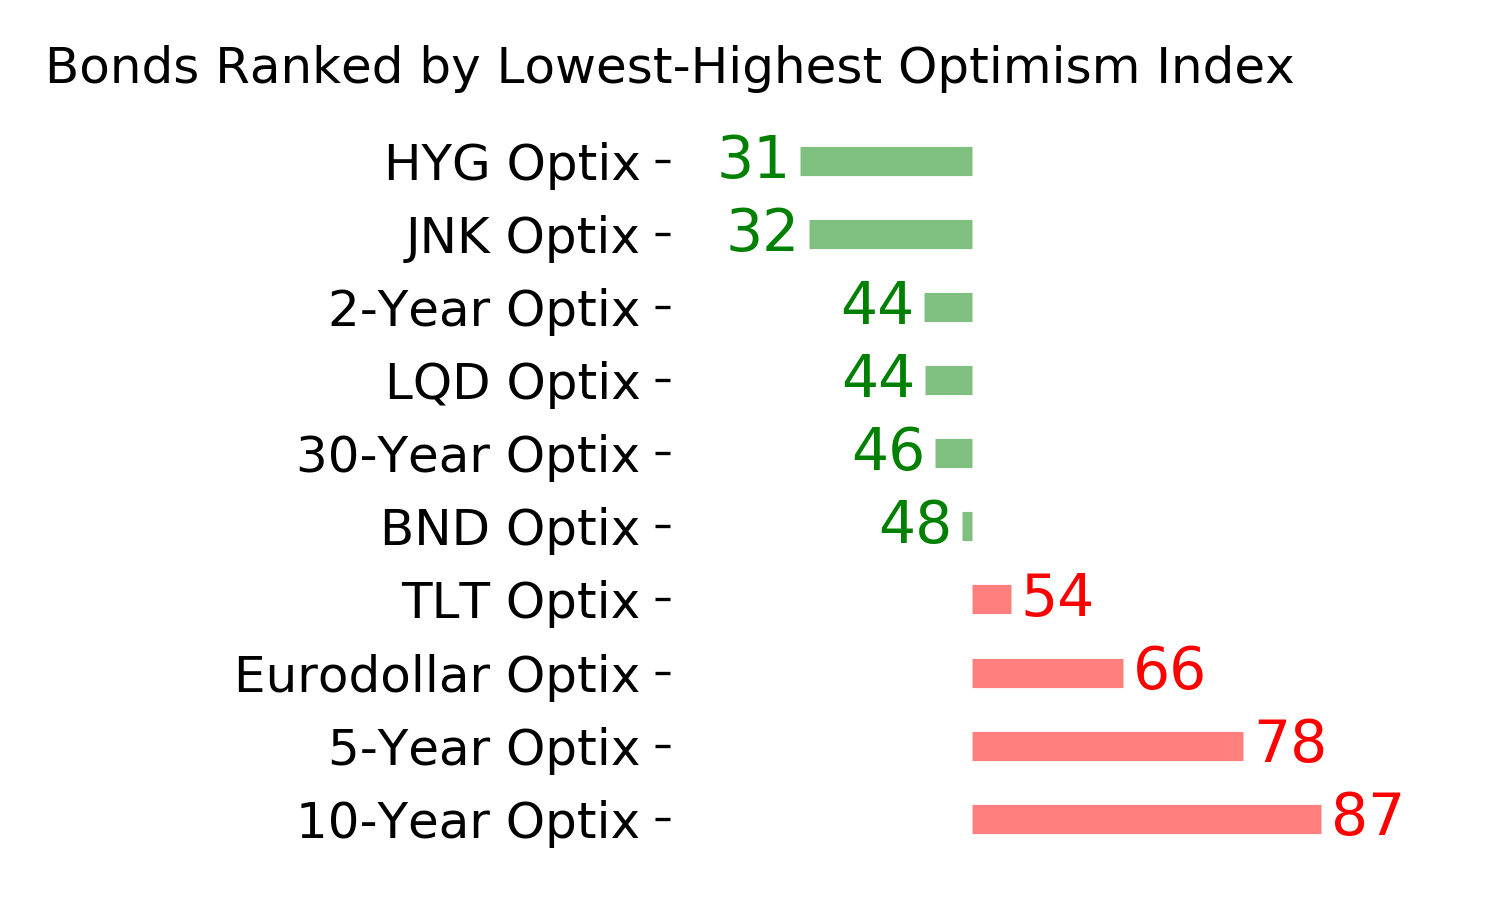
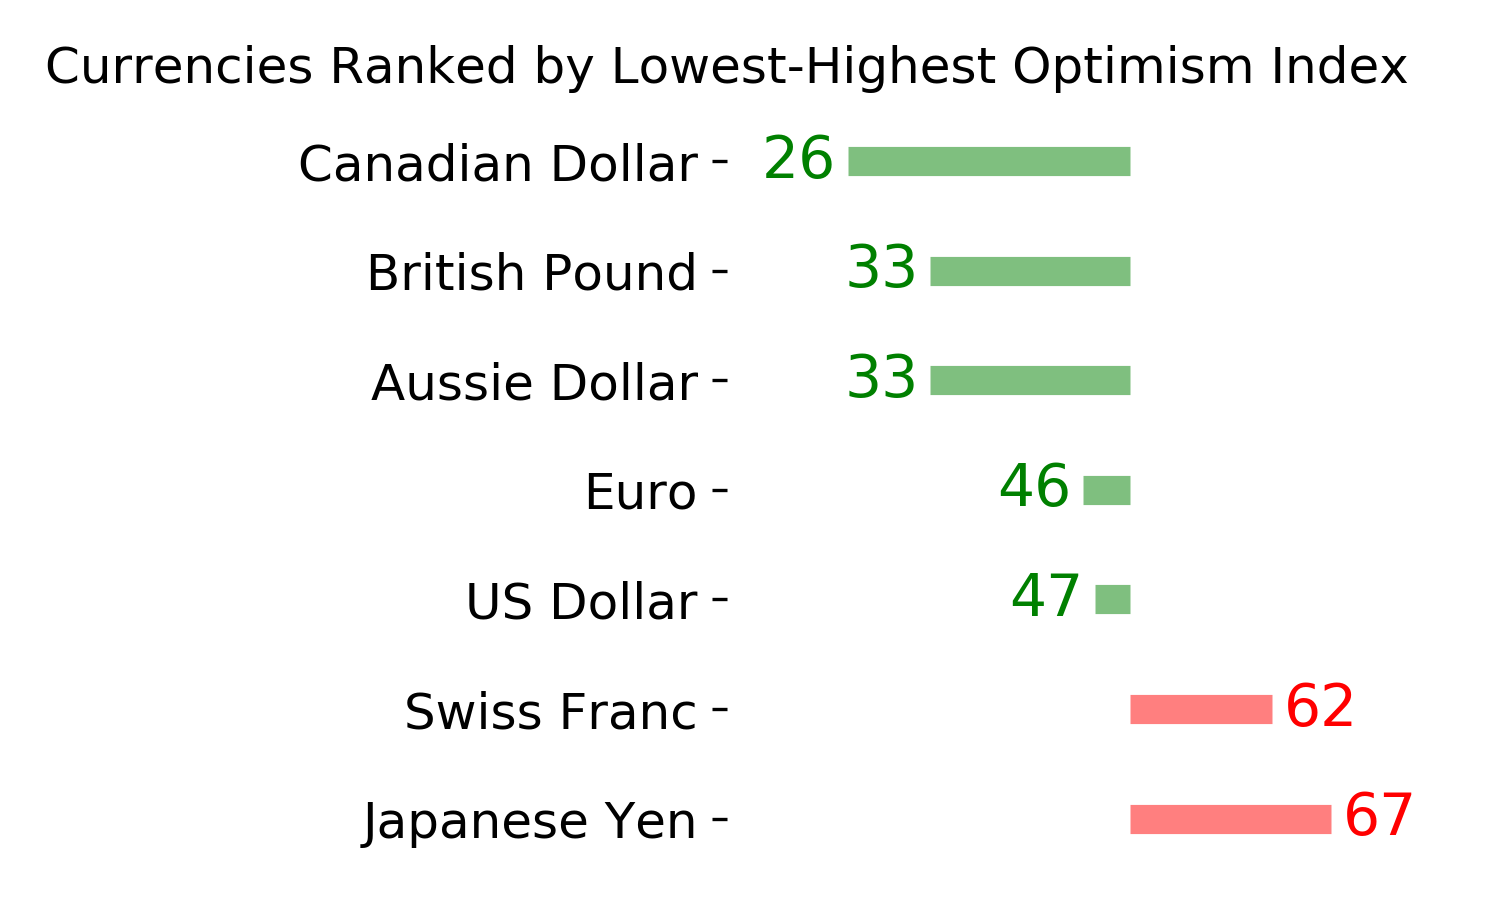
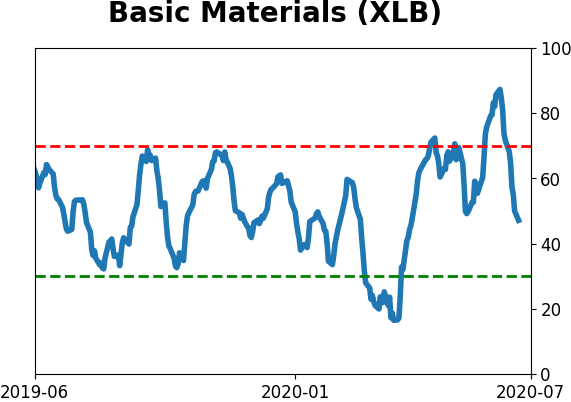
Optimism Index Thumbnails
|
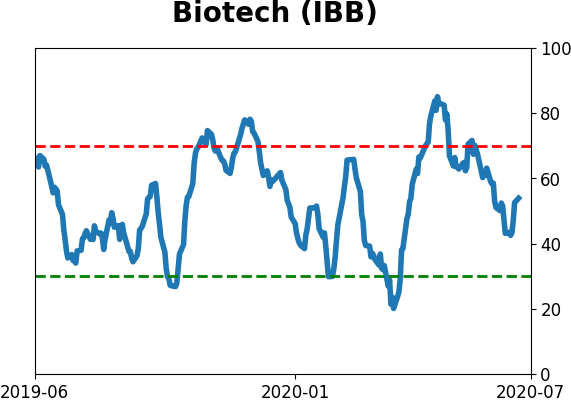
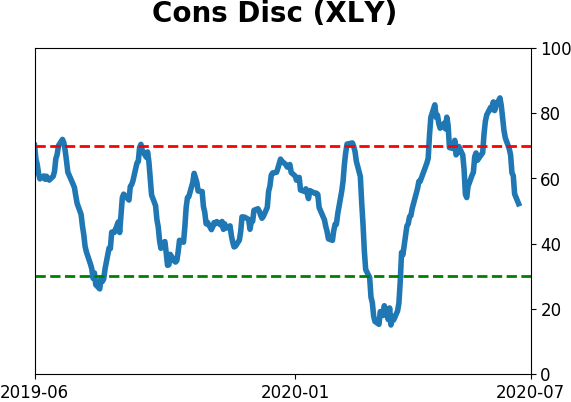
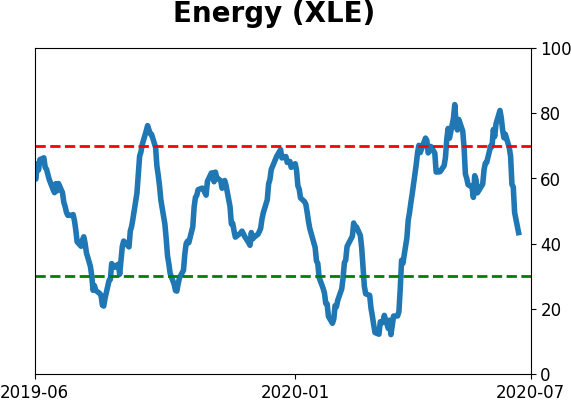
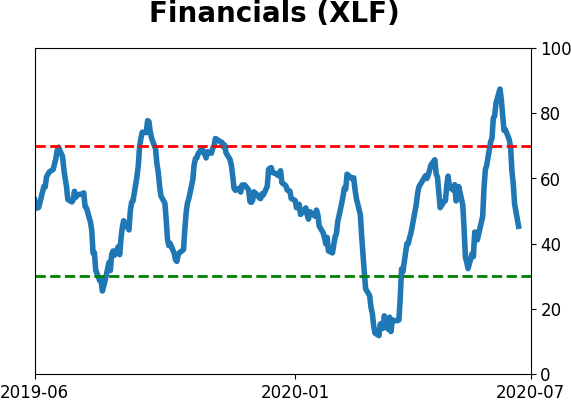
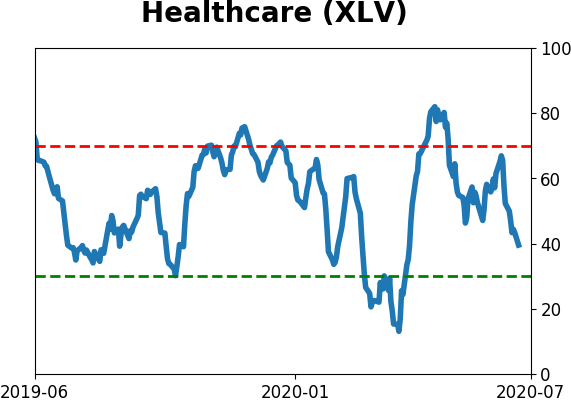
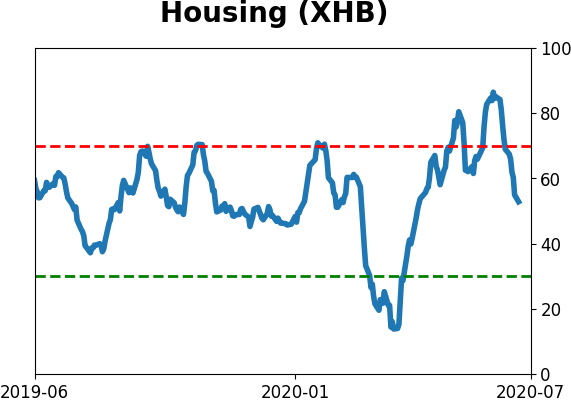
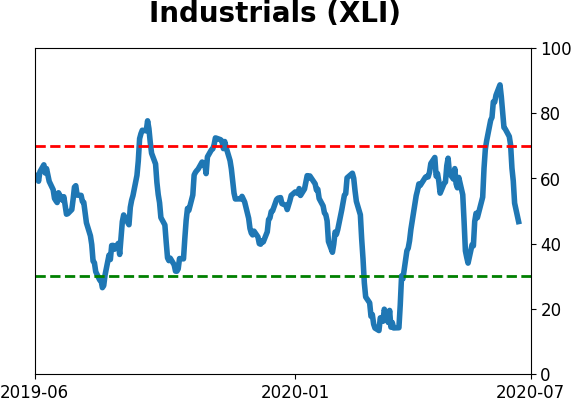
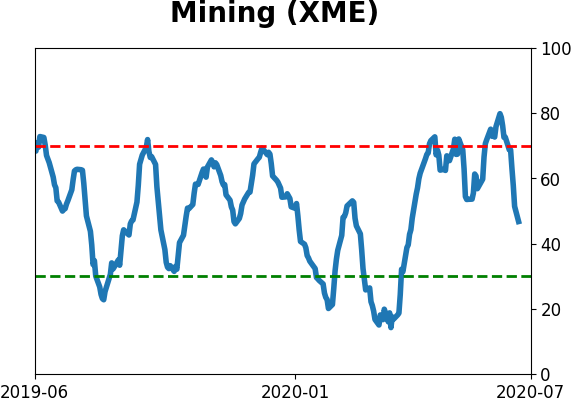
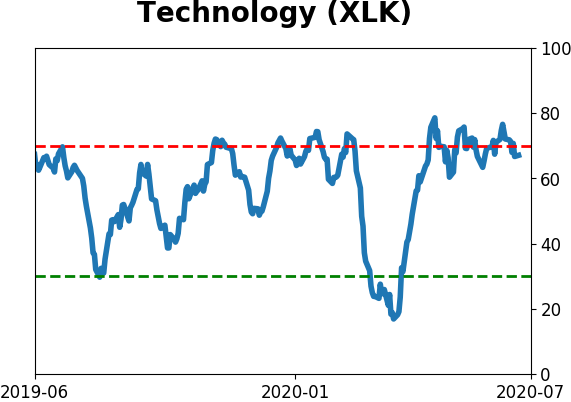
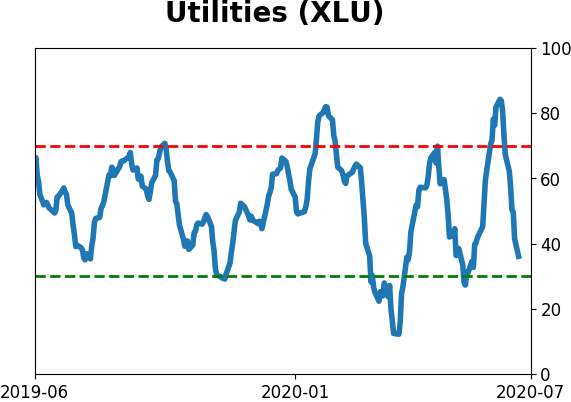
Sector ETF's - 10-Day Moving Average
|
|
|
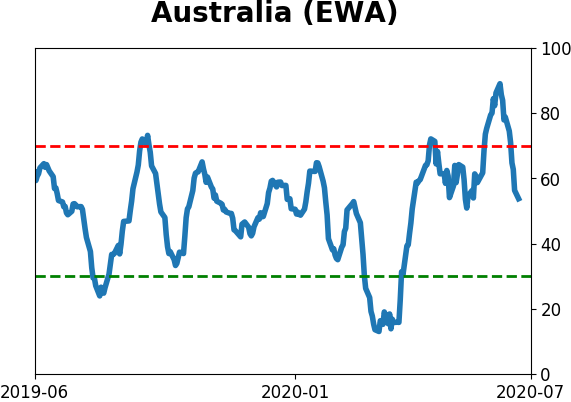
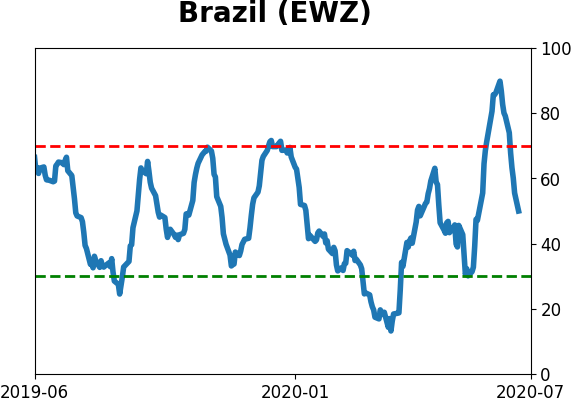
Country ETF's - 10-Day Moving Average
|
|
|
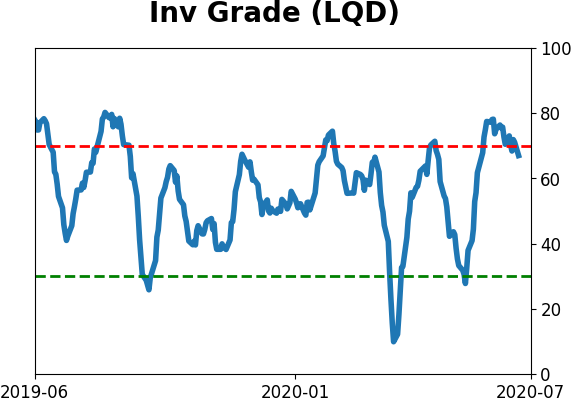
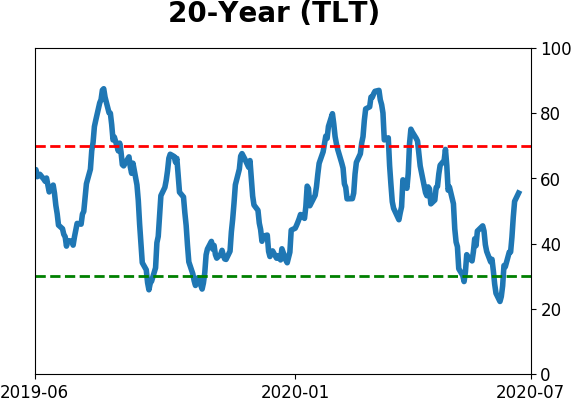
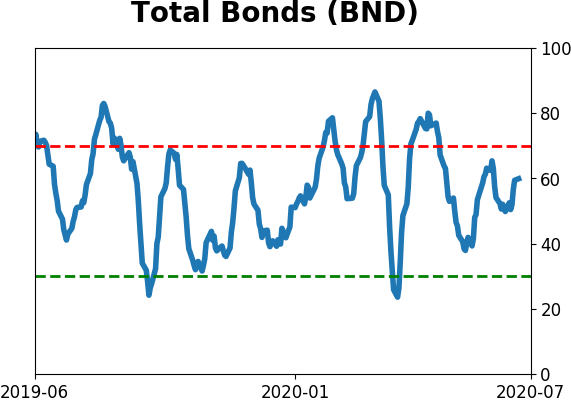
Bond ETF's - 10-Day Moving Average
|
|
|
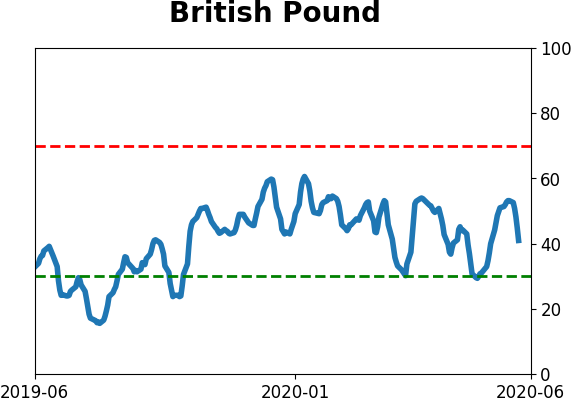
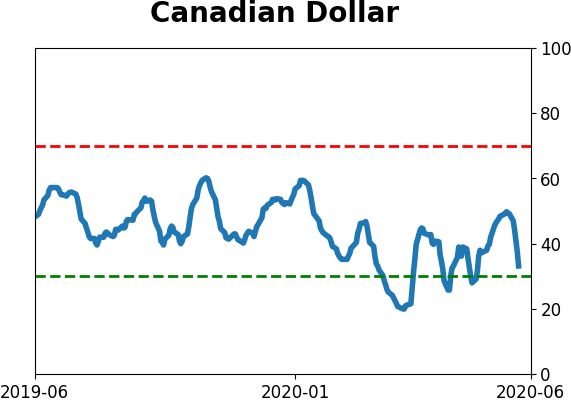
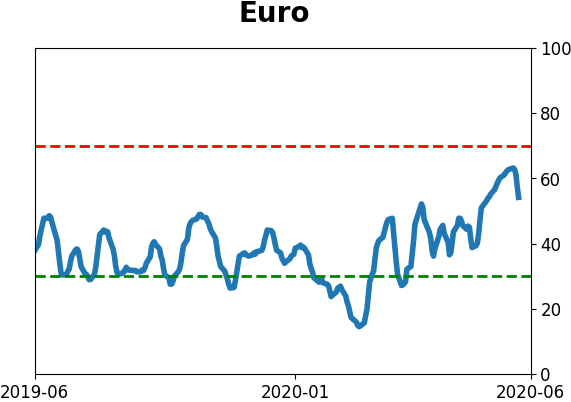
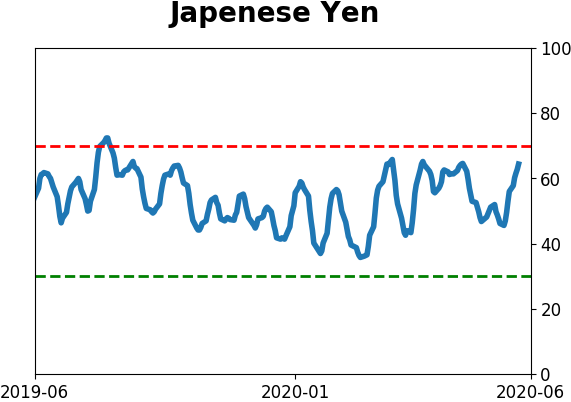
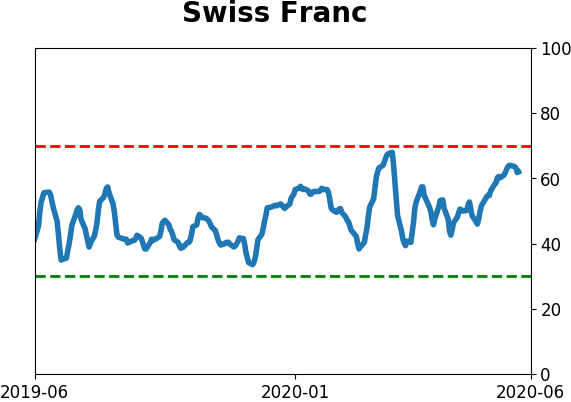
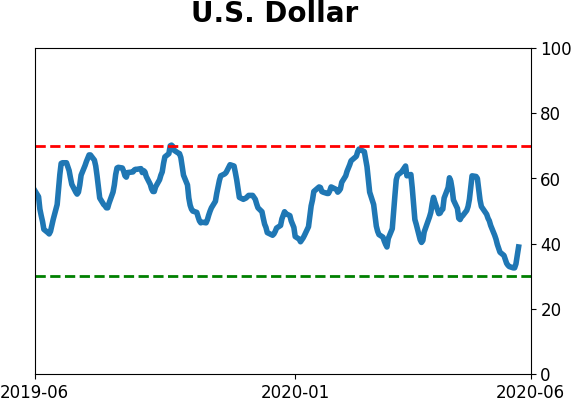
Currency ETF's - 5-Day Moving Average
|
|
|
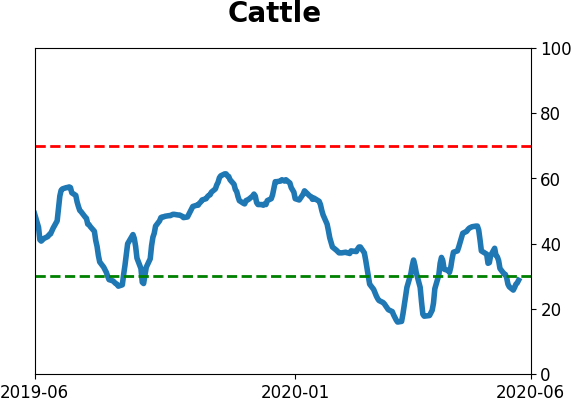
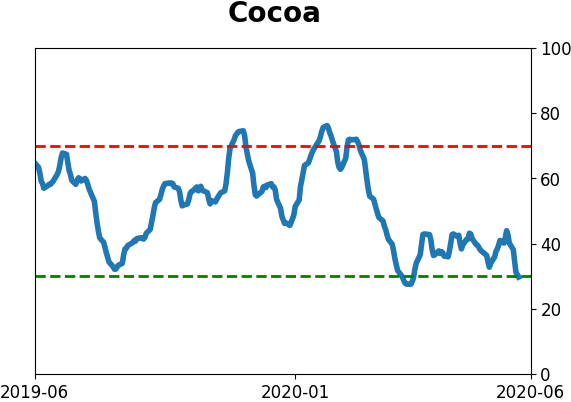
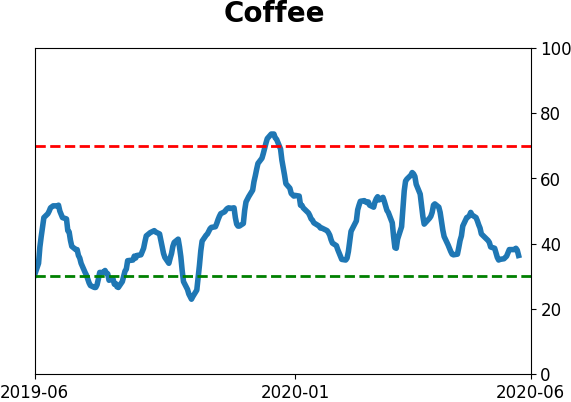
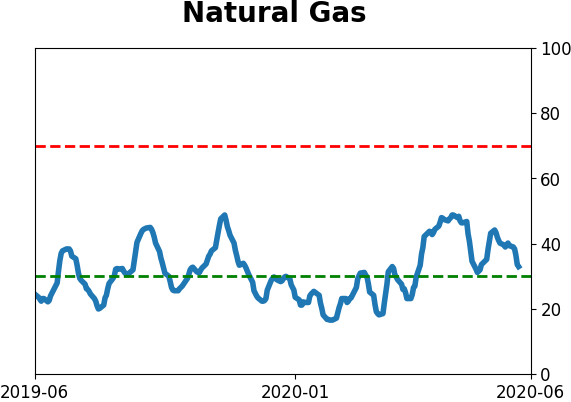
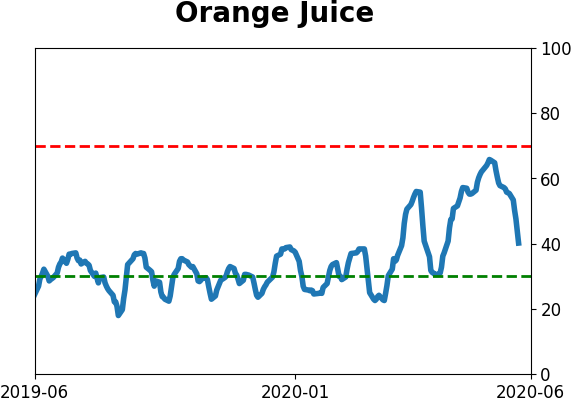
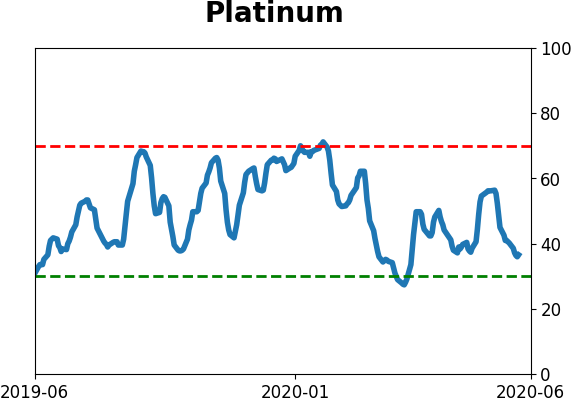
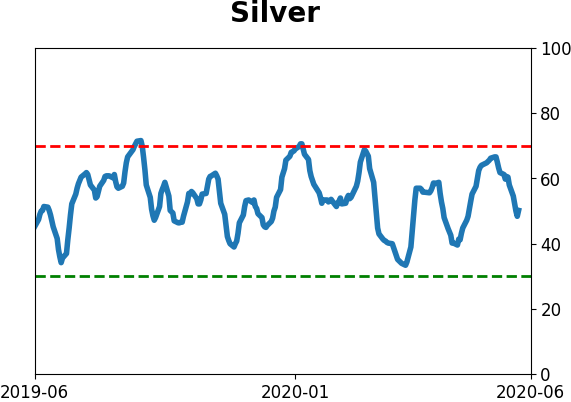
Commodity ETF's - 5-Day Moving Average
|
|