Headlines
|
|
A Dow Theory Sell Signal:
The decline in stocks on Friday likely triggered a Dow Theory sell signal in the Dow Industrials and Dow Transports. These sell signals have a good record at preceding weakness but only temporarily during the past decade.
Bottom Line:
See the Outlook & Allocations page for more details on these summaries STOCKS: Hold
The speculative frenzy in February is wrung out. Internal dynamics have mostly held up, with some exceptions. Many of our studies still show a mixed to poor short-term view, with medium- and long-term ones turning more positive. BONDS: Hold
Various parts of the market got hit in March, with the lowest Bond Optimism Index we usually see during healthy environments. After a shaky couple of weeks, the broad bond market has modestly recovered. Not a big edge here either way. GOLD: Hold
Gold and miners have done very well, recovering above long-term trend lines. The issue is that both have tended to perform poorly after similar situations - will have to wait and see how it plays out.
|
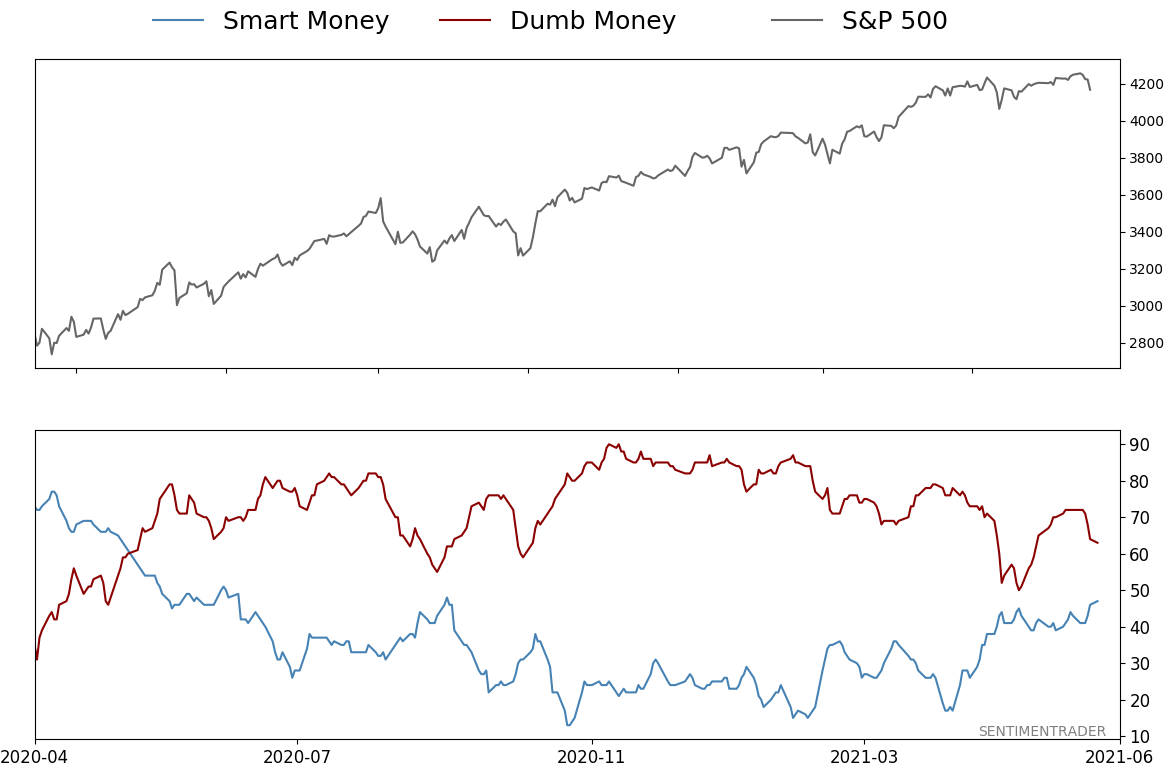
Smart / Dumb Money Confidence
|
Smart Money Confidence: 47%
Dumb Money Confidence: 63%
|
|
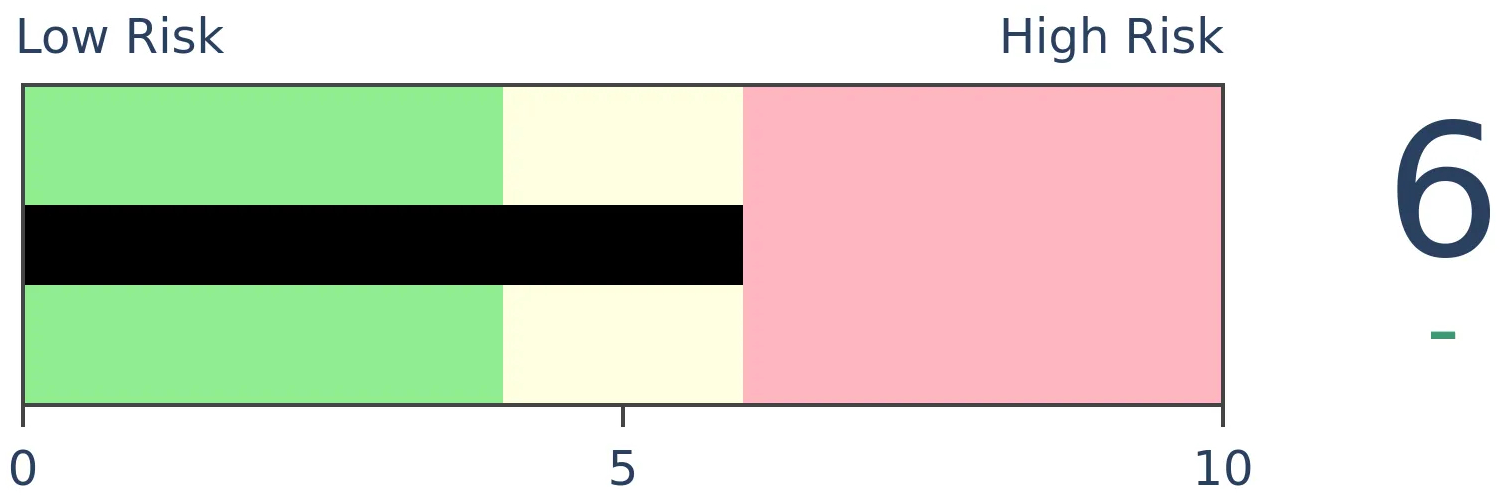
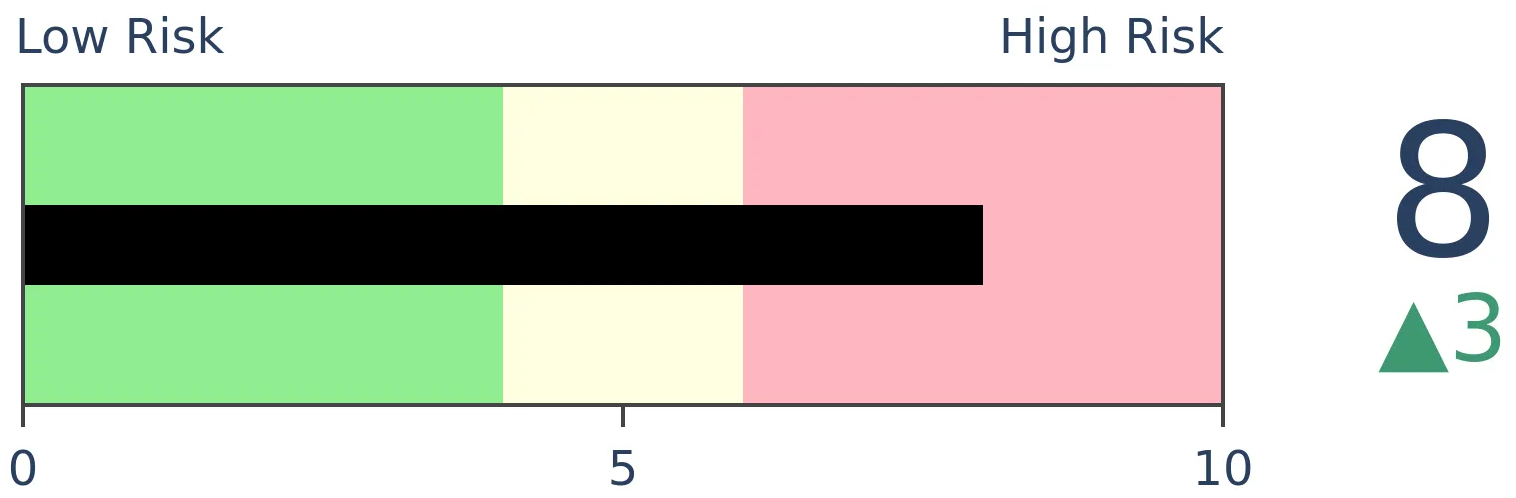
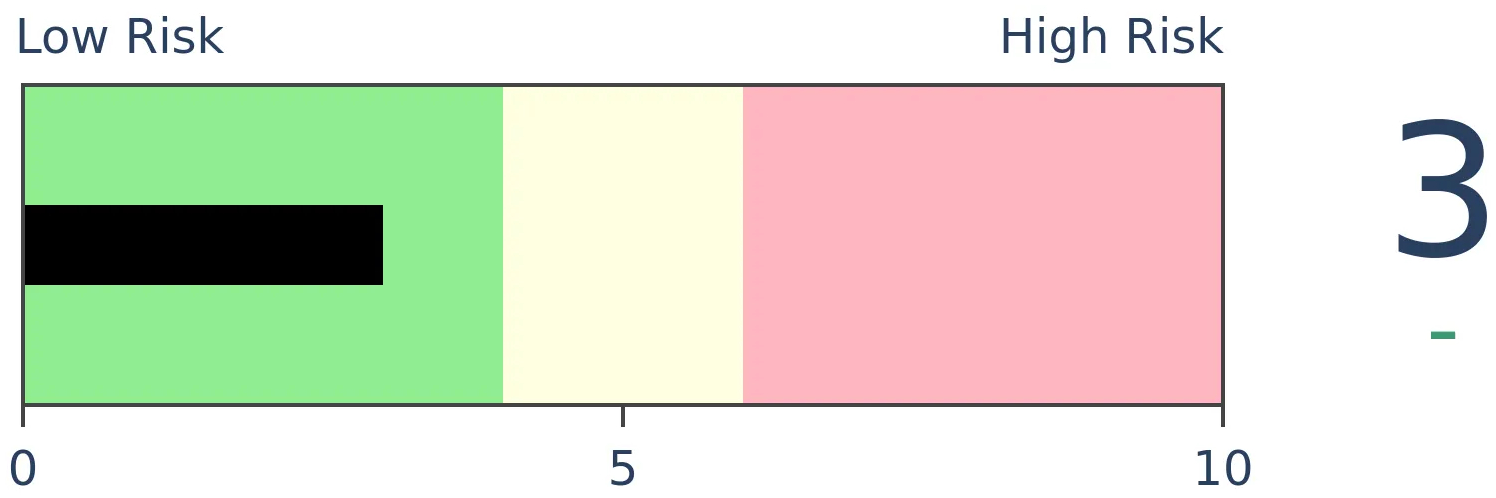
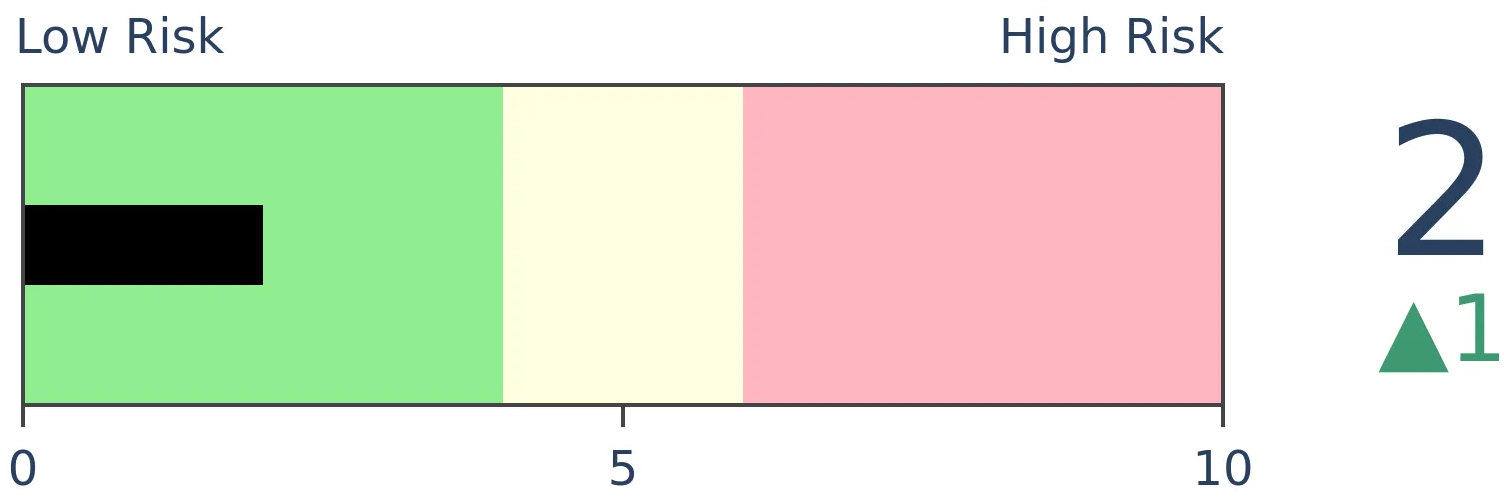
Risk Levels
Stocks Short-Term
|
Stocks Medium-Term
|
|
Bonds
|
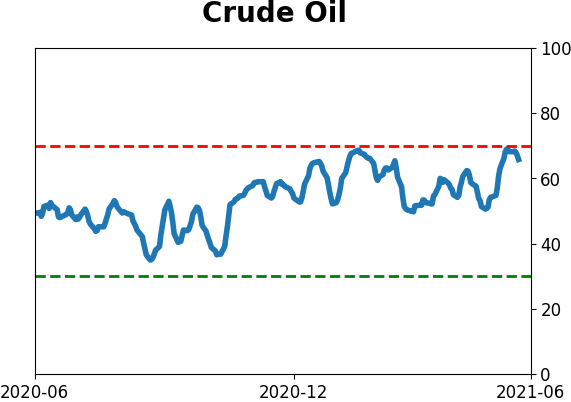
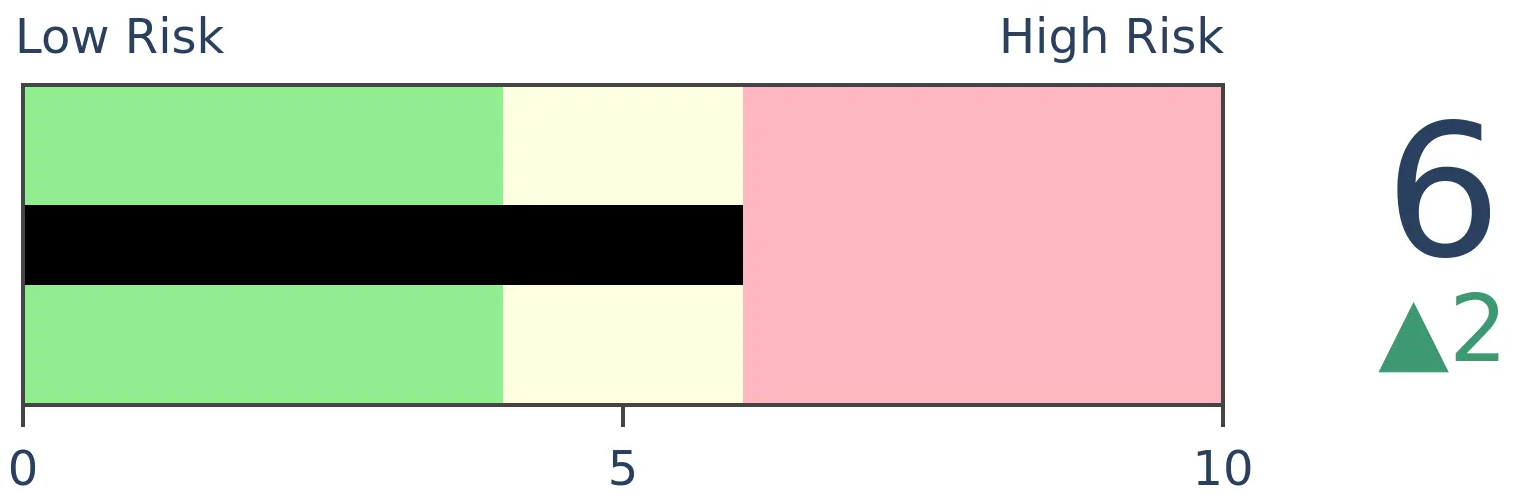
Crude Oil
|
|
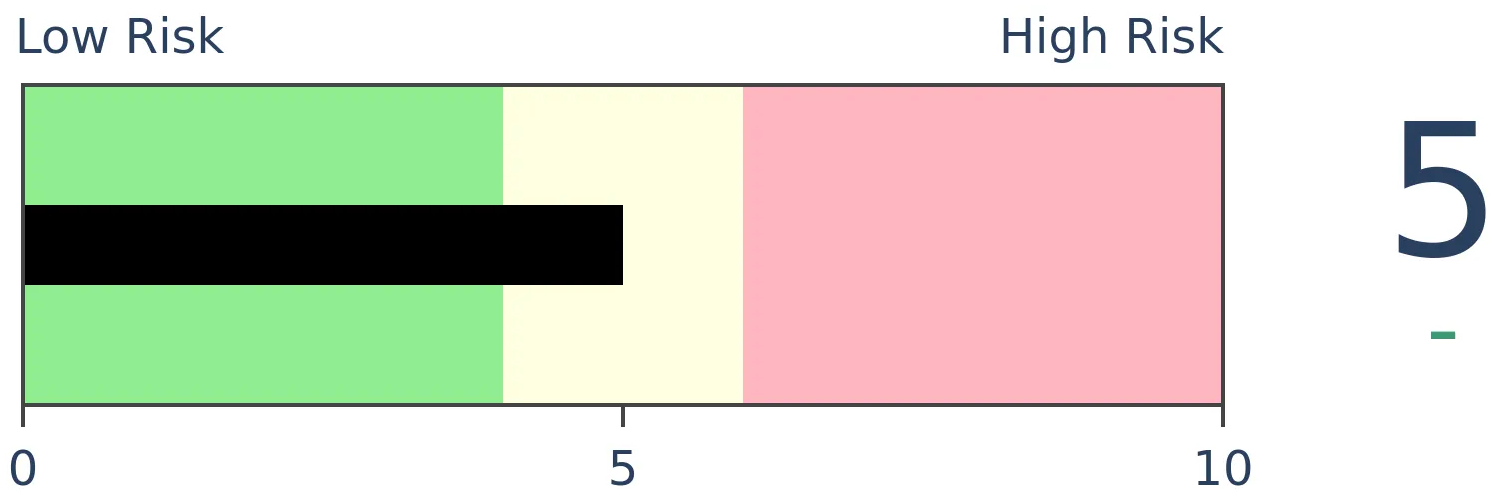
Gold
|
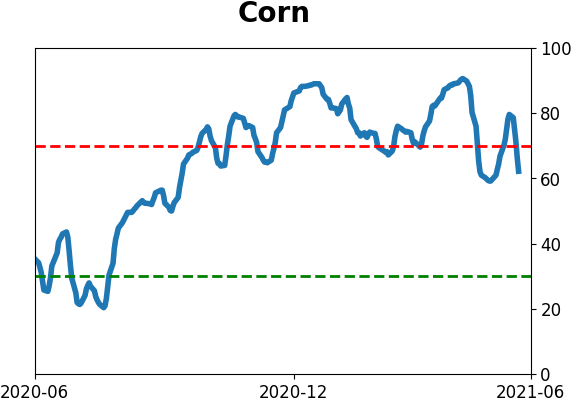
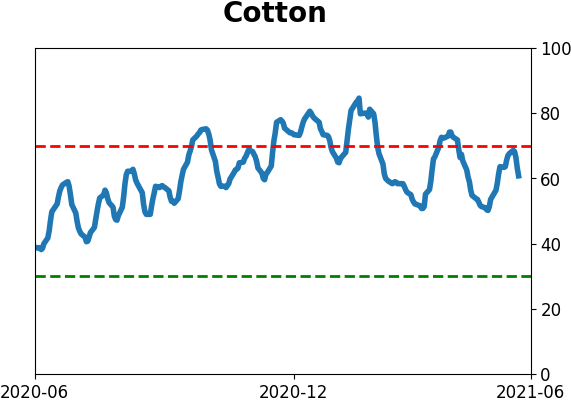
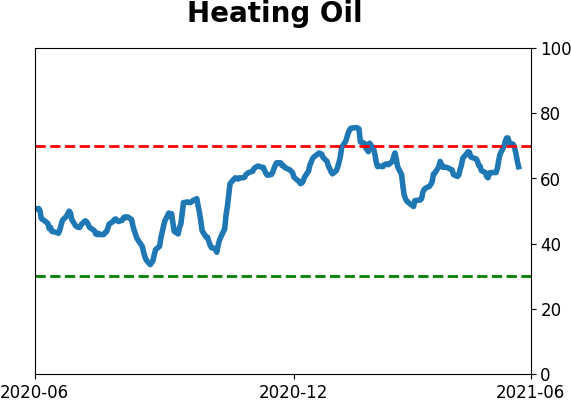
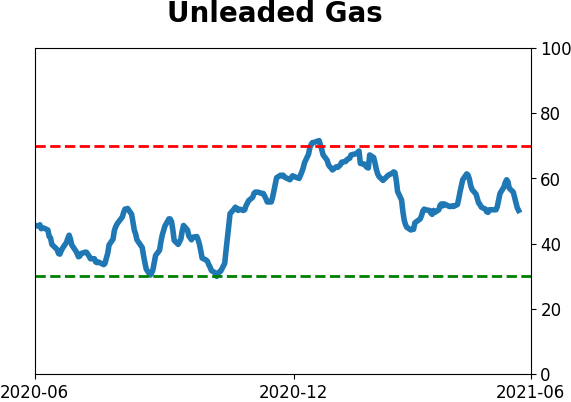
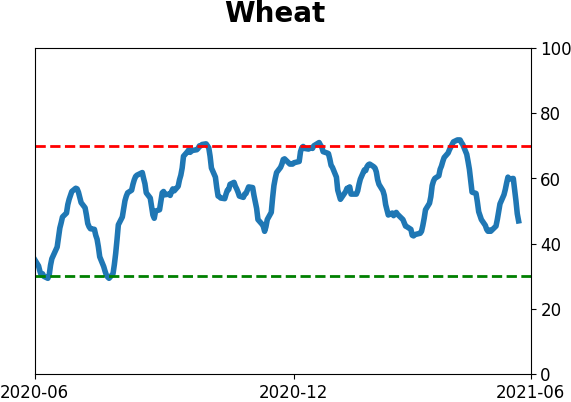
Agriculture
|
|
Research
BOTTOM LINE
The decline in stocks on Friday likely triggered a Dow Theory sell signal in the Dow Industrials and Dow Transports. These sell signals have a good record at preceding weakness but only temporarily during the past decade.
FORECAST / TIMEFRAME
None
|
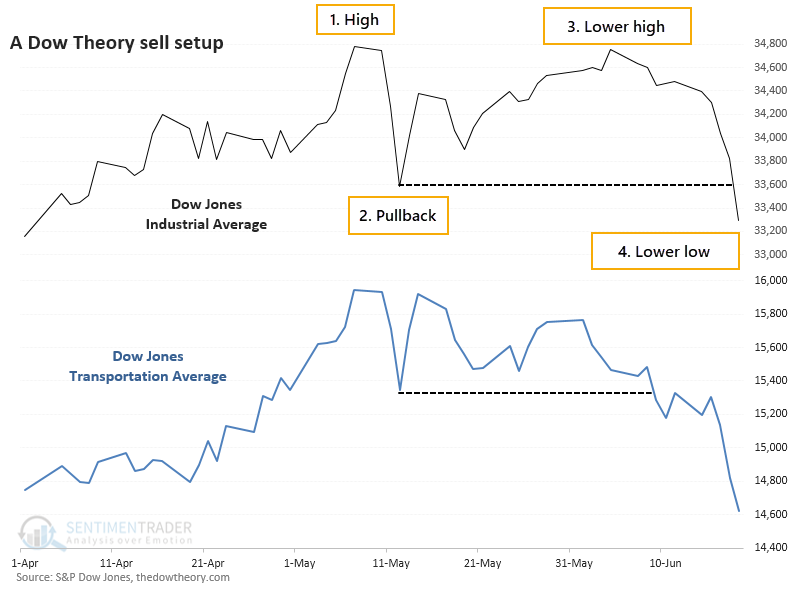
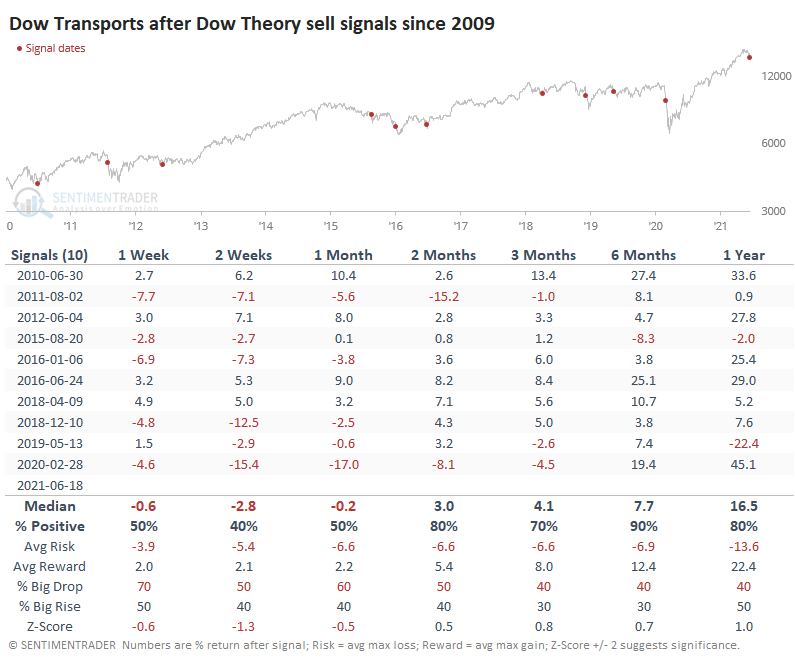
For the first time in over a year, one of the oldest forms of technical analysis has triggered a sell signal.
There is no "official" record of buys and sells according to Dow Theory, but the basic setup is fairly standard.
"The Dow theory is a financial theory that says the market is in an upward trend if one of its averages (i.e. industrials or transportation) advances above a previous important high and is accompanied or followed by a similar advance in the other average.
A reversal in the primary trend is signaled when the market is unable to create another successive peak and trough in the direction of the primary trend. For an uptrend, a reversal would be signaled by an inability to reach a new high followed by the inability to reach a higher low. In this situation, the market has gone from a period of successively higher highs and lows to successively lower highs and lows, which are the components of a downward primary trend." - Investopedia
TRIGGER CONDITIONS
When we've looked at this in the past, we've used the historical record of buy and sell signals from TheDowTheory.com, a site specializing in analyzing these signals. It's unknown whether they consider Friday's moves in the Dow Industrials and Transportation averages to be a sell signal. Still, it does meet the criteria, or if not, it's close enough to consider. Trying to split hairs based on arbitrary rules is silly - it's the concept that counts.
For a sell signal, both averages should:
- Set a new high
- Pull back in a reaction against those new highs
- Rebound by 3% or more but without setting a higher high
- Decline below the pullback low
That pretty much sums up the past two months in the averages.
FUTURE RETURNS WERE TERRIBLE...BUT
Since the year 1900, there have been 47 prior sell signals. Not surprisingly, the Dow Industrials have not responded well.
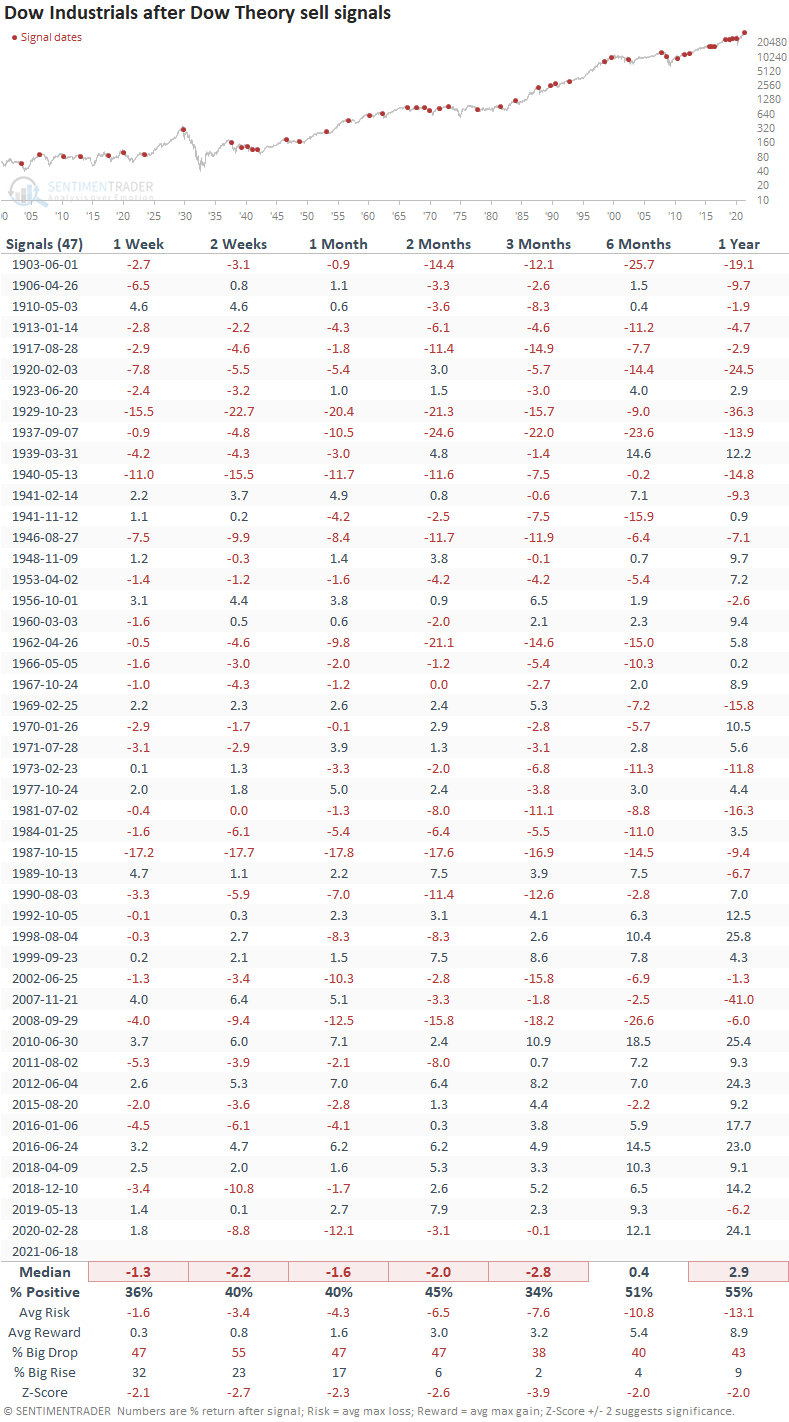
Over the next three months, the Dow managed to rally only 34% of the time. Across all time frames, the risk/reward was skewed toward "risk" and the Dow's median return was at least 2 standard deviations below random.
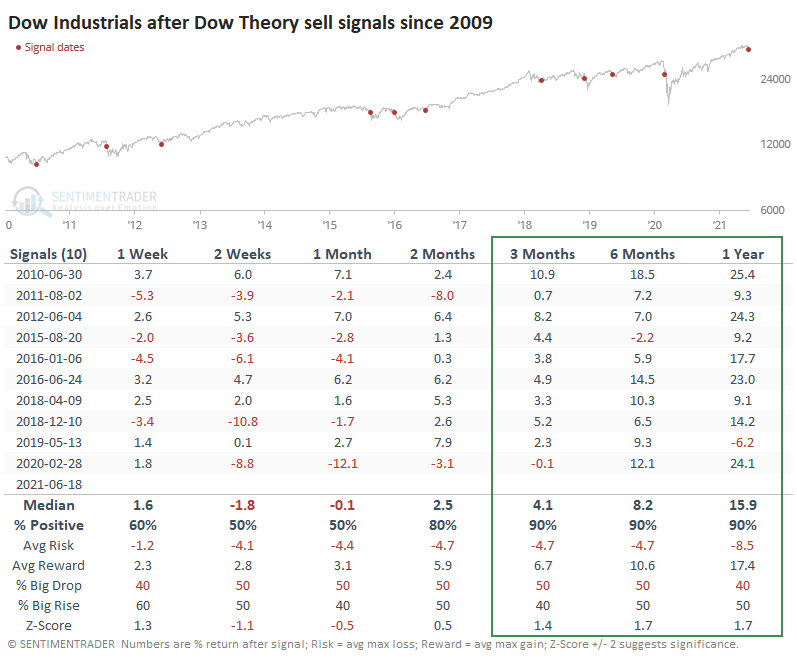
If there's any solace here for investors, it's that sell signals since the end of the financial crisis have mostly been terrible. They would have prevented some uncomfortable losses in 2011, 2018, and 2020, and a few other modest ones. But all were brief and ended up leading to gains during the next 3-6 months.
For the Dow Transports, these sell signals were equally painful.
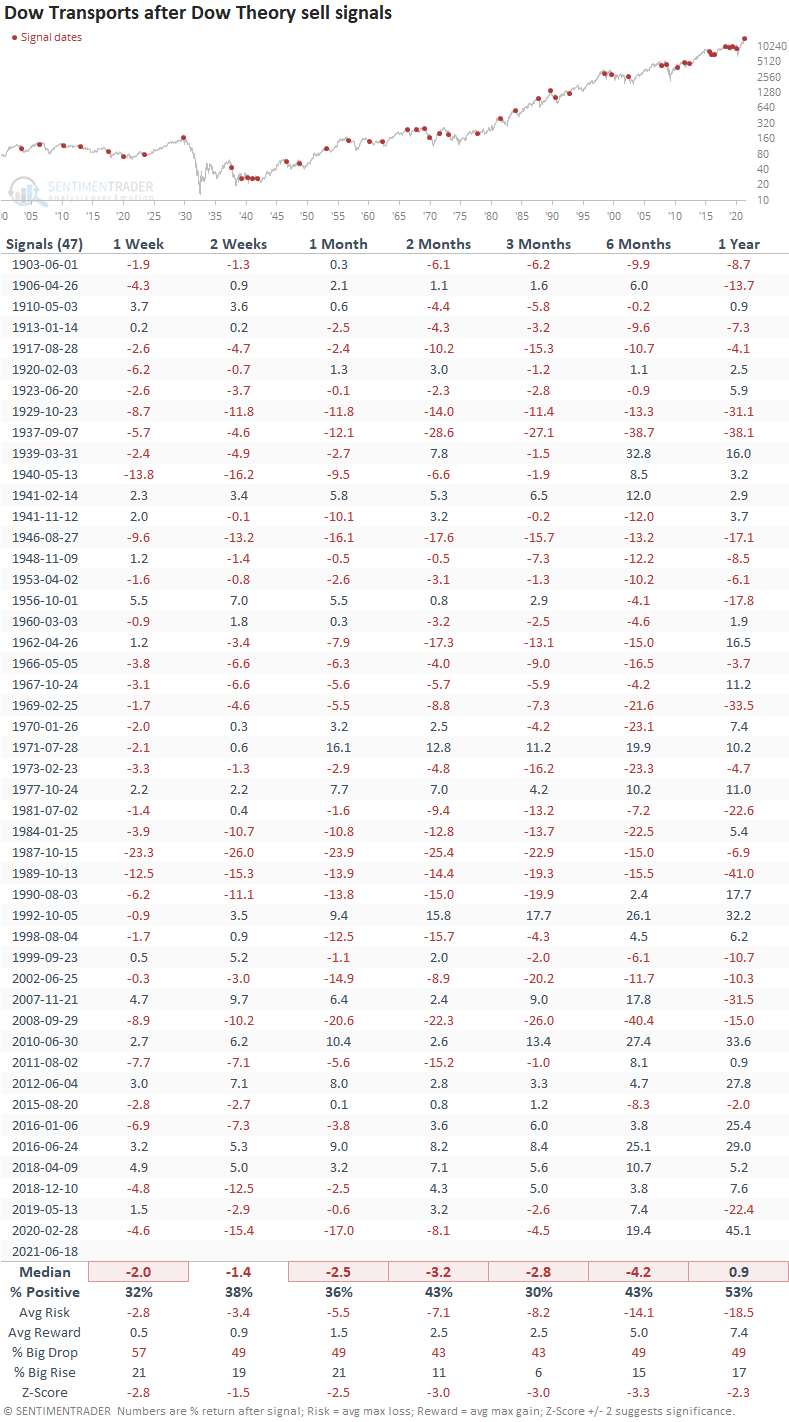
Again, however, over the past decade or so, any pain was mostly temporary.
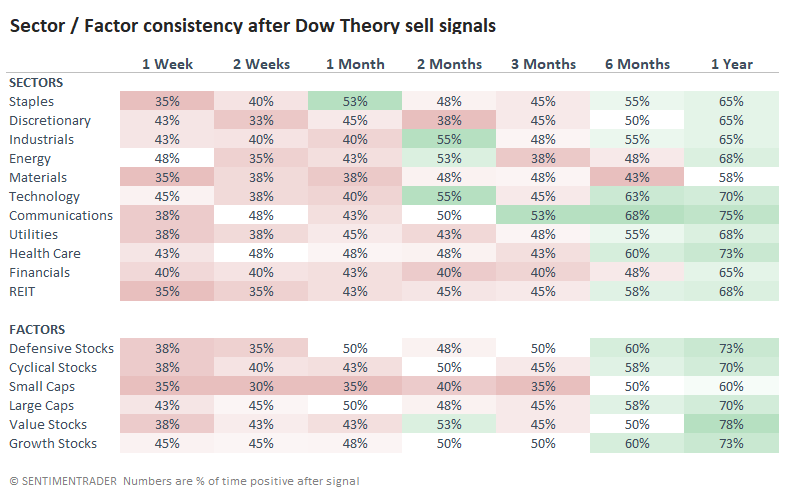
LITTLE SOLACE AMONG SECTORS
When we look at sector and factor returns, there was a mixed bag. We could reasonably expect Defensive sectors to hold up best, and for the most part they did, but it was not definitive. Staples held up relatively well, but so did Technology, which is not what we'd expect.
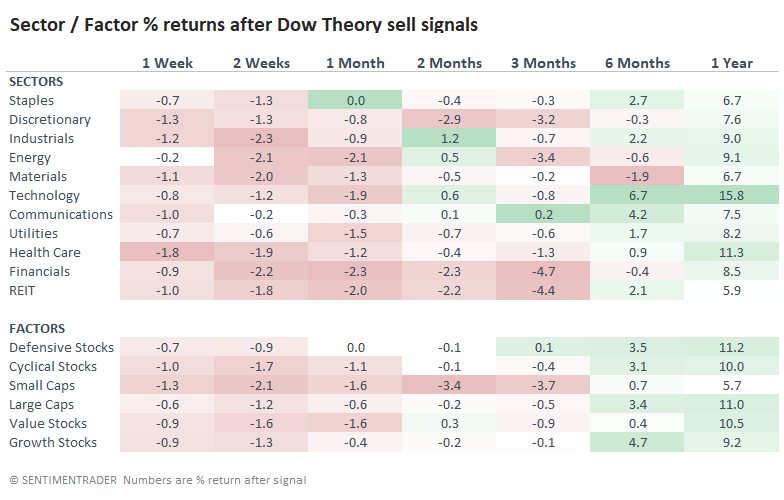
In terms of consistency, there was quite a bit of back-and-forth over the next 1-3 months, with few clear winners. Financial and Discretionary stocks were among the most persistent losers.
We tend to place more weight on recent occurrences, so this is a caveat against becoming too pessimistic based on this one theory. Also, there is an argument to be made that these two indexes no longer properly reflect the U.S. economy.
With those concerns, we're not placing a whole lot of weight on Friday's potential Dow Theory sell signal. It's a worry, to be sure, especially since it's occurring after another surge in speculative activity and other warnings.
Active Studies
| Time Frame | Bullish | Bearish | | Short-Term | 0 | 1 | | Medium-Term | 2 | 12 | | Long-Term | 11 | 5 |
|
Indicators at Extremes
Portfolio
| Position | Description | Weight % | Added / Reduced | Date | | Stocks | RSP | 4.1 | Added 4.1% | 2021-05-19 | | Bonds | 23.9% BND, 6.9% SCHP | 30.7 | Reduced 7.1% | 2021-05-19 | | Commodities | GCC | 2.6 | Reduced 2.1%
| 2020-09-04 | | Precious Metals | GDX | 5.6 | Reduced 4.2% | 2021-05-19 | | Special Situations | 4.3% XLE, 2.2% PSCE | 7.6 | Reduced 5.6% | 2021-04-22 | | Cash | | 49.4 | | |
|
Updates (Changes made today are underlined)
Much of our momentum and trend work has remained positive for several months, with some scattered exceptions. Almost all sentiment-related work has shown a poor risk/reward ratio for stocks, especially as speculation drove to record highs in exuberance in February. Much of that has worn off, and most of our models are back toward neutral levels. There isn't much to be excited about here. The same goes for bonds and even gold. Gold has been performing well lately and is back above long-term trend lines. The issue is that it has a poor record of holding onto gains when attempting a long-term trend change like this, so we'll take a wait-and-see approach. RETURN YTD: 9.2% 2020: 8.1%, 2019: 12.6%, 2018: 0.6%, 2017: 3.8%, 2016: 17.1%, 2015: 9.2%, 2014: 14.5%, 2013: 2.2%, 2012: 10.8%, 2011: 16.5%, 2010: 15.3%, 2009: 23.9%, 2008: 16.2%, 2007: 7.8%
|
|
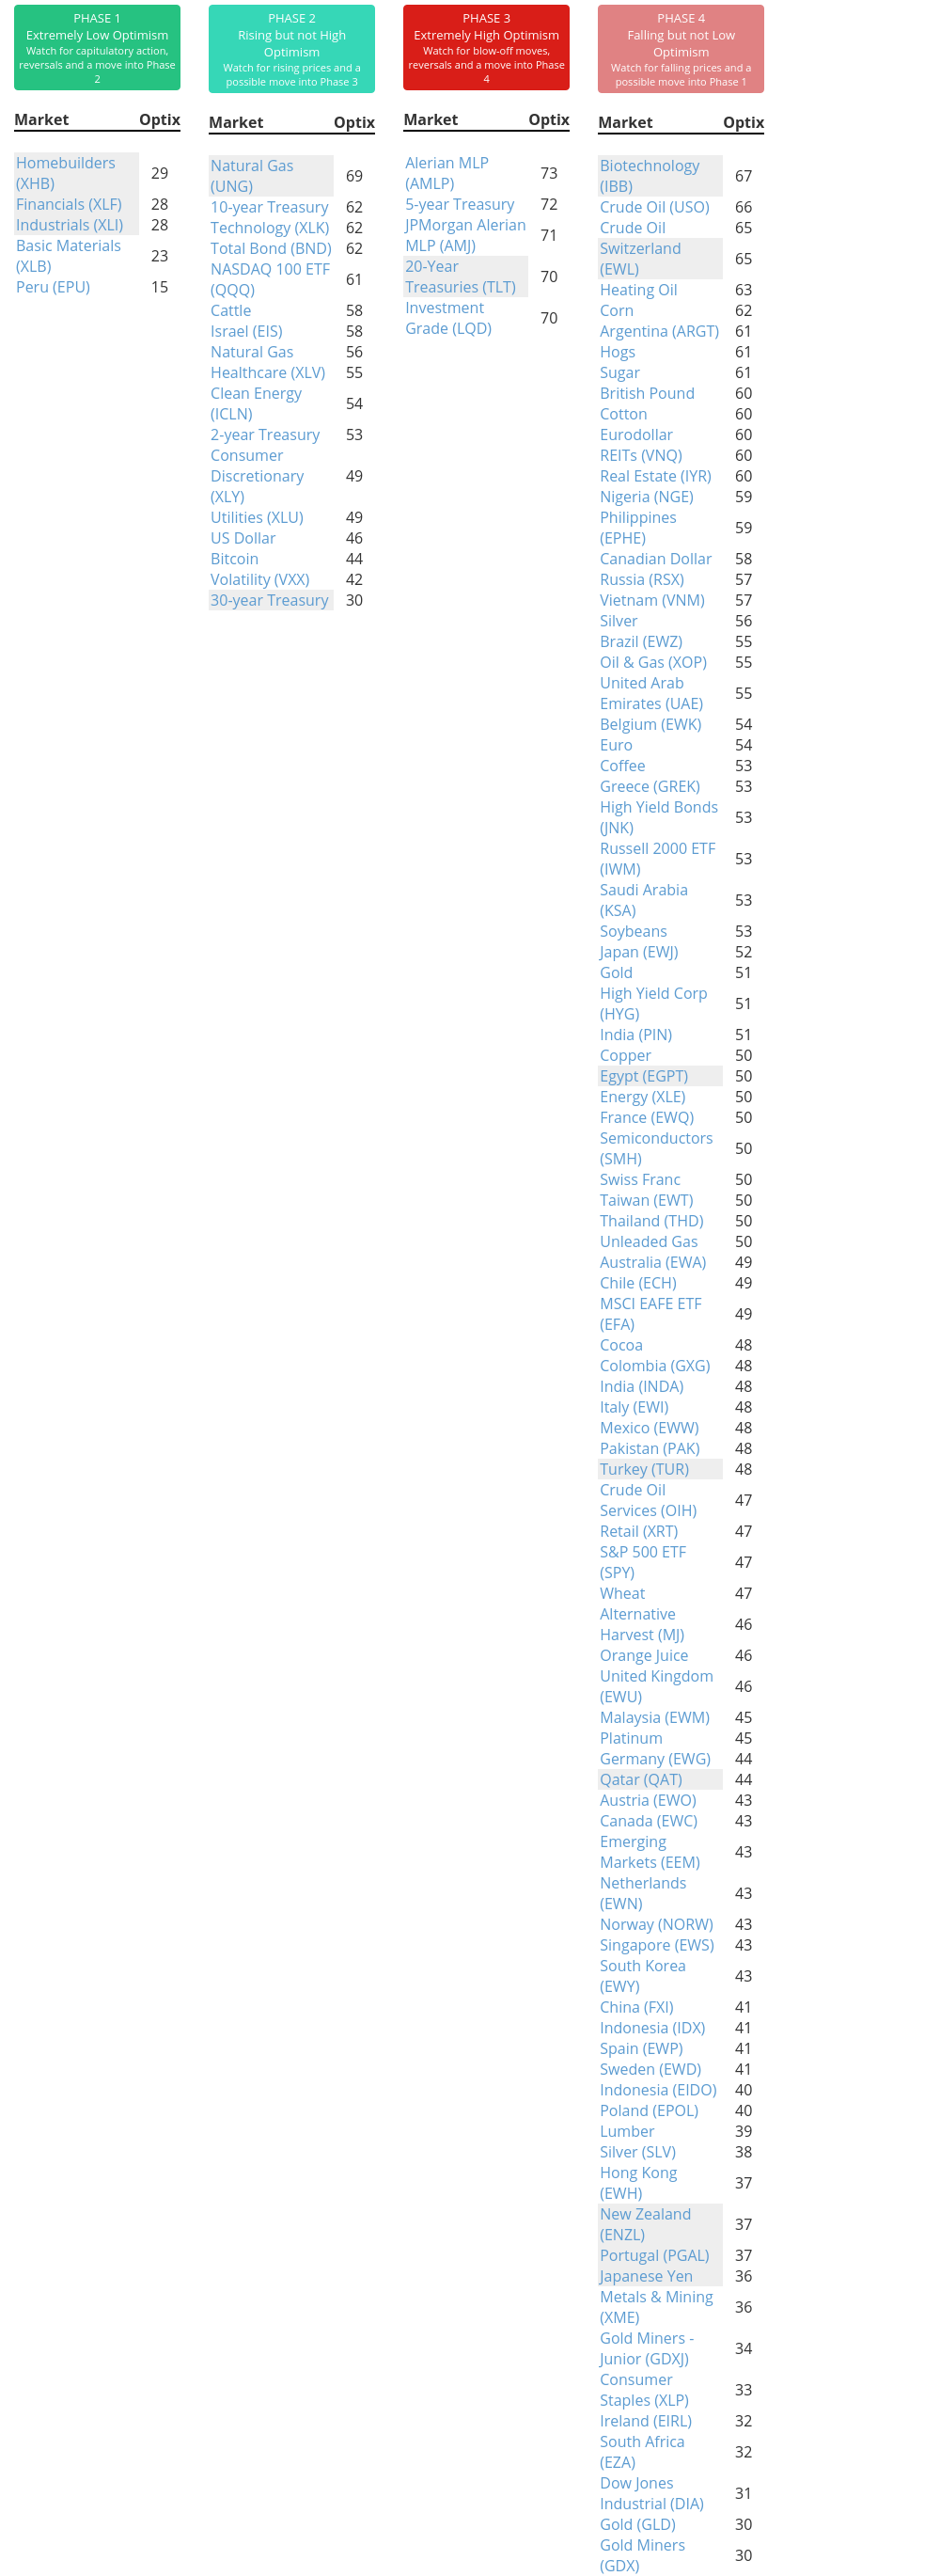
Phase Table
Ranks
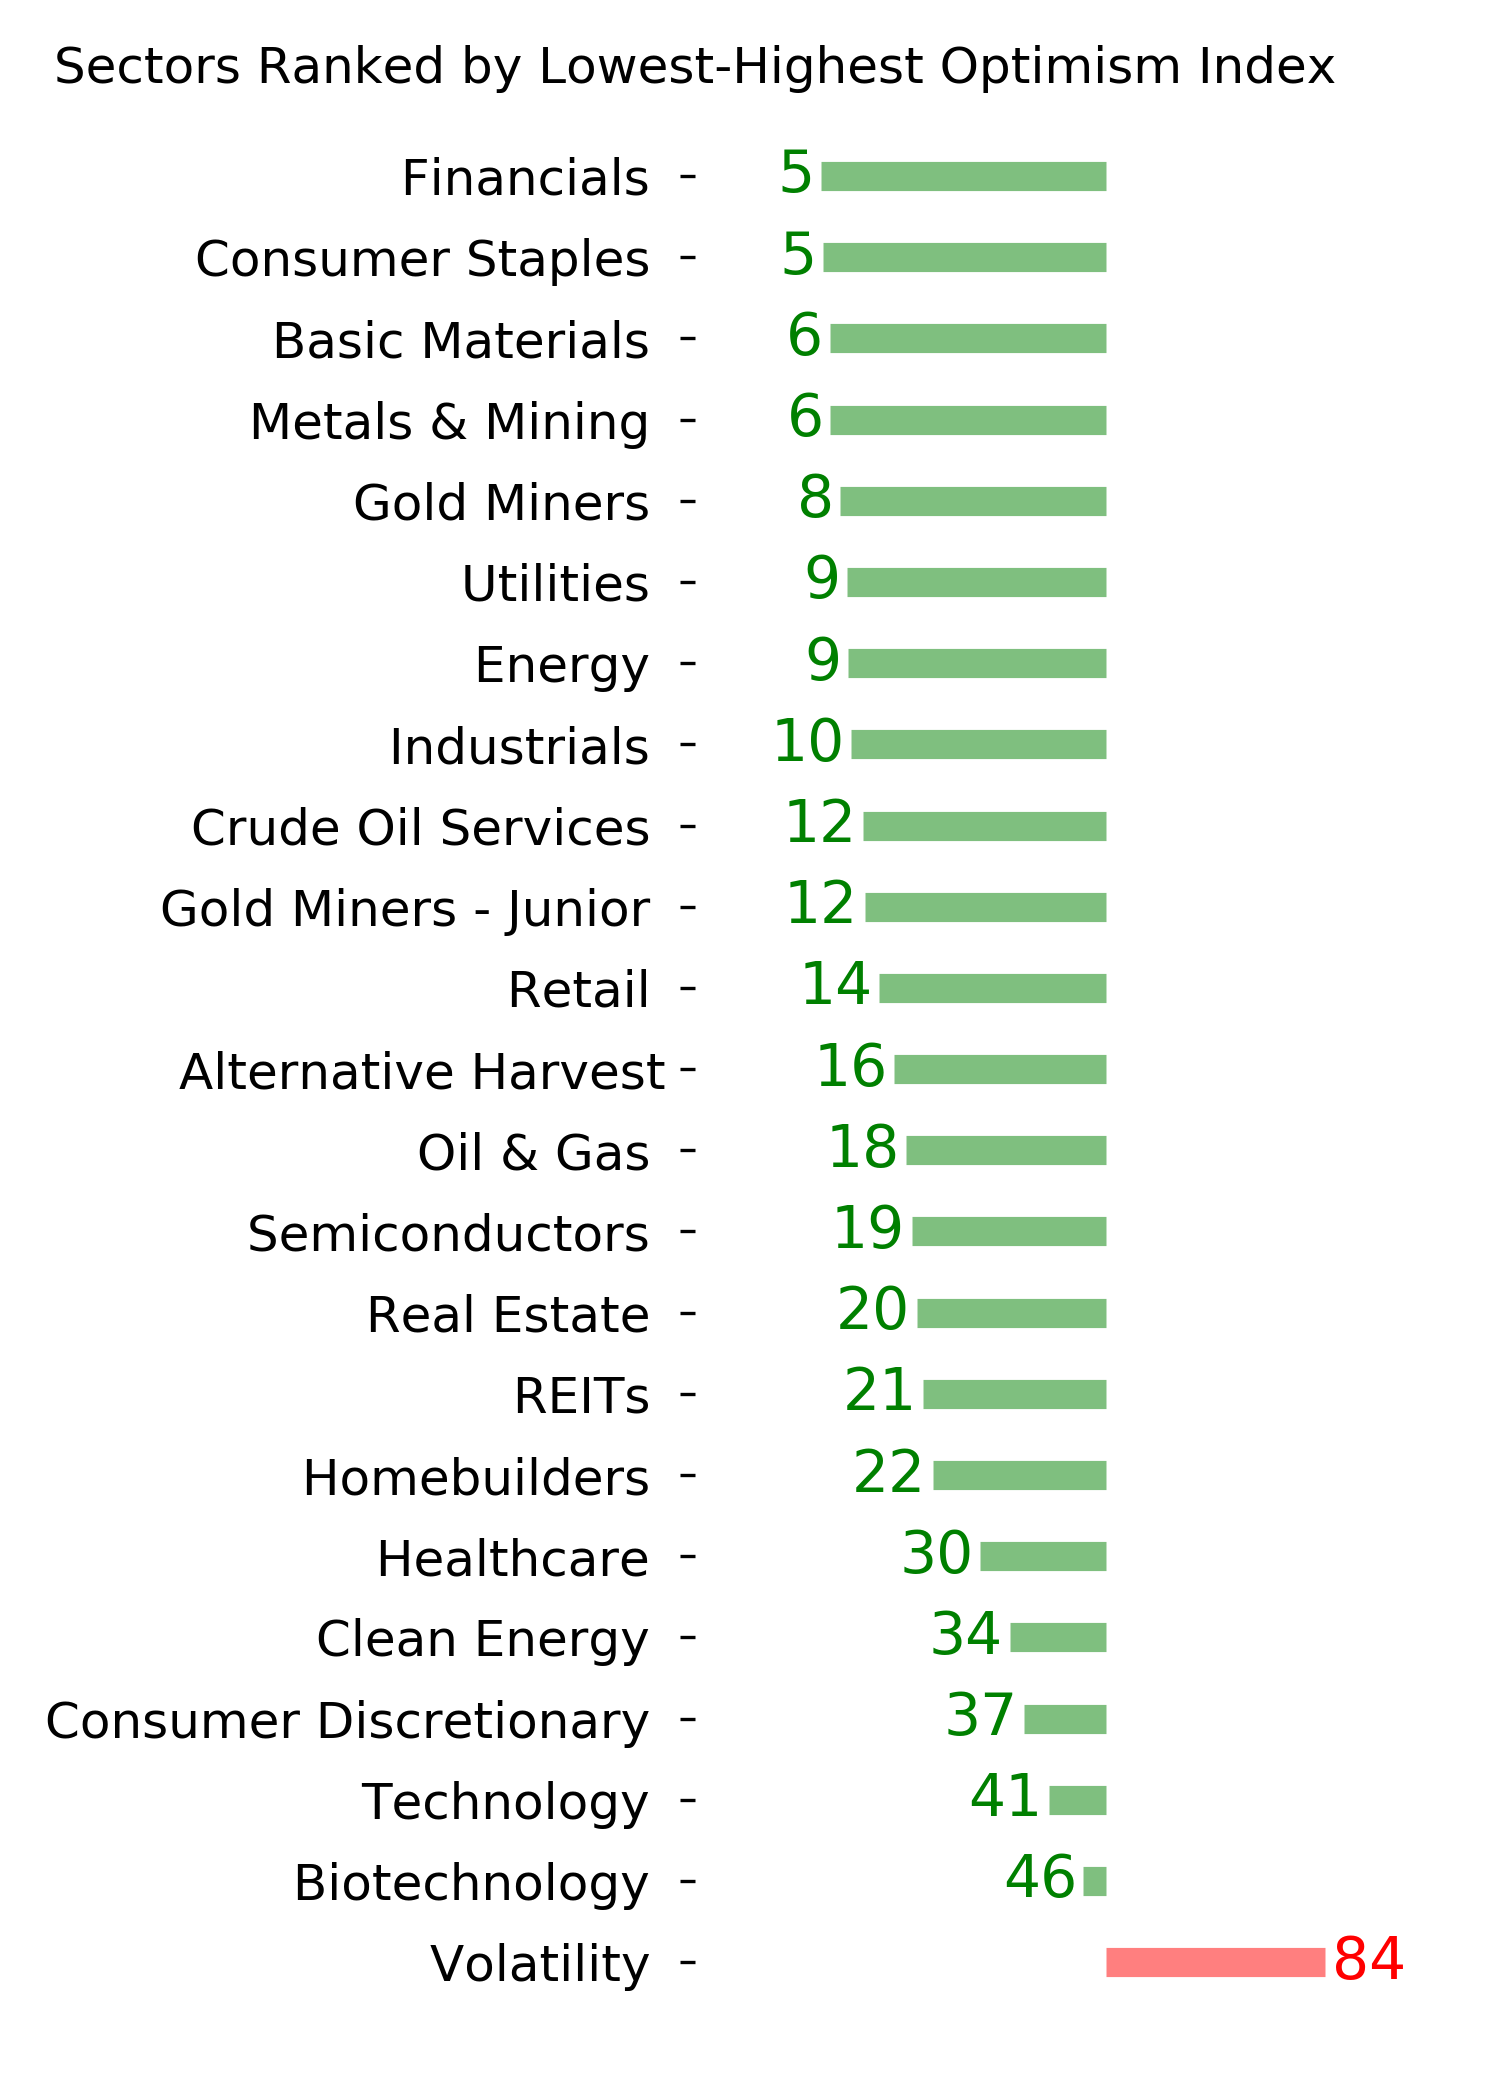
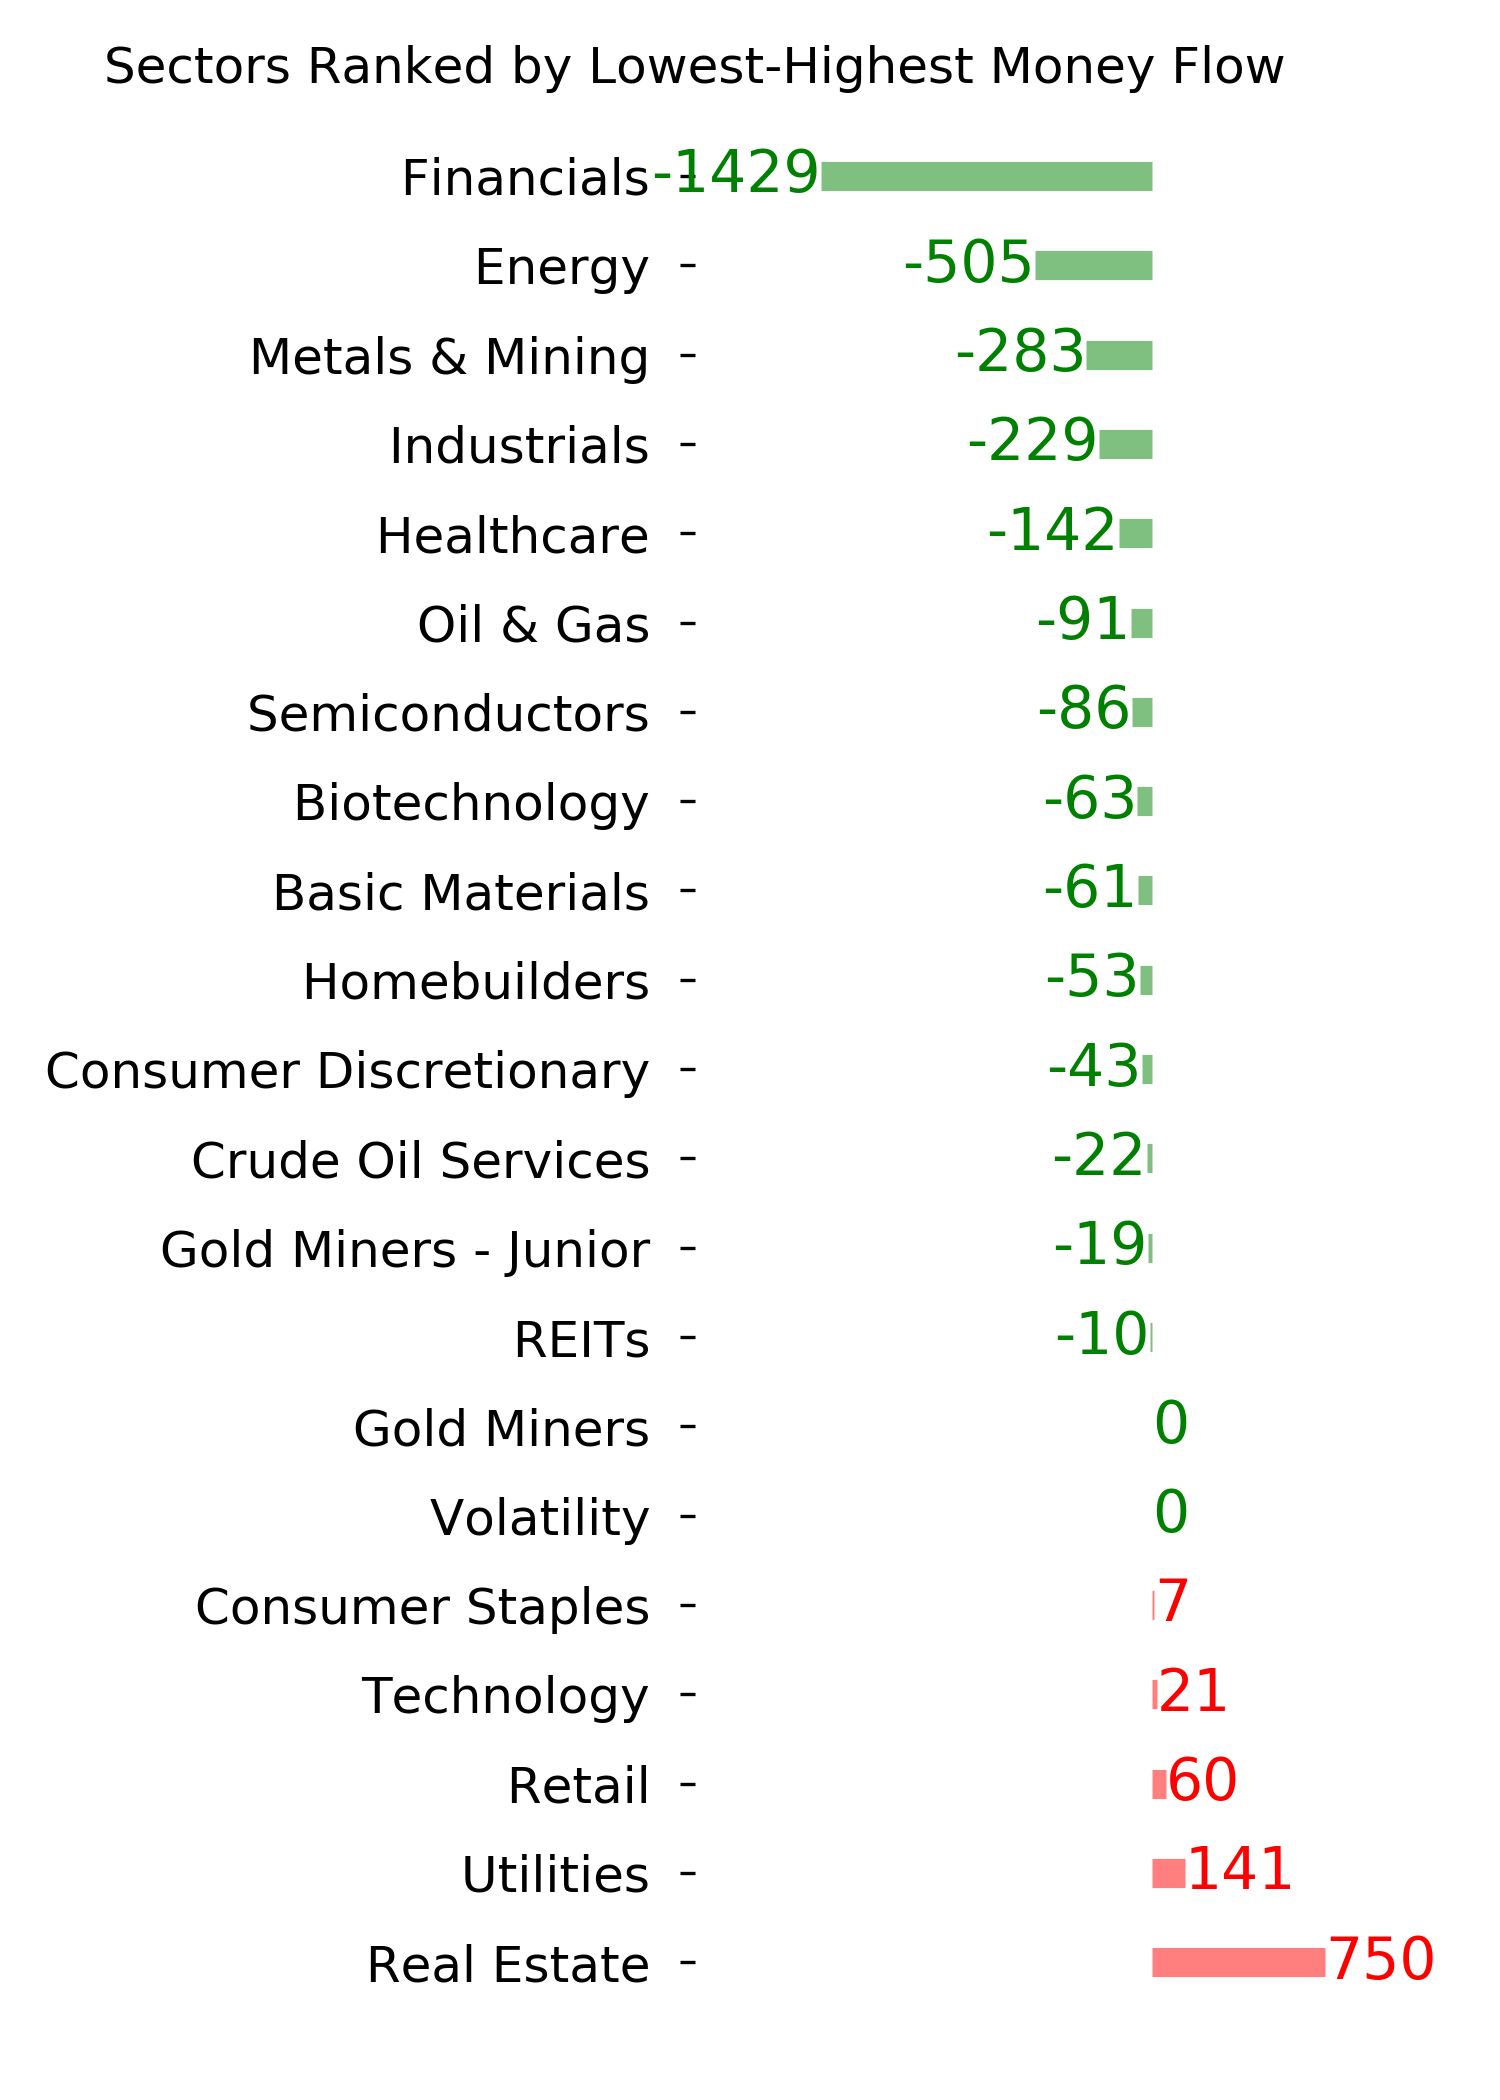
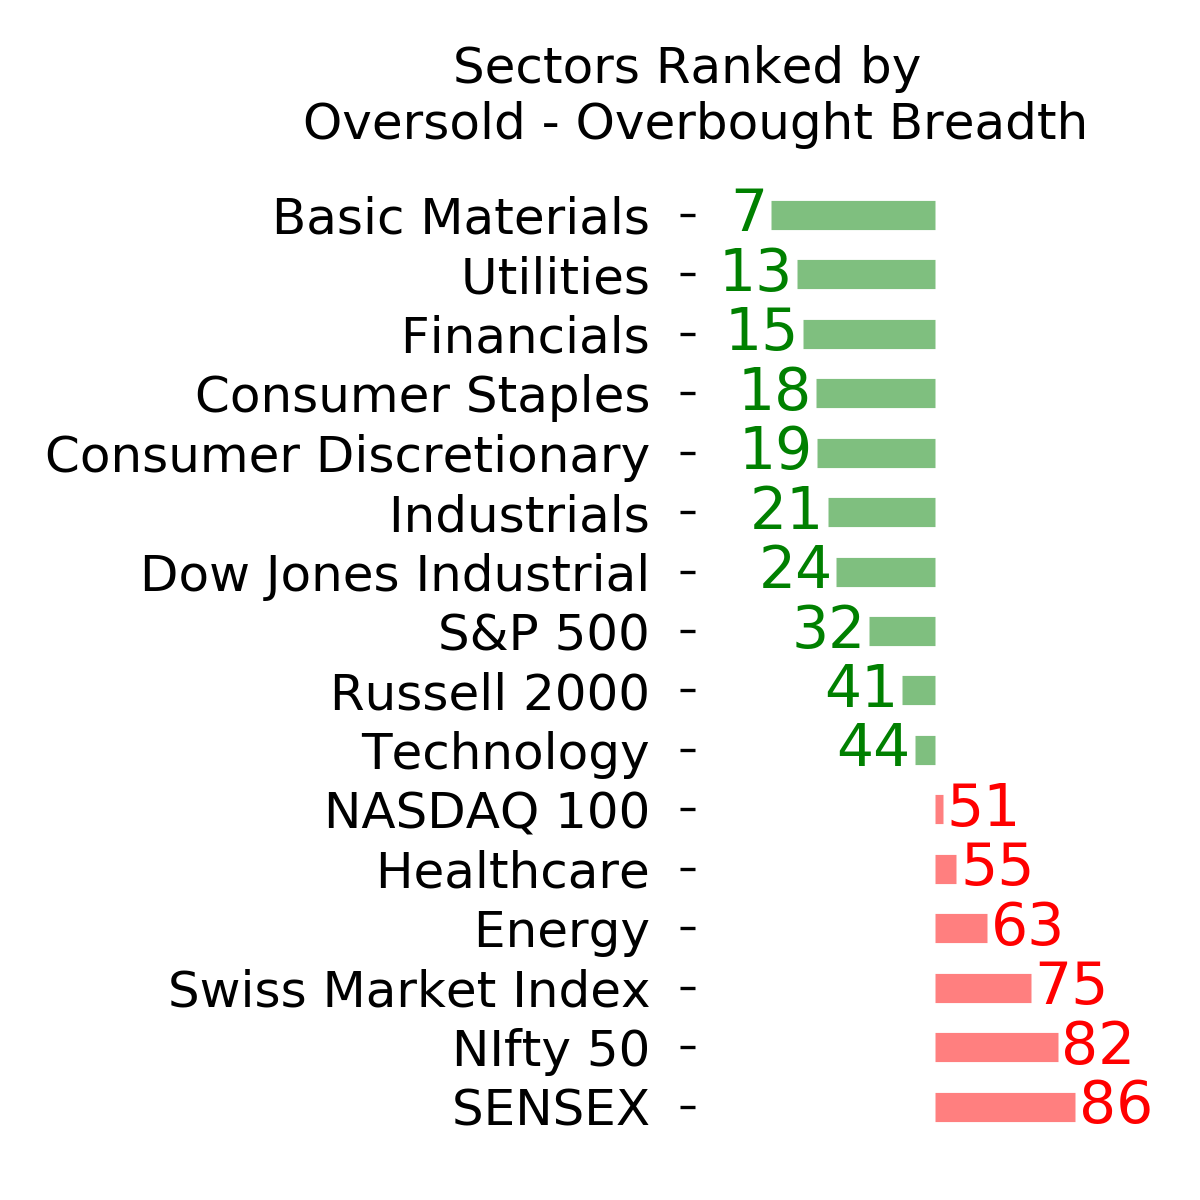
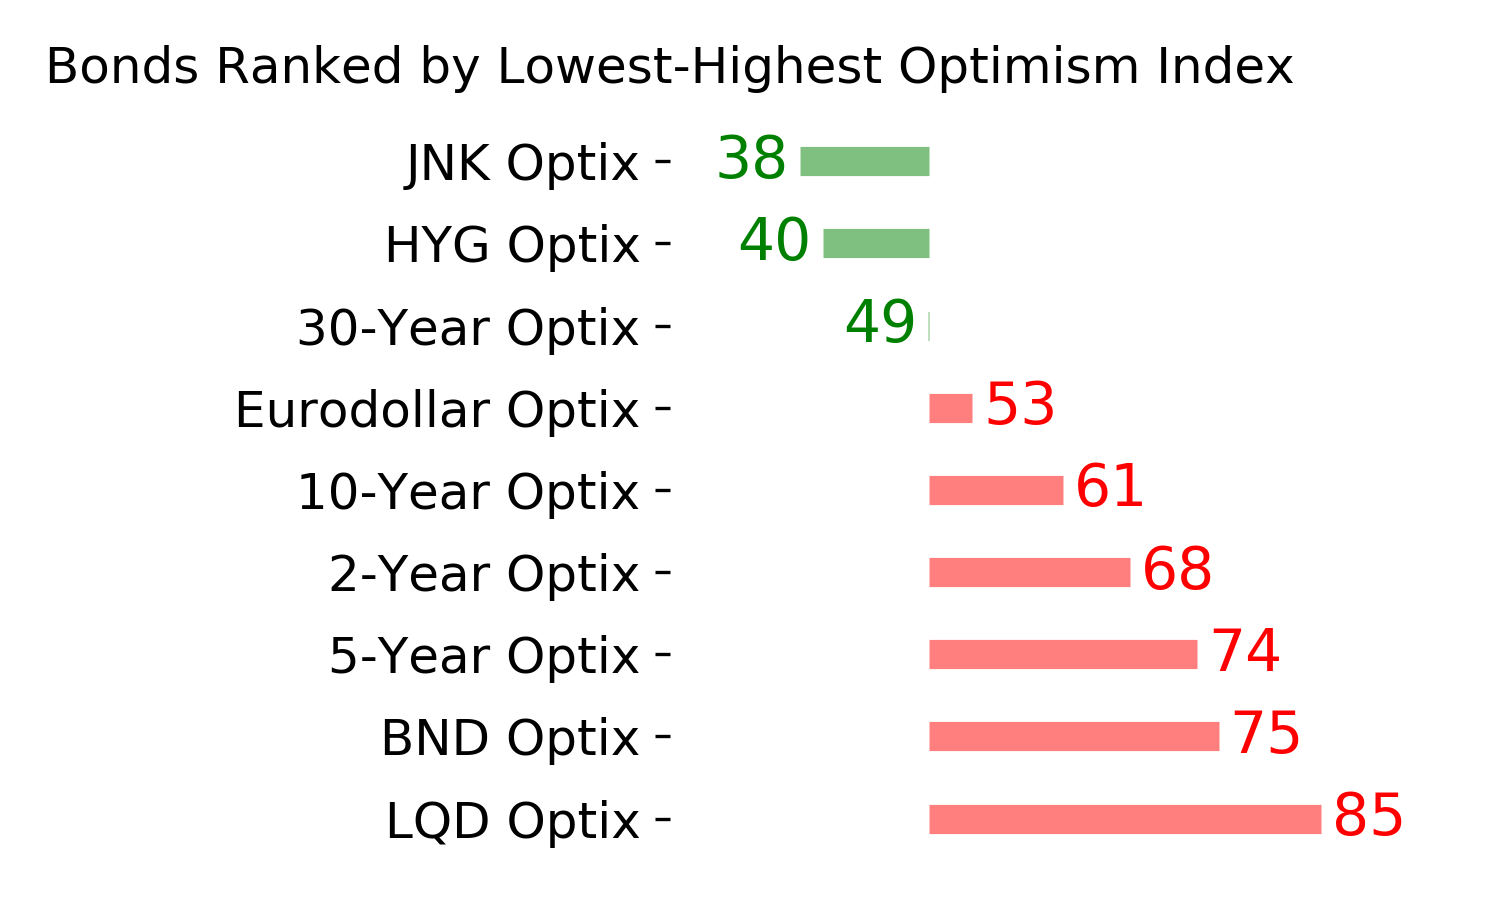
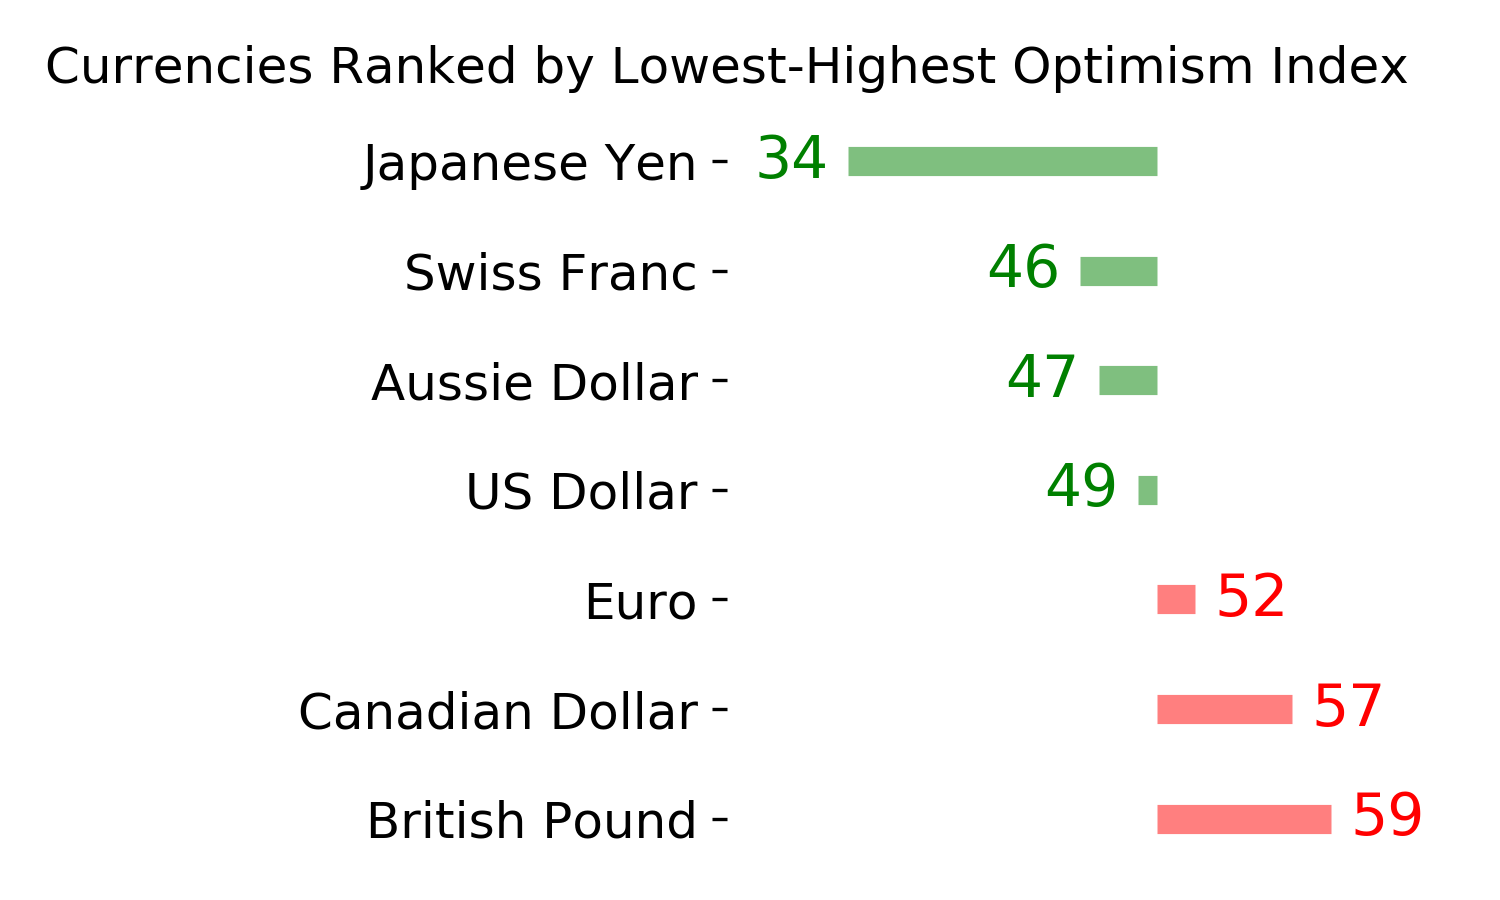
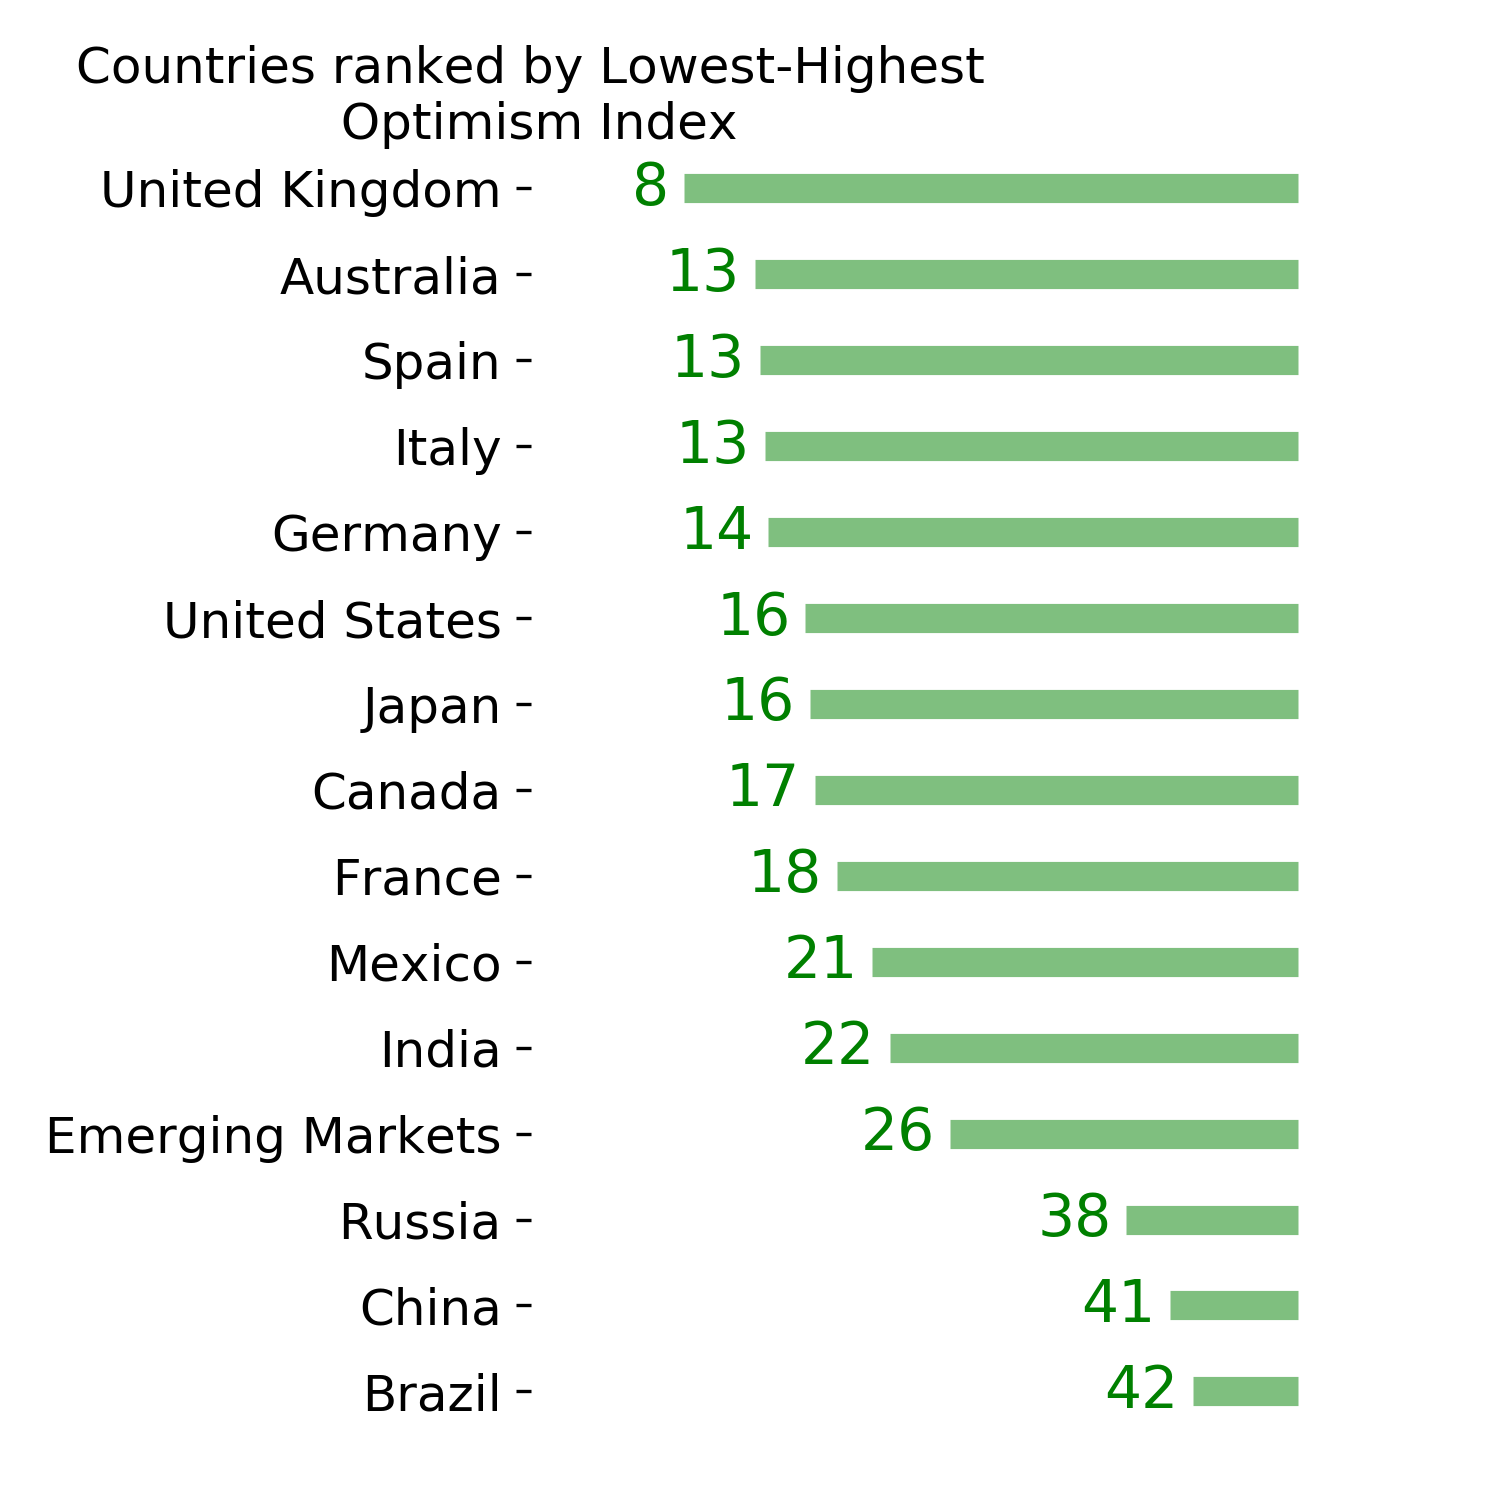
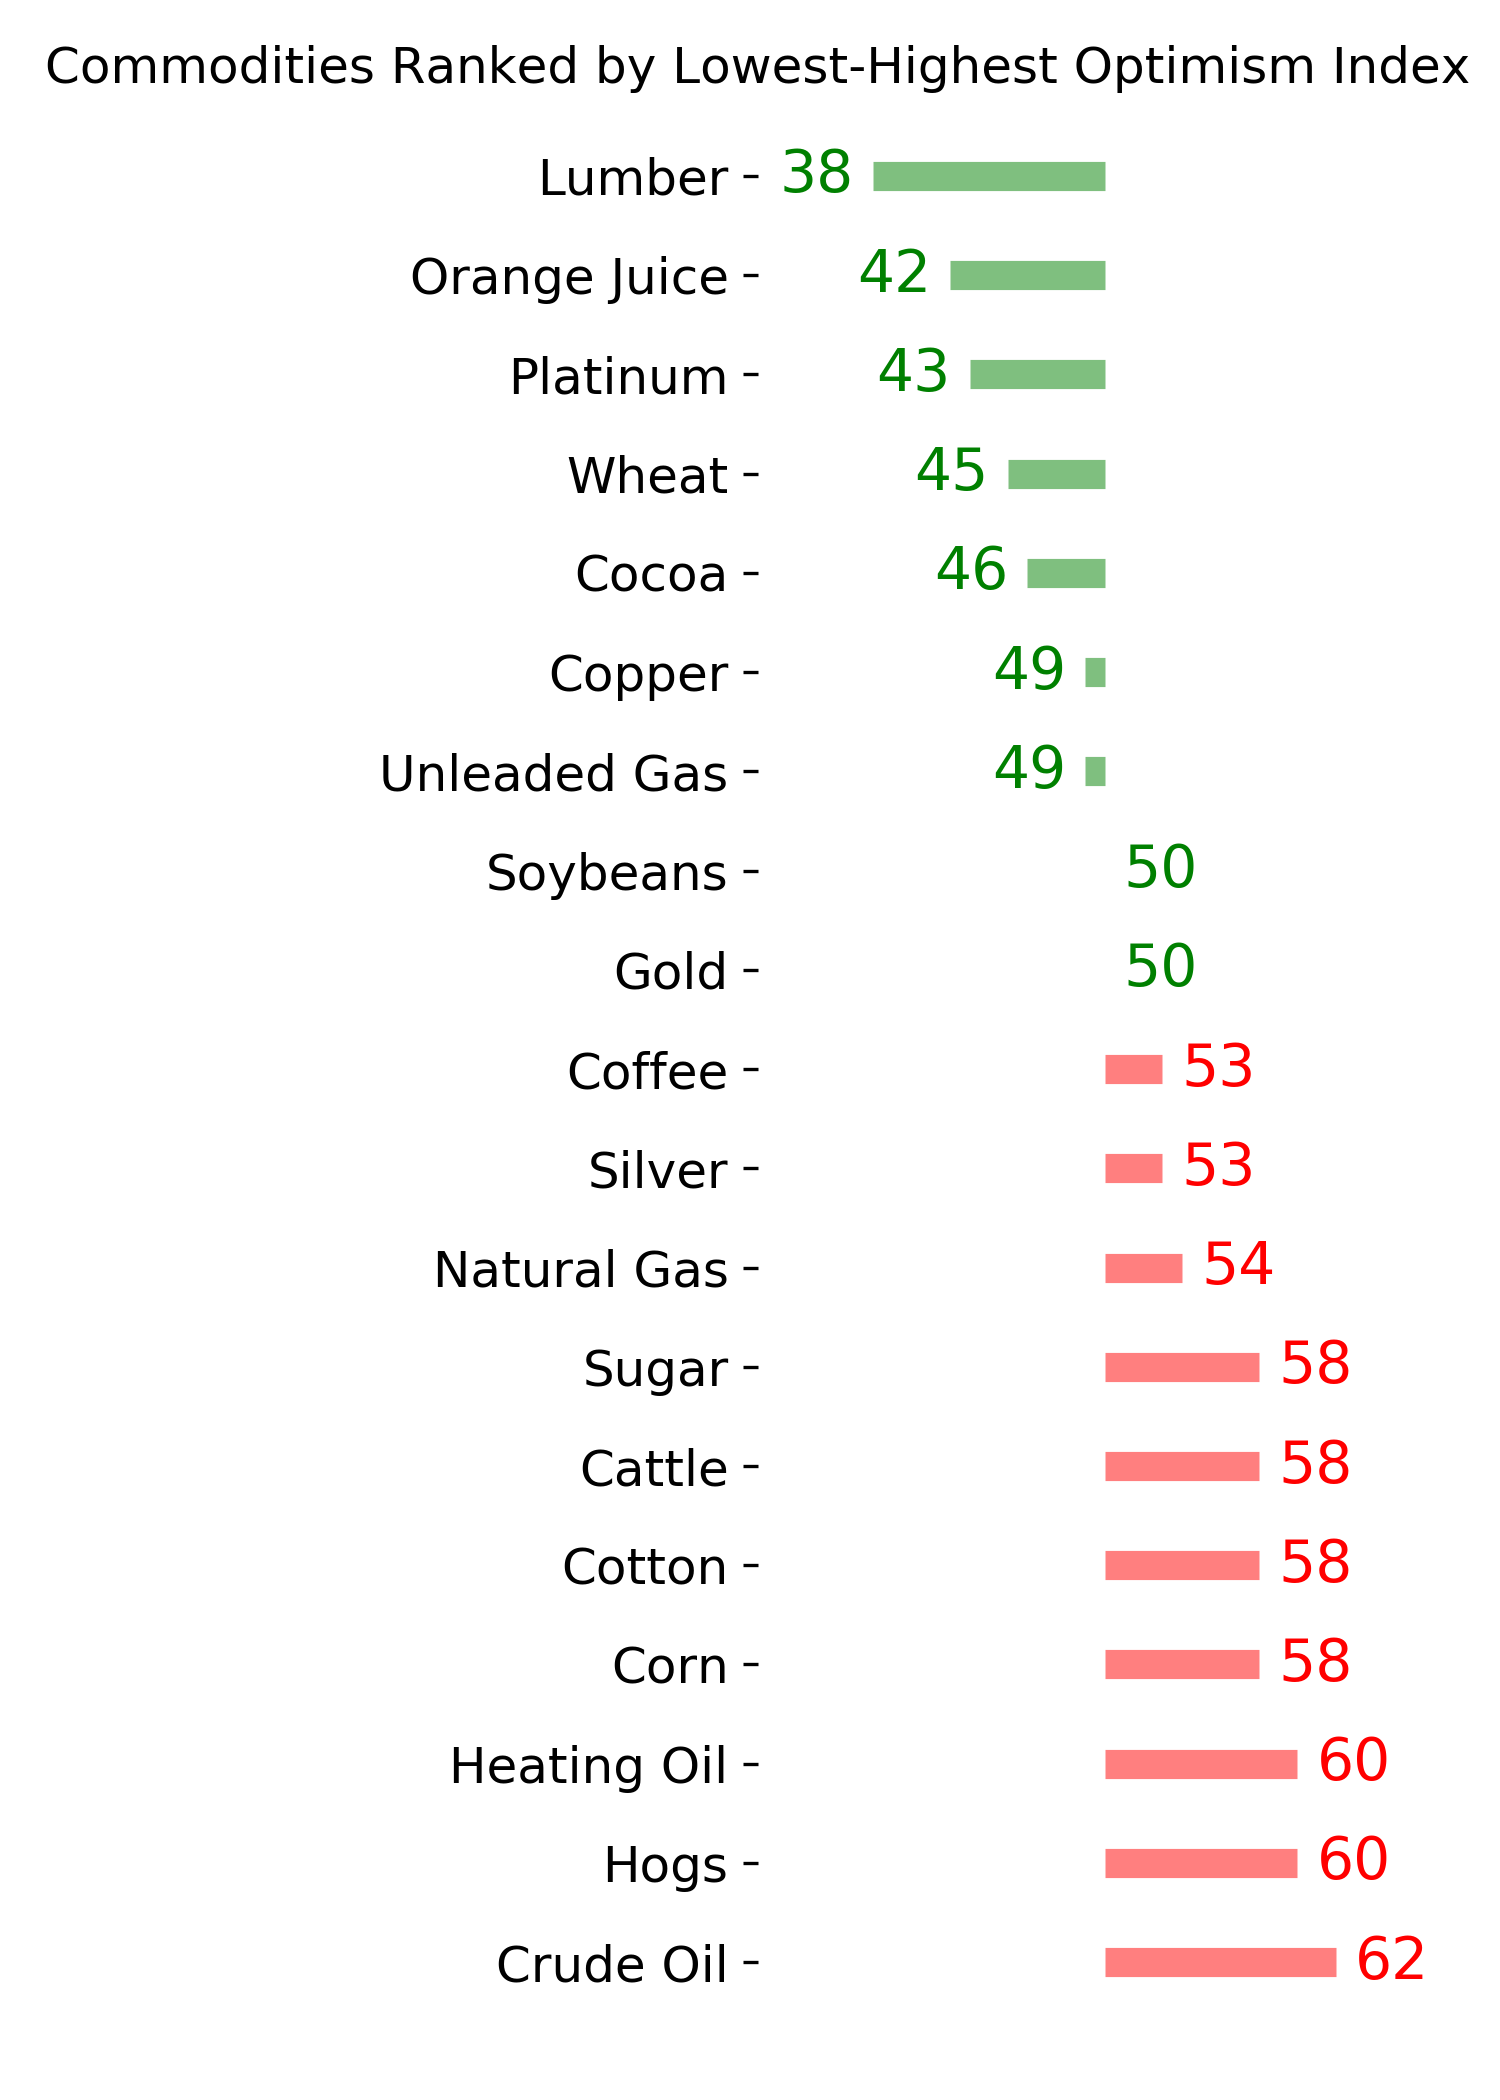
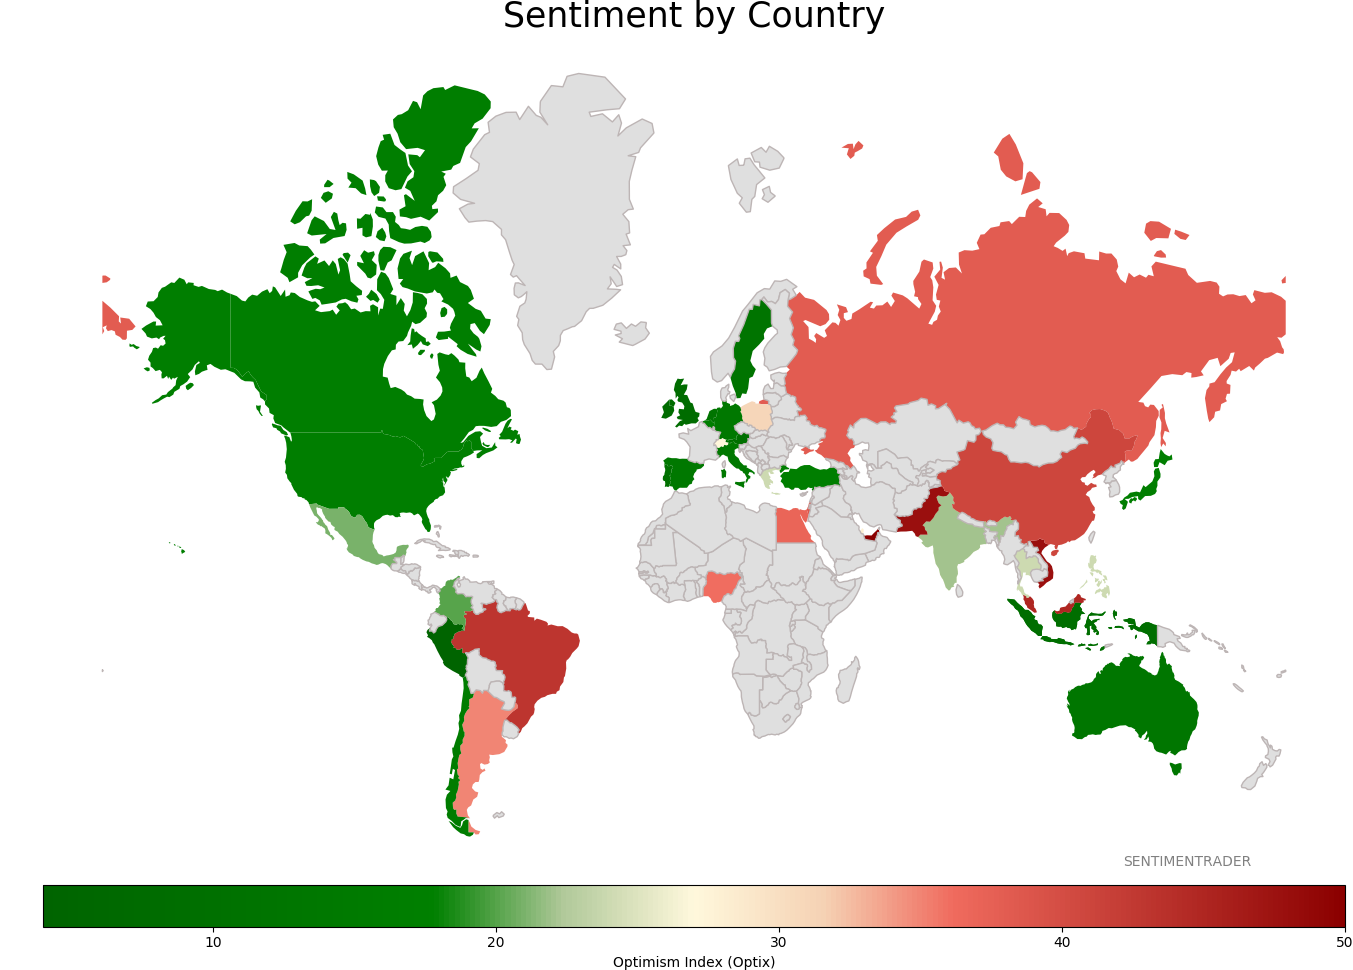
Sentiment Around The World
Optimism Index Thumbnails
|
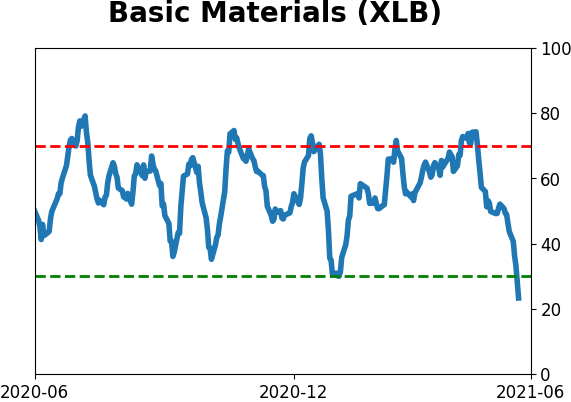
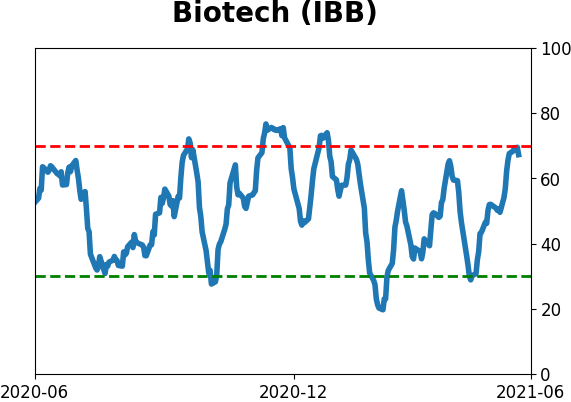
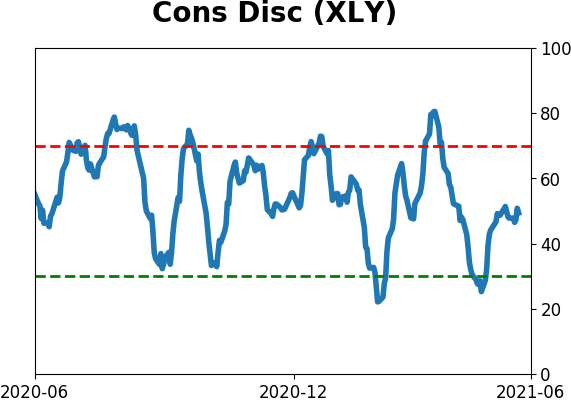
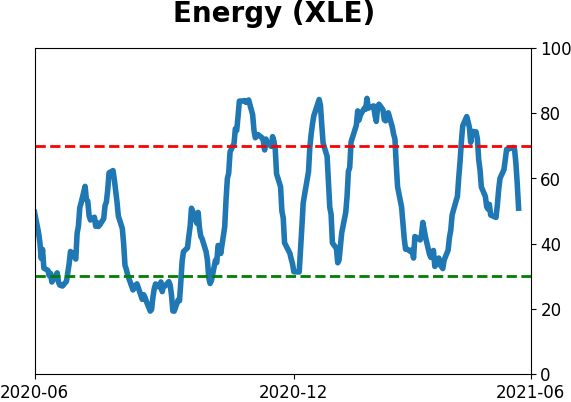
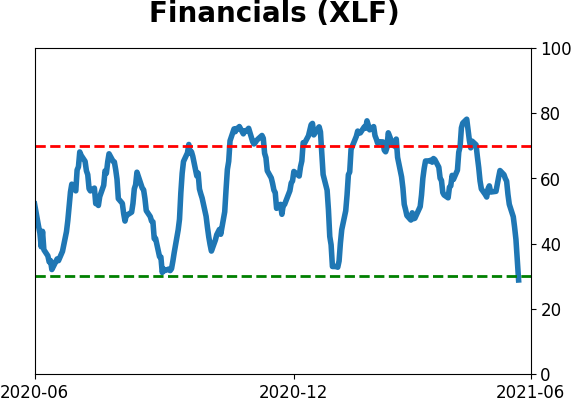
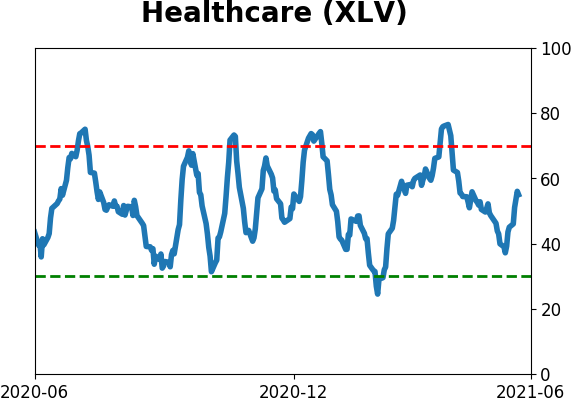
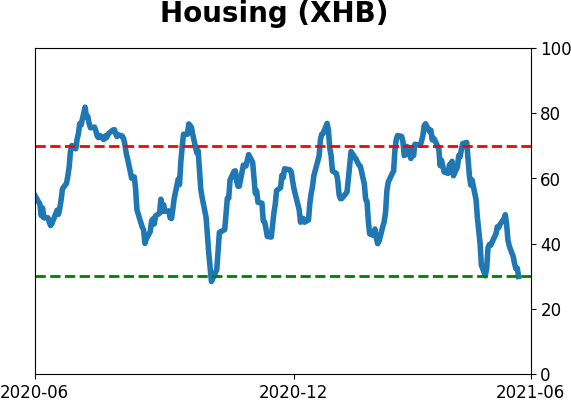
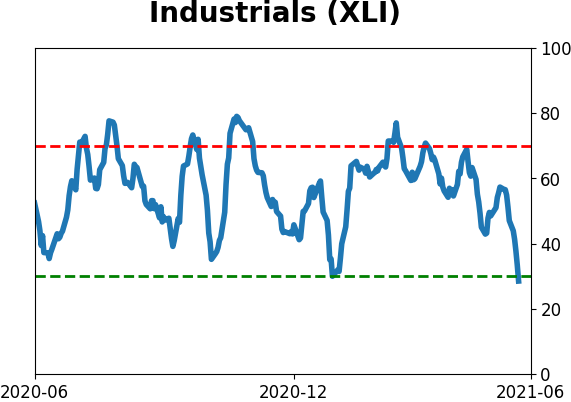
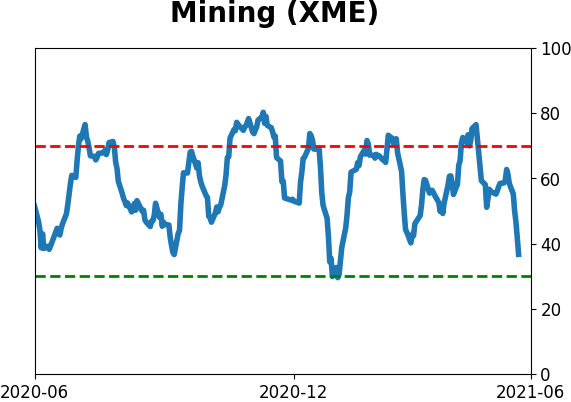
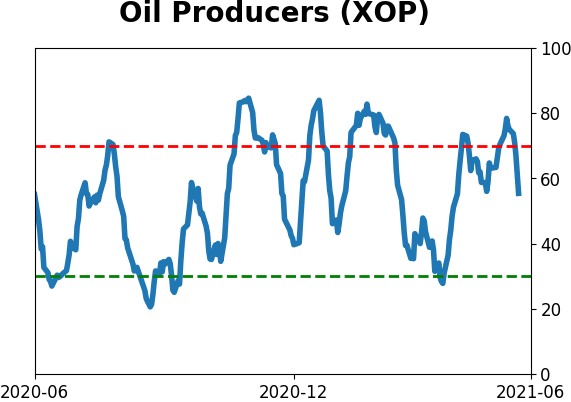
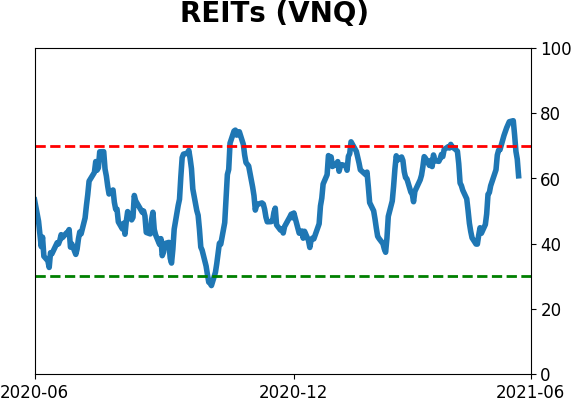
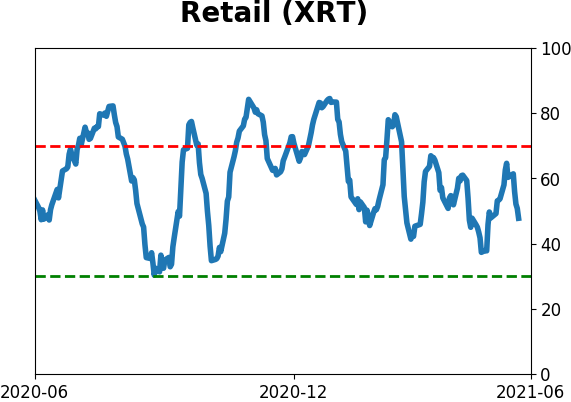
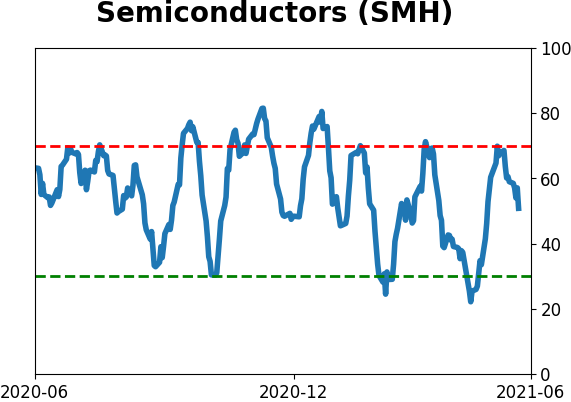
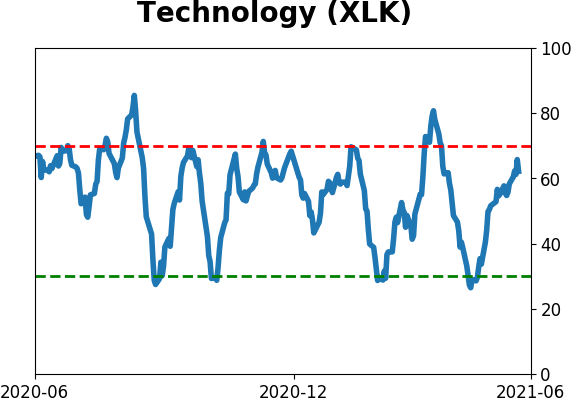
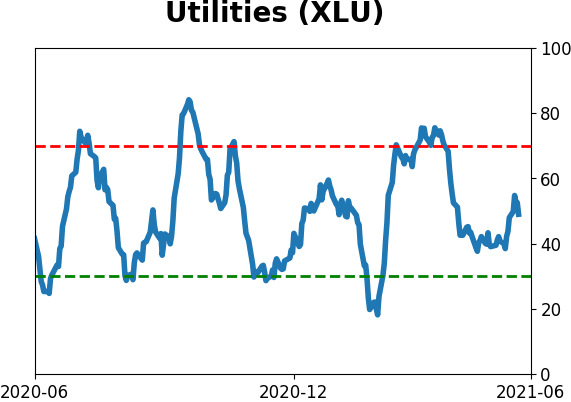
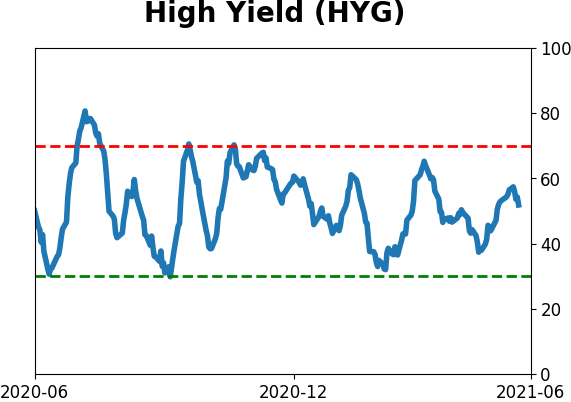
Sector ETF's - 10-Day Moving Average
|
|
|
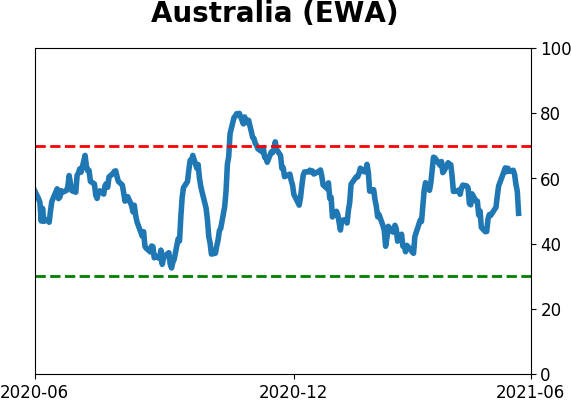
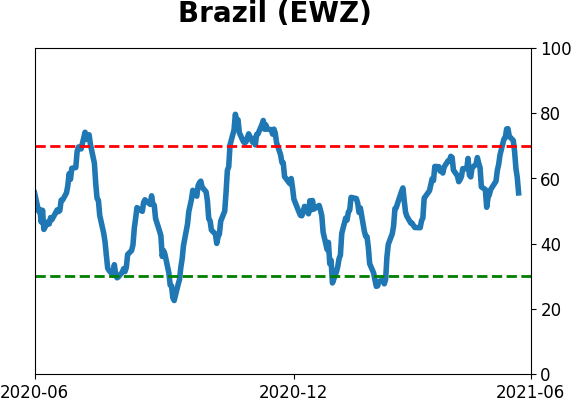
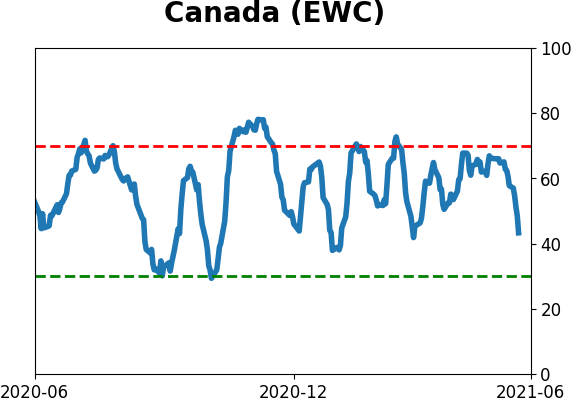
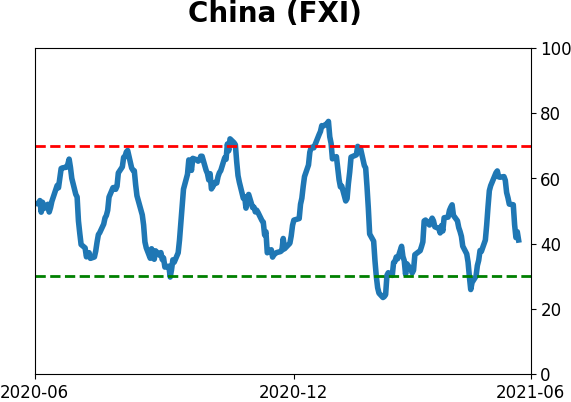
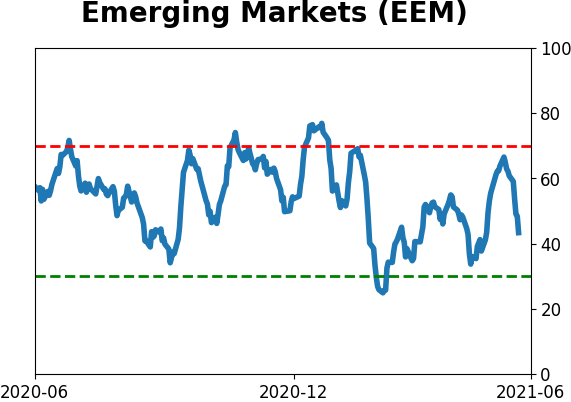
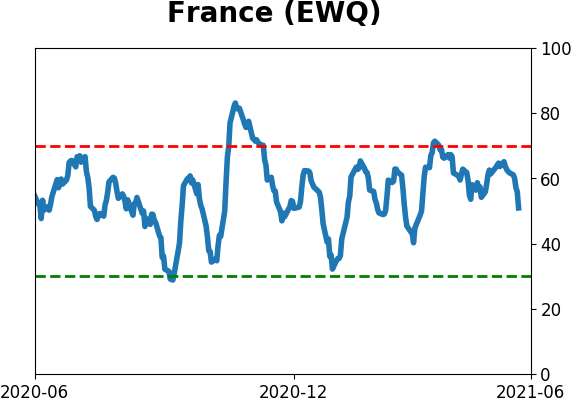
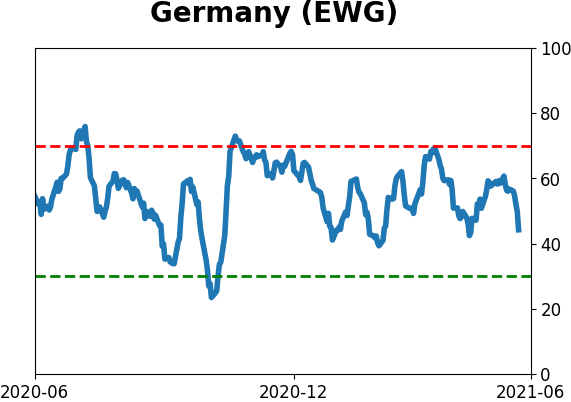
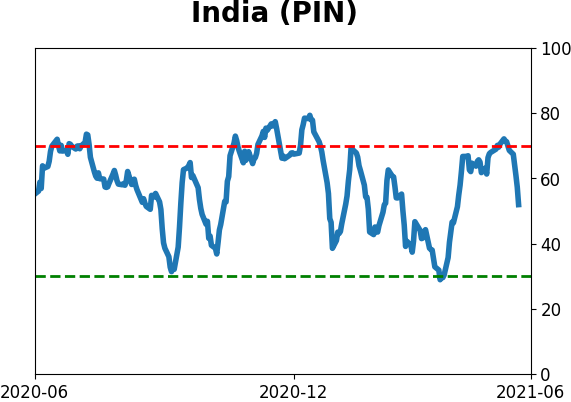
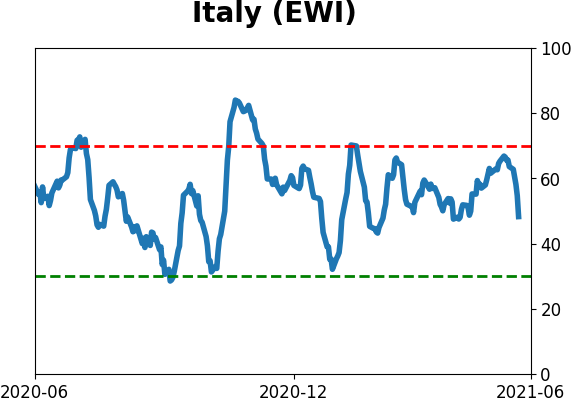
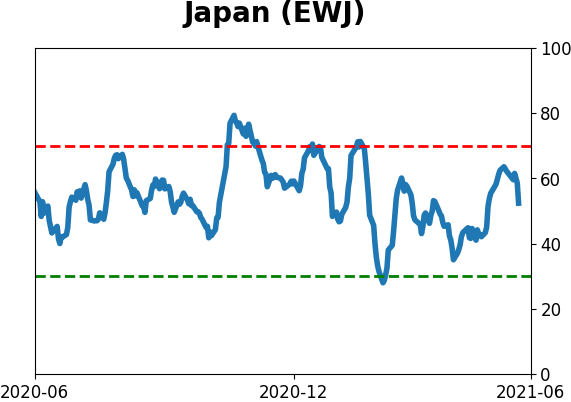
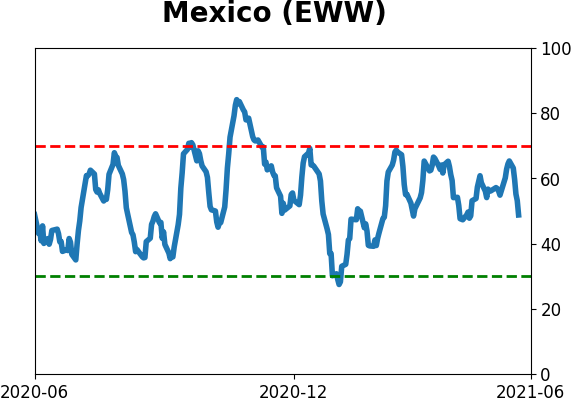
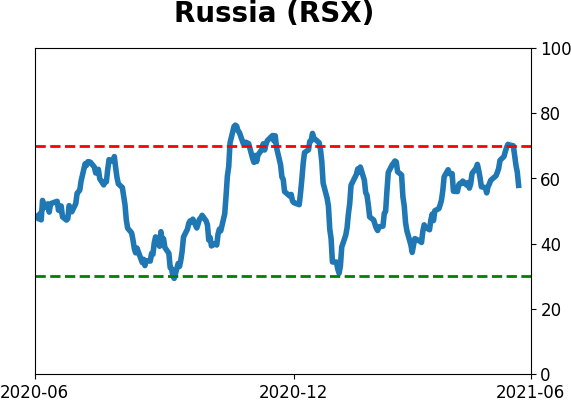
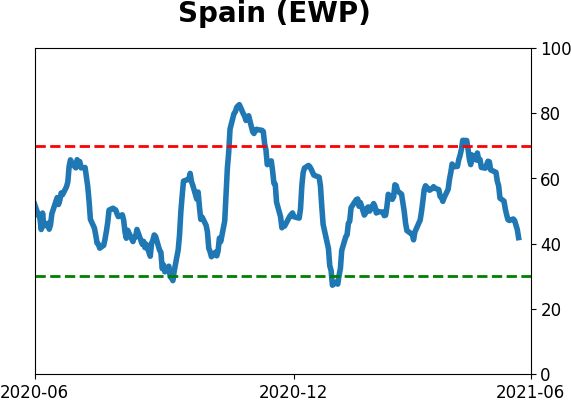
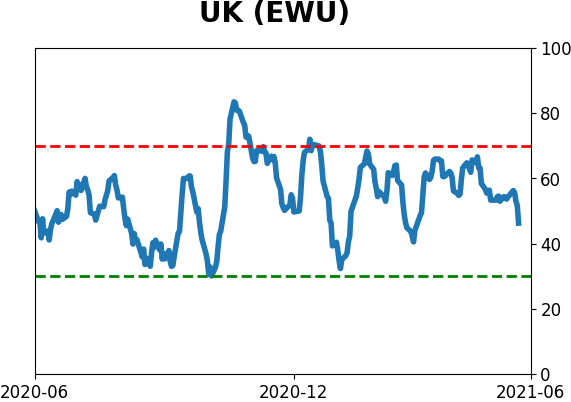
Country ETF's - 10-Day Moving Average
|
|
|
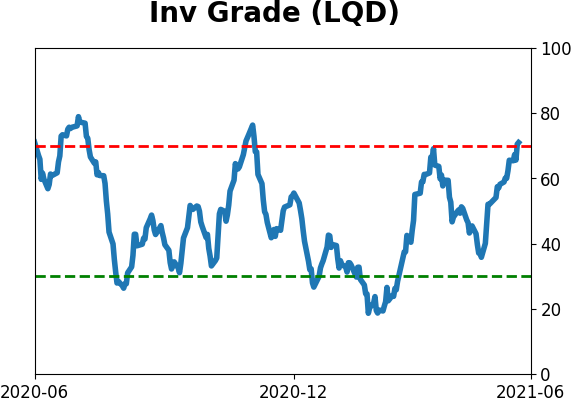
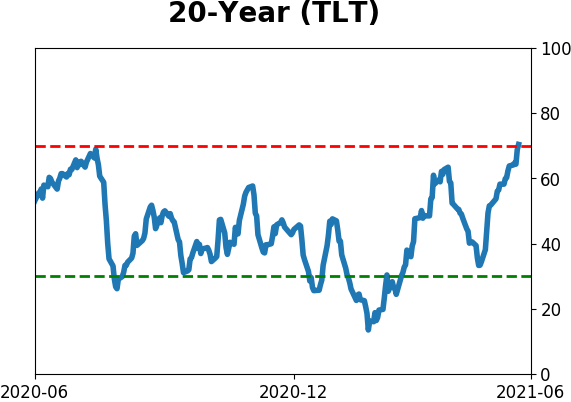
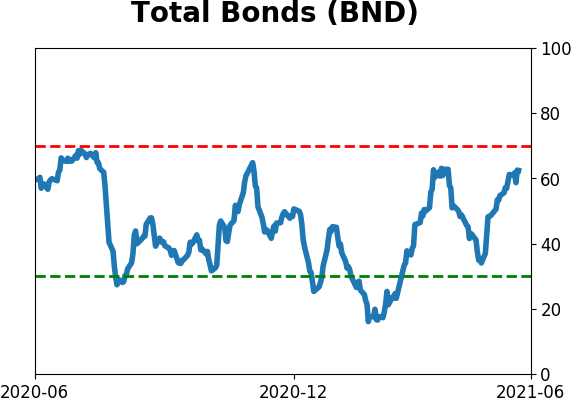
Bond ETF's - 10-Day Moving Average
|
|
|
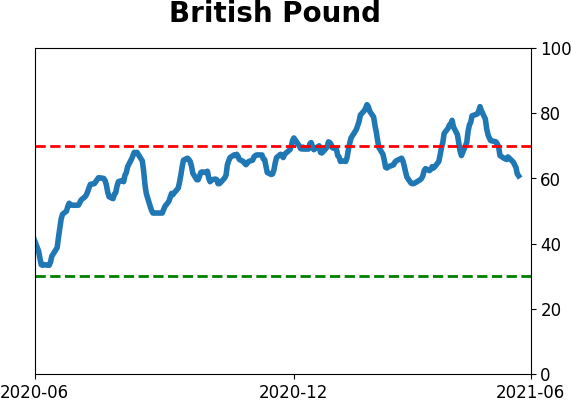
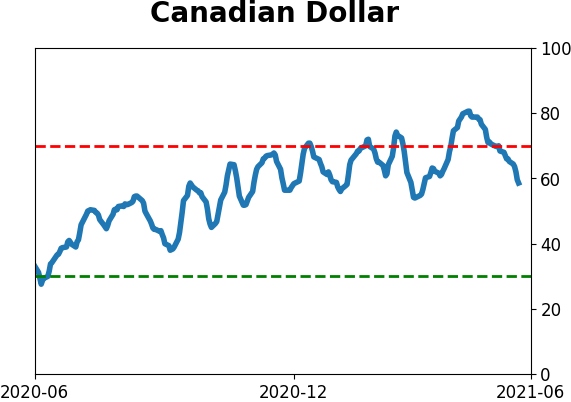
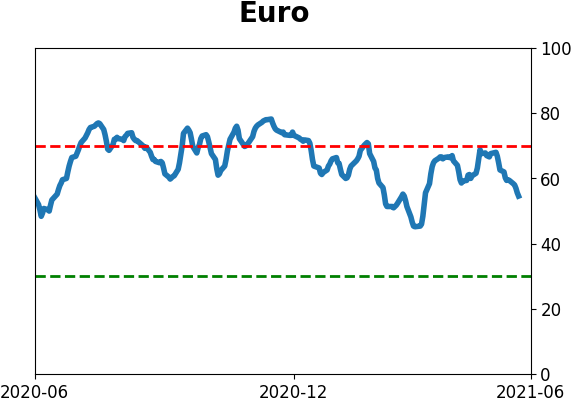
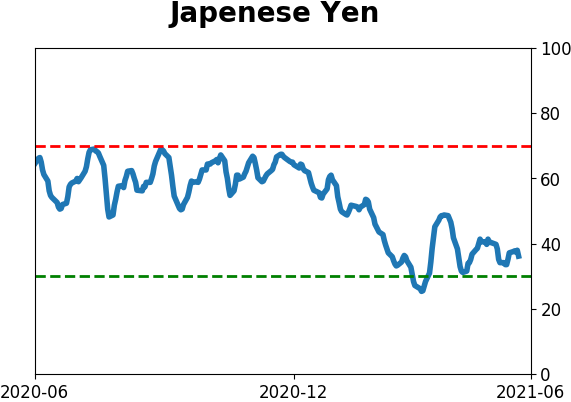
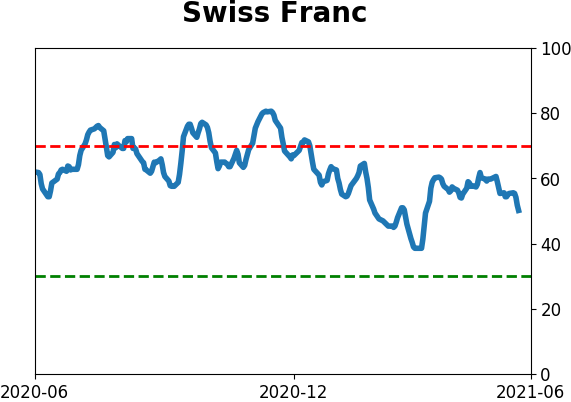
Currency ETF's - 5-Day Moving Average
|
|
|
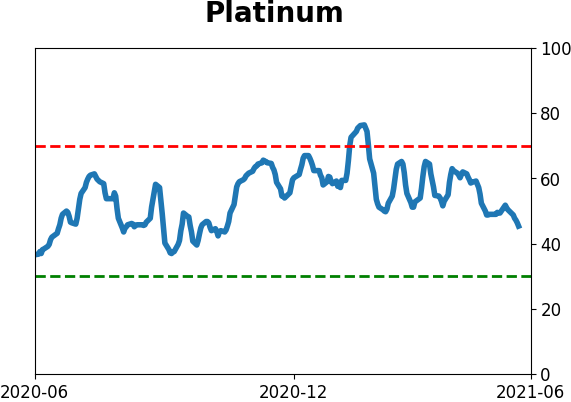
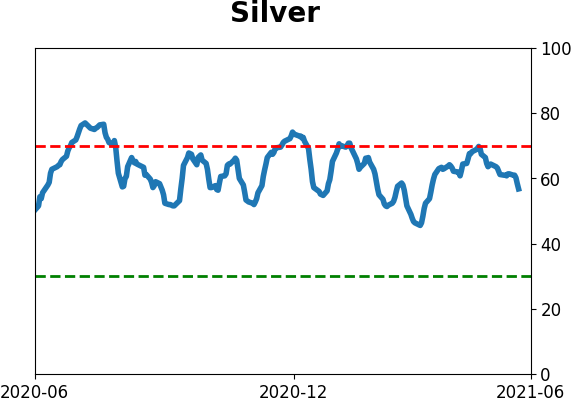
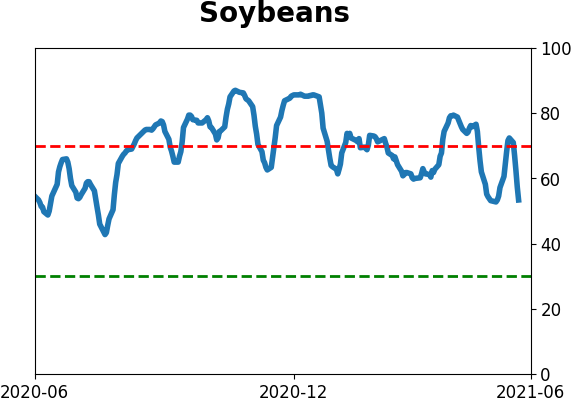
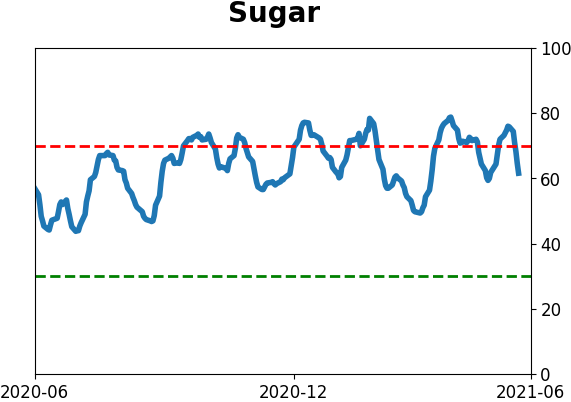
Commodity ETF's - 5-Day Moving Average
|
|