Headlines
|
|
Broad display of medium-term uptrends during long-term downtrends:
All (or almost all) industries, sectors, and worldwide equity indexes are trading above their 50-day moving averages. But as we saw on Thursday, few have yet managed to hold above their 200-day averages. This happens during the initial kick-off stage of long-term recoveries. In the past, this raised investors' risks short-term but led to long-term positive returns.
Big money managers come back:
A survey of large money managers shows that they are overweight equities for the first time in months. History is limited, so there were only two other times when managers were underweight stocks for months on end, then turned positive. Both led to sustained recoveries as money continued to pour in.
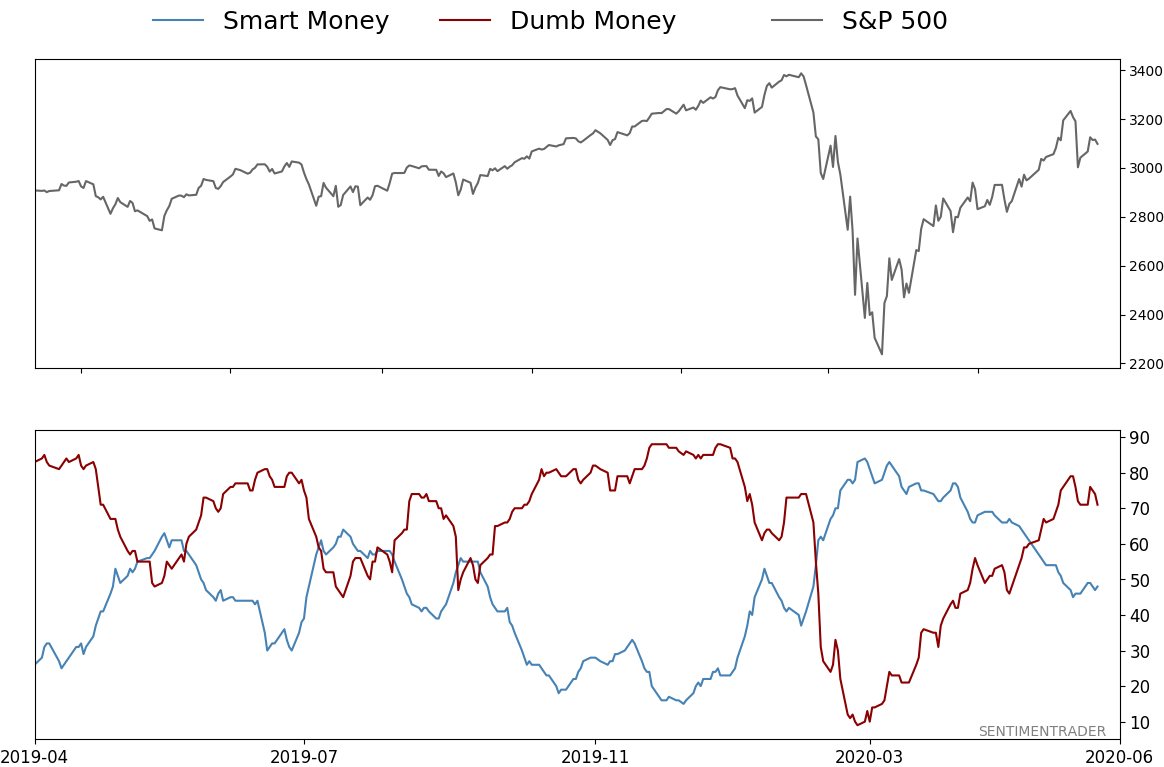
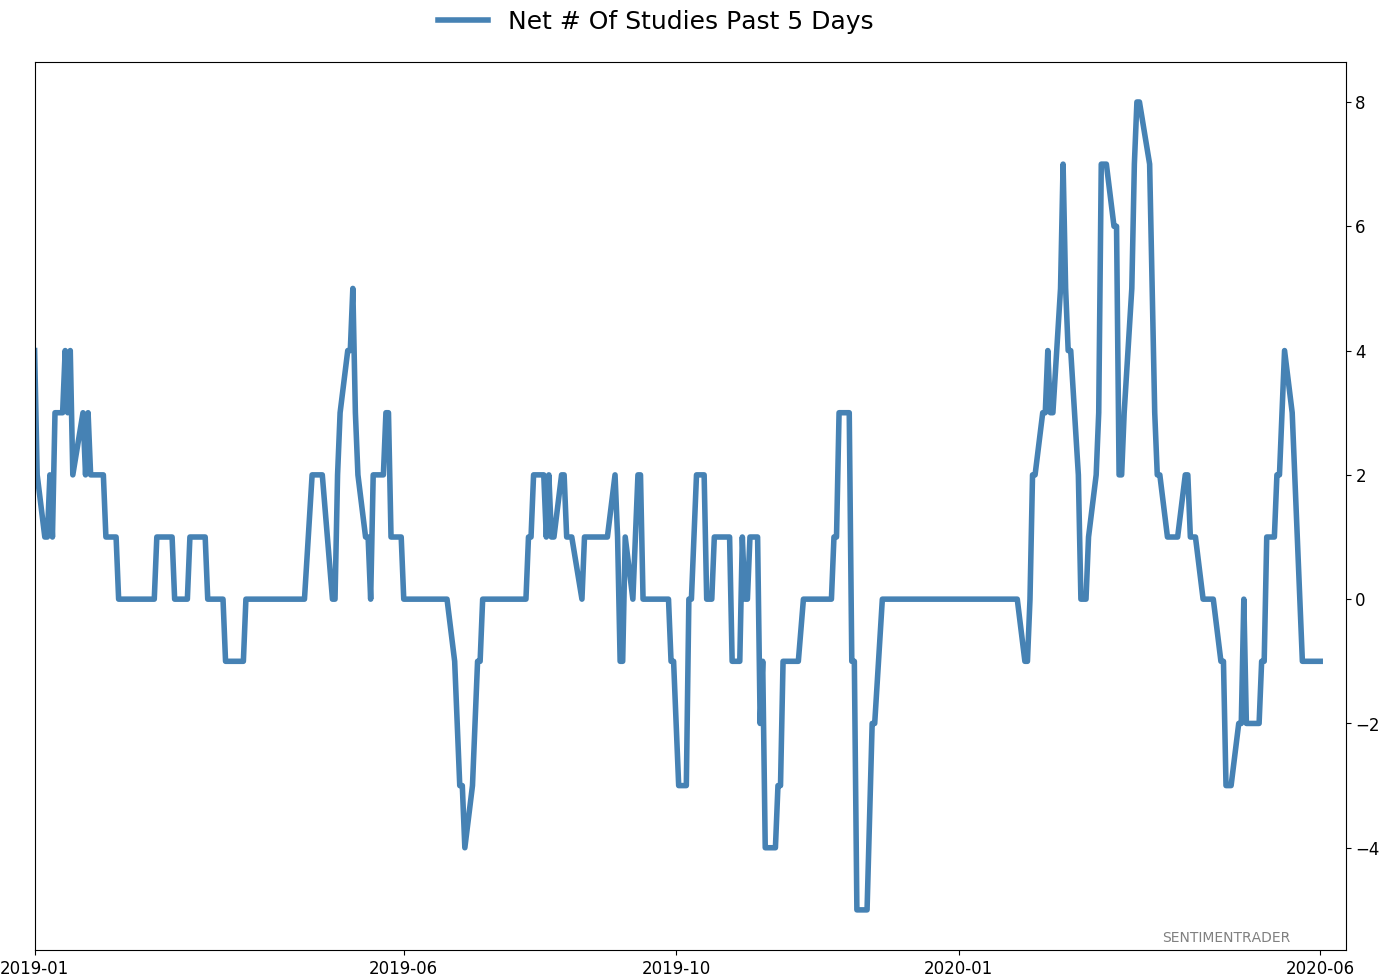
Bottom line: The suggestion is flat/lower prices short- to medium-term, and higher prices long-term. Indicators are currently showing excessive optimism, with Dumb Money Confidence was recently near 80% and has gyrated since then, during what appears to still be an unhealthy market environment, and price reversals on Friday. The Active Studies show that when we look at stocks from various perspectives, there is a heavy positive skew over the medium-term long-term. Recently, there have been troubling signs of reckless speculation, but the breadth thrusts and recoveries have an almost unblemished record at preceding higher prices over a 6-12 month time frame. Indicators and studies for other markets are mixed with no strong conclusion.
The latest Commitments of Traders report was released, covering positions through Tuesday: The 3-Year Min/Max Screen didn't show any new extremes of note. "Smart money" hedgers remain net long nearly $40 billion of major equity index futures, which is still the same odd behavior we've seen for weeks. Over the past 10 years, this has been very bullish for stocks, but they would normally be selling into a rally like this, and any change in behavior raises the possibility that something else is happening. Hedgers went net long the U.S. dollar for the first time since early 2018, thanks mainly to ramping up their shorts against the euro. The Backtest Engine shows that over the past decade, hedgers being net long the dollar has been a mixed blessing, though over the next year it averaged a gain of 5.2%. Gold showed muted returns when hedgers were long the dollar.
|
Smart / Dumb Money Confidence
|
Smart Money Confidence: 48%
Dumb Money Confidence: 71%
|
|
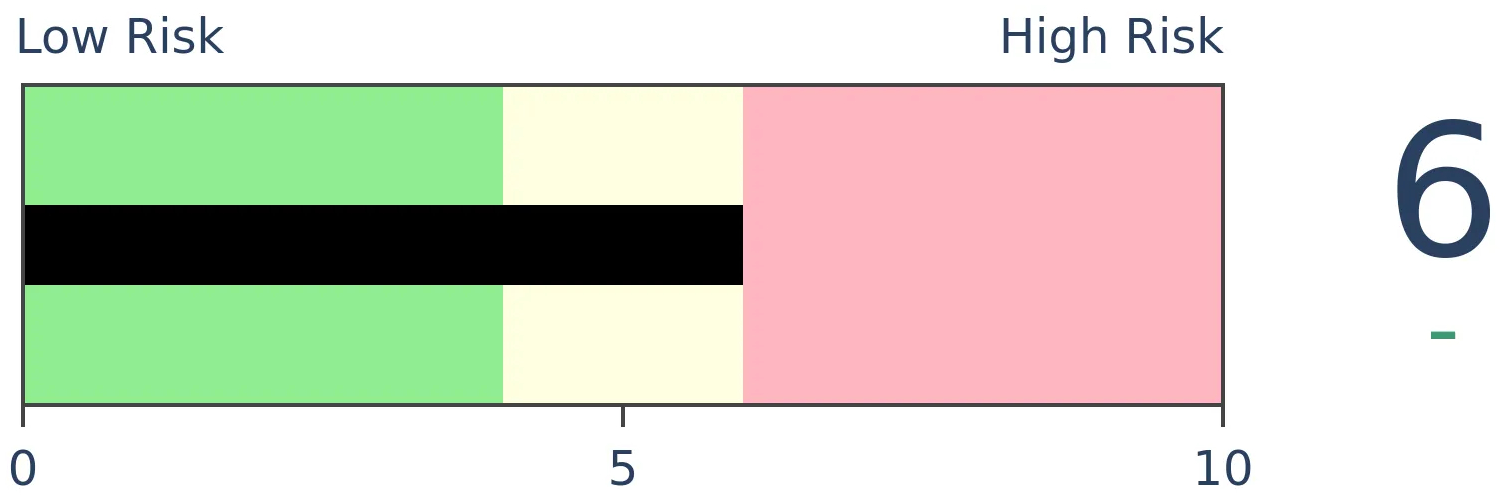
Risk Levels
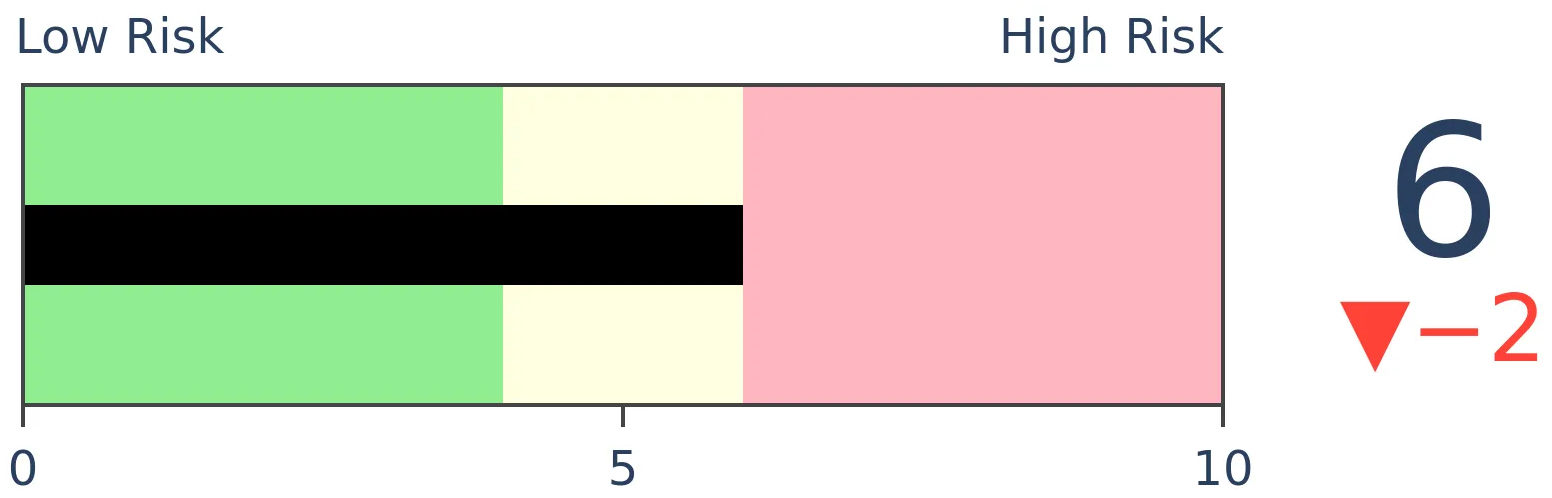
Stocks Short-Term

|
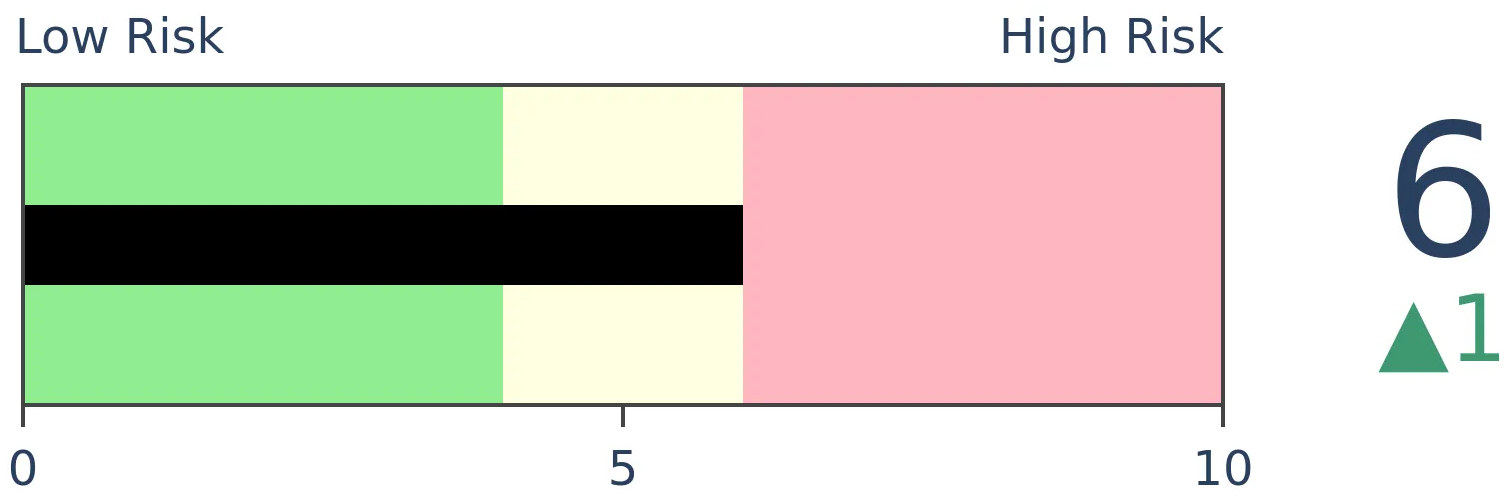
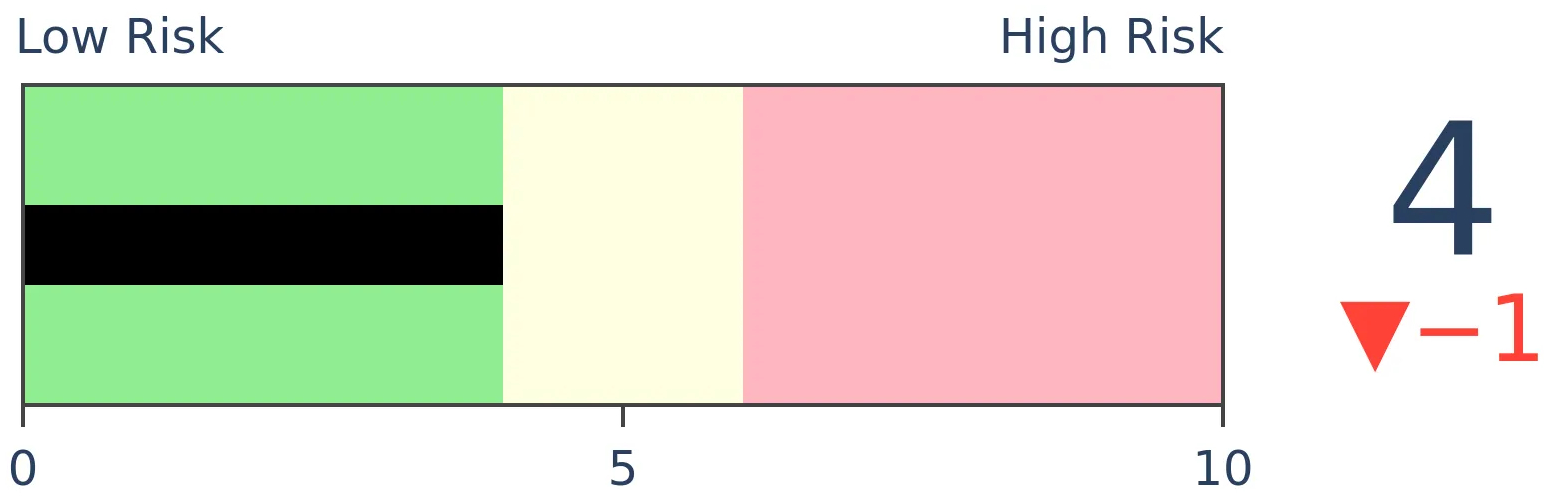
Stocks Medium-Term
|
|
Bonds
|
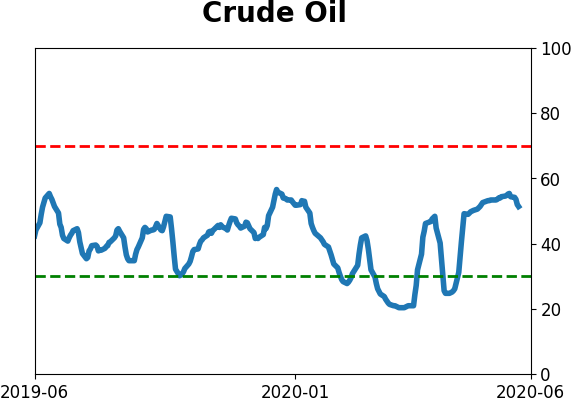
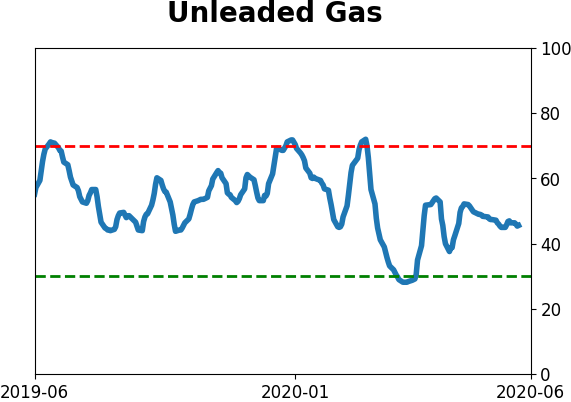
Crude Oil
|
|
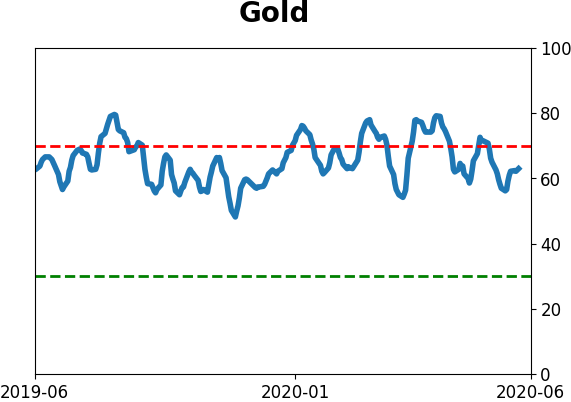
Gold

|
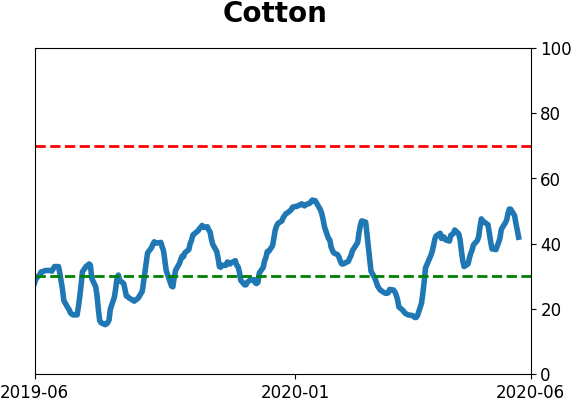
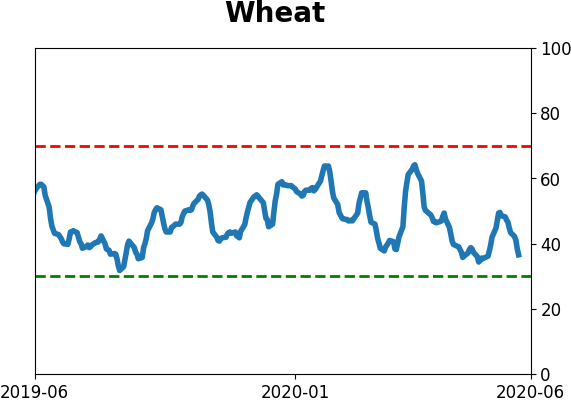
Agriculture
|
|
Research
BOTTOM LINE
All (or almost all) industries, sectors, and worldwide equity indexes are trading above their 50-day moving averages. But as we saw on Thursday, few have yet managed to hold above their 200-day averages. This happens during the initial kick-off stage of long-term recoveries. In the past, this raised investors' risks short-term but led to long-term positive returns.
FORECAST / TIMEFRAME
None
|
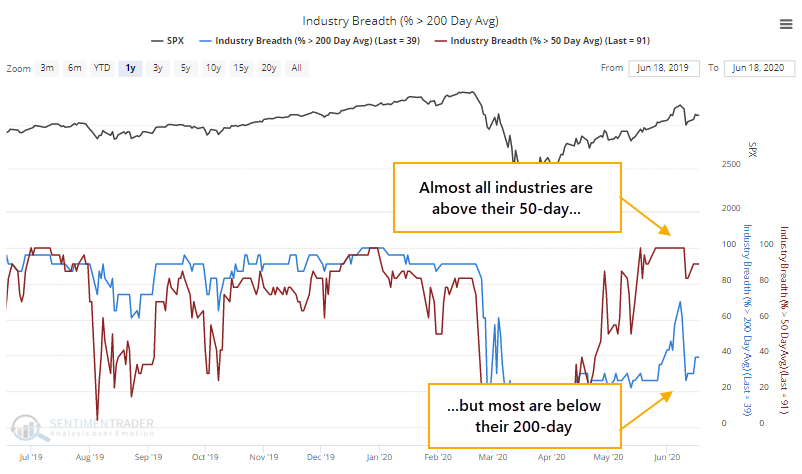
As we monitor the rally for health and watch how many stocks, industries, sectors, and countries are able to hold their trends, we're seeing an unusual battle between time frames.
For about half of the trading days over the past month, almost all industry indexes have managed to hold above their 50-day moving averages, but not even half of them have held above their 200-day averages.
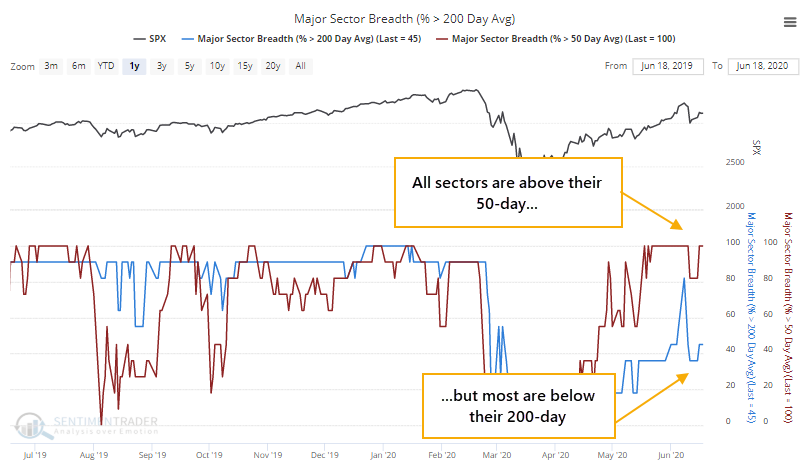
Same goes for the major sectors. Because there are fewer of them, it's even more extreme. All sectors have consistently held above their 50-day, while less than half of them have managed to hold their 200-day.
We're seeing almost the exact same thing among major world equity indexes, with all of them above their 50-day but few above their 200-day.
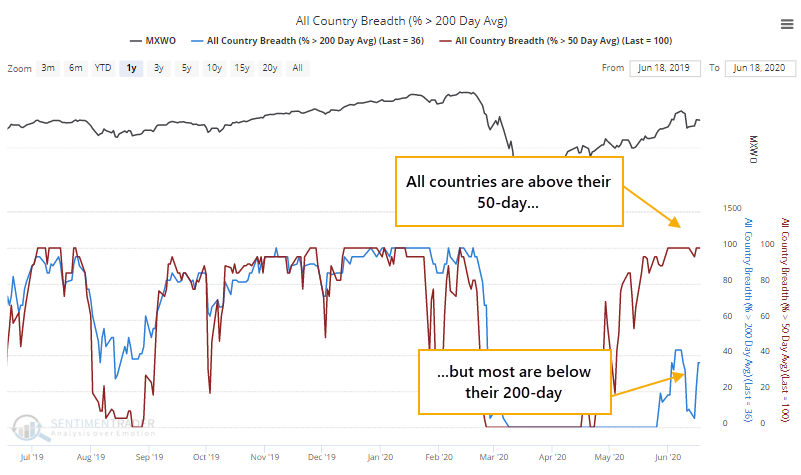
When we see breadth thrusts, like an overwhelming majority of stocks and indexes trading above their 50-day averages, it has consistently signaled intense buying interest that tends to continue. But when we see fewer than 60% of stocks and indexes holding above their 200-day averages, that has tended to occur during unhealthy markets, like we saw on Thursday.
Going back as far as we can, the table below shows other times when there was this kind of protracted battle between all (or almost all) industries, sectors, or countries trading above their 50-day moving averages while less half of them managed to hold above their 200-day averages. The signals only include dates when this tension triggered for at least 10 out of 20 sessions.
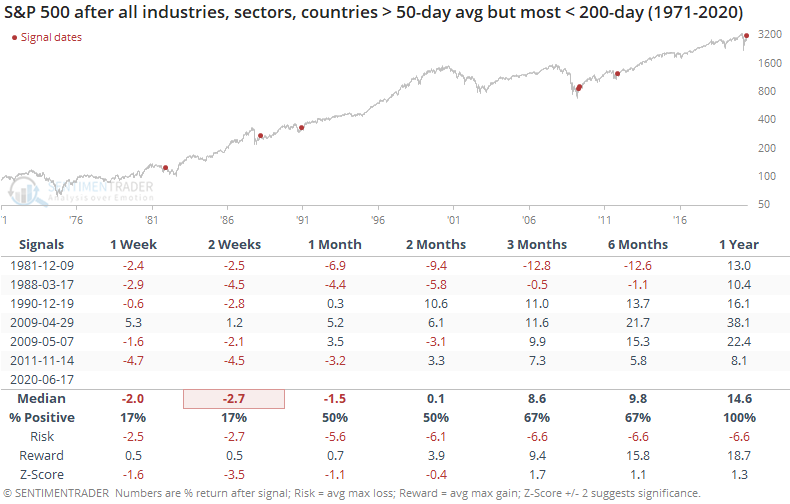
It's no surprise that every one of them triggered during the initial kick-off from deeply oversold conditions. These are times when a market decline was protracted and deep enough to push almost all equities into downtrends, then there was a medium-term burst of optimism and buying pressure.
By the time it reached this level, stocks were tired. The S&P managed to add to its gains only once over the next couple of weeks. The decline persisted in 1981, but that was really the only false signal. The rest were good indications that the bulk of the decline was over, and markets were on the path to recovery.
Like most of the other developments we've seen in recent weeks, this suggests shorter-term risk, but longer-term reward.
BOTTOM LINE
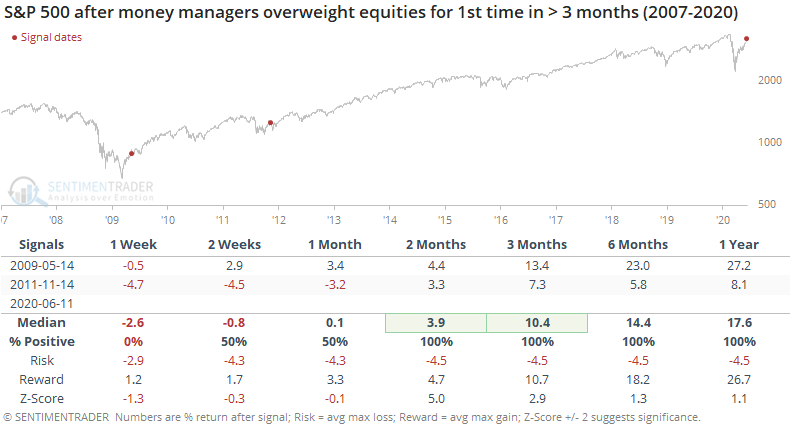
A survey of large money managers shows that they are overweight equities for the first time in months. History is limited, so there were only two other times when managers were underweight stocks for months on end, then turned positive. Both led to sustained recoveries as money continued to pour in.
FORECAST / TIMEFRAME
None
|
On Wednesday, we saw that institutional investors were pulling money out of cash, the start of a potential reversal in a historic rush into money markets.
According to the latest Bank of America poll of large money managers, some of that cash is likely finding its way into stocks. For the first time in months, managers are net overweight equities.
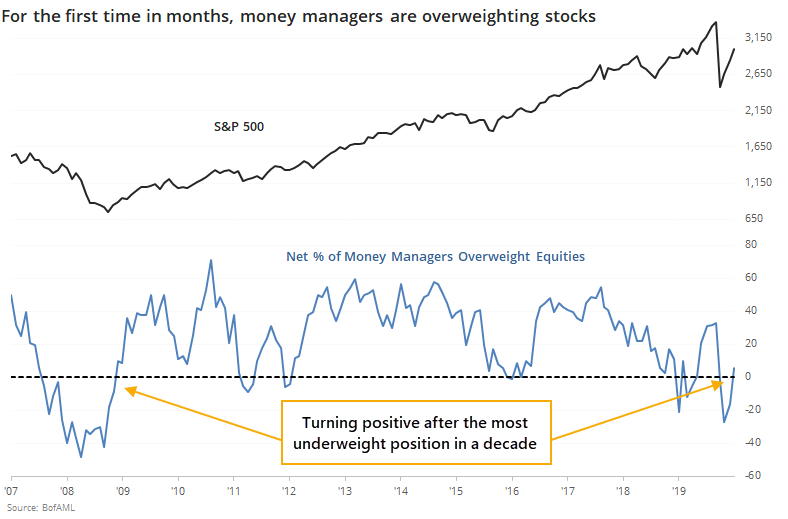
Surprisingly, the streak of three months of being underweight is tied for the 2nd-longest in 13 years.
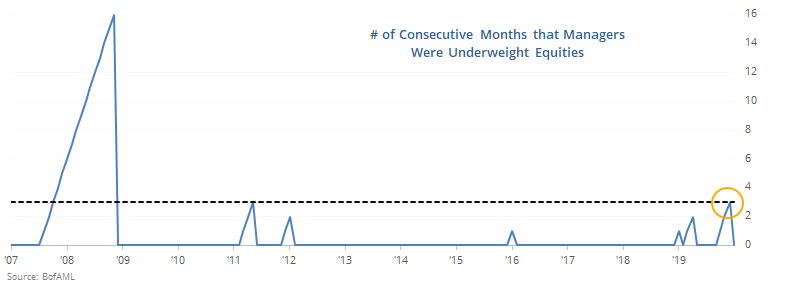
The sample size is ridiculously small, but the other two times when managers went overweight for the first time in 3 or more months, they were the beginnings of longer-term recoveries.
When managers returned to stocks after even two months of being underweight, it was also a good sign.
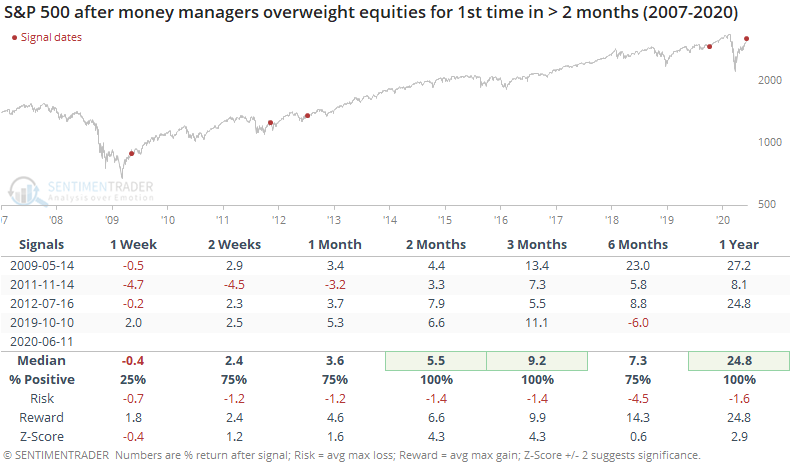
Granted, the study period is dominated by a historic bull market, or multiple bull markets depending on the definition, so results will tend to be skewed to the upside. Even so, the returns following these return-to-optimism signals were well above random. With a small sample size, the z-score requires that results not only be markedly different than random, but consistent, too, and these were, especially over the next 2-3 months.
We're not including it in the Active Studies due to limited history and the small sample, but it's one of those "environmental" indicators that suggest a tailwind. There is quite a battle over that time frame, with signs of speculation and extreme optimism indicating a subdued summer, versus breadth thrusts and recoveries having an almost unblemished record at preceding higher prices, but more consistently over a 6-12 month time frame. This renewed optimism among money managers likely isn't enough to overcome the overhang of speculative activity and potential for a change in the White House.
Active Studies
| Time Frame | Bullish | Bearish | | Short-Term | 0 | 1 | | Medium-Term | 8 | 6 | | Long-Term | 40 | 1 |
|
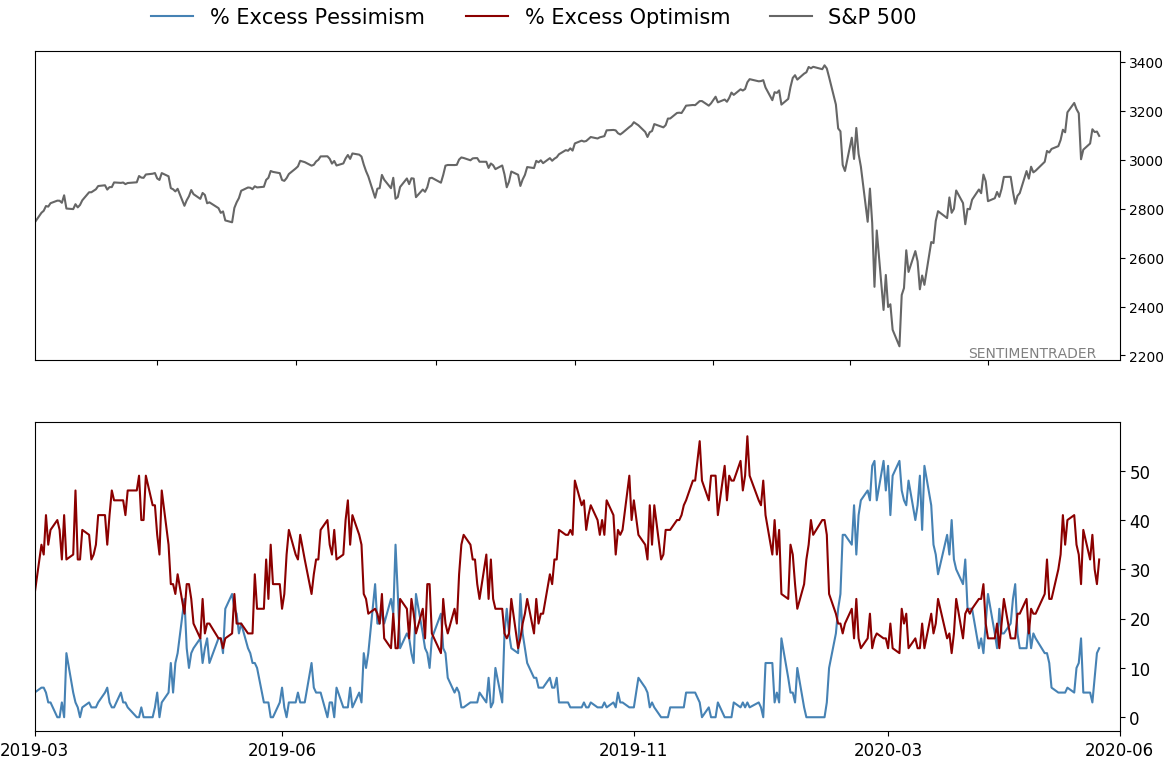
Indicators at Extremes
Portfolio
| Position | Weight % | Added / Reduced | Date | | Stocks | 29.8 | Reduced 9.1% | 2020-06-11 | | Bonds | 0.0 | Reduced 6.7% | 2020-02-28 | | Commodities | 5.2 | Added 2.4%
| 2020-02-28 | | Precious Metals | 0.0 | Reduced 3.6% | 2020-02-28 | | Special Situations | 0.0 | Reduced 31.9% | 2020-03-17 | | Cash | 65.0 | | |
|
Updates (Changes made today are underlined)
In the first months of the year, we saw manic trading activity. From big jumps in specific stocks to historic highs in retail trading activity to record highs in household confidence to almost unbelievable confidence among options traders. All of that came amid a market where the average stock couldn't keep up with their indexes. There were signs of waning momentum in stocks underlying the major averages, which started triggering technical warning signs in late January. After stocks bottomed on the 23rd, they enjoyed a historic buying thrust and retraced a larger amount of the decline than "just a bear market rally" tends to. Those thrusts are the most encouraging sign we've seen in years. Through early June, we were still seeing thrusts that have led to recoveries in longer-term breadth metrics. The longer-term prospects for stocks (6-12 months) still look decent given the above. On a short- to medium-term basis, it was getting harder to make that case. Dumb Money Confidence spiked and there were multiple signs of a historic level of speculation. Given that, I reduced my exposure a bit when stocks gapped down and failed to hold the lows of late last week. This is likely the lowest I will go given what I still consider to be compelling positives over a longer time frame. There is not a slam-dunk case to be made for either direction, so it will seem like a mistake whether stocks keep dropping (why didn't I sell more?) or if they turn and head higher (why did I let short-term concerns prevail?). After nearly three decades of trading, I've learned to let go of the idea of perfection.
RETURN YTD: -6.4% 2019: 12.6%, 2018: 0.6%, 2017: 3.8%, 2016: 17.1%, 2015: 9.2%, 2014: 14.5%, 2013: 2.2%, 2012: 10.8%, 2011: 16.5%, 2010: 15.3%, 2009: 23.9%, 2008: 16.2%, 2007: 7.8%
|
|
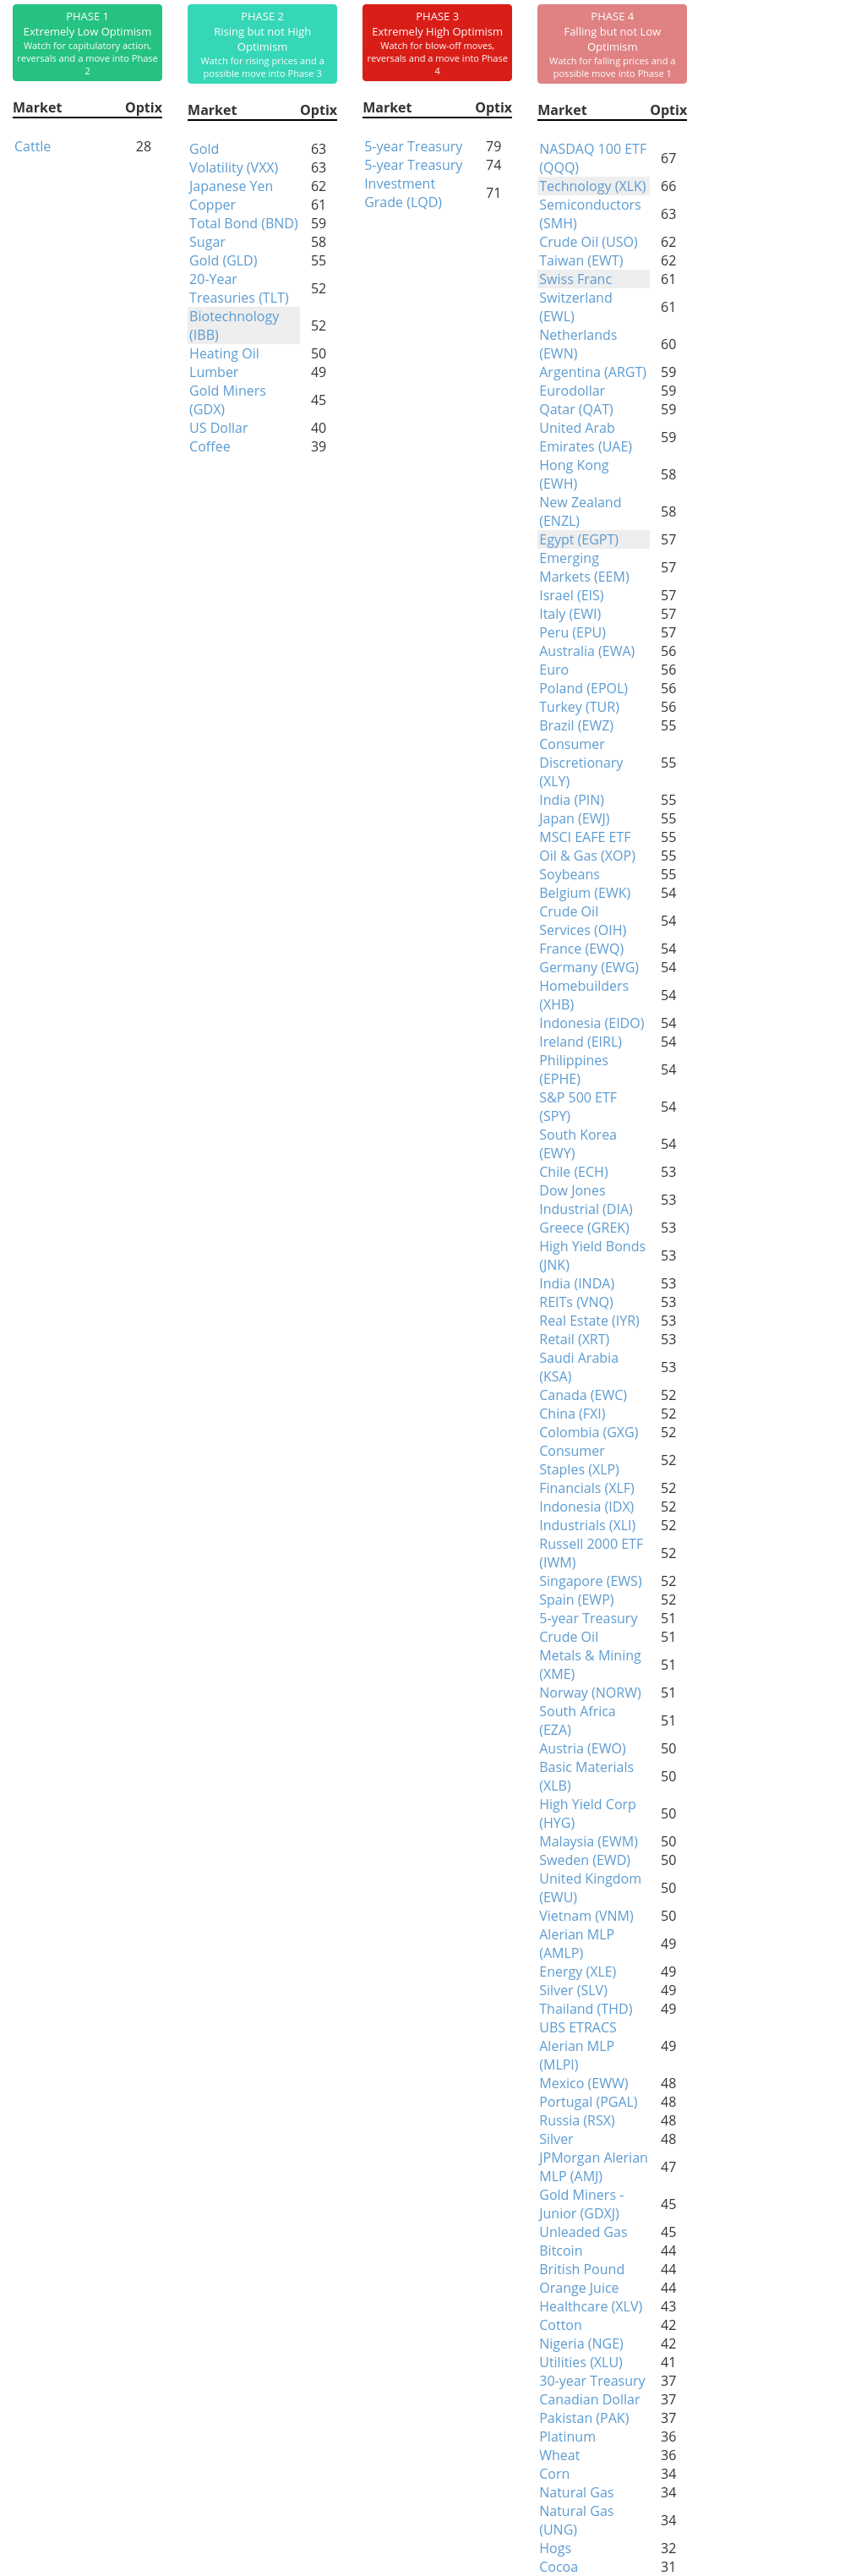
Phase Table
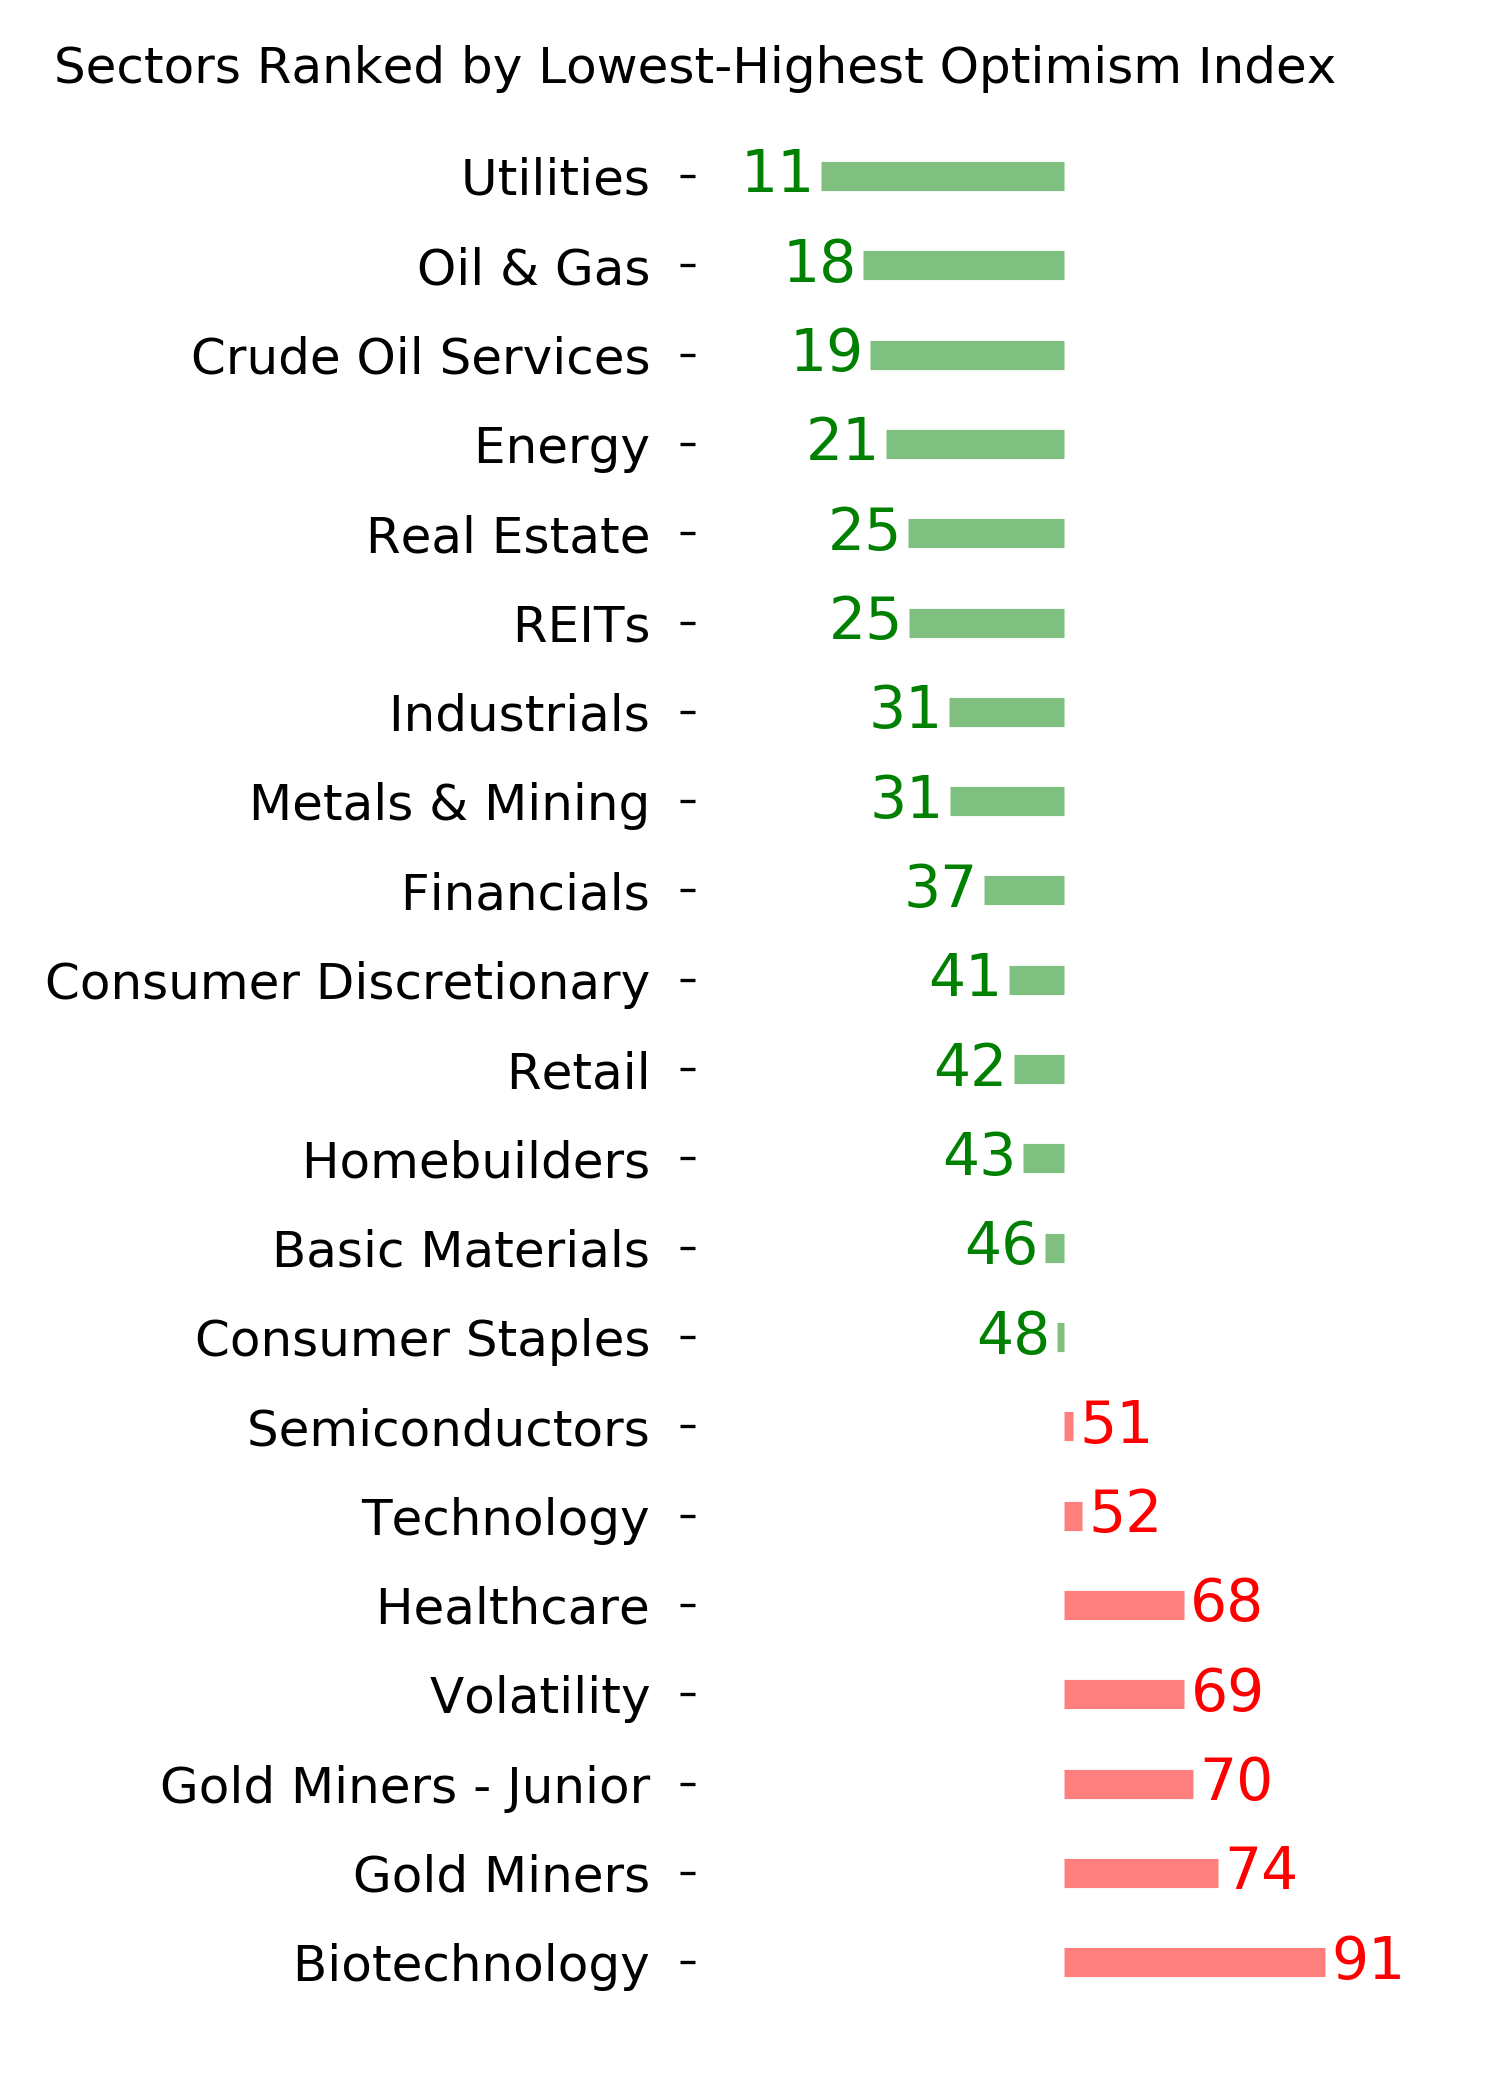
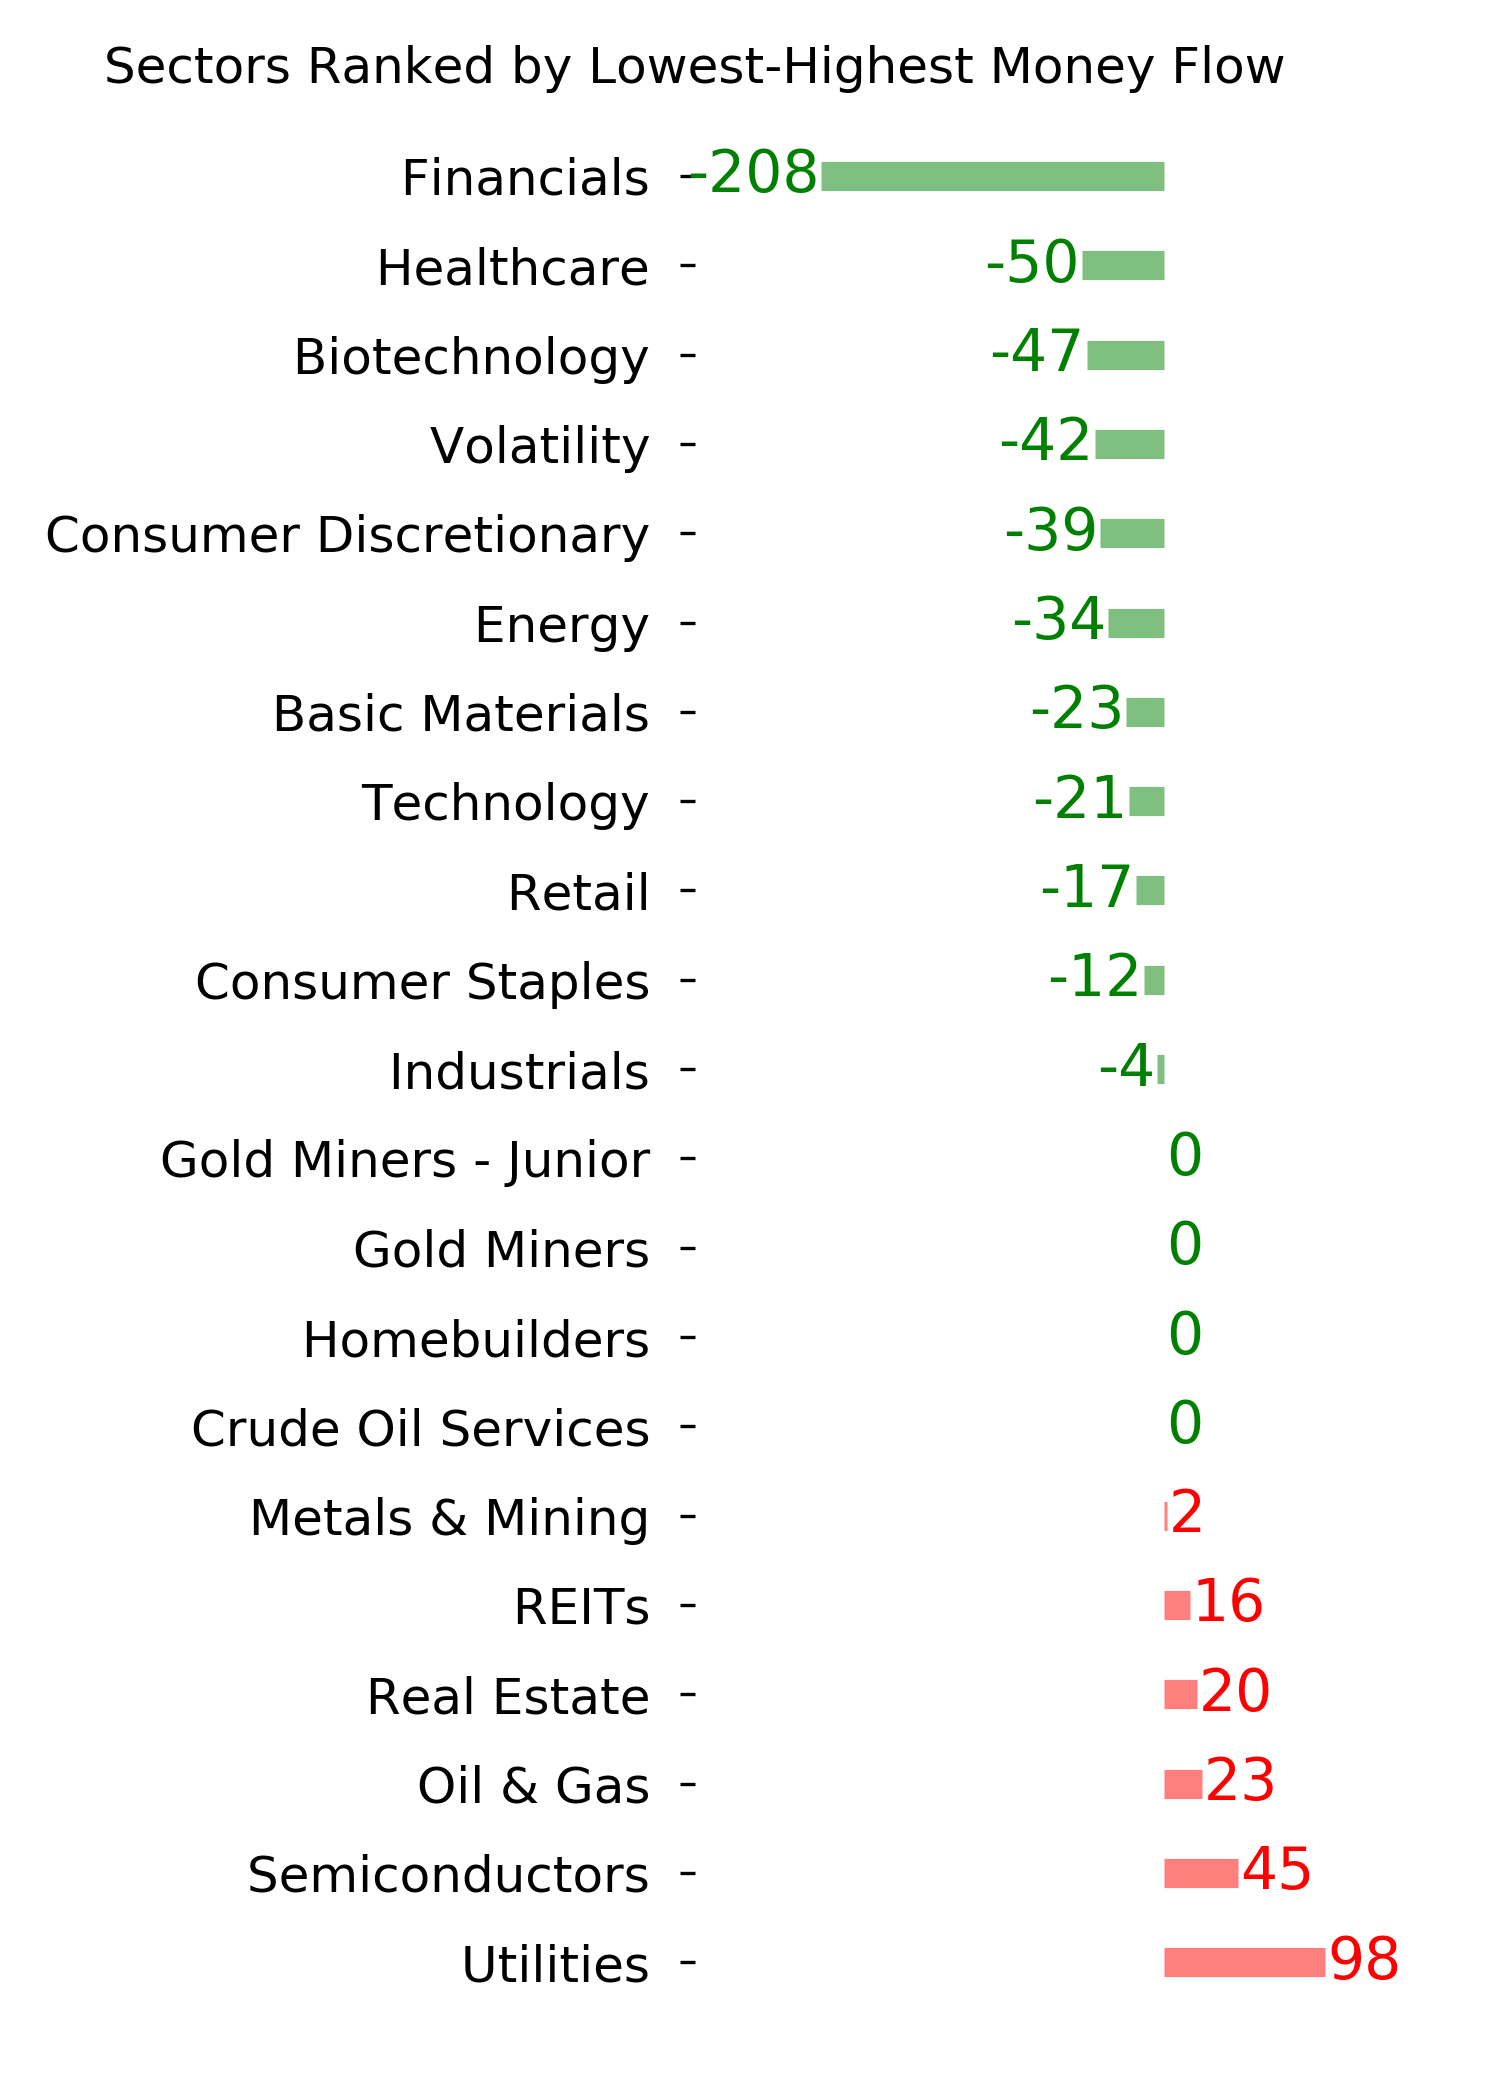
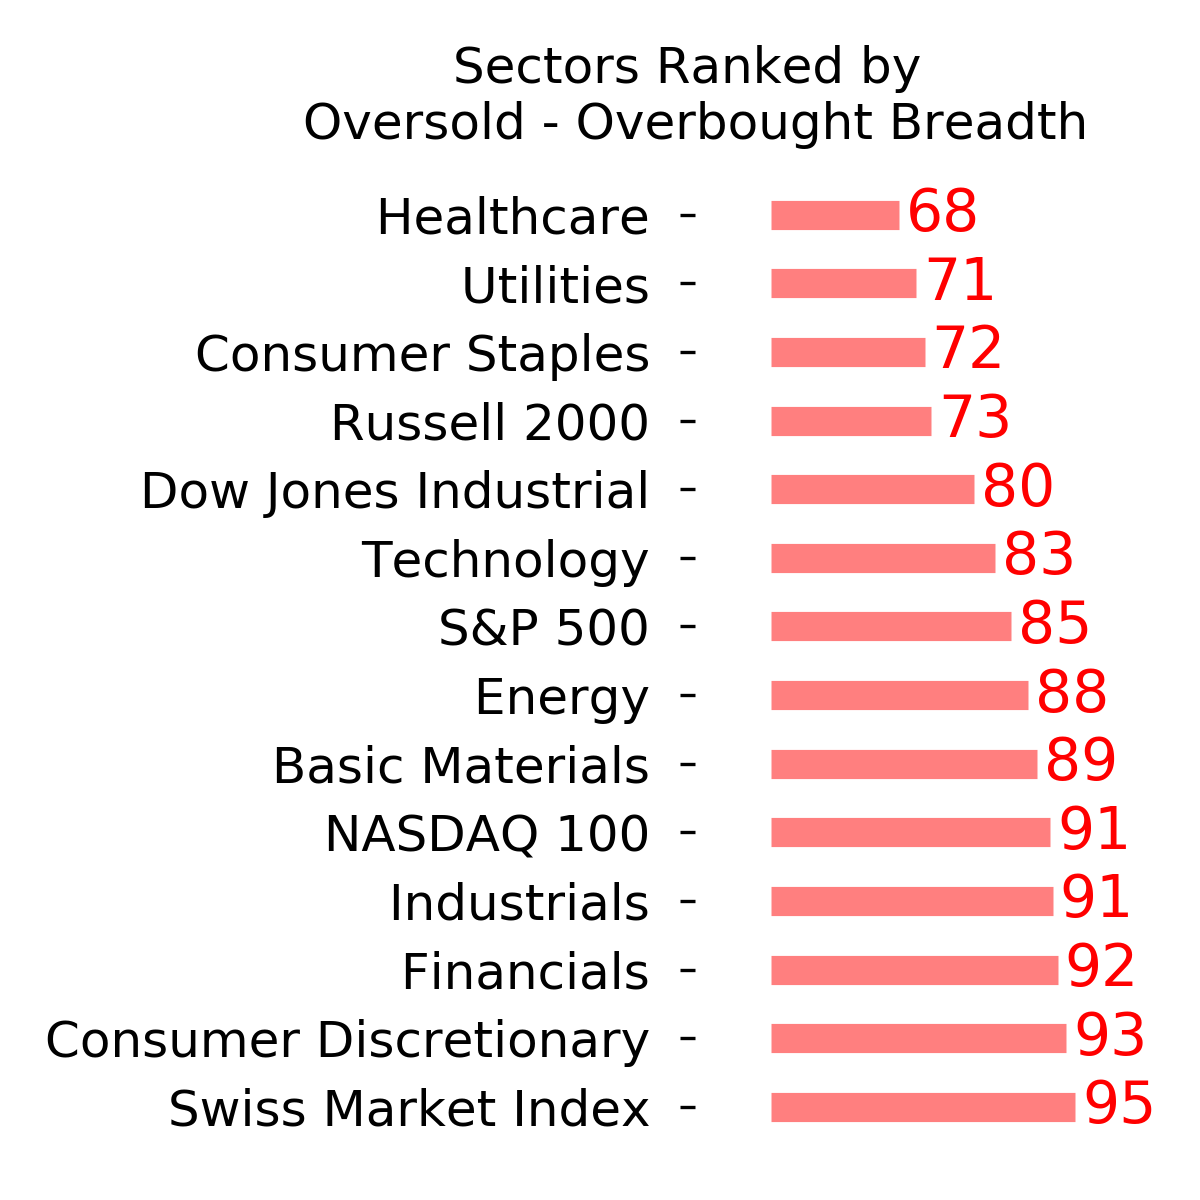
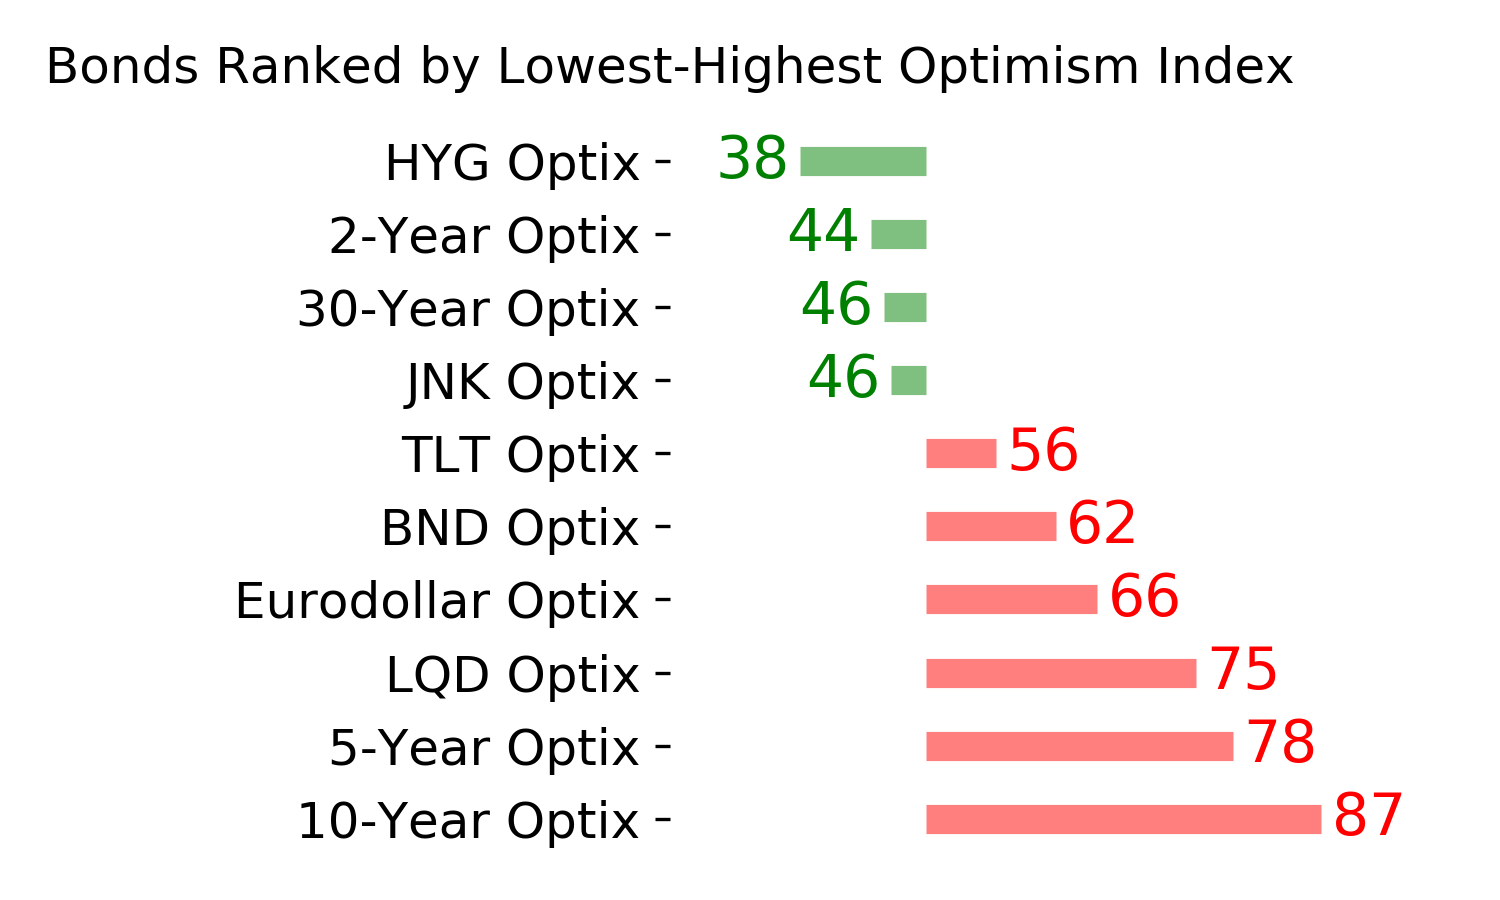
Ranks
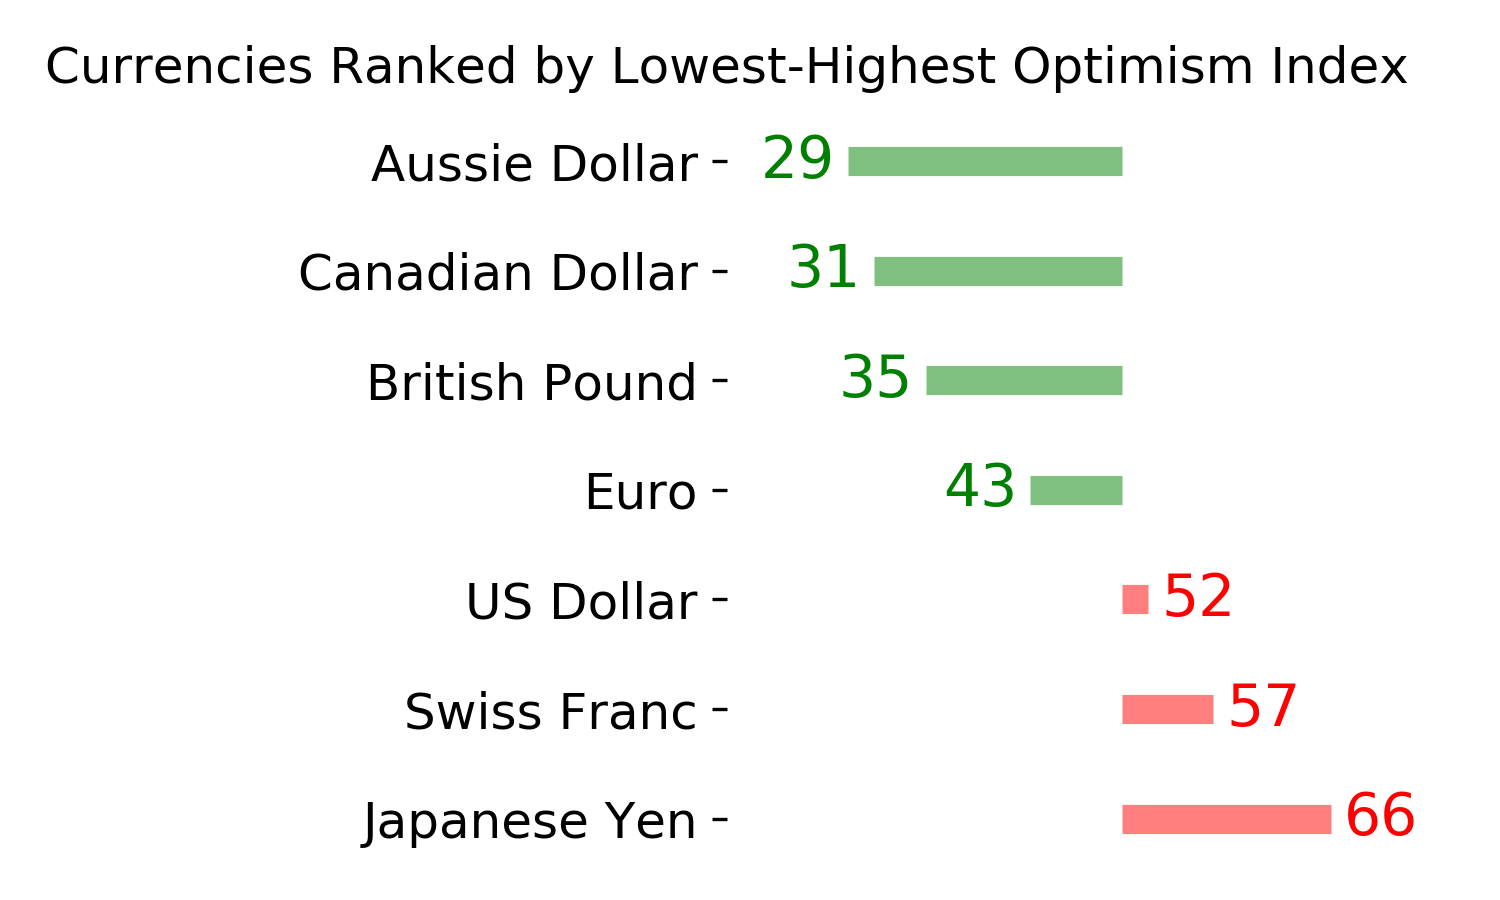
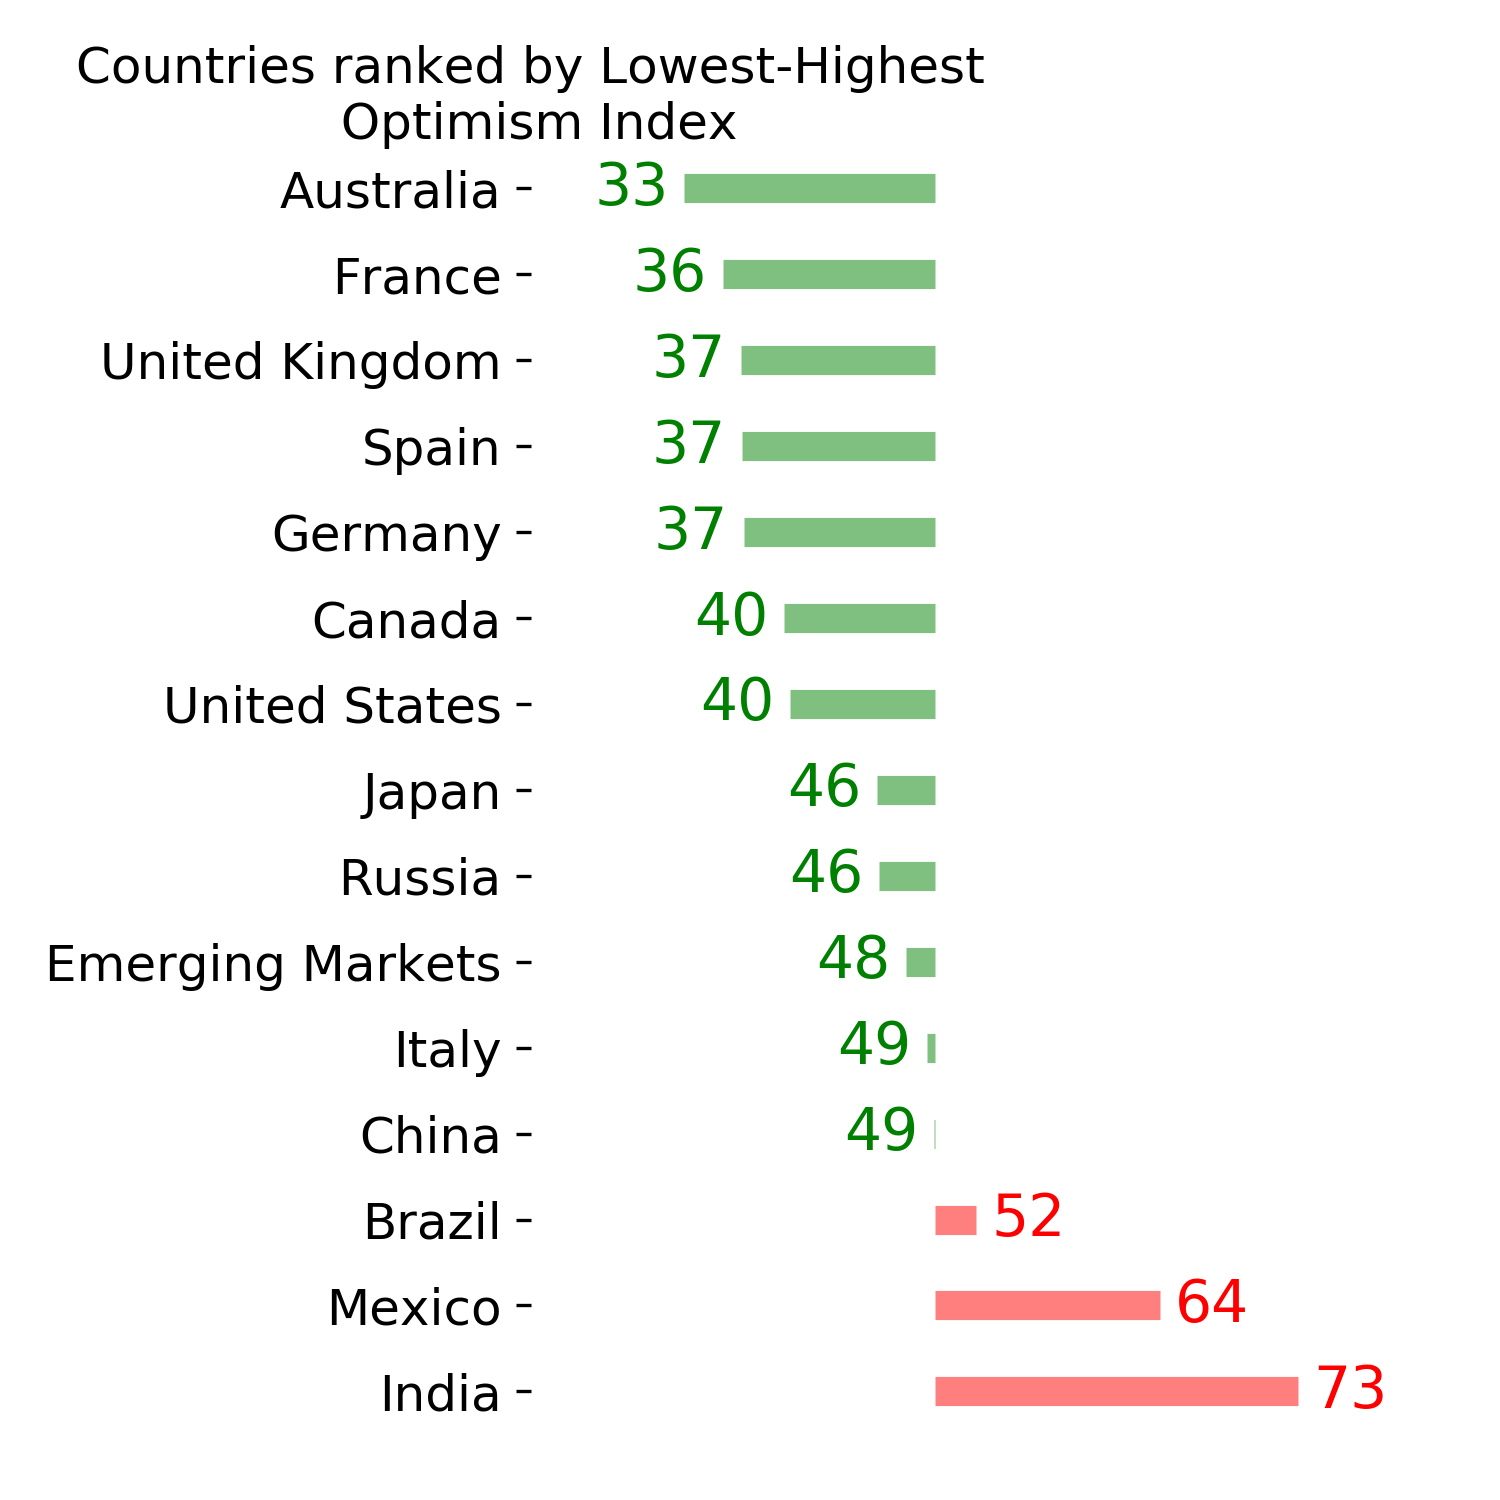
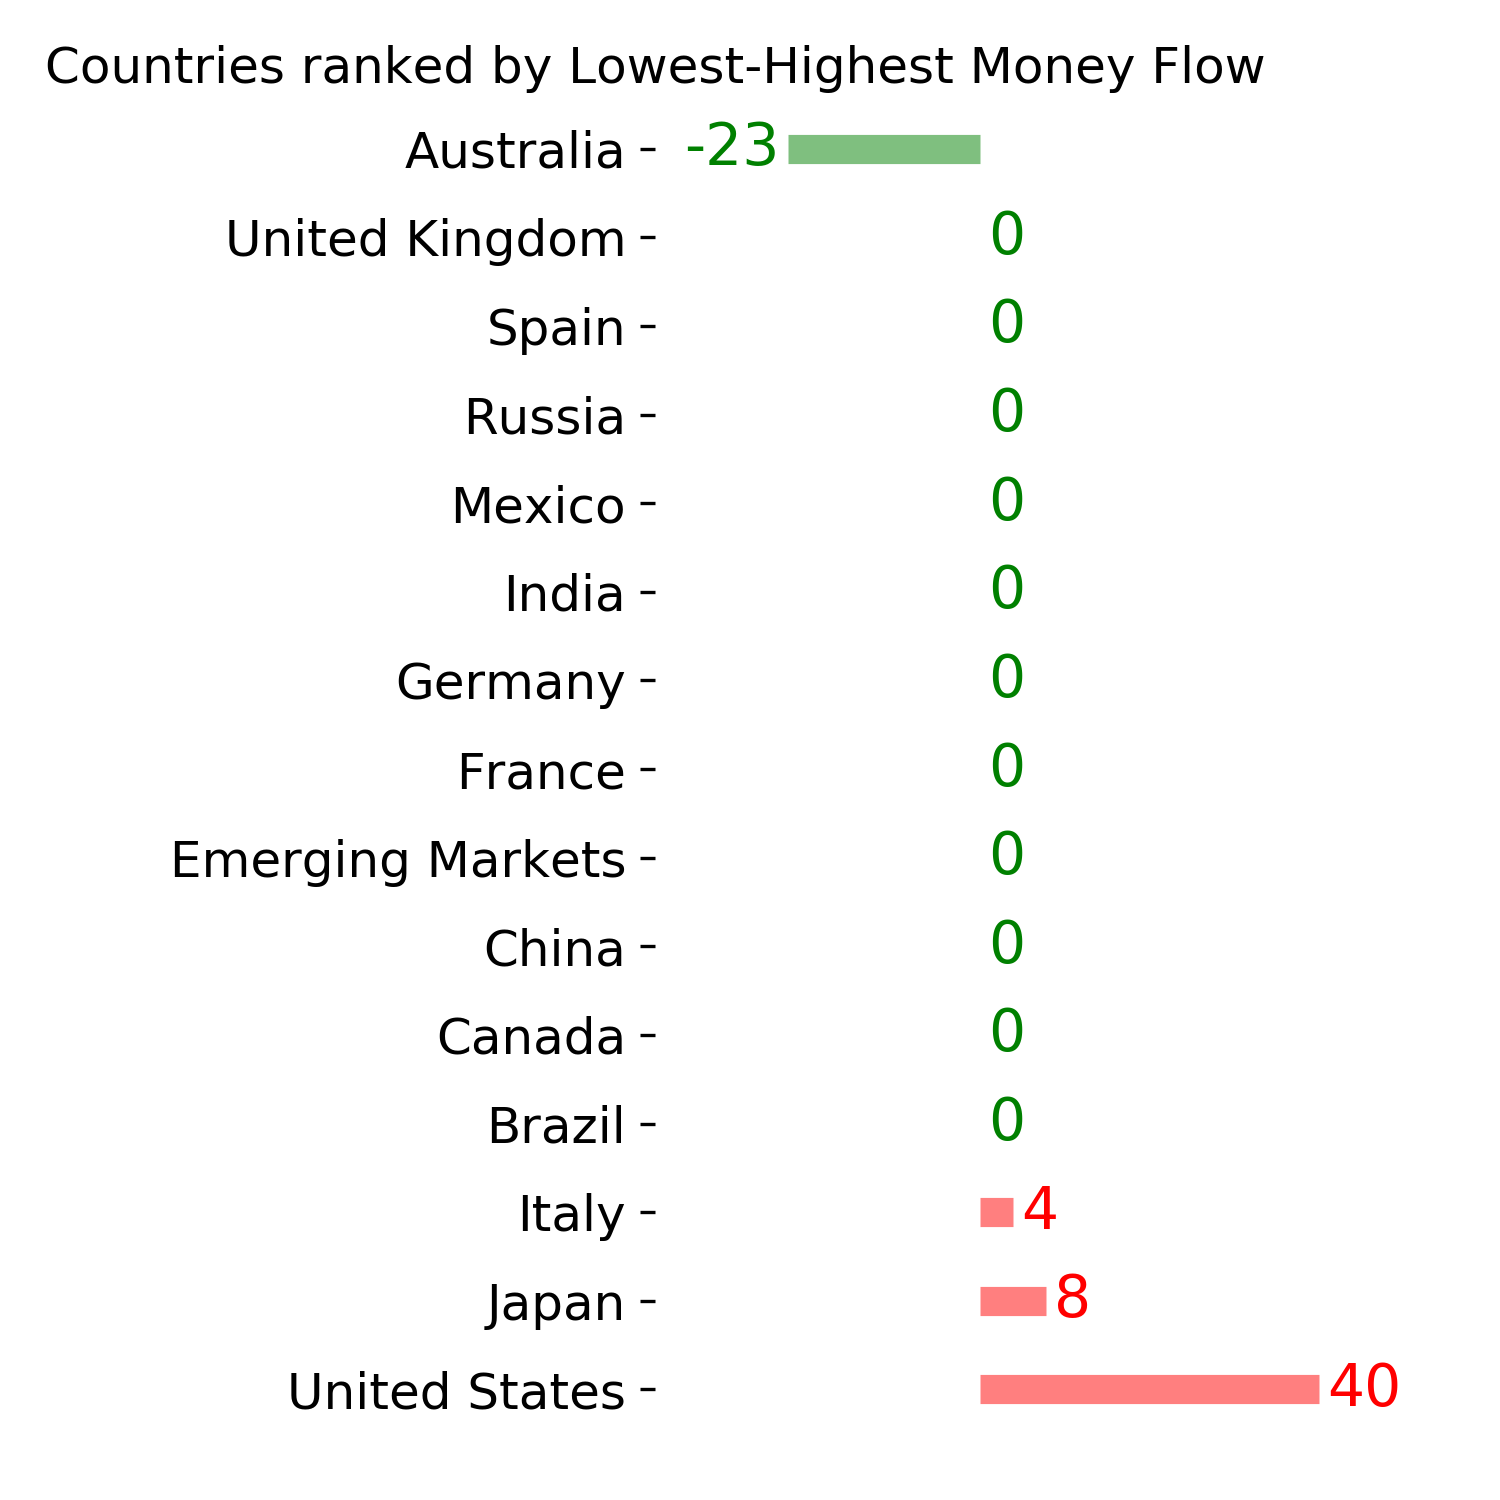
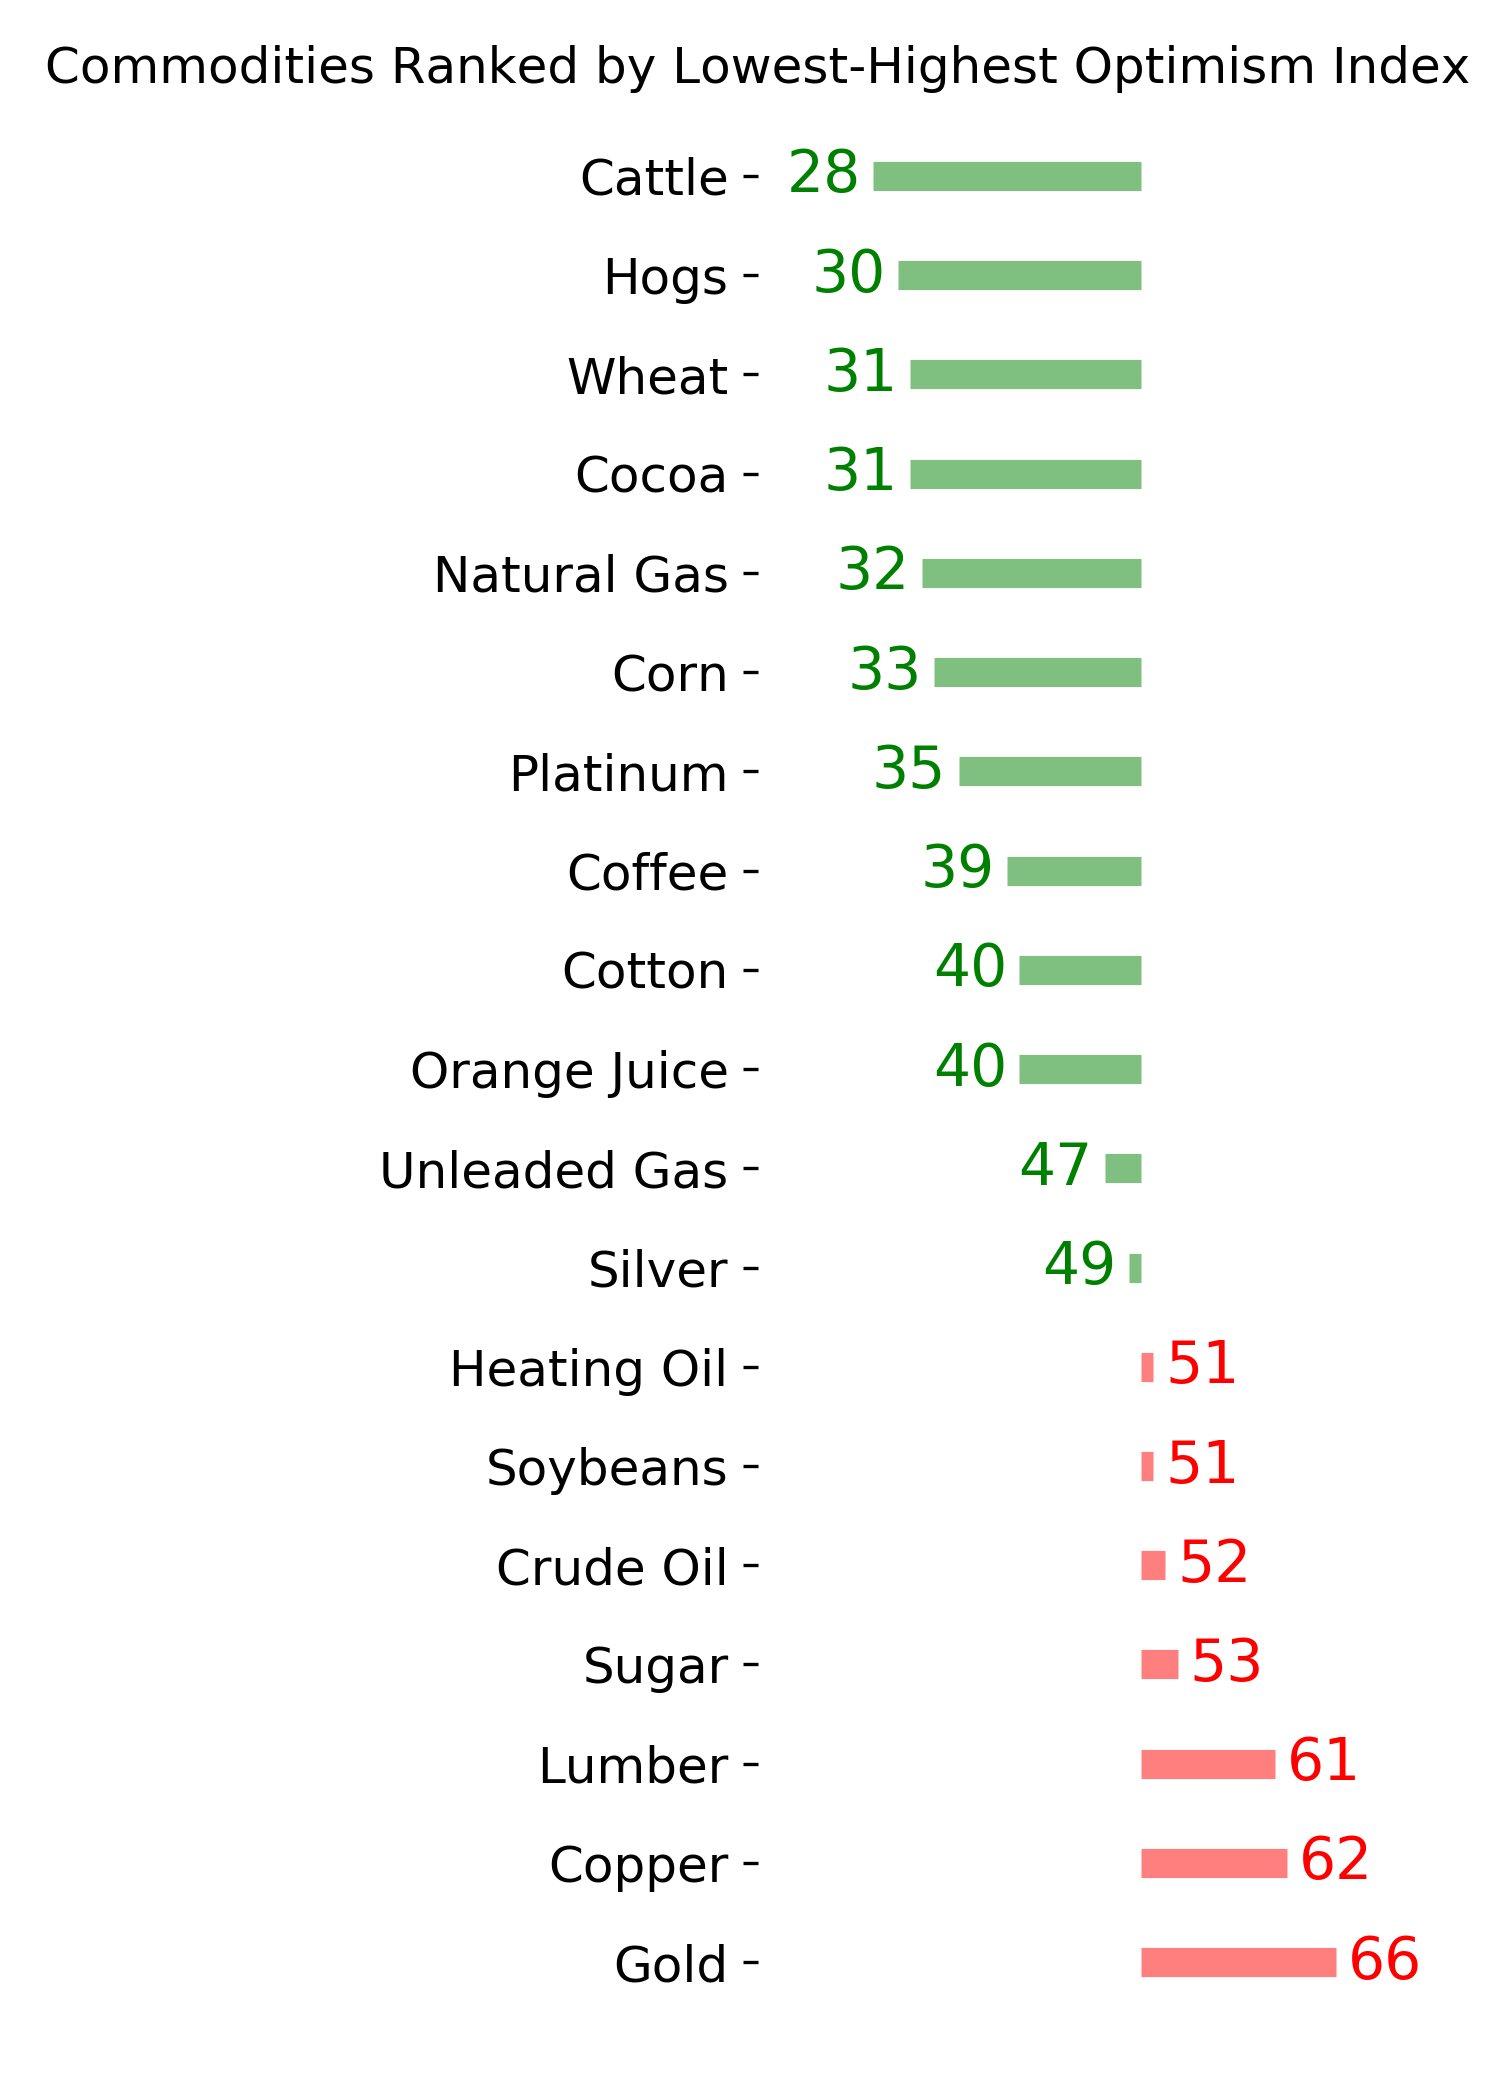
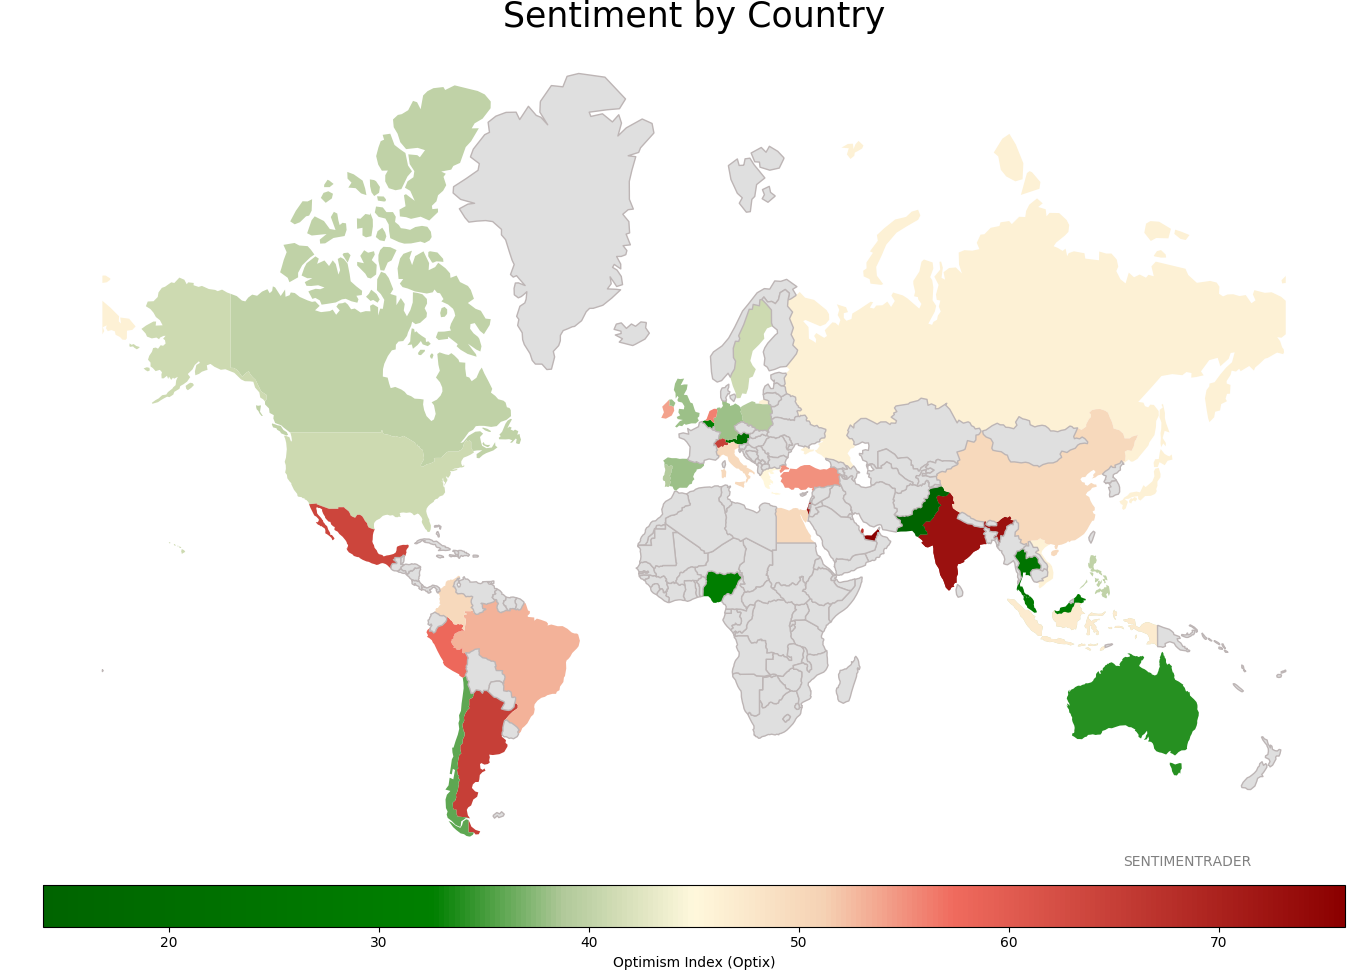
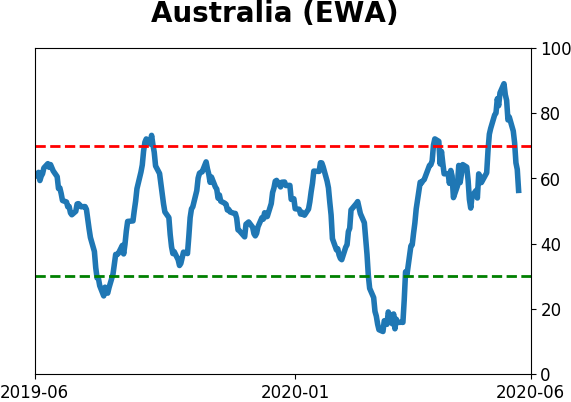
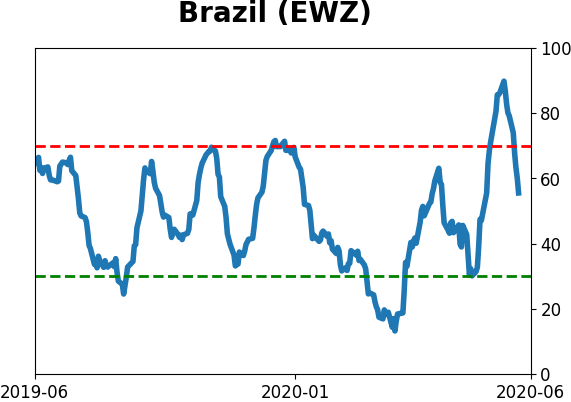
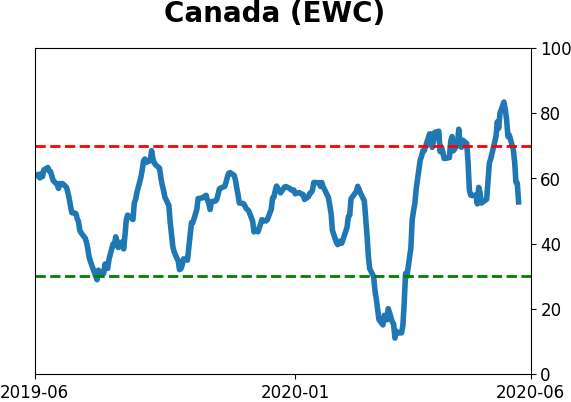
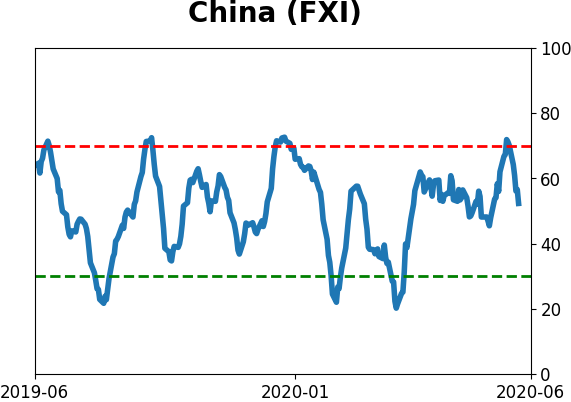
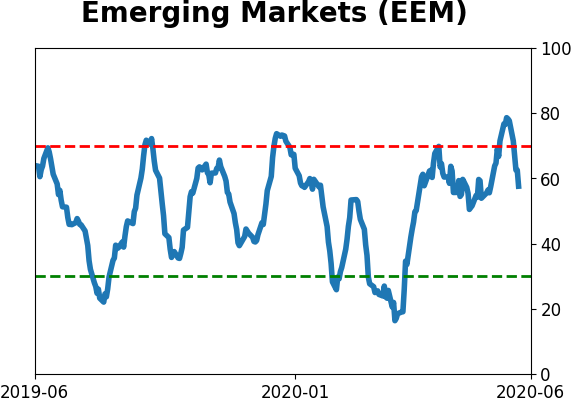
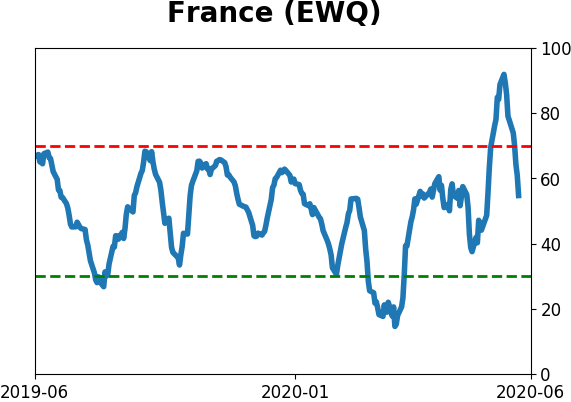
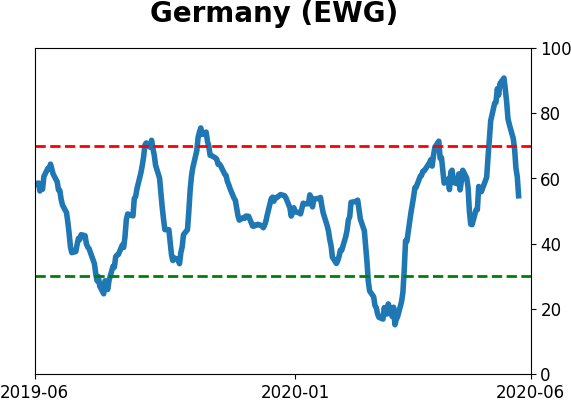
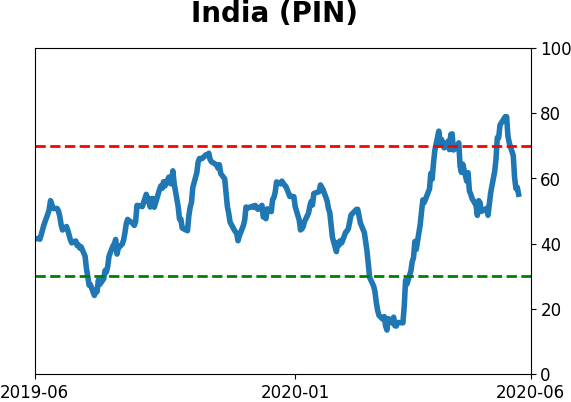
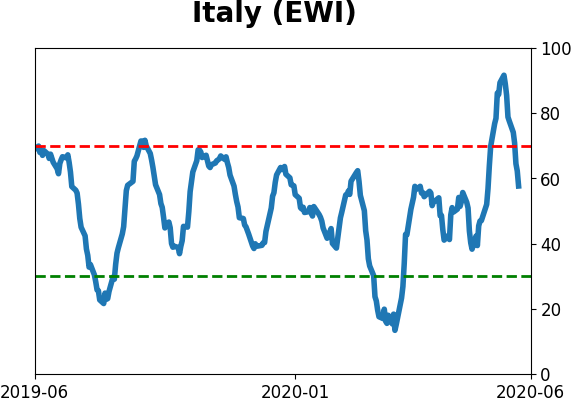
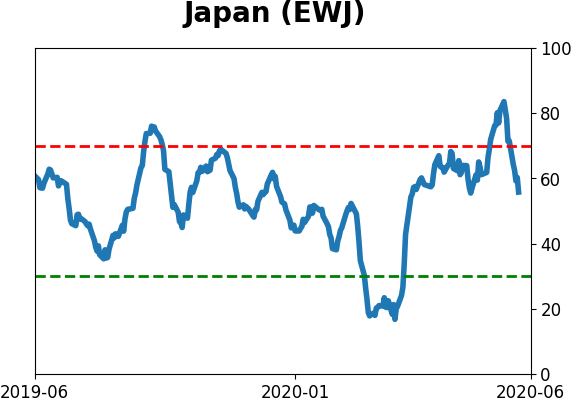
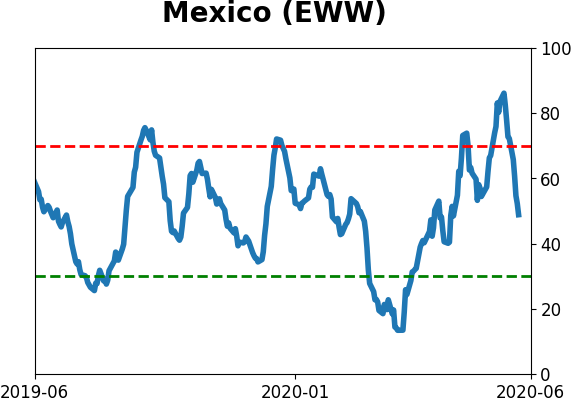
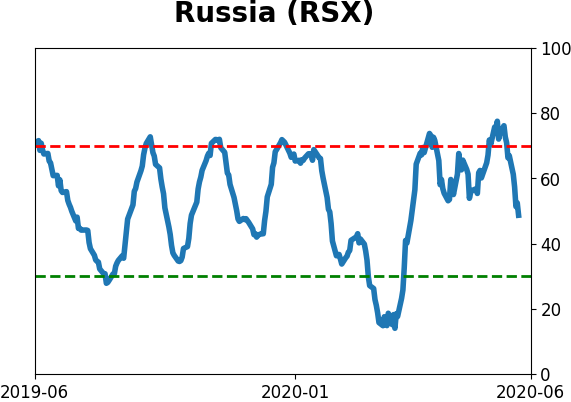
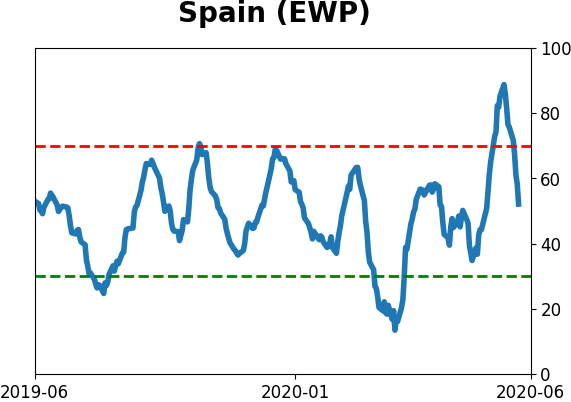
Sentiment Around The World
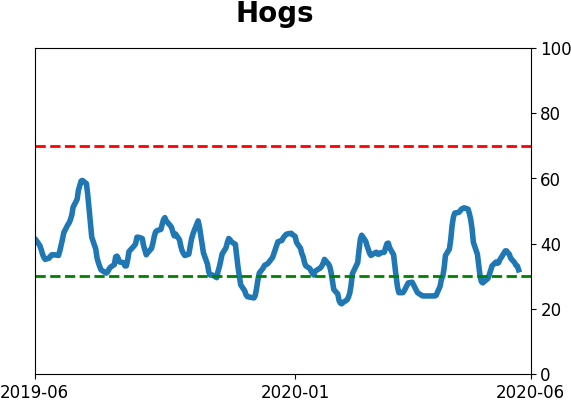
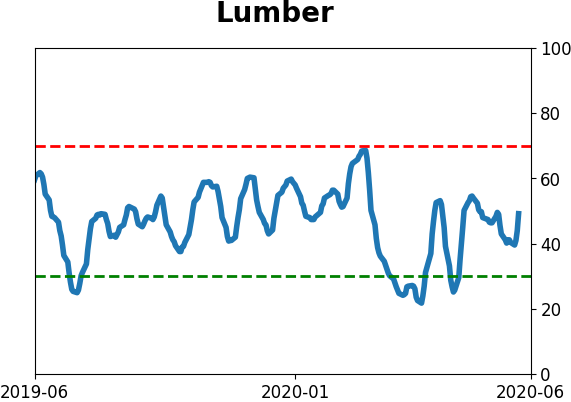
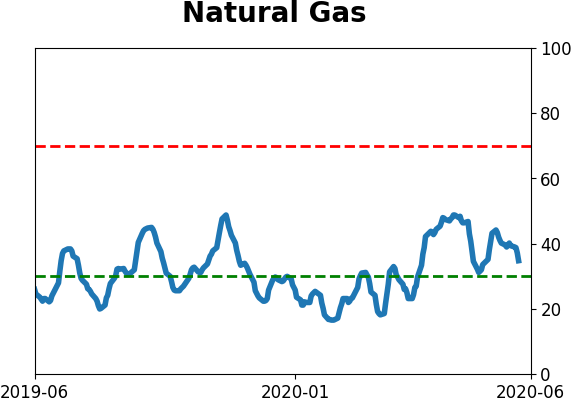
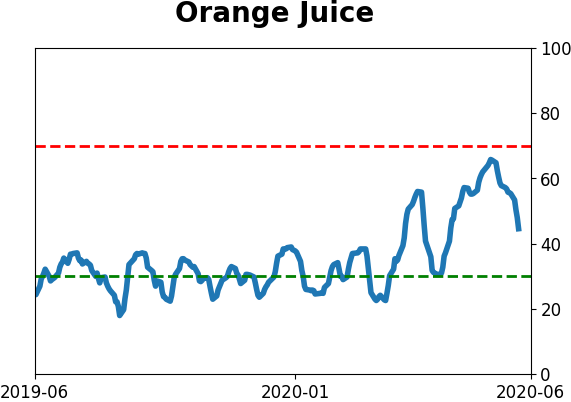
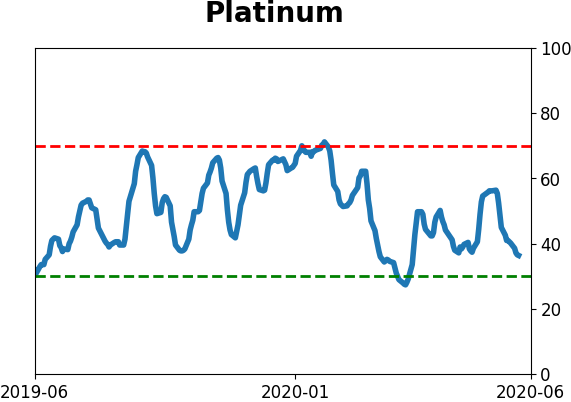
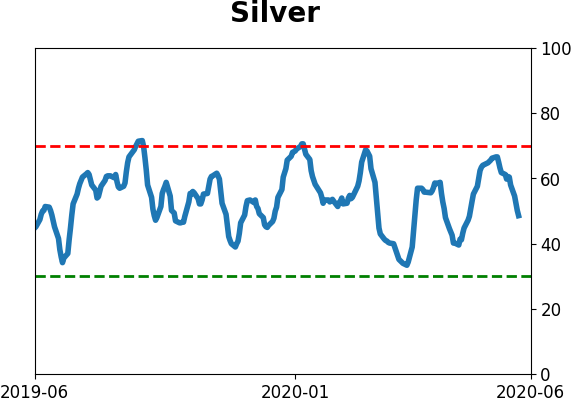
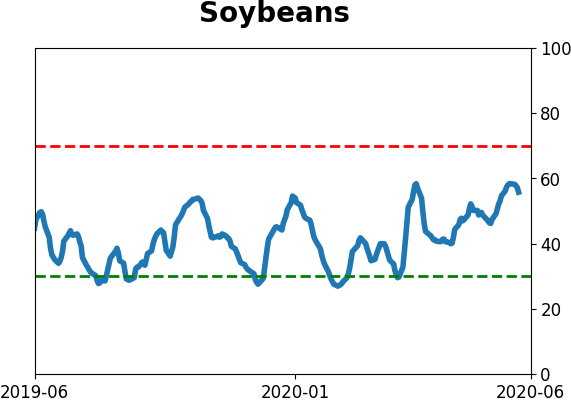
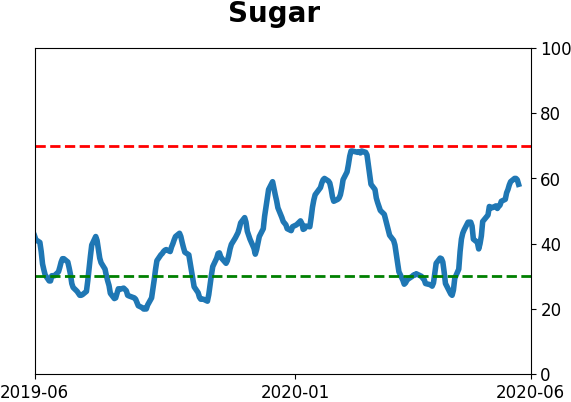
Optimism Index Thumbnails
|
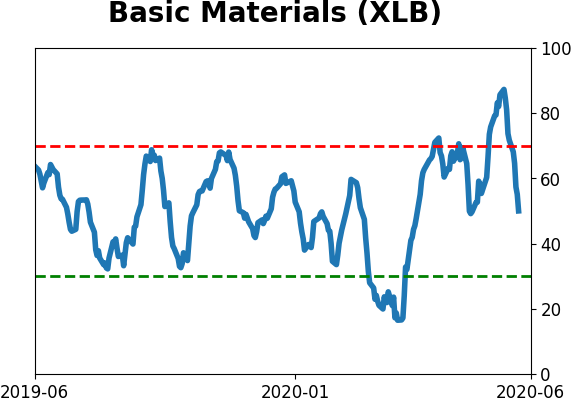
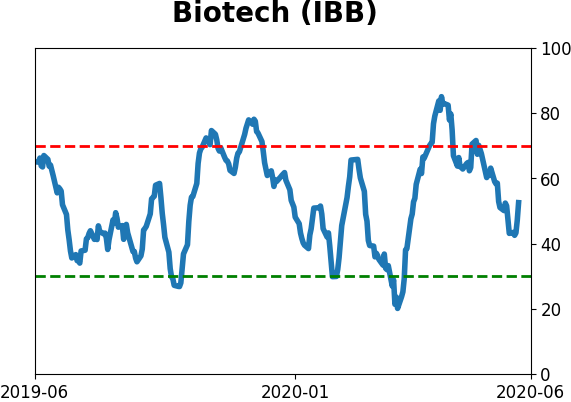
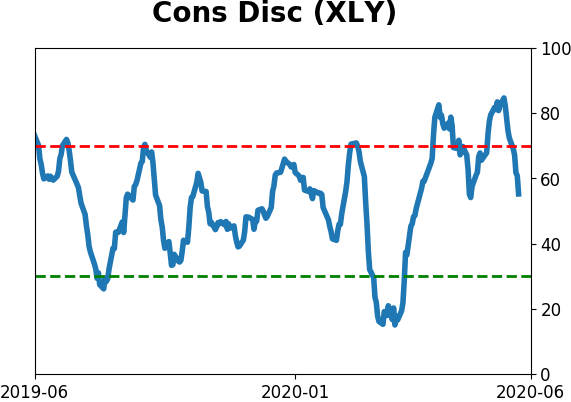
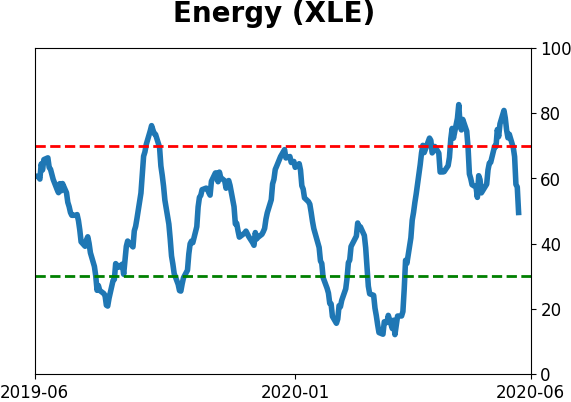
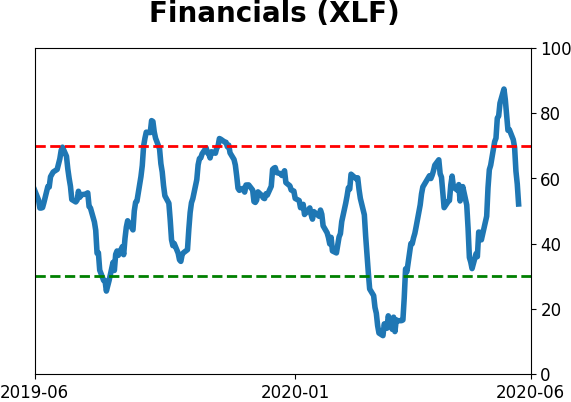
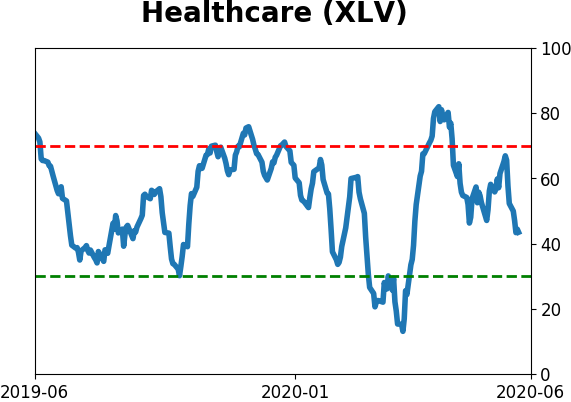
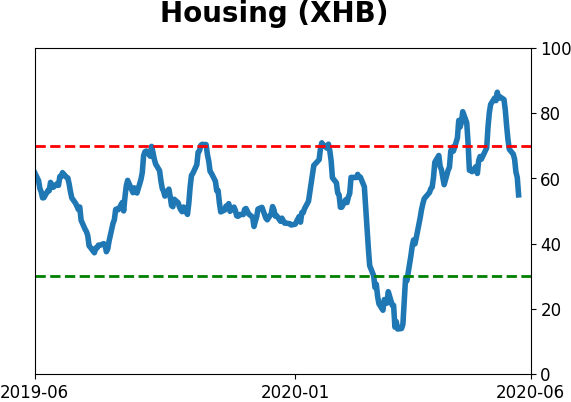
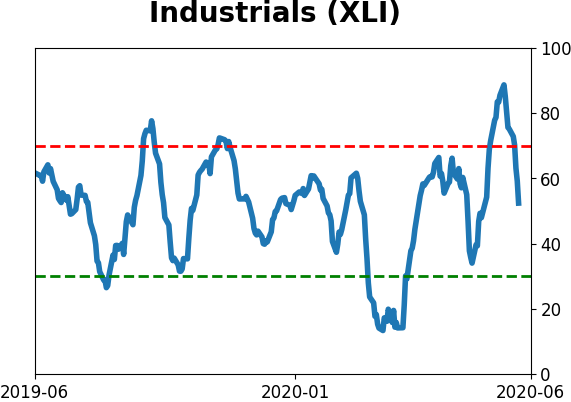
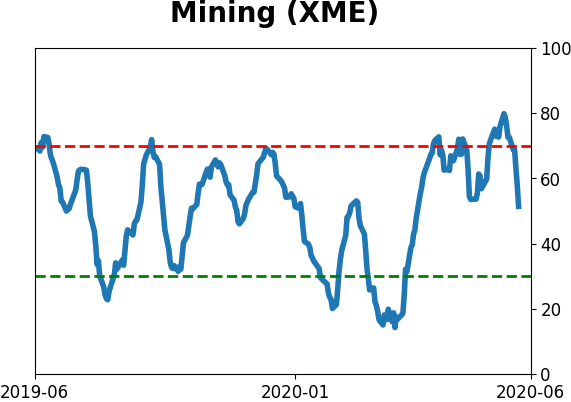
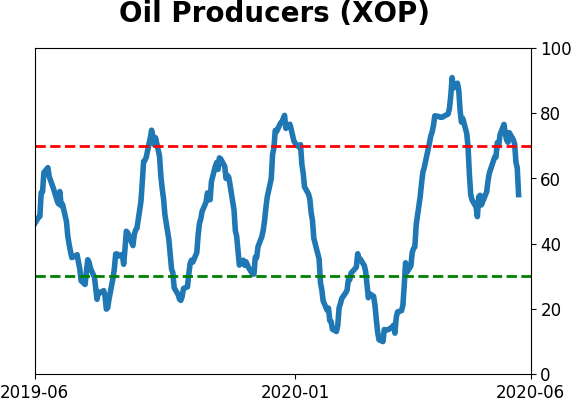
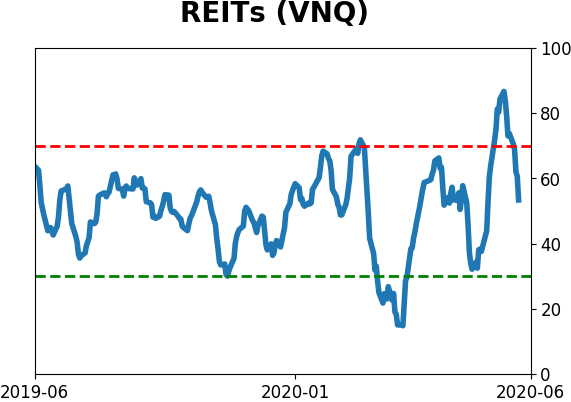
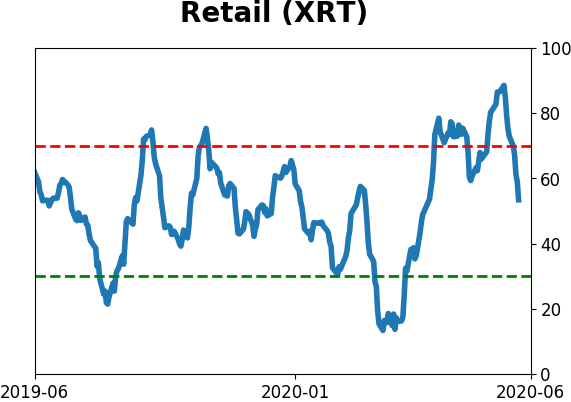
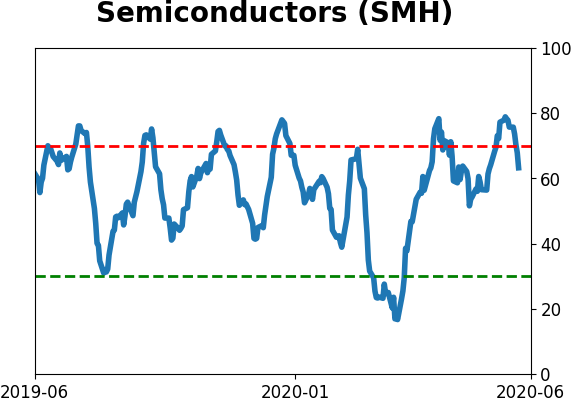
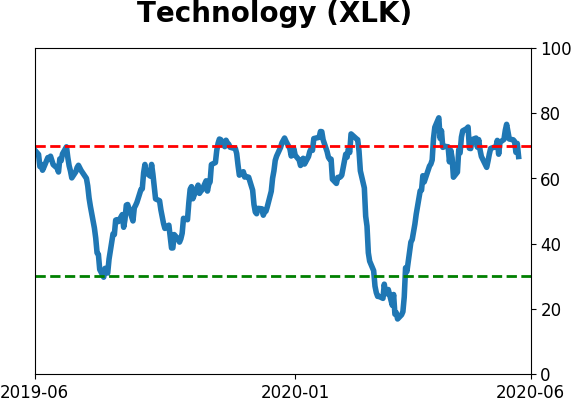
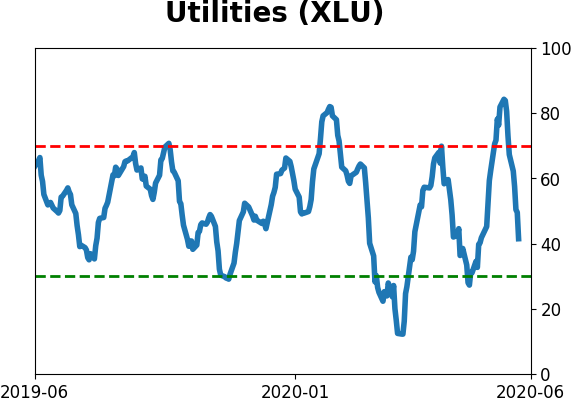
Sector ETF's - 10-Day Moving Average
|
|
|
Country ETF's - 10-Day Moving Average
|
|
|
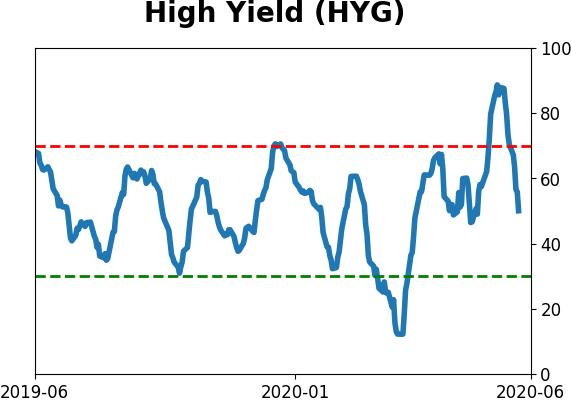
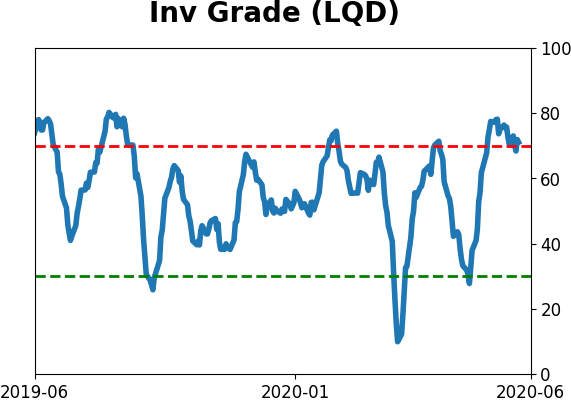
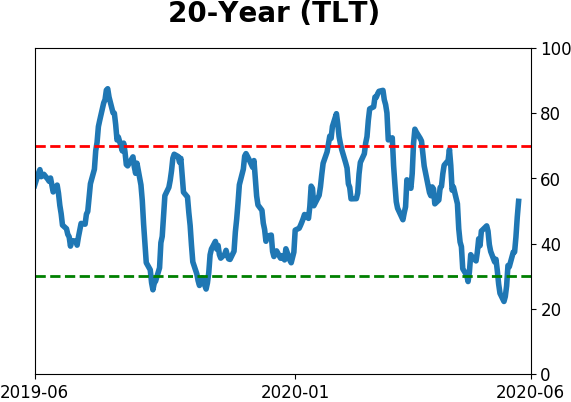
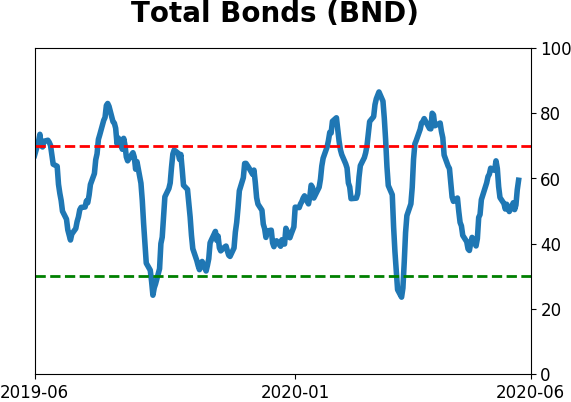
Bond ETF's - 10-Day Moving Average
|
|
|
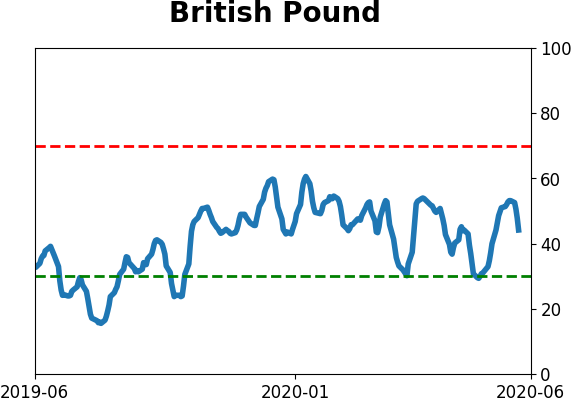
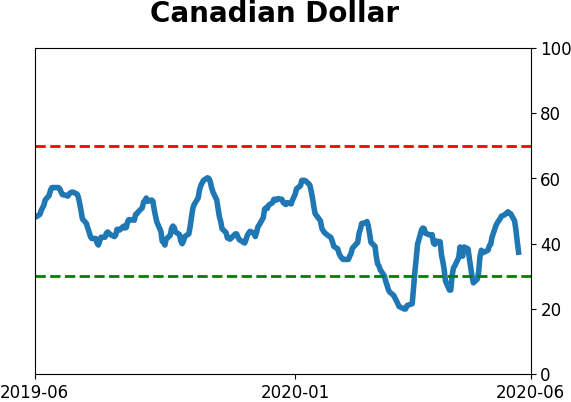
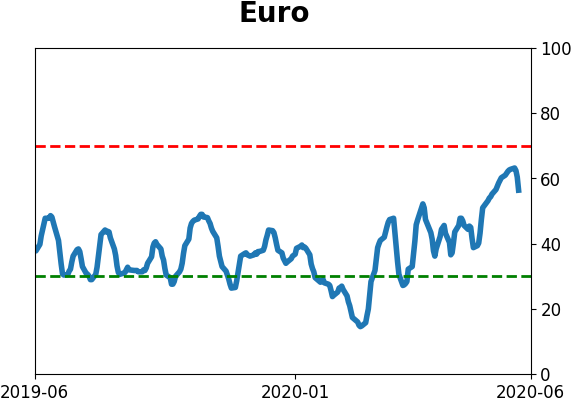
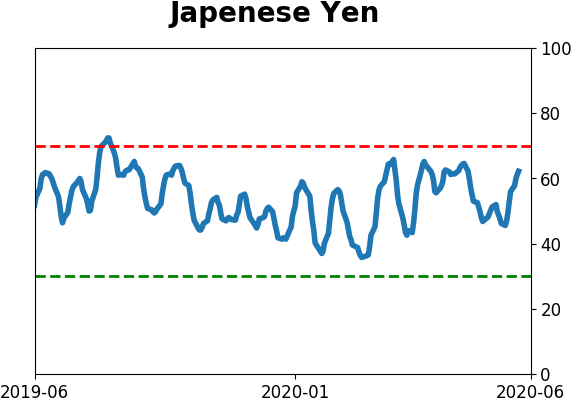
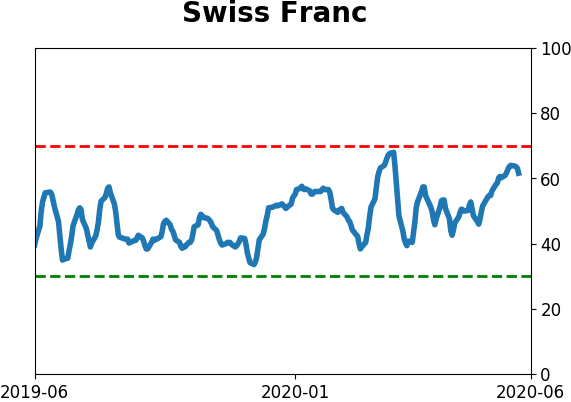
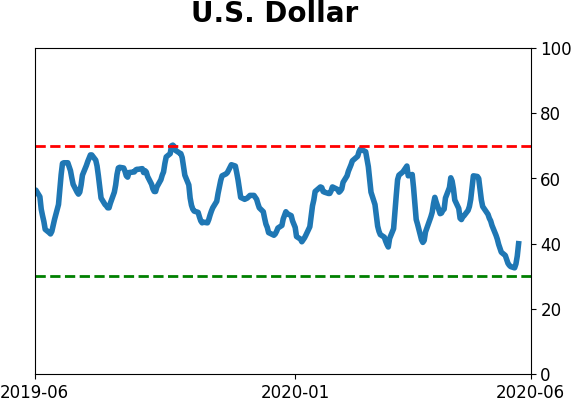
Currency ETF's - 5-Day Moving Average
|
|
|
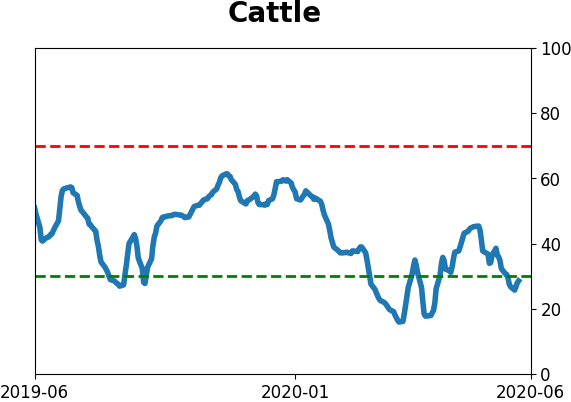
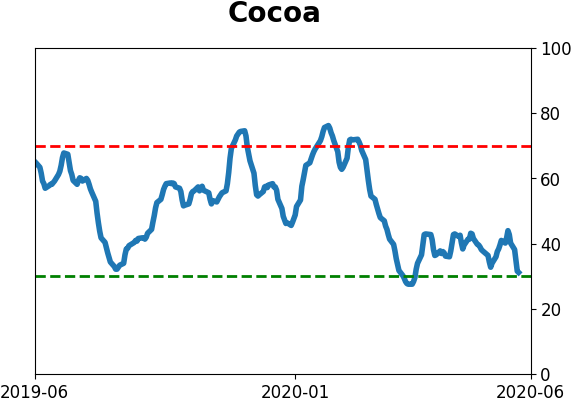
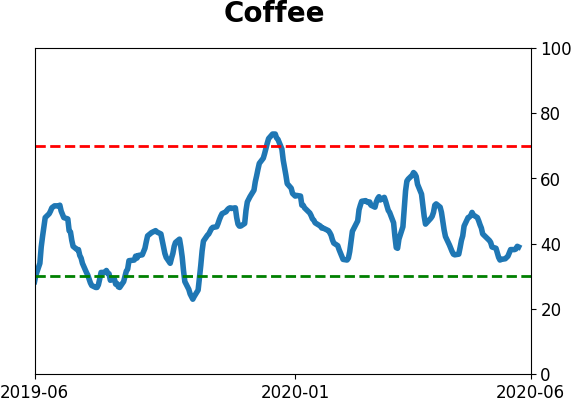
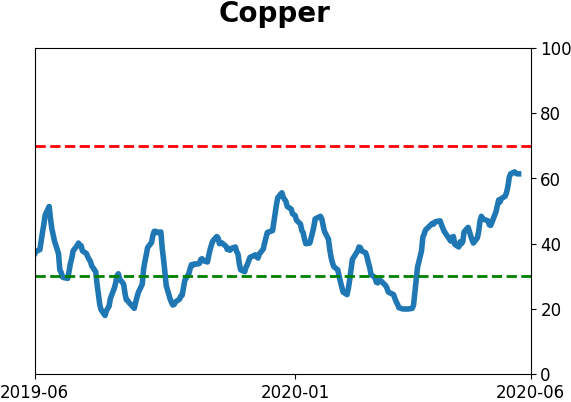
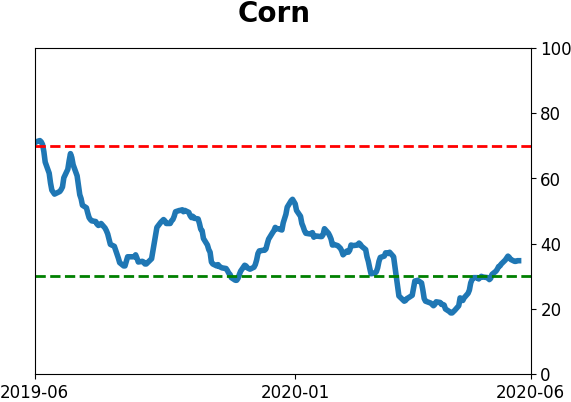
Commodity ETF's - 5-Day Moving Average
|
|