Headlines
|
|
Most stocks, industries, sectors, and world indexes are unhealthy:
A good way to determine whether a market environment is healthy or not is by watching how many stocks and indexes are holding above their 200-day moving averages. Healthy markets see most of them holding above, with dips below quickly getting bought. So far, we're seeing the opposite among stocks, industries, sectors, and worldwide indexes.
Sectors and factors depending on the election outcome:
Depending on whether an incumbent Republican wins or loses in the November election, various sectors and factors tend to do better or worse. Prediction markets show a better-than-even probability that a Democrat will win, and past changes in party showed a risky summer for growth stocks, especially technology shares.
Bottom line: The suggestion is flat/lower prices short- to medium-term, and higher prices long-term. Indicators are currently showing excessive optimism, with Dumb Money Confidence was recently near 80% and has gyrated since then, during what appears to still be an unhealthy market environment. The Active Studies show that when we look at stocks from various perspectives, there is a heavy positive skew over the medium-term long-term. Recently, there have been troubling signs of reckless speculation, but the breadth thrusts and recoveries have an almost unblemished record at preceding higher prices over a 6-12 month time frame. Indicators and studies for other markets are mixed with no strong conclusion.
Now they're leaving: A week after mutual fund and ETF investors piled into equities, they fled. Equity funds suffered a $25 billion outflow this week, according to Lipper. The Backtest Engine shows 13 weeks with an outflow greater than $20 billion, and it was surprisingly mixed-to-negative in the short-term. The only other time we've seen extreme weekly inflows and outflows like this was early 2018.
|
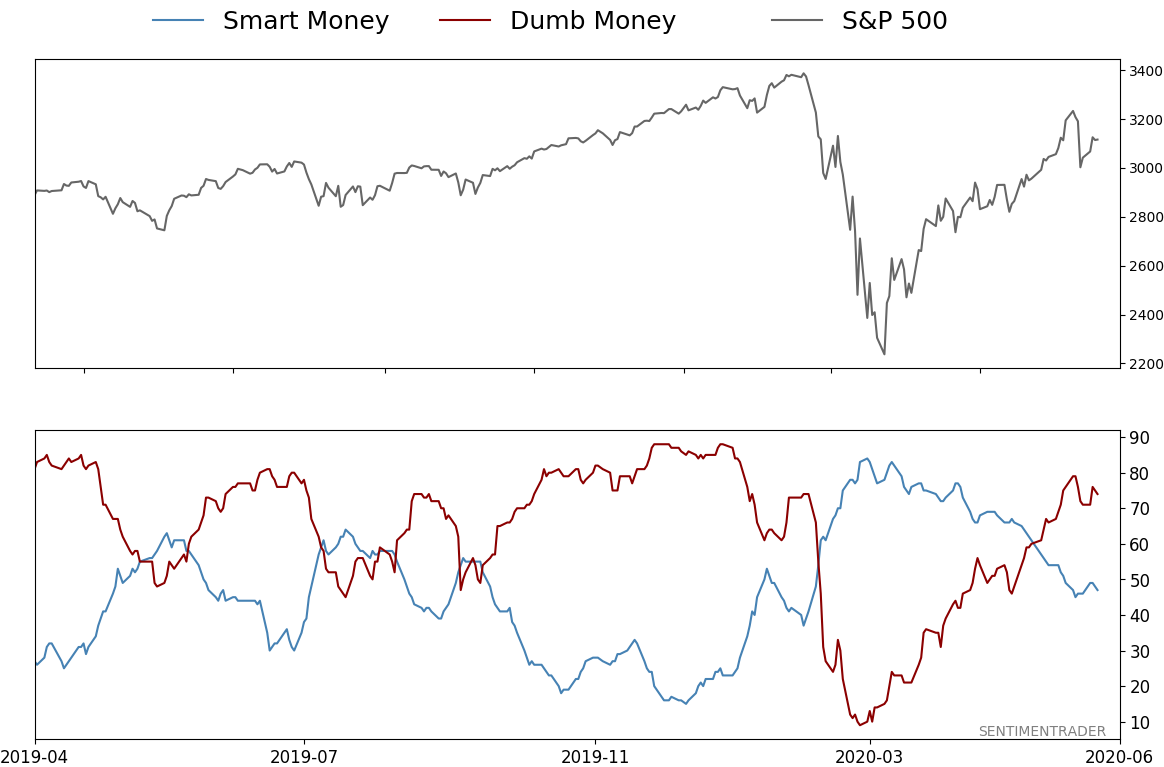
Smart / Dumb Money Confidence
|
Smart Money Confidence: 47%
Dumb Money Confidence: 74%
|
|
Risk Levels
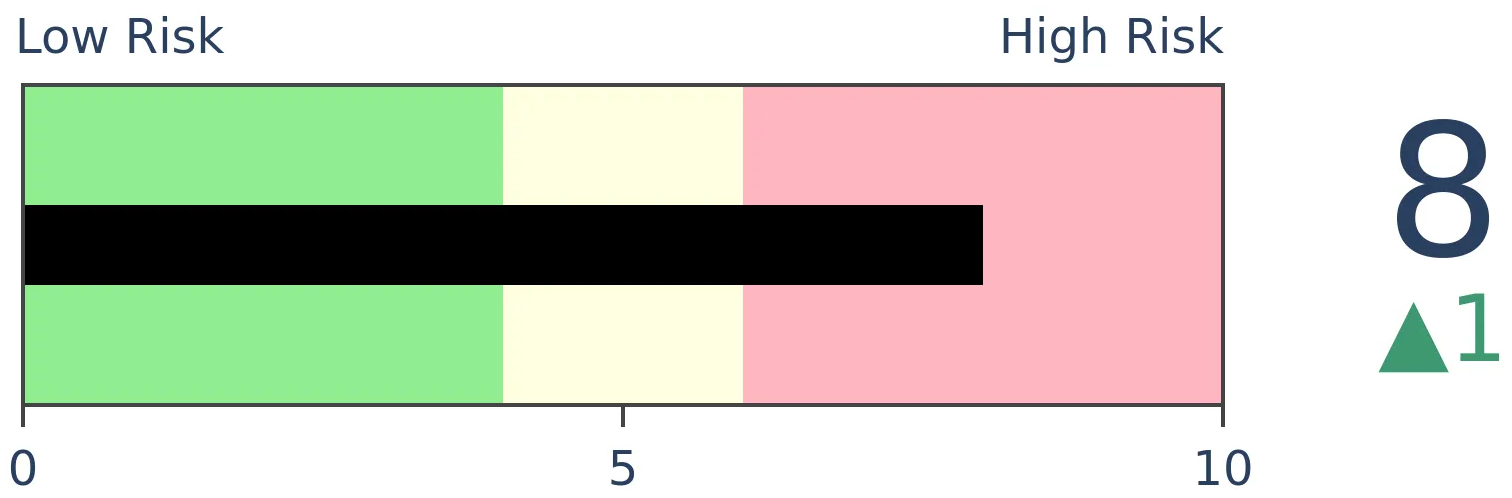
Stocks Short-Term

|
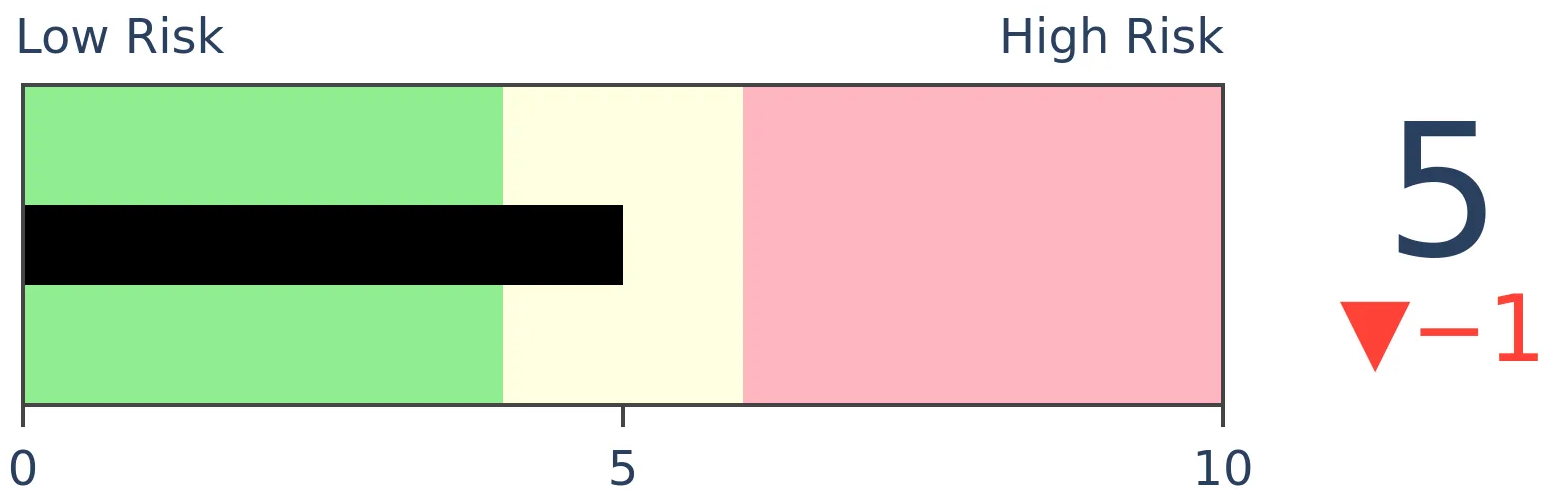
Stocks Medium-Term
|
|
Bonds
|
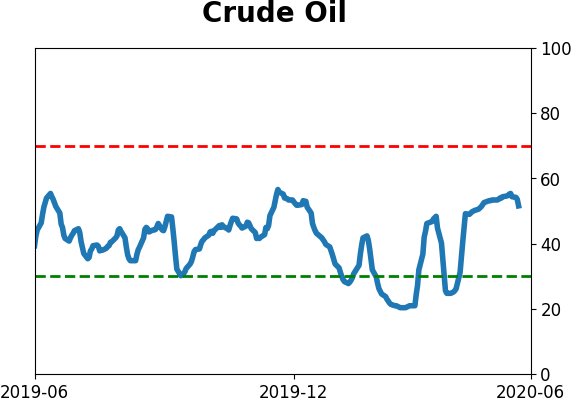
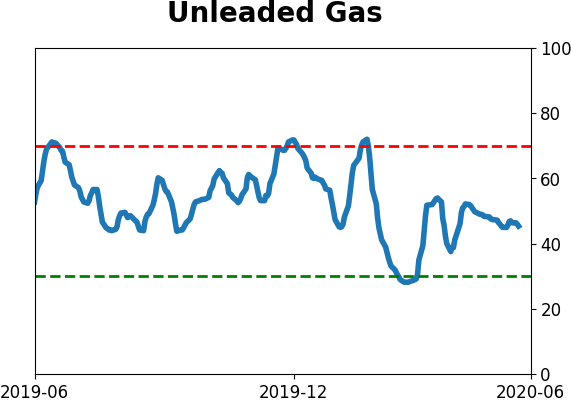
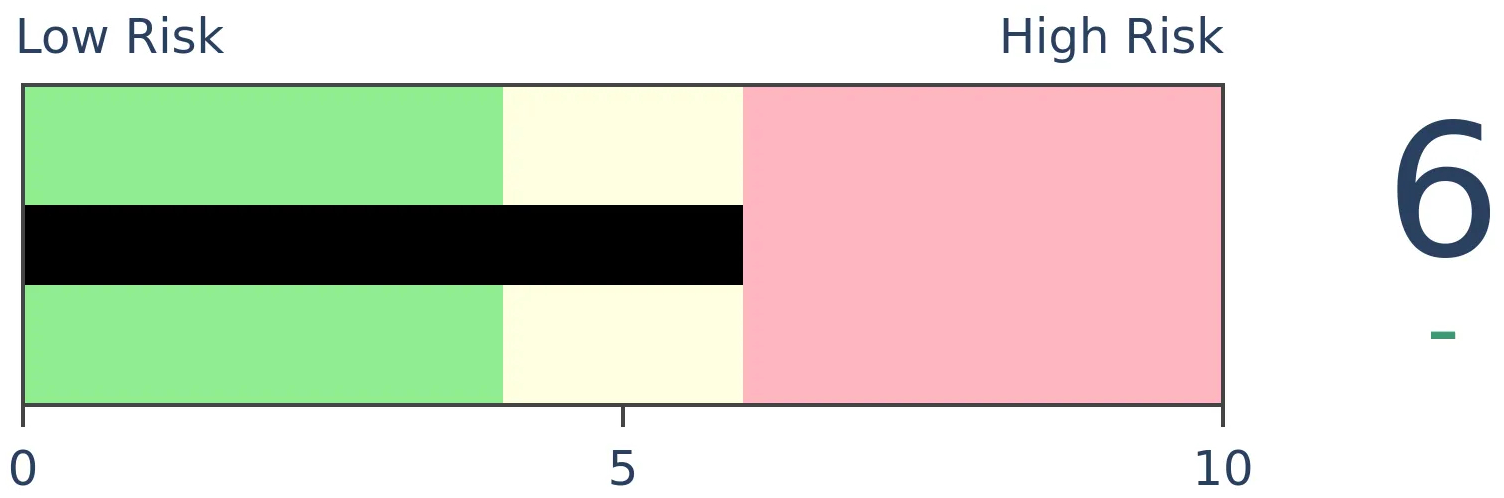
Crude Oil
|
|
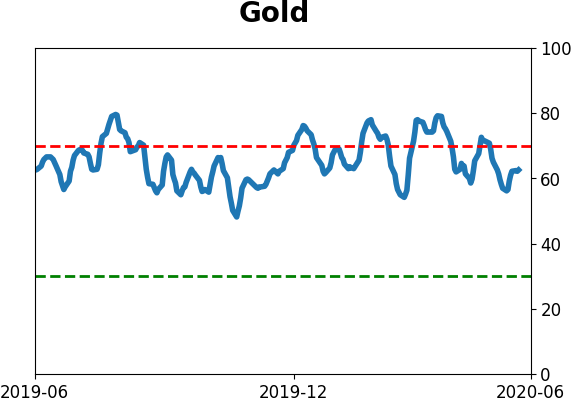
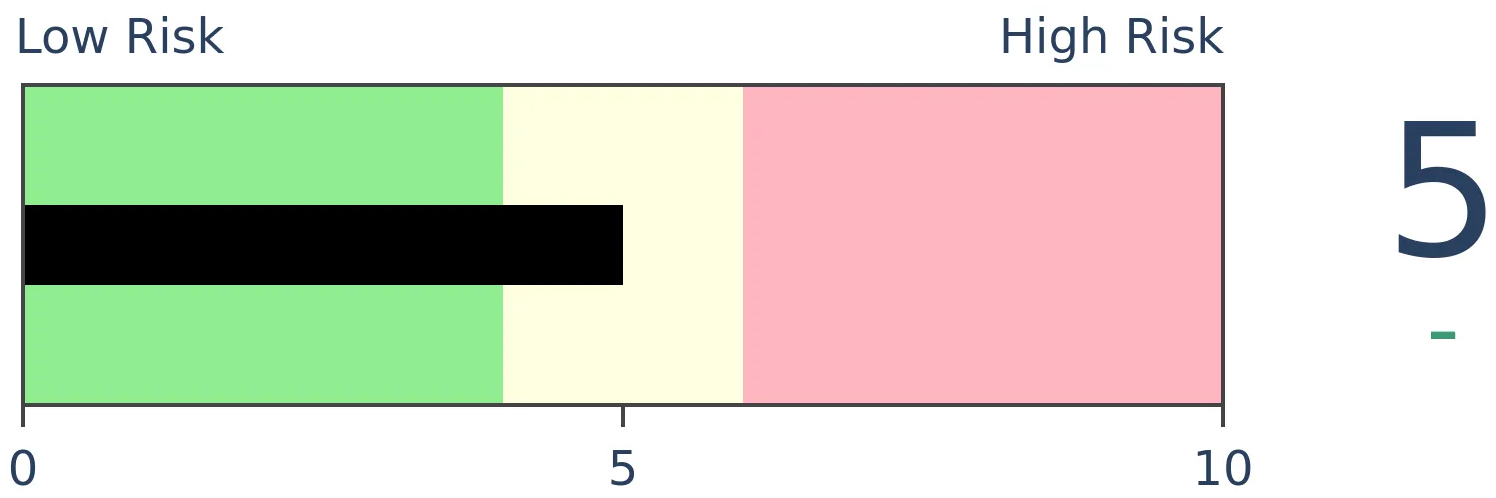
Gold

|
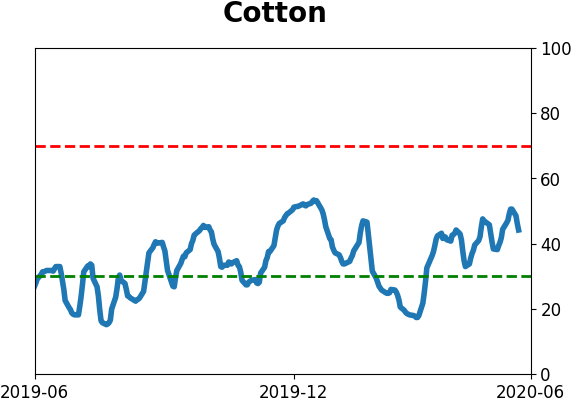
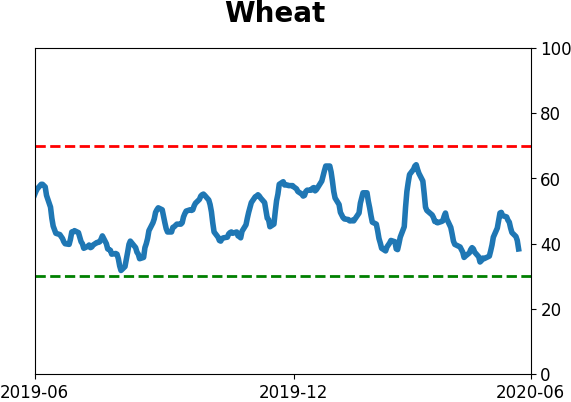
Agriculture
|
|
Research
BOTTOM LINE
A good way to determine whether a market environment is healthy or not is by watching how many stocks and indexes are holding above their 200-day moving averages. Healthy markets see most of them holding above, with dips below quickly getting bought. So far, we're seeing the opposite among stocks, industries, sectors, and worldwide indexes.
FORECAST / TIMEFRAME
None
|
When it comes down to brass tacks, investing sounds simple. Buy stocks when investors are pessimistic during healthy market environments, and sell them when investors are optimistic during unhealthy ones.
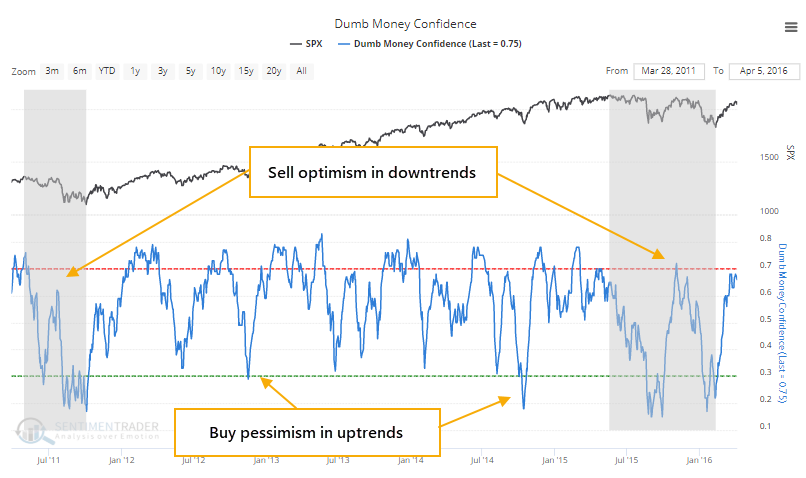
Like most things, the difficulty comes in the implementation, where theory meets practice. The biggest challenge is defining pessimism and optimism, and determining what is healthy and what is not.
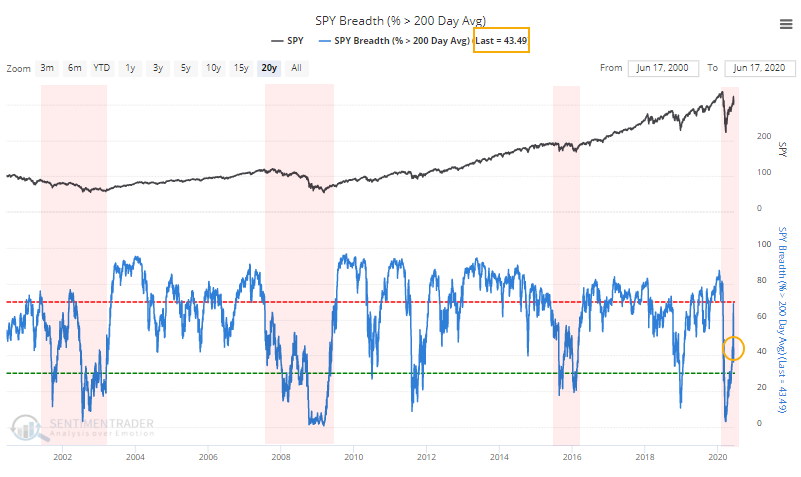
One of the better ways to define the latter is by watching how many stocks and indexes can maintain longer-term trends. The default tends to be the 200-day moving average, which in all of our testing has served about as well as any other trend measure, with the added bonus of being simple.
In prior years, we've suggested that markets are healthy when the percentage of stocks in the S&P 500 that are trading above their 200-day moving averages generally holds above 40%. Dips below that threshold typically see quick buying pressure. During unhealthy markets, this percentage usually stays below 60% or so, and forays above that level tend to lead to selling pressure.
This is a worry now.
Since February, most days have seen fewer than 60% of stocks in the S&P trading above their 200-day averages. It poked above that threshold a couple of weeks ago and then dropped right back below. That is not what typically happens during healthy markets.
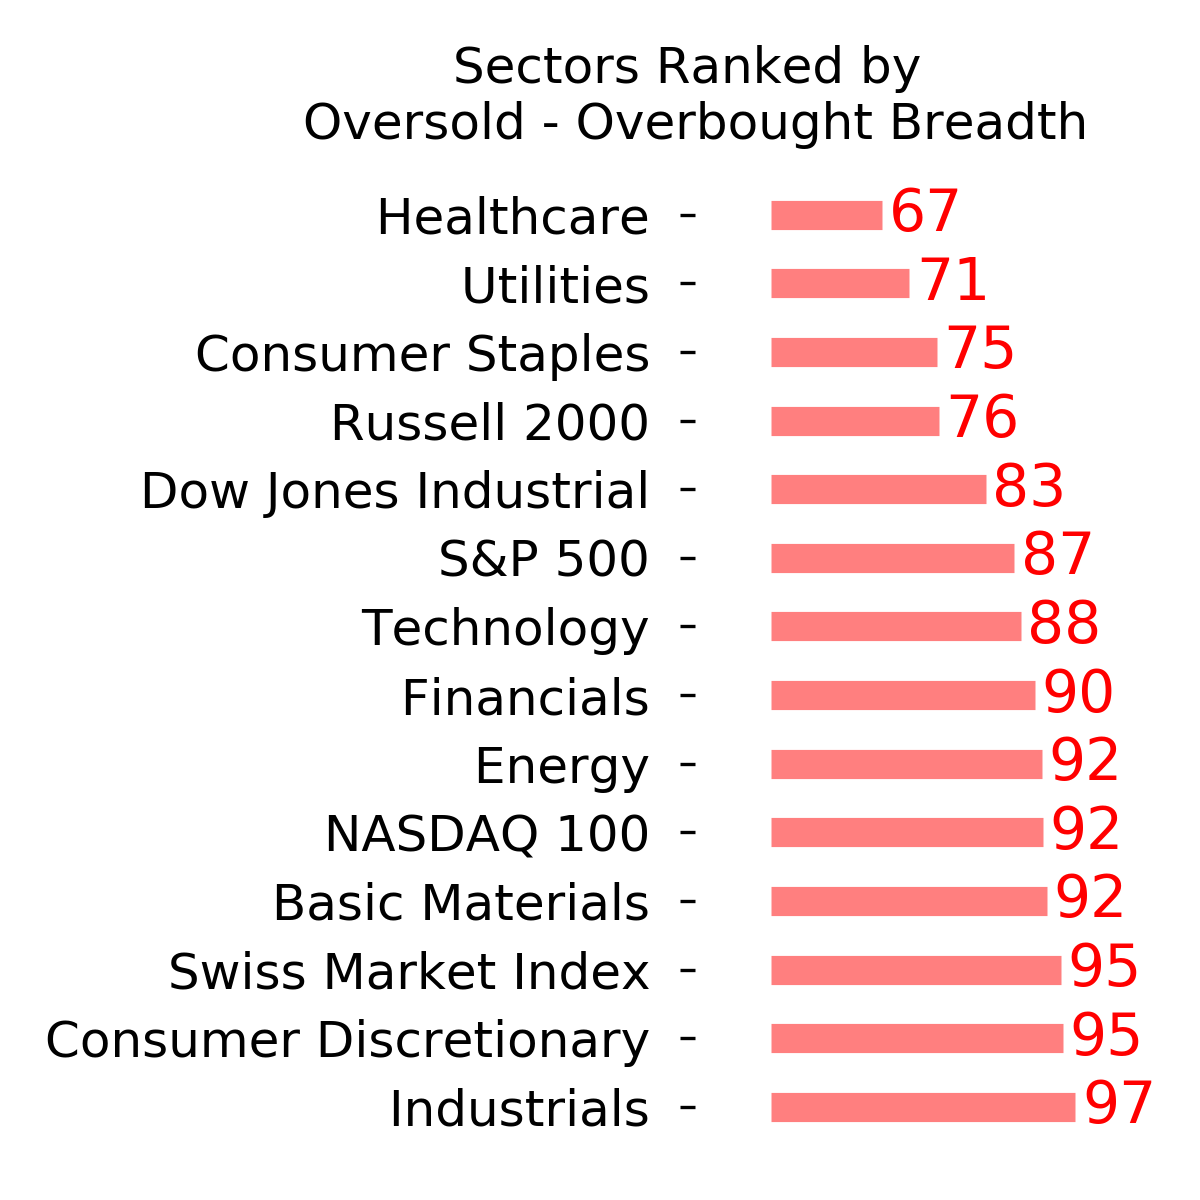
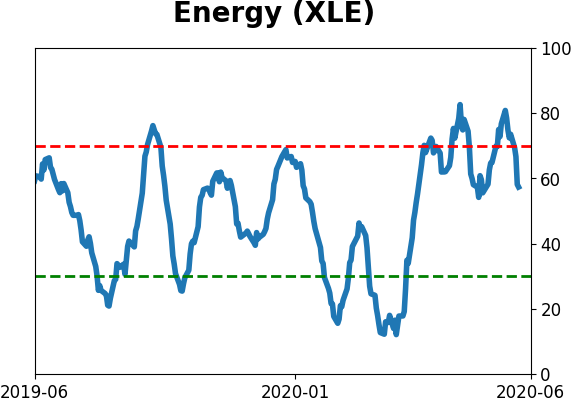
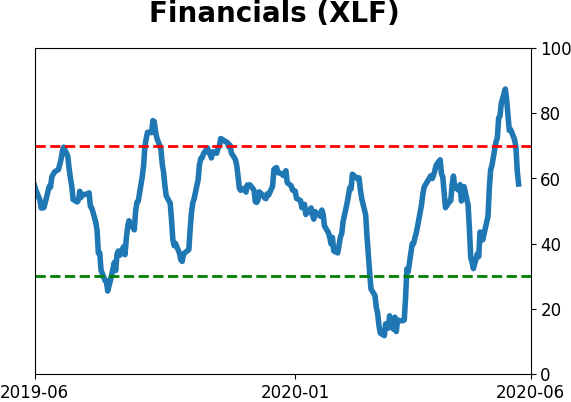
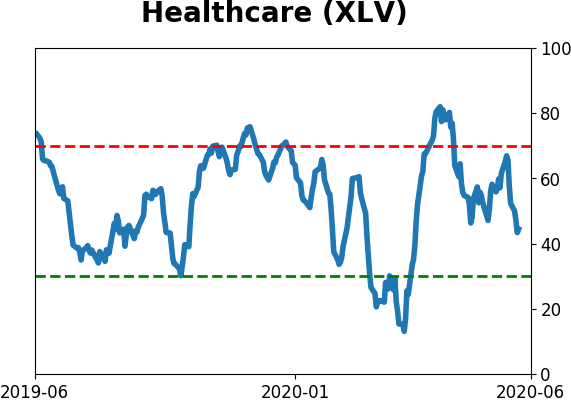
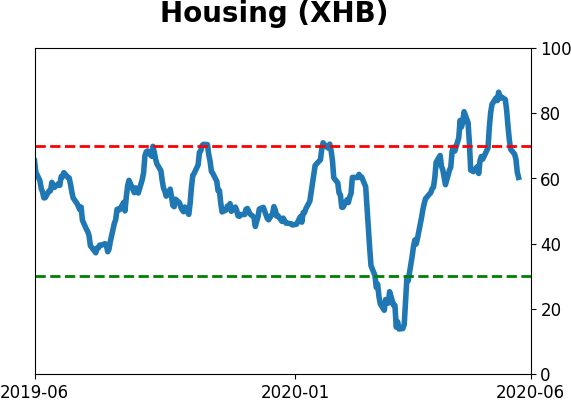
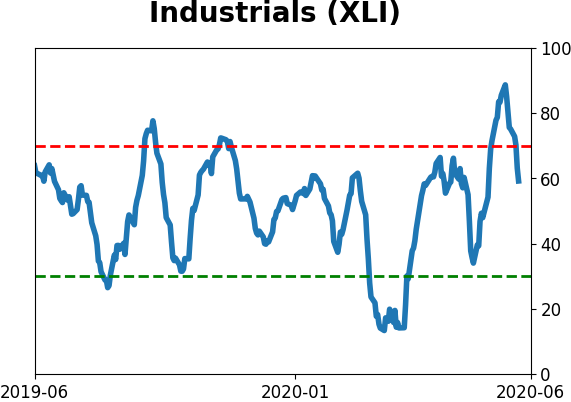
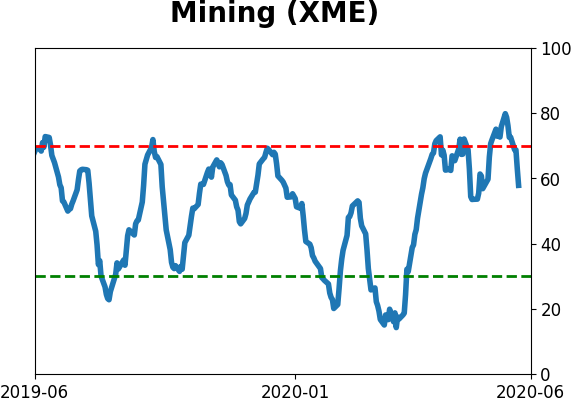
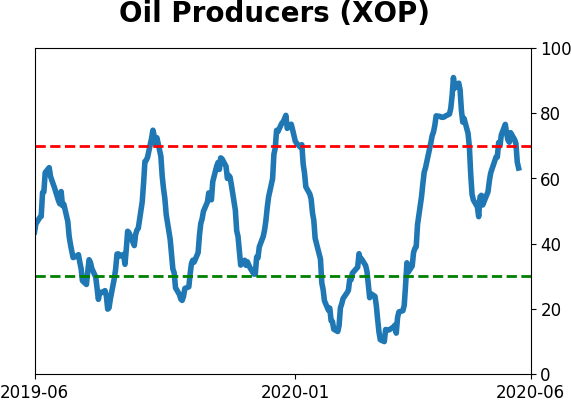
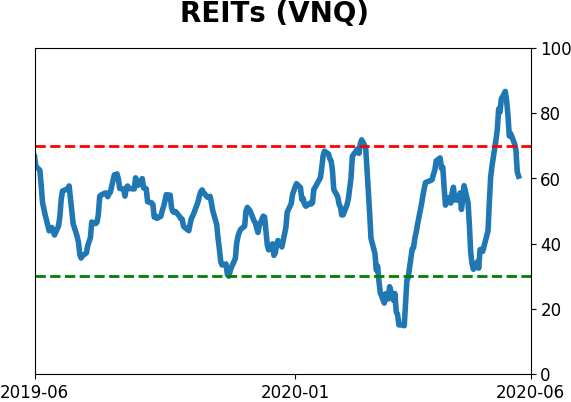
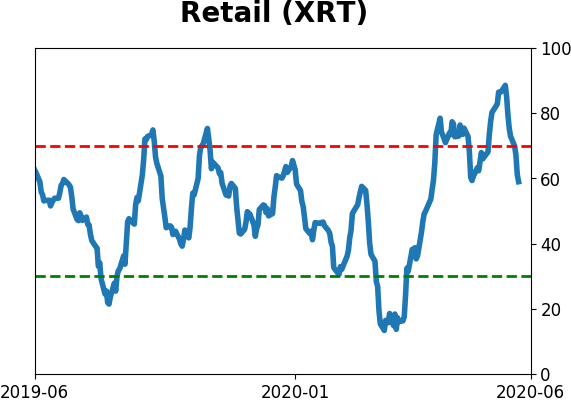
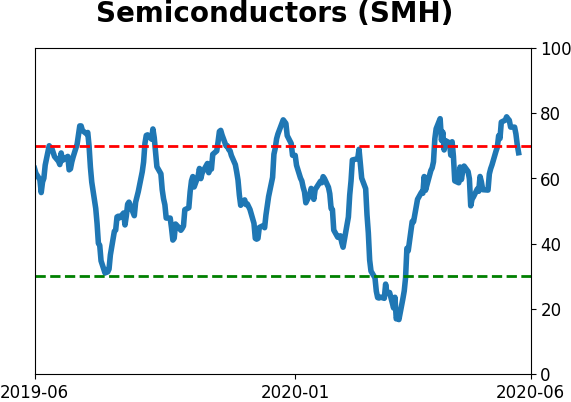
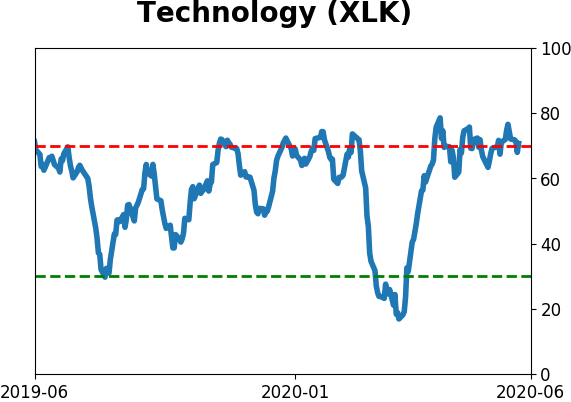
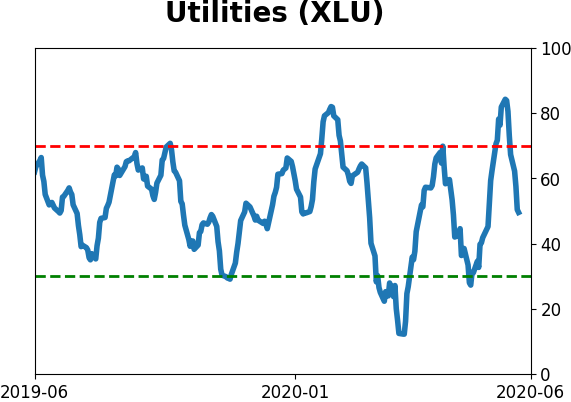
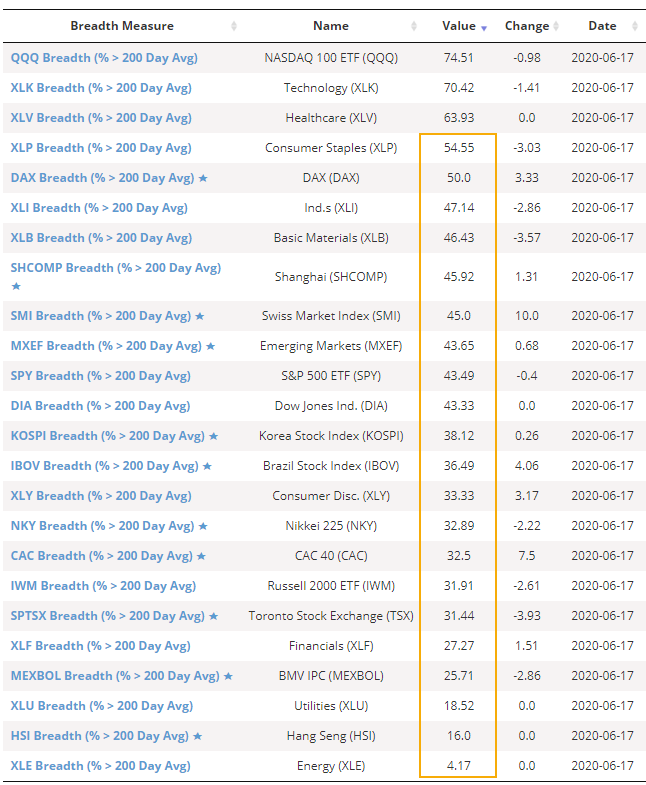
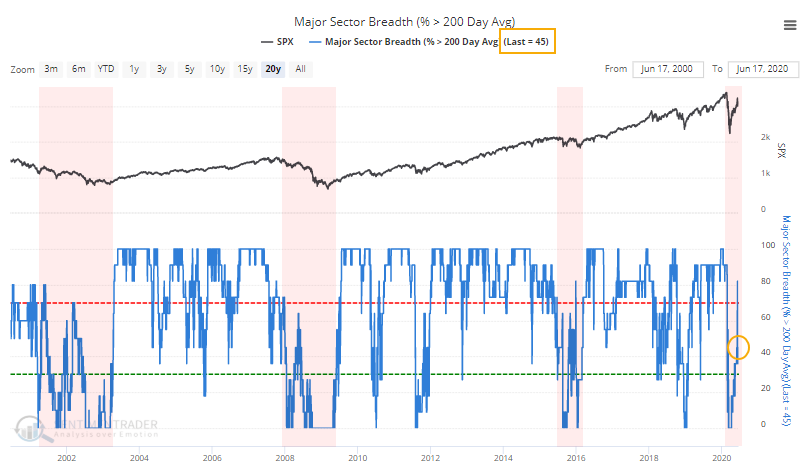
Almost all major sectors are still showing fewer than 60% of their component stocks trading above their long-term averages.
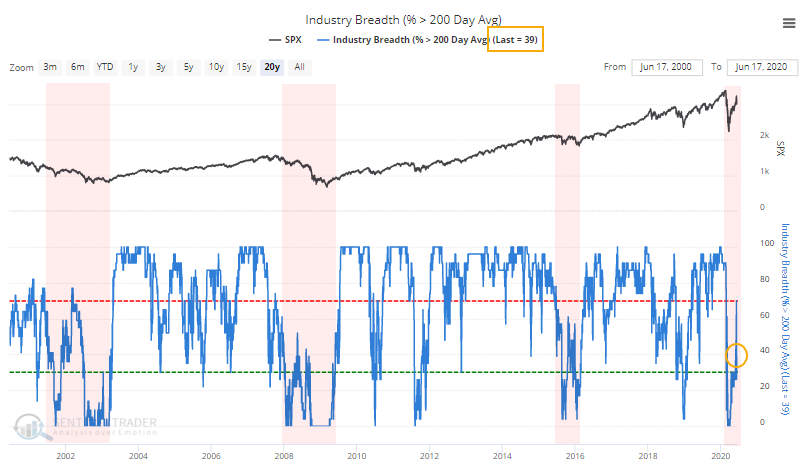
The same phenomenon can be seen among major industry groups.
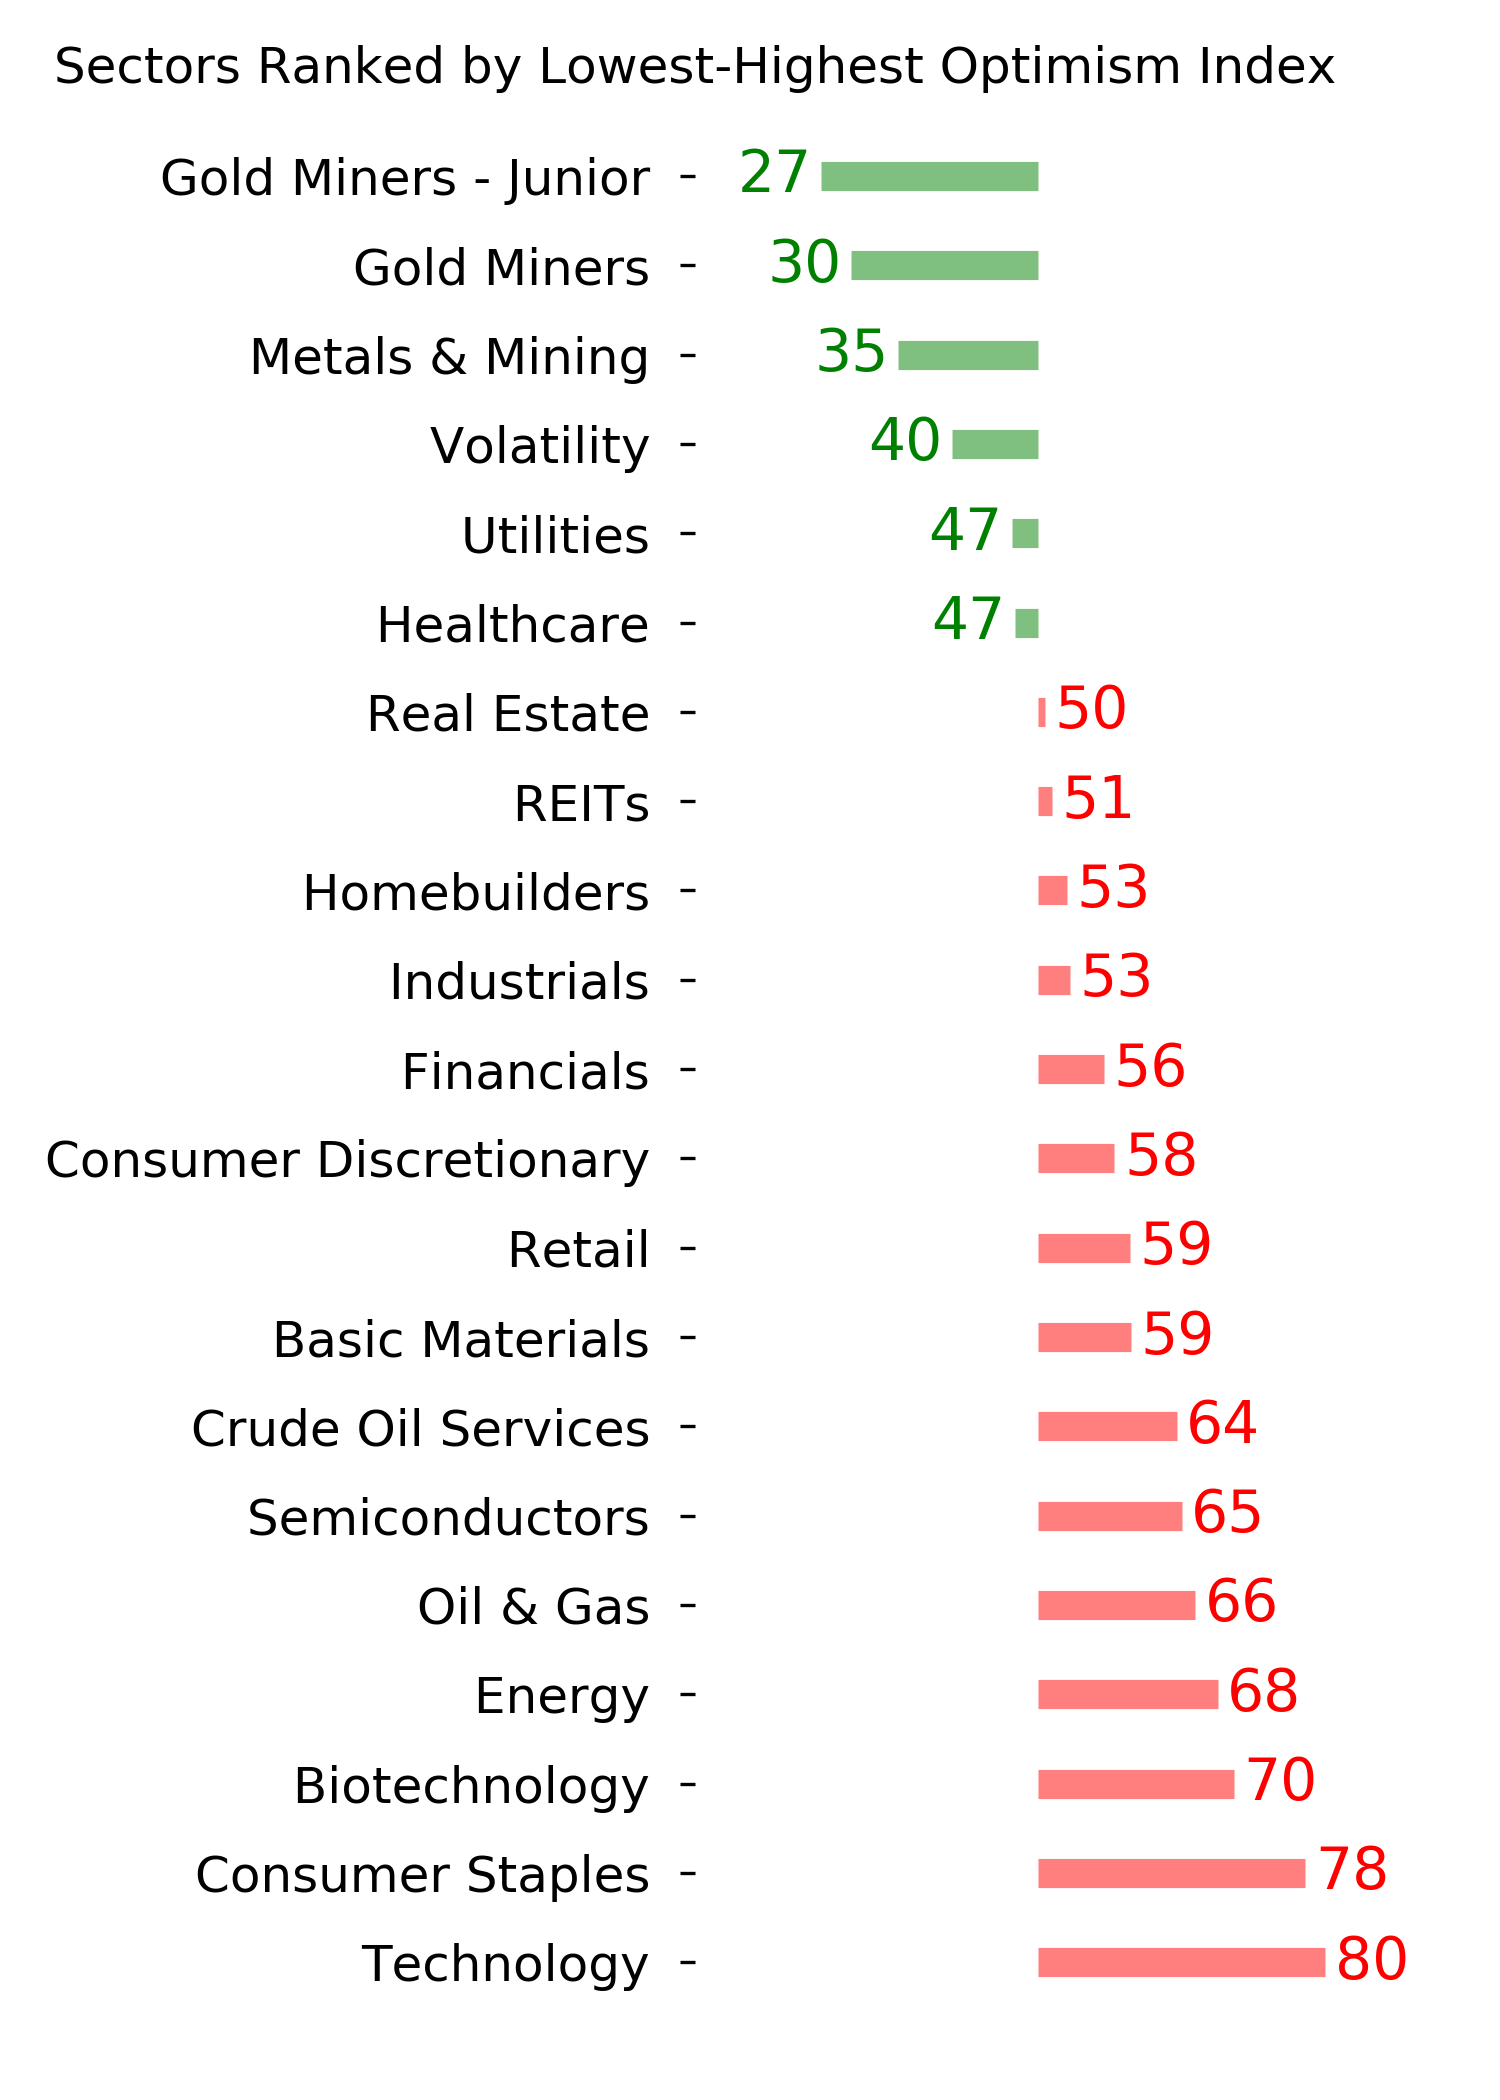
And sectors.
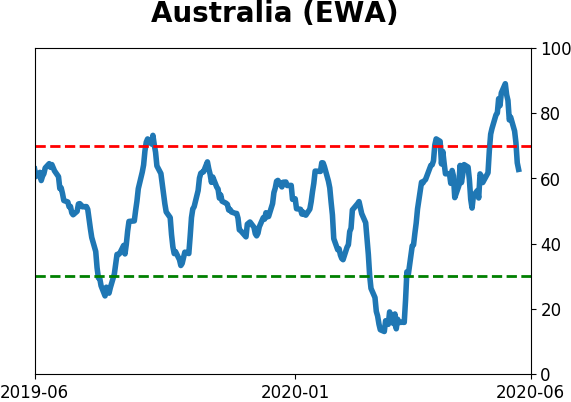
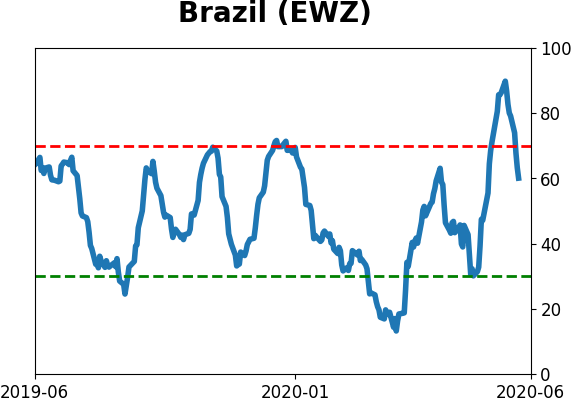
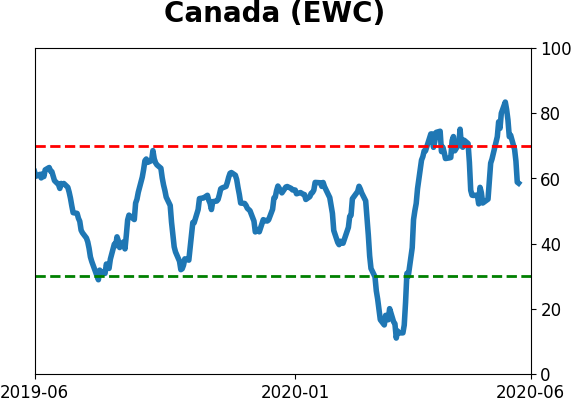
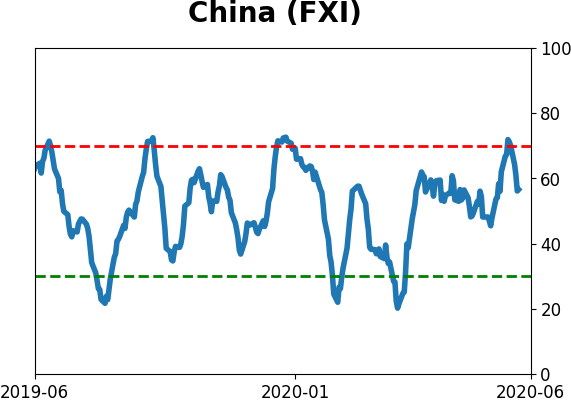
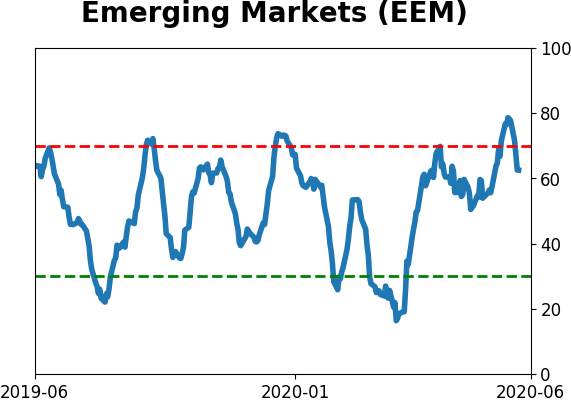
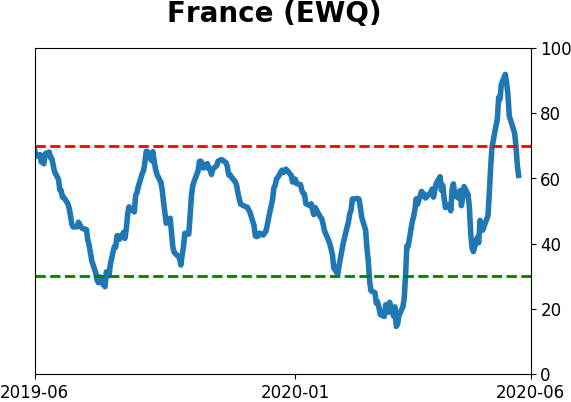
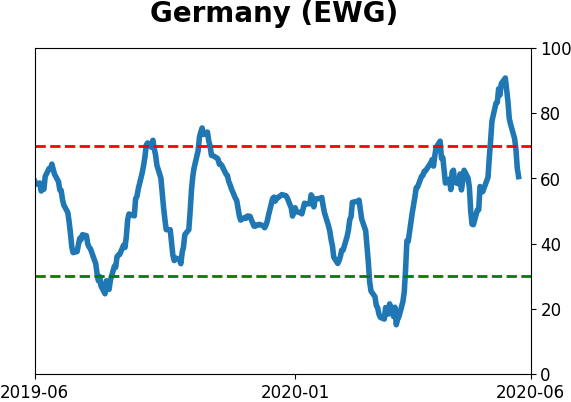
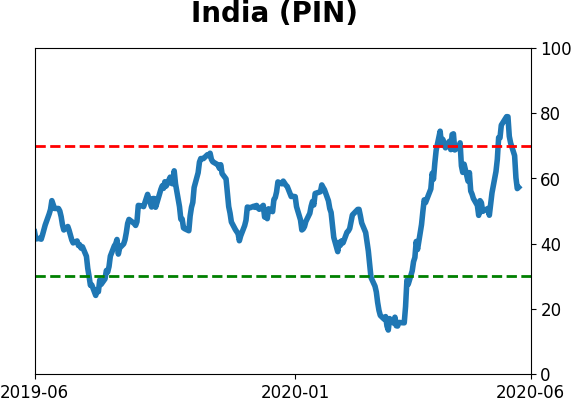
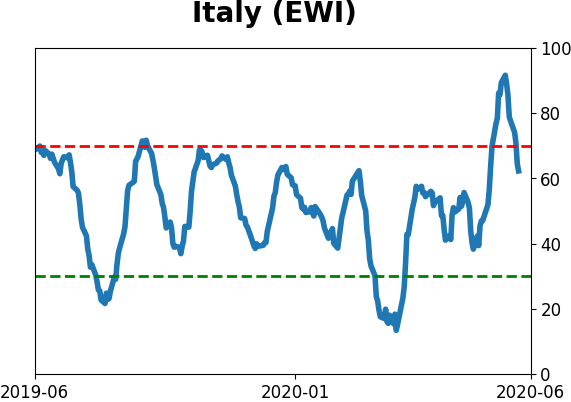
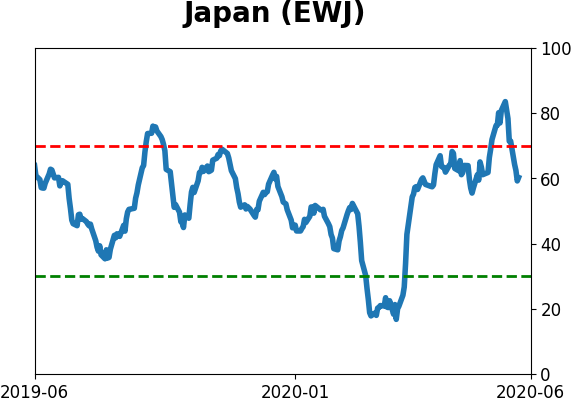
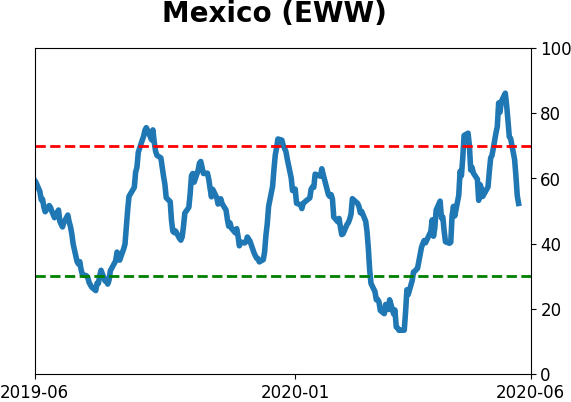
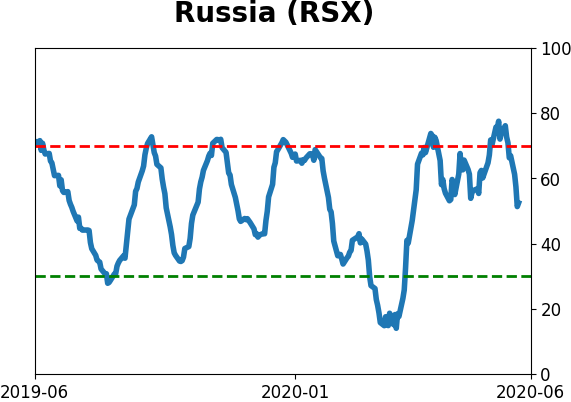
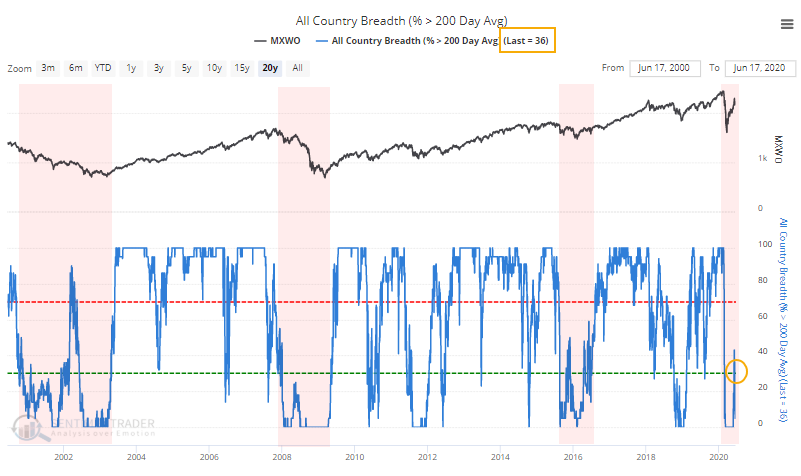
Even worldwide, with most major global indexes now trading below their 200-day averages again.
This isn't necessarily a death knell for the rally. Whenever we're in a period of extreme volatility, these figures can jump around some. They're not meant for day trading, they're meant to help us identify periods of long-term healthy and unhealthy markets, and we should watch how they behave over periods of weeks or even months.
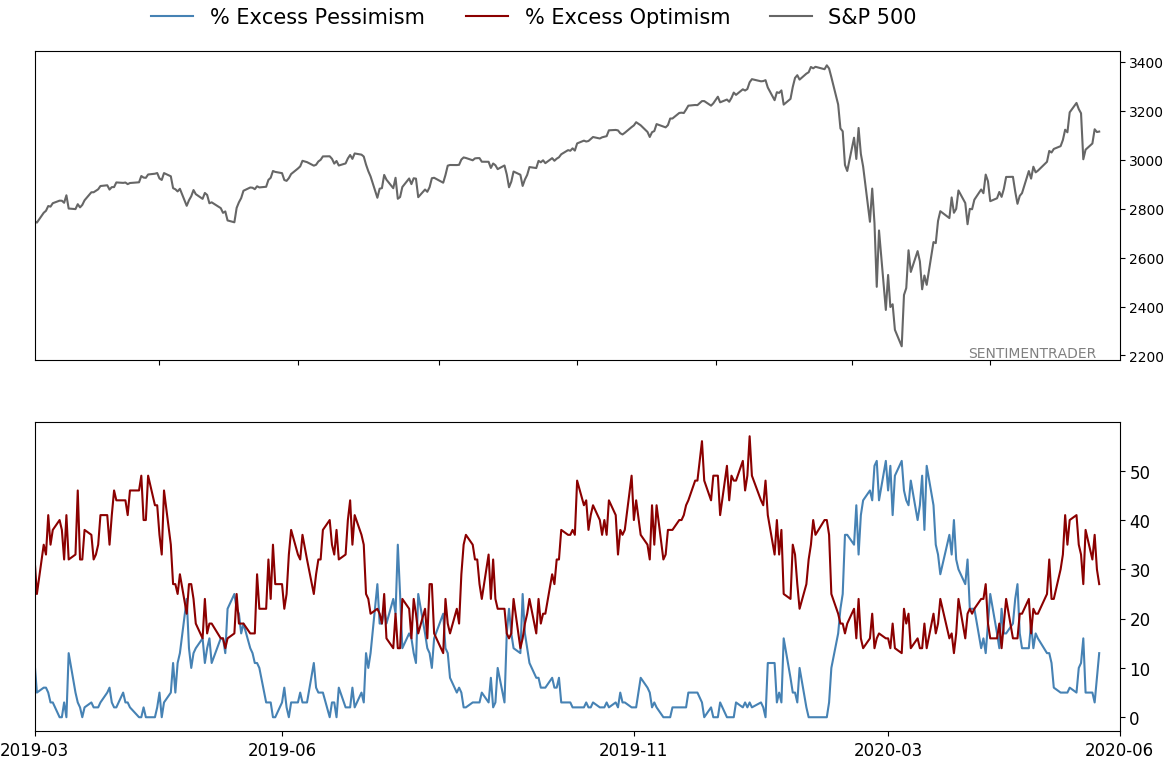
High optimism is less worrisome during healthy markets. But so far, there is limited evidence that we've flipped to a healthy environment, so periods of excessive optimism should still be viewed as being troubling. By most accounts, that's what we're seeing now with Dumb Money Confidence hovering above 70%, which is why the short- to medium-term prospects for stocks is risky.
BOTTOM LINE
Depending on whether an incumbent Republican wins or loses in the November election, various sectors and factors tend to do better or worse. Prediction markets show a better-than-even probability that a Democrat will win, and past changes in party showed a risky summer for growth stocks, especially technology shares.
FORECAST / TIMEFRAME
None
|
A couple of days ago, we looked at what the summer might look like depending on how the odds change for President Trump to hold onto the White House. Essentially, it was better for stocks if an incumbent Republican managed to hold onto the office or lose to another Republican.
We got quite a few questions asking if there were any specific sectors or factors that did better or worse depending on the outcome.
The table below shows the difference in returns and percentage of the time the sector was positive between those years when a Democrat won versus a Republican. If the number is positive, then that sector did better when a Democrat ended up winning the election.
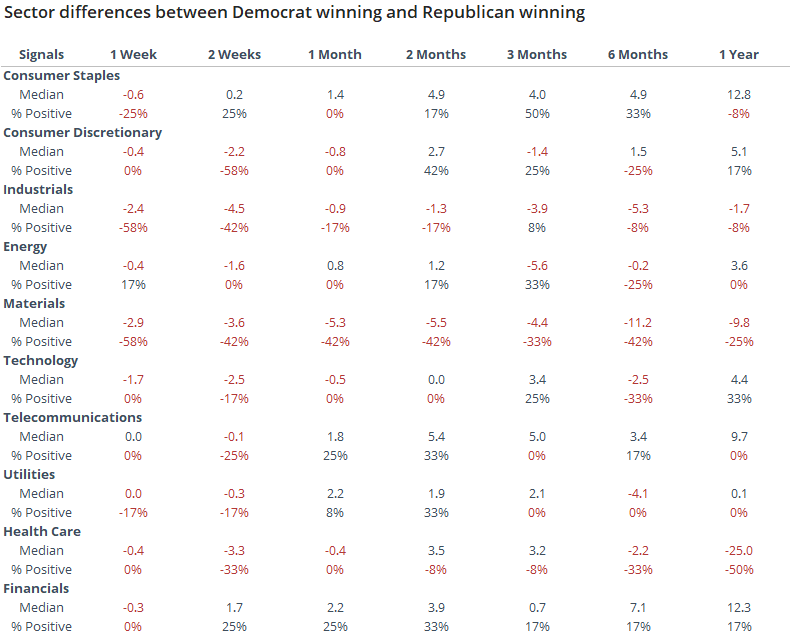
The largest positive differences over the next 6 months were in staples, followed by financials and communications. The biggest negatives were in materials, health care, and technology. Again, it's hard to assign cause and effect, but we might see some of these sector differences become pronounced depending on how the election odds play out in the coming months.
Here is the same table for factors.
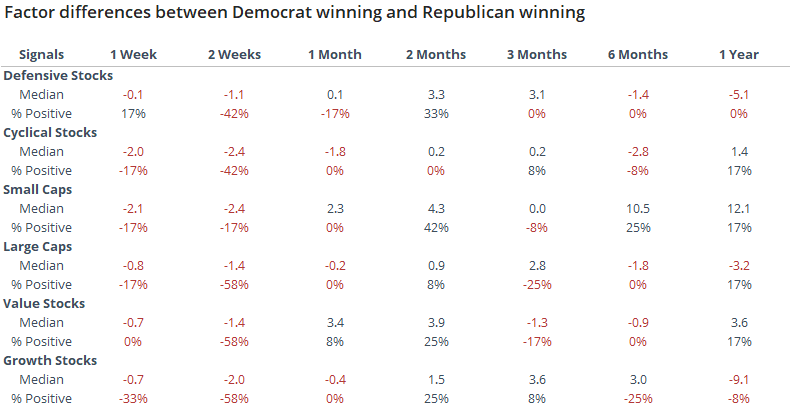
Small-cap stocks showed the only positive factor if a Democrat ended up taking the White House vs a Republican. Cyclical and growth stocks were among the most consistent losers, but the edges were not large.
It's a little iffy to base a conclusion on this data because we don't know what the election outcome will be ahead of time. It does suggest, though, that given the historic performance and optimism currently baked into growth (especially tech) shares, the high and rising probability of an incumbent Republican loss should be a headwind for sustained further gains.
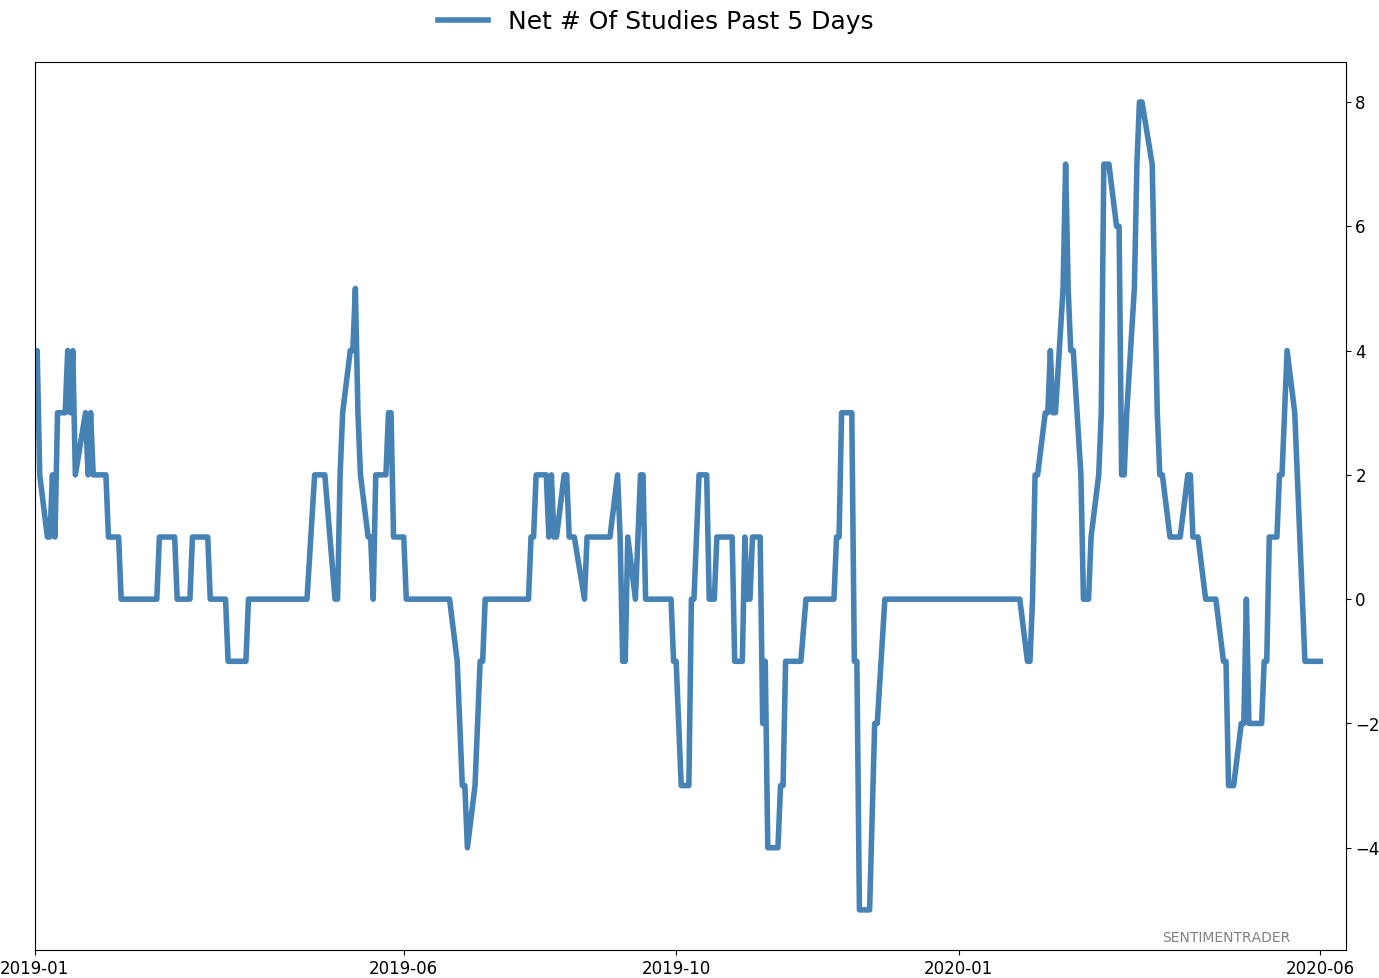
Active Studies
| Time Frame | Bullish | Bearish | | Short-Term | 0 | 1 | | Medium-Term | 8 | 6 | | Long-Term | 40 | 1 |
|
Indicators at Extremes
Portfolio
| Position | Weight % | Added / Reduced | Date | | Stocks | 29.8 | Reduced 9.1% | 2020-06-11 | | Bonds | 0.0 | Reduced 6.7% | 2020-02-28 | | Commodities | 5.2 | Added 2.4%
| 2020-02-28 | | Precious Metals | 0.0 | Reduced 3.6% | 2020-02-28 | | Special Situations | 0.0 | Reduced 31.9% | 2020-03-17 | | Cash | 65.0 | | |
|
Updates (Changes made today are underlined)
In the first months of the year, we saw manic trading activity. From big jumps in specific stocks to historic highs in retail trading activity to record highs in household confidence to almost unbelievable confidence among options traders. All of that came amid a market where the average stock couldn't keep up with their indexes. There were signs of waning momentum in stocks underlying the major averages, which started triggering technical warning signs in late January. After stocks bottomed on the 23rd, they enjoyed a historic buying thrust and retraced a larger amount of the decline than "just a bear market rally" tends to. Those thrusts are the most encouraging sign we've seen in years. Through early June, we were still seeing thrusts that have led to recoveries in longer-term breadth metrics. The longer-term prospects for stocks (6-12 months) still look decent given the above. On a short- to medium-term basis, it was getting harder to make that case. Dumb Money Confidence spiked and there were multiple signs of a historic level of speculation. Given that, I reduced my exposure a bit when stocks gapped down and failed to hold the lows of late last week. This is likely the lowest I will go given what I still consider to be compelling positives over a longer time frame. There is not a slam-dunk case to be made for either direction, so it will seem like a mistake whether stocks keep dropping (why didn't I sell more?) or if they turn and head higher (why did I let short-term concerns prevail?). After nearly three decades of trading, I've learned to let go of the idea of perfection.
RETURN YTD: -5.8% 2019: 12.6%, 2018: 0.6%, 2017: 3.8%, 2016: 17.1%, 2015: 9.2%, 2014: 14.5%, 2013: 2.2%, 2012: 10.8%, 2011: 16.5%, 2010: 15.3%, 2009: 23.9%, 2008: 16.2%, 2007: 7.8%
|
|
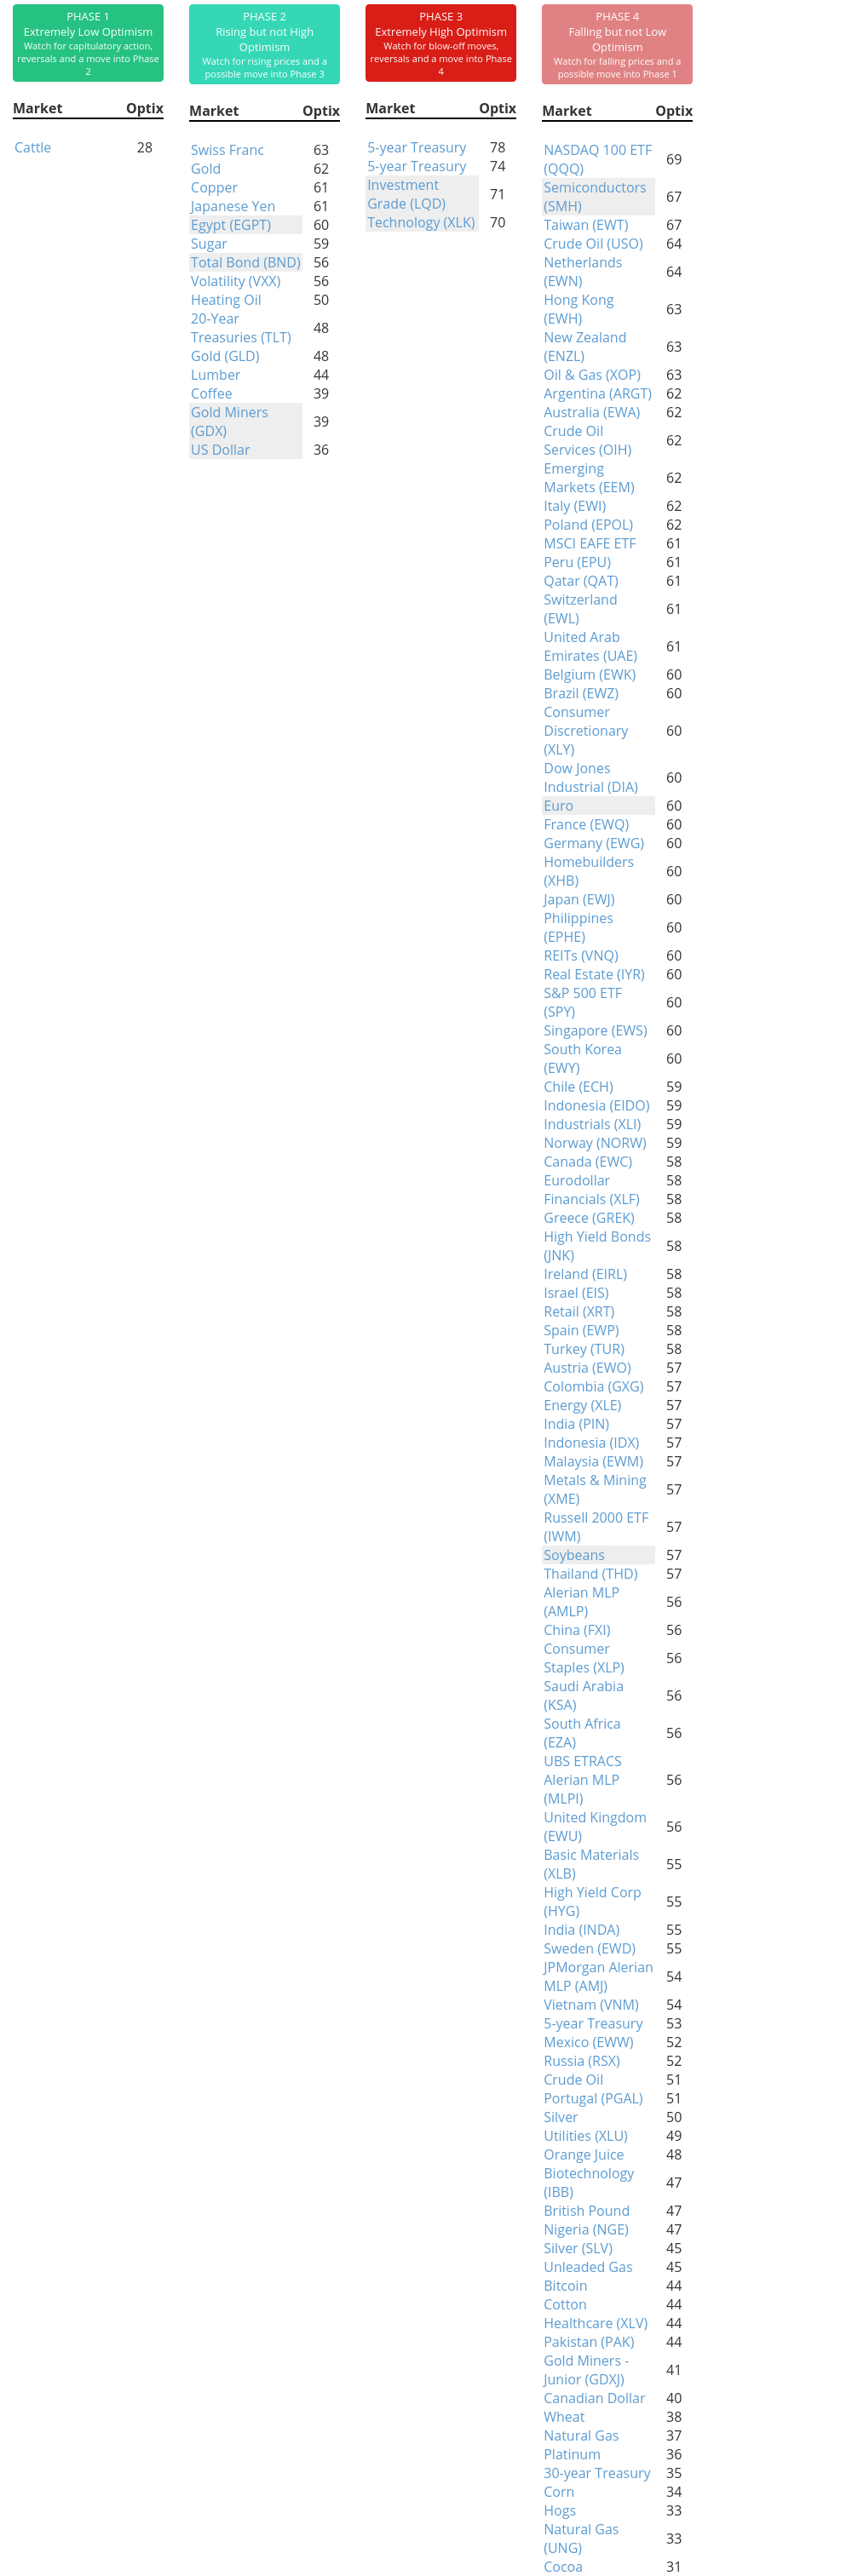
Phase Table
Ranks
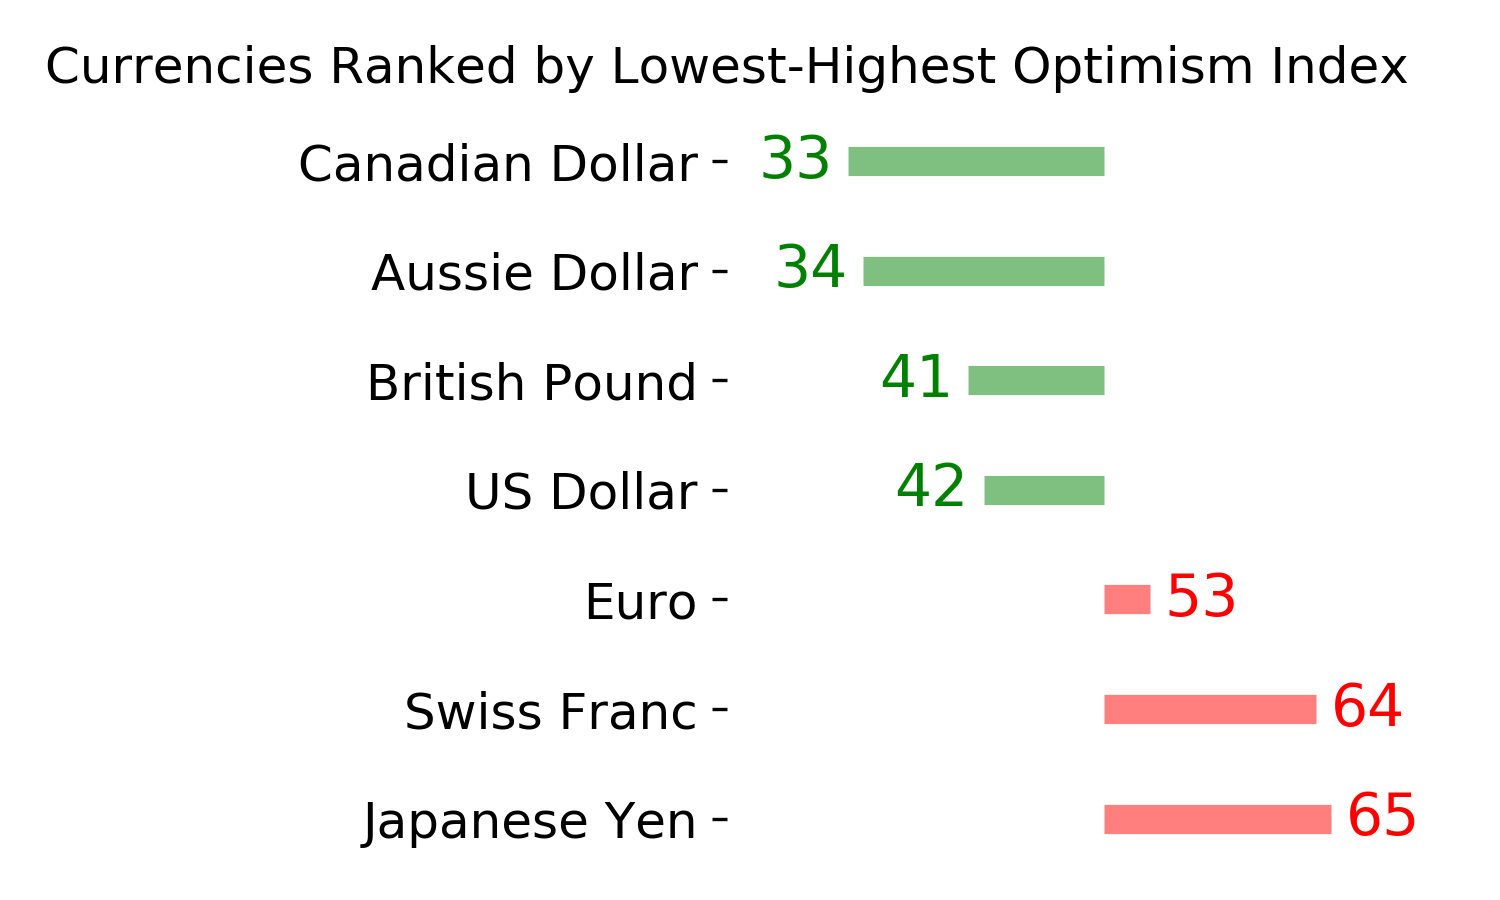
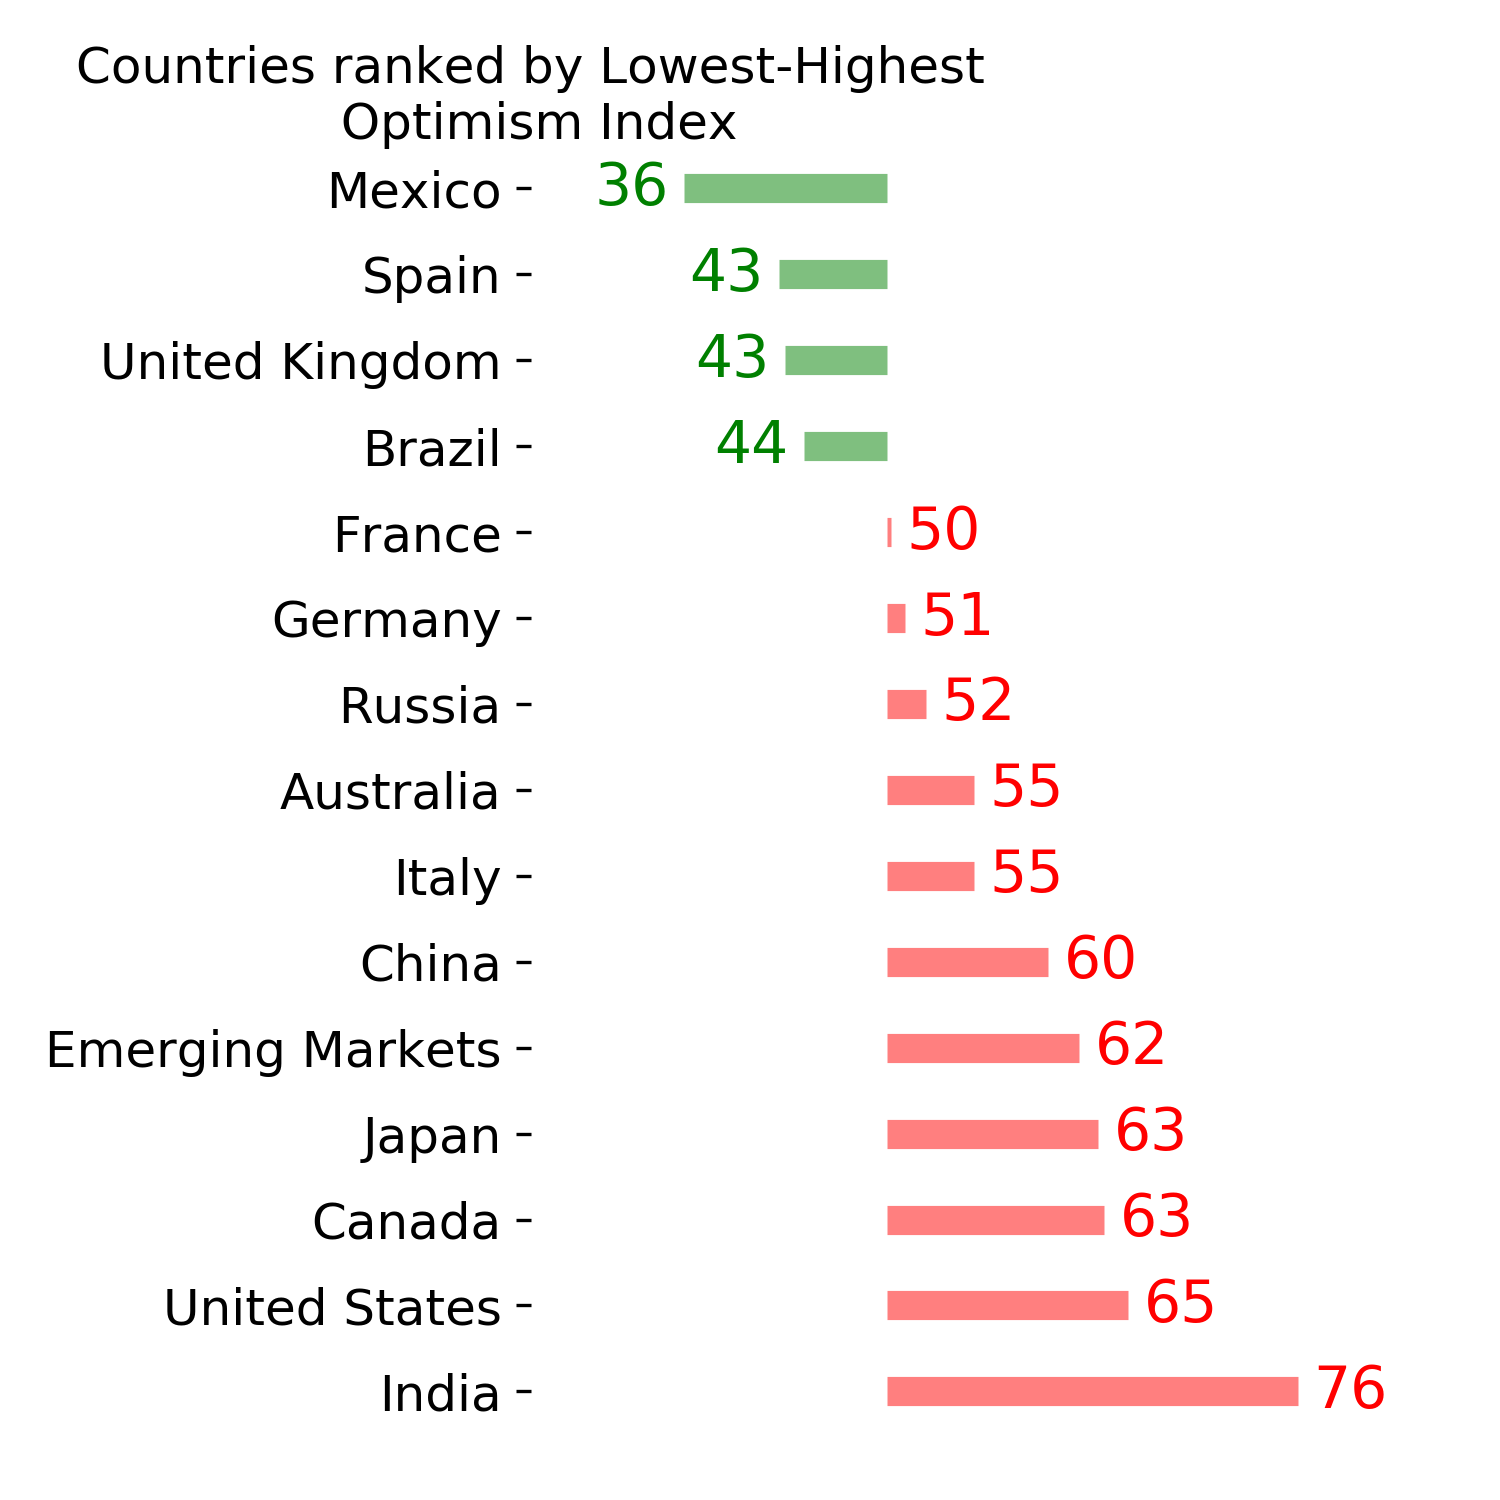
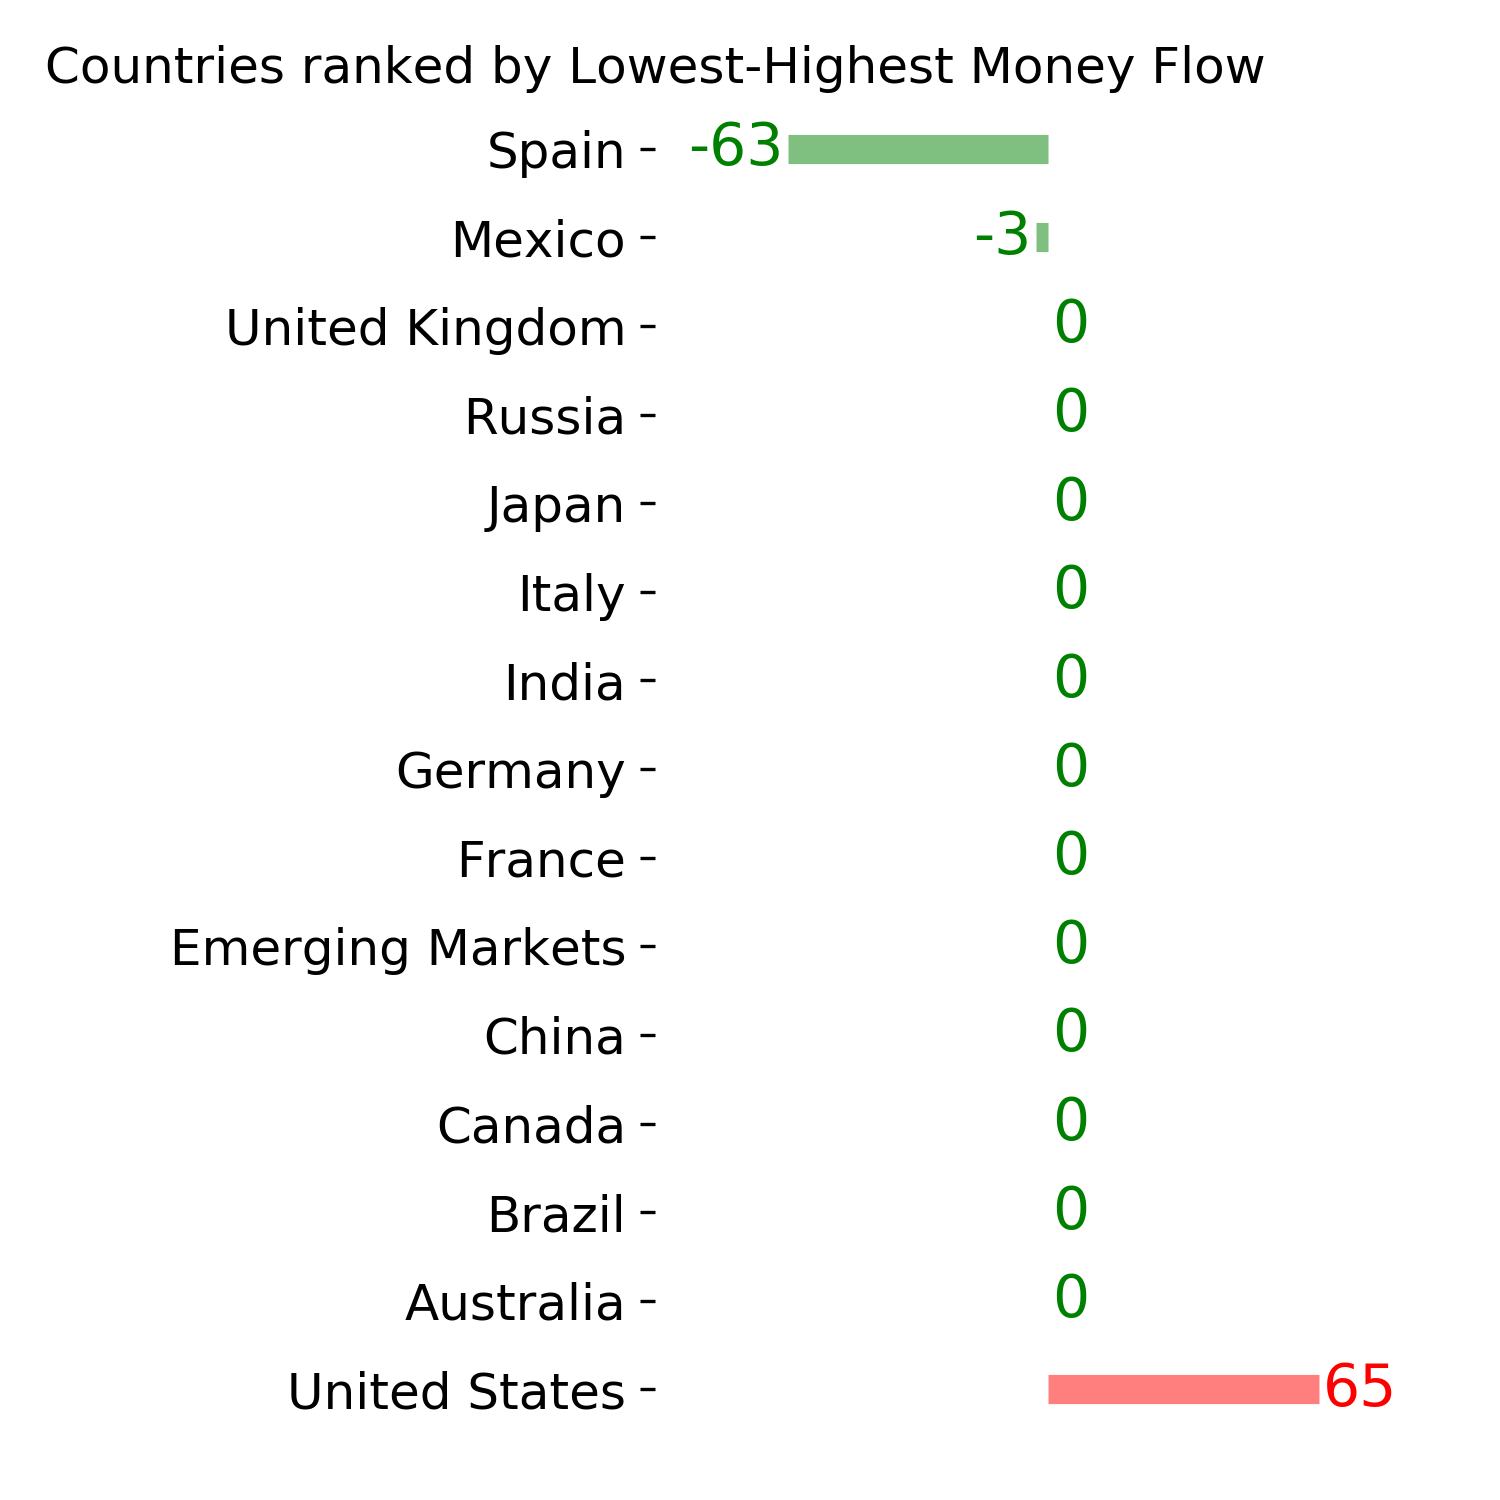
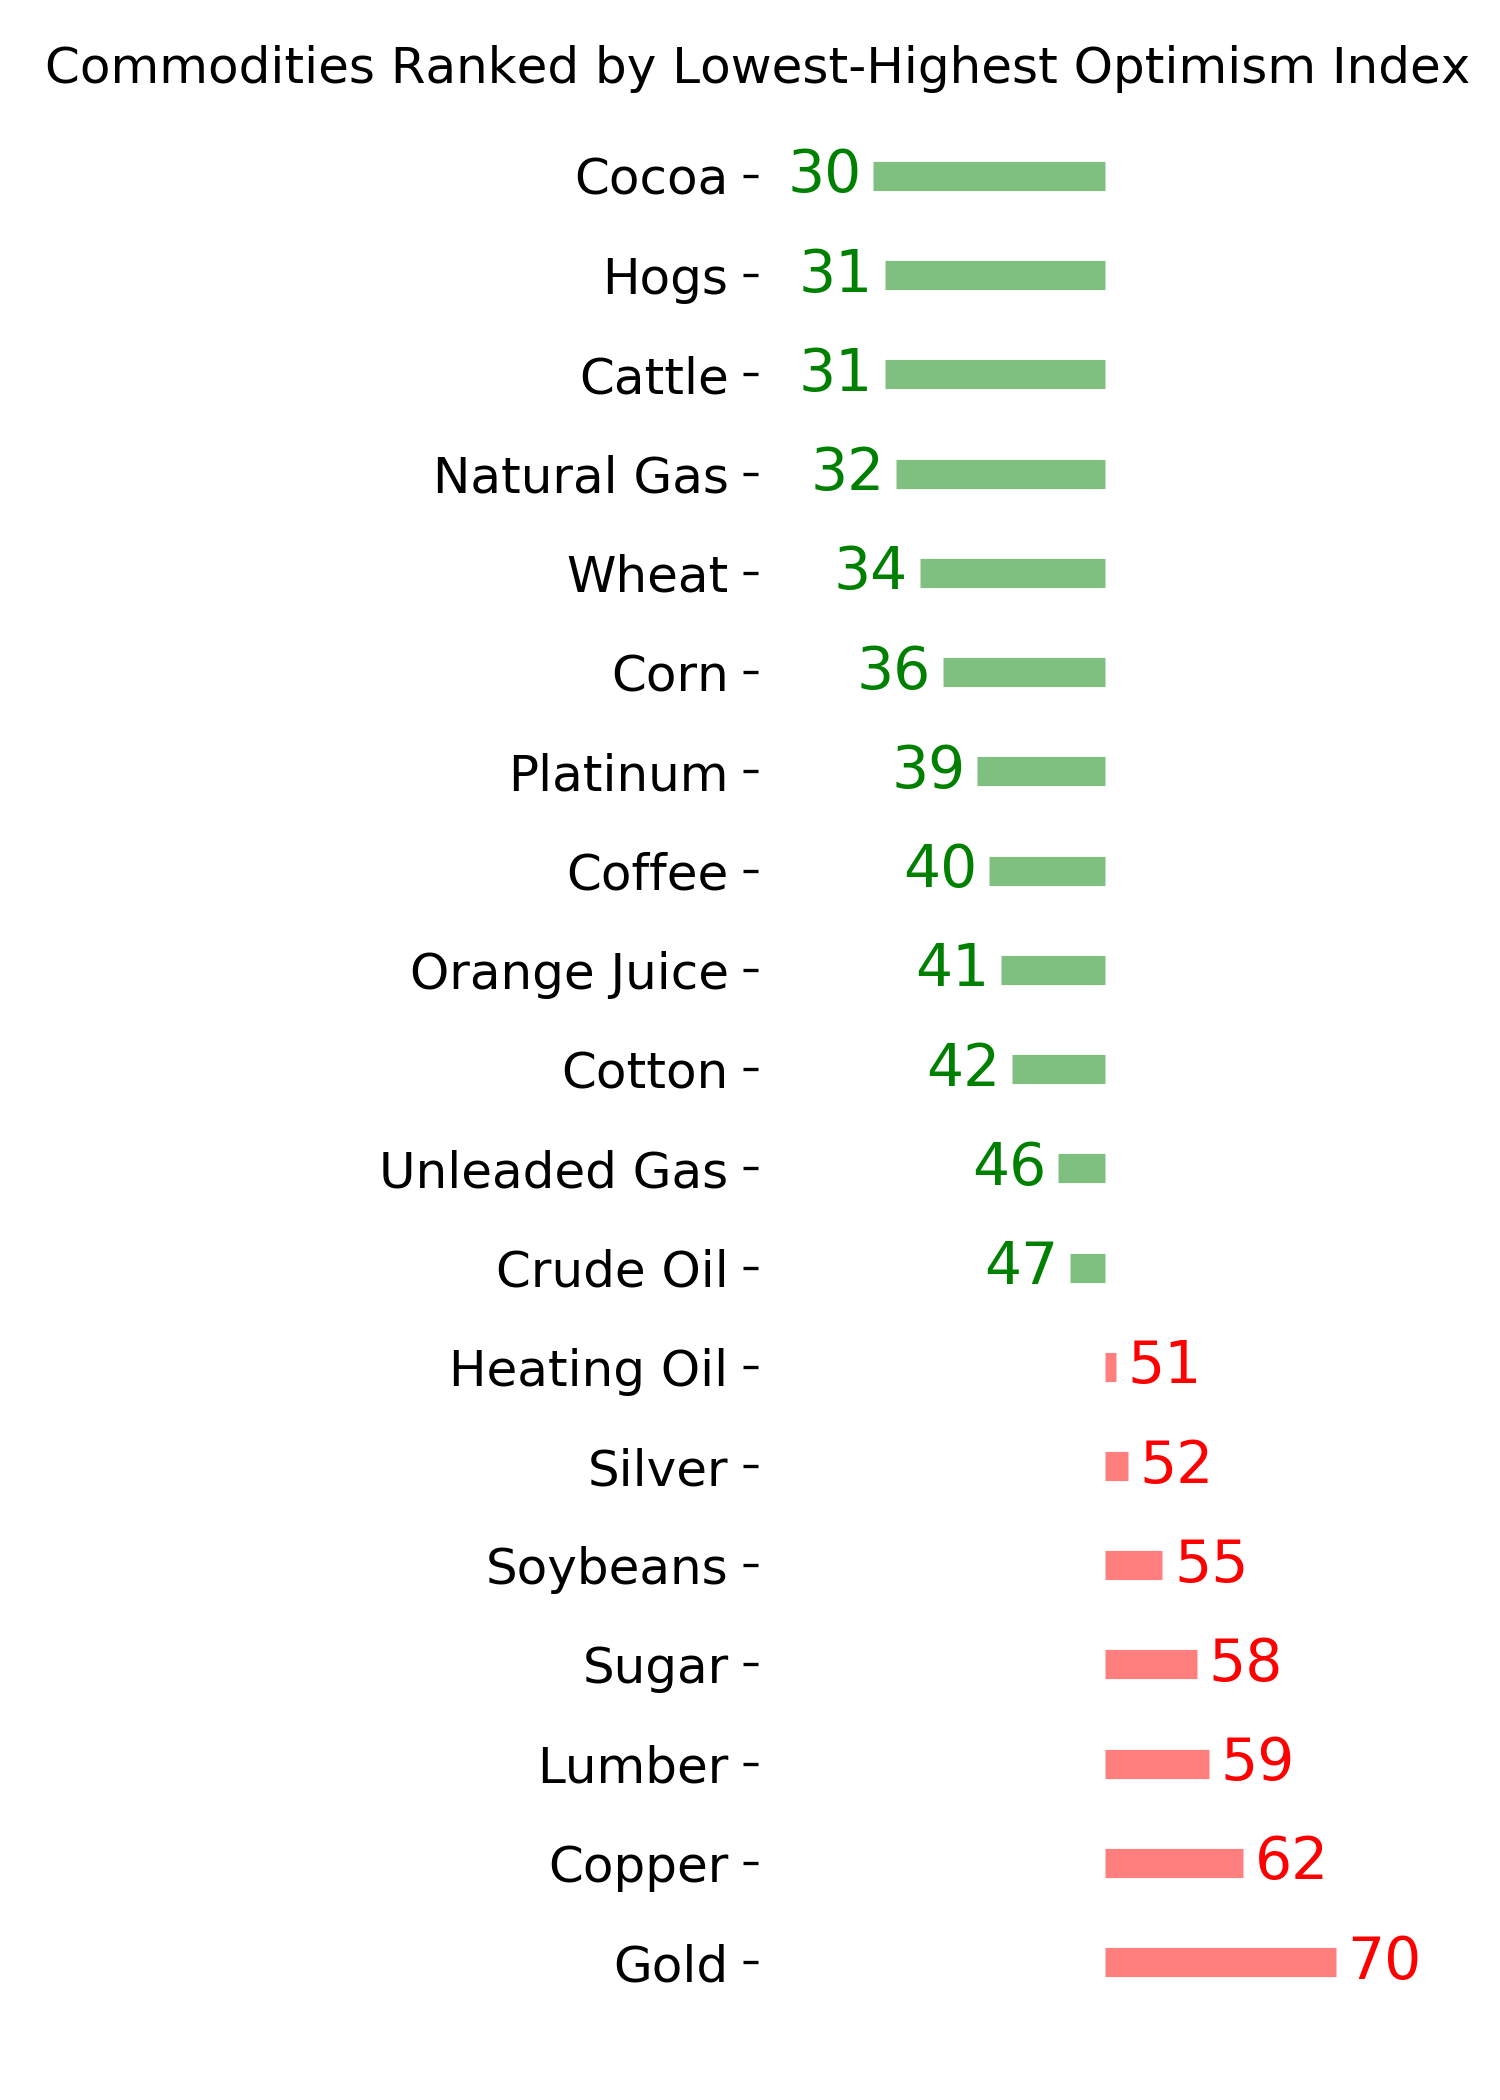
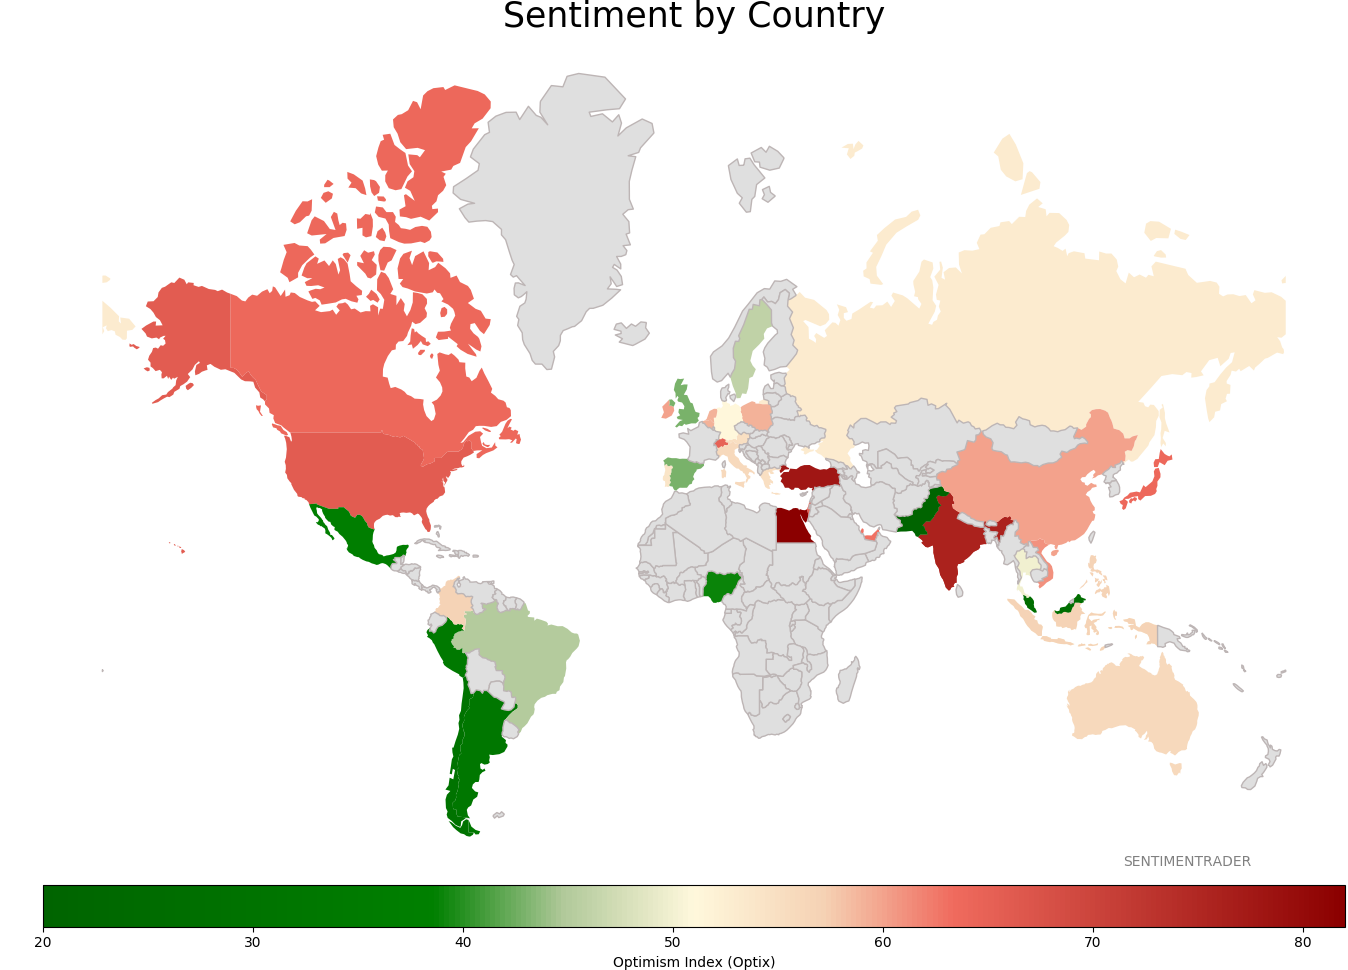
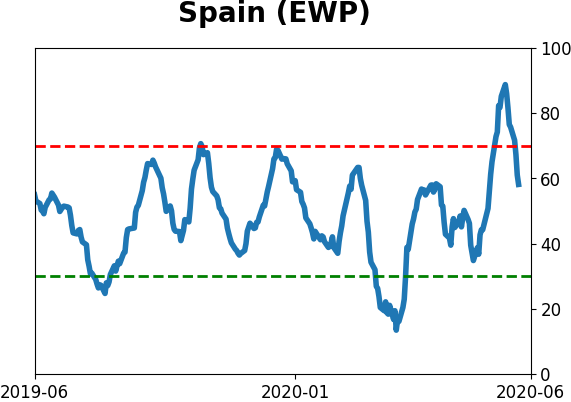
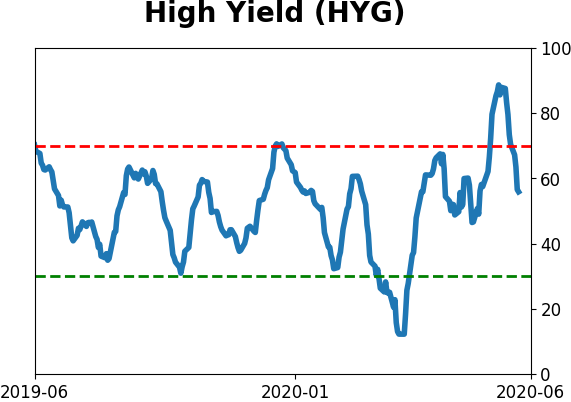
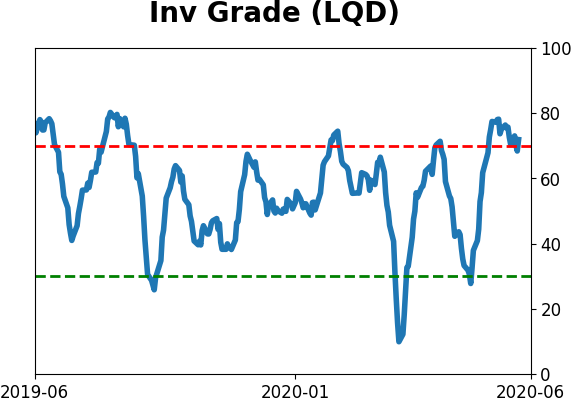
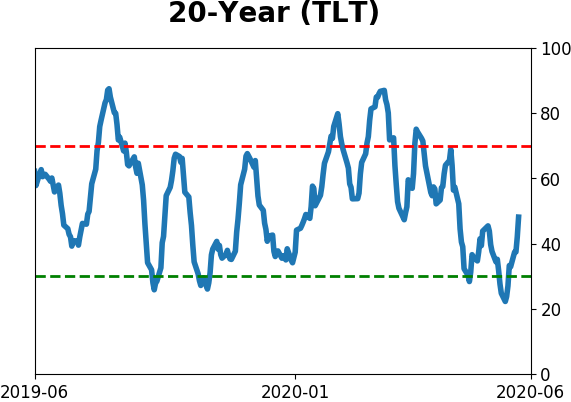
Sentiment Around The World
Optimism Index Thumbnails
|
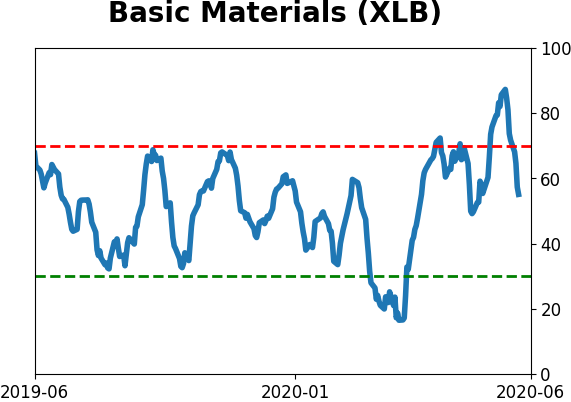
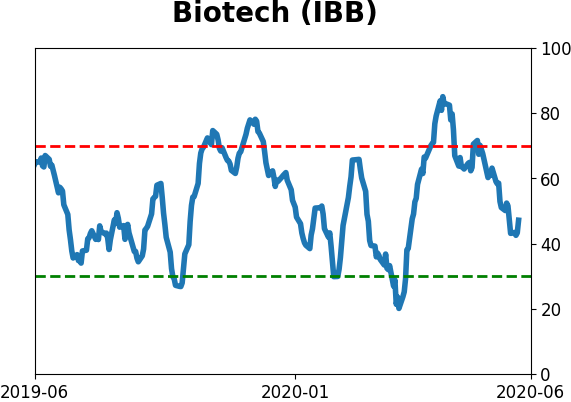
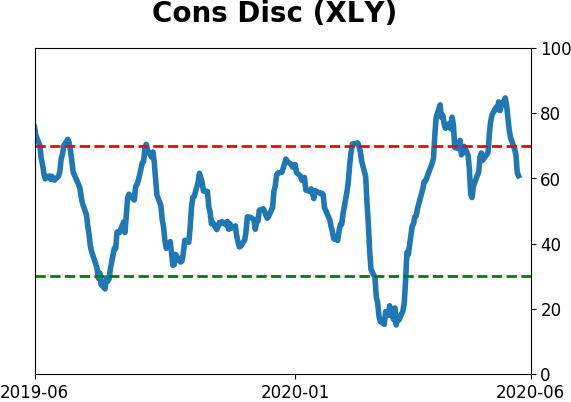
Sector ETF's - 10-Day Moving Average
|
|
|
Country ETF's - 10-Day Moving Average
|
|
|
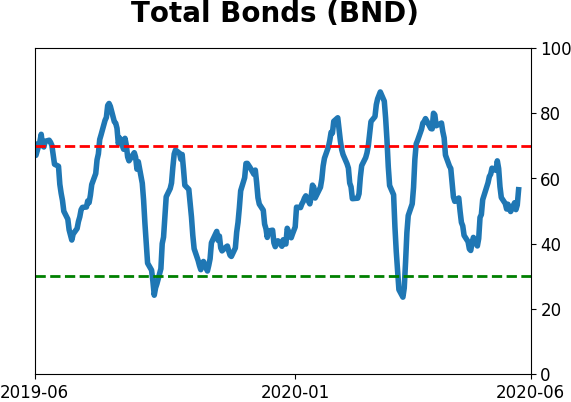
Bond ETF's - 10-Day Moving Average
|
|
|
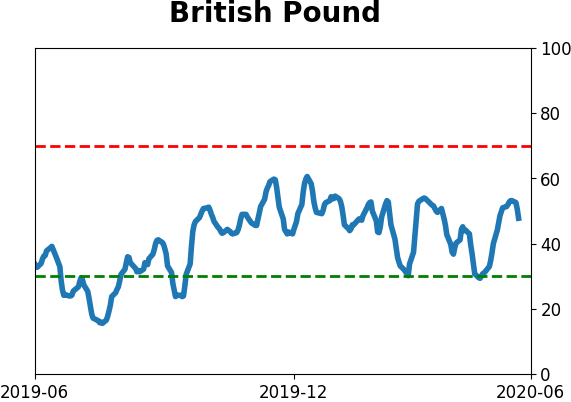
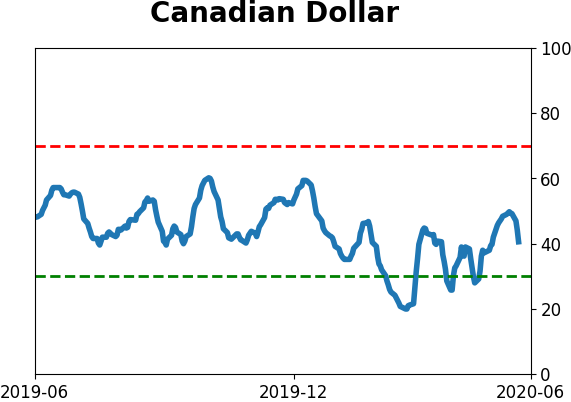
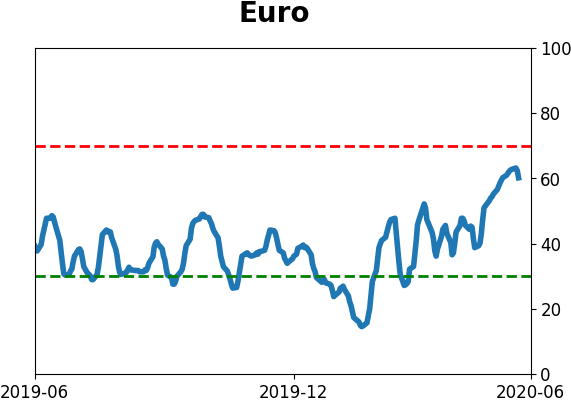
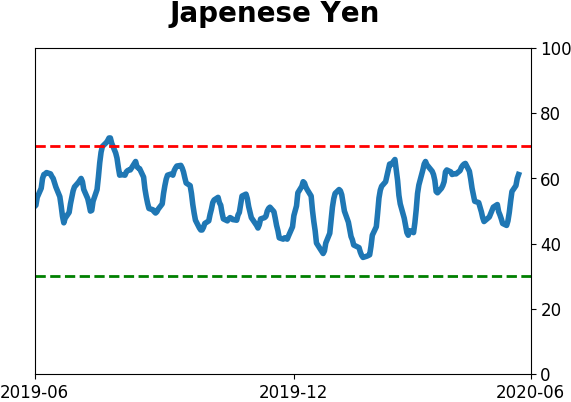
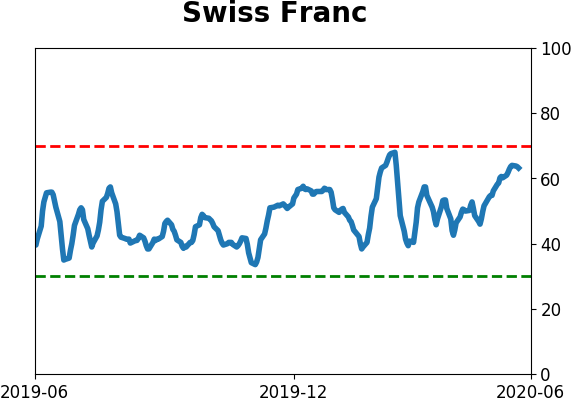
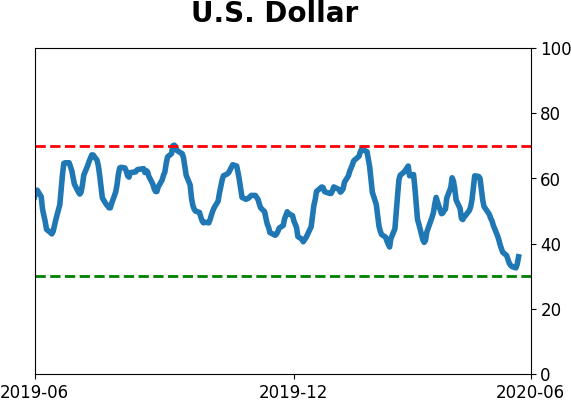
Currency ETF's - 5-Day Moving Average
|
|
|
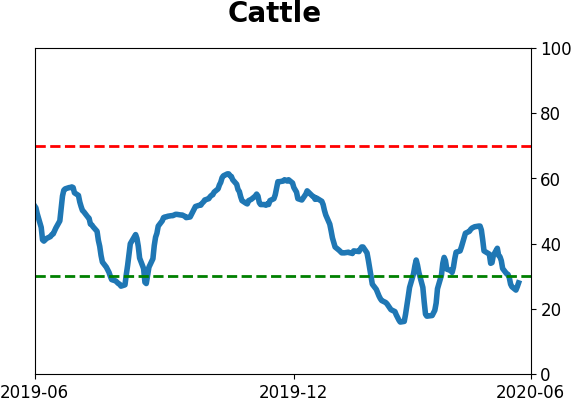
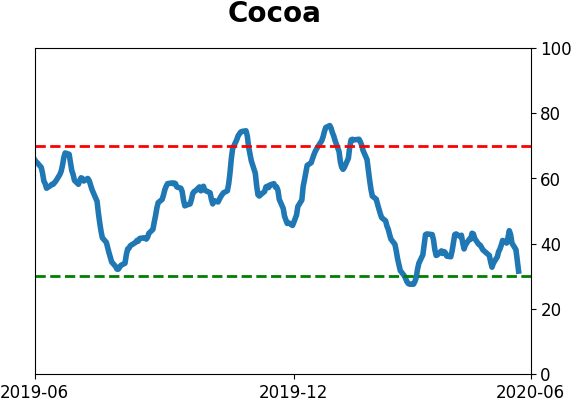
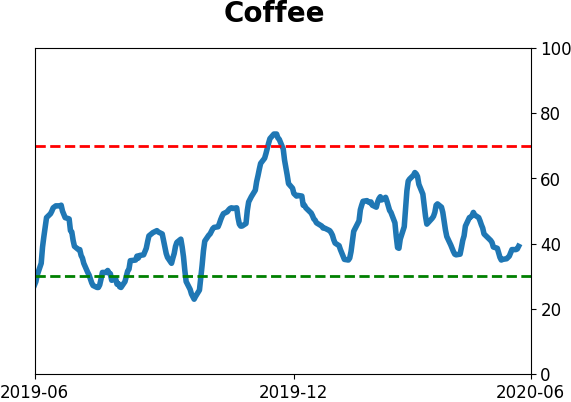
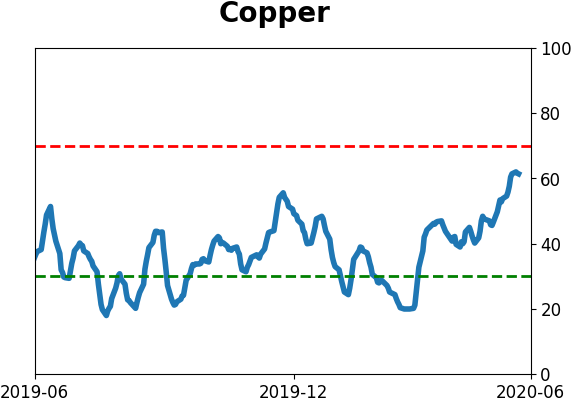
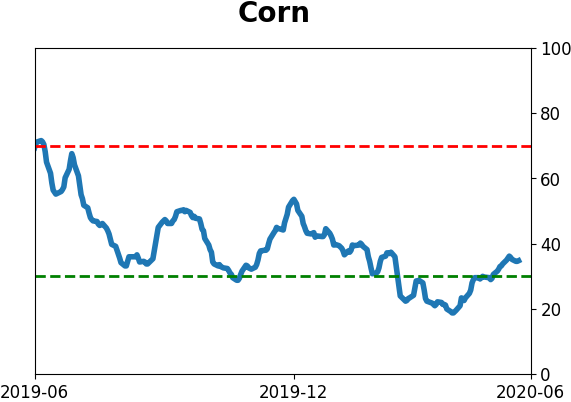
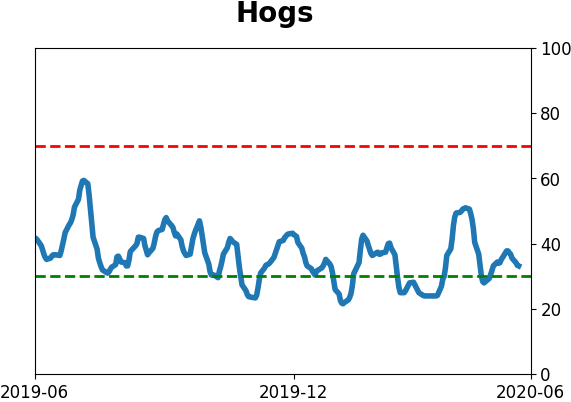
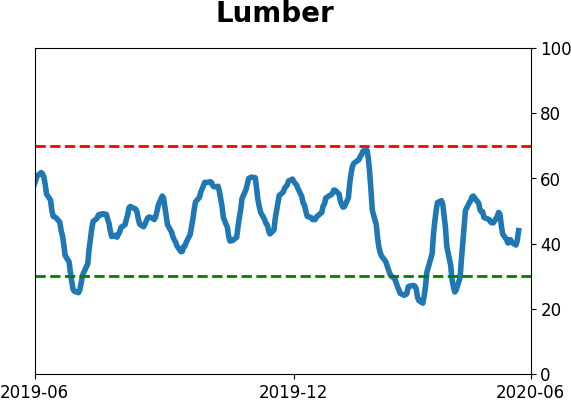
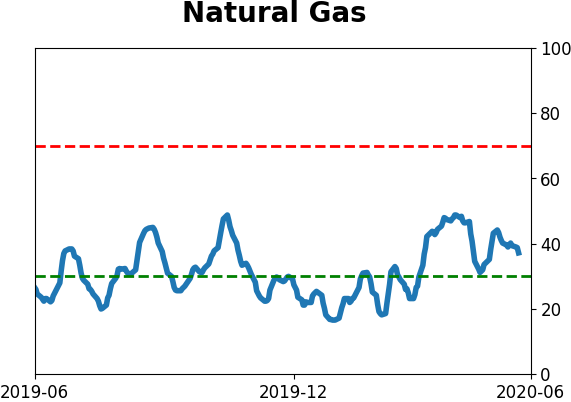
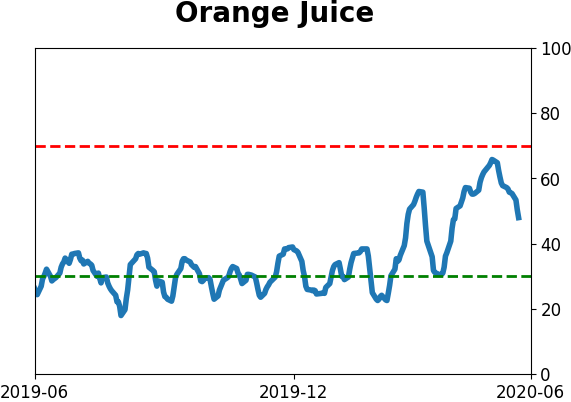
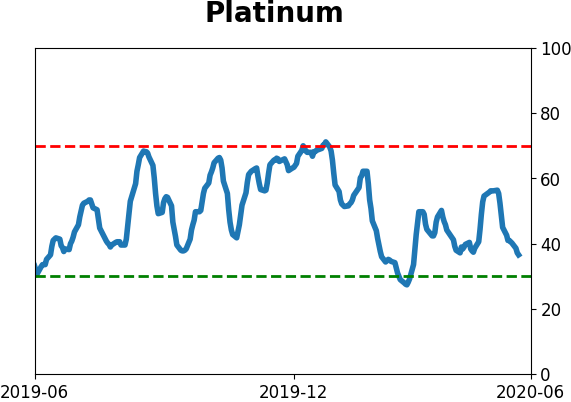
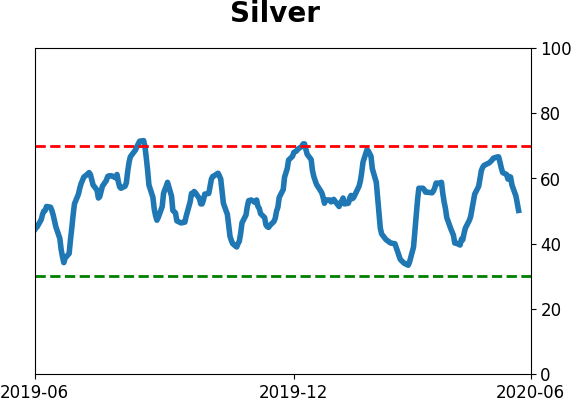
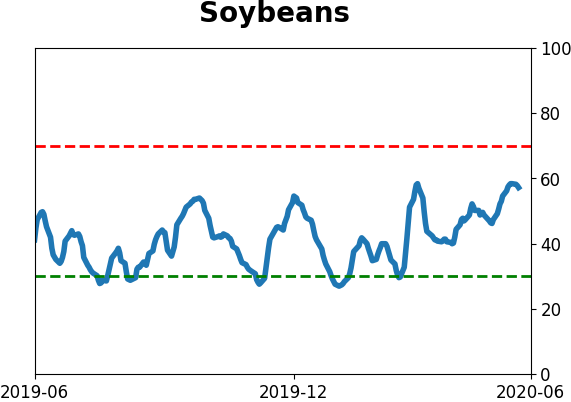
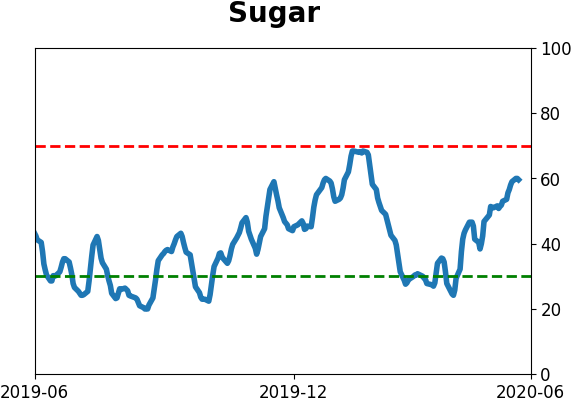
Commodity ETF's - 5-Day Moving Average
|
|