Headlines
|
|
Households Have Never Been More Exposed:
With the release of household finances for the first quarter, the Federal Reserve suggests that households are holding record allocations to stocks in terms of their total financial assets, and relative to the country's output. There is a strong negative correlation between this and future returns.
Bottom Line:
See the Outlook & Allocations page for more details on these summaries STOCKS: Hold
The speculative frenzy in February is wrung out. Internal dynamics have mostly held up, with some exceptions. Many of our studies still show a mixed to poor short-term view, with medium- and long-term ones turning more positive. BONDS: Hold
Various parts of the market got hit in March, with the lowest Bond Optimism Index we usually see during healthy environments. After a shaky couple of weeks, the broad bond market has modestly recovered. Not a big edge here either way. GOLD: Hold
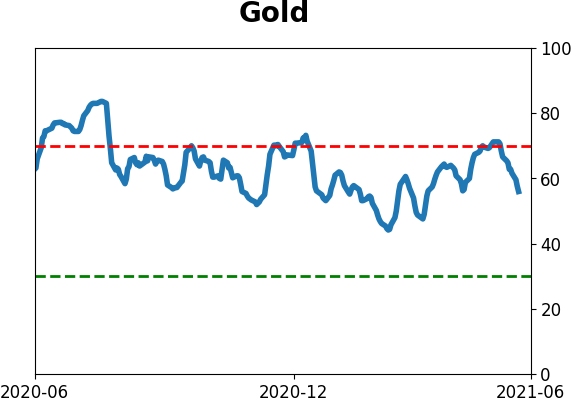
Gold and miners have done very well, recovering above long-term trend lines. The issue is that both have tended to perform poorly after similar situations - will have to wait and see how it plays out.
|
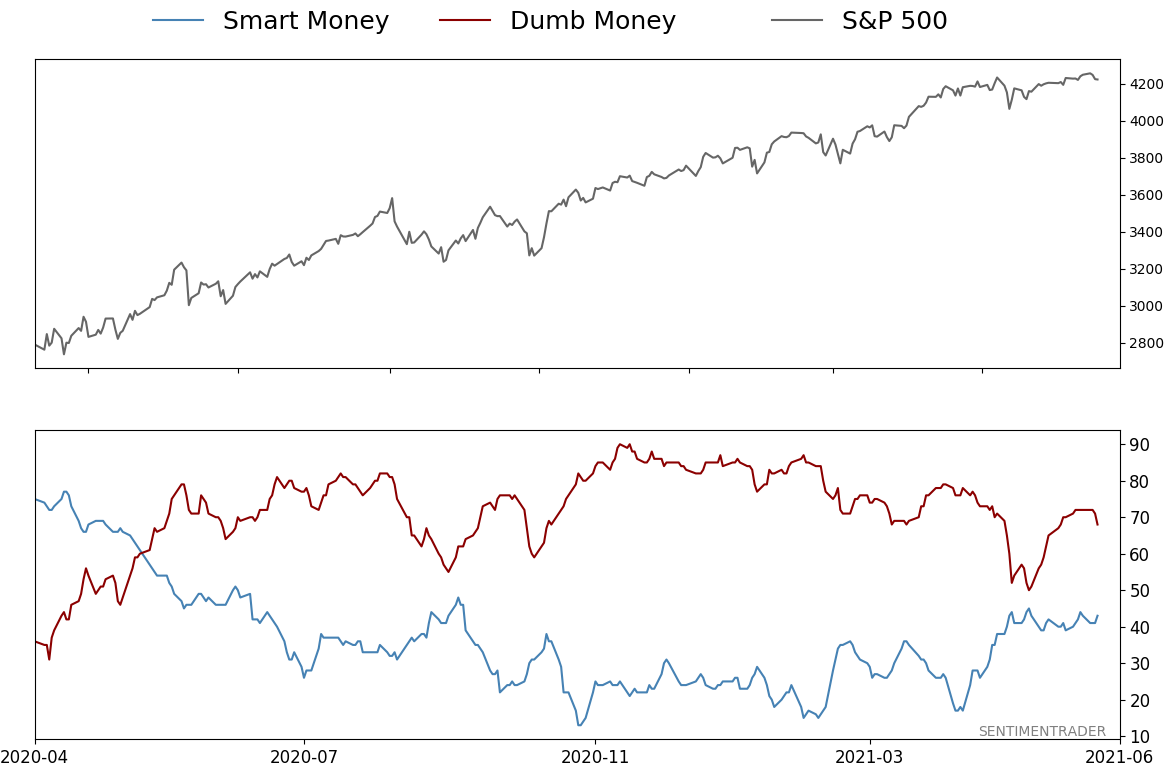
Smart / Dumb Money Confidence
|
Smart Money Confidence: 43%
Dumb Money Confidence: 68%
|
|
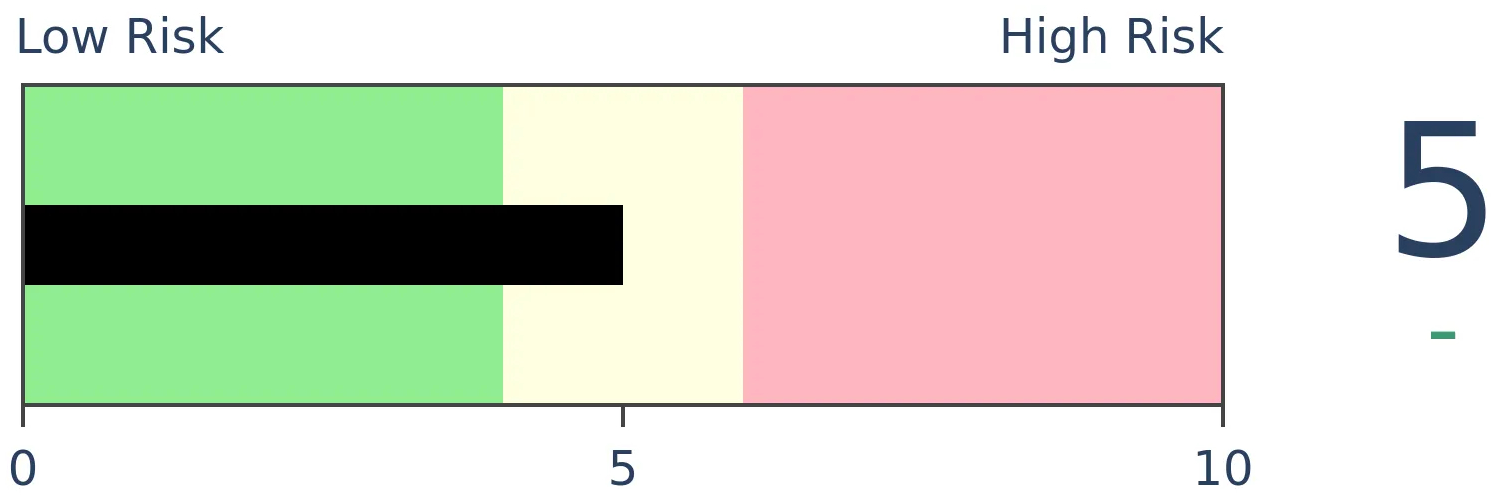
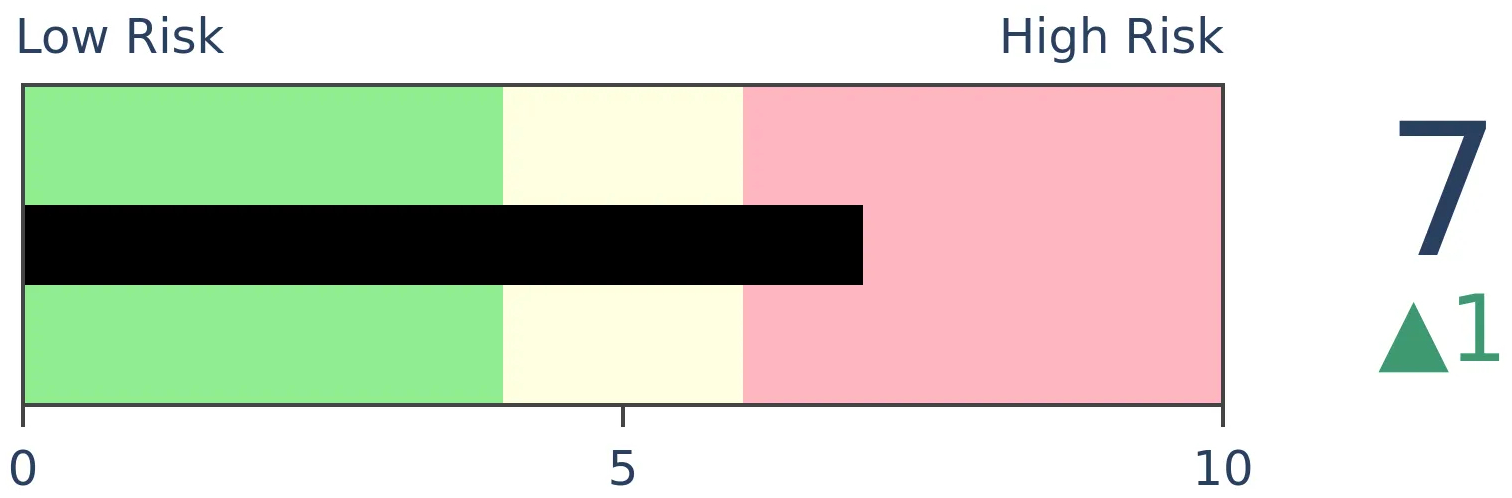
Risk Levels
Stocks Short-Term
|
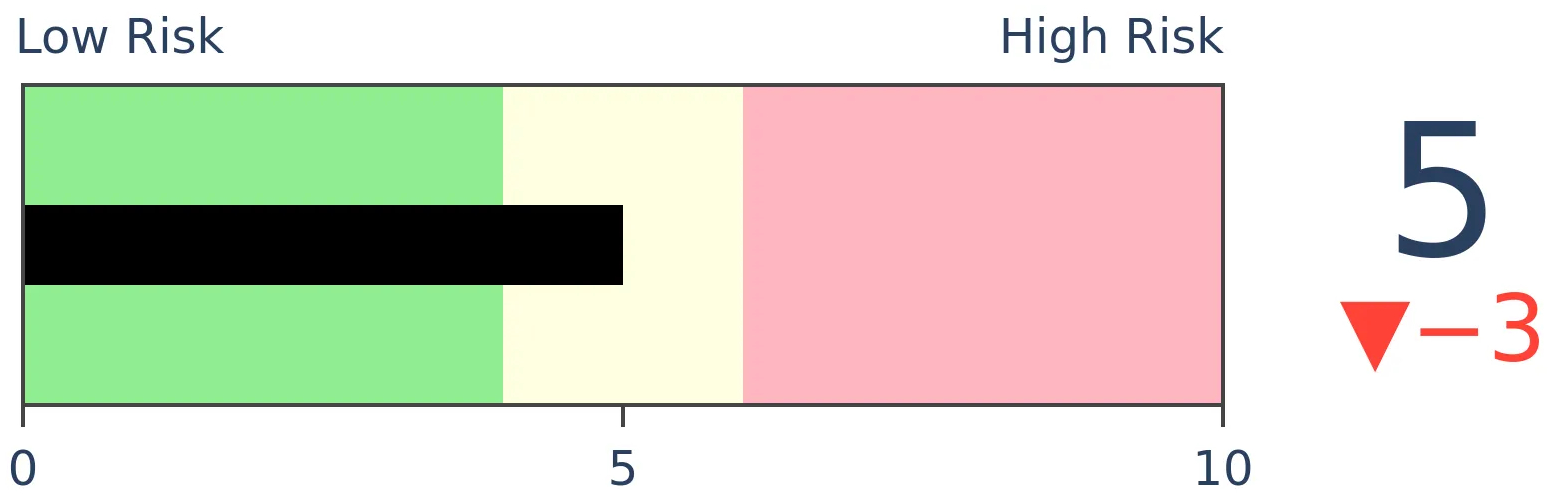
Stocks Medium-Term
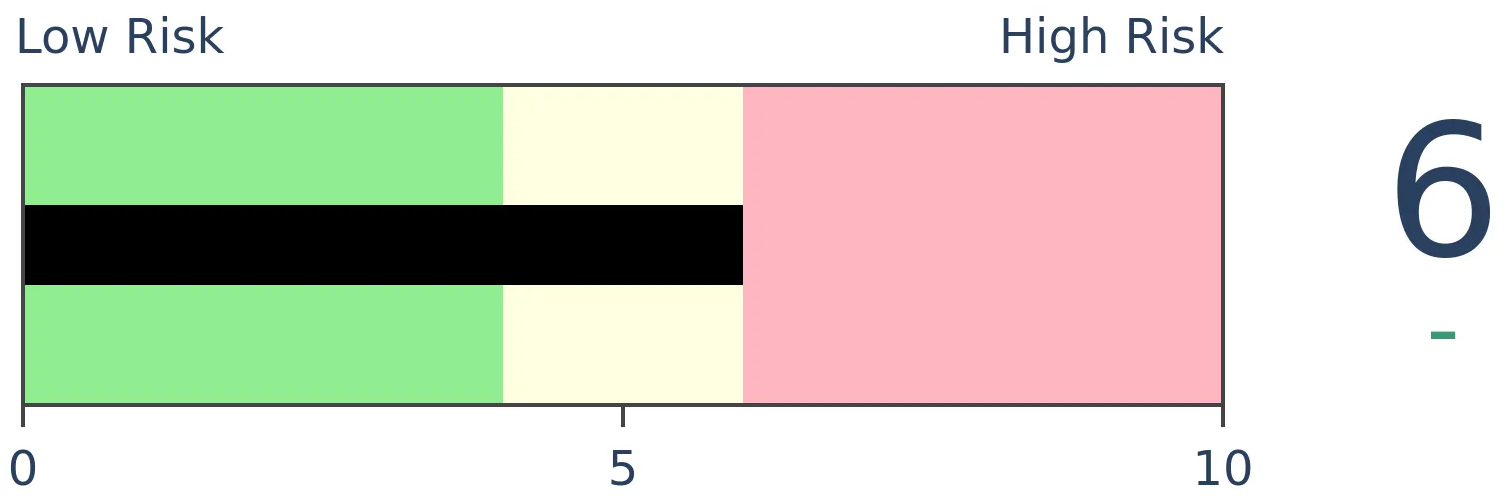
|
|
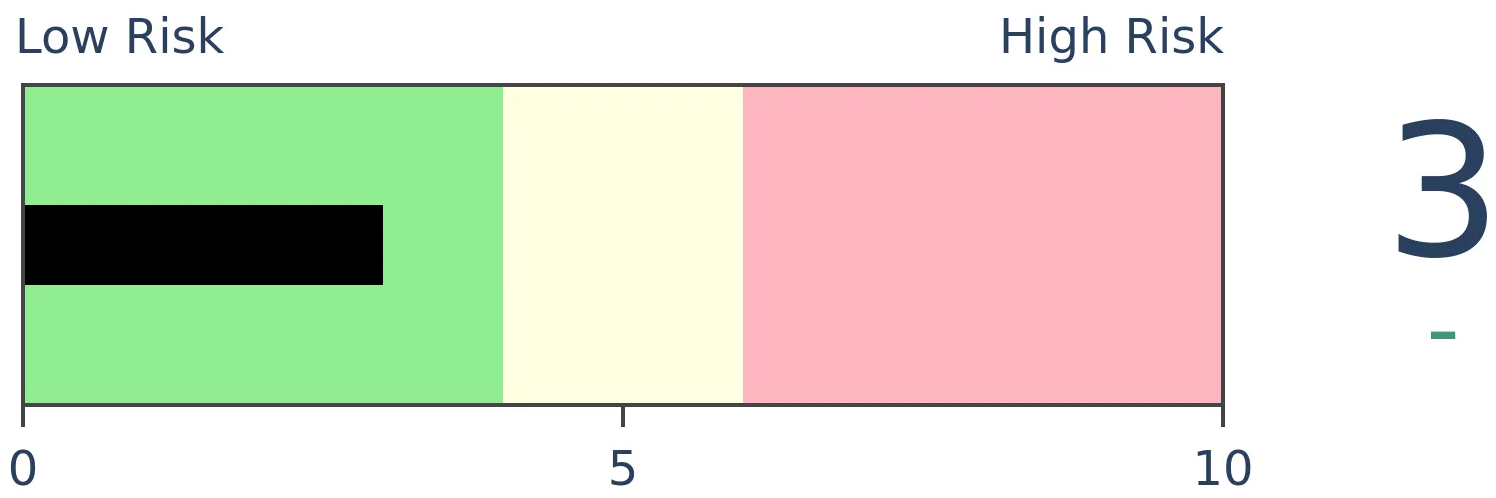
Bonds
|
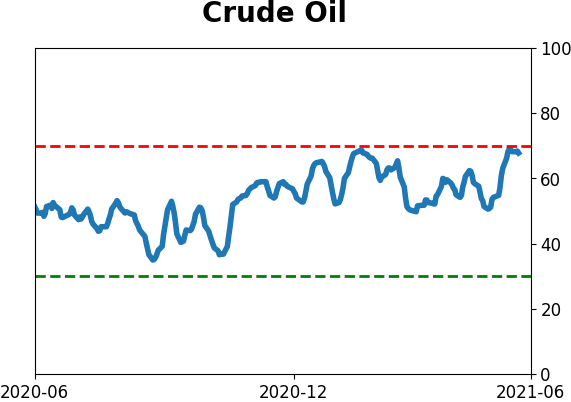
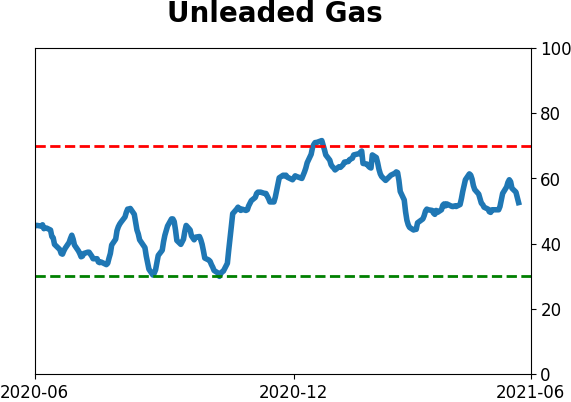
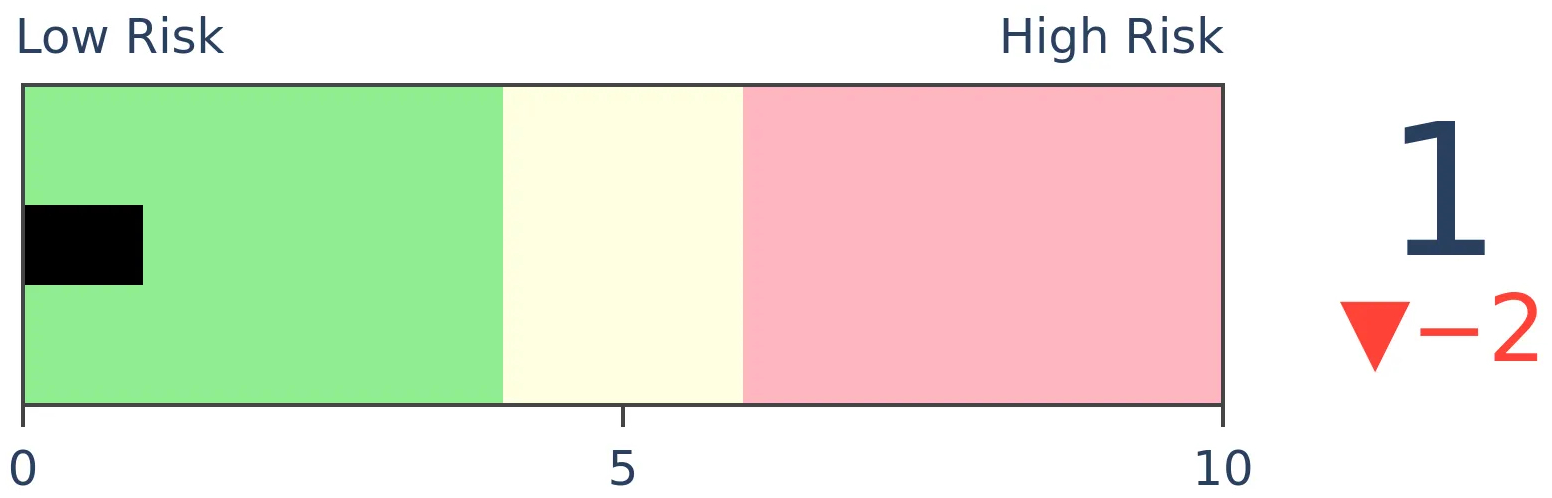
Crude Oil
|
|
Gold
|
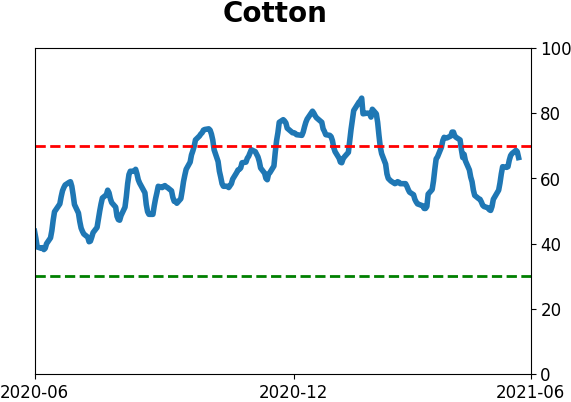
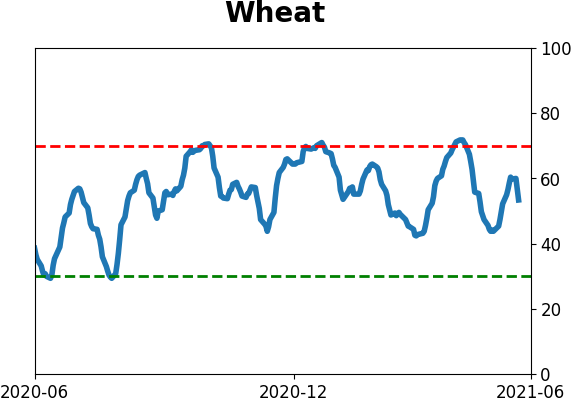
Agriculture
|
|
Research
BOTTOM LINE
With the release of household finances for the first quarter, the Federal Reserve suggests that households are holding record allocations to stocks in terms of their total financial assets, and relative to the country's output. There is a strong negative correlation between this and future returns.
FORECAST / TIMEFRAME
None
|
Consumers are flush, and they've got a whole lot riding on markets.
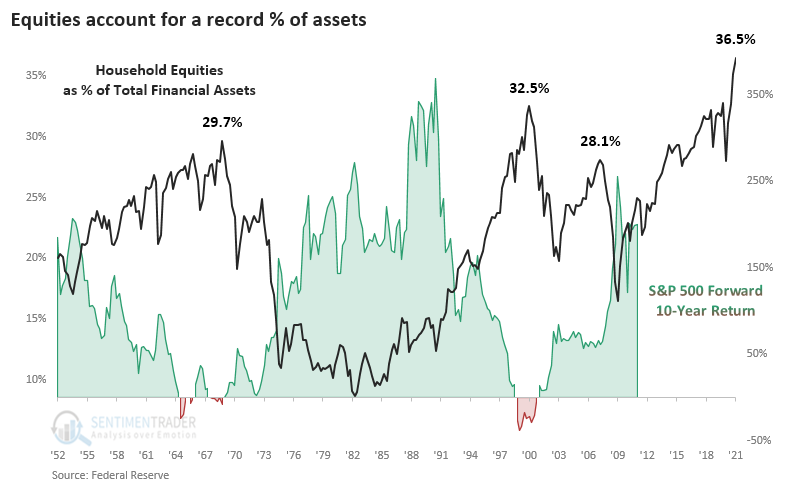
The latest Federal Reserve data on household assets, just released with a delay for Q1, shows that once again, equities have pushed to a record relative to all household financial assets. At 36.5% of all assets, mutual funds and equities account for a greater share than any point since at least 1952.
The chart below shows this measure against the S&P 500's return over the next decade. There has been a clear negative correlation, meaning that as households allocate more of their assets to stocks, future returns on those stocks decrease.
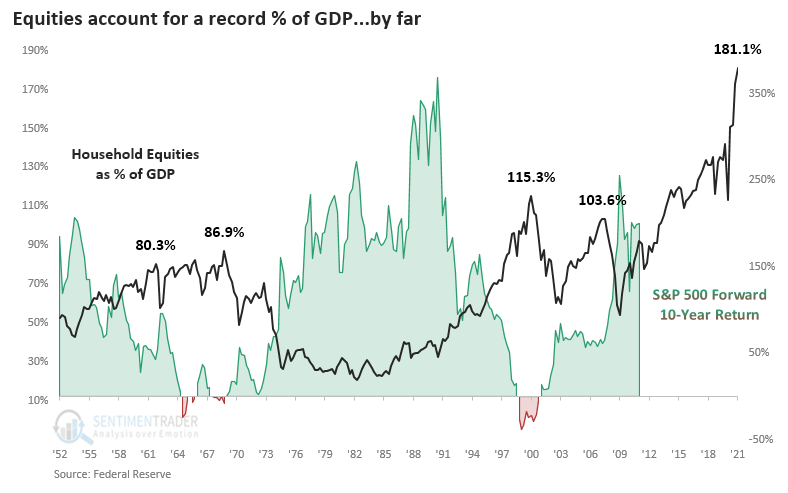
A similar look at the data shows the thing but in an even more extreme way. Relative to the country's output, stock holdings have soared and far surpass any historical extreme. Of course, it's been this way since 2015, so anyone using it as a bearish crutch has been hurting.
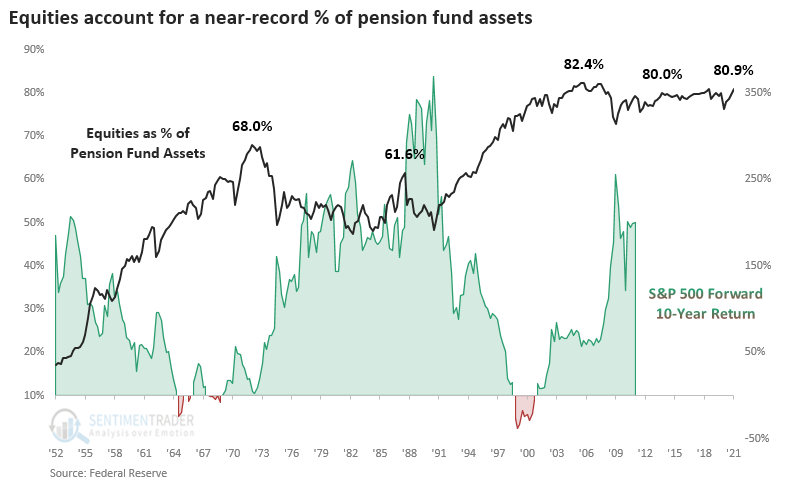
One of the largest asset allocators in the market, pension funds, also picked up their stock exposure. At nearly 81% of all assets, funds are nearing a record allocation to stocks. There hasn't been as consistent a negative correlation between these allocations and stocks' long-term forward returns, and it hasn't moved much in the past 20 years, gyrating between 70% - 83% of assets.
CORRELATIONS AND FORECASTS
If we focus on the first two charts, then the table below shows their correlation to the S&P 500's future returns across various time frames. There was a negative, but weak, correlation to returns up to a year later, then it increases consistently with the highest correlation being to 10-year returns.
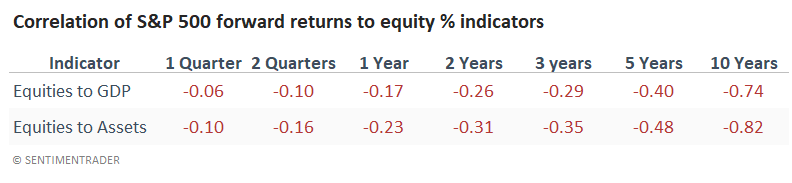
If we use these correlations to estimate the S&P's returns in the quarters ahead, then it's not a pretty picture. This should be a surprise since the indicators are at all-time highs.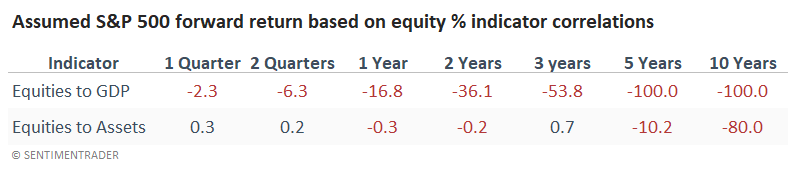
Taking this literally would be silly. Stocks probably aren't going to zero just because households have a record amount of assets allocated to them. It's just a reminder that high allocations to any asset tend to precede poor returns in that very asset. Given the record allocations to stocks in Q1, which likely got even more extreme in Q2, it's a sobering thought that traders might have more of an advantage than investors in the years ahead.
NOT ANY SAFE HAVENS
There weren't many sectors that did well after peaks in the Equity / GDP Ratio. It's not a big surprise that the ones that held up the best tended to be more defensive. Returns in the table are shifted forward by one quarter to account for lag in the data.
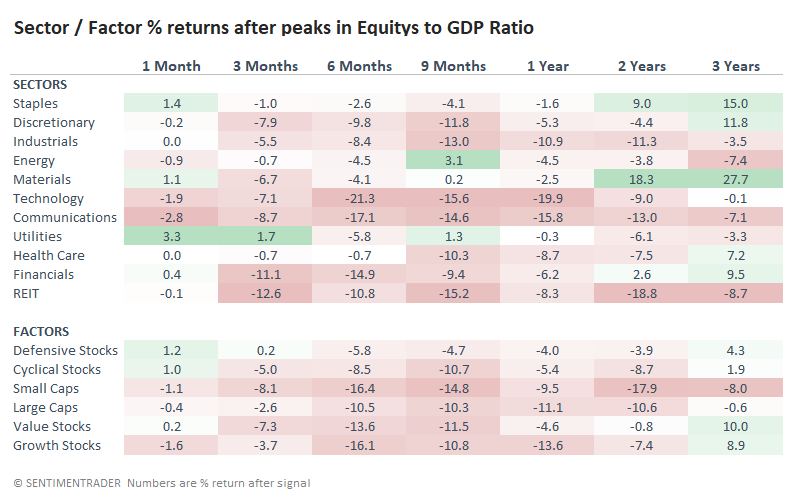
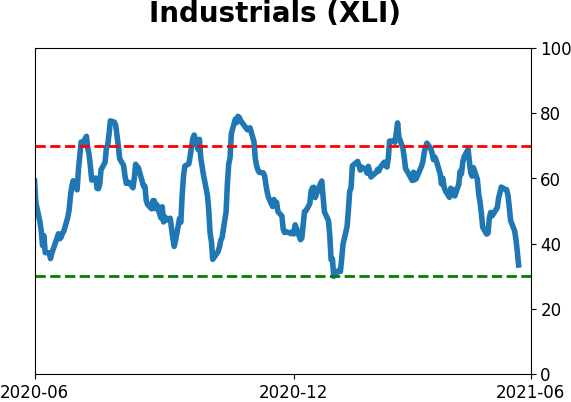
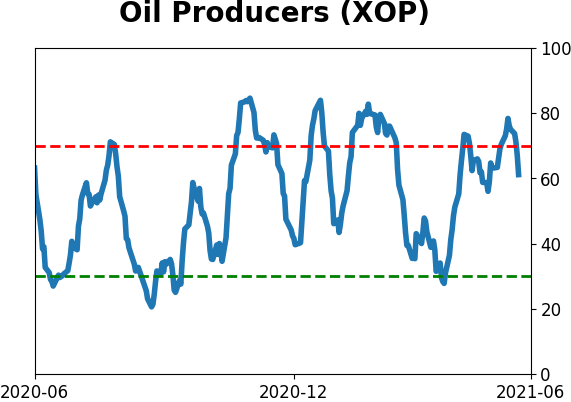
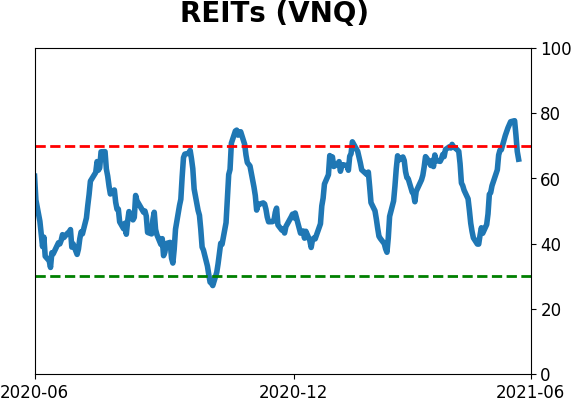
Most of the "least bad" returns were in Staples, Energy, and Utilities. The worst were in Industrials, Technology, Communications, and REITs.
We don't know if these stock allocations have peaked - it's almost certain that they have not. So it's premature to rely too much on these results. And while it's been a worry for while, the record allocations to stocks is becoming even more concerning with each release. Perhaps it won't matter as much since household balance sheets are in good condition, with high cash levels and relatively low debt service ratios, allowing them to take a loss on investments without panic-selling. But that gets into guessing, and we'd rather just take the data as it comes.
Active Studies
| Time Frame | Bullish | Bearish | | Short-Term | 0 | 1 | | Medium-Term | 2 | 12 | | Long-Term | 11 | 5 |
|
Indicators at Extremes
Portfolio
| Position | Description | Weight % | Added / Reduced | Date | | Stocks | RSP | 4.1 | Added 4.1% | 2021-05-19 | | Bonds | 23.9% BND, 6.9% SCHP | 30.7 | Reduced 7.1% | 2021-05-19 | | Commodities | GCC | 2.6 | Reduced 2.1%
| 2020-09-04 | | Precious Metals | GDX | 5.6 | Reduced 4.2% | 2021-05-19 | | Special Situations | 4.3% XLE, 2.2% PSCE | 7.6 | Reduced 5.6% | 2021-04-22 | | Cash | | 49.4 | | |
|
Updates (Changes made today are underlined)
Much of our momentum and trend work has remained positive for several months, with some scattered exceptions. Almost all sentiment-related work has shown a poor risk/reward ratio for stocks, especially as speculation drove to record highs in exuberance in February. Much of that has worn off, and most of our models are back toward neutral levels. There isn't much to be excited about here. The same goes for bonds and even gold. Gold has been performing well lately and is back above long-term trend lines. The issue is that it has a poor record of holding onto gains when attempting a long-term trend change like this, so we'll take a wait-and-see approach. RETURN YTD: 9.1% 2020: 8.1%, 2019: 12.6%, 2018: 0.6%, 2017: 3.8%, 2016: 17.1%, 2015: 9.2%, 2014: 14.5%, 2013: 2.2%, 2012: 10.8%, 2011: 16.5%, 2010: 15.3%, 2009: 23.9%, 2008: 16.2%, 2007: 7.8%
|
|
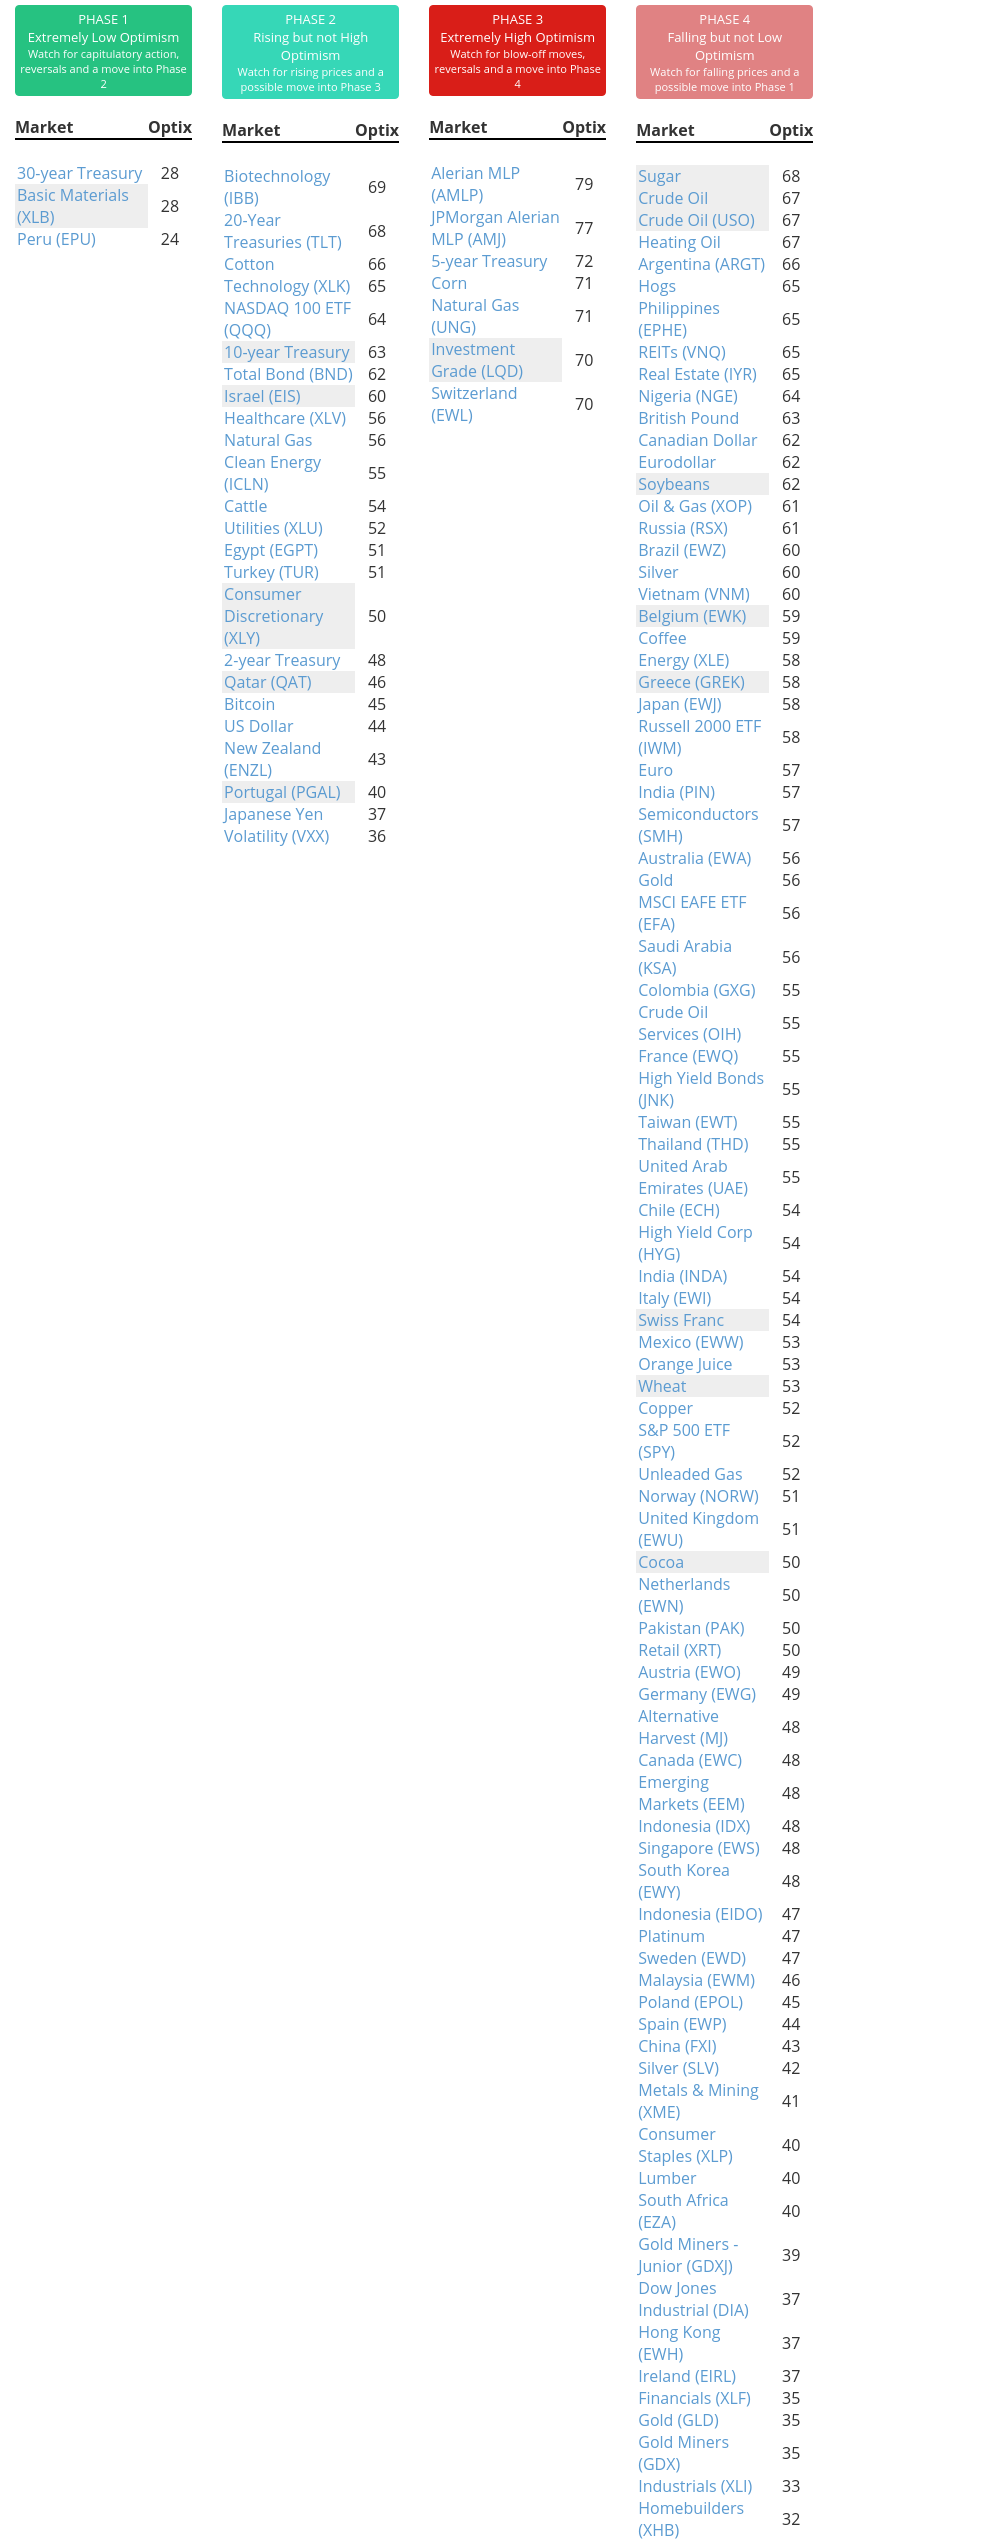
Phase Table
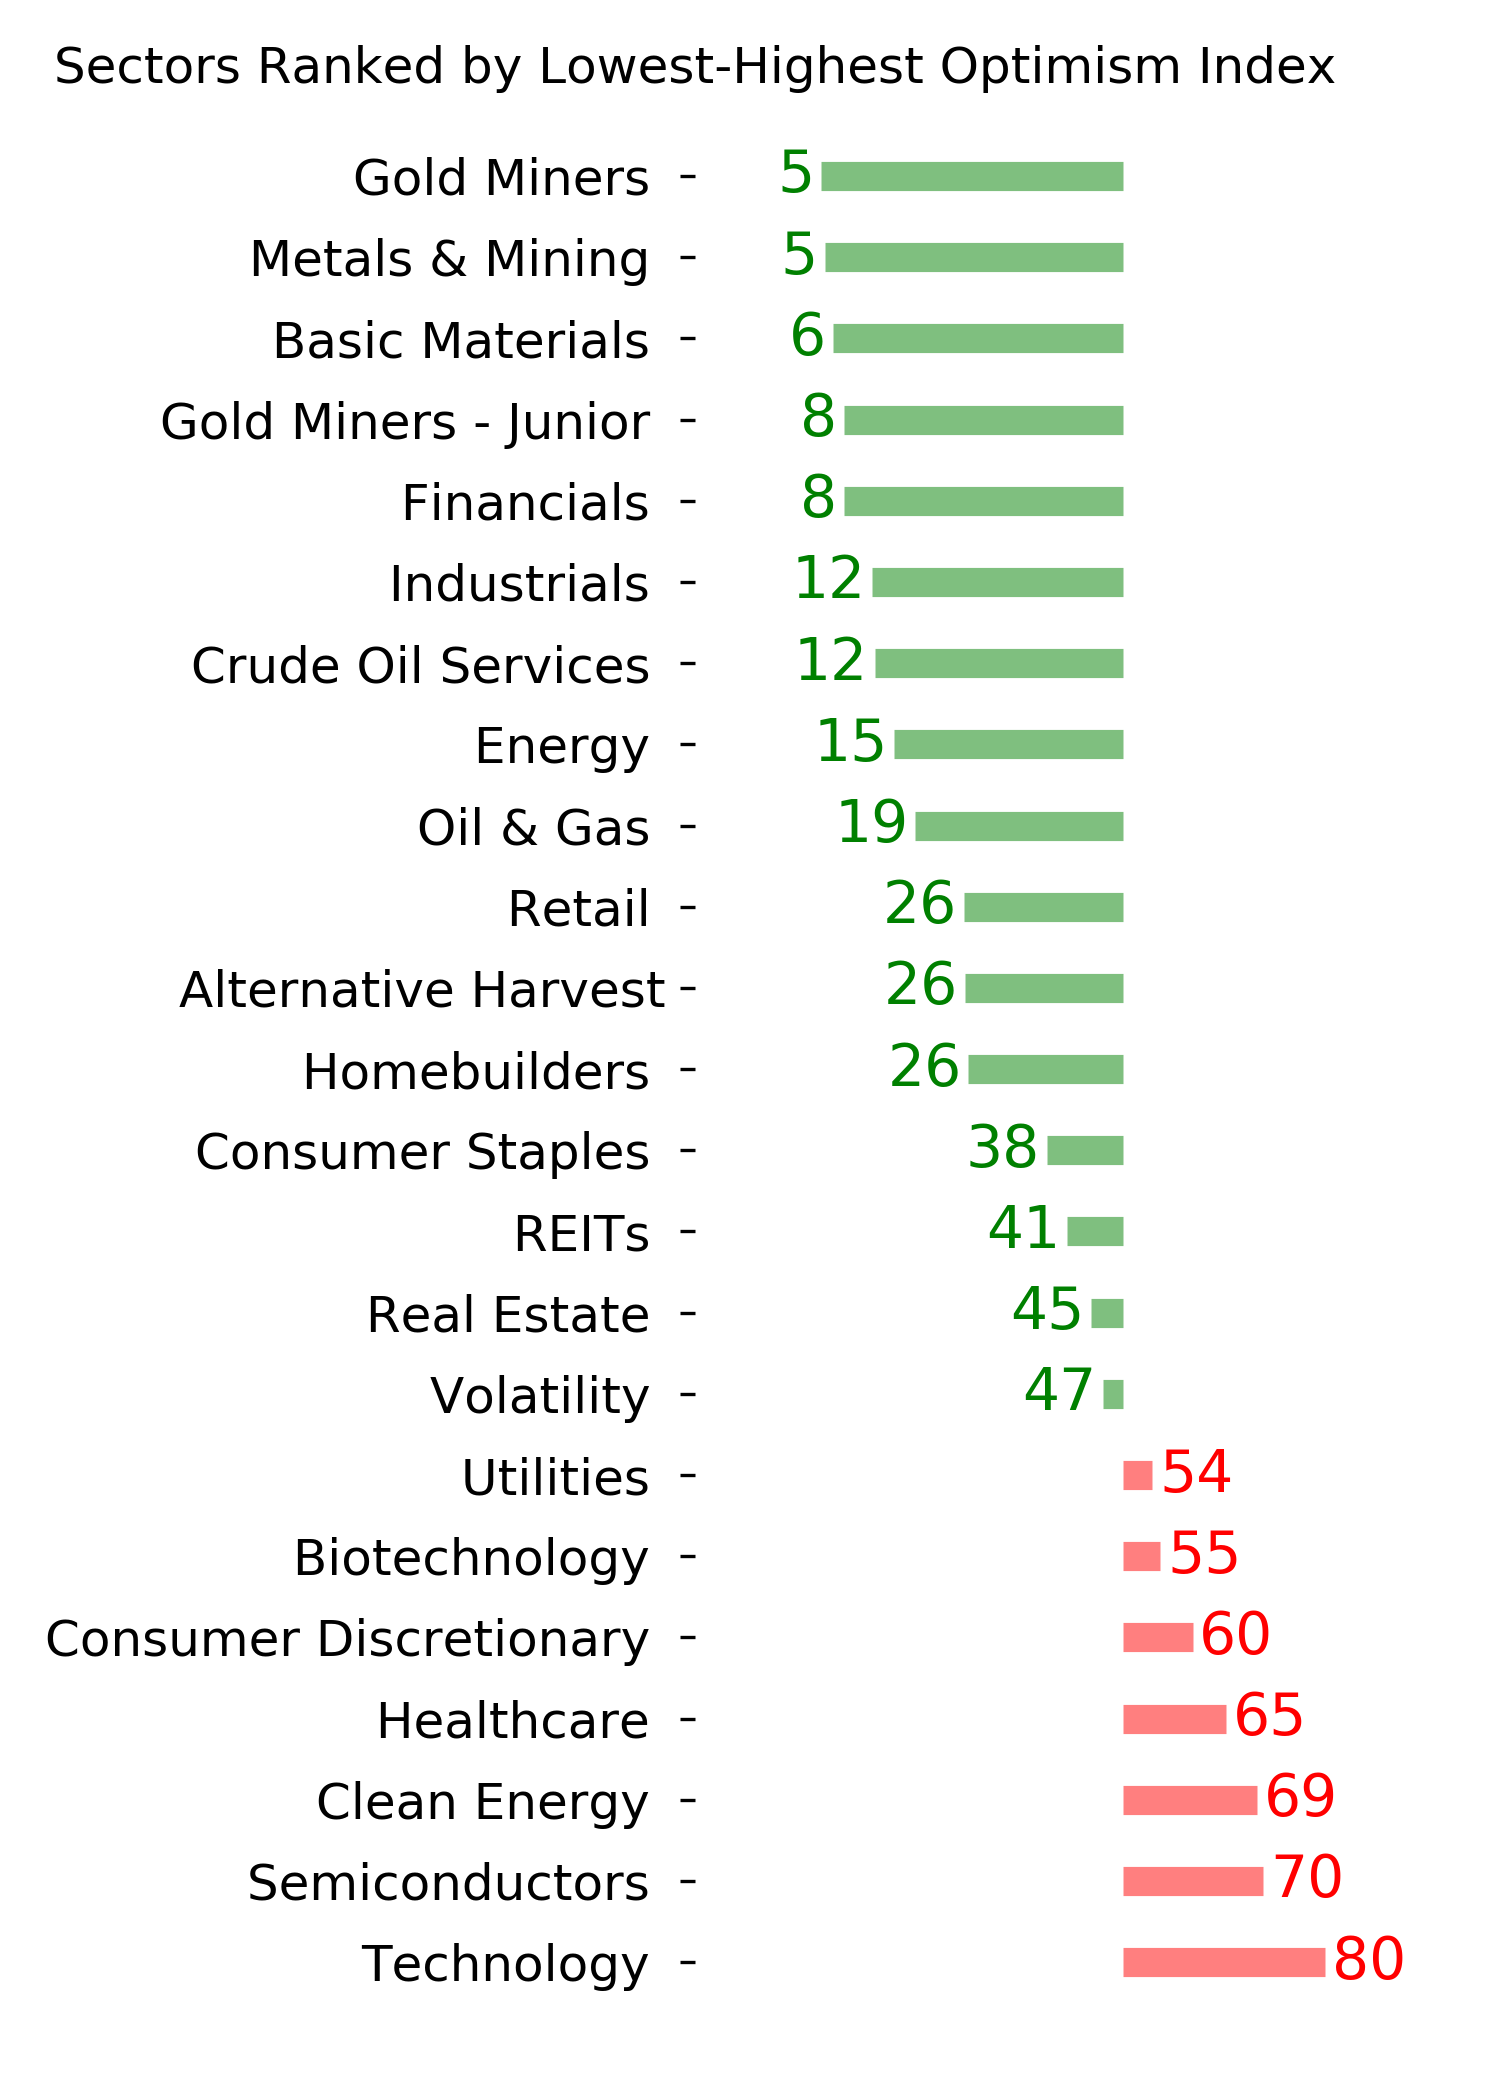
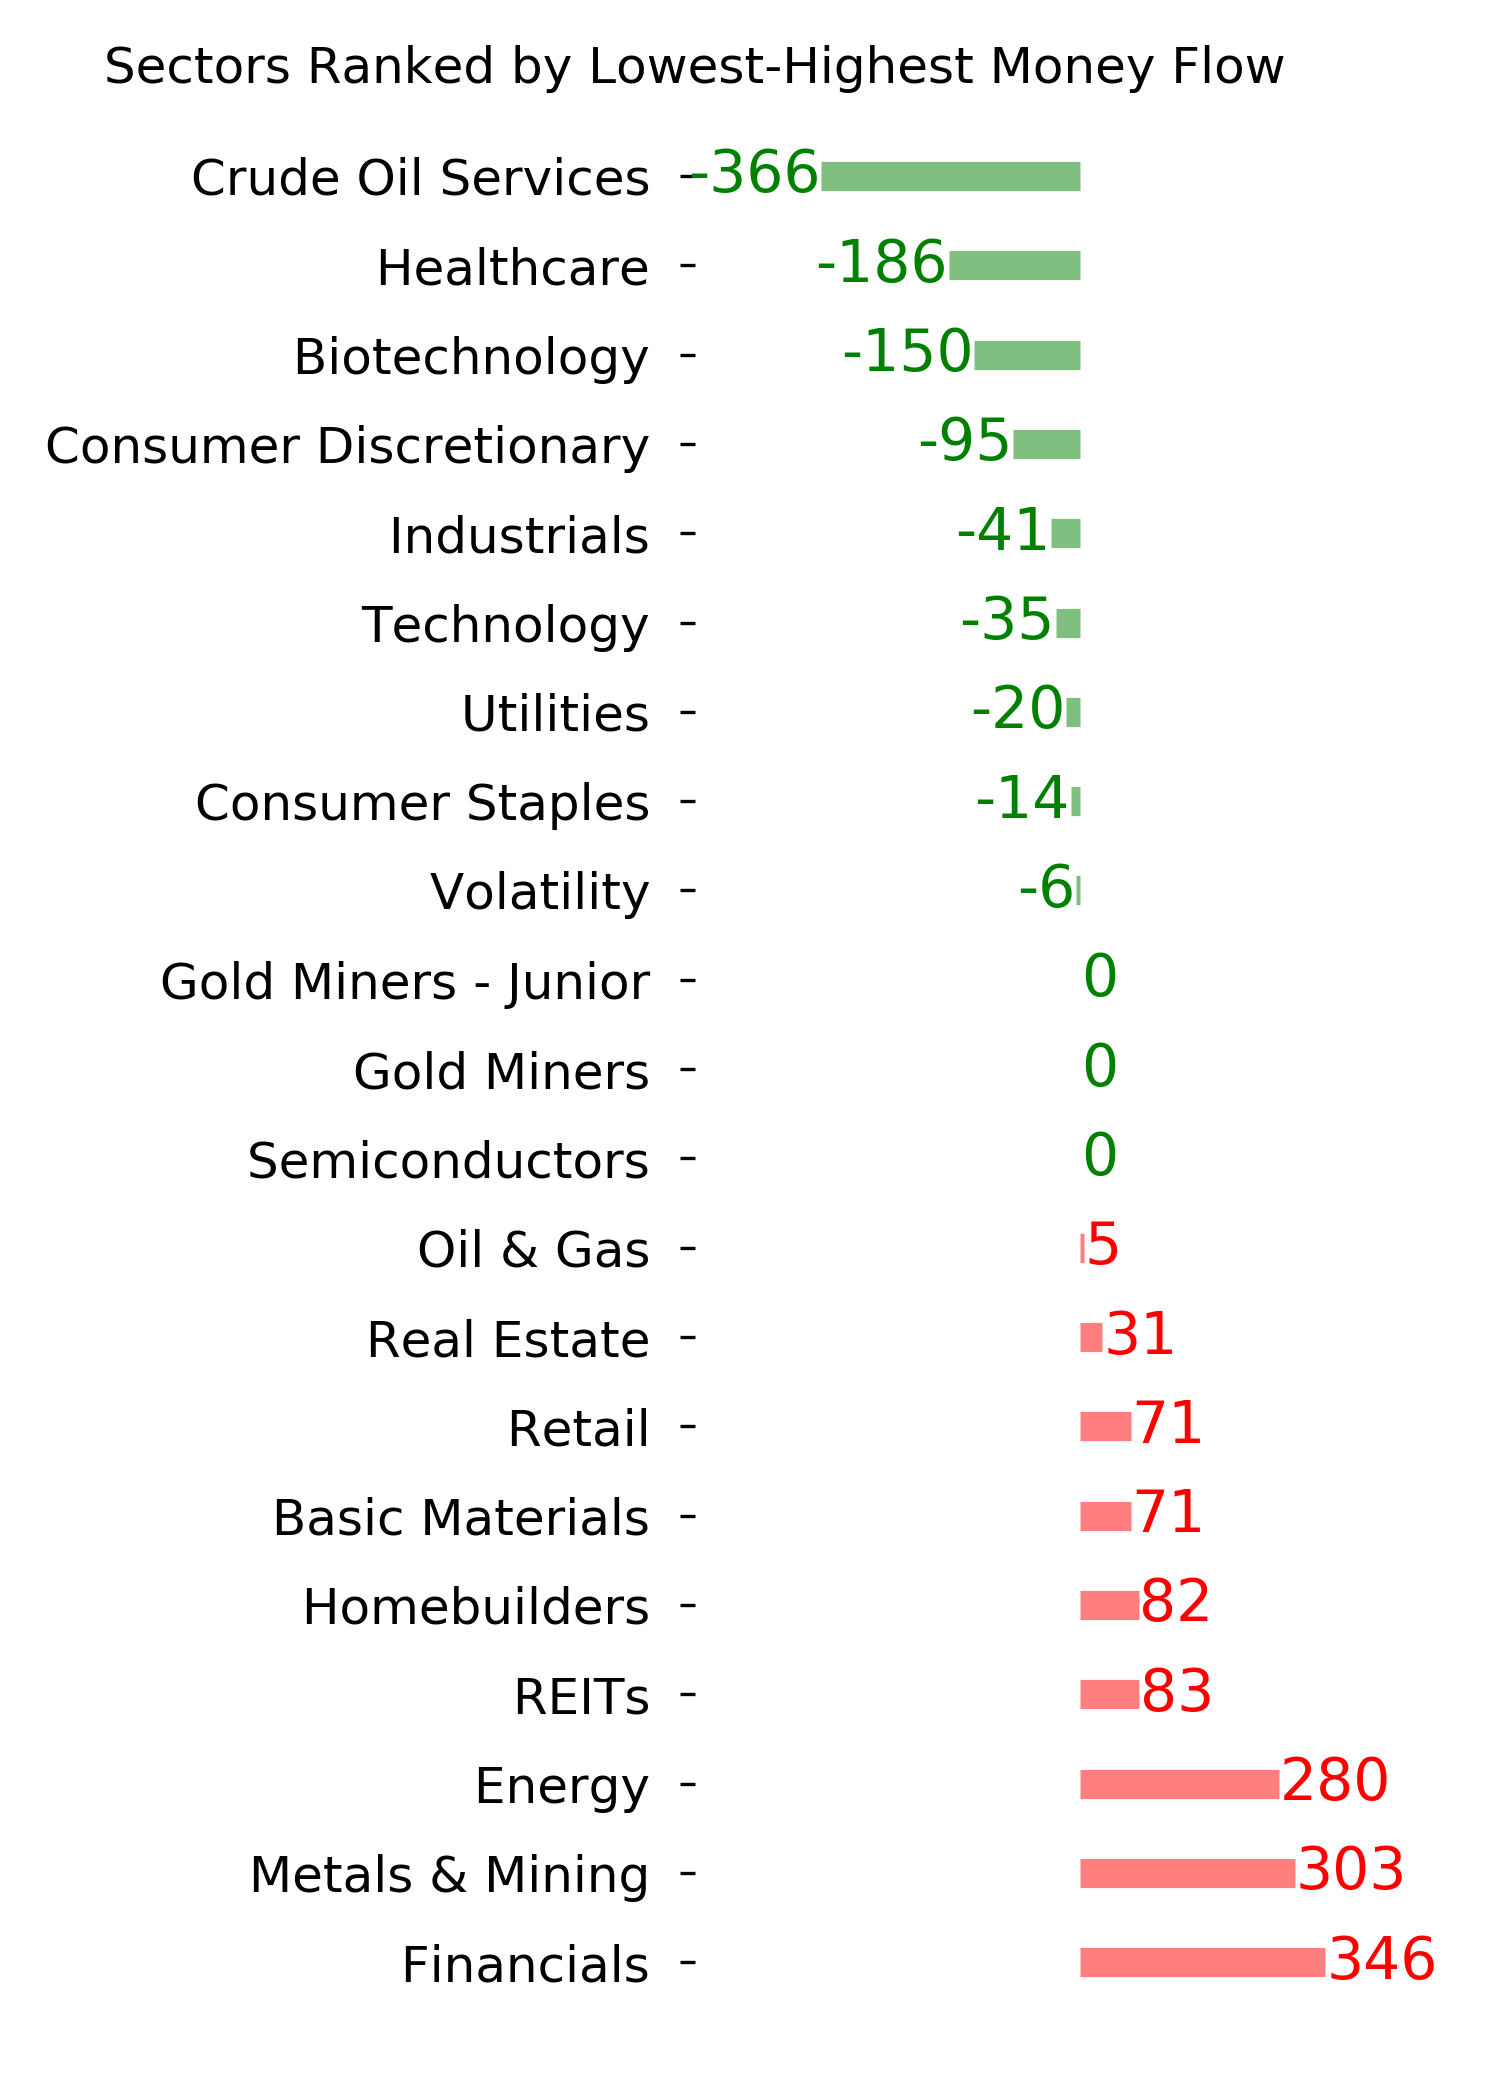
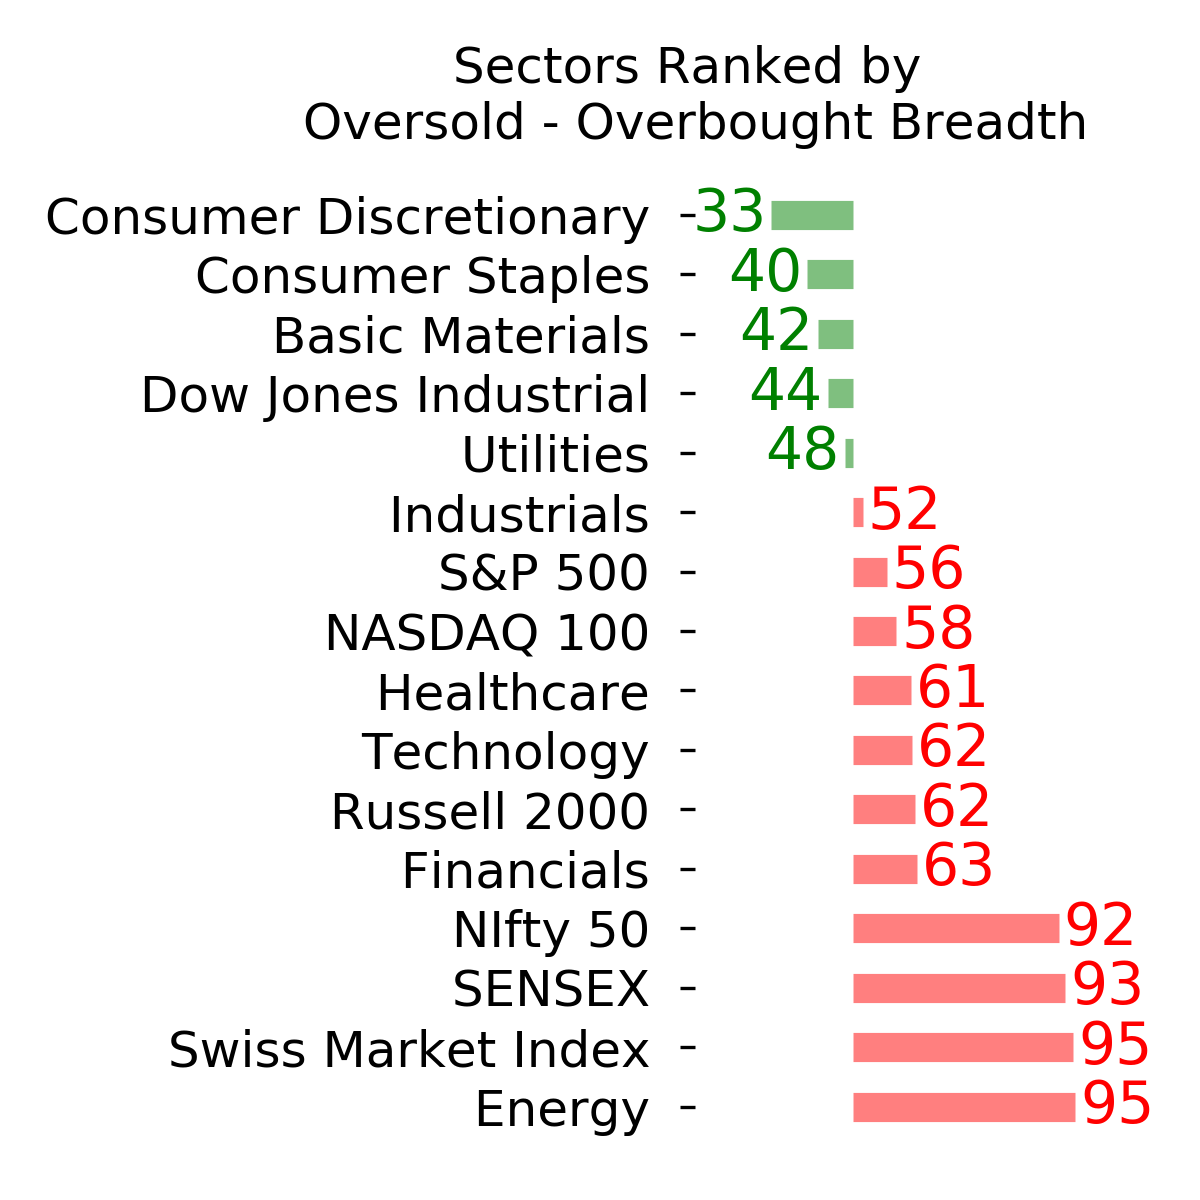
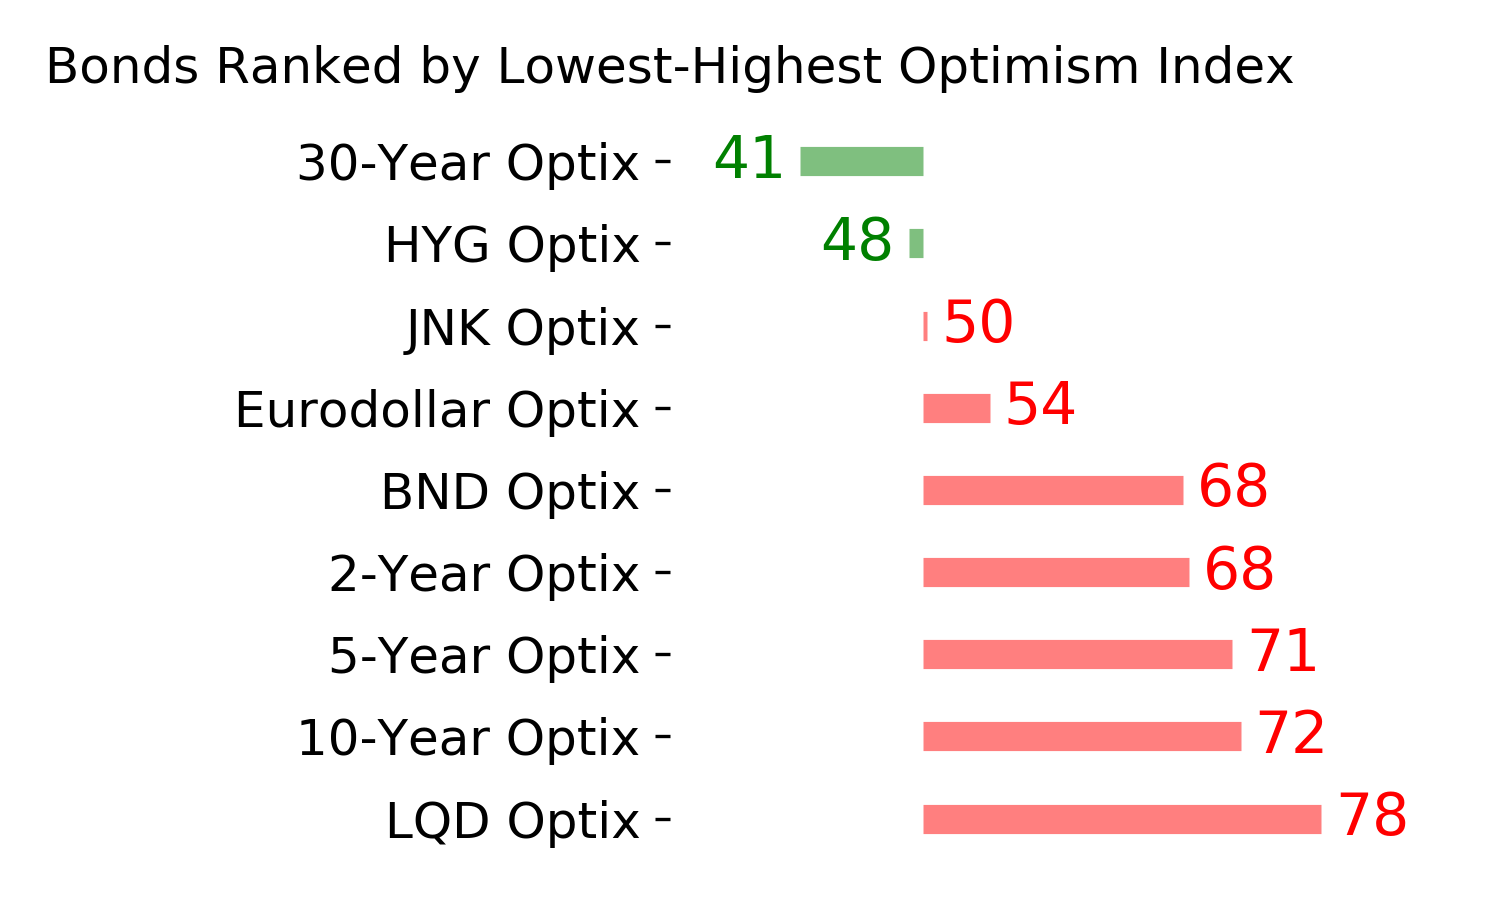
Ranks
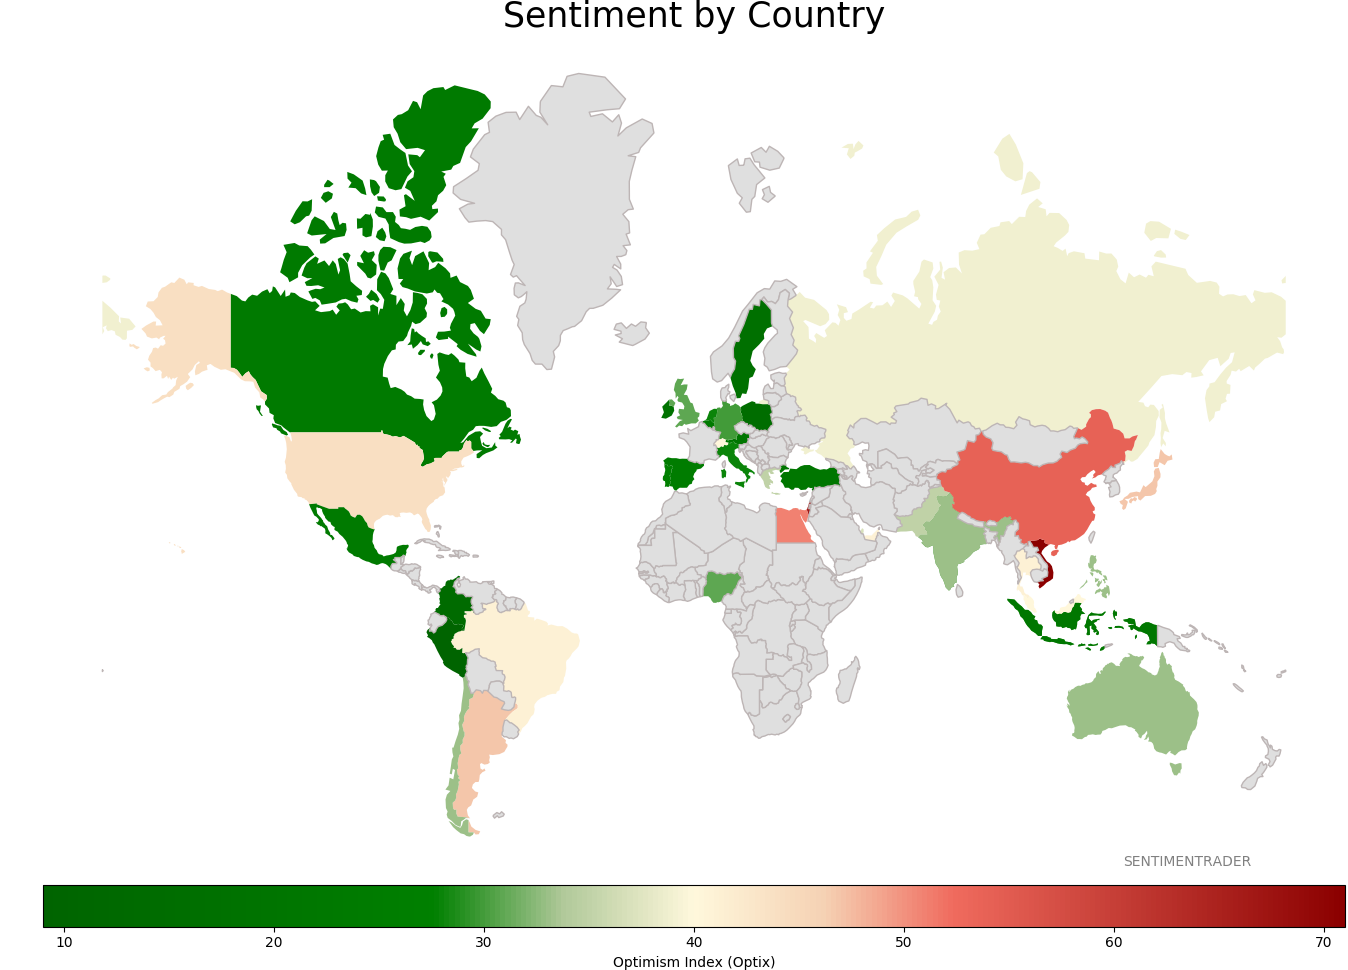
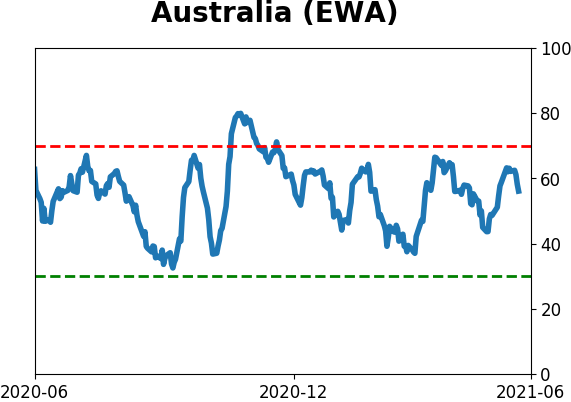
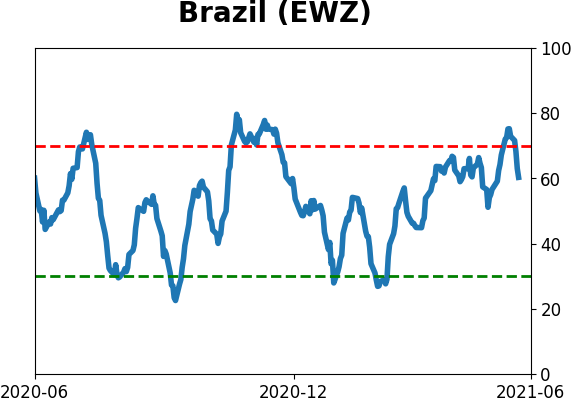
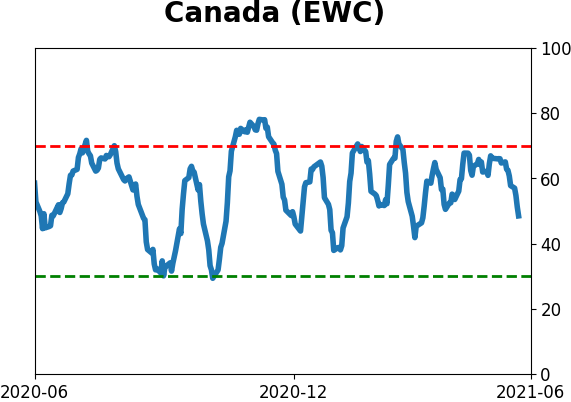
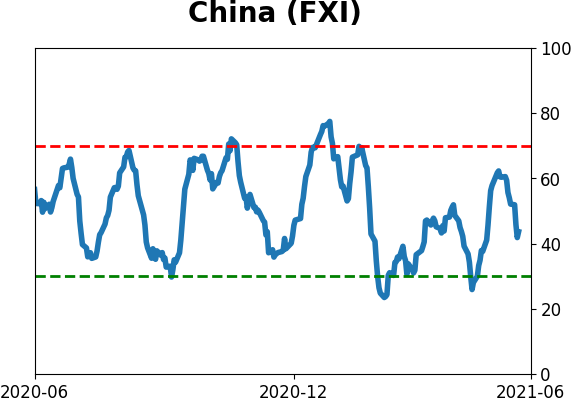
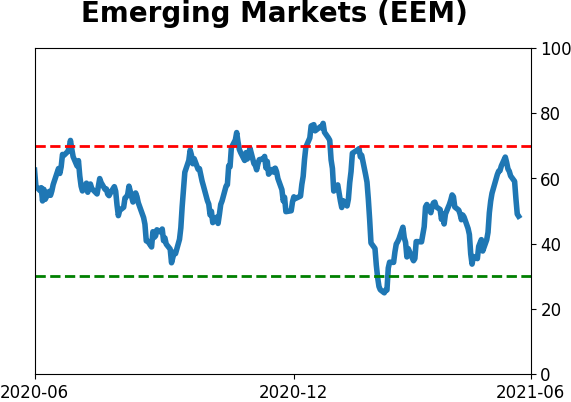
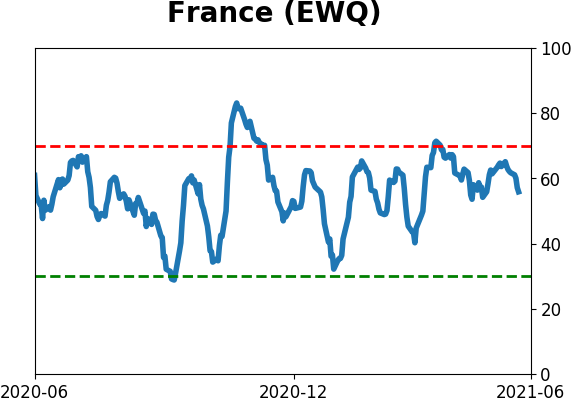
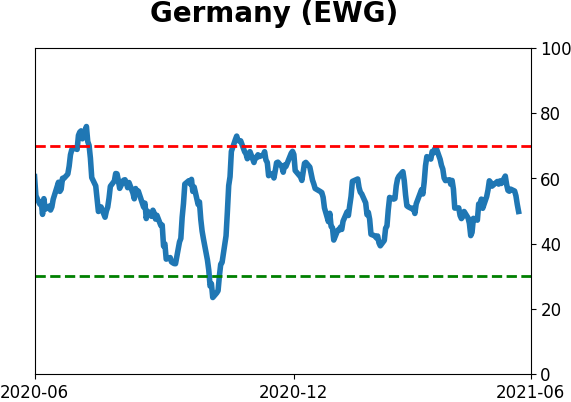
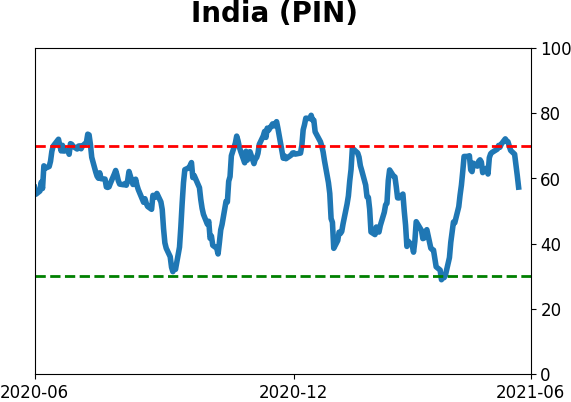
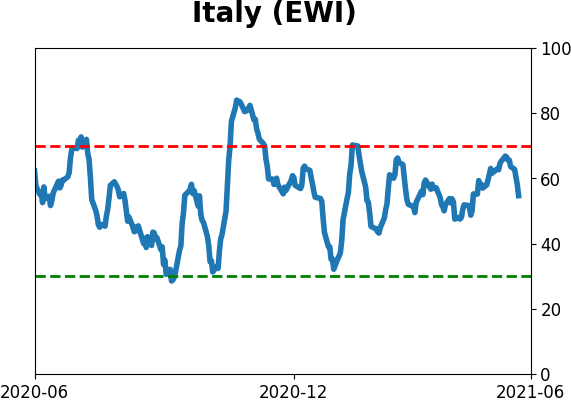
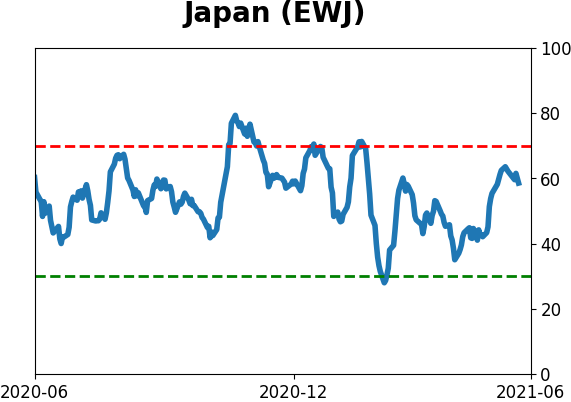
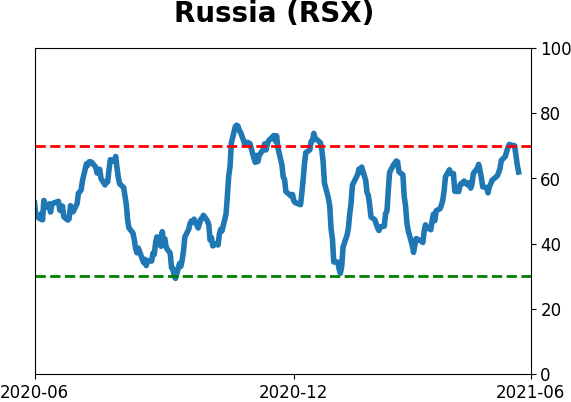
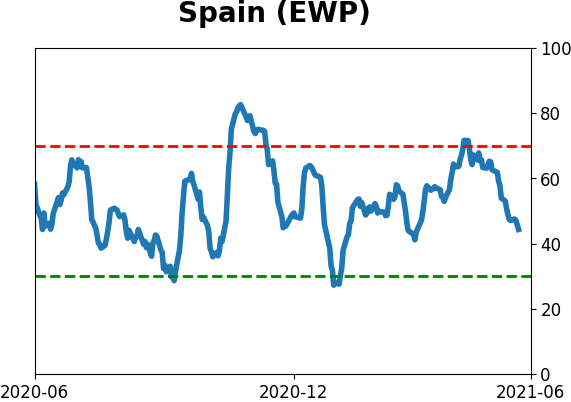
Sentiment Around The World
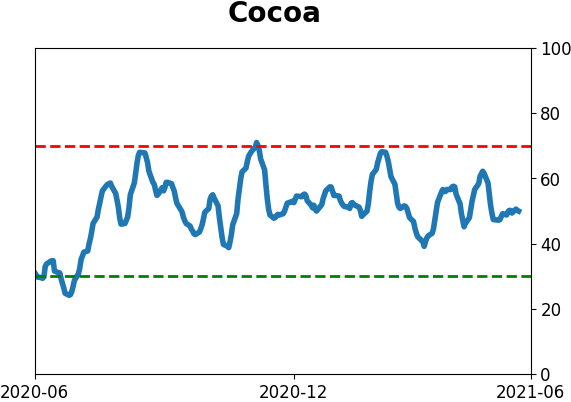
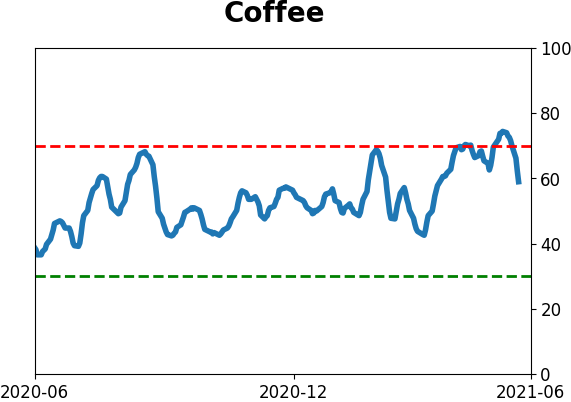
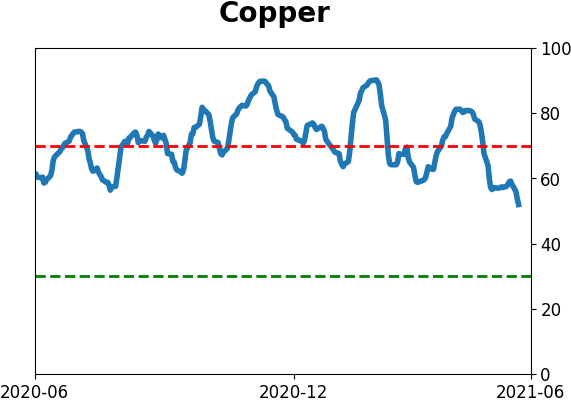
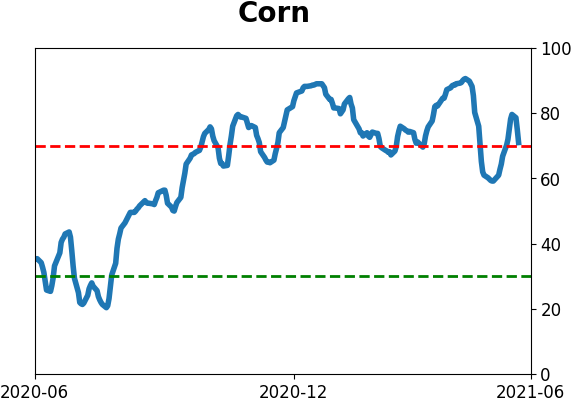
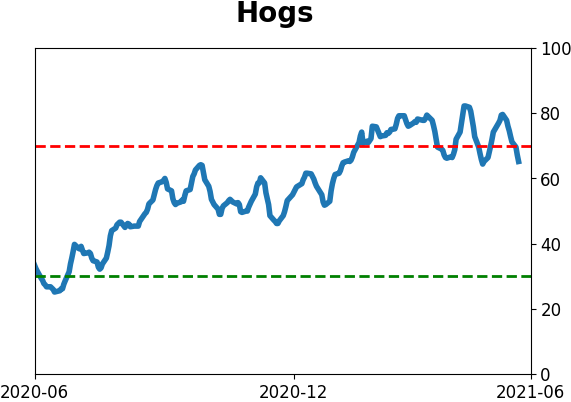
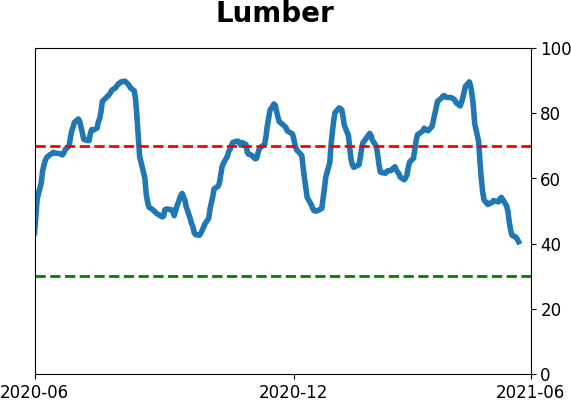
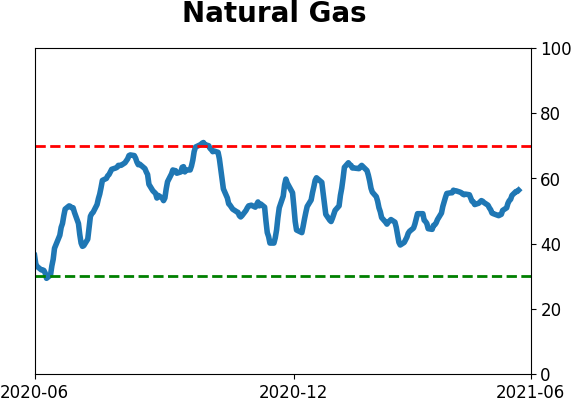
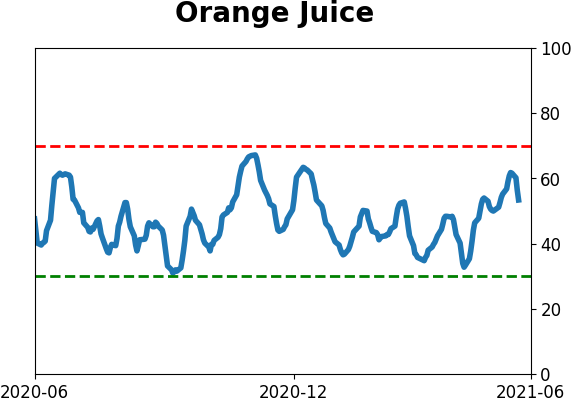
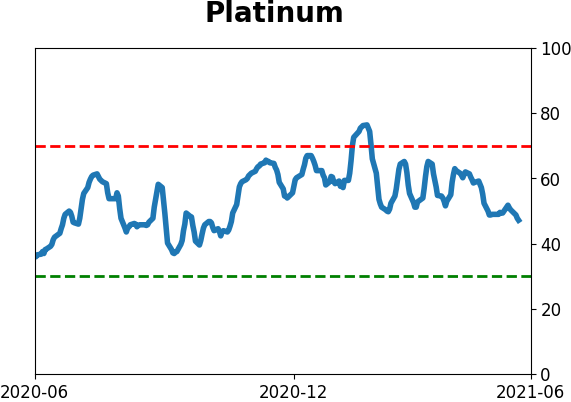
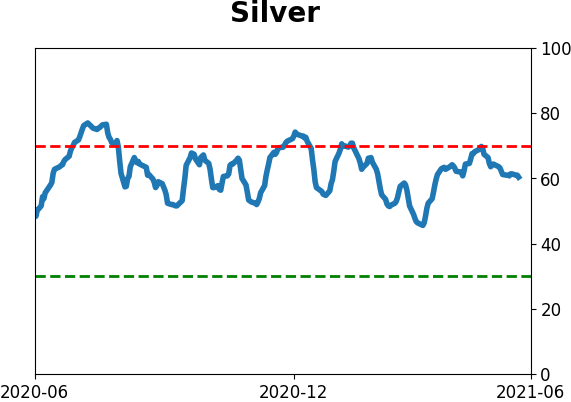
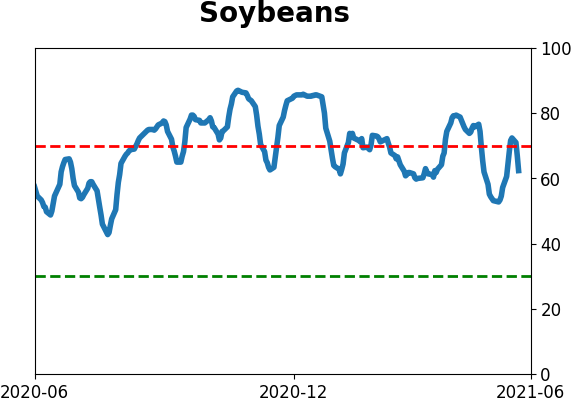
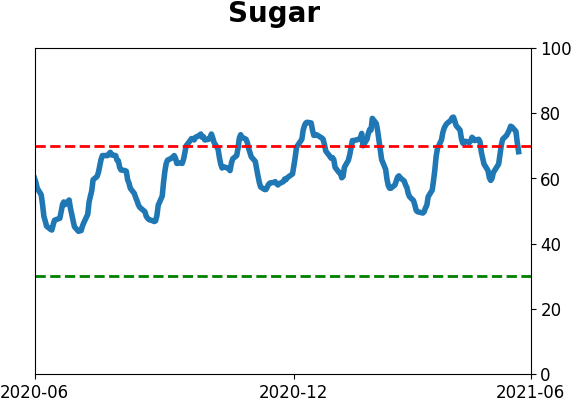
Optimism Index Thumbnails
|
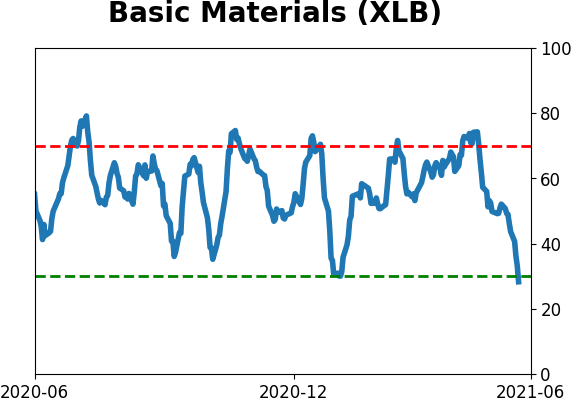
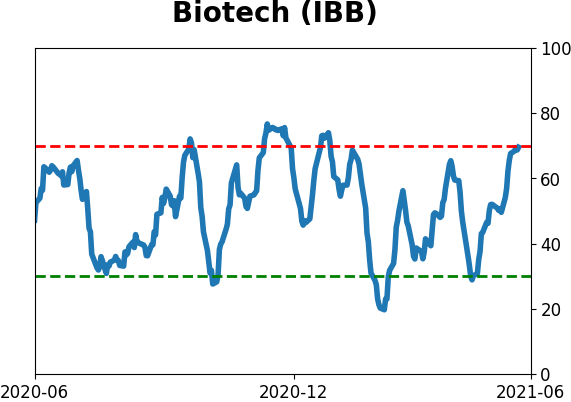
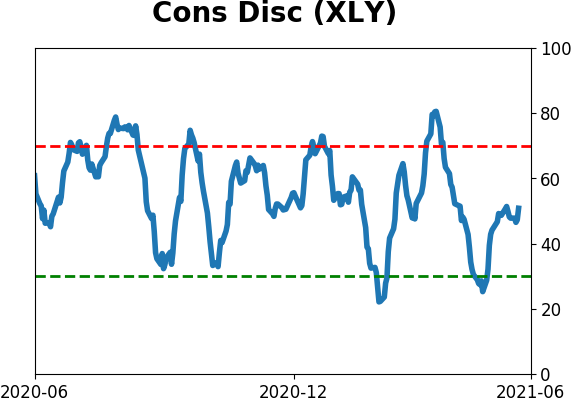
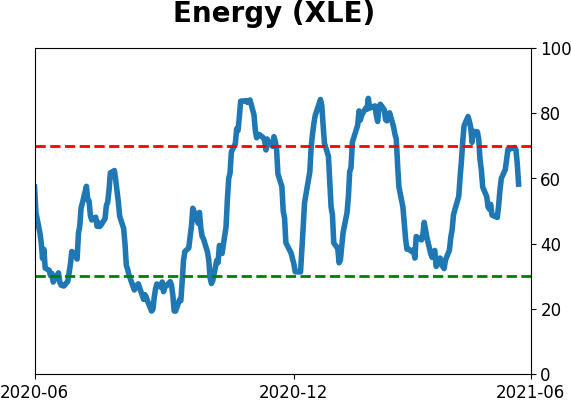
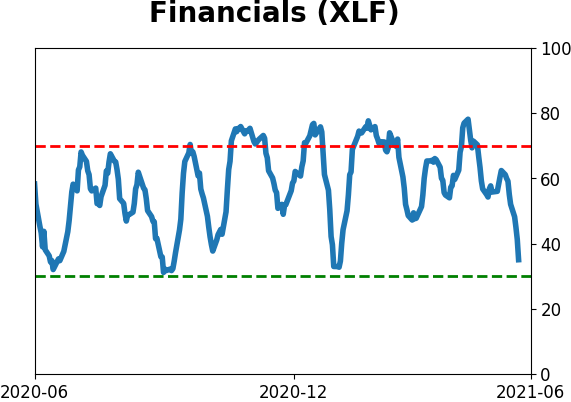
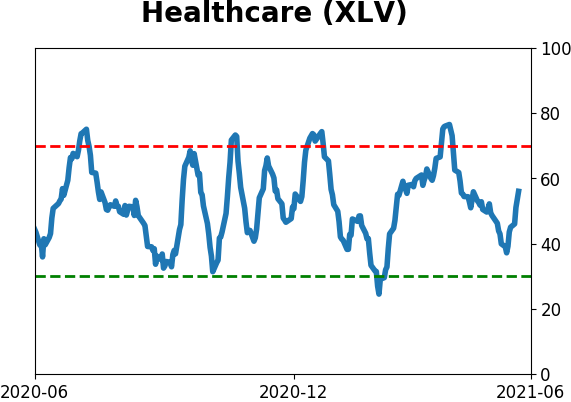
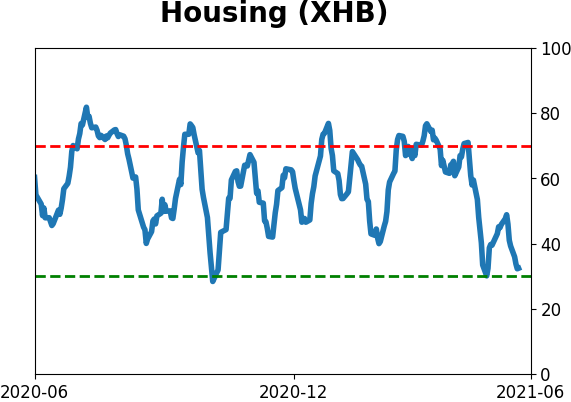
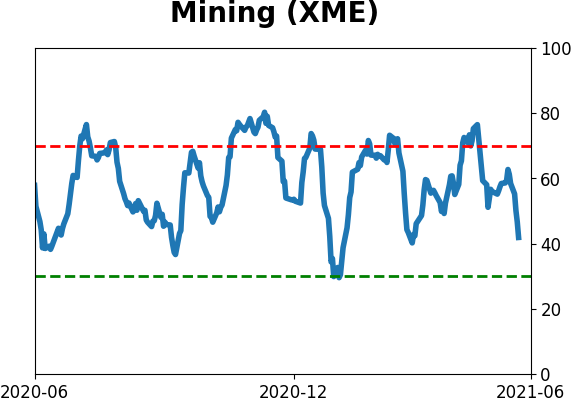
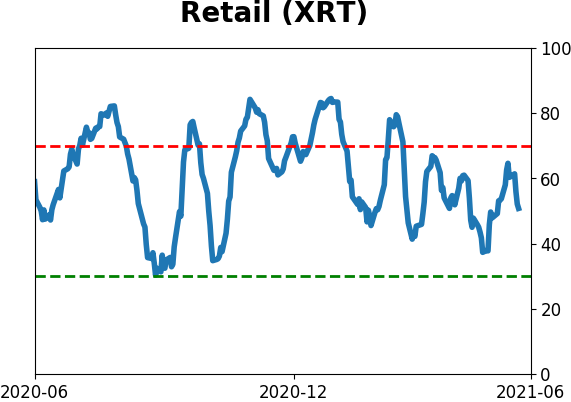
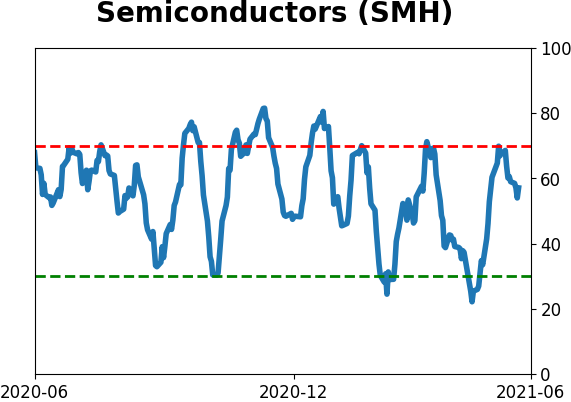
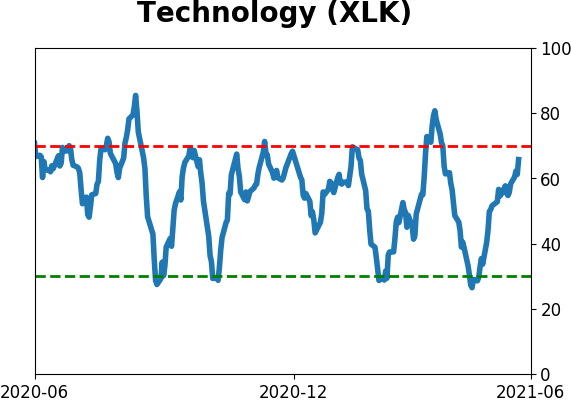
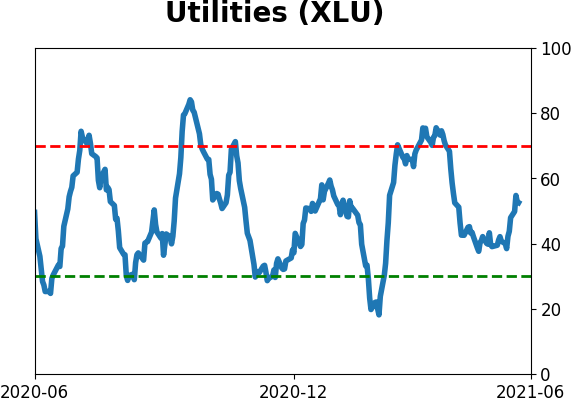
Sector ETF's - 10-Day Moving Average
|
|
|
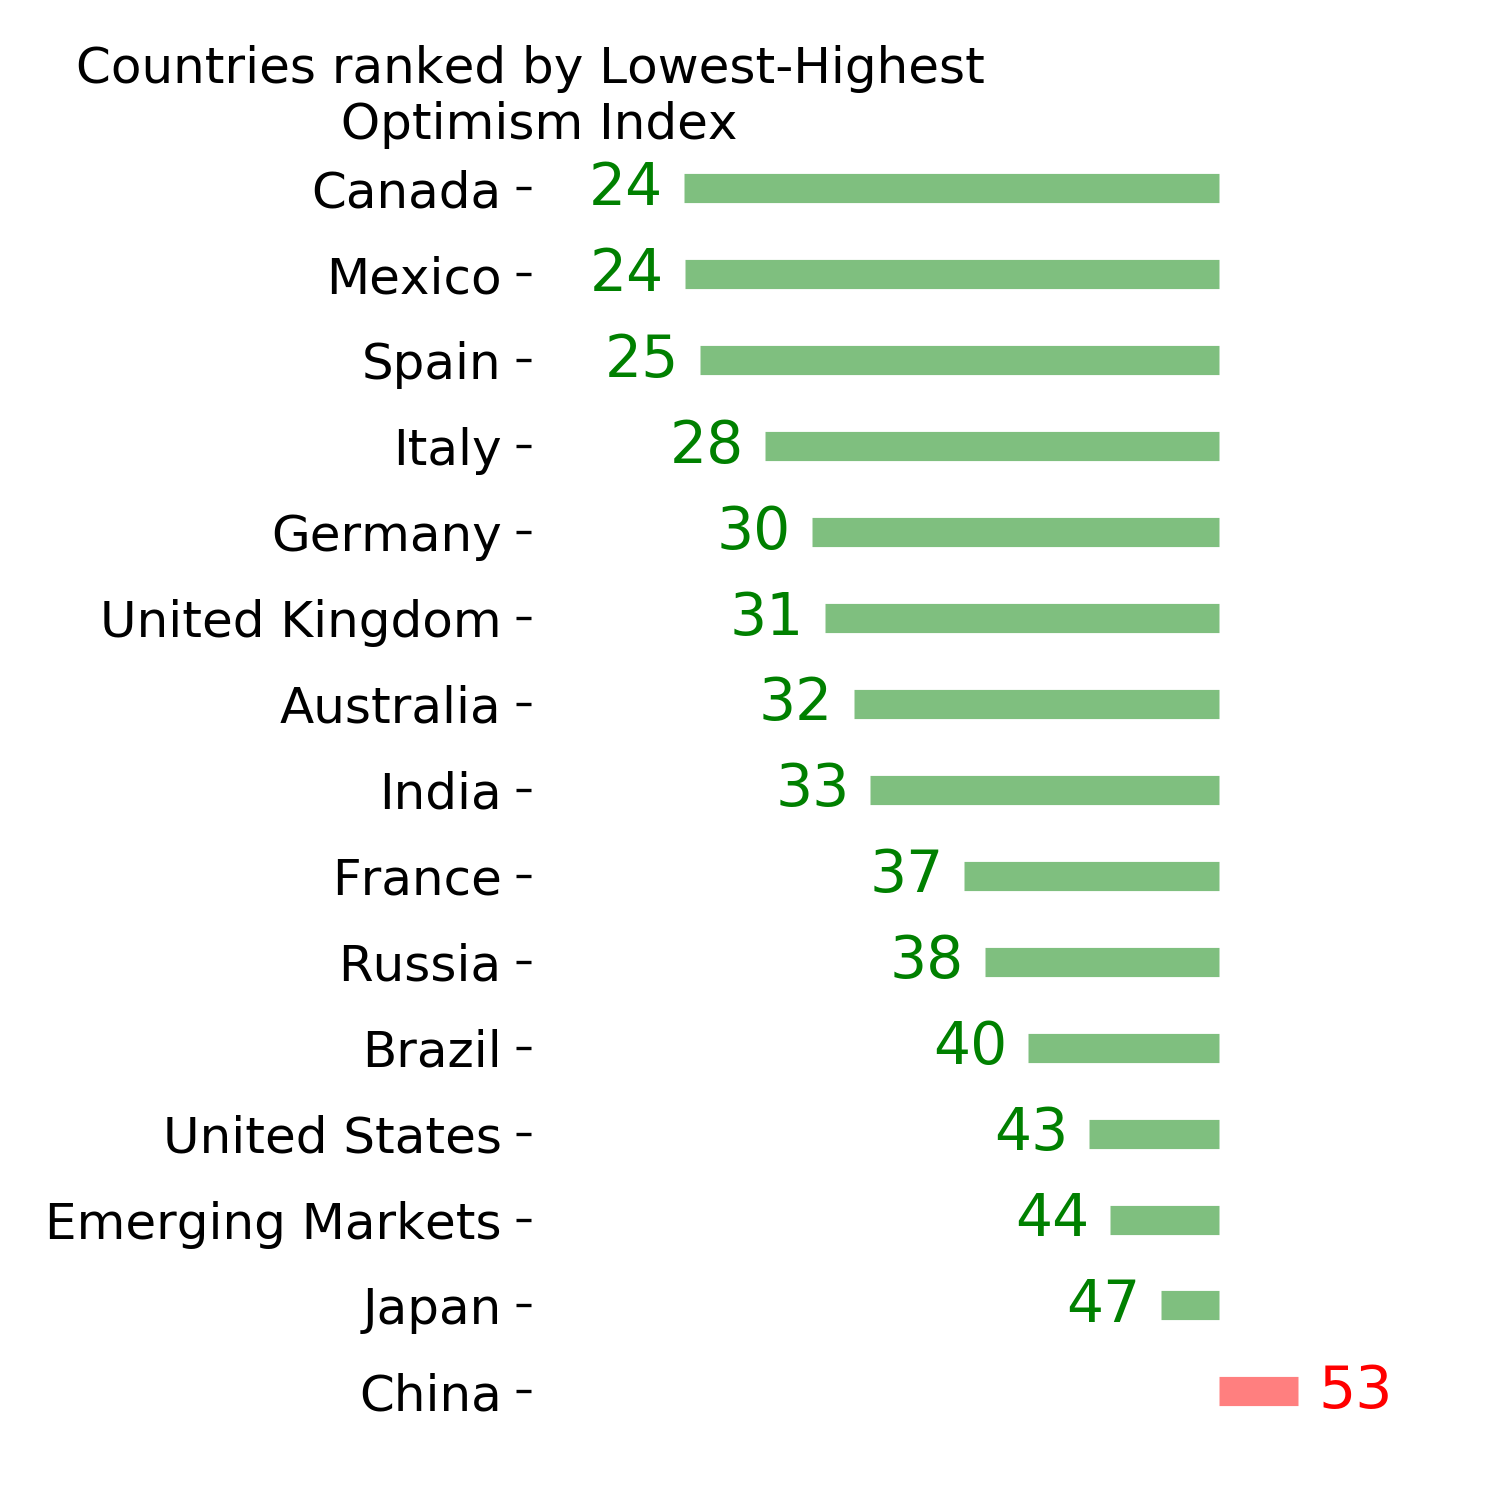
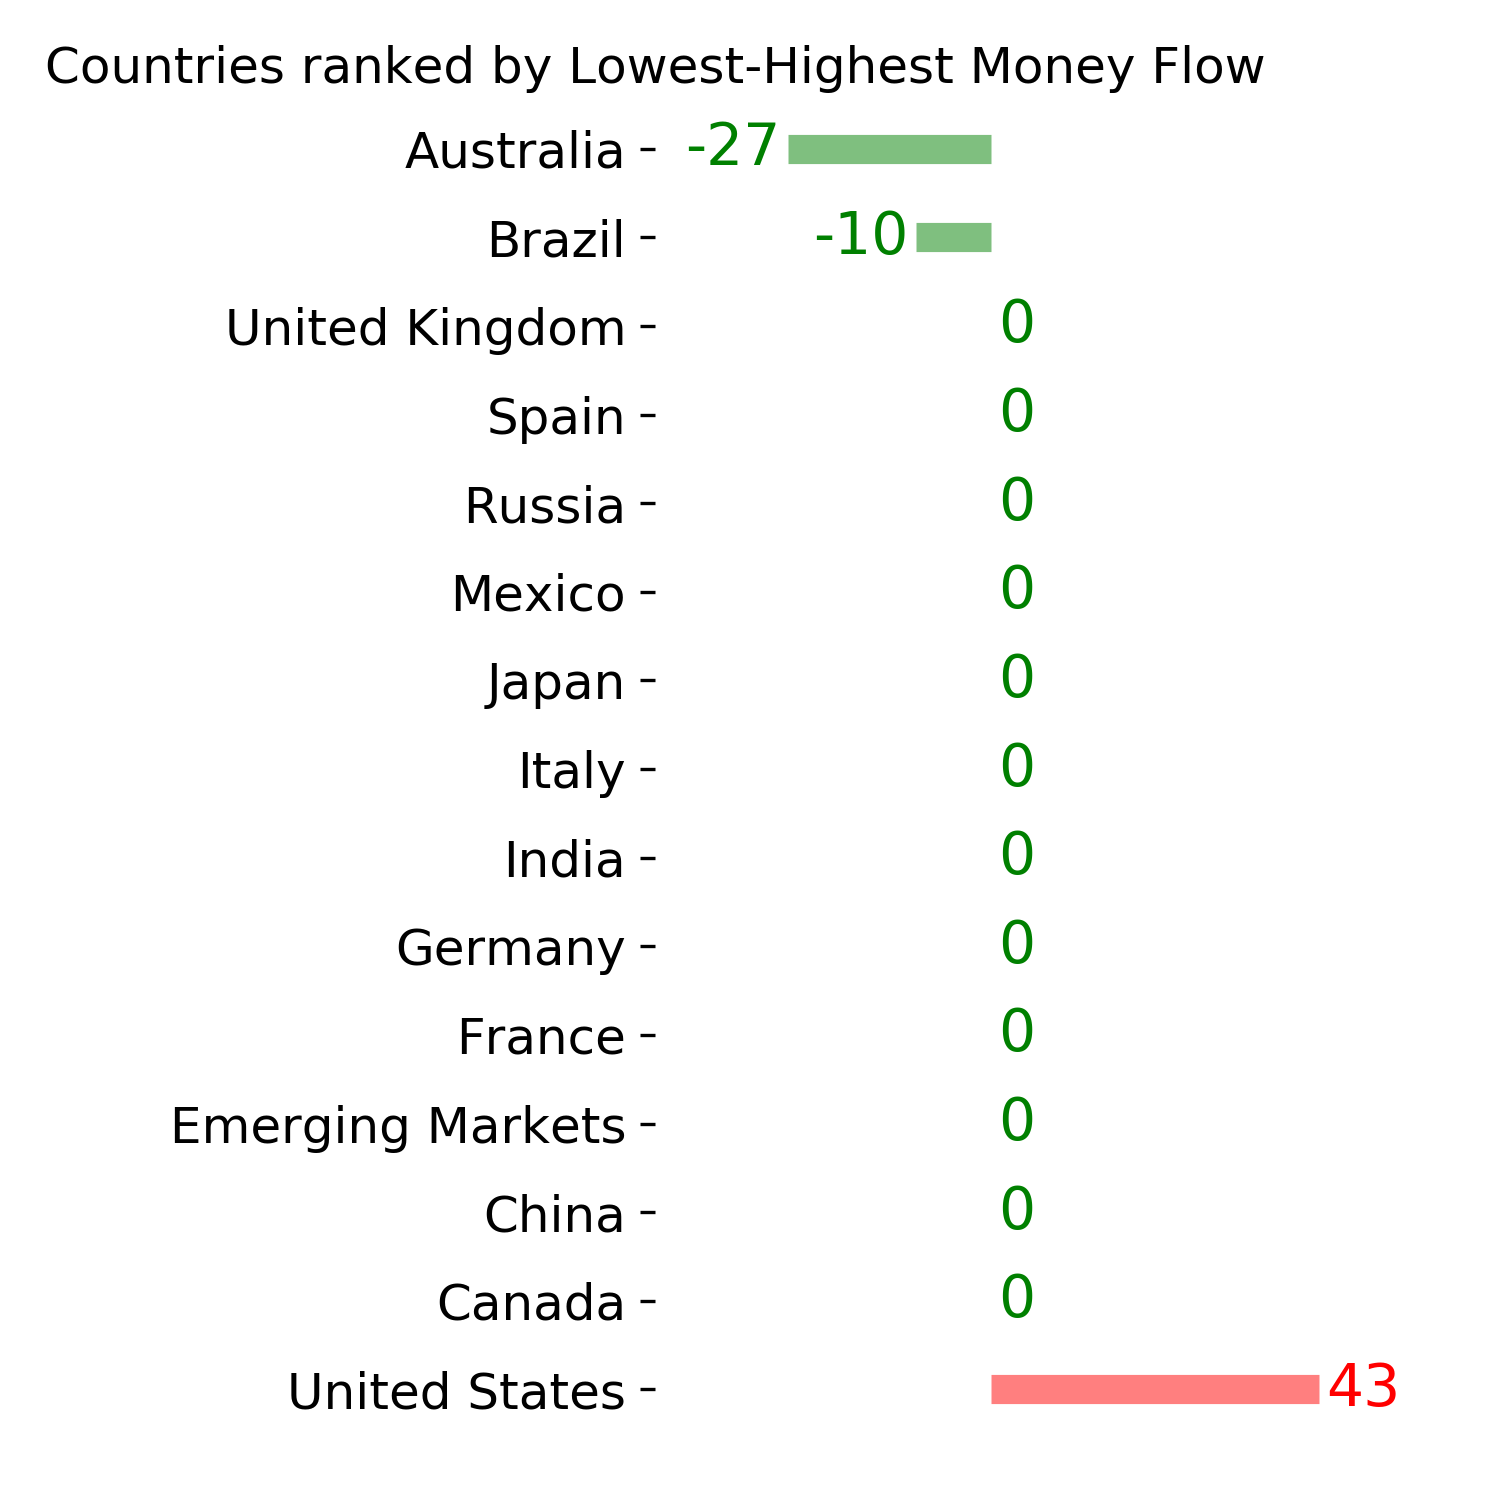
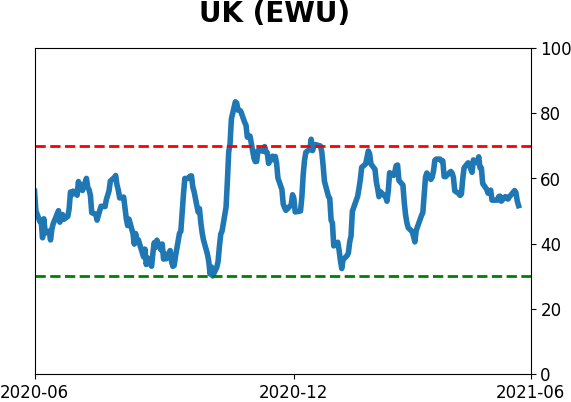
Country ETF's - 10-Day Moving Average
|
|
|
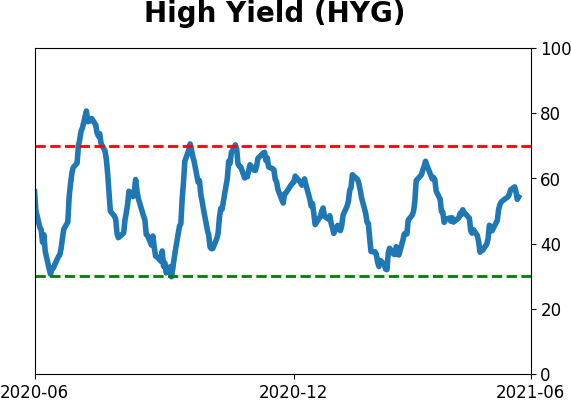
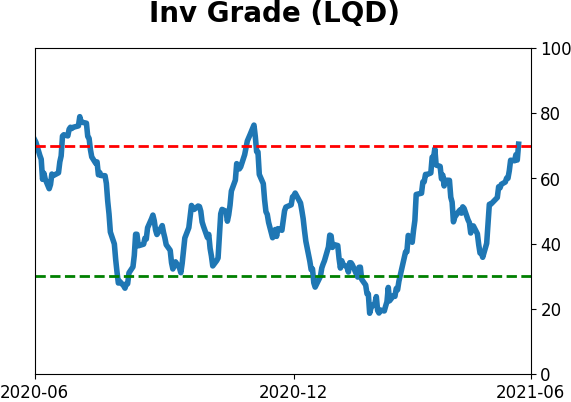
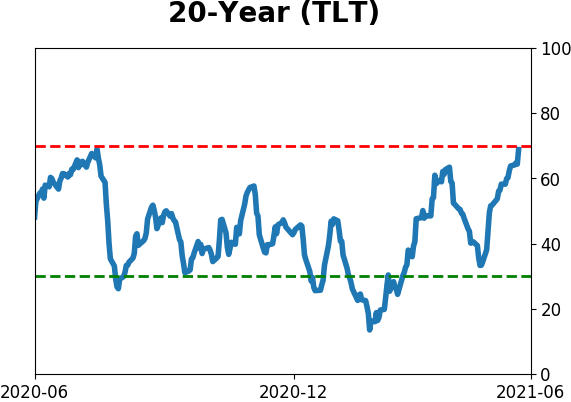
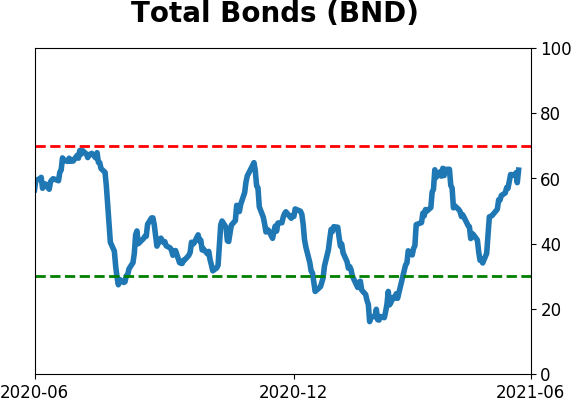
Bond ETF's - 10-Day Moving Average
|
|
|
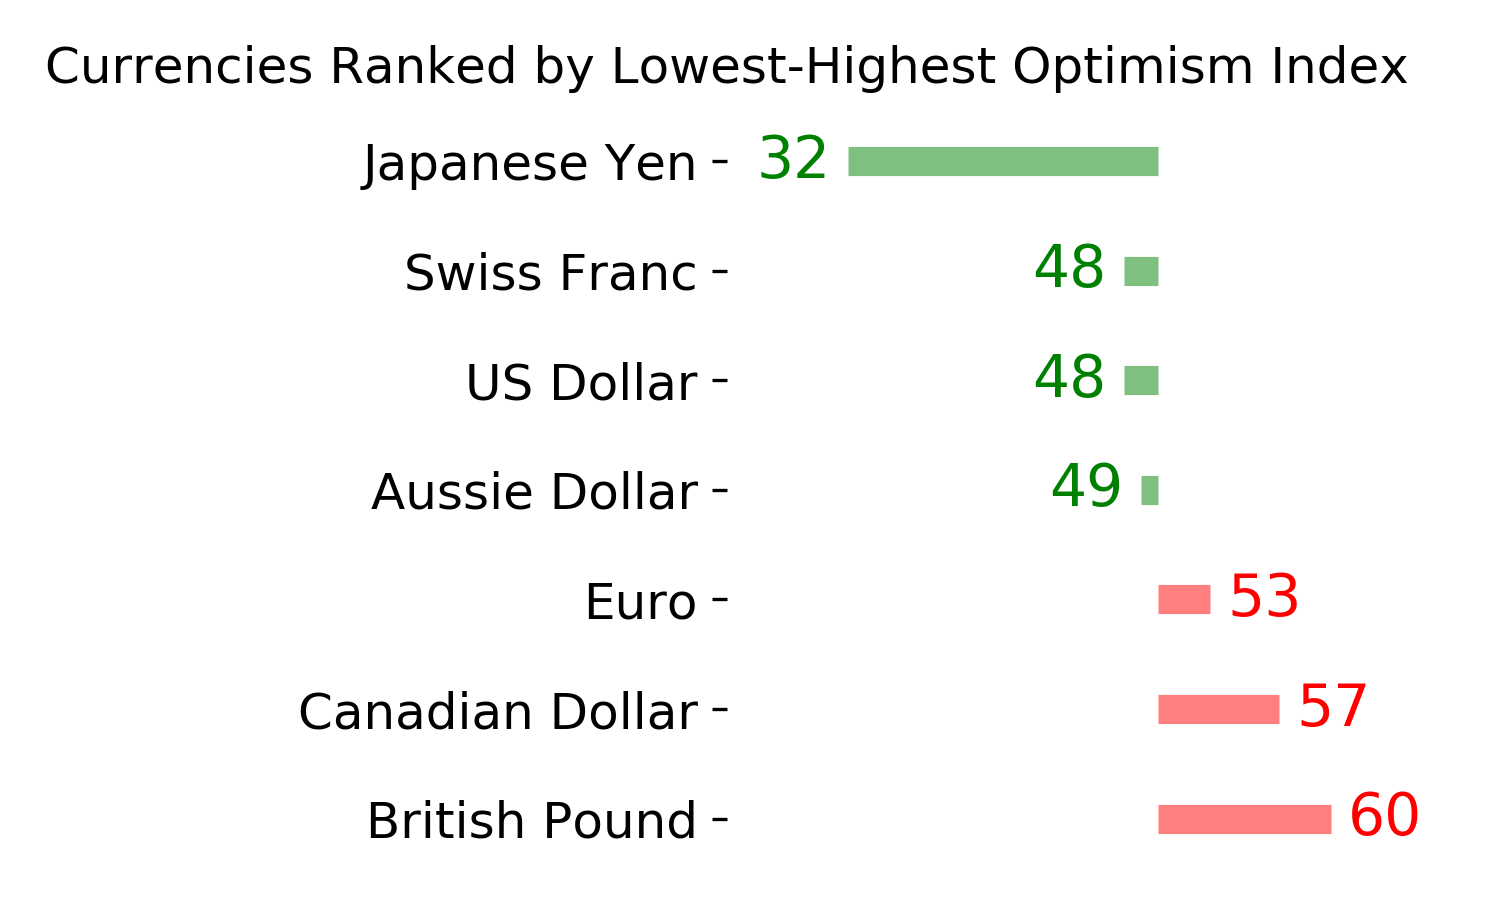
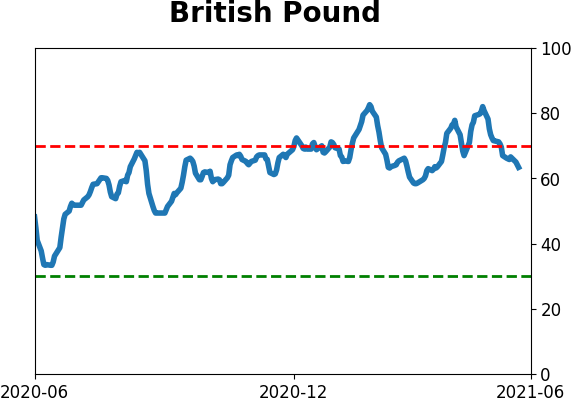
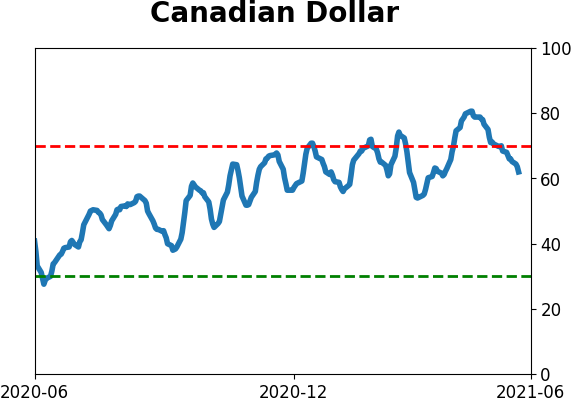
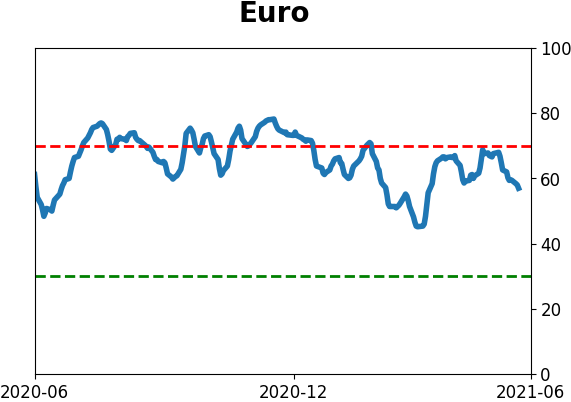
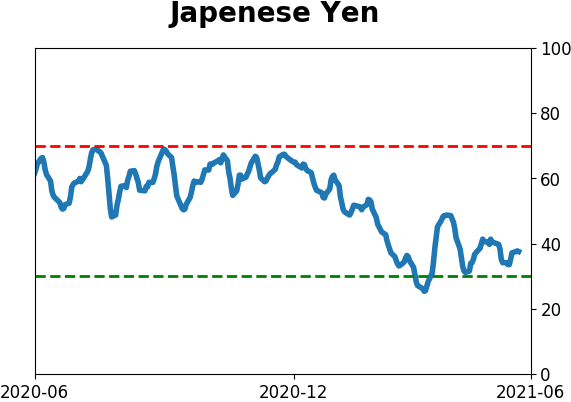
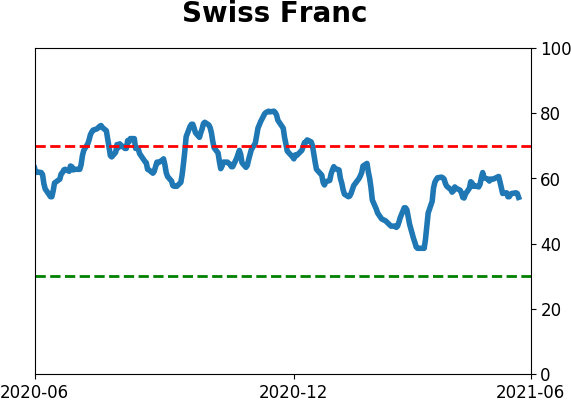
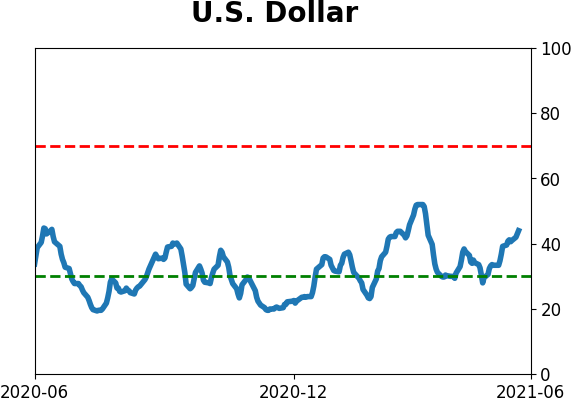
Currency ETF's - 5-Day Moving Average
|
|
|
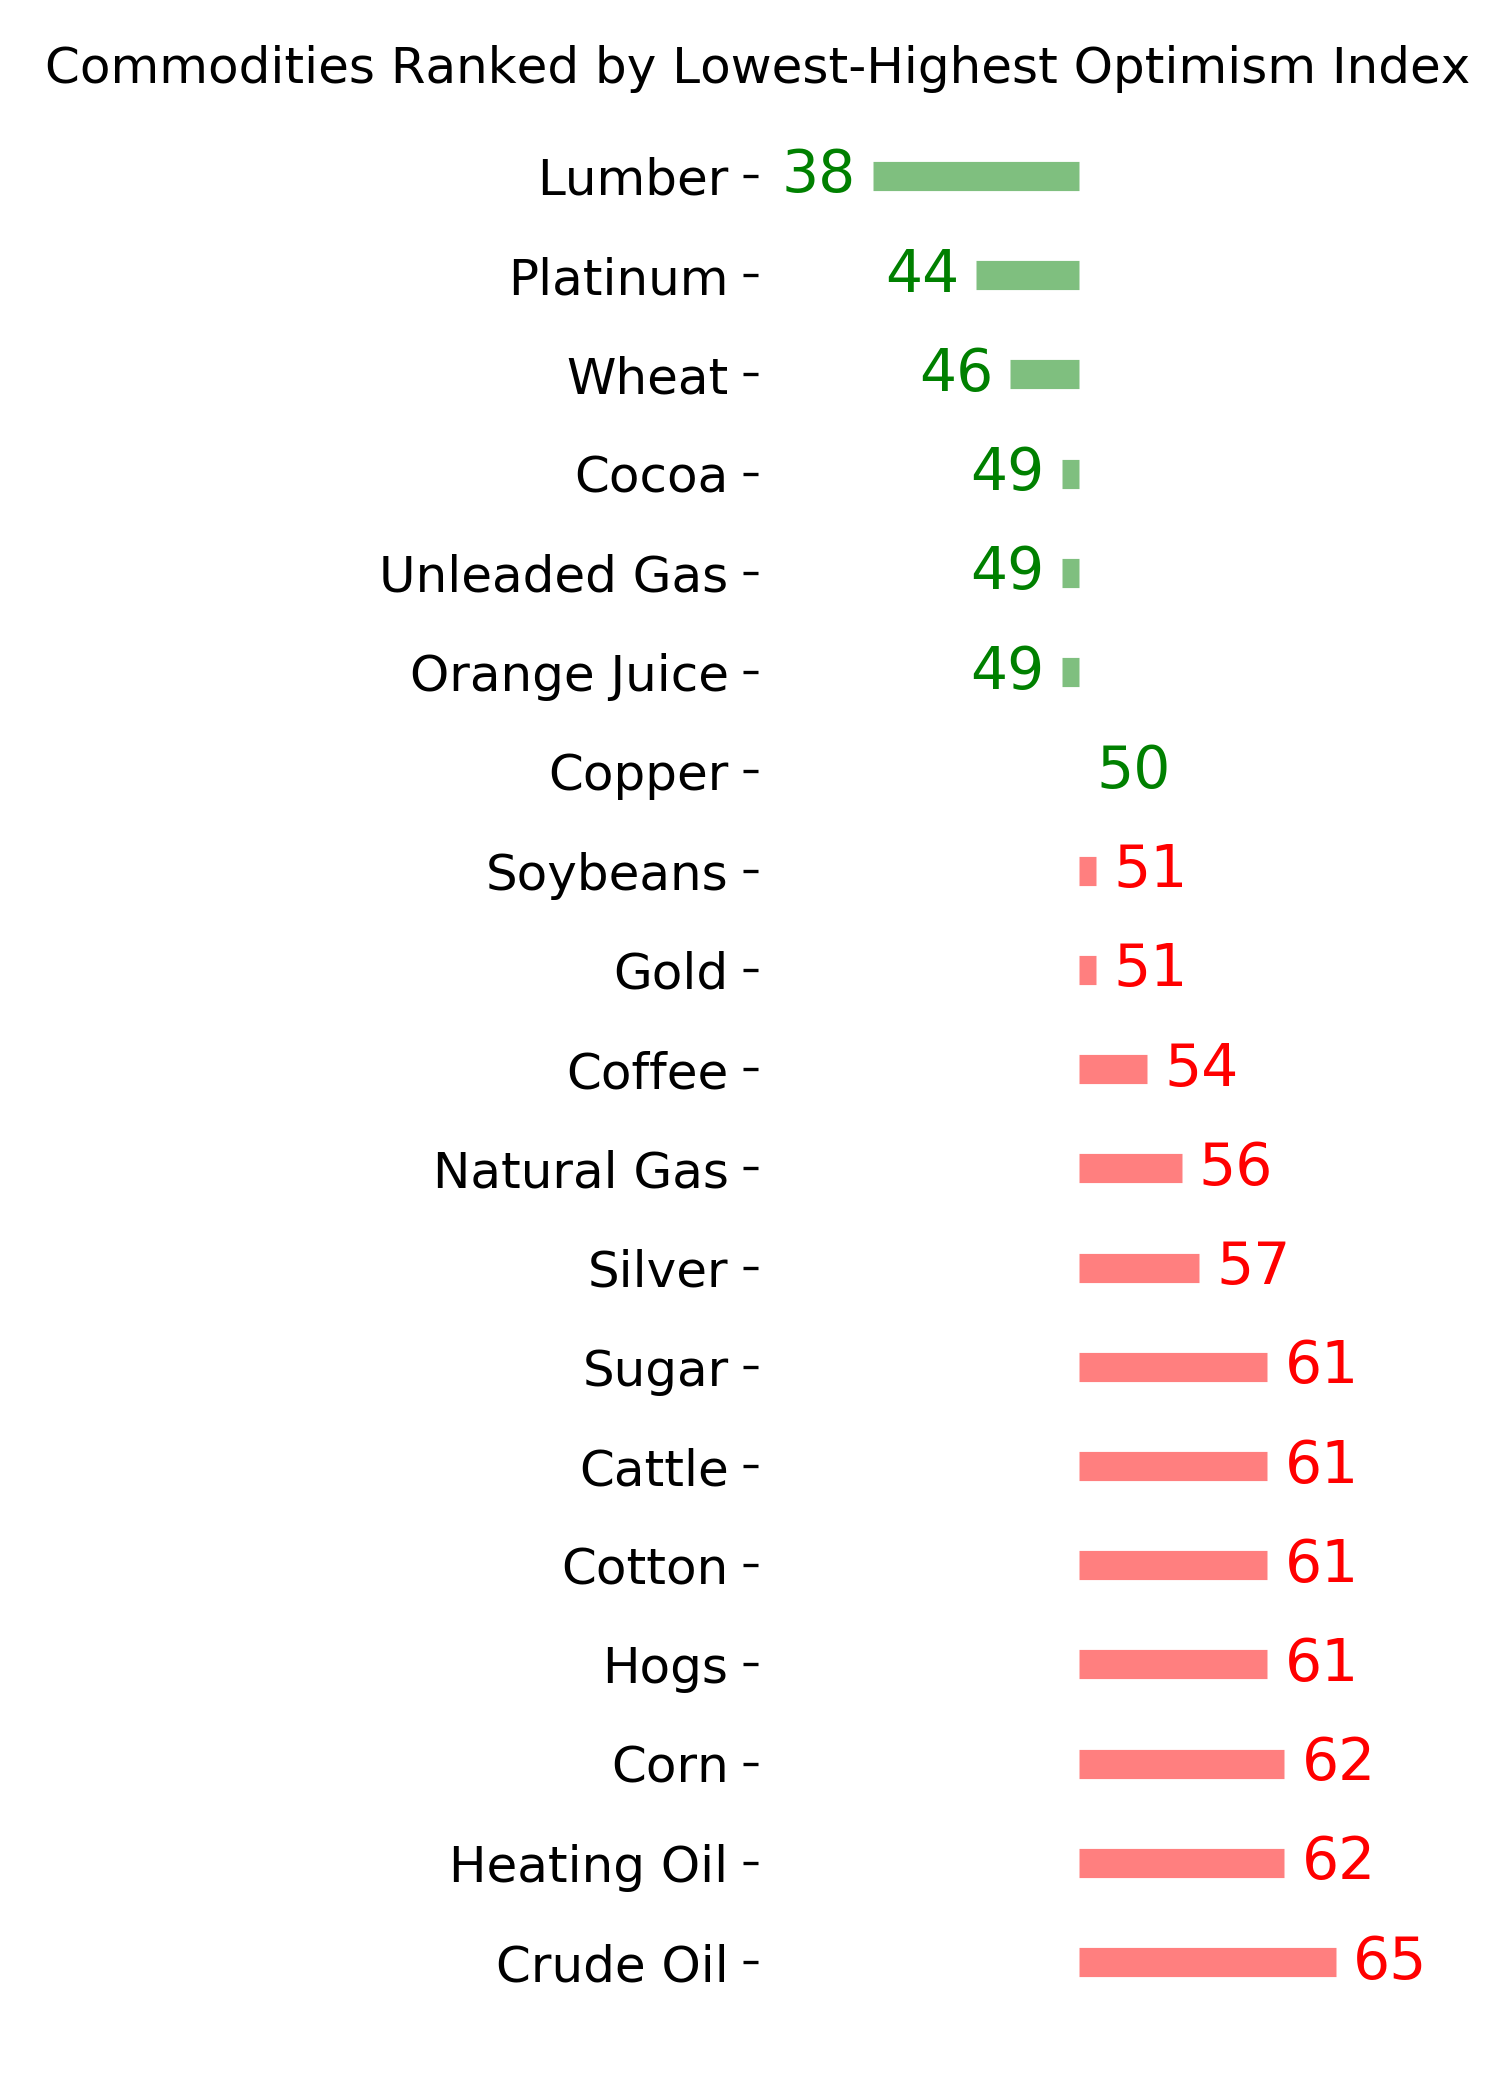
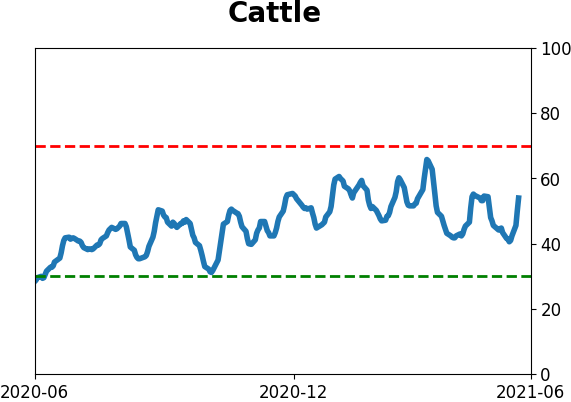
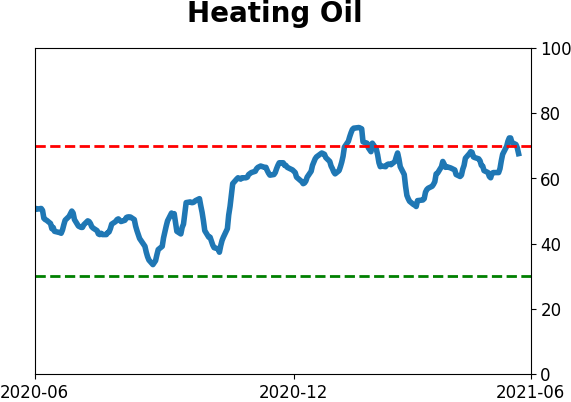
Commodity ETF's - 5-Day Moving Average
|
|