Headlines
|
|
Institutions are coming off the "sidelines":
Institutions had been piling into money markets, much as retail investors have been. Over the past year, asset growth in money markets hit a nearly 40-year high, and it has only now started to reverse. The "cash on the sidelines" argument is weak, and future returns didn't support this as a bullish argument. Hedge fund exposure to stocks shows conflicting signals, with perhaps a slight downside edge.
High beta indexes are jumping:
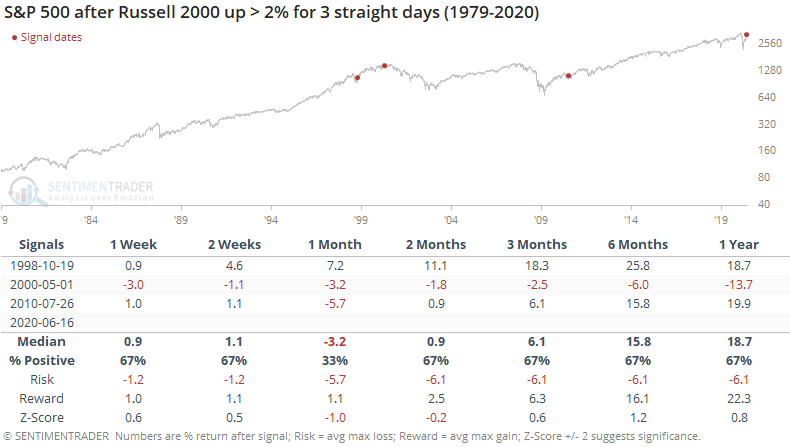
Over the past 3 days, the Russell 2000 has rallied at least 2% and the Nasdaq Composite at least 1%. That has indicated "too much too fast" on a short- to medium-term basis, especially for the broader indexes like the S&P 500. It was mostly a good sign for the Nasdaq, though.
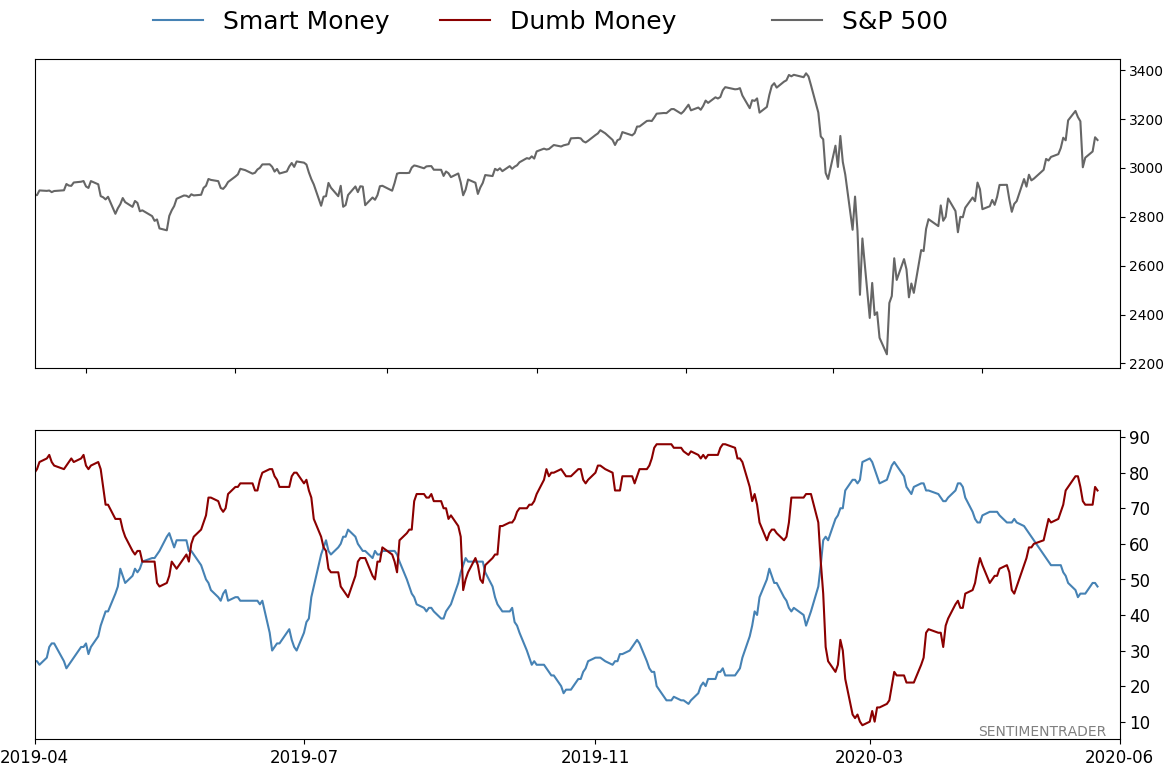
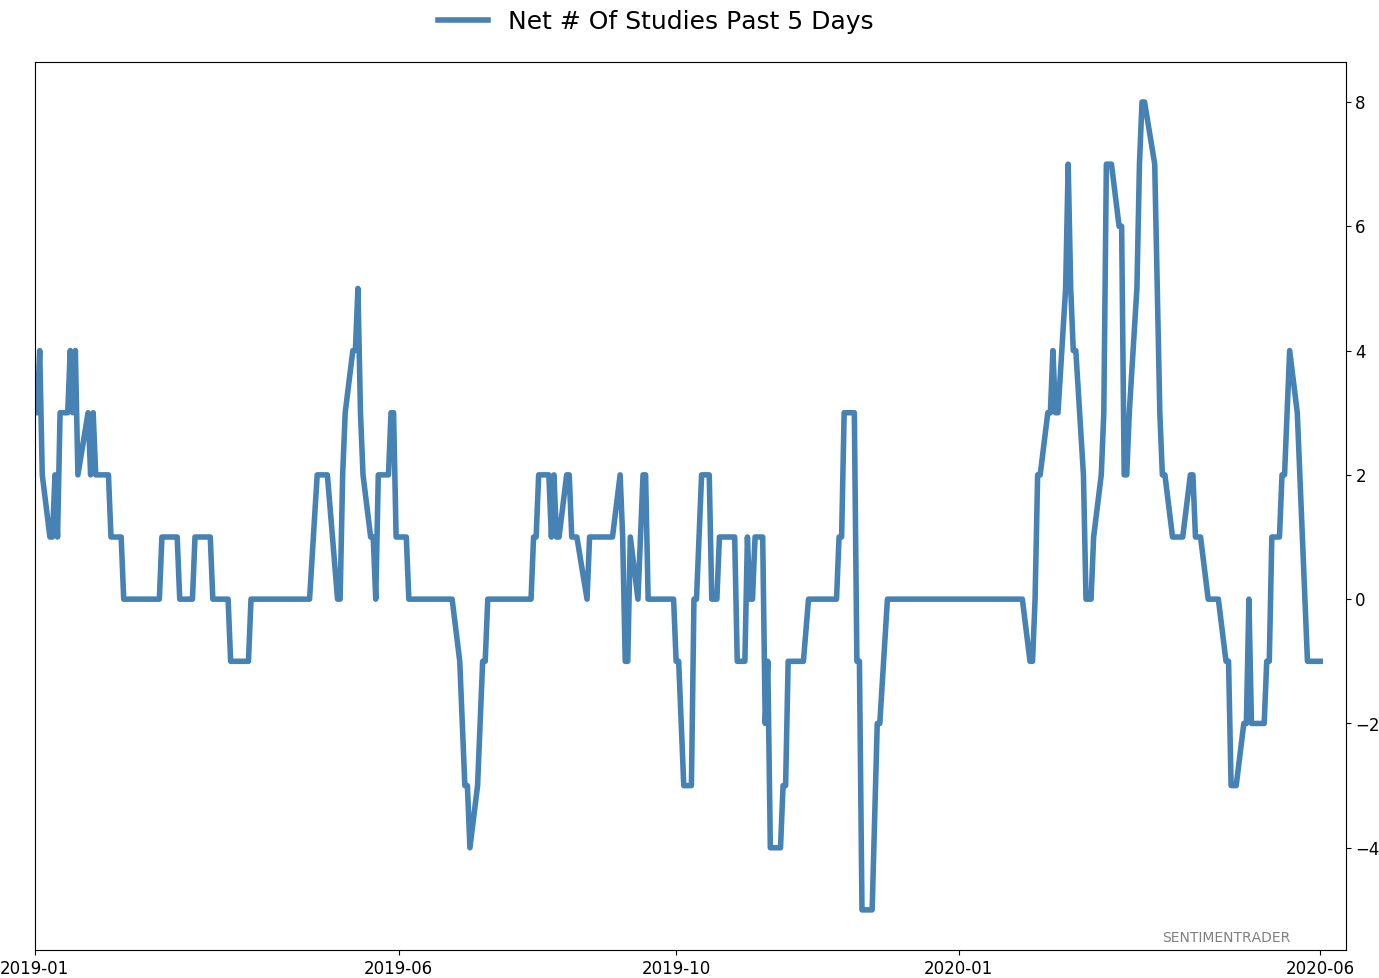
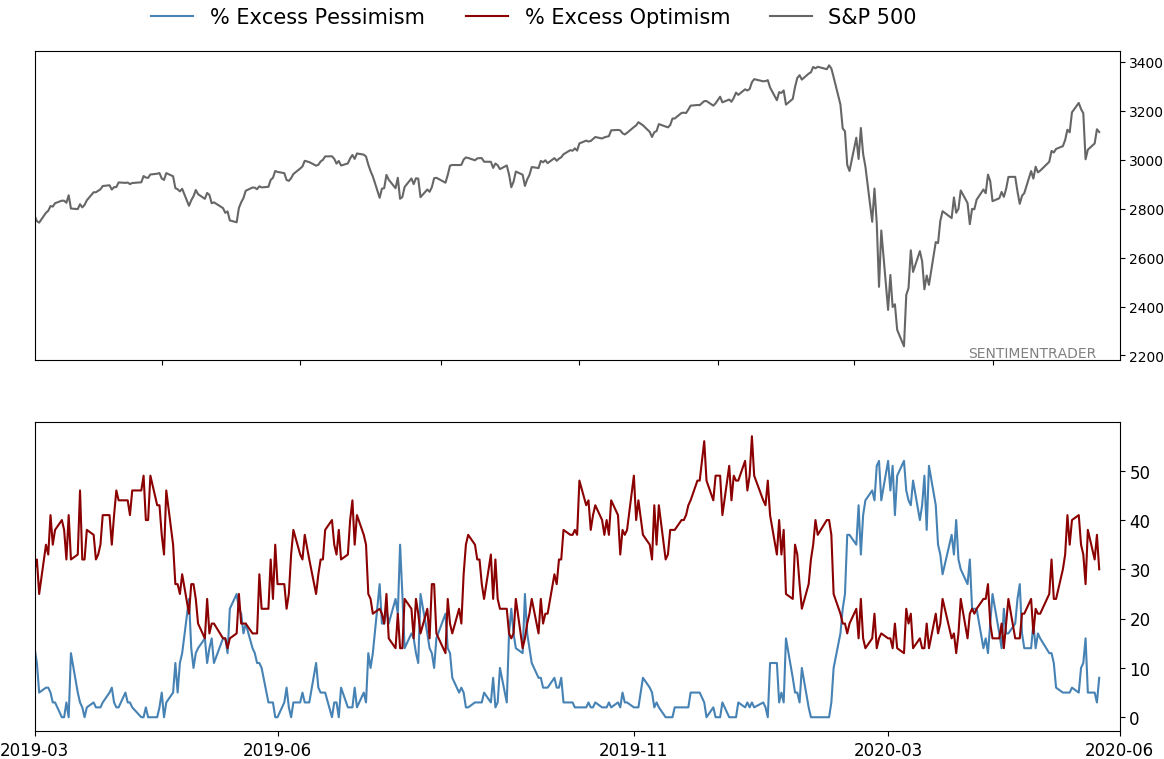
Bottom line: The suggestion is flat/lower prices short- to medium-term, and higher prices long-term. Indicators are currently showing excessive optimism, with Dumb Money Confidence was recently near 80% and has gyrated since then. Monday's reversal and Tuesday's follow through haven't changed the odds despite looking good on a chart. The Active Studies show that when we look at stocks from various perspectives, there is a heavy positive skew over the medium-term long-term. Recently, there have been troubling signs of reckless speculation, but the breadth thrusts and recoveries have an almost unblemished record at preceding higher prices over a 6-12 month time frame. Indicators and studies for other markets are mixed with no strong conclusion.
Big flow into ETFs: According to the ICI, more than $21 billion flowed into domestic equity ETFs for the week ended June 10. That's the 5th-highest since at least 2014. There have been 12 weeks with an inflow of more than $15 billion, with half of those weeks in 2016-17. Since the beginning of 2018, there have been 6 weeks with an inflow that large, all of which preceded a decline in the S&P 500 in the next 4-8 weeks.
|
Smart / Dumb Money Confidence
|
Smart Money Confidence: 48%
Dumb Money Confidence: 75%
|
|
Risk Levels
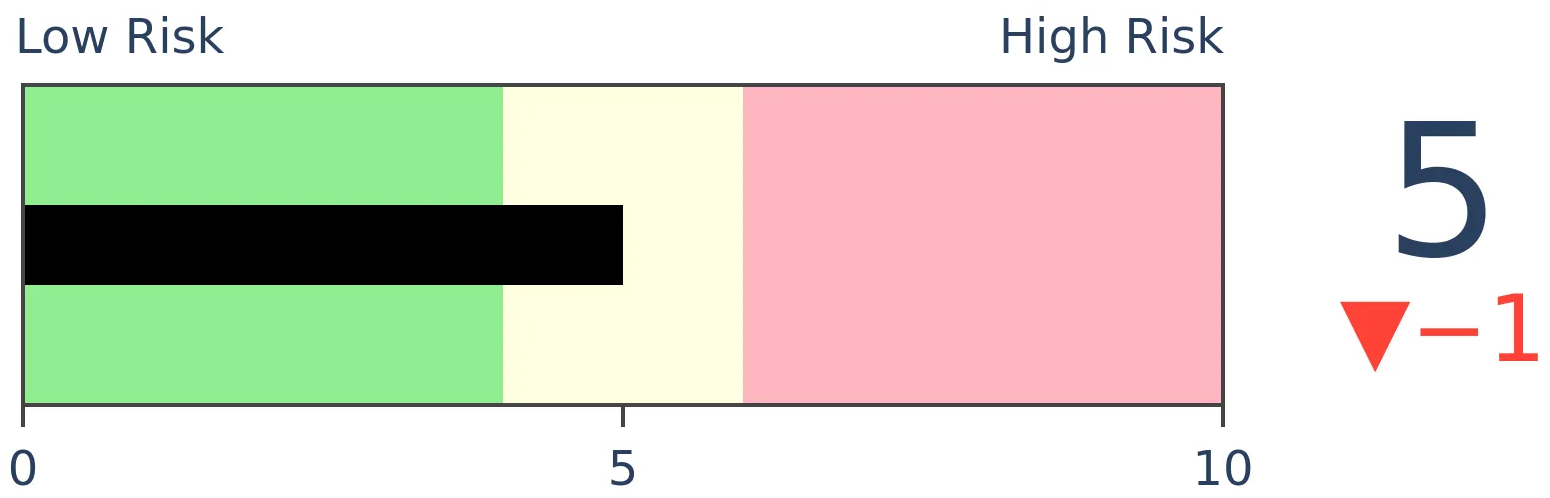
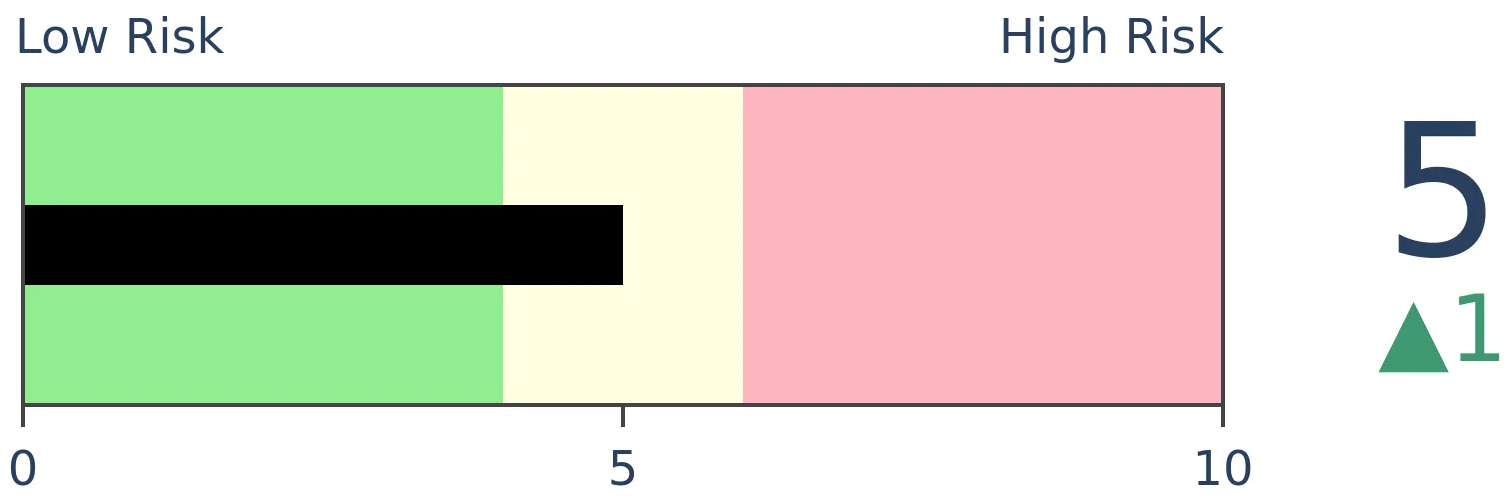
Stocks Short-Term
|
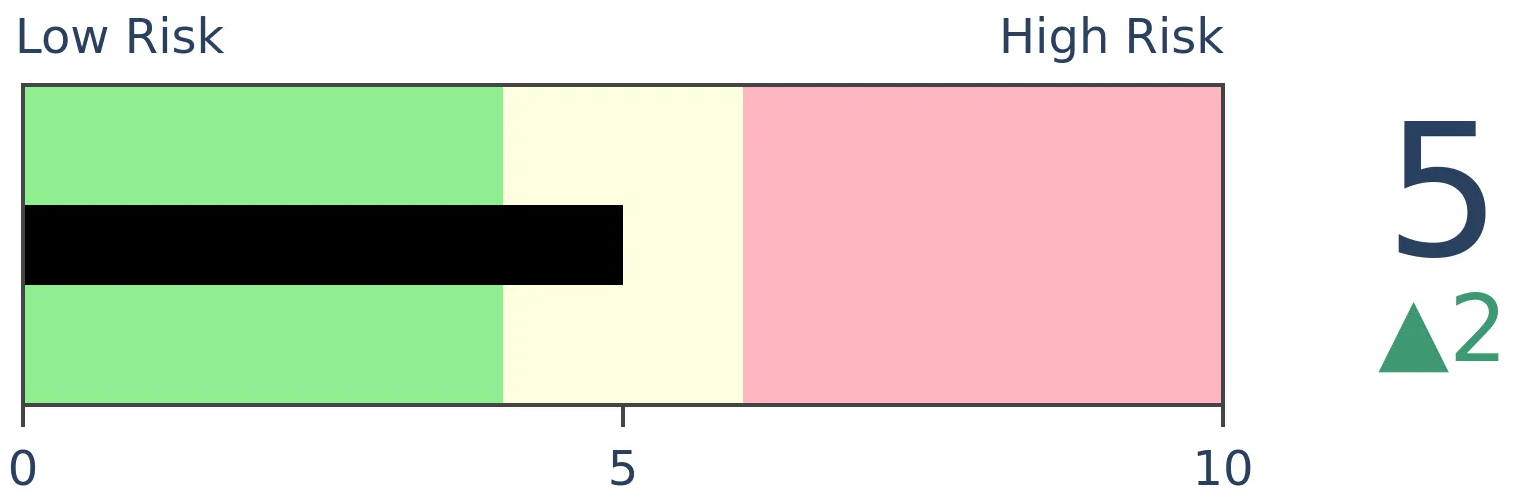
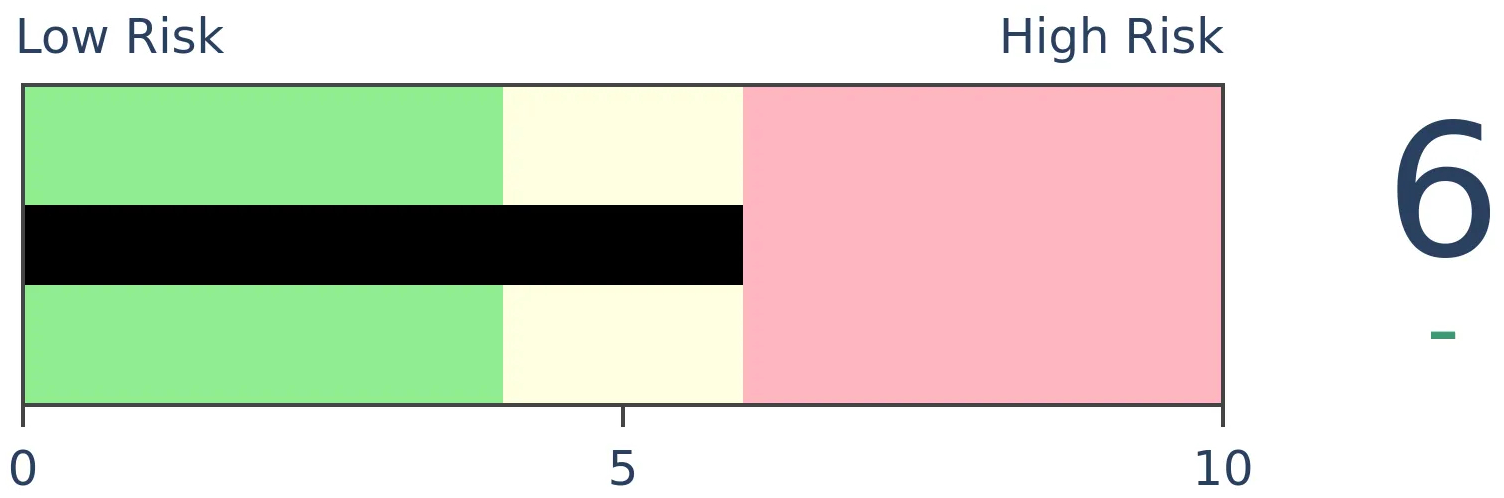
Stocks Medium-Term

|
|
Bonds
|
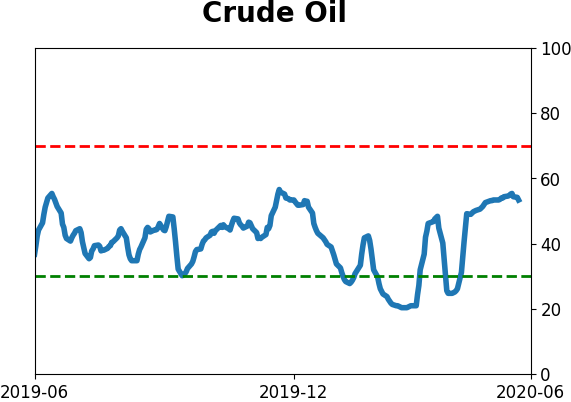
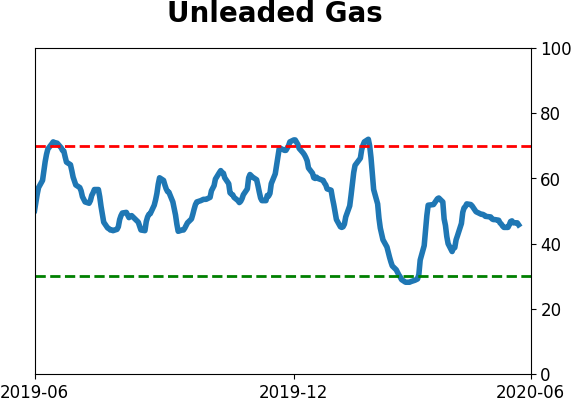
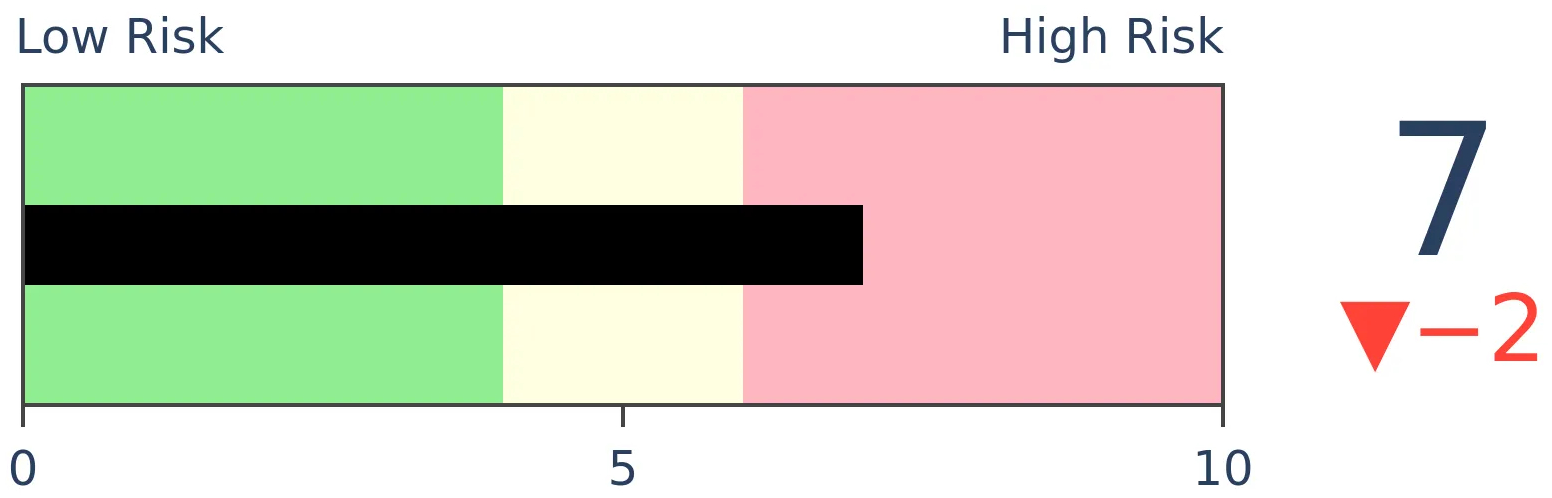
Crude Oil
|
|
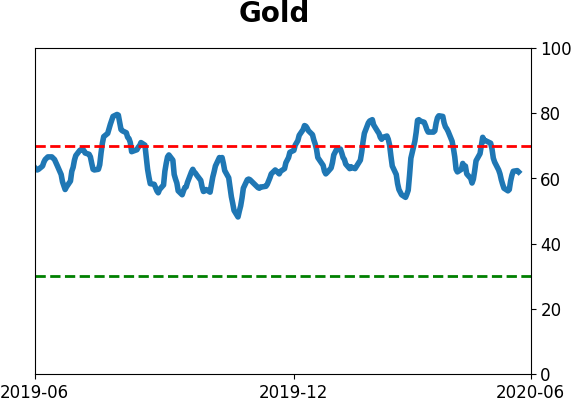
Gold
|
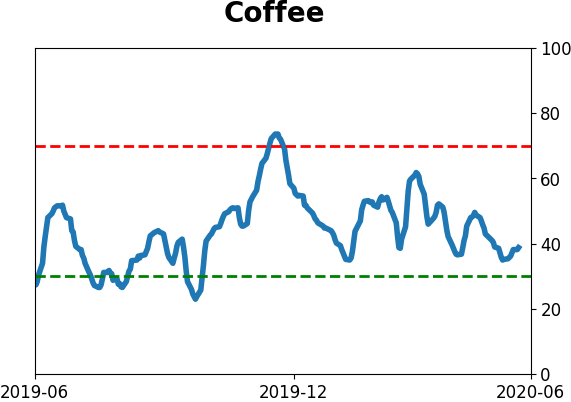
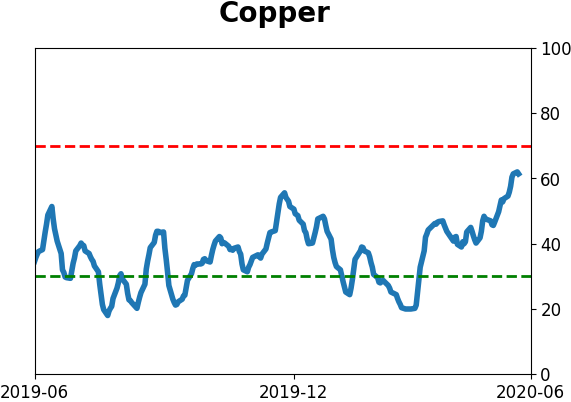
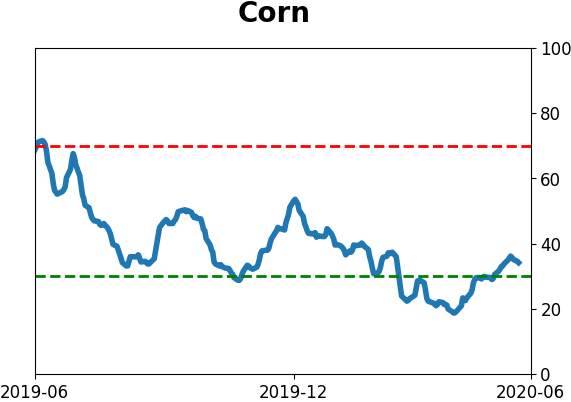
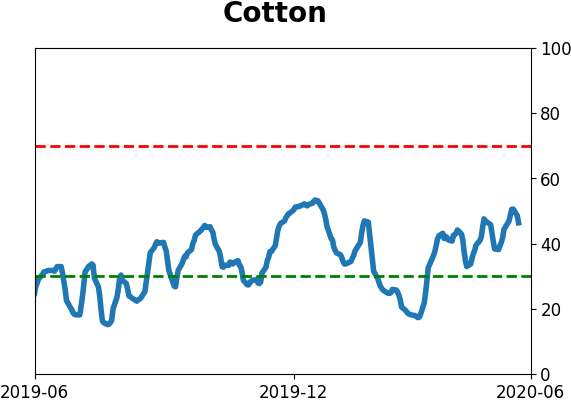
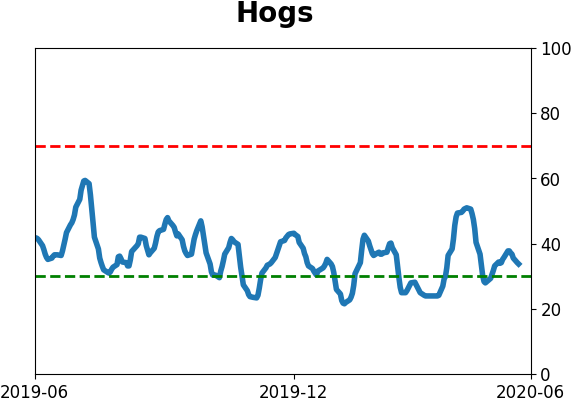
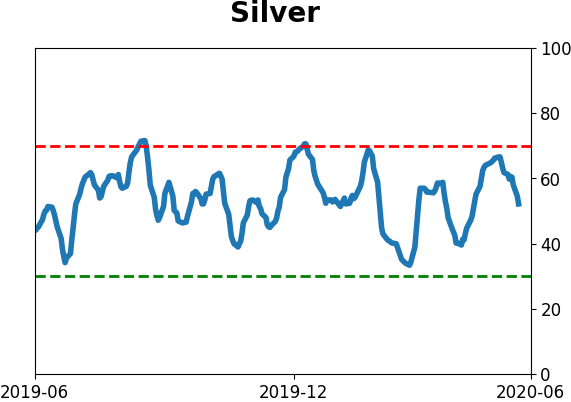
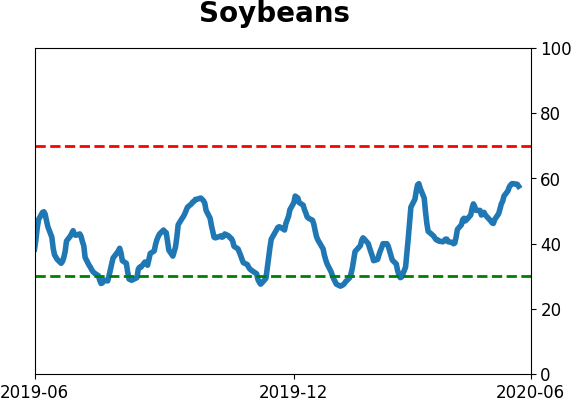
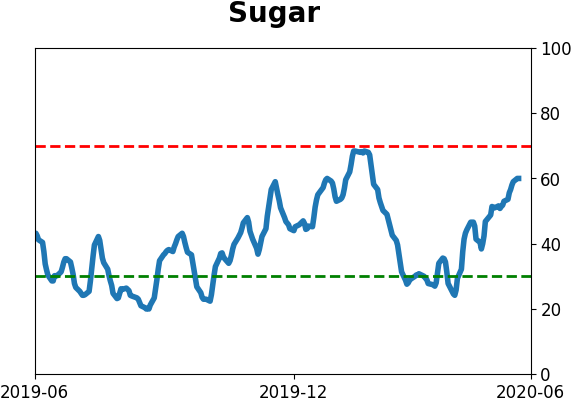
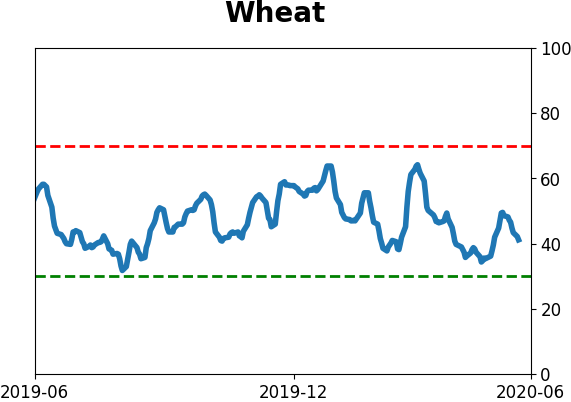
Agriculture
|
|
Research
BOTTOM LINE
Institutions had been piling into money markets, much as retail investors have been. Over the past year, asset growth in money markets hit a nearly 40-year high, and it has only now started to reverse. The "cash on the sidelines" argument is weak, and future returns didn't support this as a bullish argument. Hedge fund exposure to stocks shows conflicting signals, with perhaps a slight downside edge.
FORECAST / TIMEFRAME
None
|
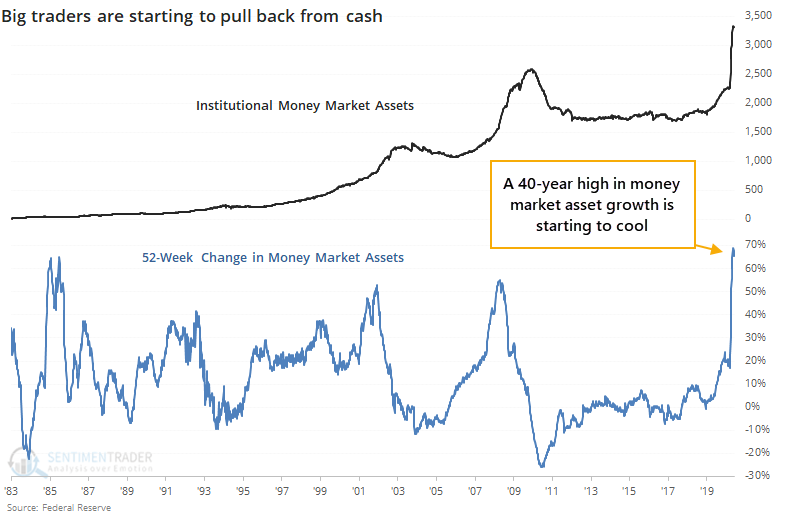
One of the standout pieces of data during the pandemic was the exponential rise in money market assets, including those catering to retail investors and institutions.
This always brings up the bulls' argument that there is a lot of "cash on the sidelines" to drive stocks higher, as the WSJ noted in late 2019. Clearly, it's not always a good argument but it's continuing to get repeated and probably will for all of time, despite common sense and empirical evidence.
Probably the best refutation of this line of thinking comes from money manager Cliff Asness (bold added):
"Every time someone says, “There is a lot of cash on the sidelines,” a tiny part of my soul dies. There are no sidelines. Those saying this seem to envision a seller of stocks moving her money to cash and awaiting a chance to return. But they always ignore that this seller sold to somebody, who presumably moved a precisely equal amount of cash off the sidelines.
If you want to save those who say this, I can think of two ways. First, they really just mean that sentiment is negative but people are waiting to buy. If sentiment turns, it won’t move any cash off the sidelines because, again, that just can’t happen, but it can mean prices will rise because more people will be trying to get off the nonexistent sidelines than on. Second, over the long term, there really are sidelines in the sense that new shares can be created or destroyed (net issuance), and that may well be a function of investor sentiment. But even though I’ve thrown people who use this phrase a lifeline, I believe that they really do think there are sidelines. There aren’t. Like any equilibrium concept (a powerful way of thinking that is amazingly underused), there can be a sideline for any subset of investors, but someone else has to be doing the opposite. Add us all up and there are no sidelines."
When we start to see the meteoric rise in money market assets stop and reverse, surely the "cash on the sidelines" argument will be used. And we're starting to see that right now among institutions.
Through late May, the year-over-year growth in institutional money market assets surged to nearly 70%, the highest in almost 40 years. The latest data shows that's finally starting to cool.
It seems like this should be a good thing. If institutions are pulling funds from cash, then it has to go somewhere. Bulls like to assume that the most logical place is in stocks. Historically, it has been tough to support that assumption.
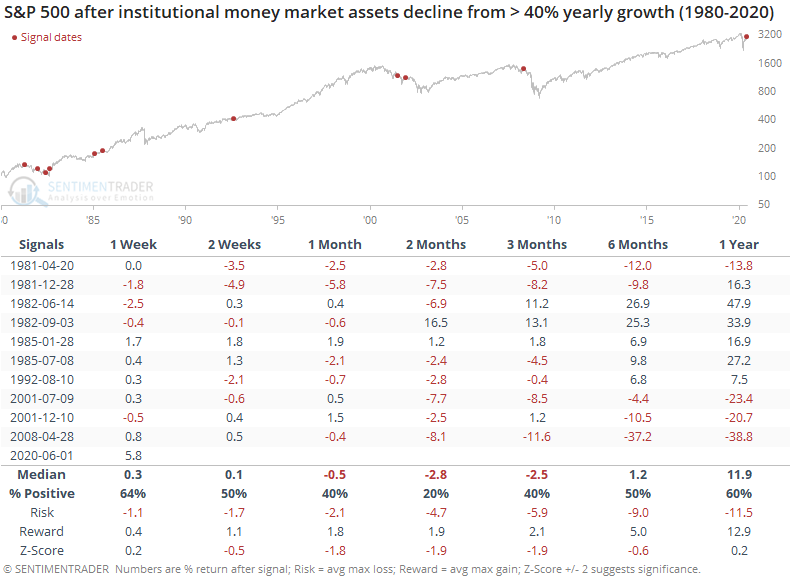
When the yearly growth in institutional money market assets reached at least 40% then pulled back by at least 3%, it did consistently signal that they would keep pulling money out of those liquid accounts. But it did not consistently signal that the money was going into stocks, or at least that it made a difference.
Over the next 1-3 months, the S&P tended to fall, with poor returns and risk/reward ratio. The growth in institutional assets in money markets started to reverse early in the last two bear markets, not at the end of them.
One reason to think that at least some of that money could find its way into stocks is the seeming under-exposure that hedge funds have to stocks. This is based on a rolling 20-day beta of the return in equity long/short hedge funds to the return in the S&P 500.
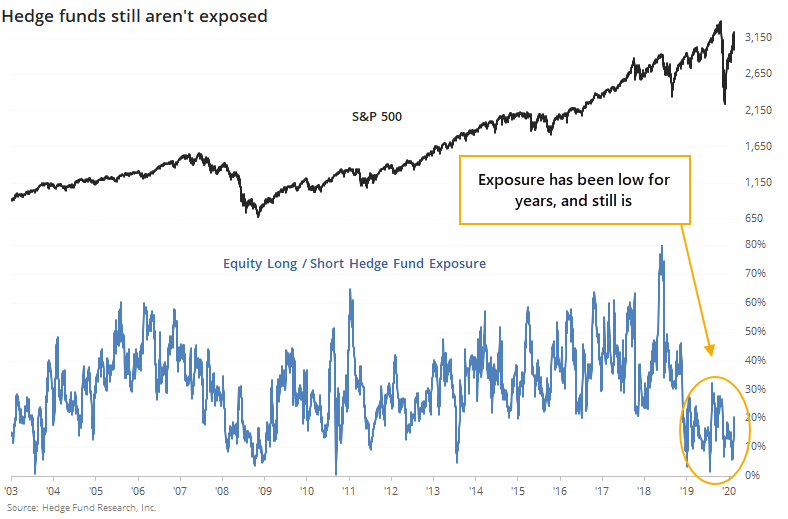
Prior to the last couple of years, this was a consistent contrary indicator. Maybe something changed in 2019, but funds never really seemed fully geared toward stocks, and it hasn't been an effective signal since 2018.
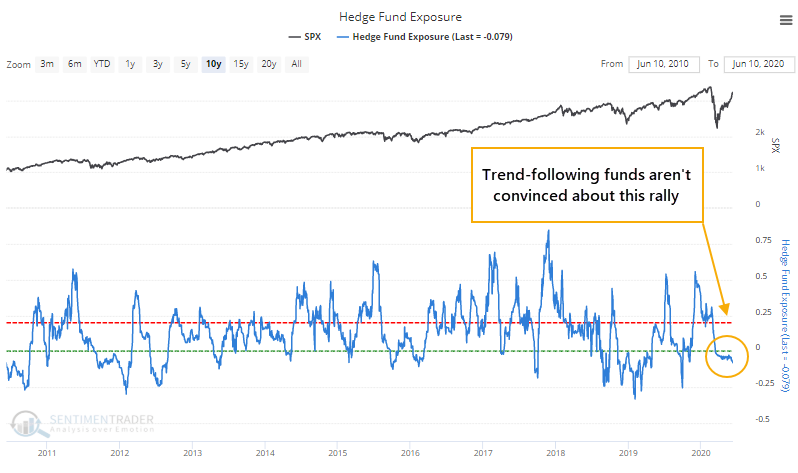
It's been a better signal if we look at trend-following funds, and that, too, is showing that exposure is still low.
According to a survey by Bank of America, their hedge fund clients show a high degree of exposure. Theoretically, this should be a more accurate measure because ostensibly they are directly observing positions, instead of implying them like the above indicators.
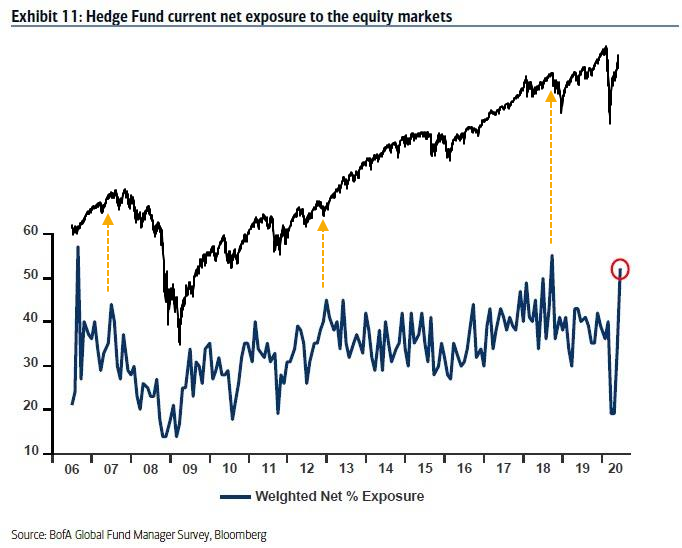
Other times when BofA clients had high exposure led to generally poor returns, but it was a much better contrary signal when funds had low exposure.
It's hard to read too much into all this. Hedge funds might (or might not) be heavily exposed, which doesn't tell us a whole lot. We'd place more weight on the direct readings from BofA, so maybe this is a modest negative. It would be more compelling as a warning sign if it had a better track record, and other measures of exposure were suggesting funds were aggressively long.
The fact that institutions have started pulling funds from money markets should be a good sign but objectively has not been. The overall tone is slightly negative, but not enough to consider it an edge.
BOTTOM LINE
Over the past 3 days, the Russell 2000 has rallied at least 2% and the Nasdaq Composite at least 1%. That has indicated "too much too fast" on a short- to medium-term basis, especially for the broader indexes like the S&P 500. It was mostly a good sign for the Nasdaq, though.
FORECAST / TIMEFRAME
None
|
After it looked like the recovery was going to take a break, with large losses last Thursday, stocks have stormed back. Especially some of the higher-beta ones in indexes like the Nasdaq Composite and Russell 2000.
For the small-cap Russell, it just capped off three straight days with at least a 2% gain. That's only happened three other times.
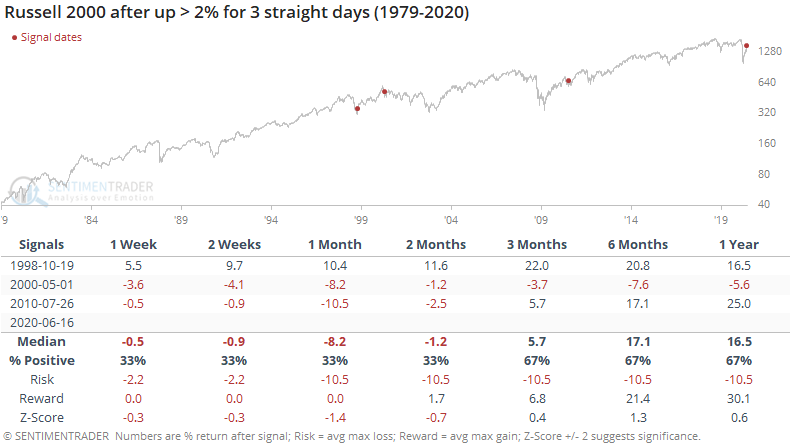
When it triggered during the initial burst from the 1998 bottom, it was a great sign of momentum. The other two times, when the Russell was near its highs, it led to some short-term give-back of the gains, with large losses over the next month.
It was better for the S&P 500, though it also showed a negative return over the next month two of the three times.
The Nasdaq Composite, which contains a large number of technology-related stocks, has also seen a boost over the past few sessions, rising at least 1% each day.
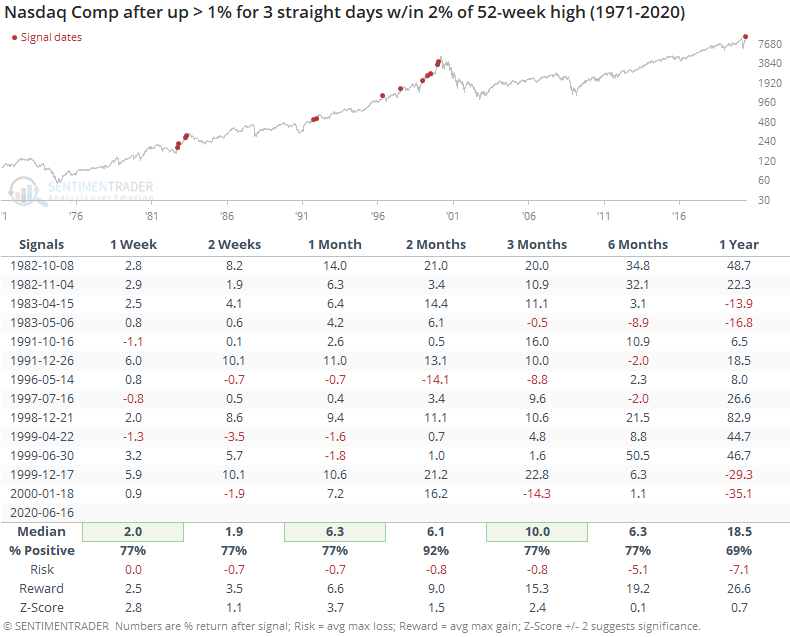
Coming out of the lows in 1982 and 1998, tech stocks continued to roar over the medium- to long-term, though it ultimately gave back much or all of those large gains. The other signals preceded mixed returns. Even so, two months later the Nasdaq showed only a single loss.
For the S&P, it was mostly a good sign, but not nearly as strong as for the Nasdaq itself.
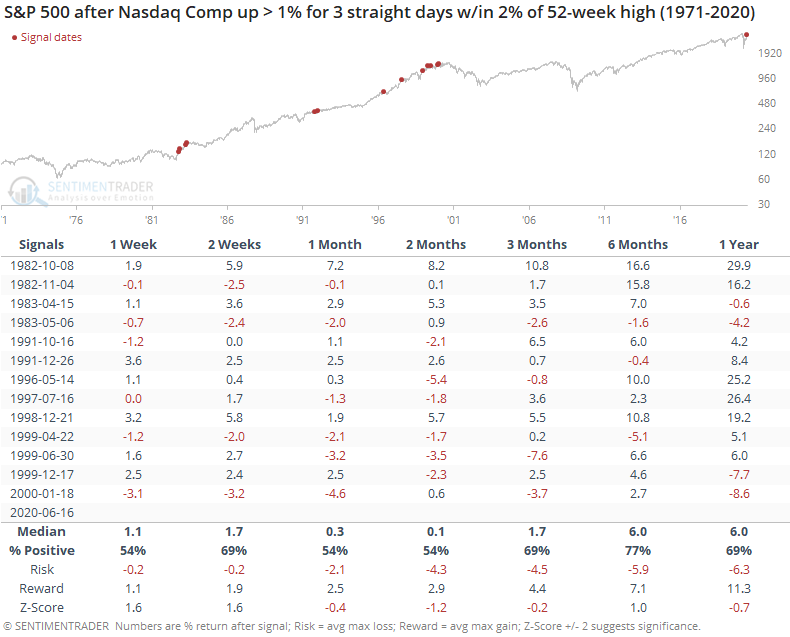
The S&P was higher only 54% of the time two months later. Over the past 30 years, the S&P showed a negative return sometime between 1-6 months later every time but once (1998).
A stretch like this will get financial media excited, while they should have been more impressed by signs of momentum in March and April. This kind of price rise has a mixed record, and can't be considered too much of a positive.
Active Studies
| Time Frame | Bullish | Bearish | | Short-Term | 0 | 1 | | Medium-Term | 8 | 6 | | Long-Term | 40 | 1 |
|
Indicators at Extremes
Portfolio
| Position | Weight % | Added / Reduced | Date | | Stocks | 29.8 | Reduced 9.1% | 2020-06-11 | | Bonds | 0.0 | Reduced 6.7% | 2020-02-28 | | Commodities | 5.2 | Added 2.4%
| 2020-02-28 | | Precious Metals | 0.0 | Reduced 3.6% | 2020-02-28 | | Special Situations | 0.0 | Reduced 31.9% | 2020-03-17 | | Cash | 65.0 | | |
|
Updates (Changes made today are underlined)
In the first months of the year, we saw manic trading activity. From big jumps in specific stocks to historic highs in retail trading activity to record highs in household confidence to almost unbelievable confidence among options traders. All of that came amid a market where the average stock couldn't keep up with their indexes. There were signs of waning momentum in stocks underlying the major averages, which started triggering technical warning signs in late January. After stocks bottomed on the 23rd, they enjoyed a historic buying thrust and retraced a larger amount of the decline than "just a bear market rally" tends to. Those thrusts are the most encouraging sign we've seen in years. Through early June, we were still seeing thrusts that have led to recoveries in longer-term breadth metrics. The longer-term prospects for stocks (6-12 months) still look decent given the above. On a short- to medium-term basis, it was getting harder to make that case. Dumb Money Confidence spiked and there were multiple signs of a historic level of speculation. Given that, I reduced my exposure a bit when stocks gapped down and failed to hold the lows of late last week. This is likely the lowest I will go given what I still consider to be compelling positives over a longer time frame. There is not a slam-dunk case to be made for either direction, so it will seem like a mistake whether stocks keep dropping (why didn't I sell more?) or if they turn and head higher (why did I let short-term concerns prevail?). After nearly three decades of trading, I've learned to let go of the idea of perfection.
RETURN YTD: -5.8% 2019: 12.6%, 2018: 0.6%, 2017: 3.8%, 2016: 17.1%, 2015: 9.2%, 2014: 14.5%, 2013: 2.2%, 2012: 10.8%, 2011: 16.5%, 2010: 15.3%, 2009: 23.9%, 2008: 16.2%, 2007: 7.8%
|
|
Phase Table
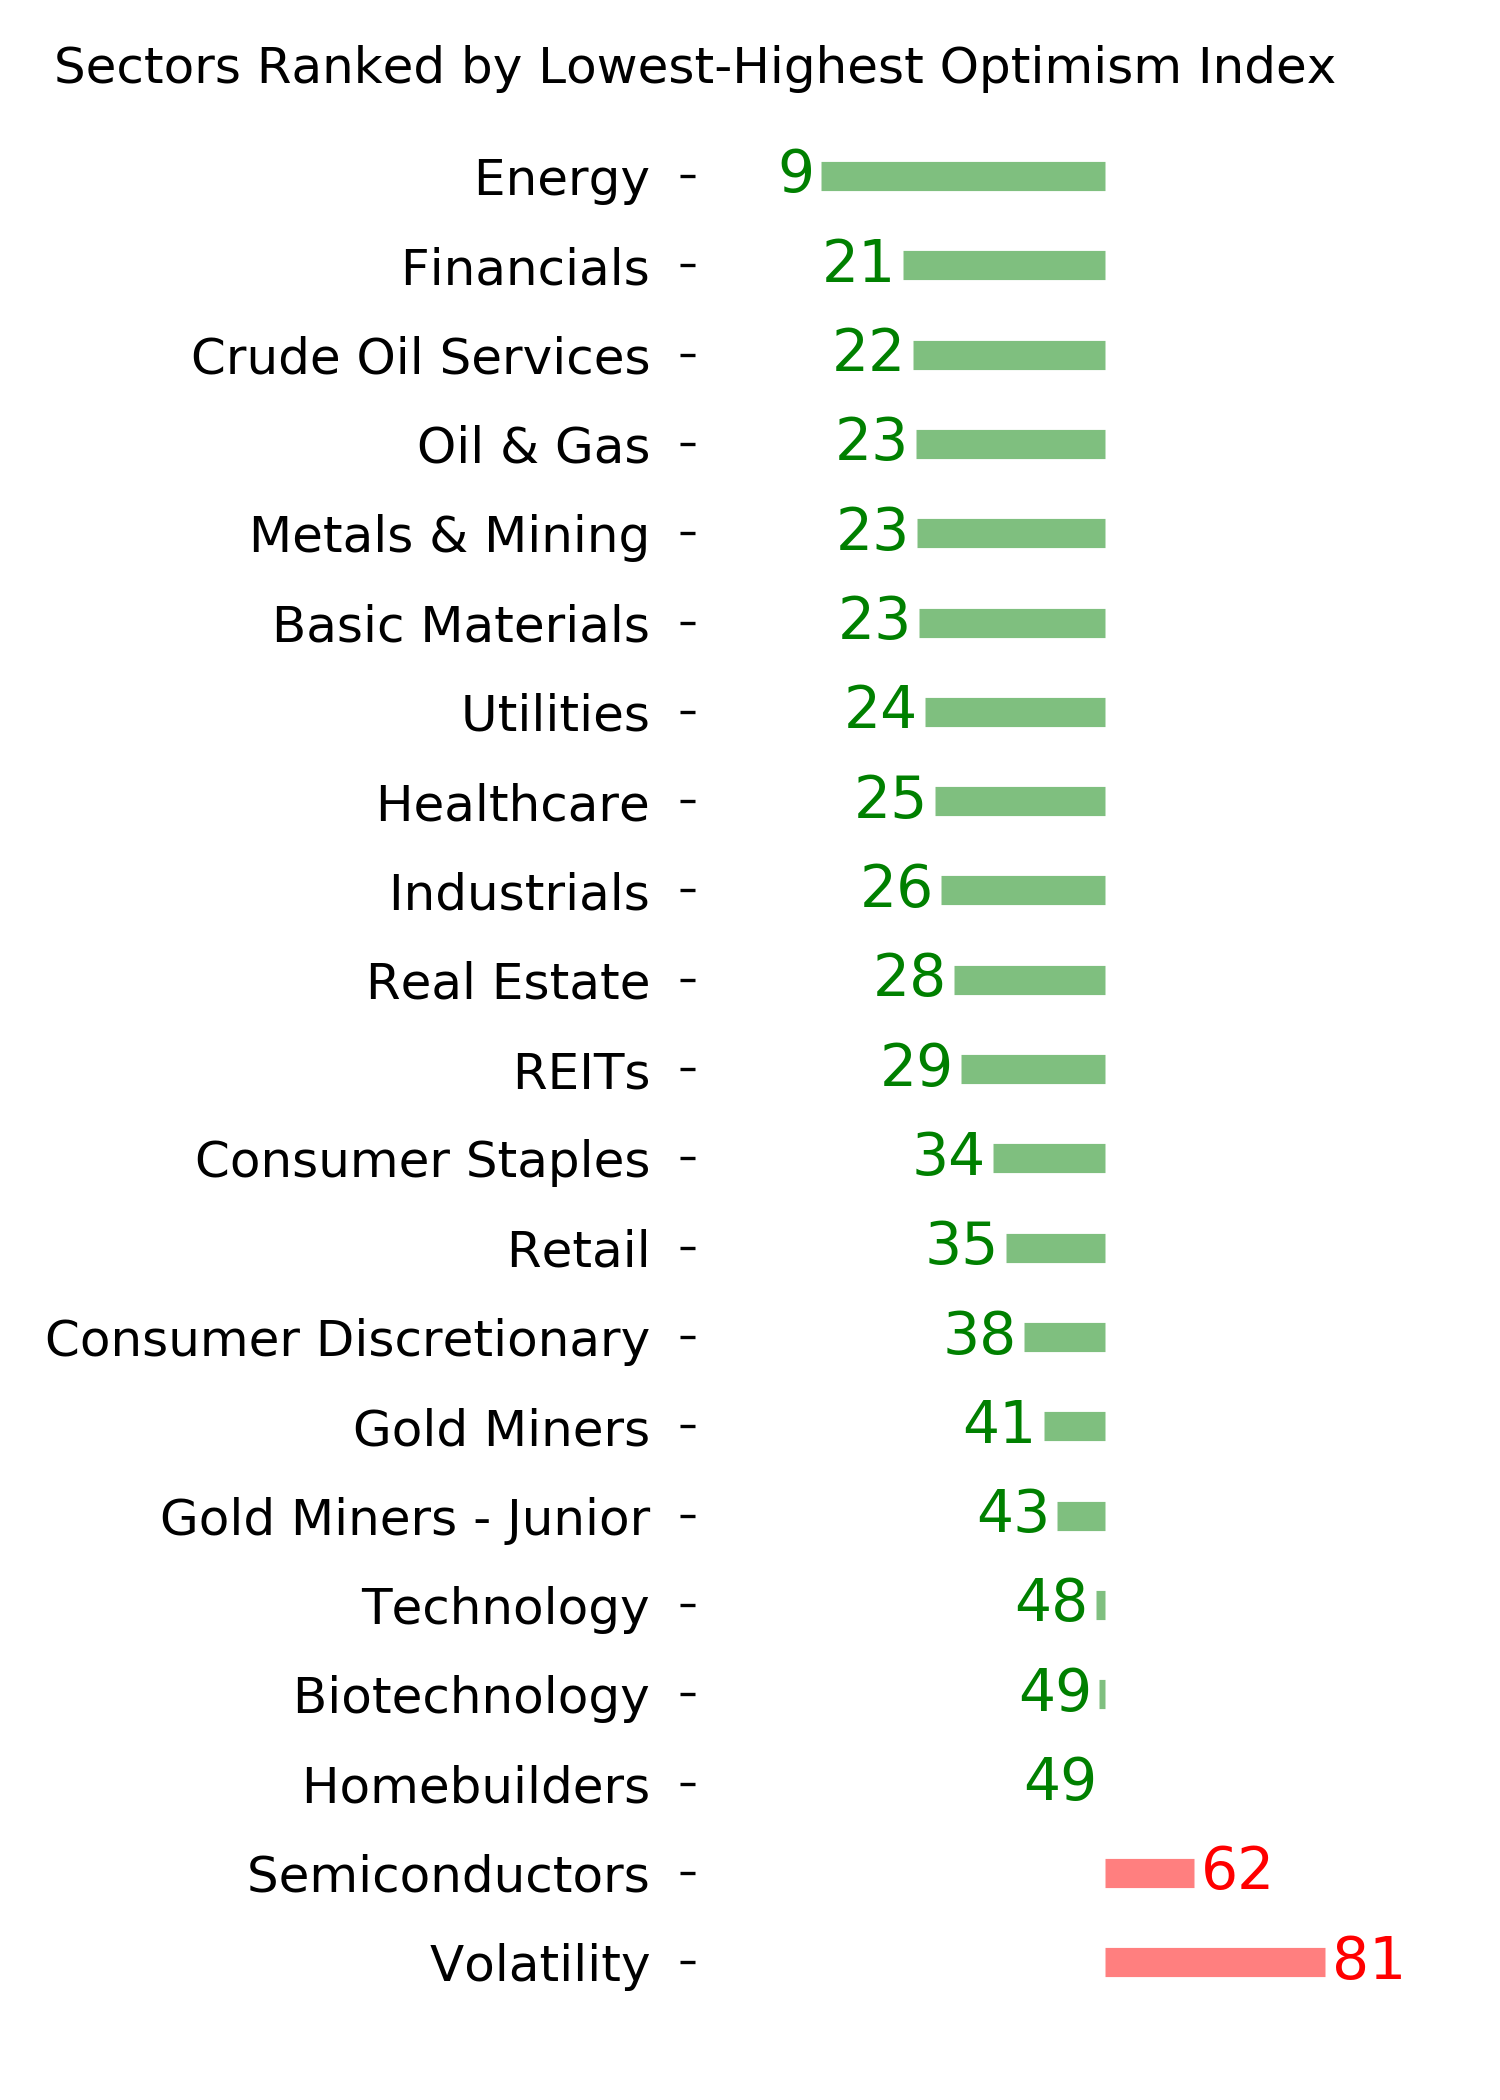
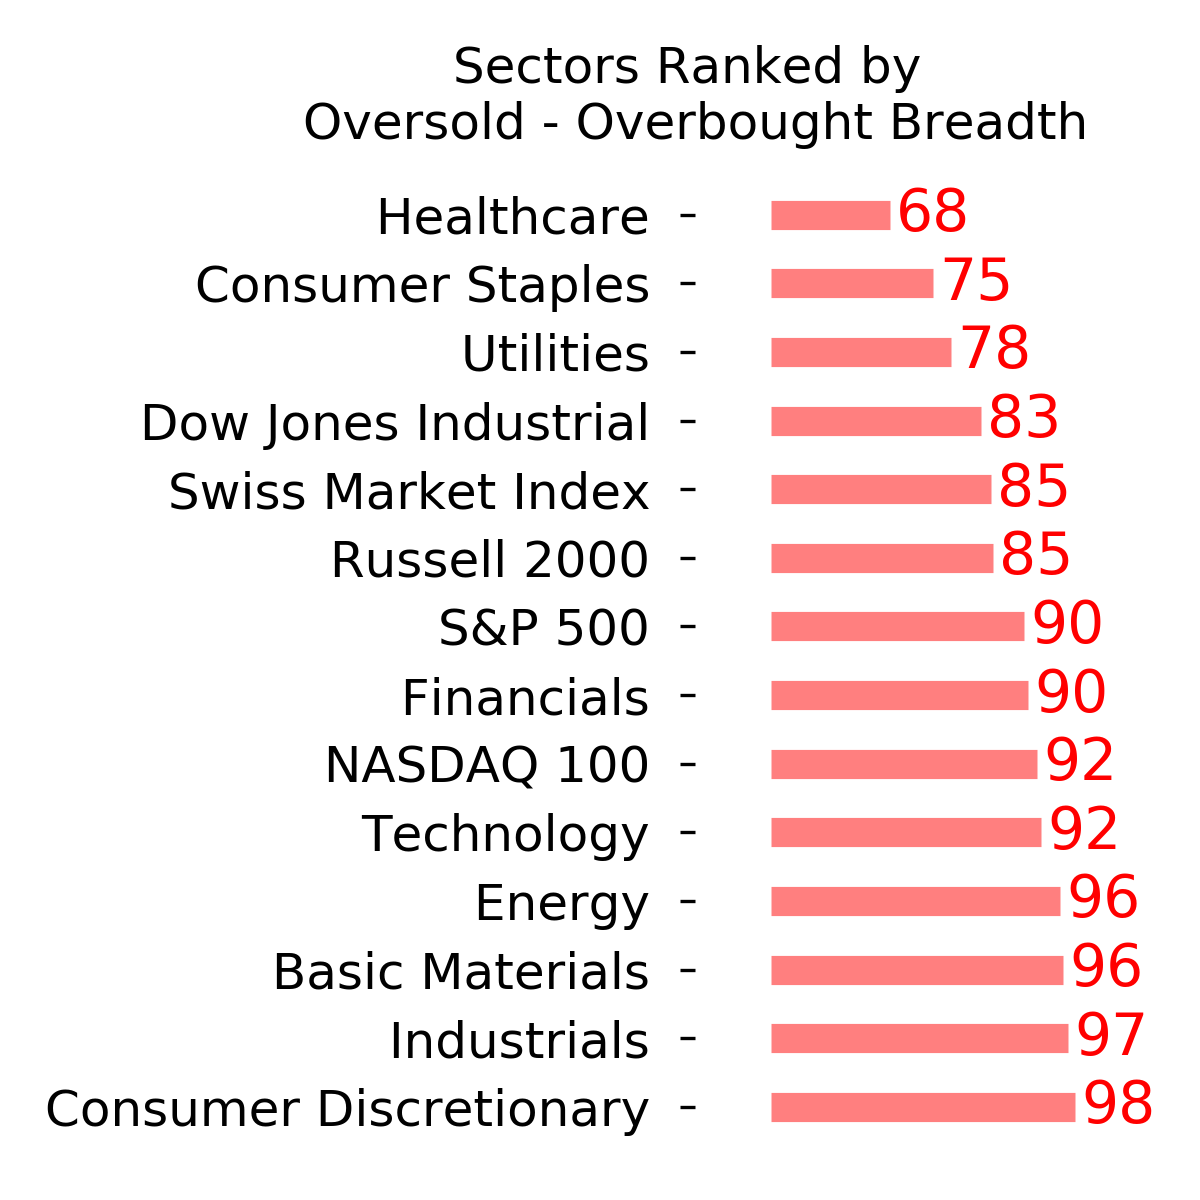
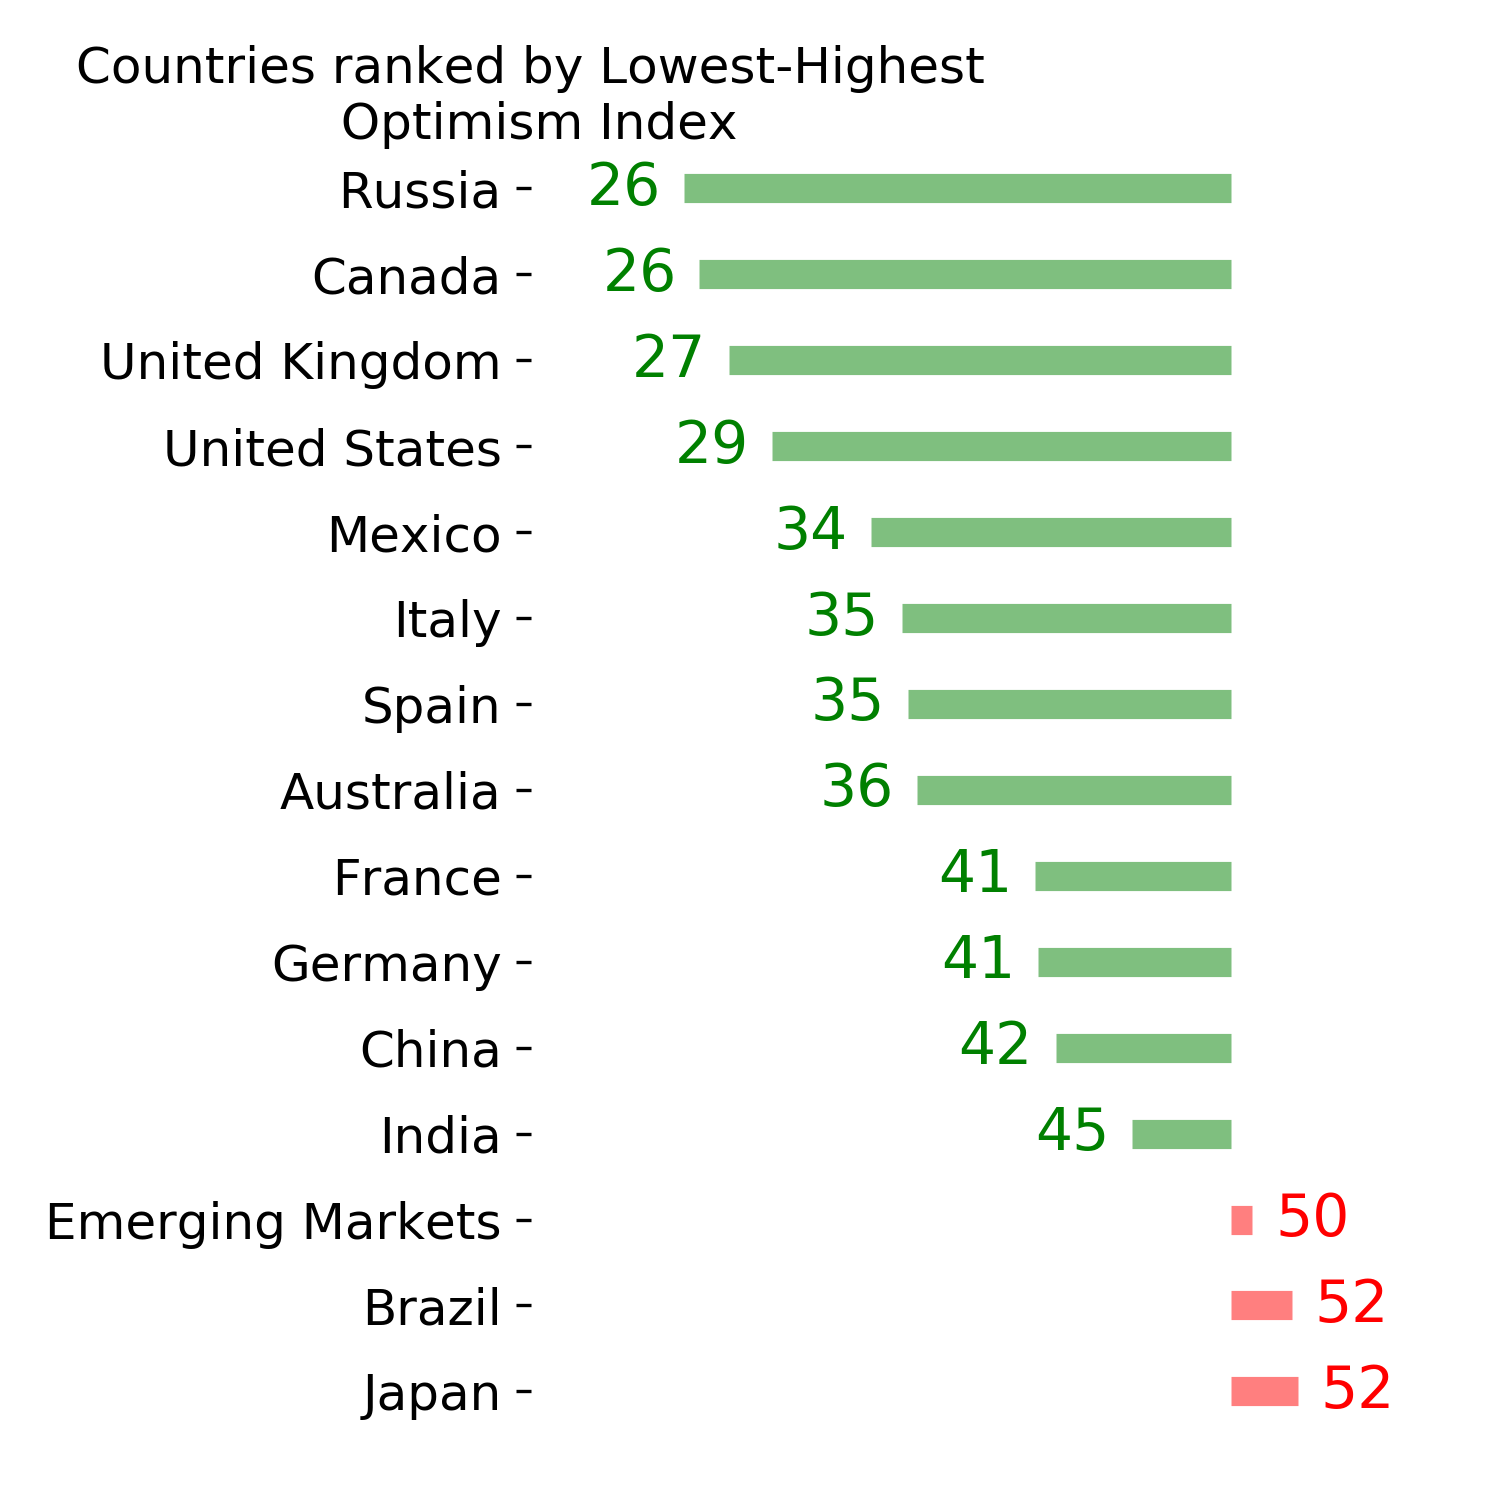
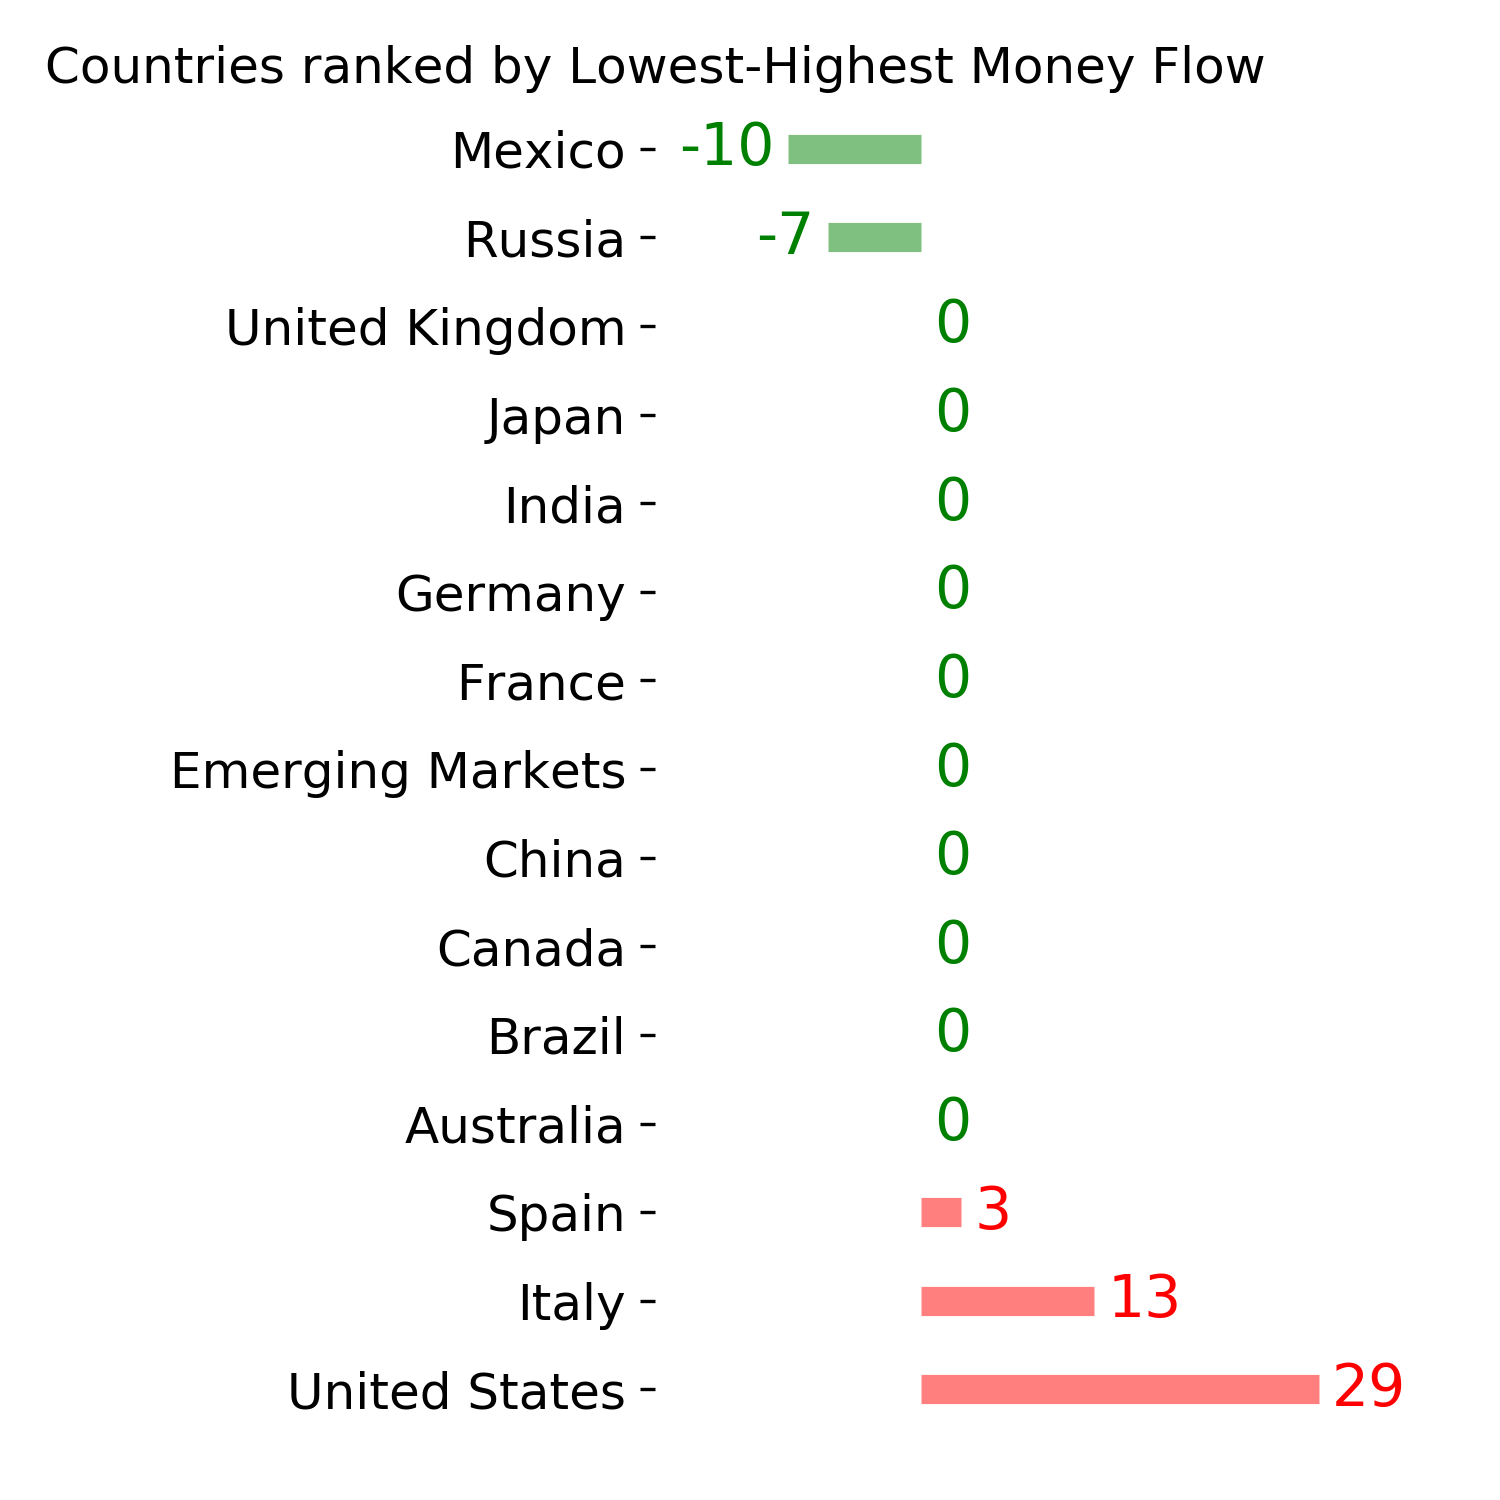
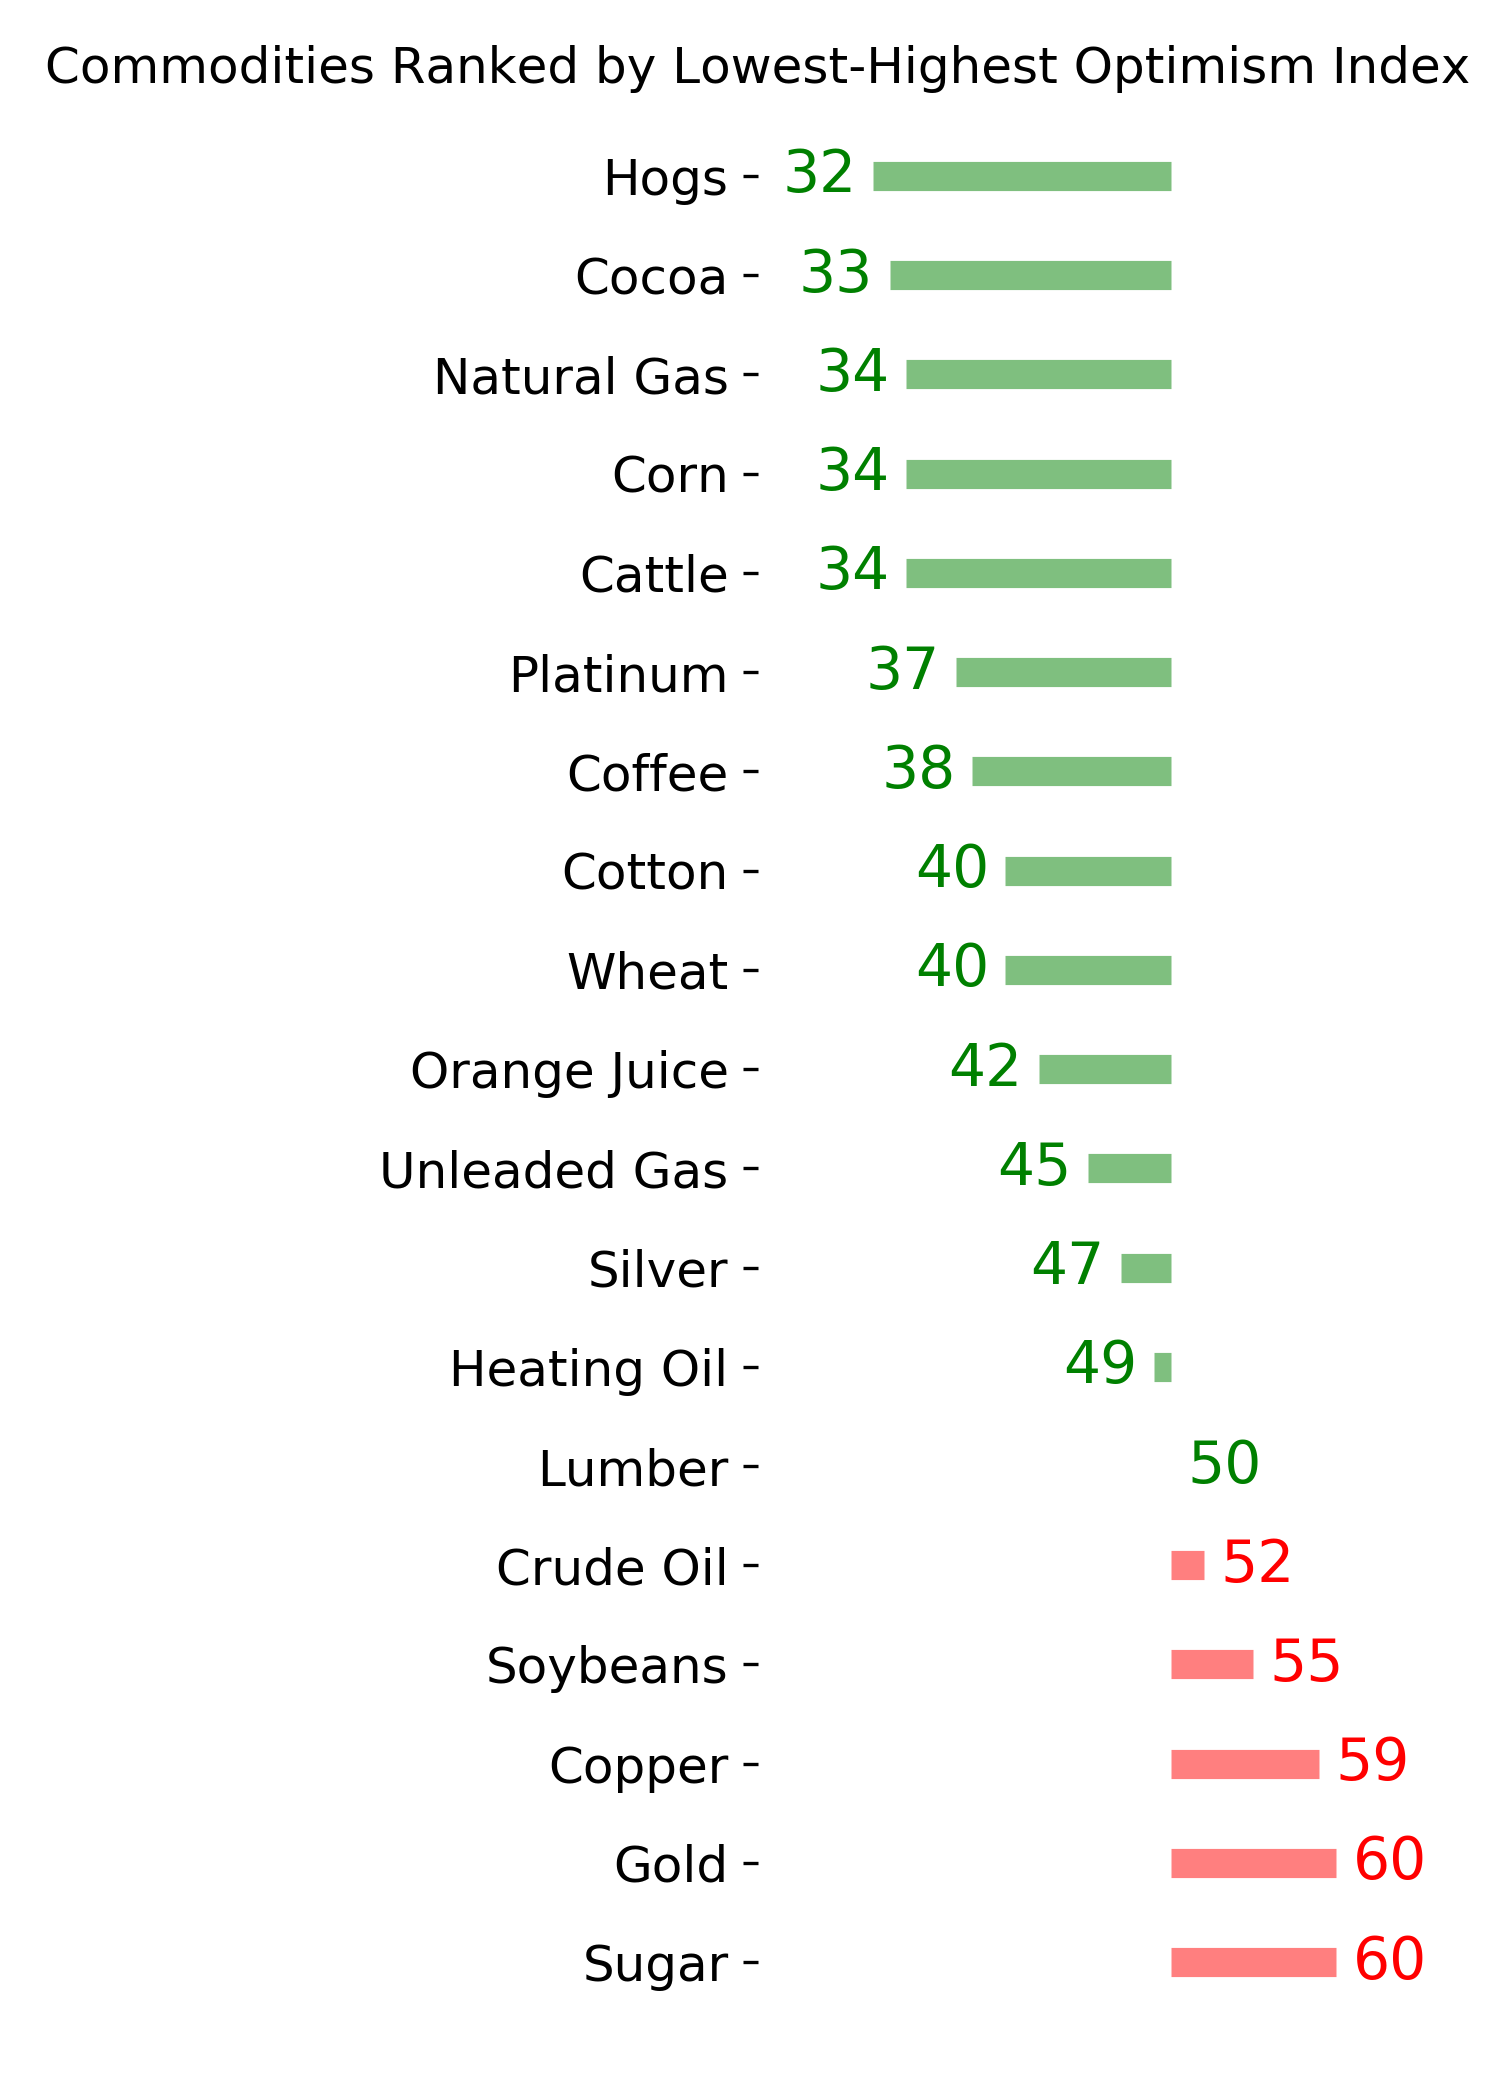
Ranks
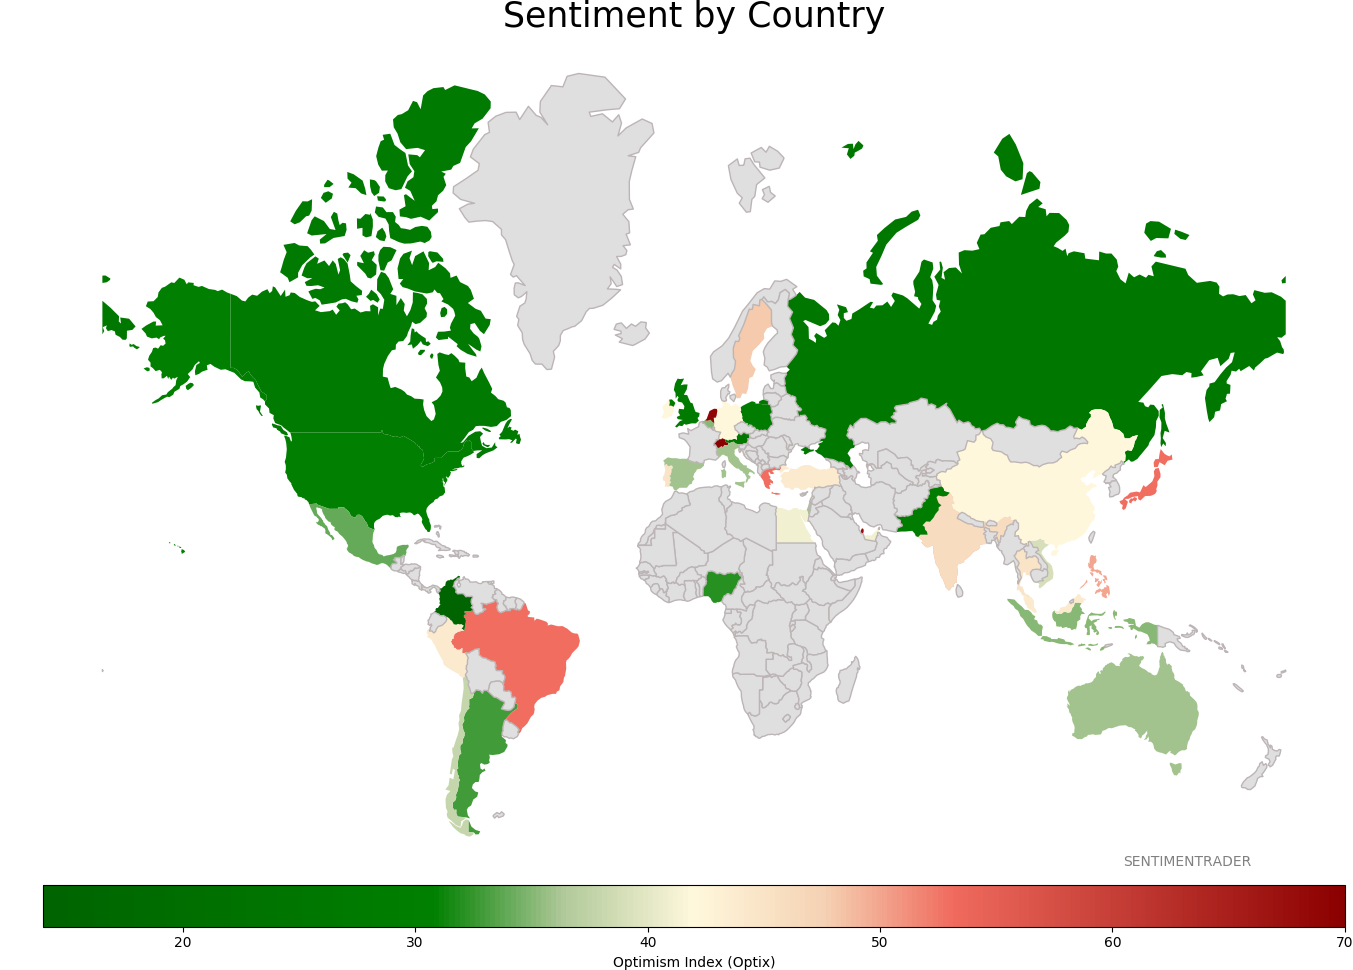
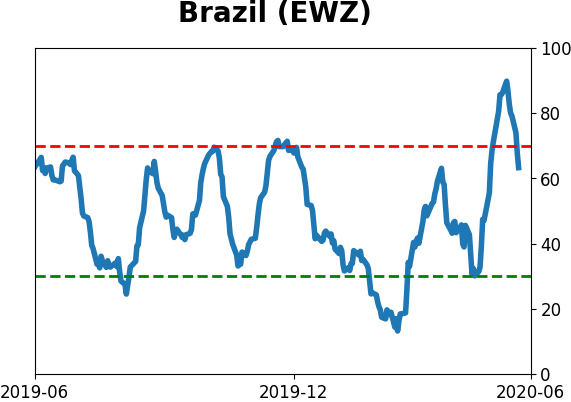
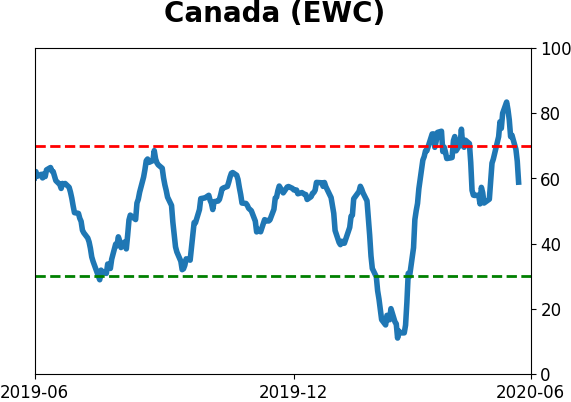
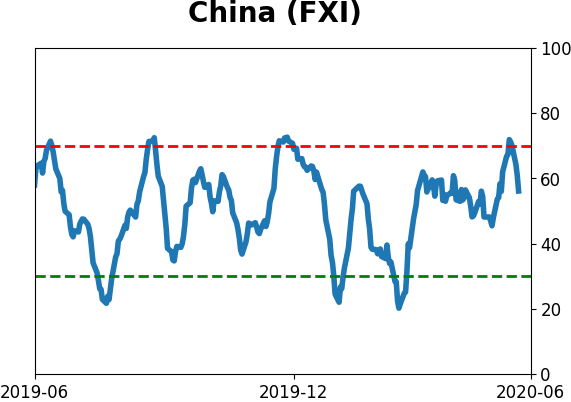
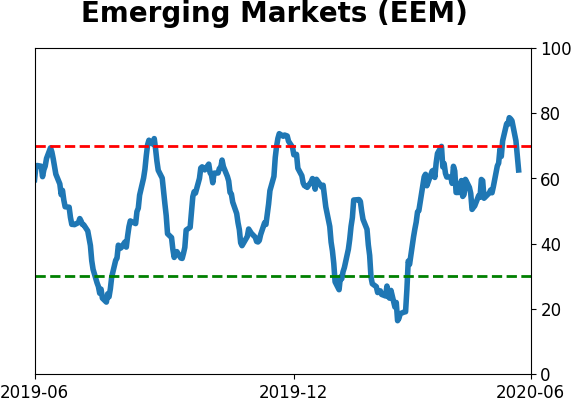
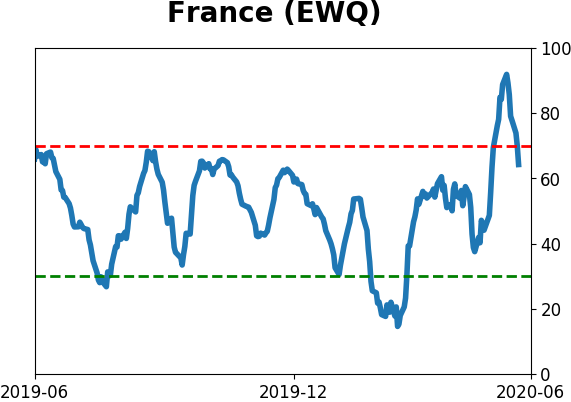
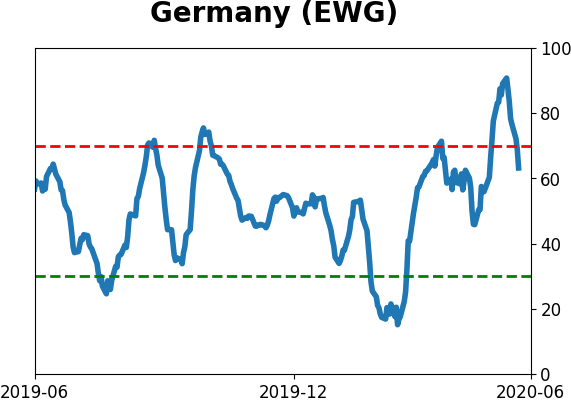
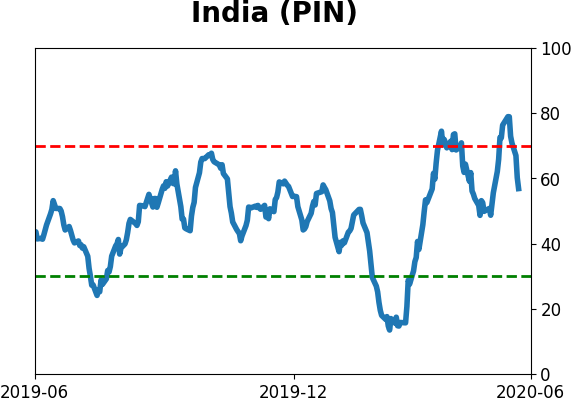
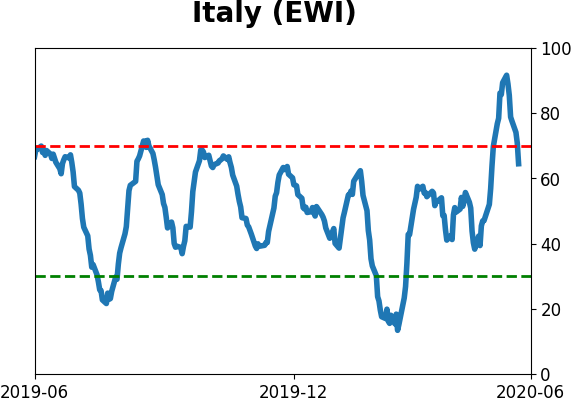
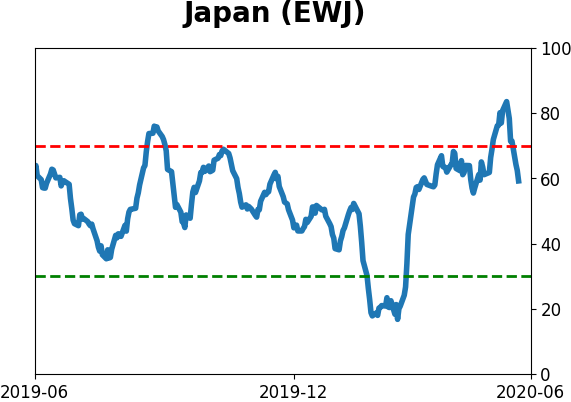
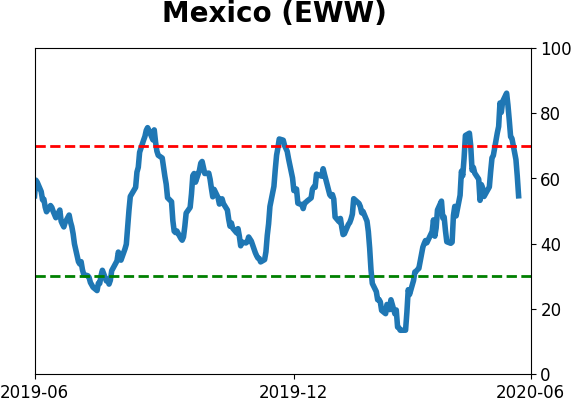
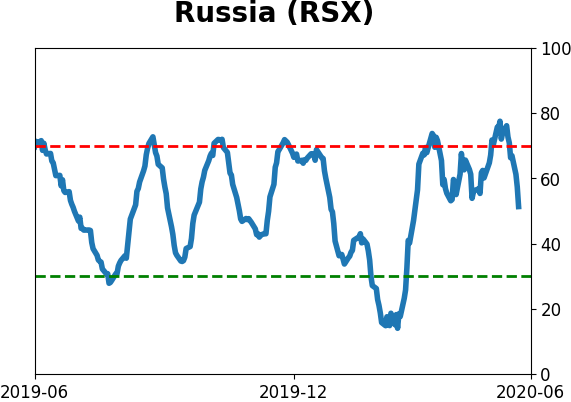
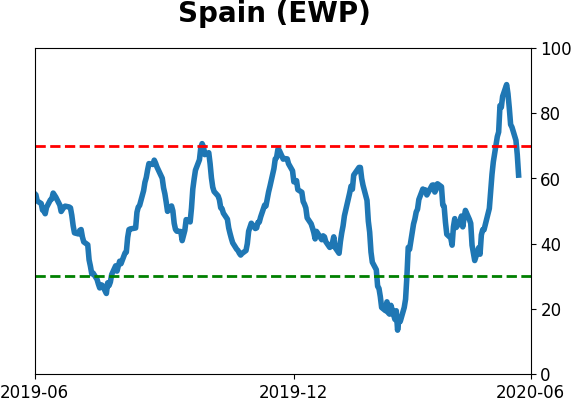
Sentiment Around The World
Optimism Index Thumbnails
|
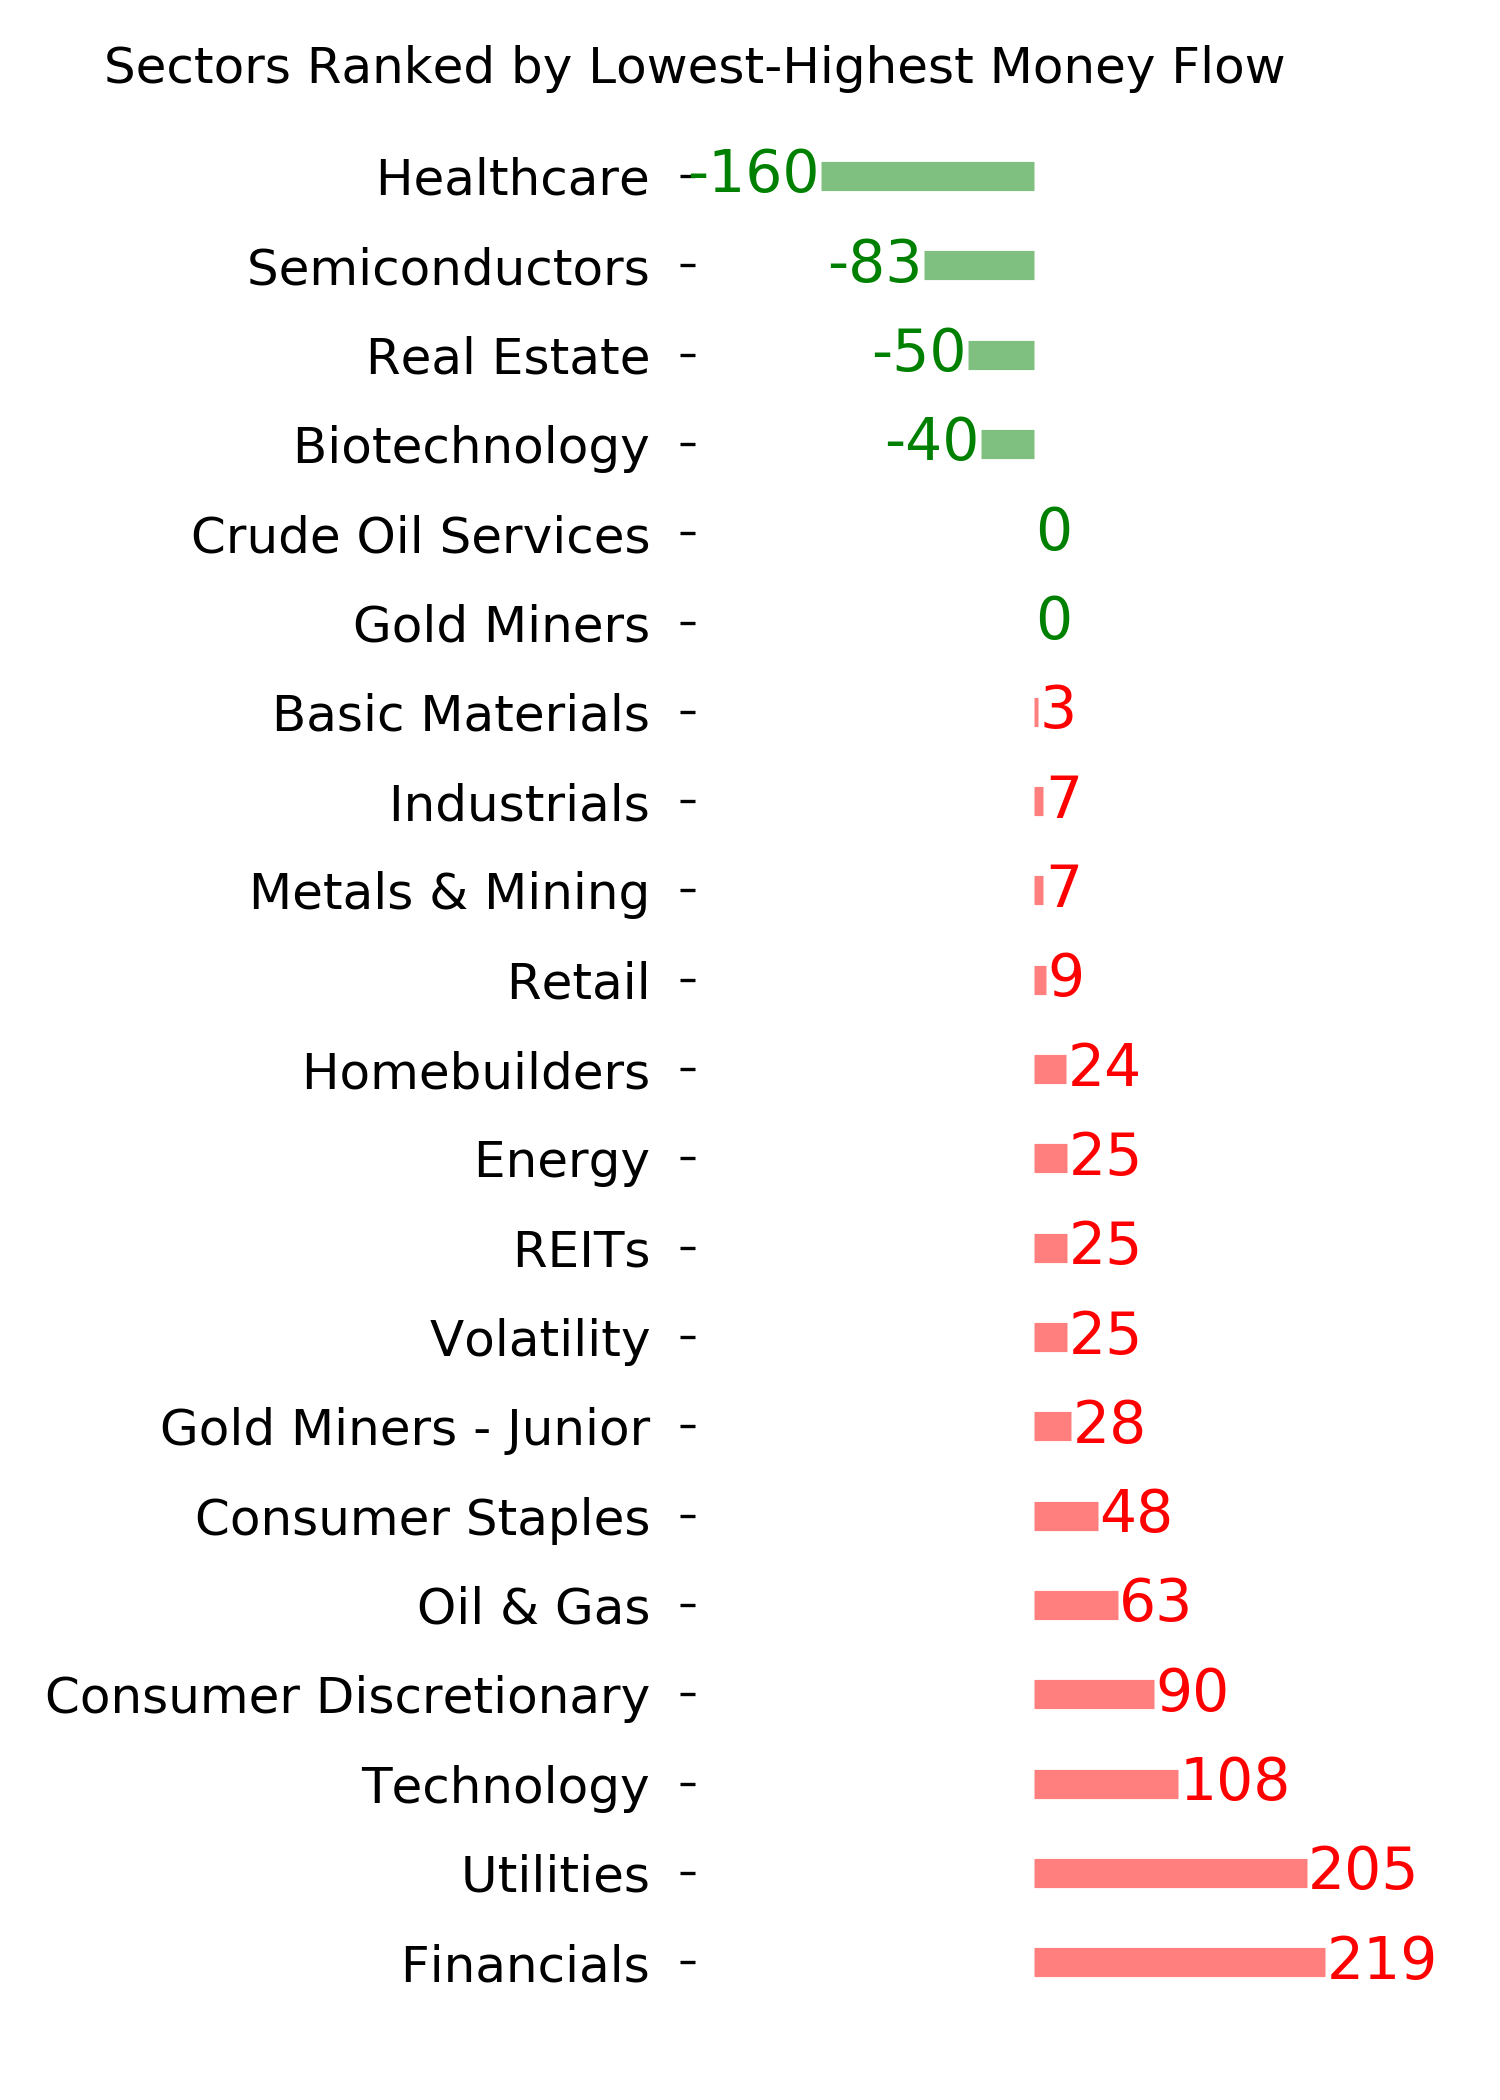
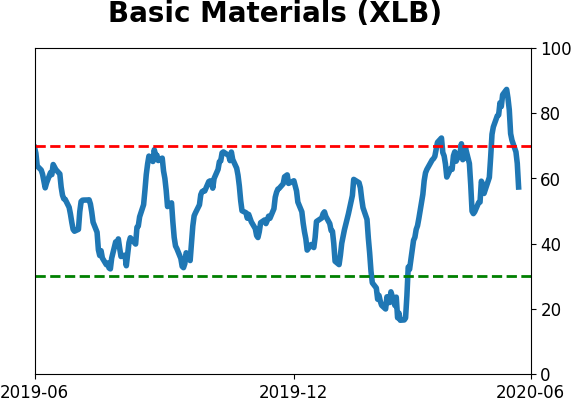
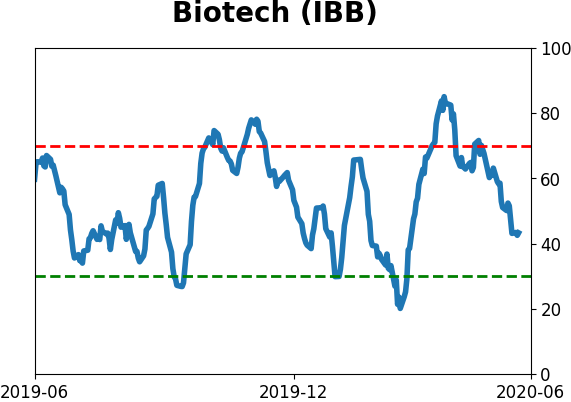
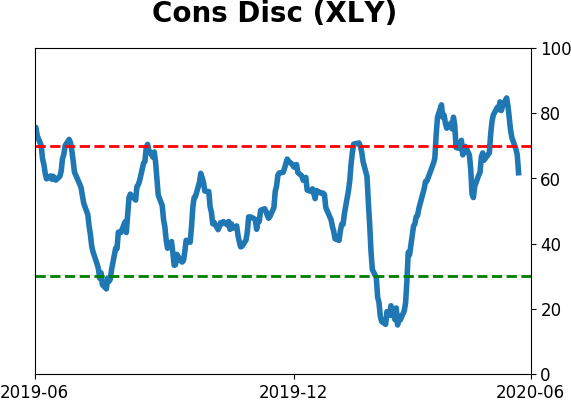
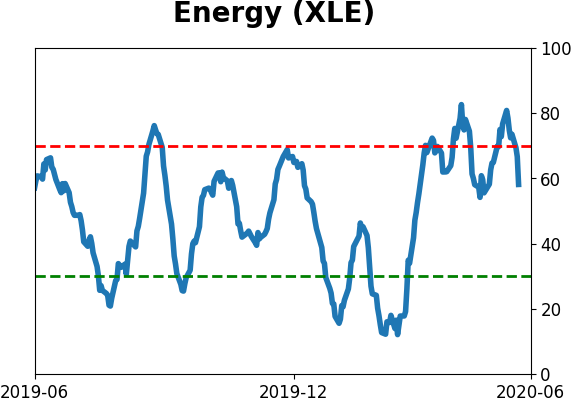
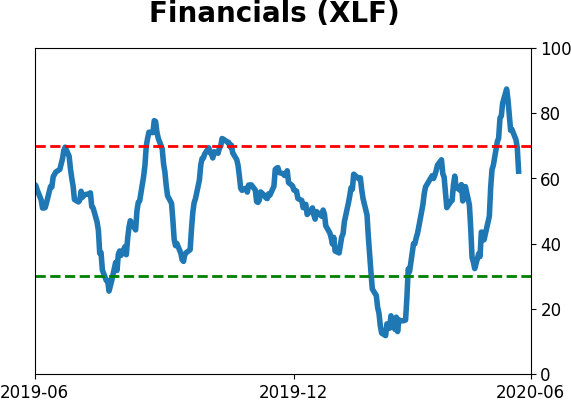
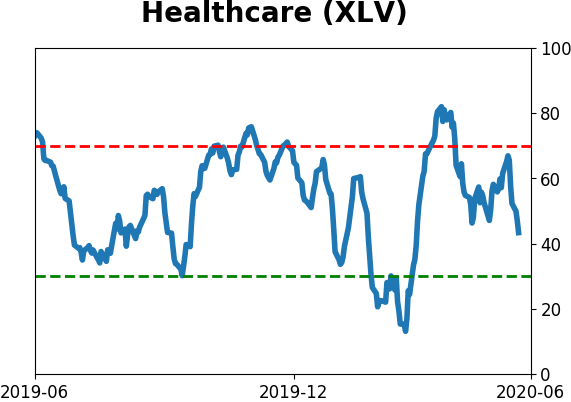
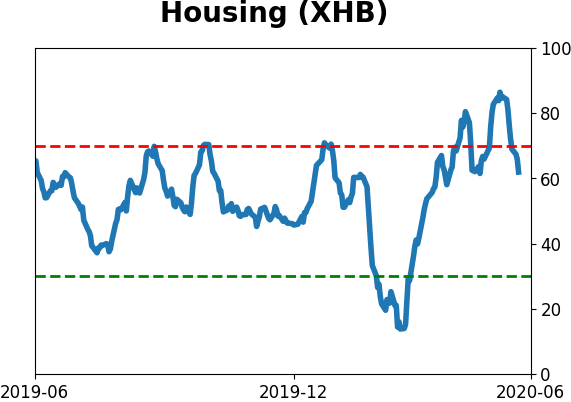
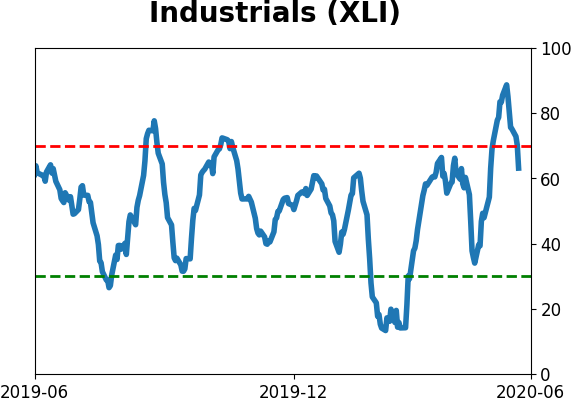
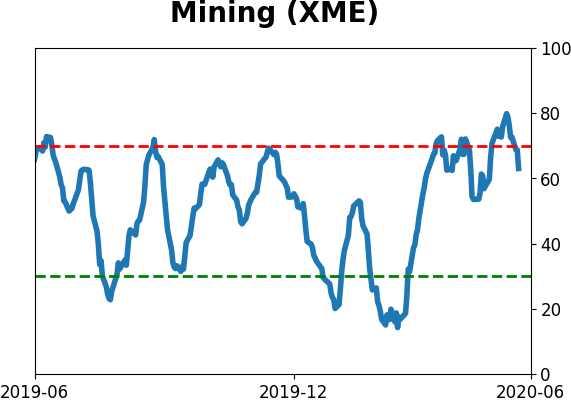
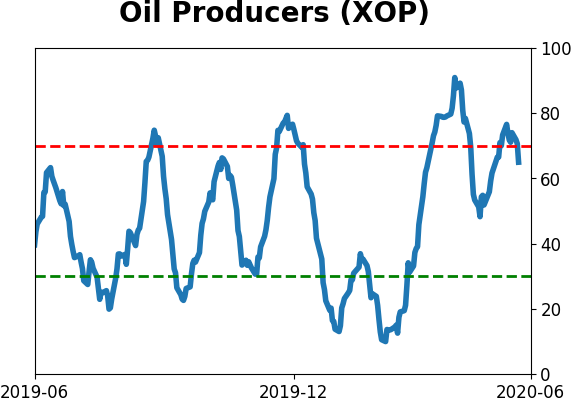
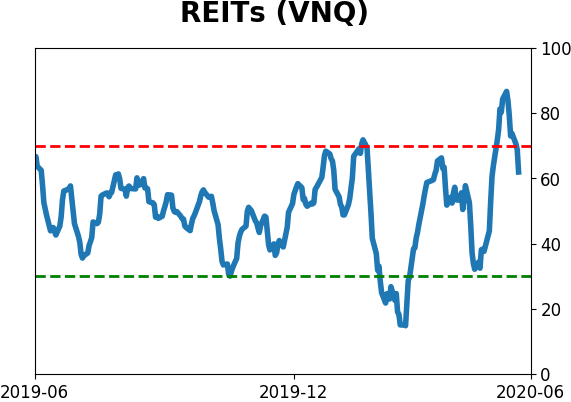
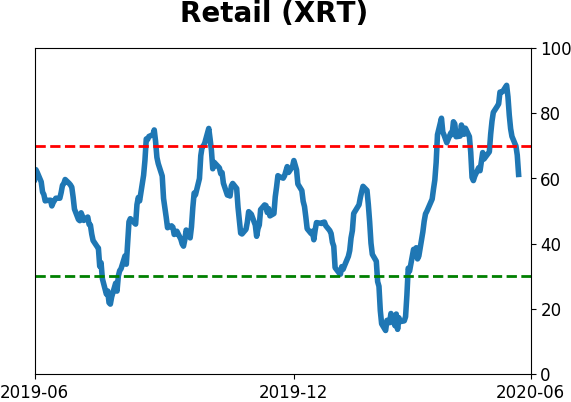
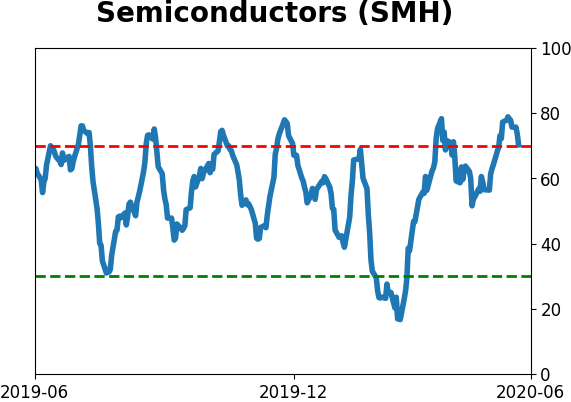
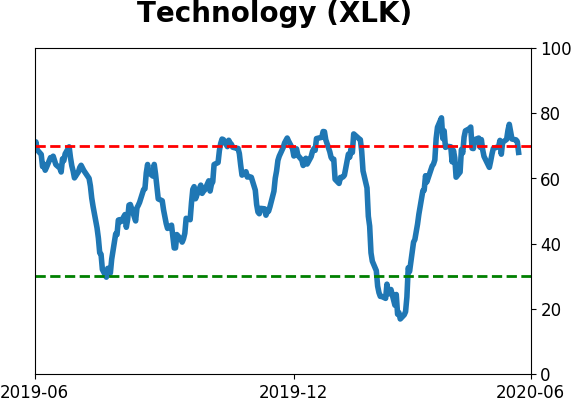
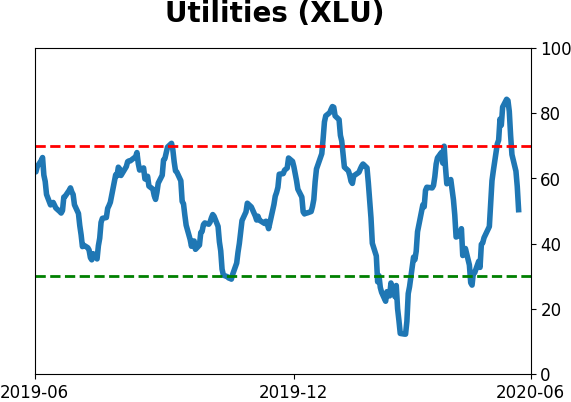
Sector ETF's - 10-Day Moving Average
|
|
|
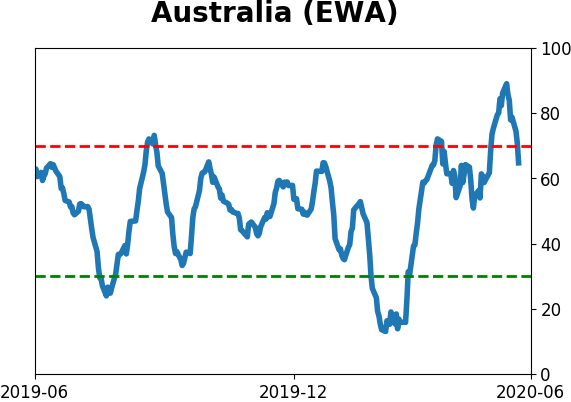
Country ETF's - 10-Day Moving Average
|
|
|
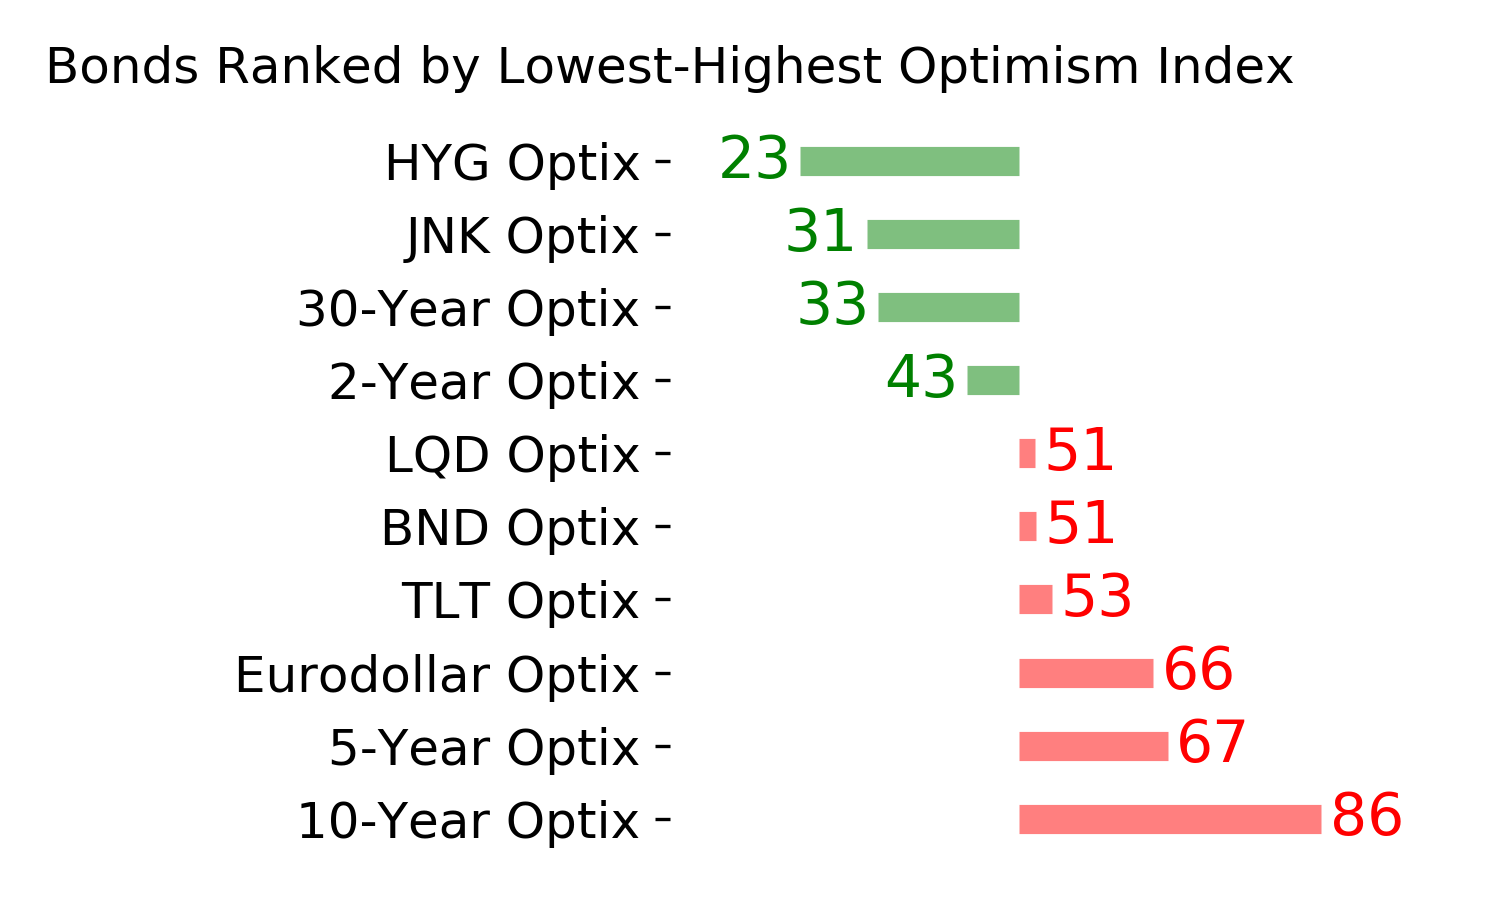
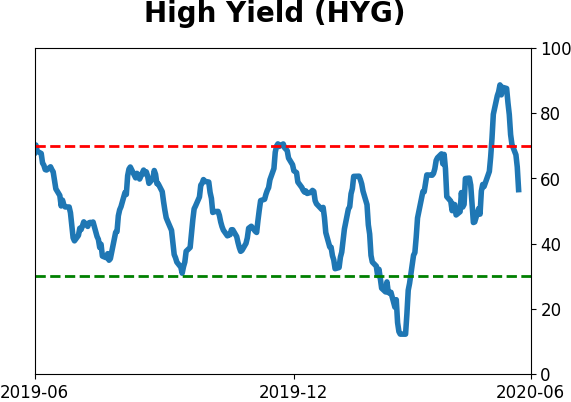
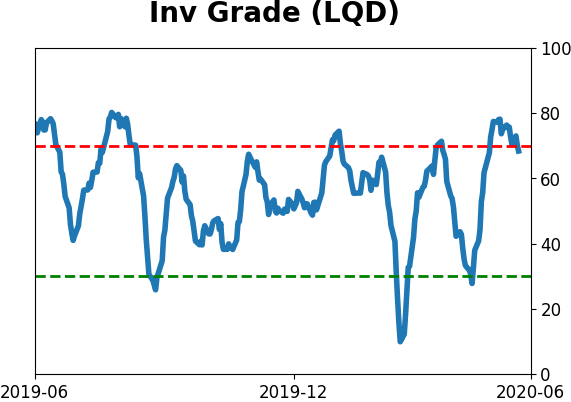
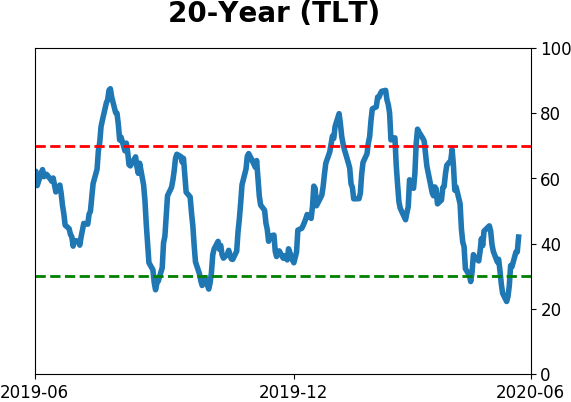
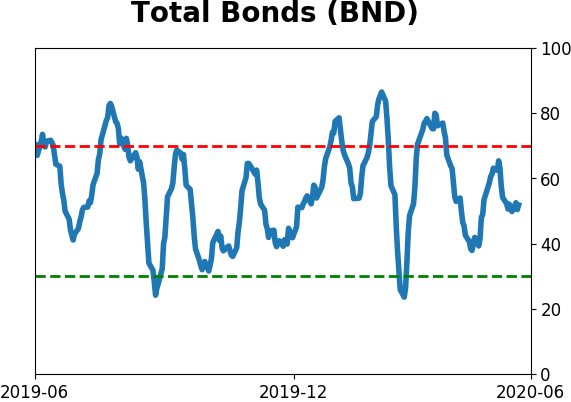
Bond ETF's - 10-Day Moving Average
|
|
|
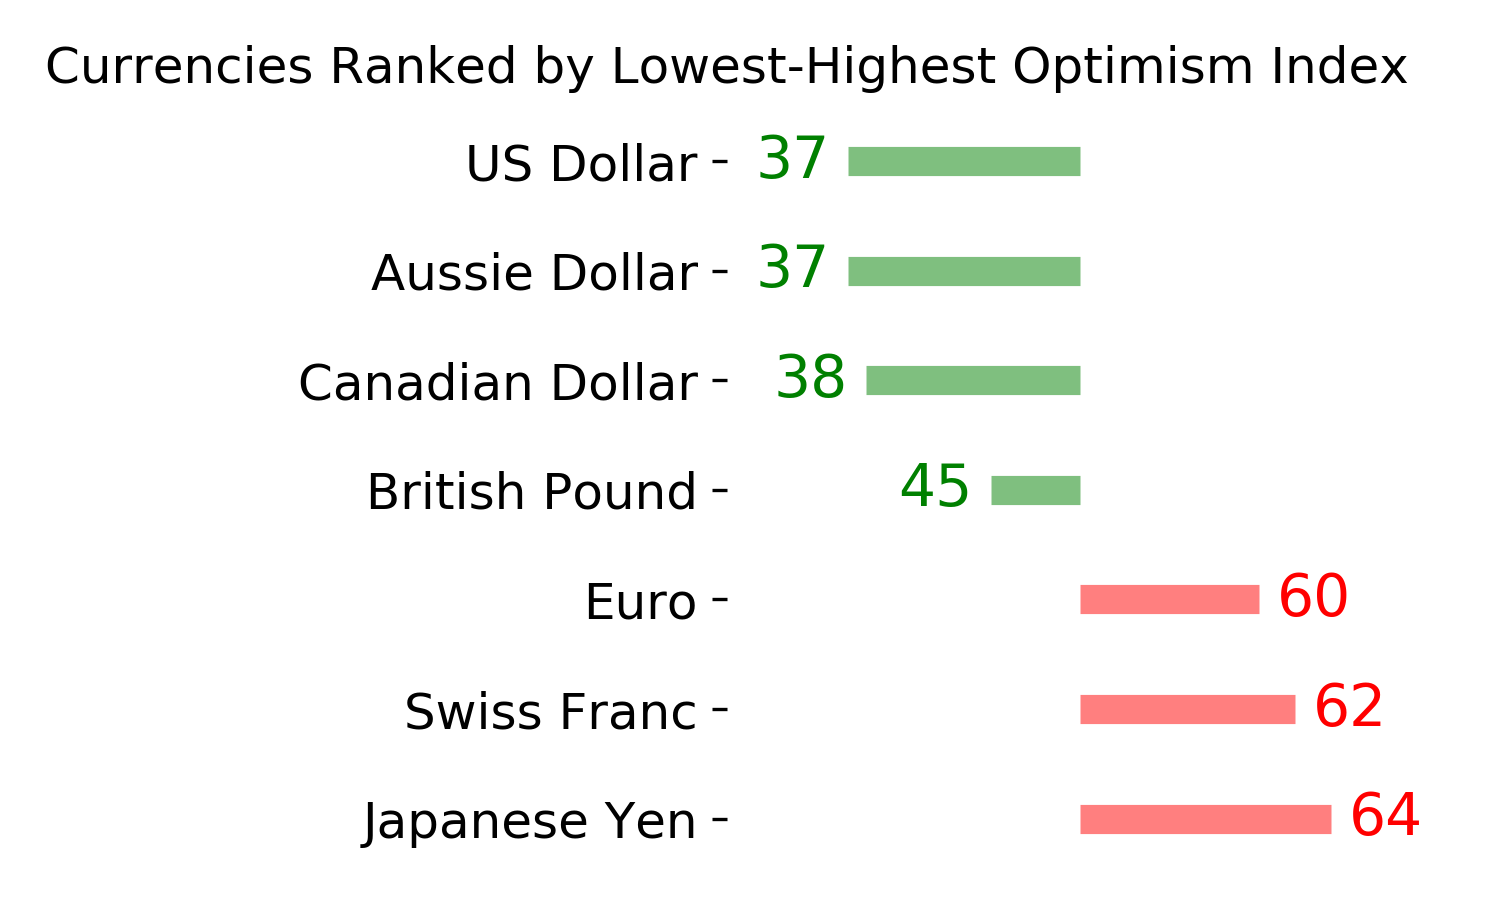
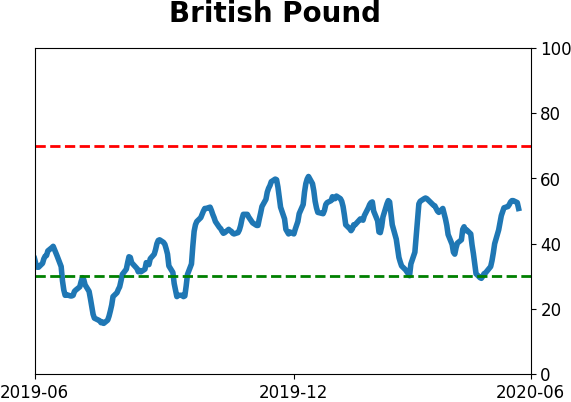
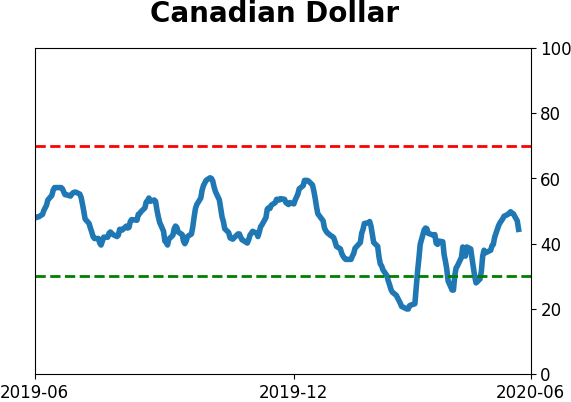
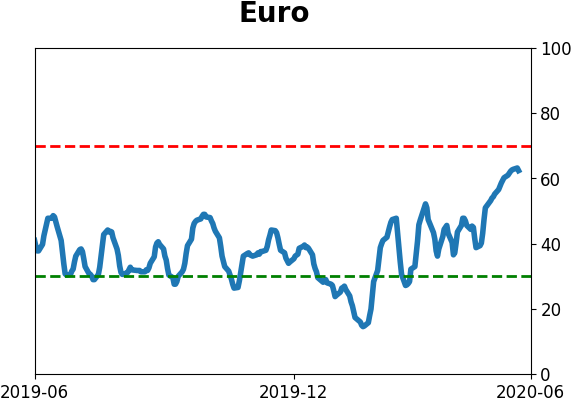
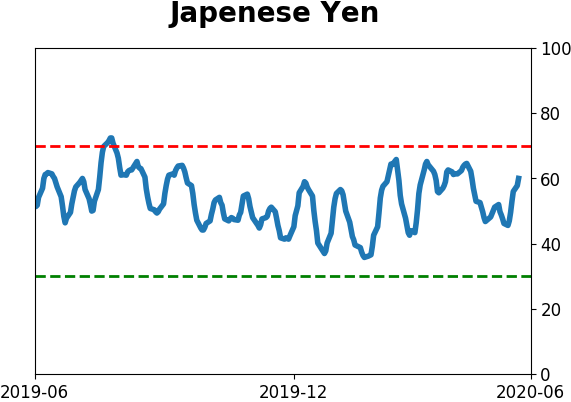
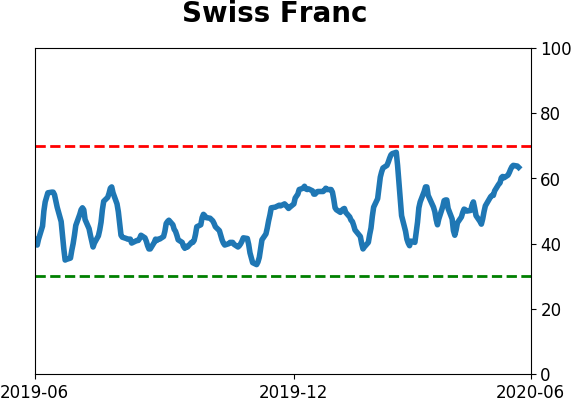
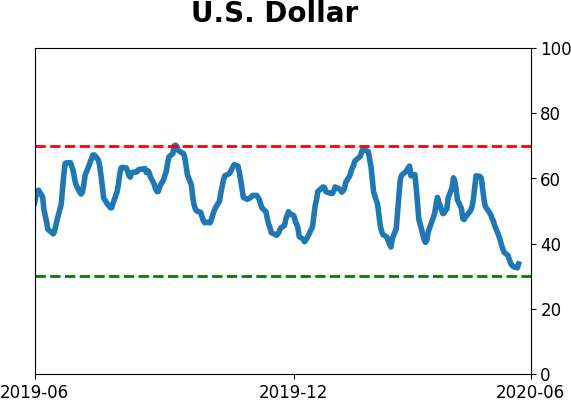
Currency ETF's - 5-Day Moving Average
|
|
|
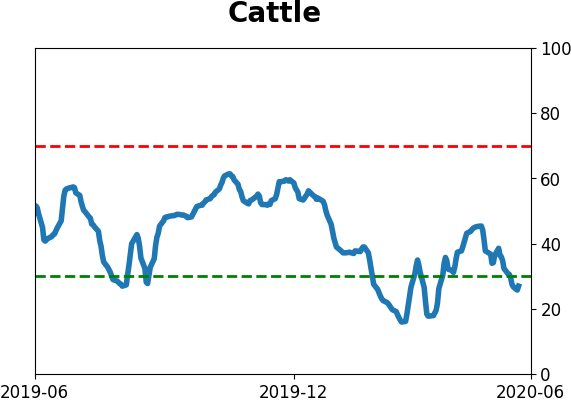
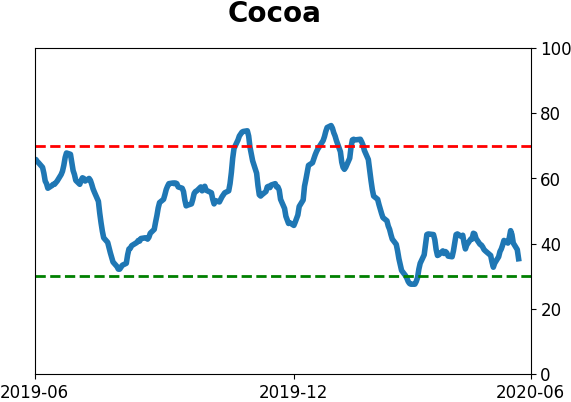
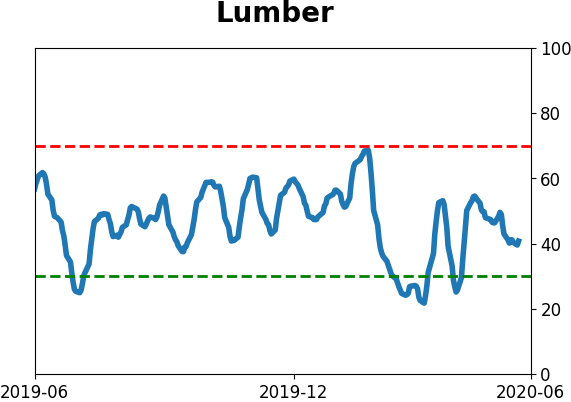
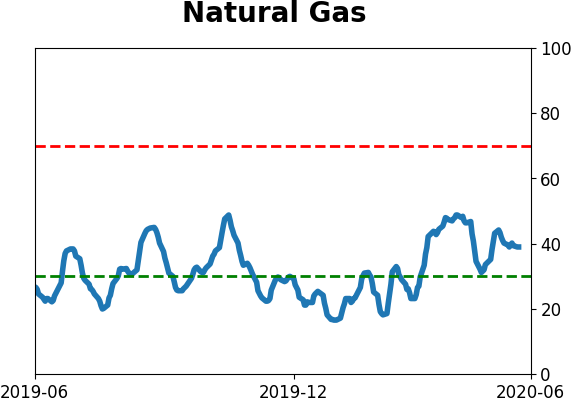
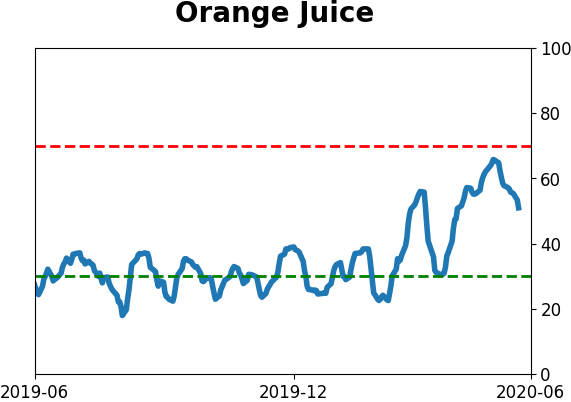
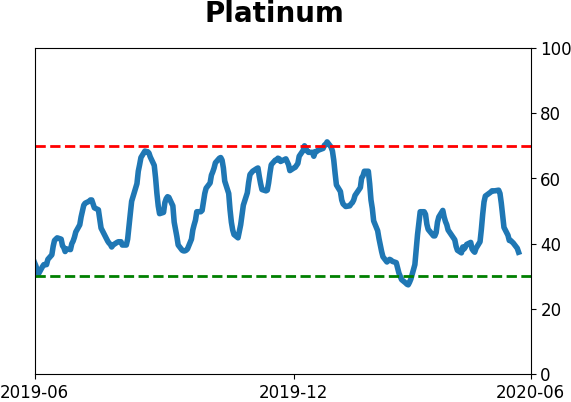
Commodity ETF's - 5-Day Moving Average
|
|