Headlines
|
|
A Week with No Pessimism:
For a week straight, there hasn't been a single one of our core indicators showing extreme pessimism. That's among the longest streaks in over 20 years, and has preceded poor short-term returns for stocks.
FOMC flush: With investors hyper-focused on the Federal Reserve and its reaction to economic developments, there were notable reactions to Wednesday's FOMC decision. Stocks, inflation-linked bonds, and gold all dropped with losses of at least 0.5% in the SPY, TIP, and GLD exchange-traded funds. There have been four other times when all three funds dropped at least this much on a FOMC day (2005-03-22, 2013-06-19, 2014-03-19, and 2016-12-14). SPY showed a negative return sometime between 1-4 weeks each time but was higher two months later after all four. TIP continued to drop in the very short-term each time, but rose over the next month every time averaging 1.7%. GLD dropped over the next week each time by an average of 1.5%. Three of the four struggled up to two months later, with only the 2016 instance showing gains.
Bottom Line:
See the Outlook & Allocations page for more details on these summaries STOCKS: Hold
The speculative frenzy in February is wrung out. Internal dynamics have mostly held up, with some exceptions. Many of our studies still show a mixed to poor short-term view, with medium- and long-term ones turning more positive. BONDS: Hold
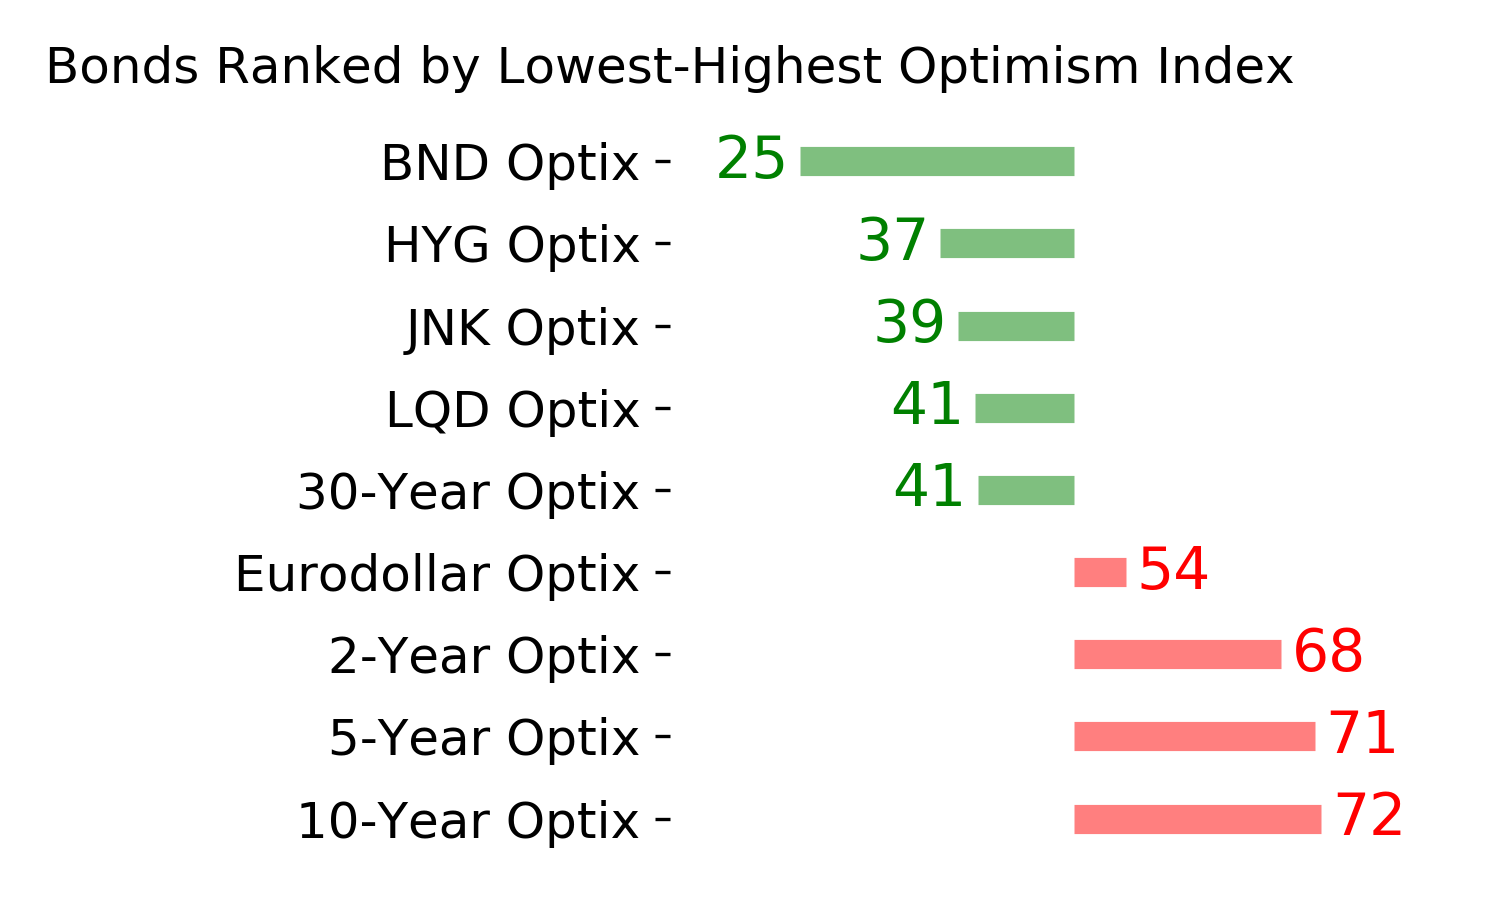
Various parts of the market got hit in March, with the lowest Bond Optimism Index we usually see during healthy environments. After a shaky couple of weeks, the broad bond market has modestly recovered. Not a big edge here either way. GOLD: Hold
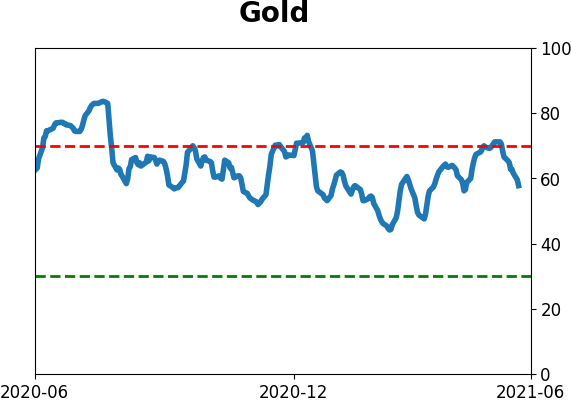
Gold and miners have done very well, recovering above long-term trend lines. The issue is that both have tended to perform poorly after similar situations - will have to wait and see how it plays out.
|
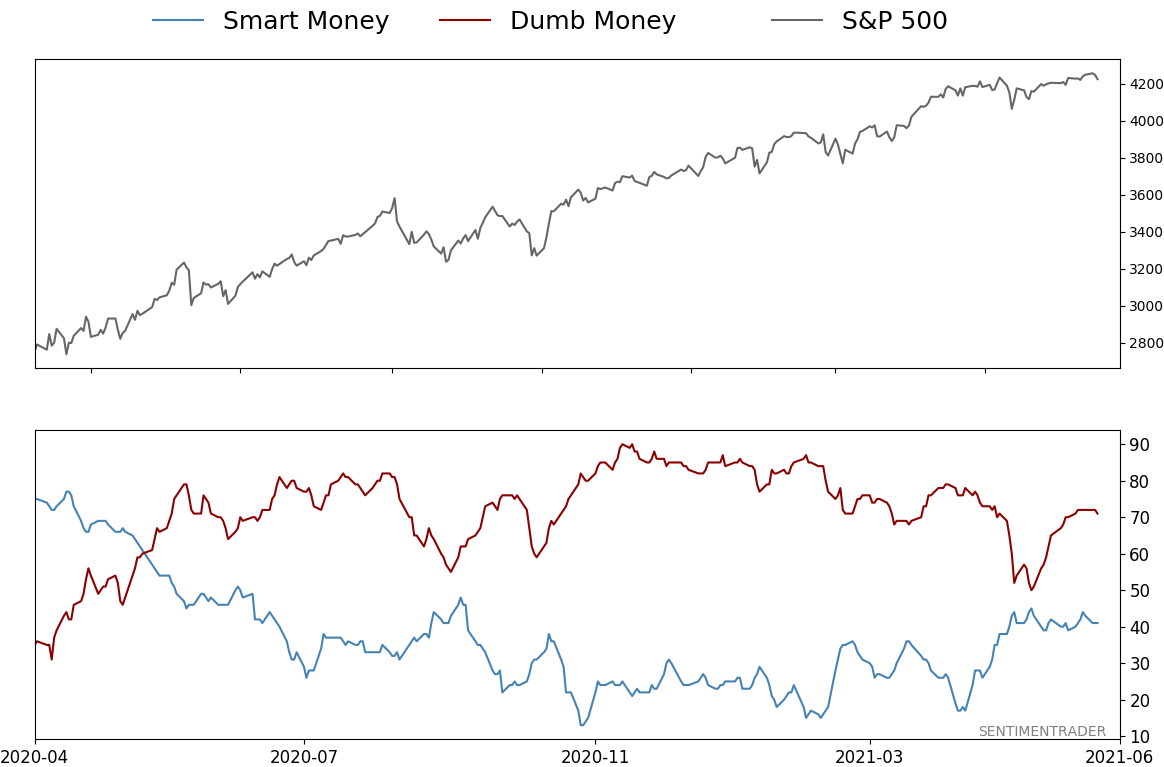
Smart / Dumb Money Confidence
|
Smart Money Confidence: 41%
Dumb Money Confidence: 71%
|
|
Risk Levels
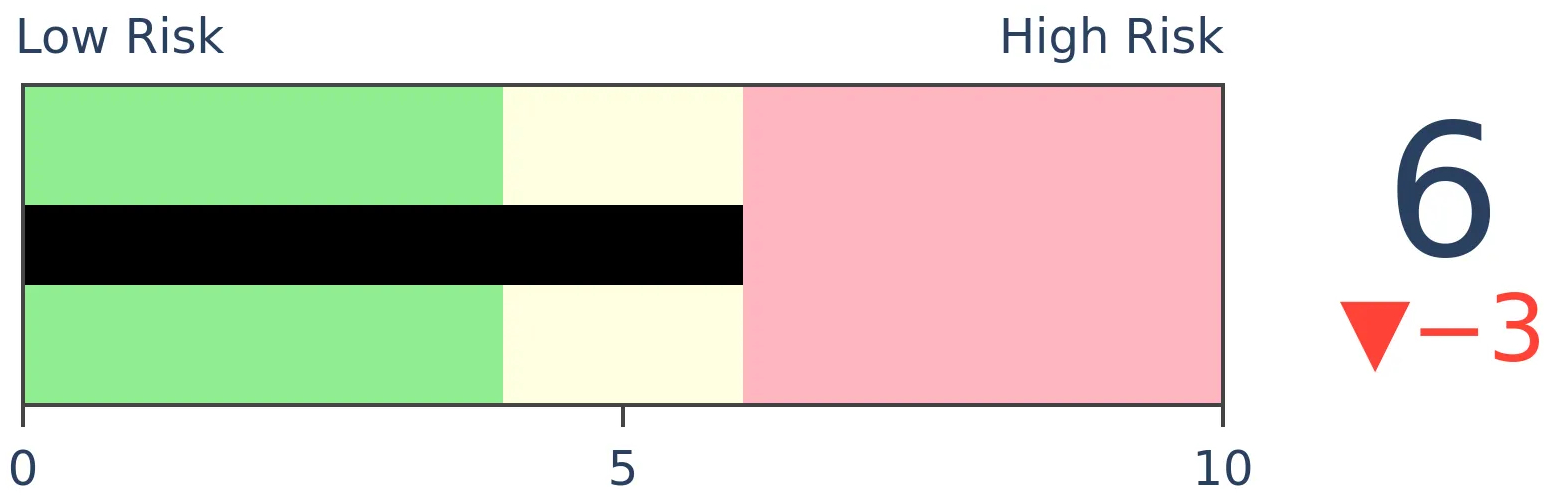
Stocks Short-Term
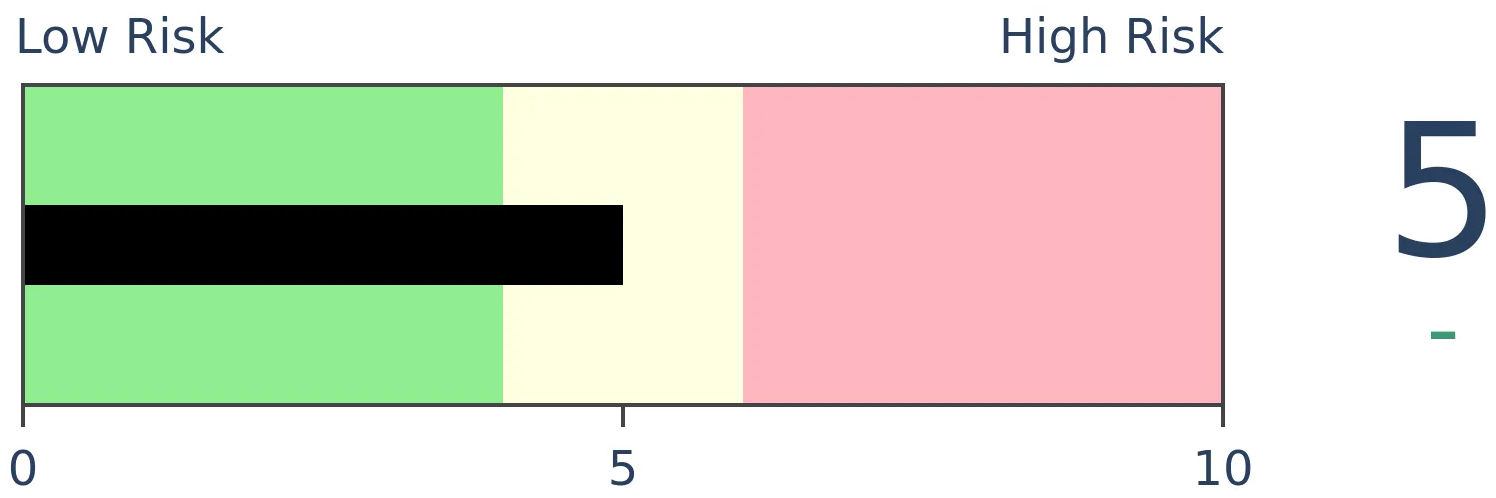
|
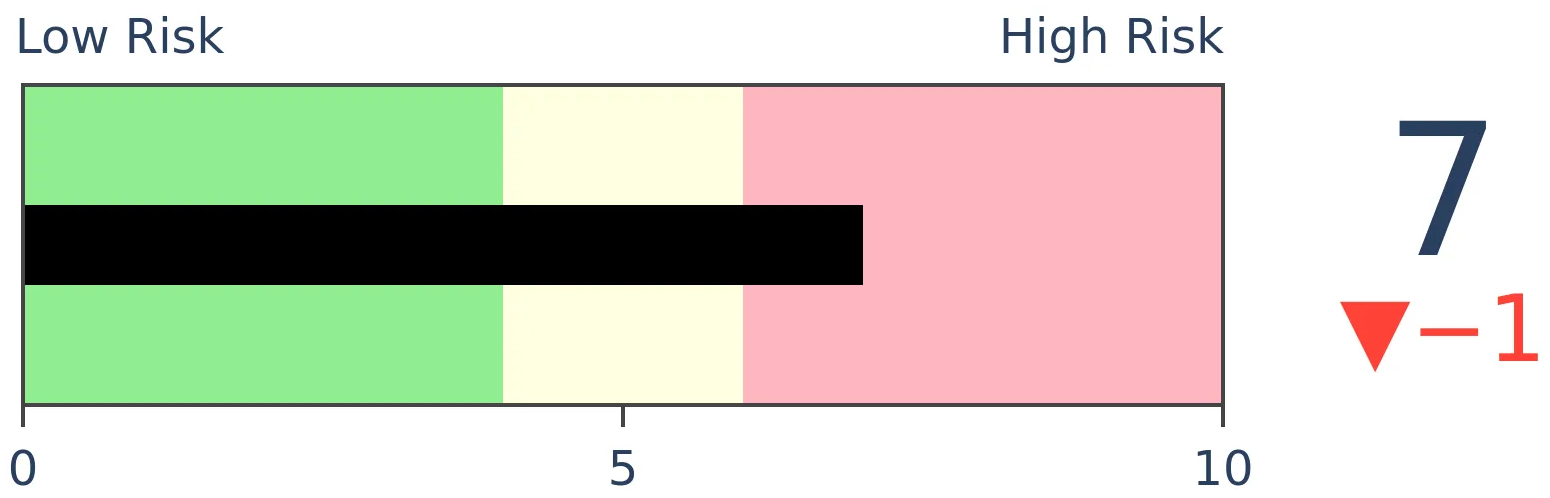
Stocks Medium-Term
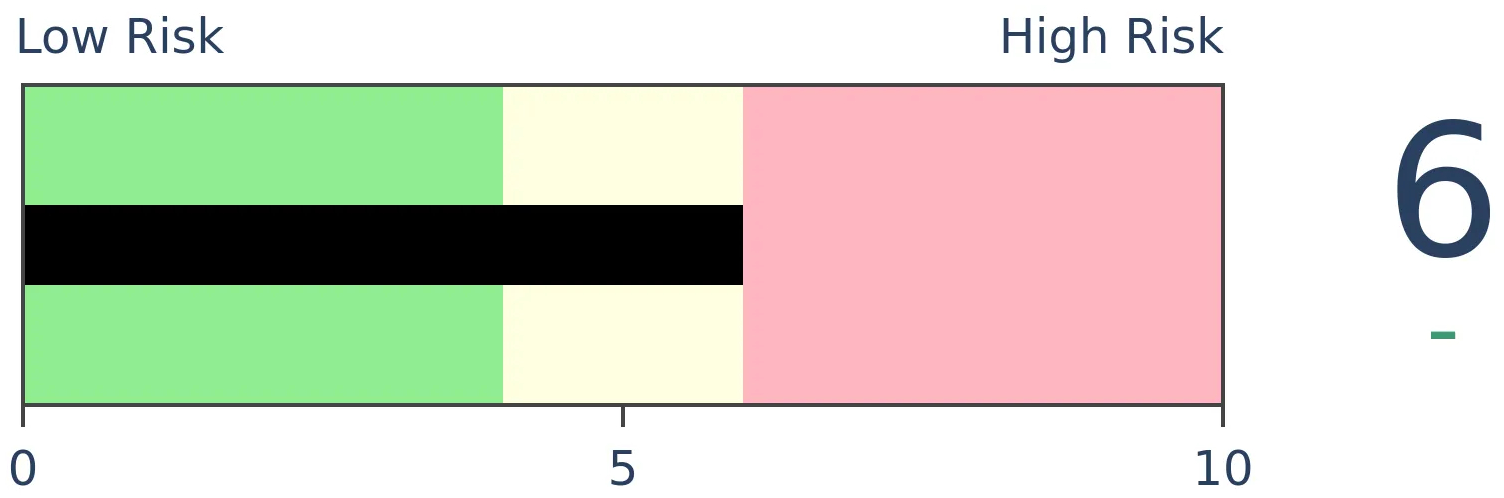
|
|
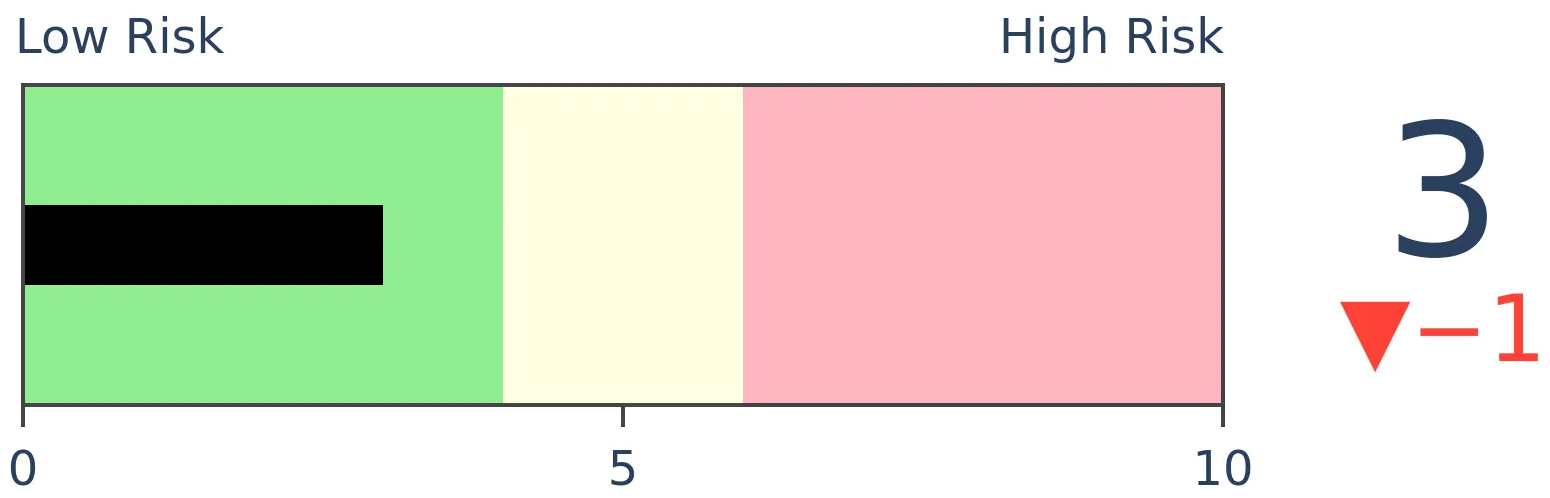
Bonds
|
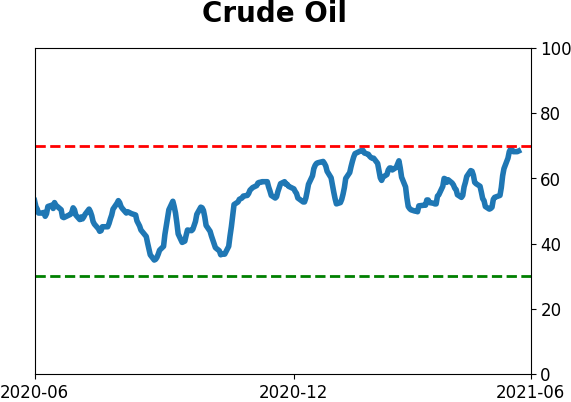
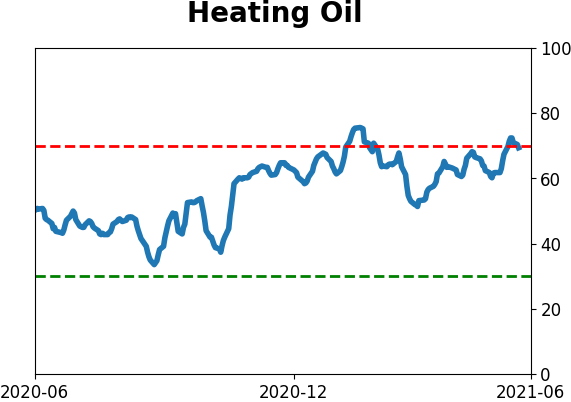
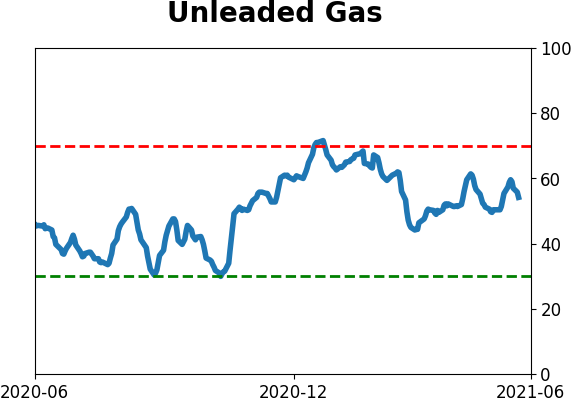
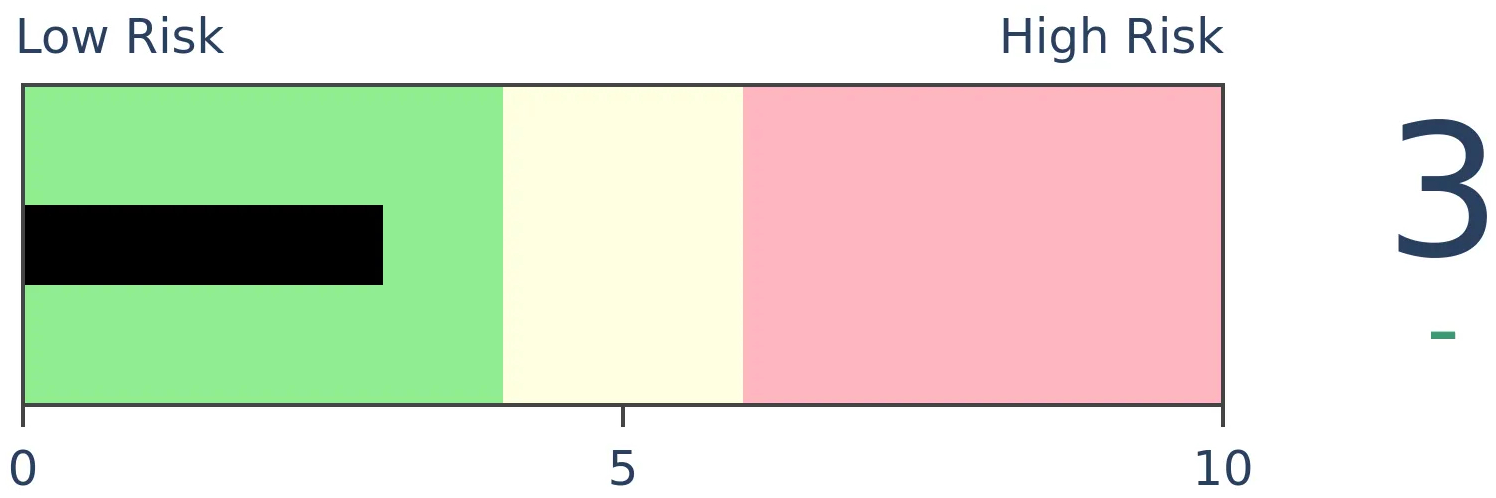
Crude Oil
|
|
Gold
|
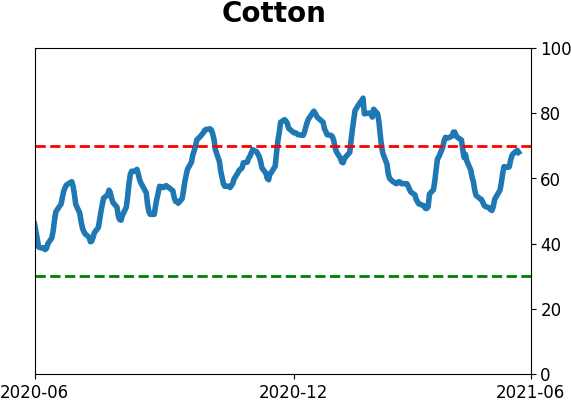
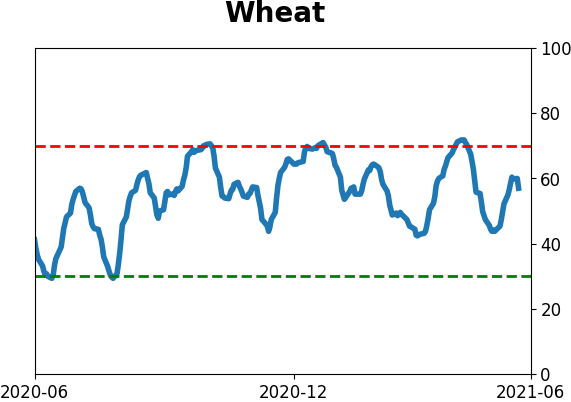
Agriculture
|
|
Research
BOTTOM LINE
For a week straight, there hasn't been a single one of our core indicators showing extreme pessimism. That's among the longest streaks in over 20 years, and has preceded poor short-term returns for stocks.
FORECAST / TIMEFRAME
SPY -- Down, Short-Term
|
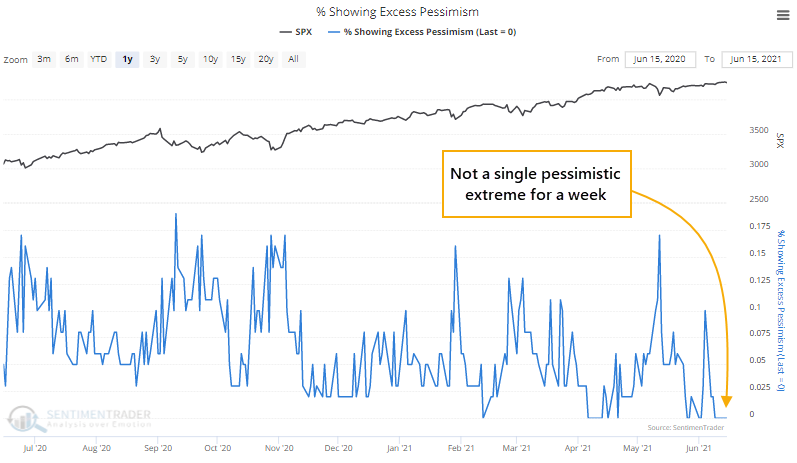
Last March, more than half of our core indicators were showing extreme pessimism. That's the kind of lopsided sentiment that has reliably coincided with the final "puke" phase of a decline, like the Christmas panic of 2018.
My how times have changed.
Over the past year, the few minor selloffs we've seen have pushed no more than 18% of indicators into pessimistic territory. And for the past week, there has not been a single one of our core indicators showing pessimism.
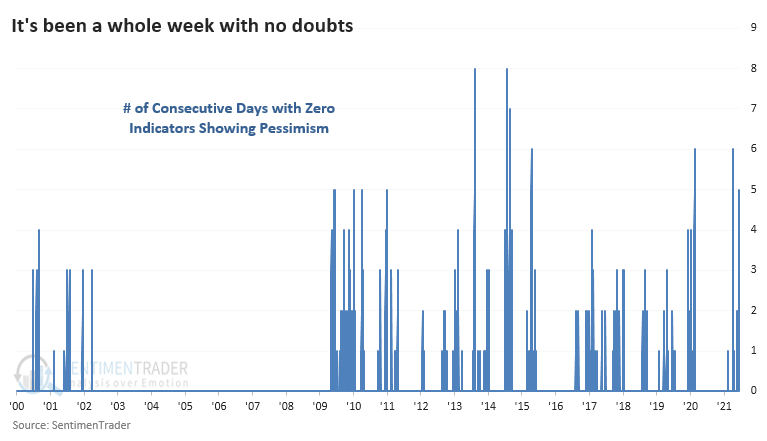
It's been rare to see an entire week go by without even one indicator sliding into extreme territory. The longest streak was 8 days, but prior to 2009, there wasn't a streak of even 5 days.
A SHORT-TERM WARNING
The handful of times we went a week without a pessimistic extreme, the S&P 500 wasn't able to sustain its gains much longer.
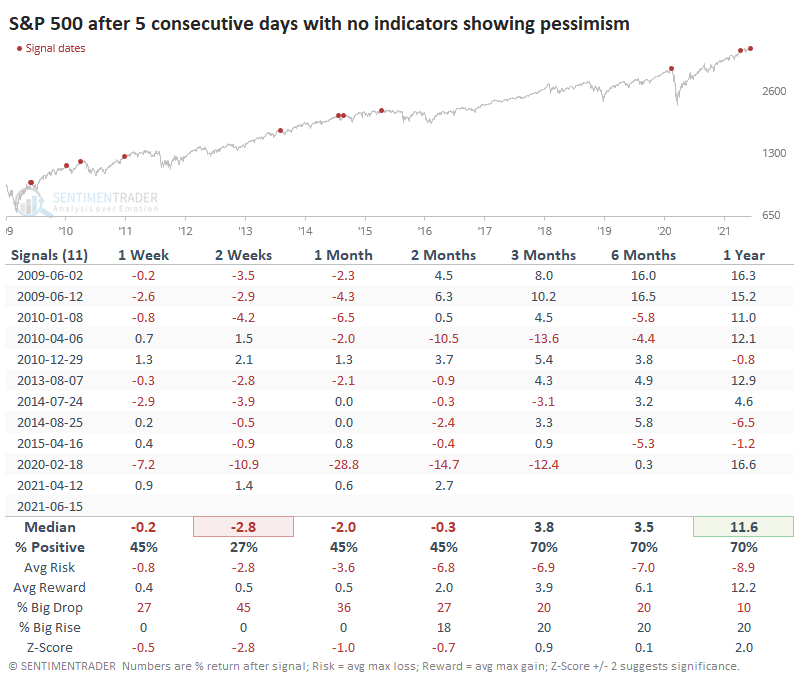
Out of the 11 precedents, 9 showed a negative return either 2 or 4 weeks later, and one of the exceptions was barely positive. The other preceded minor gains that were ultimately erased. Not impressive.
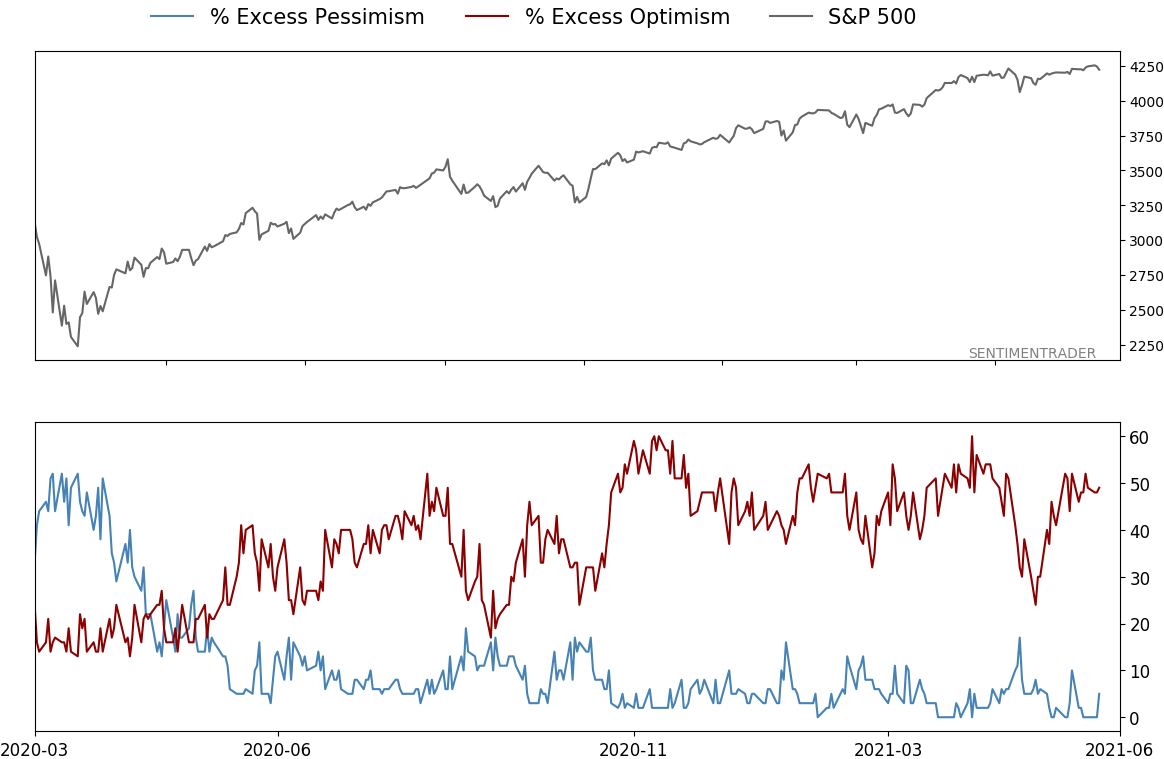
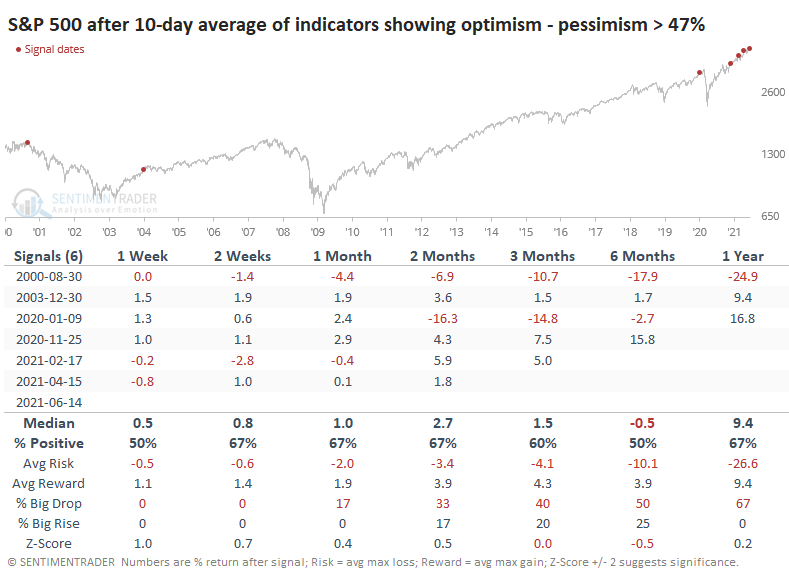
Not only have there been no indicators showing pessimism, but 45% or more indicators have been showing extreme optimism. That has pushed the 10-day average of the spread between them to one of the highest levels in 5 years.
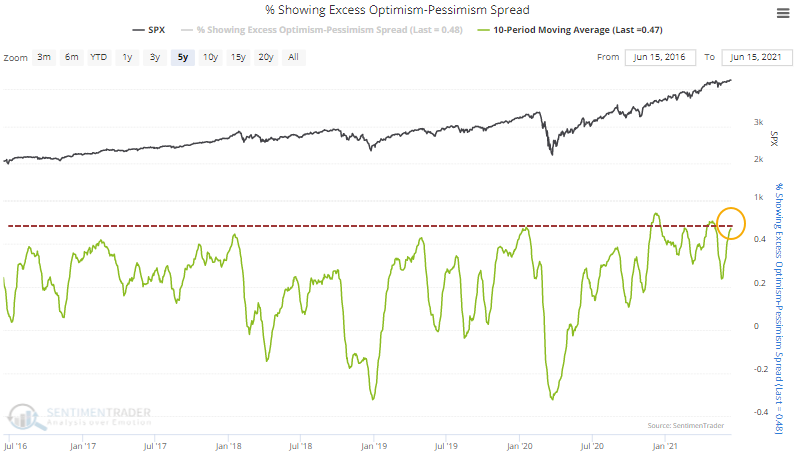
Since we began tabulating these measures over 20 years ago, there have been only a few times when the 10-day average of the spread has reached its current level.
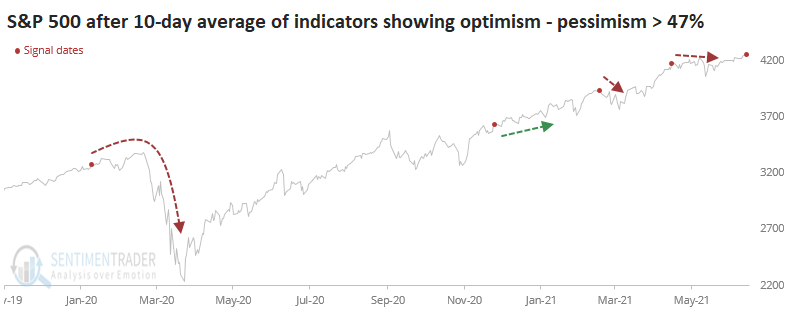
If we zoom in on the past 18 months or so, we can see that one signal preceded the covid crash, one preceded nothing but continued upside (from November 2020), and the other two saw the S&P chop lower for weeks before resuming the rally.
The rally in stocks has been incessant since November, and we're once again seeing a spurt of speculative excess along with some minor deterioration under the surface. It hasn't been enough to trigger any major warning signs but it bears watching given the new round of extremes in many indicators.
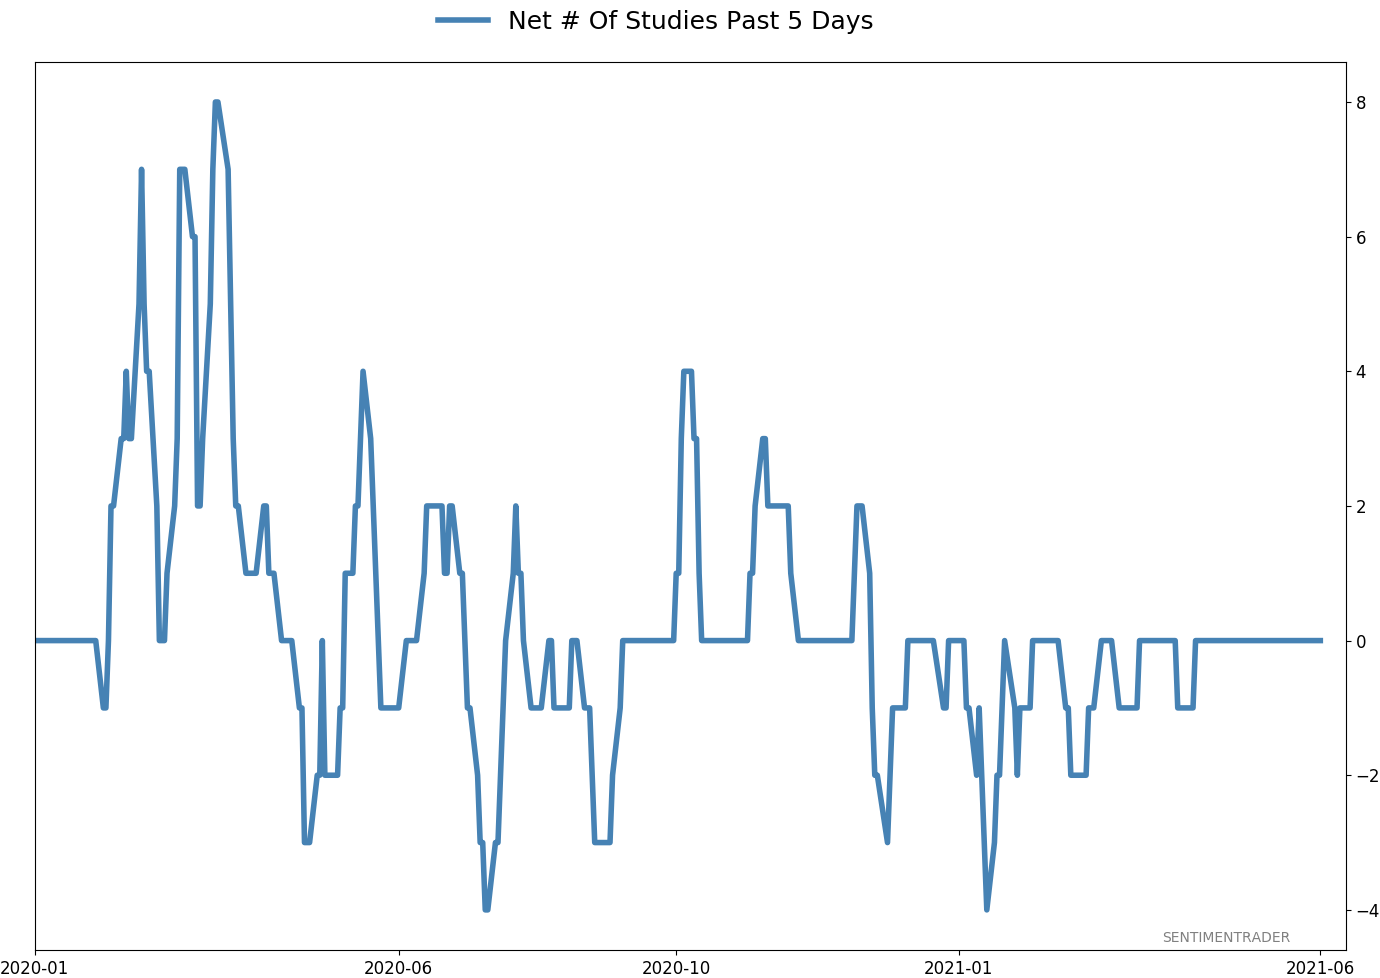
Active Studies
| Time Frame | Bullish | Bearish | | Short-Term | 0 | 1 | | Medium-Term | 2 | 12 | | Long-Term | 11 | 5 |
|
Indicators at Extremes
|
% Showing Pessimism: 5%
Bullish for Stocks
|
|
Portfolio
| Position | Description | Weight % | Added / Reduced | Date | | Stocks | RSP | 4.1 | Added 4.1% | 2021-05-19 | | Bonds | 23.9% BND, 6.9% SCHP | 30.7 | Reduced 7.1% | 2021-05-19 | | Commodities | GCC | 2.6 | Reduced 2.1%
| 2020-09-04 | | Precious Metals | GDX | 5.6 | Reduced 4.2% | 2021-05-19 | | Special Situations | 4.3% XLE, 2.2% PSCE | 7.6 | Reduced 5.6% | 2021-04-22 | | Cash | | 49.4 | | |
|
Updates (Changes made today are underlined)
Much of our momentum and trend work has remained positive for several months, with some scattered exceptions. Almost all sentiment-related work has shown a poor risk/reward ratio for stocks, especially as speculation drove to record highs in exuberance in February. Much of that has worn off, and most of our models are back toward neutral levels. There isn't much to be excited about here. The same goes for bonds and even gold. Gold has been performing well lately and is back above long-term trend lines. The issue is that it has a poor record of holding onto gains when attempting a long-term trend change like this, so we'll take a wait-and-see approach. RETURN YTD: 9.8% 2020: 8.1%, 2019: 12.6%, 2018: 0.6%, 2017: 3.8%, 2016: 17.1%, 2015: 9.2%, 2014: 14.5%, 2013: 2.2%, 2012: 10.8%, 2011: 16.5%, 2010: 15.3%, 2009: 23.9%, 2008: 16.2%, 2007: 7.8%
|
|
Phase Table
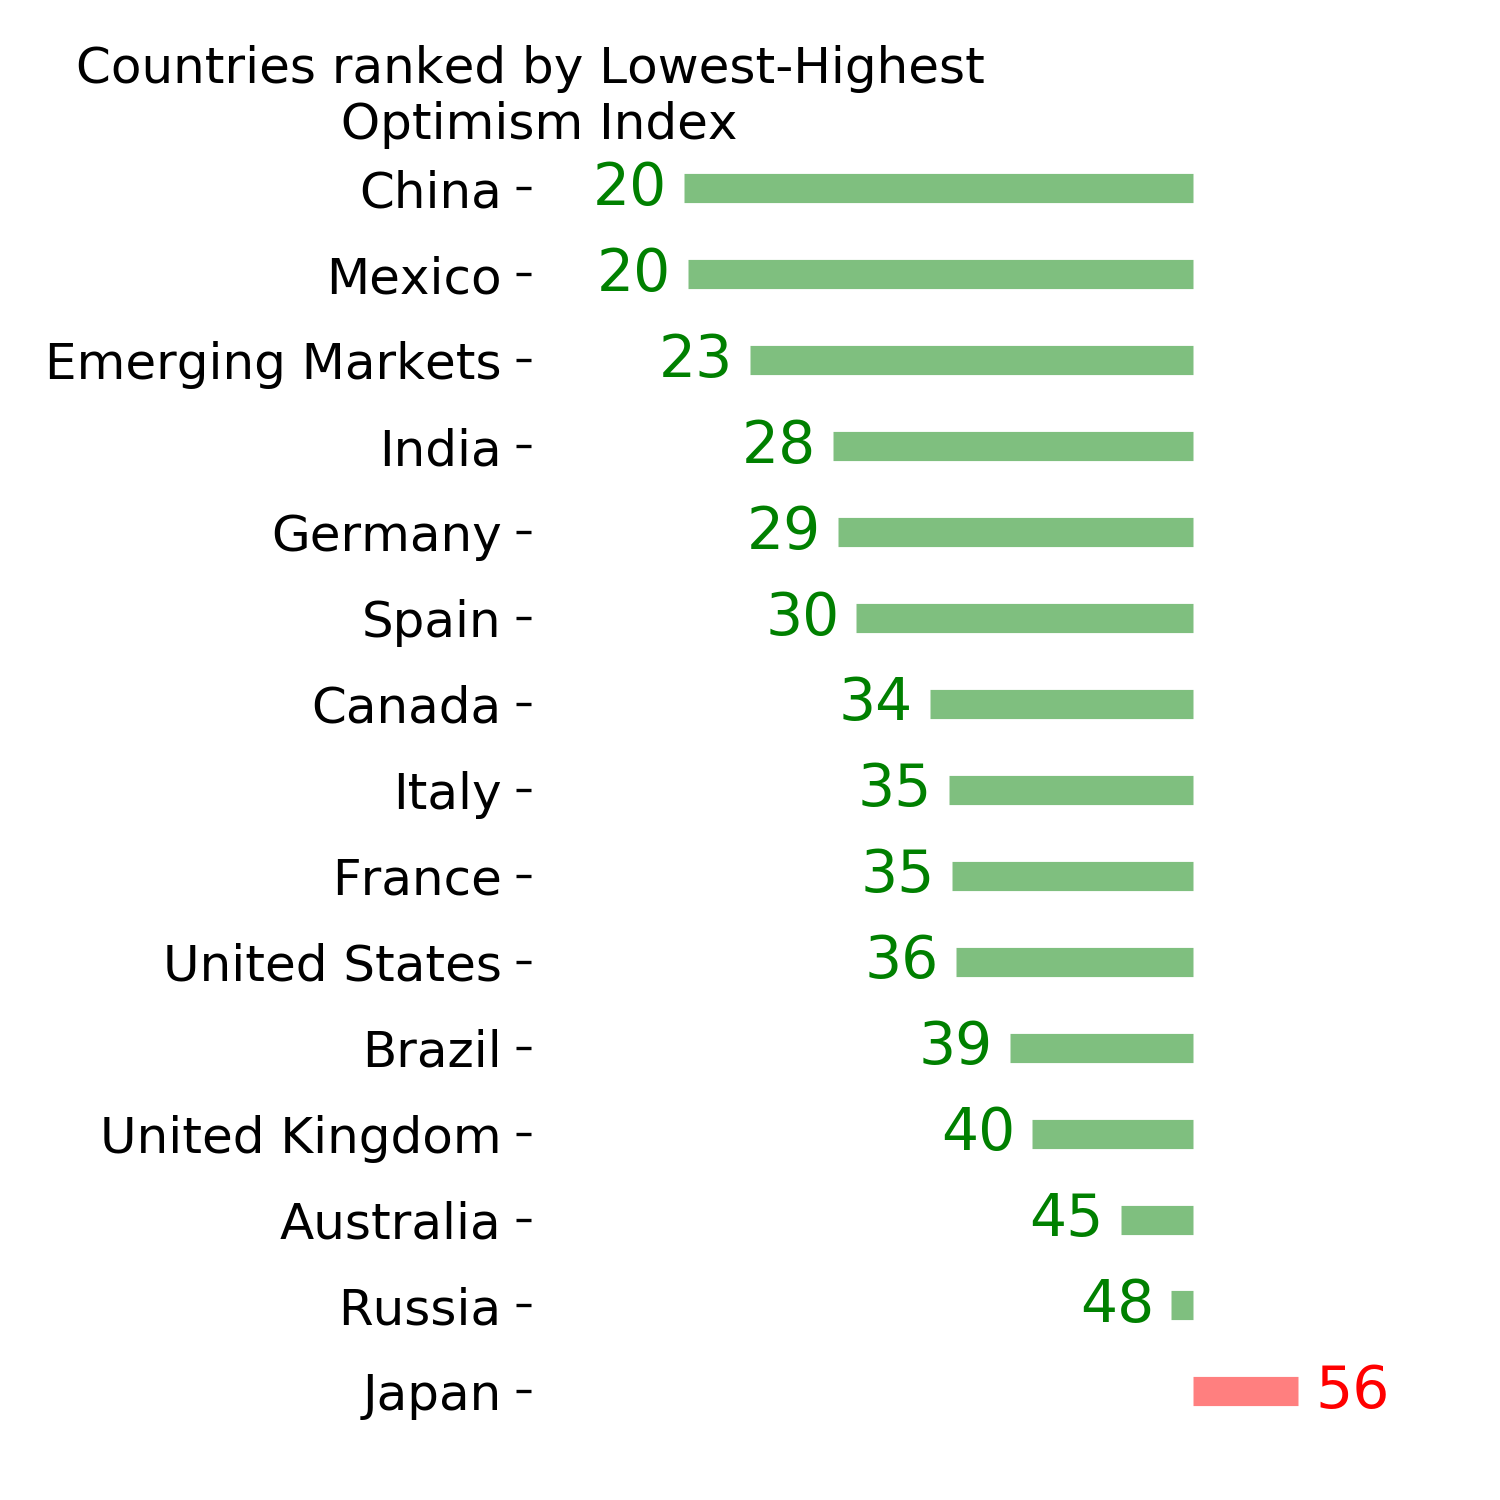
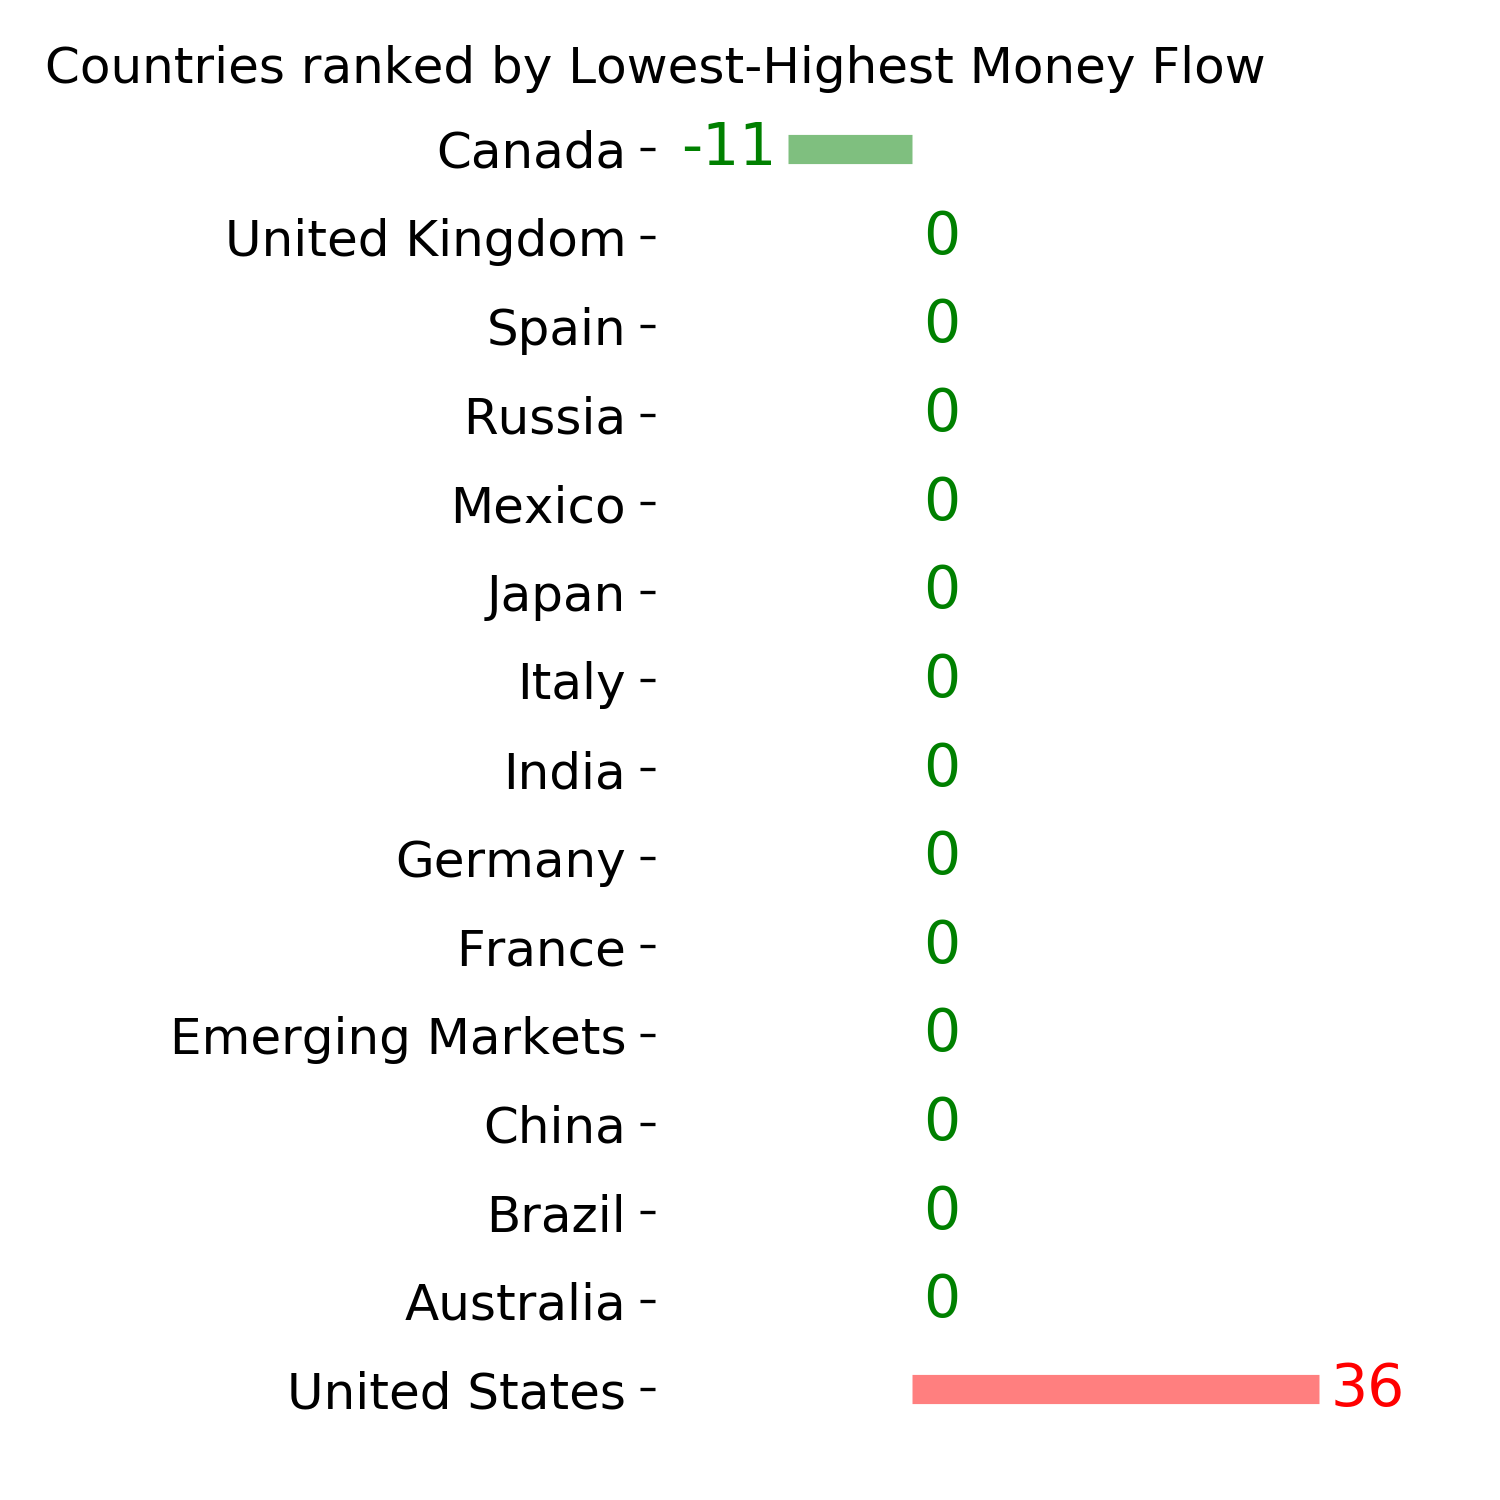
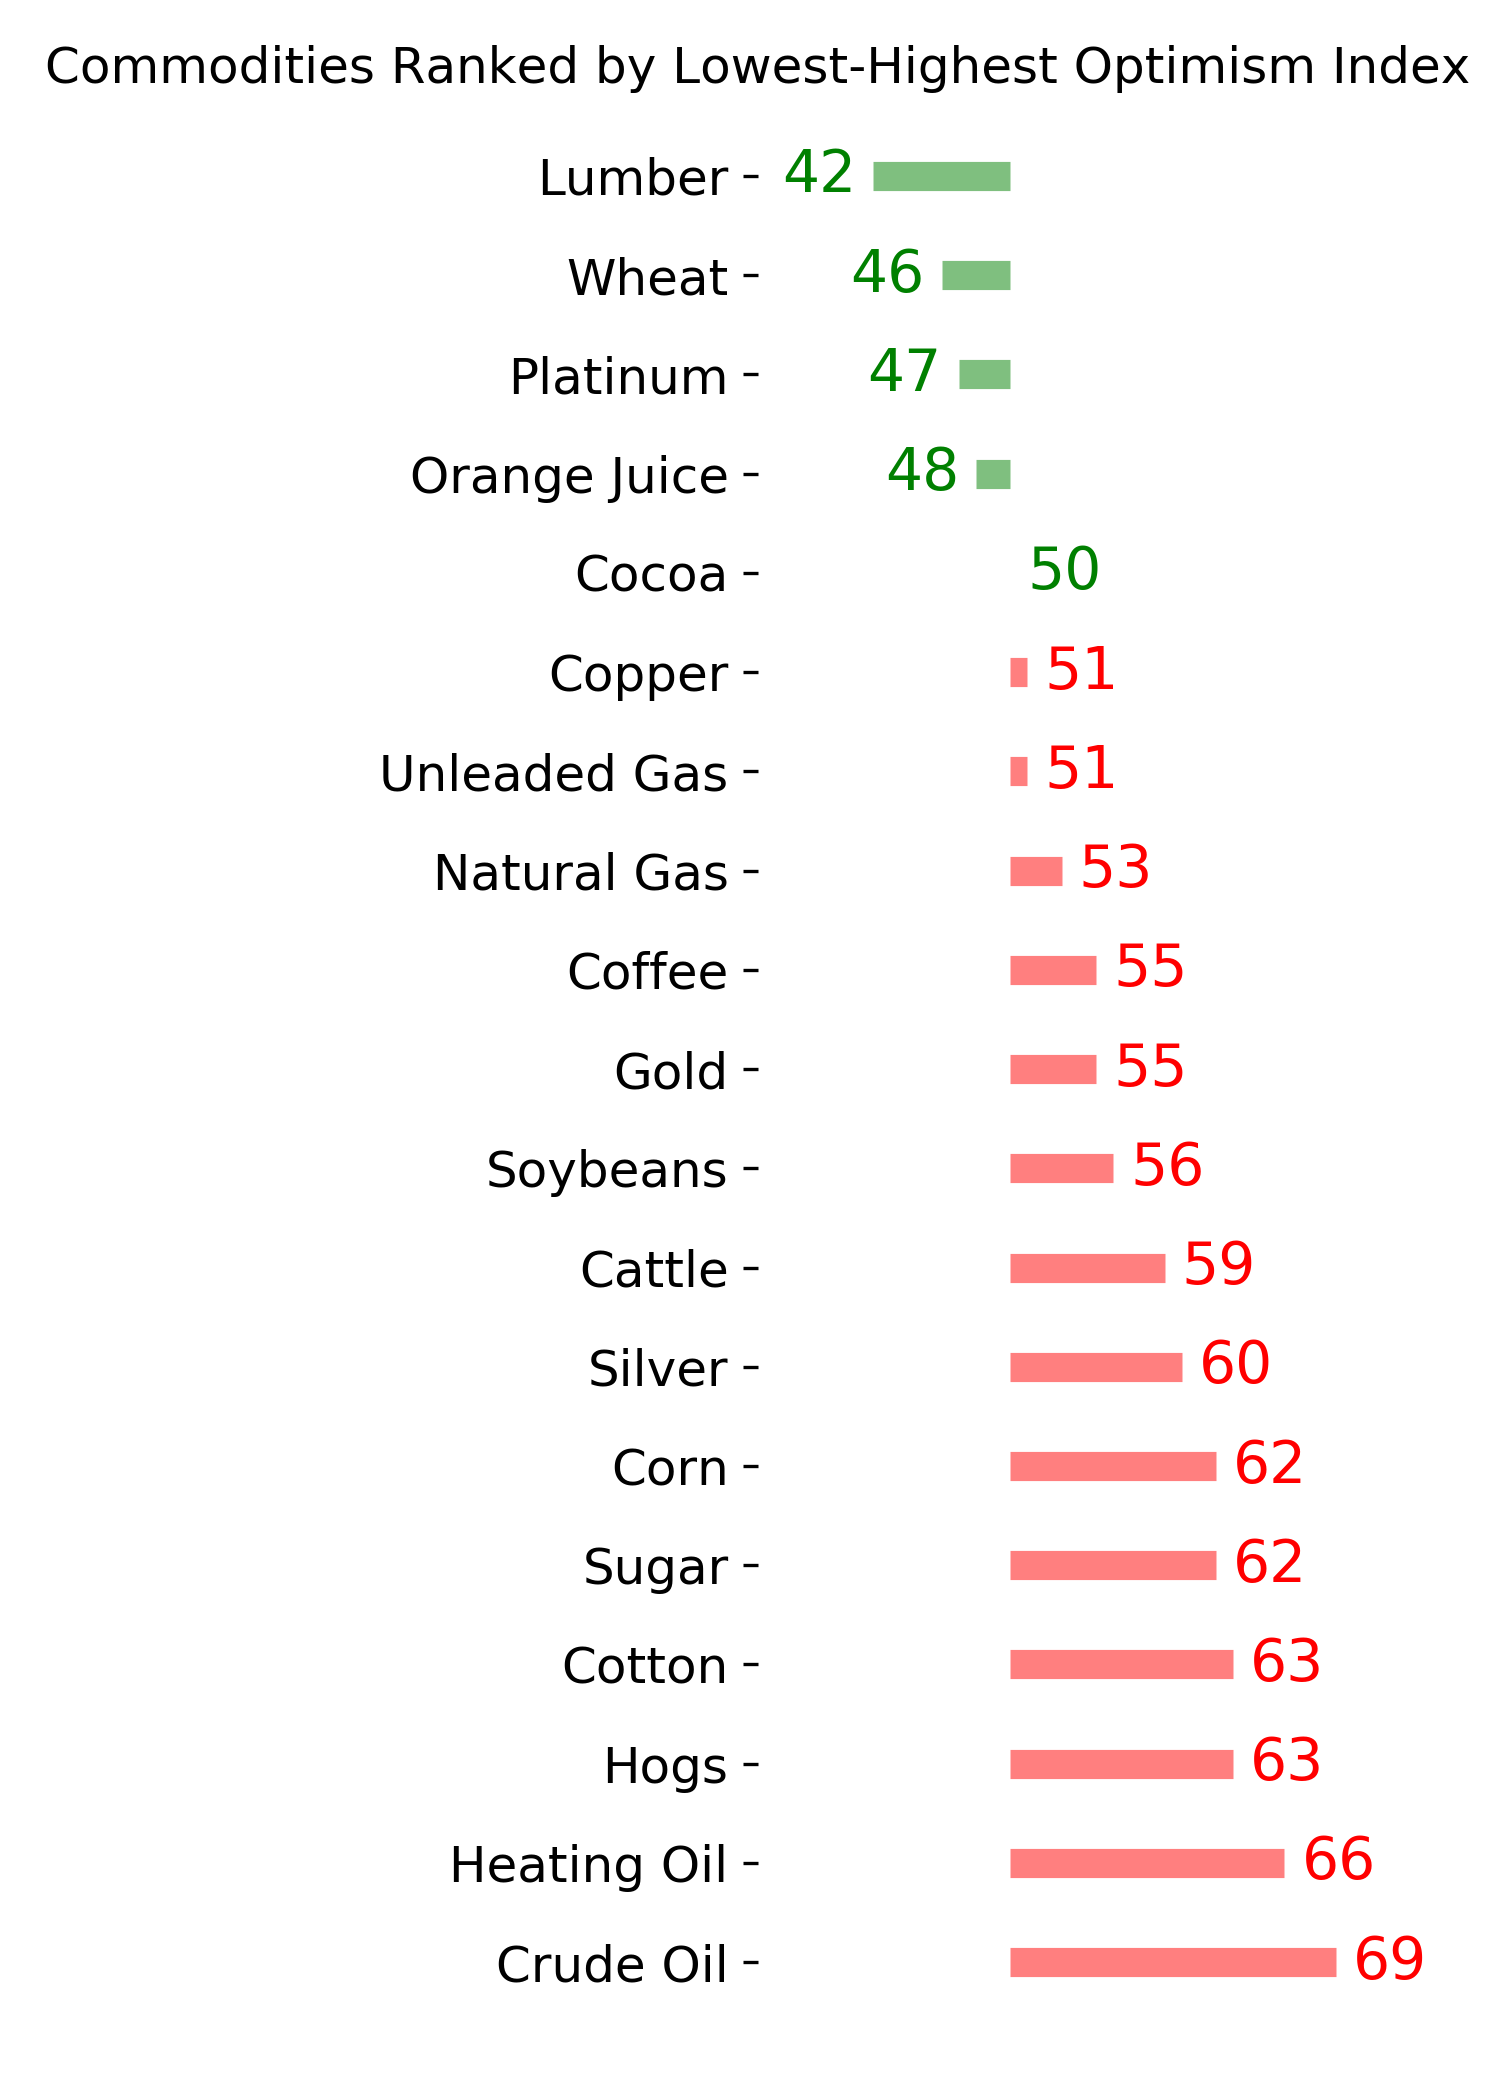
Ranks
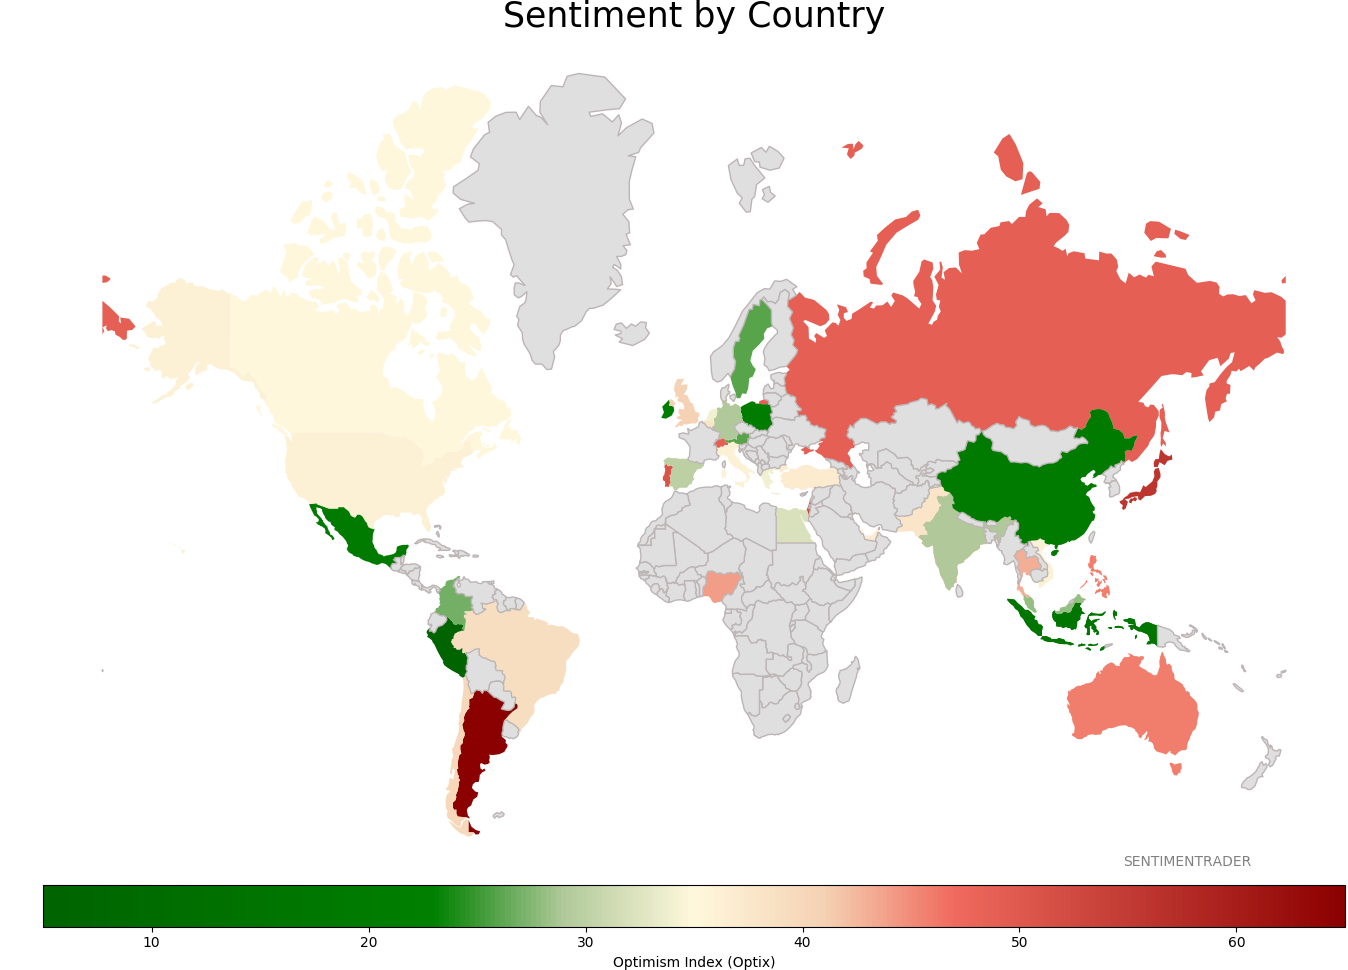
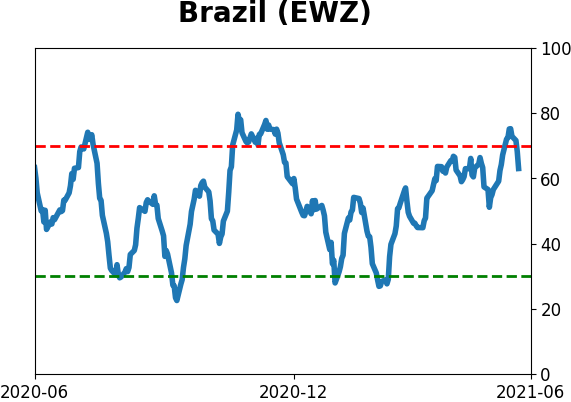
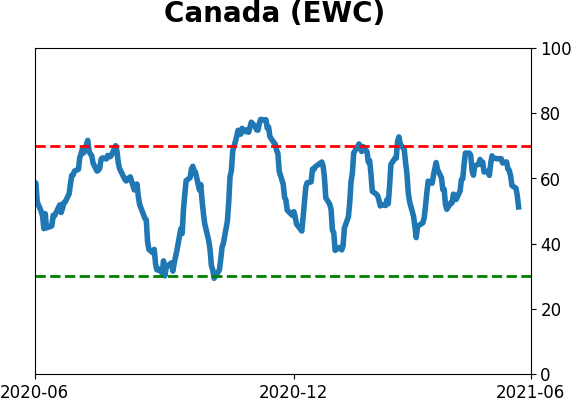
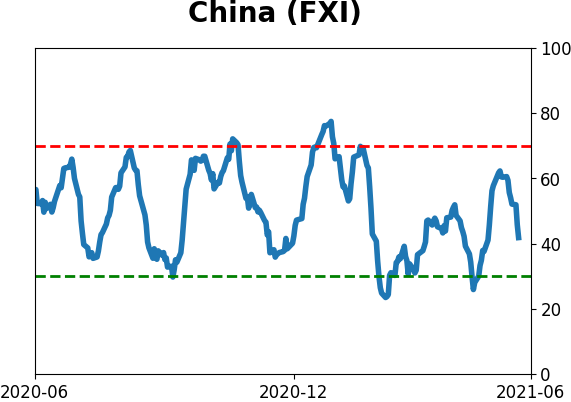
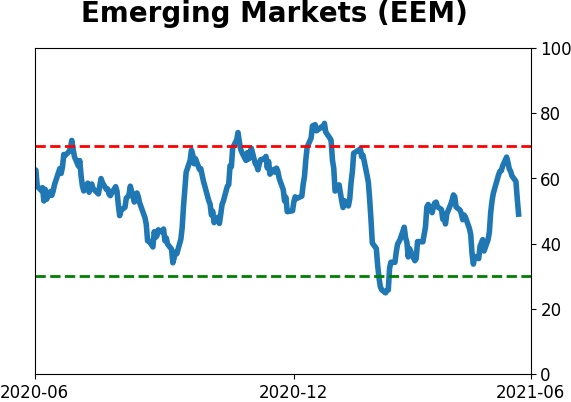
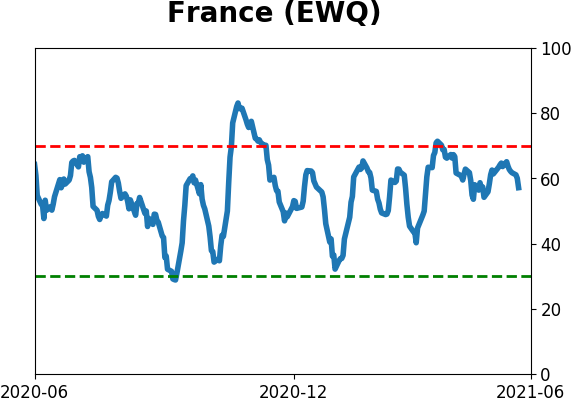
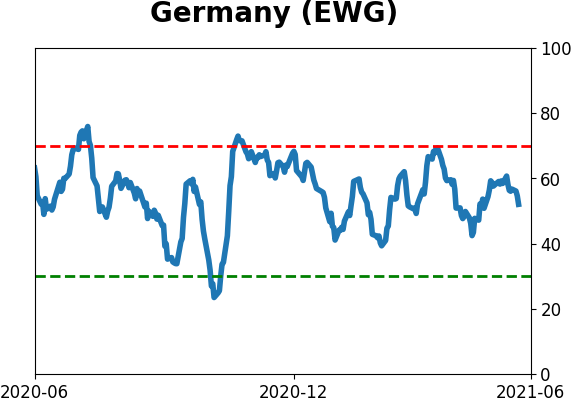
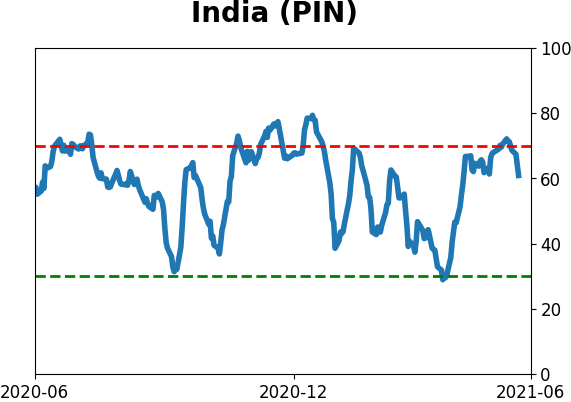
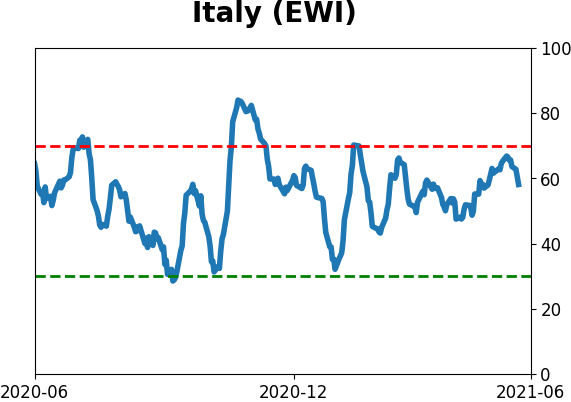
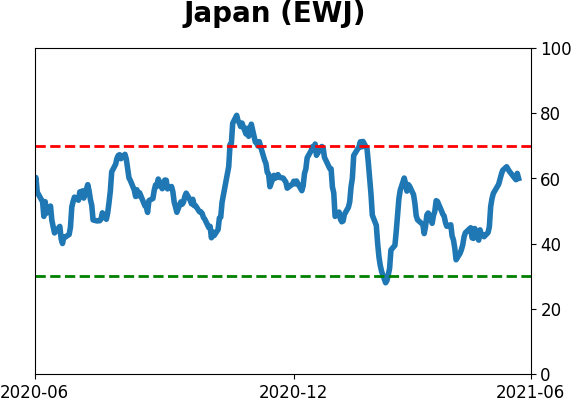
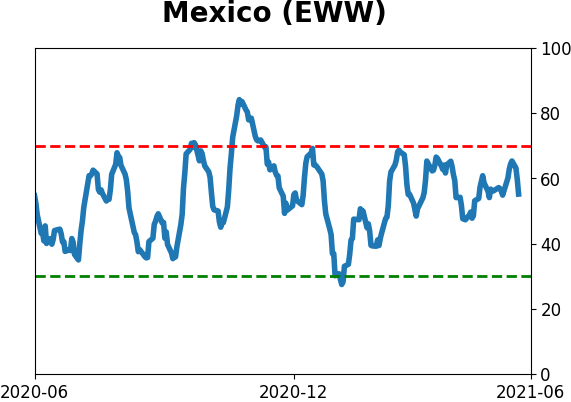
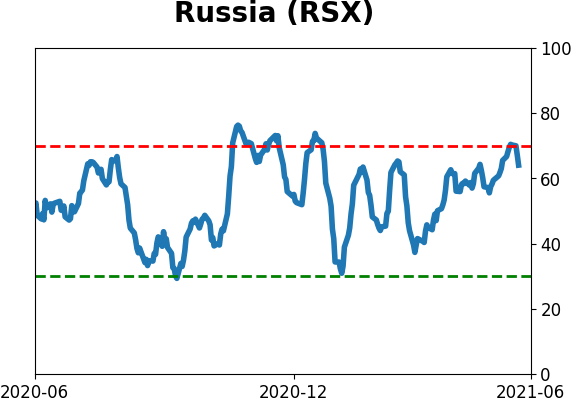
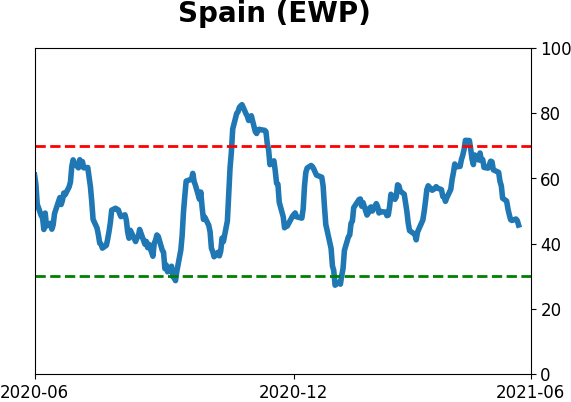
Sentiment Around The World
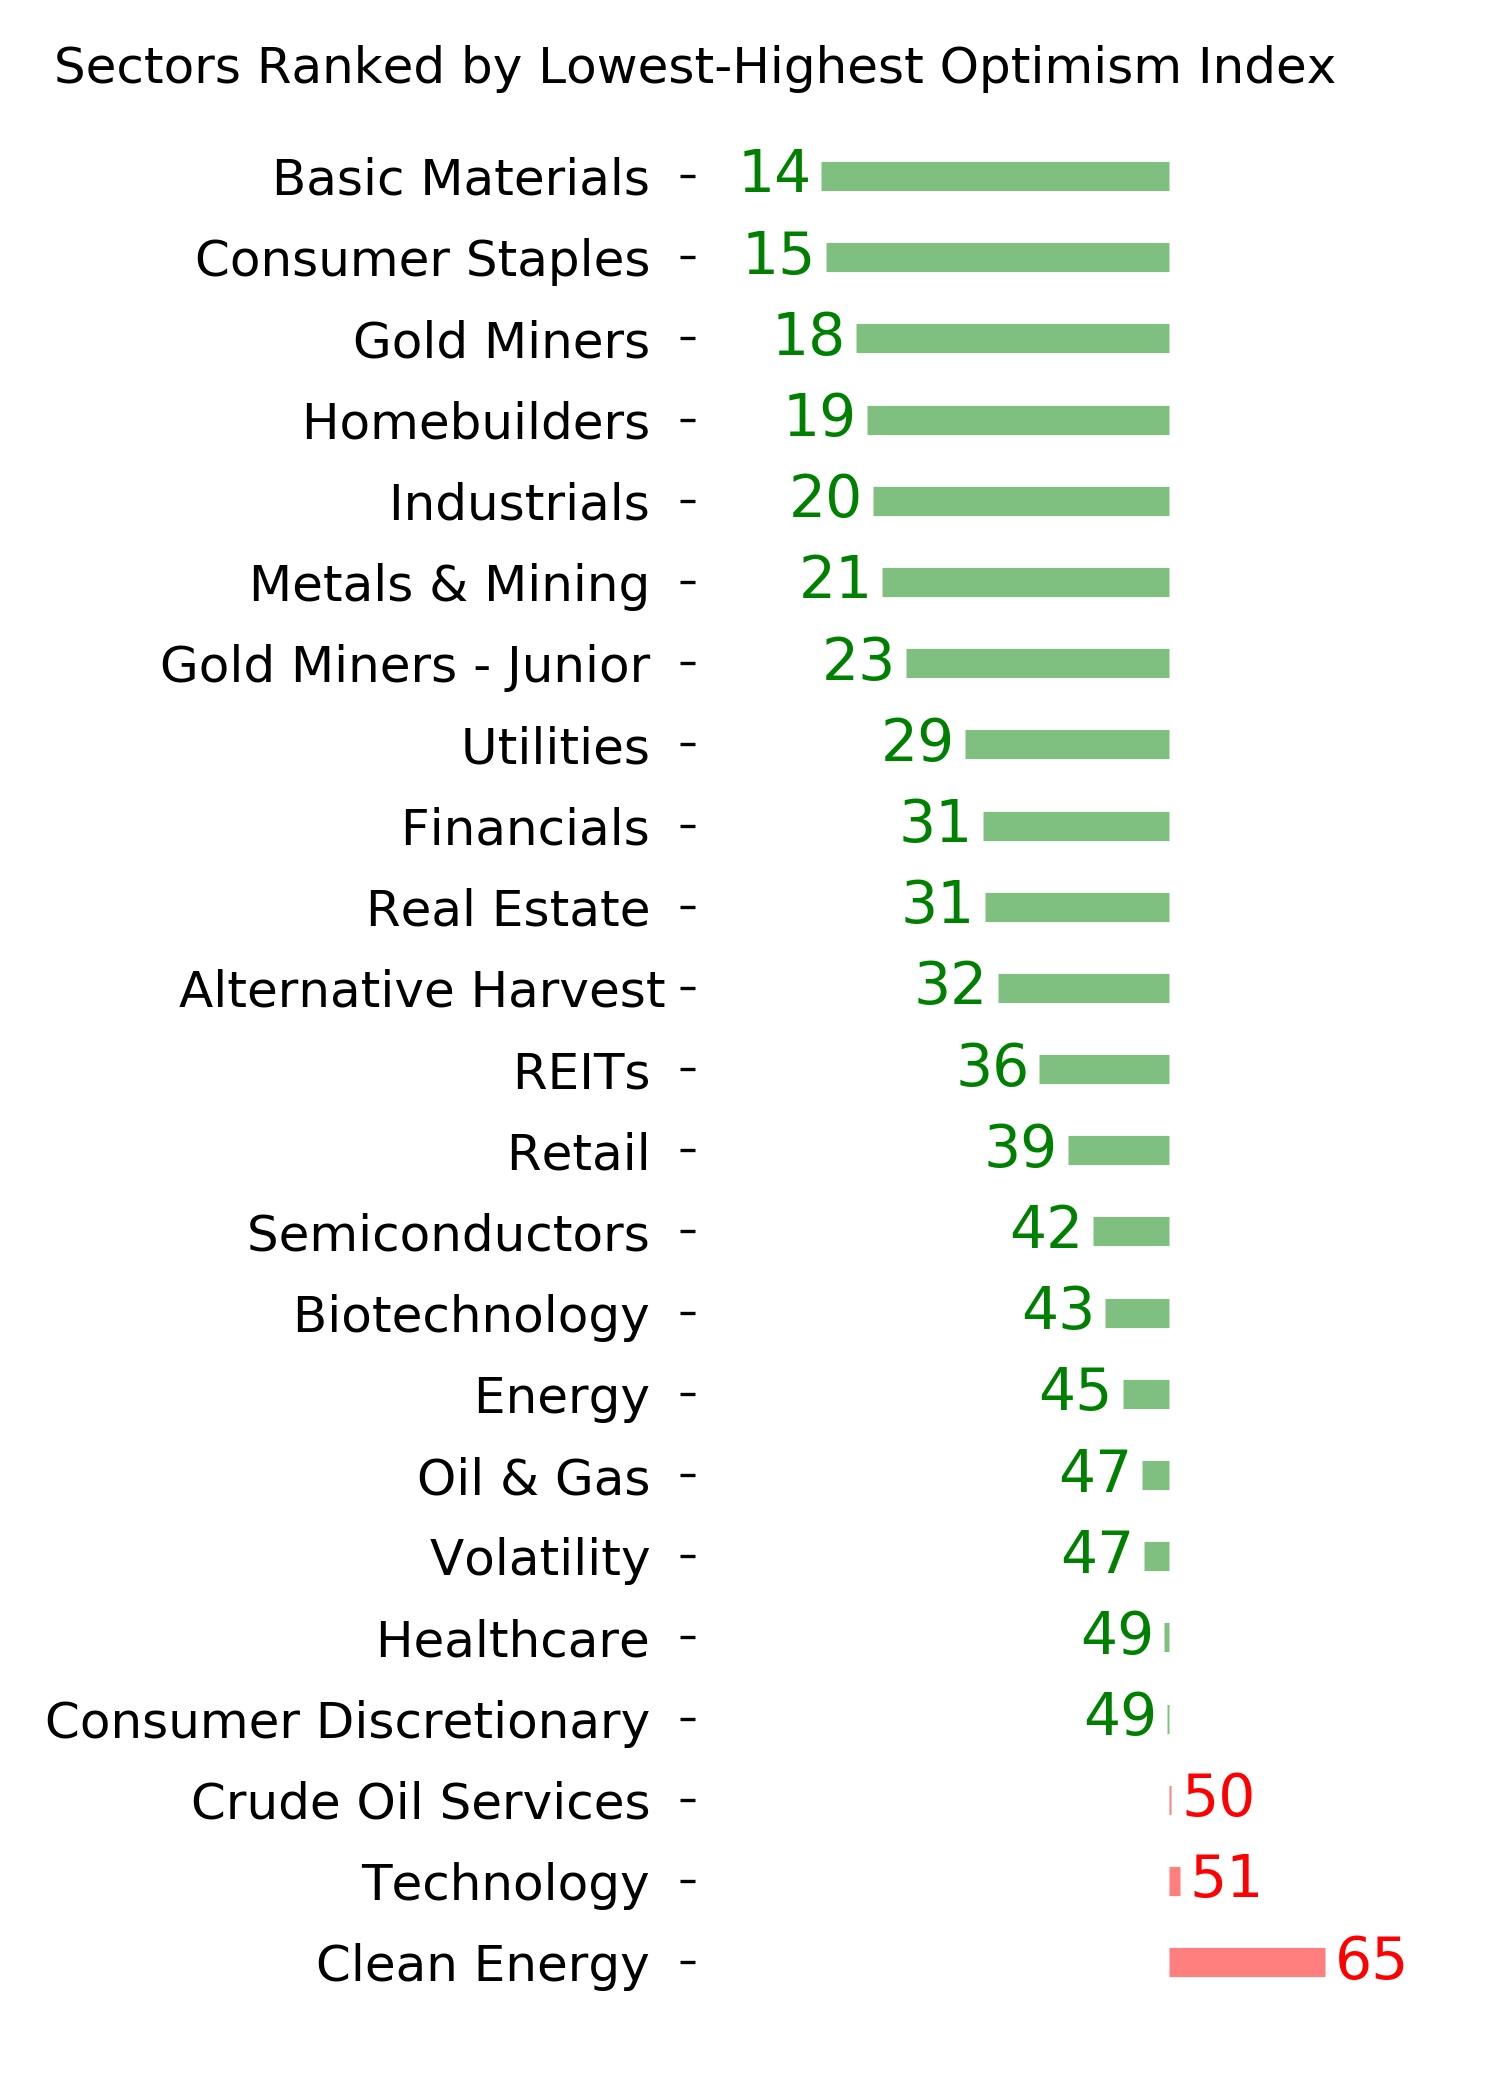
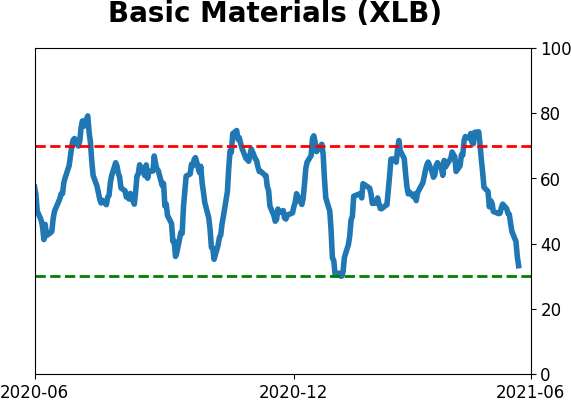
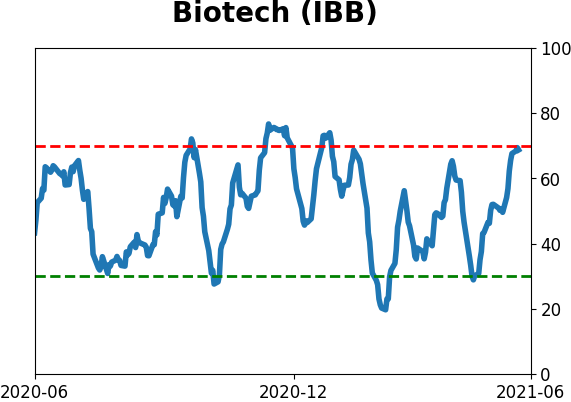
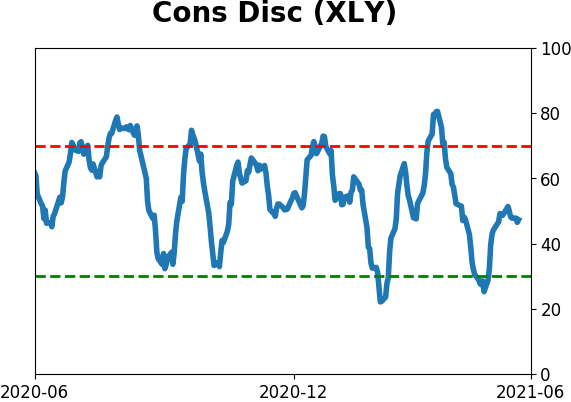
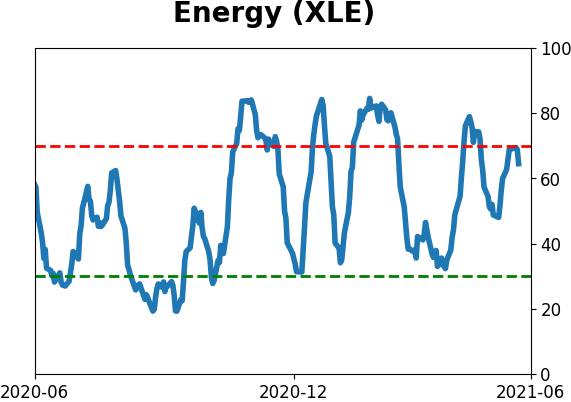
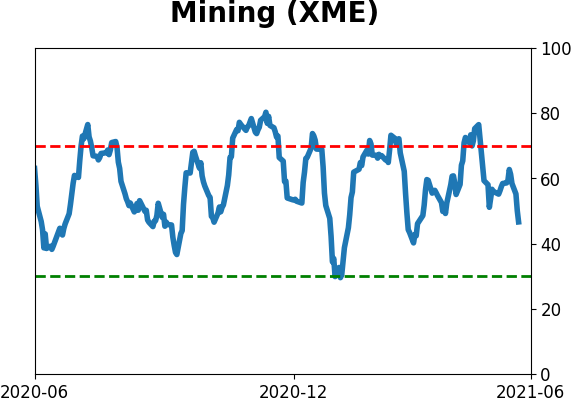
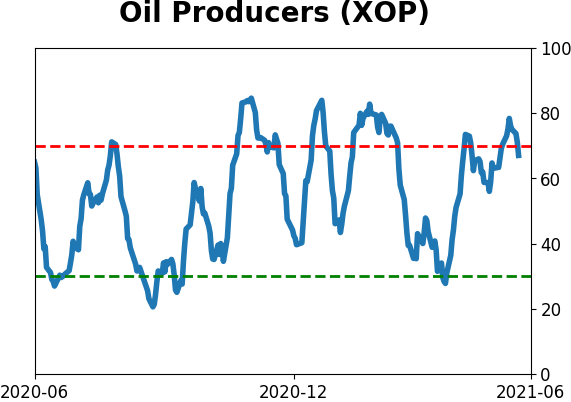
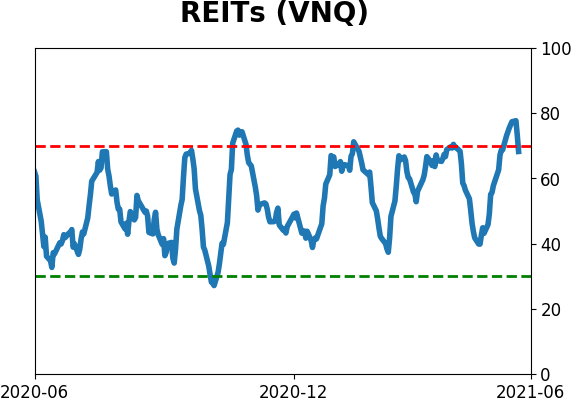
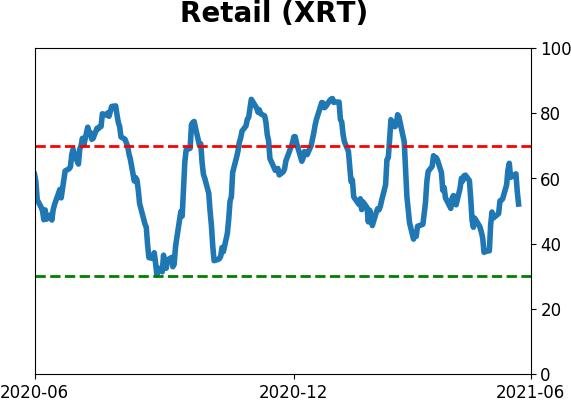
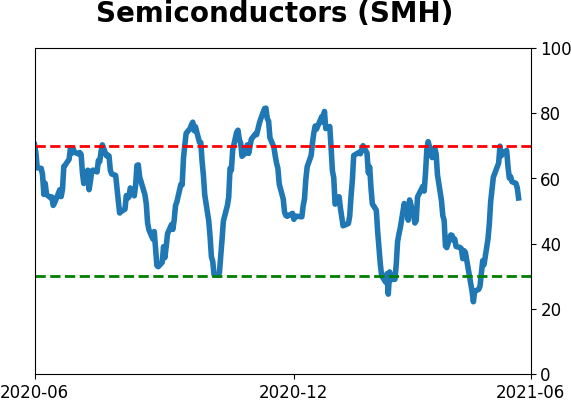
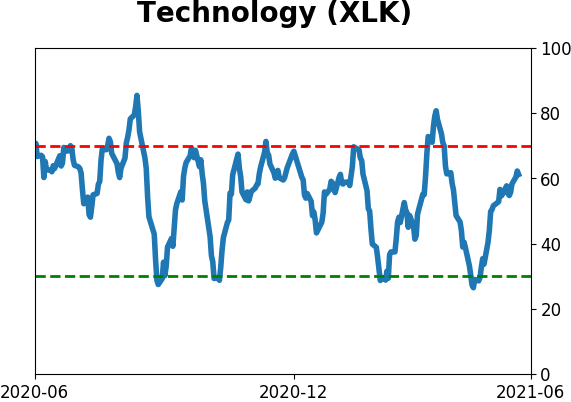
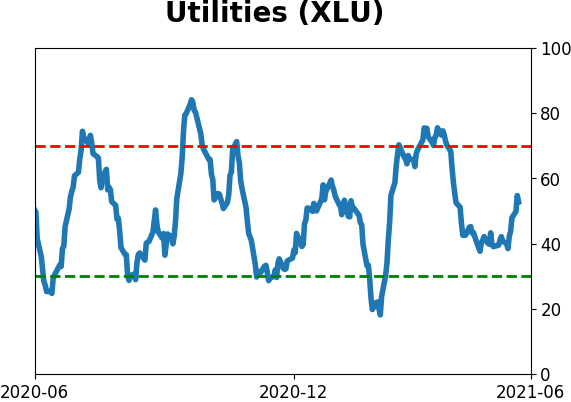
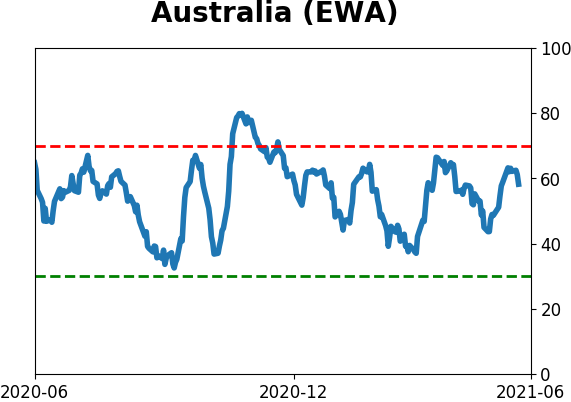
Optimism Index Thumbnails
|
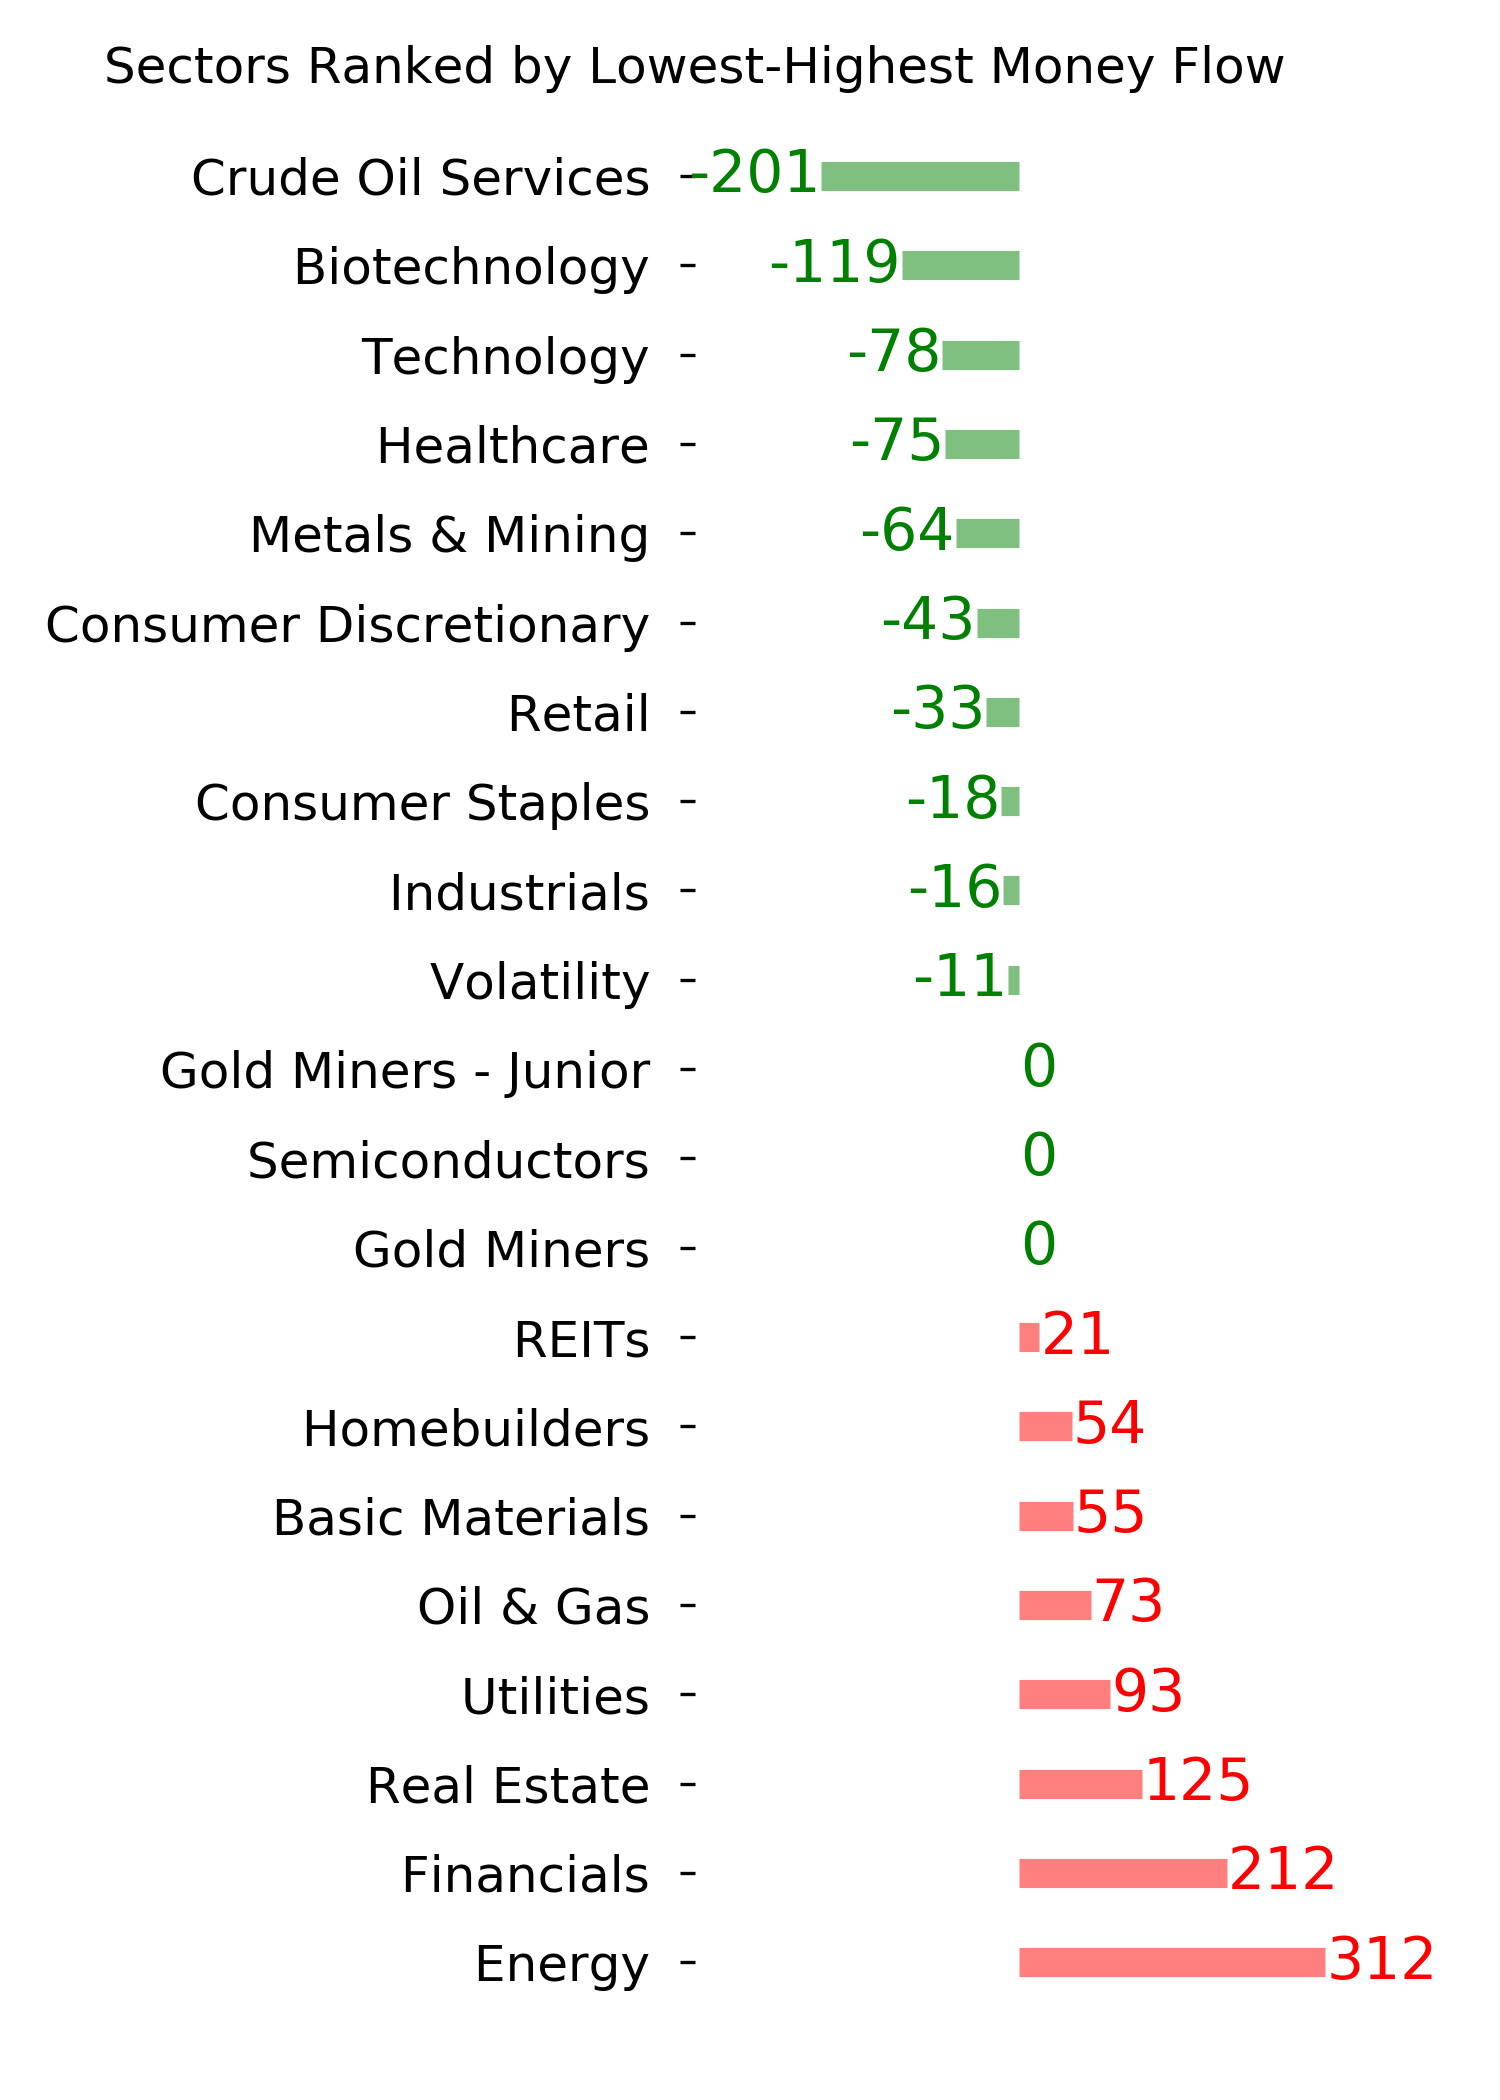
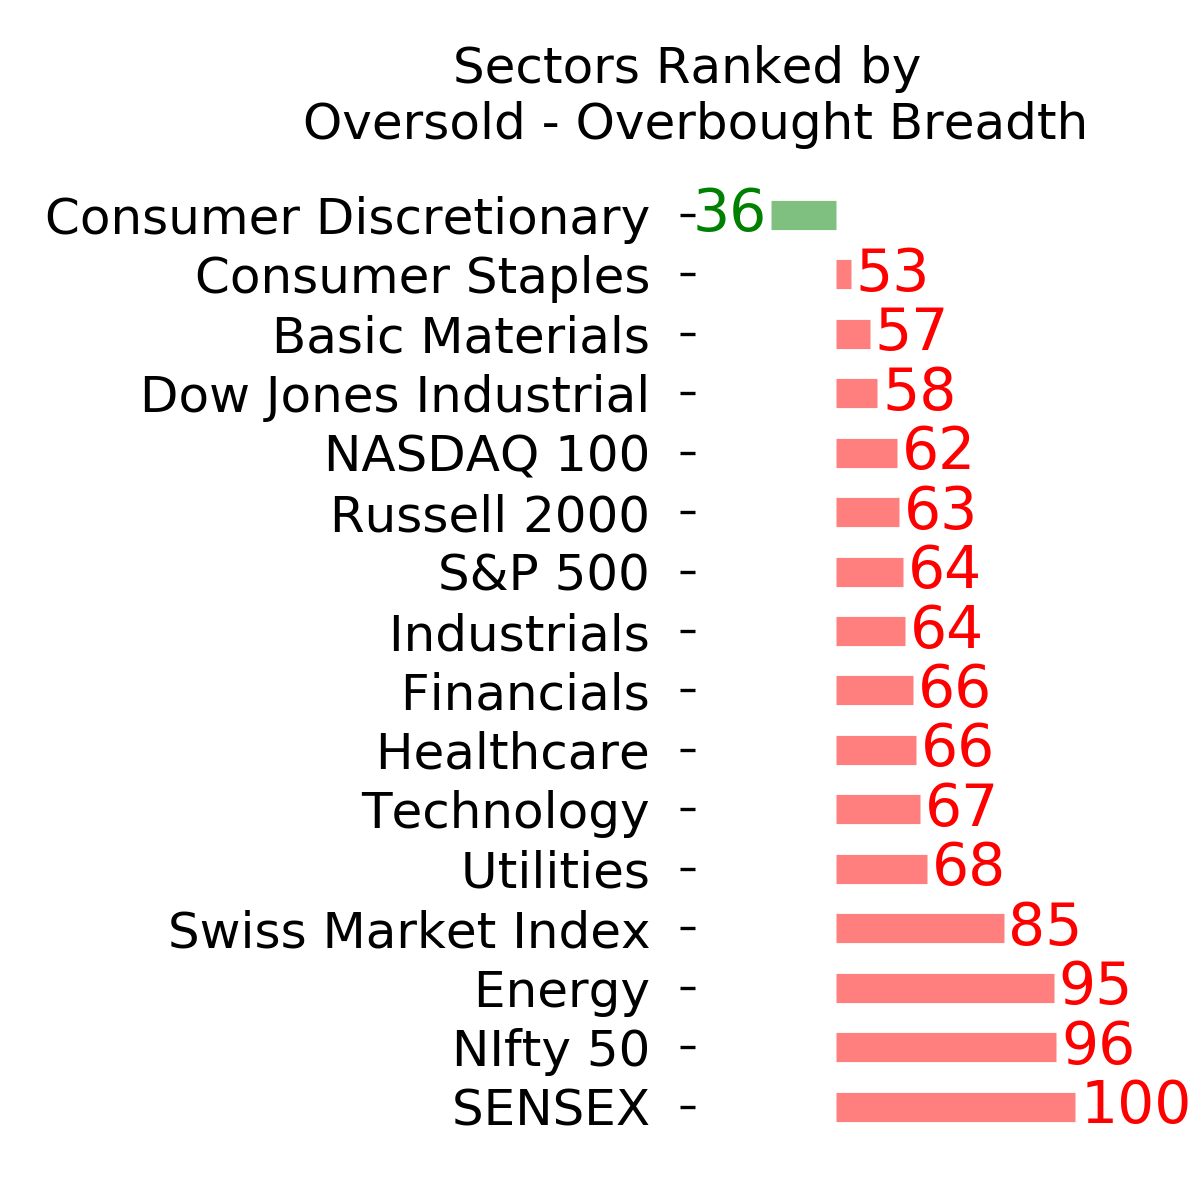
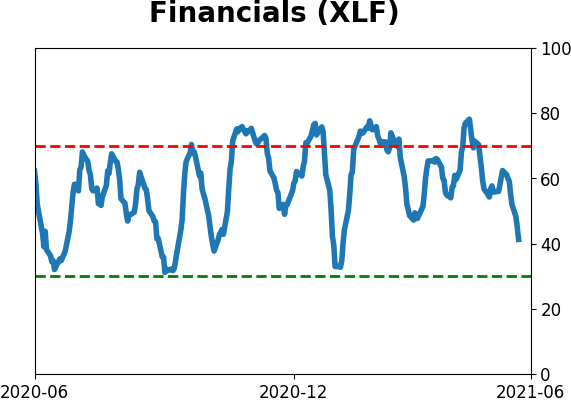
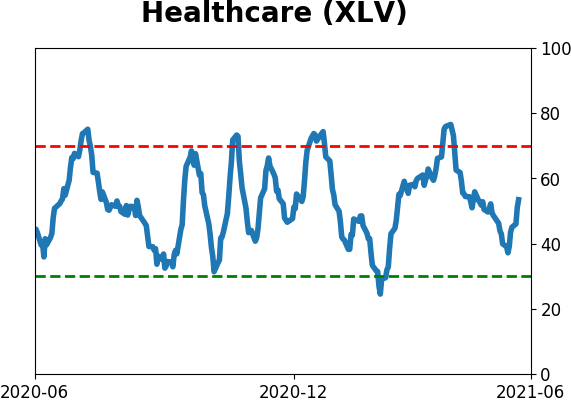
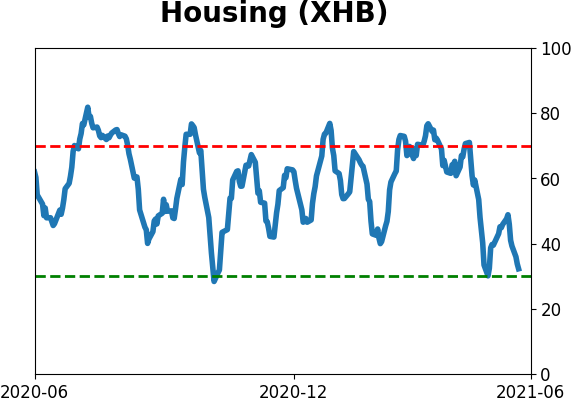
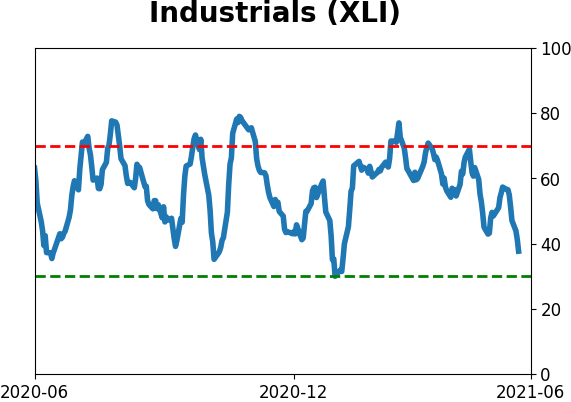
Sector ETF's - 10-Day Moving Average
|
|
|
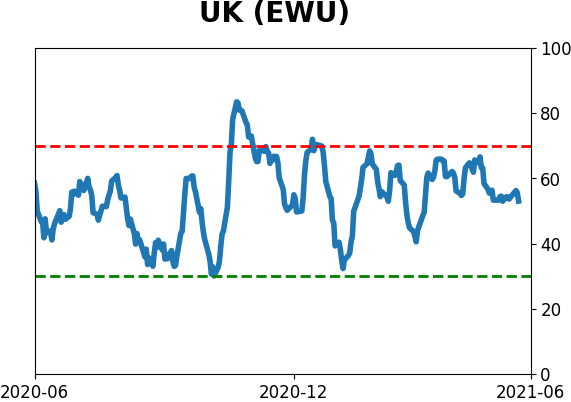
Country ETF's - 10-Day Moving Average
|
|
|
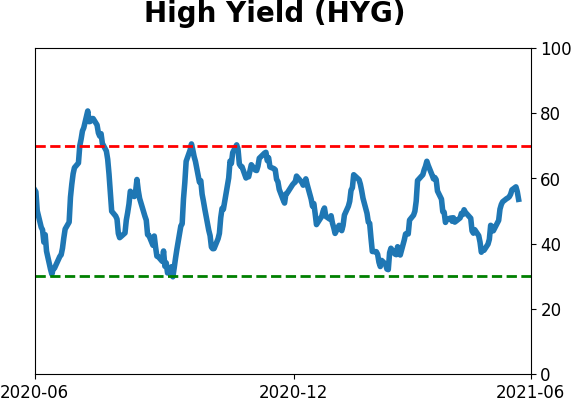
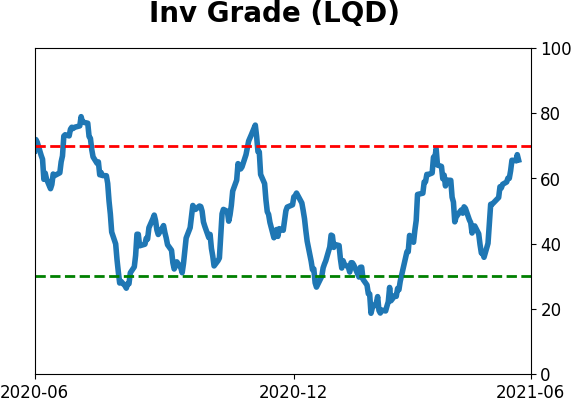
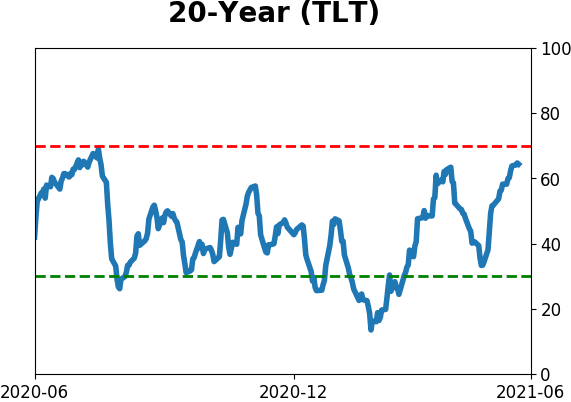
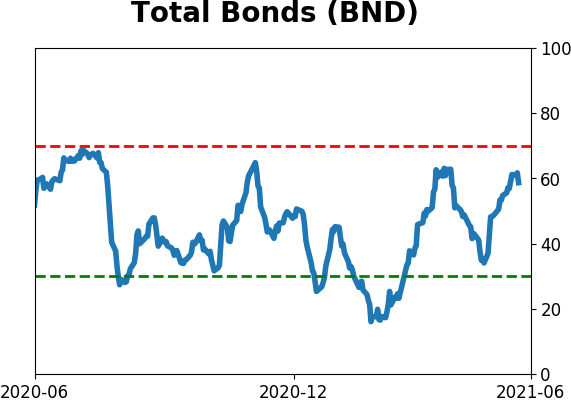
Bond ETF's - 10-Day Moving Average
|
|
|
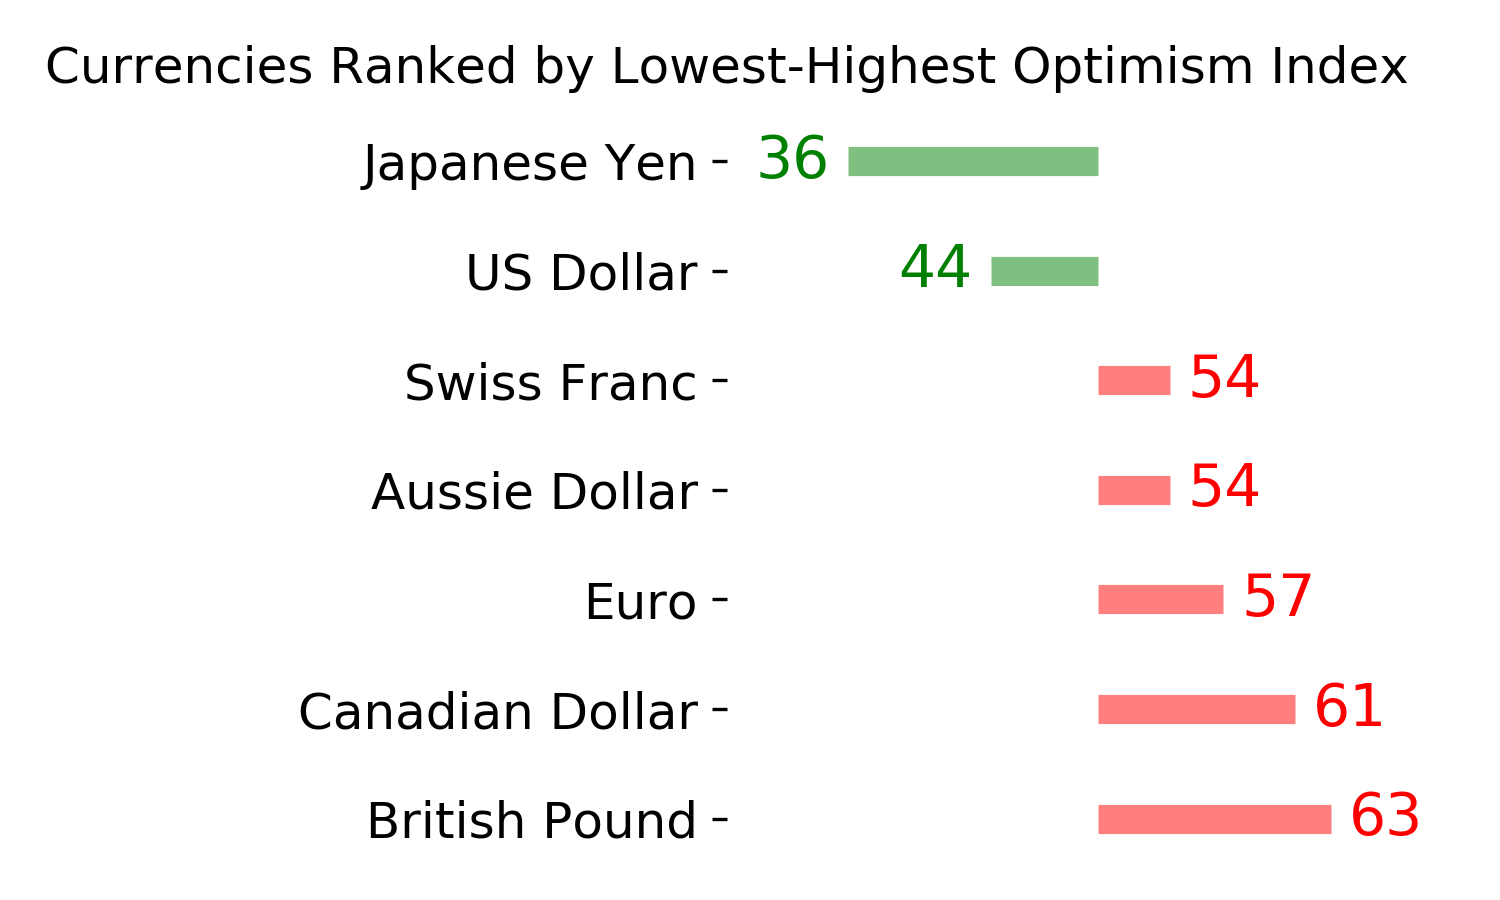
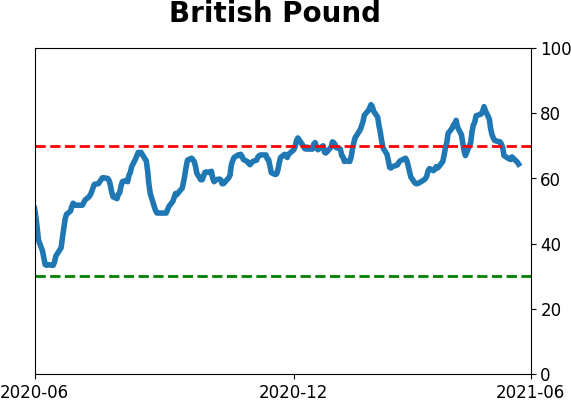
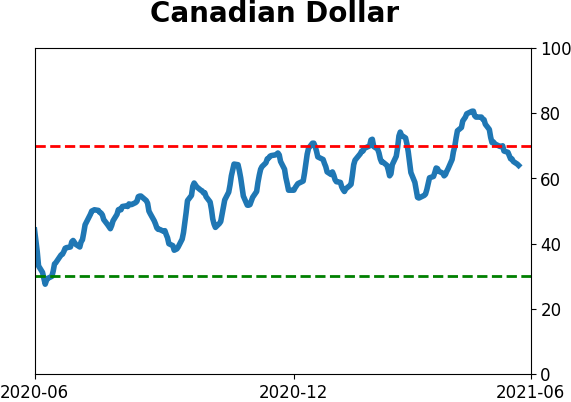
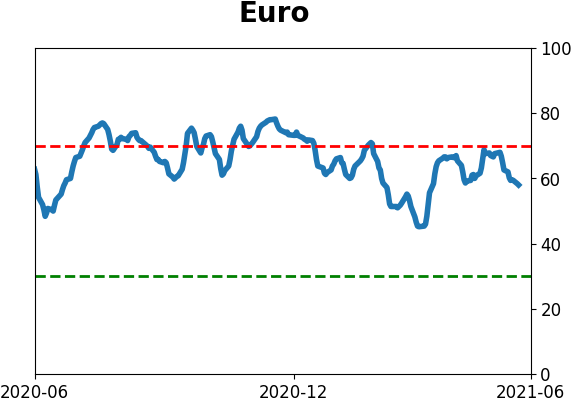
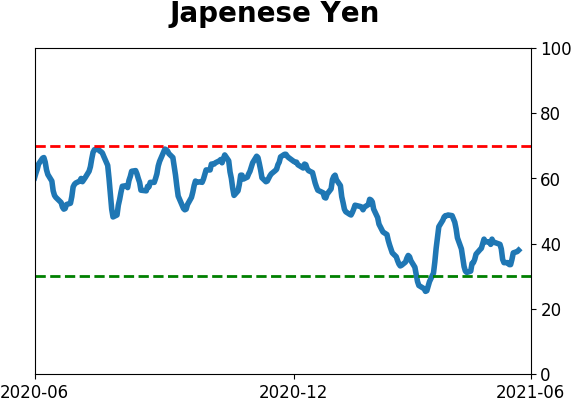
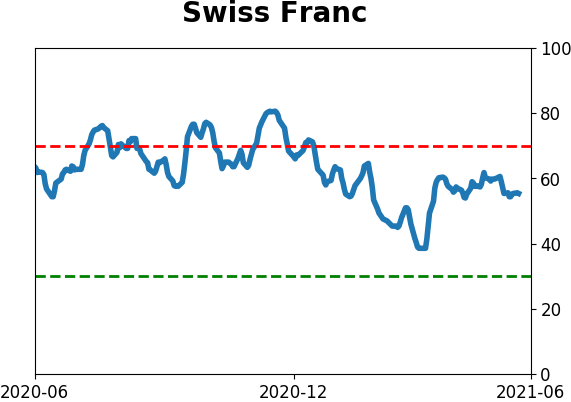
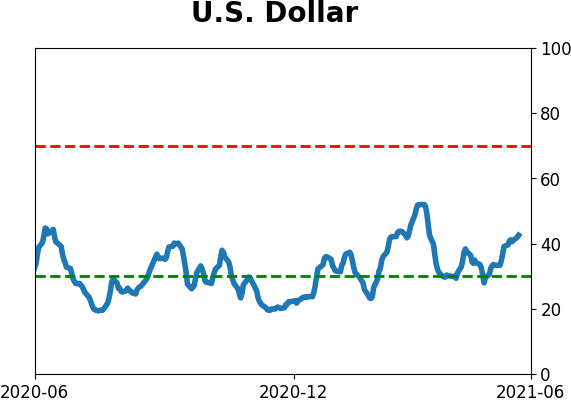
Currency ETF's - 5-Day Moving Average
|
|
|
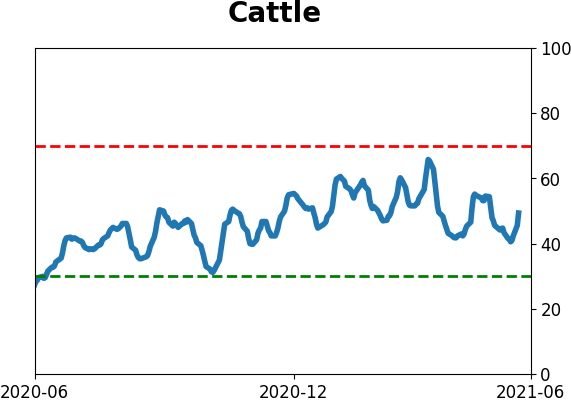
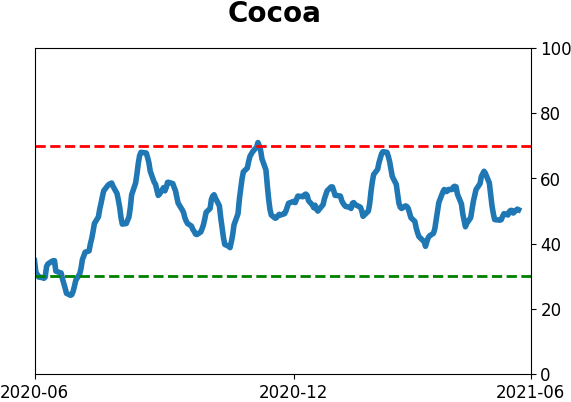
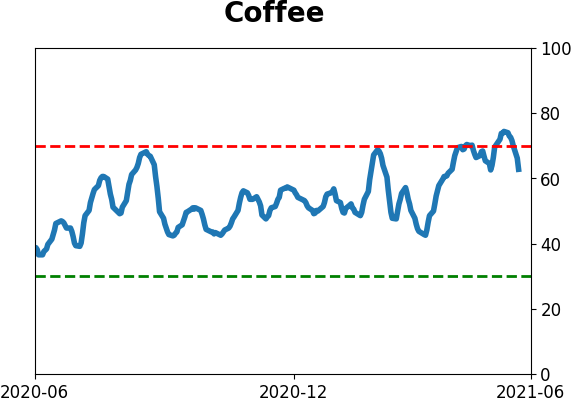
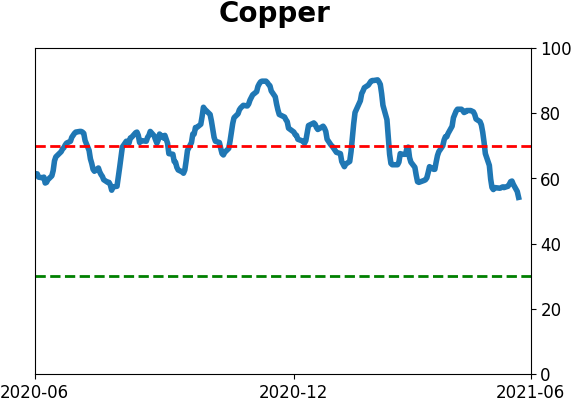
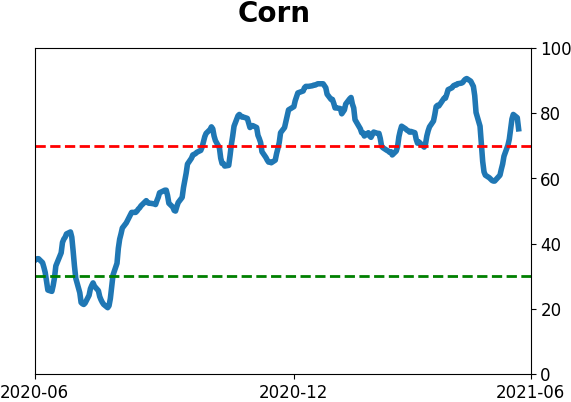
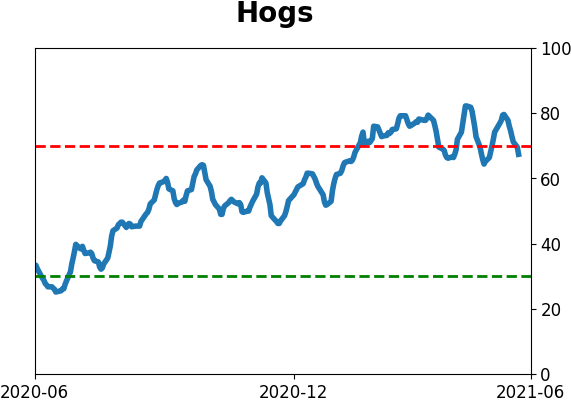
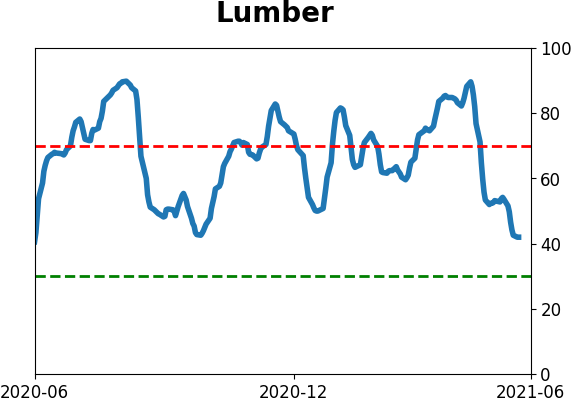
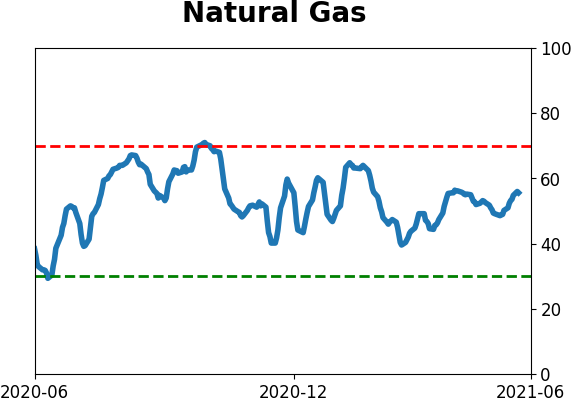
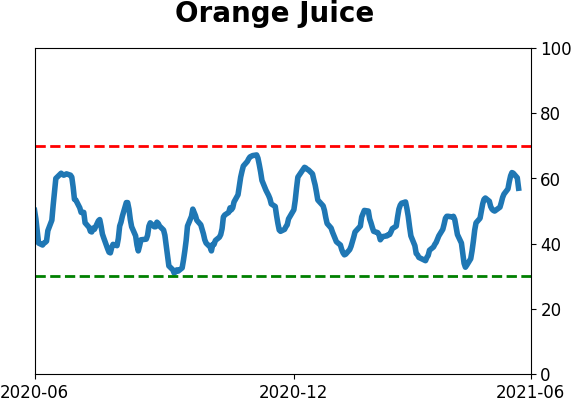
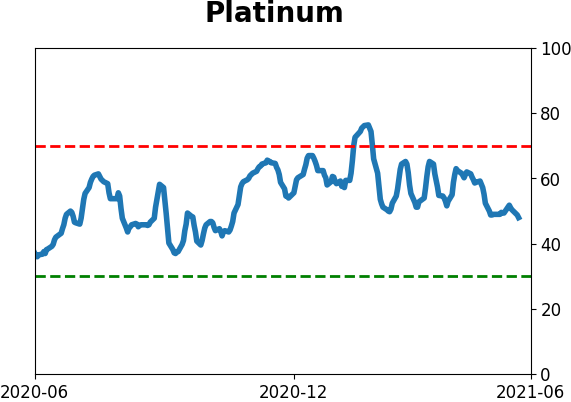
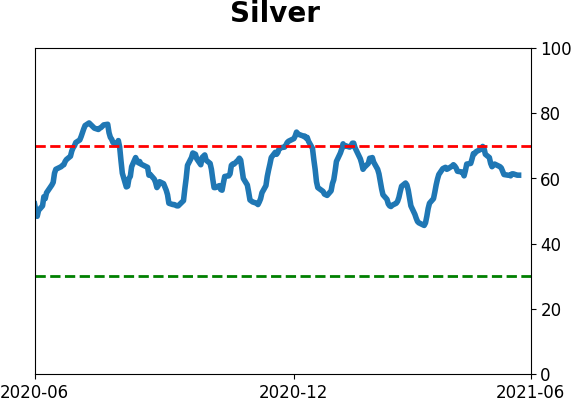
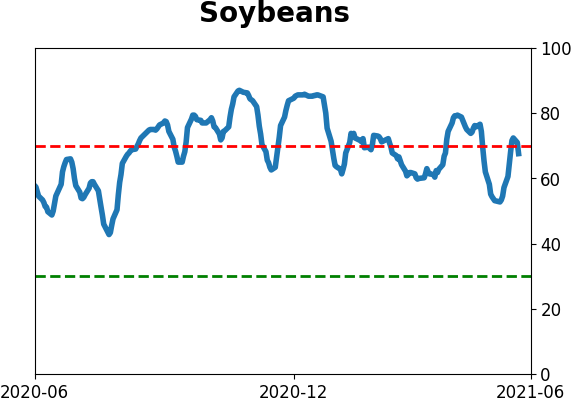
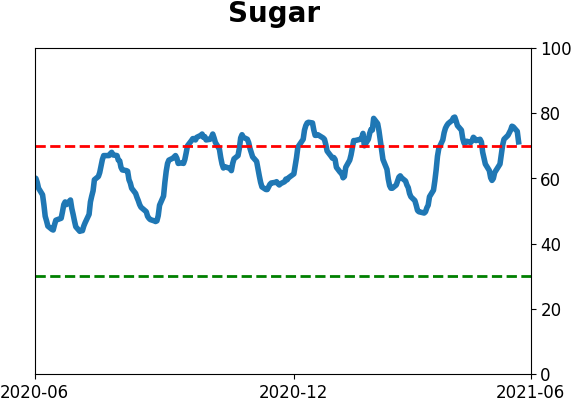
Commodity ETF's - 5-Day Moving Average
|
|