Headlines
|
|
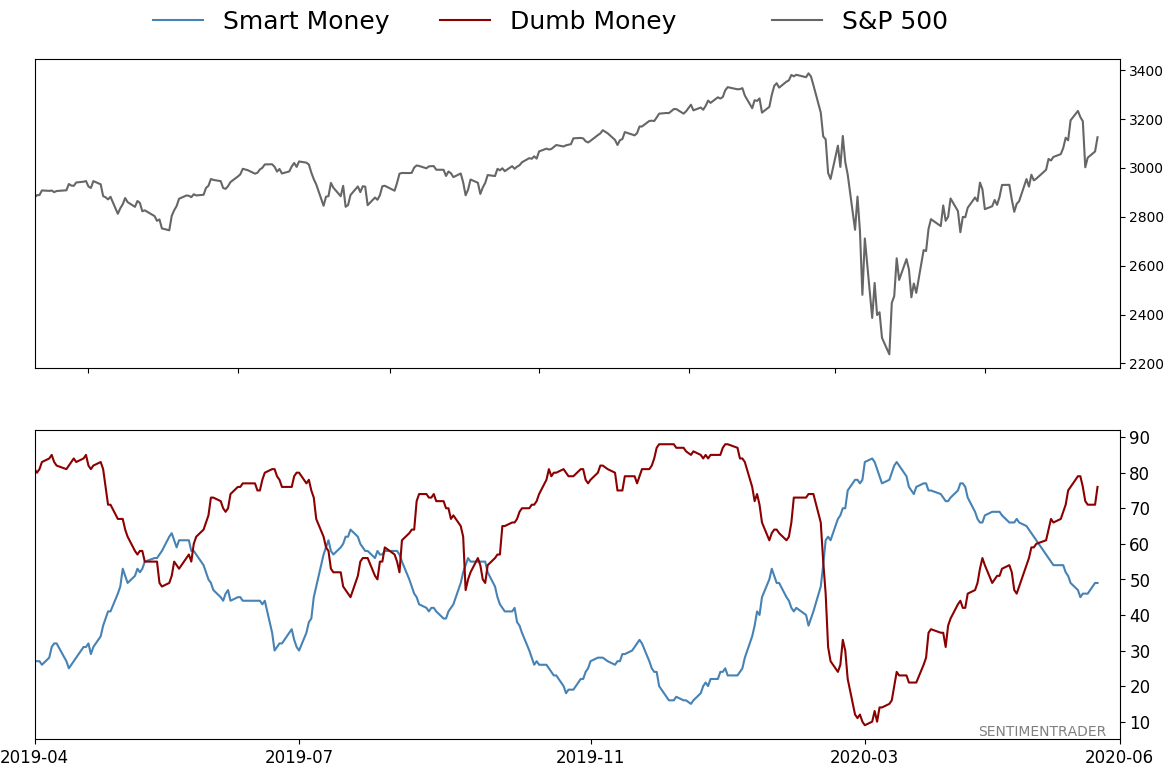
Confidence returns to pre-crisis levels:
From a record low reading in March, Dumb Money Confidence has returned to extreme optimism. When Confidence cycles like this, it has typically preceded sketchy shorter-term returns, and other warning signs triggered when Confidence went from one extreme to the other in very short periods of time.
The next 100 days may hinge on Republicans' chances:
We're about 100 days from the presidential election. Looking at past elections, the summer and fall months had a strong tendency to be positive if the White House remained in Republican hands. But if a Republican ended up losing to a Democrat, the summer was usually a rocky affair.
|
Smart / Dumb Money Confidence
|
Smart Money Confidence: 49%
Dumb Money Confidence: 76%
|
|
Risk Levels
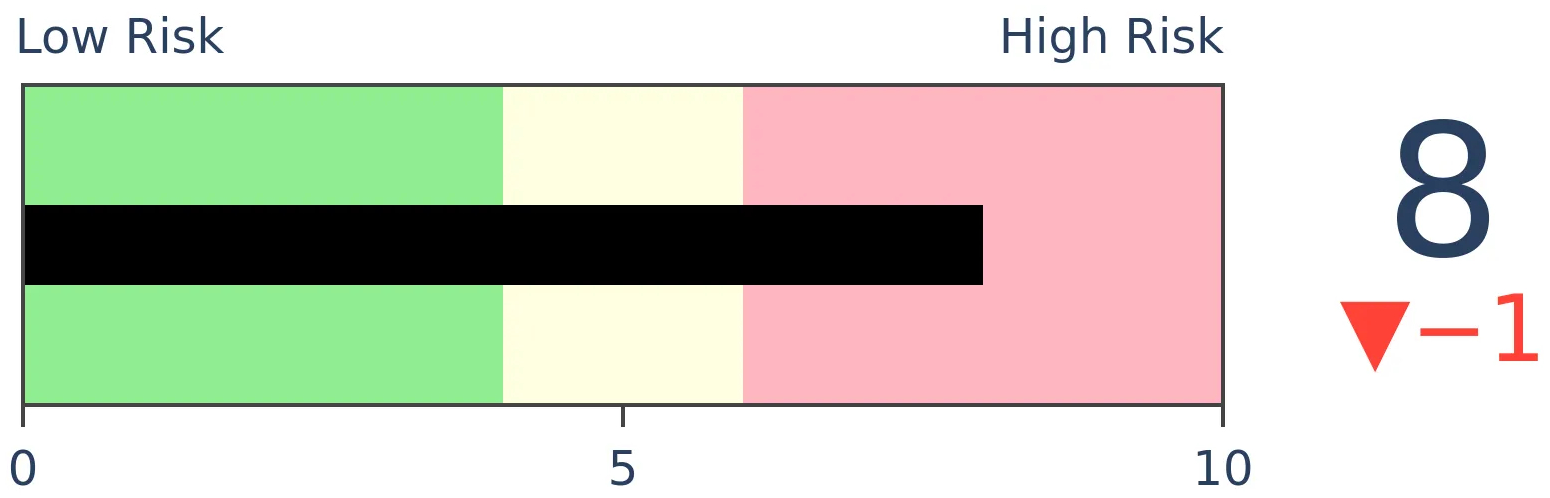
Stocks Short-Term
|
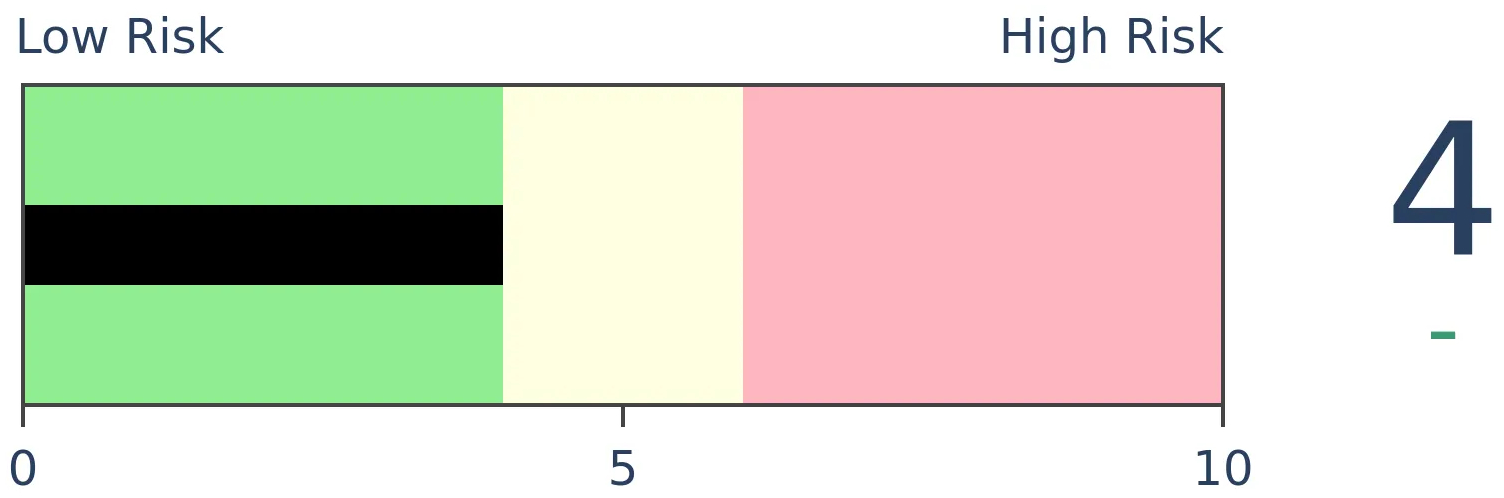
Stocks Medium-Term

|
|
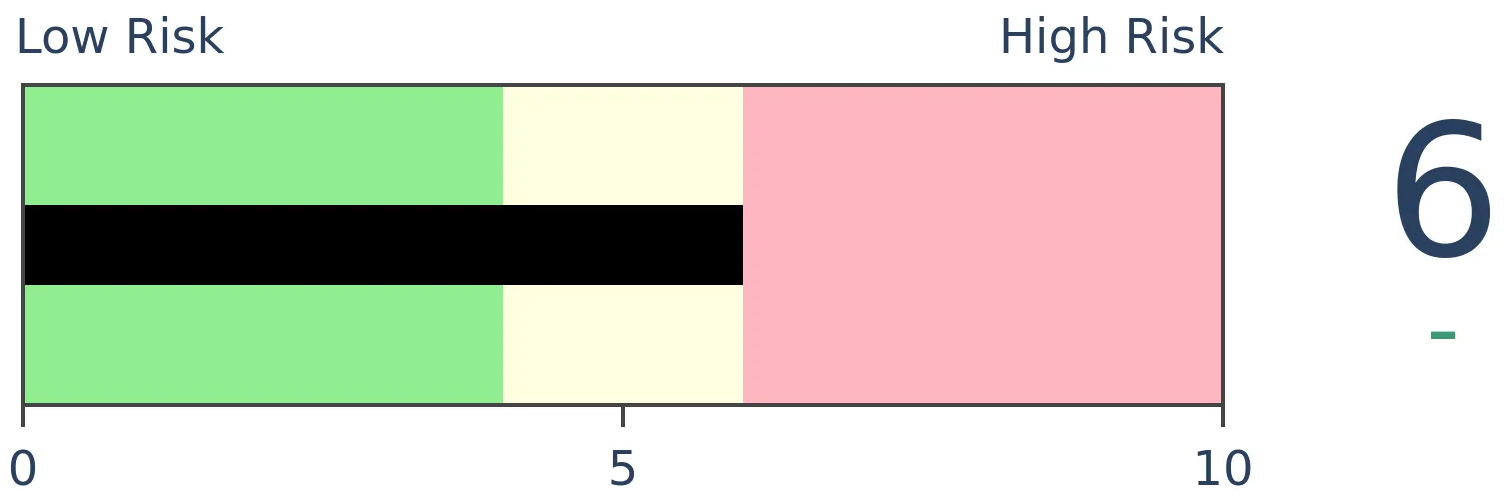
Bonds
|
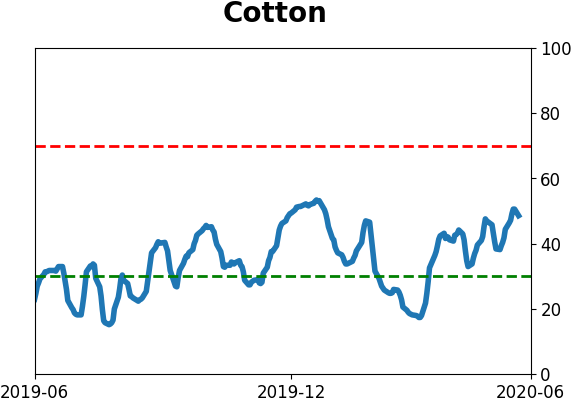
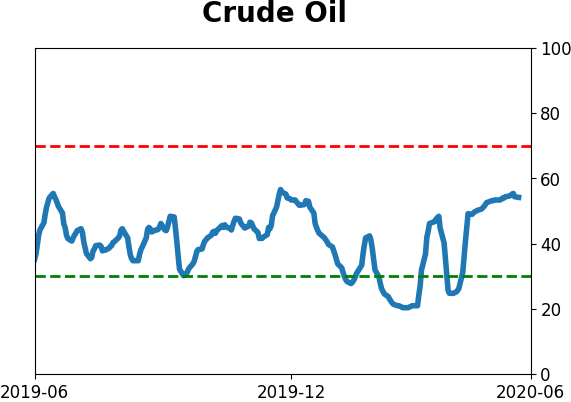
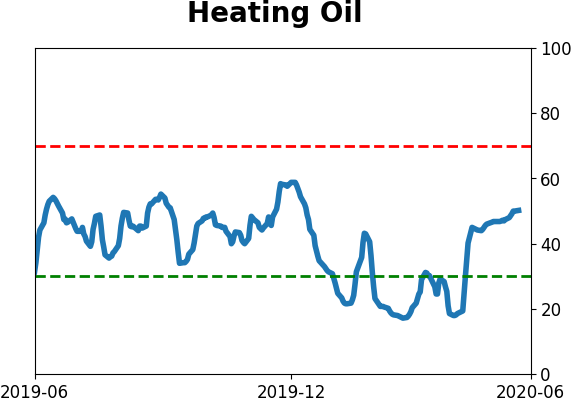
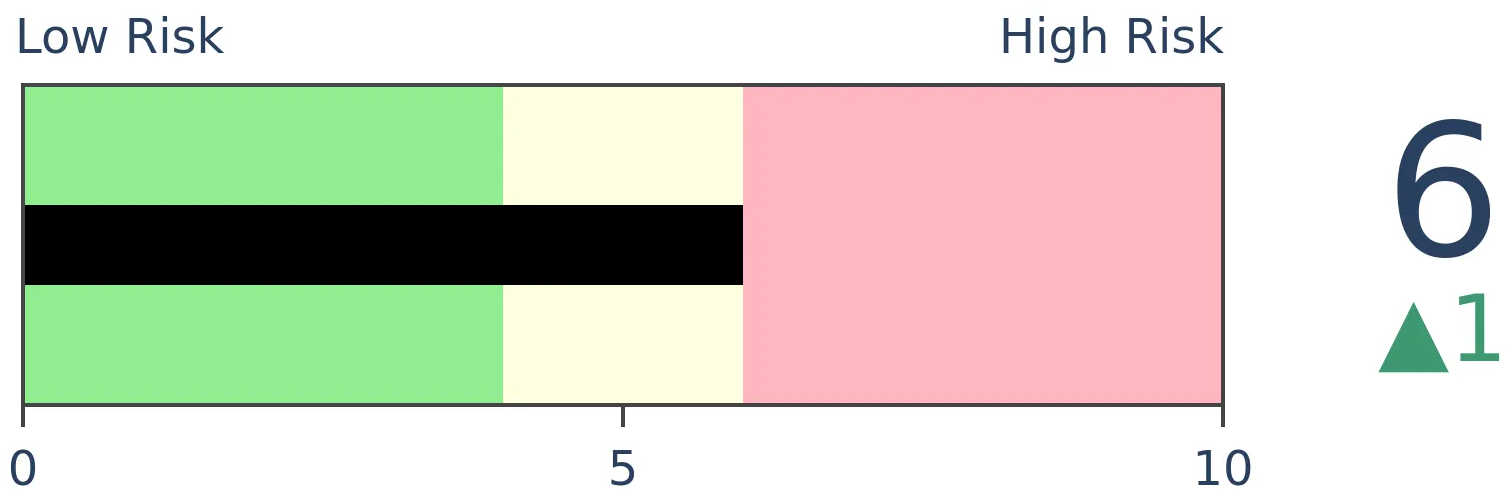
Crude Oil
|
|
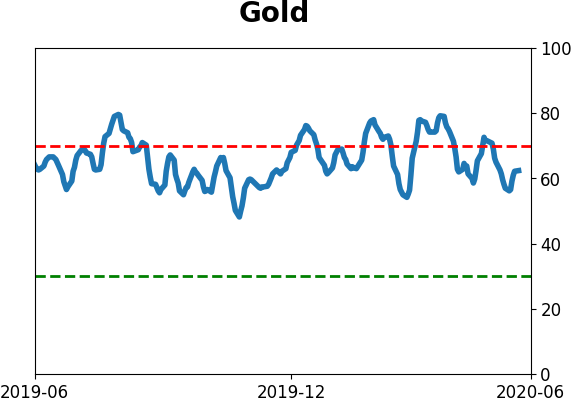
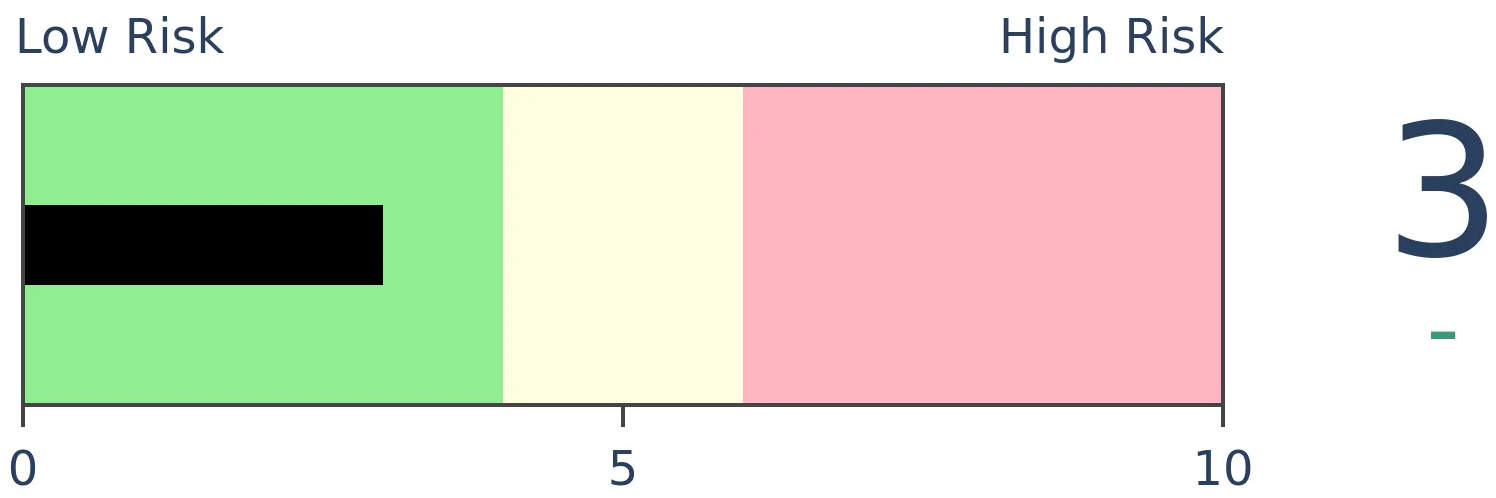
Gold
|
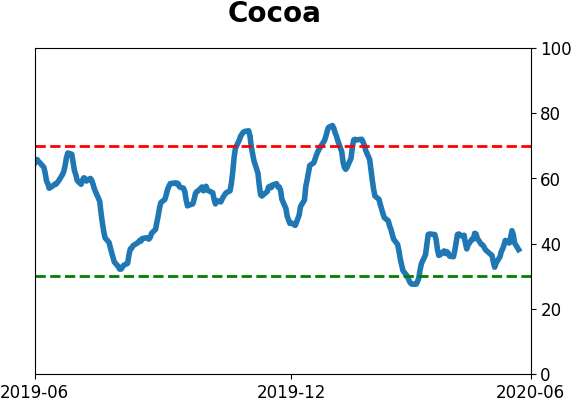
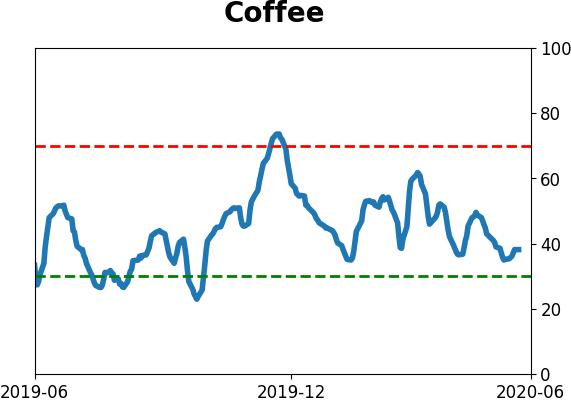
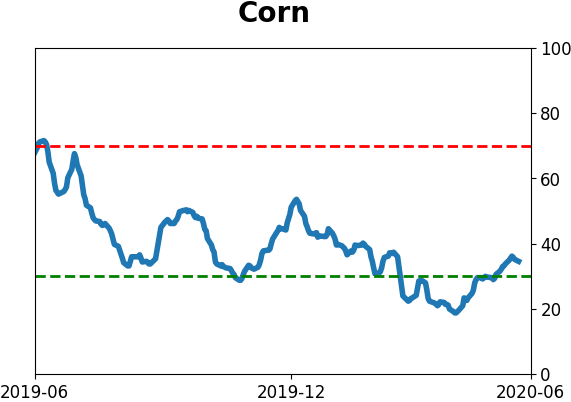
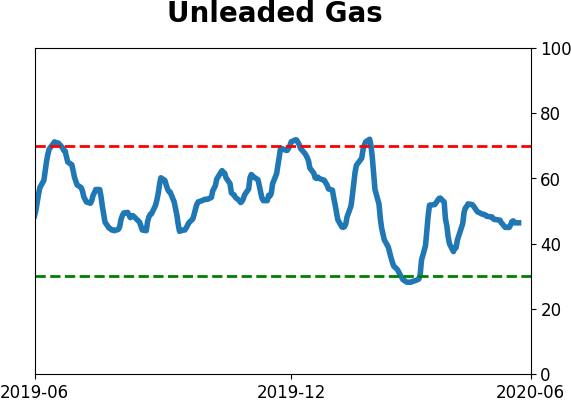
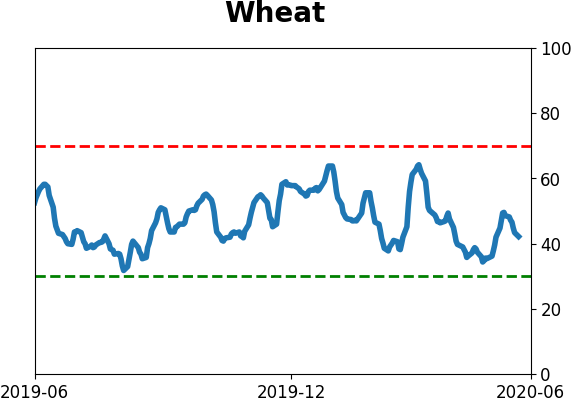
Agriculture
|
|
Research
BOTTOM LINE
From a record low reading in March, Dumb Money Confidence has returned to extreme optimism. When Confidence cycles like this, it has typically preceded sketchy shorter-term returns, and other warning signs triggered when Confidence went from one extreme to the other in very short periods of time.
FORECAST / TIMEFRAME
None
|
Along with prices, confidence has stormed back from the depths of pessimism, especially among those who have a tendency to be most bearish near price lows and most bullish near price highs. From a record low reading in March, sentiment has cycled well into extreme optimism, where it has since settled a bit.
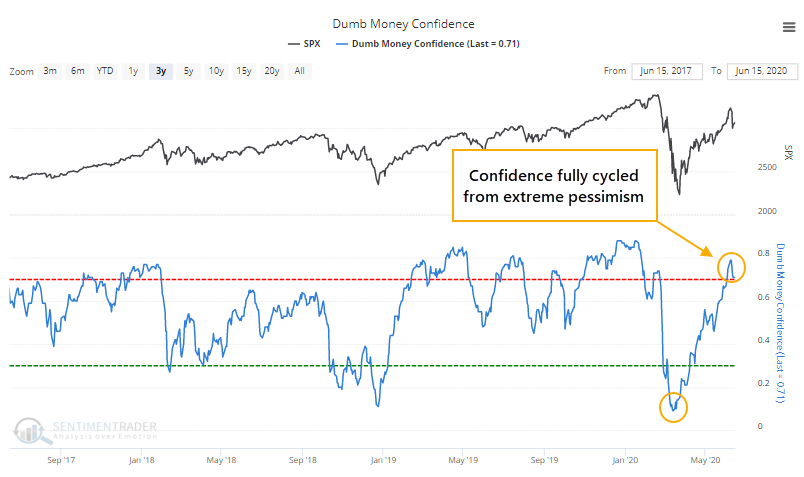
When Dumb Money Confidence has been 79% or above since 1999, the S&P 500's returns in the months ahead have tended to be subdued. Even though median returns were negative over the next 2-3 months, the S&P was still positive most of the time, thanks mostly to the initial readings following the 2002 and 2008 bear markets.
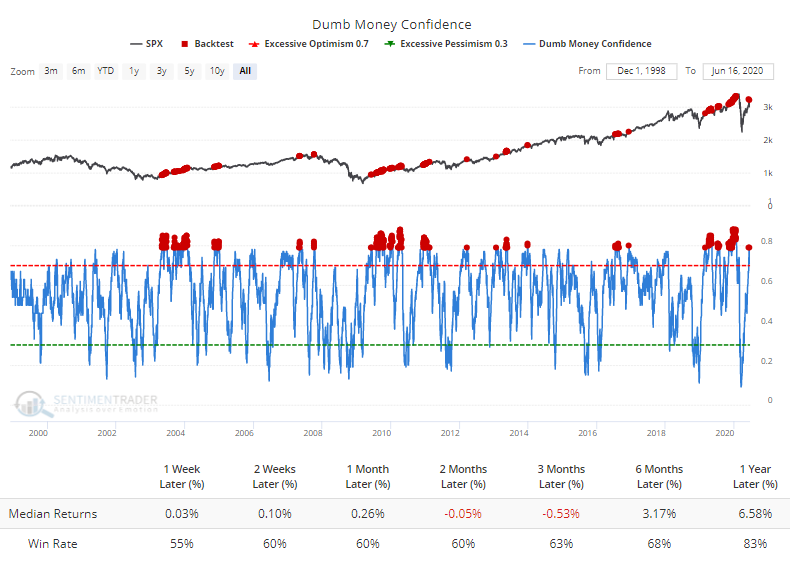
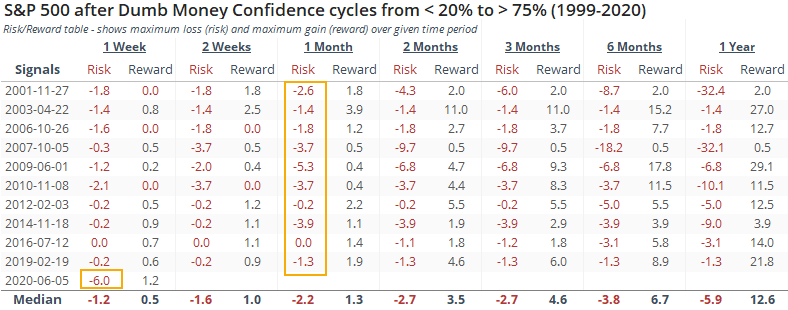
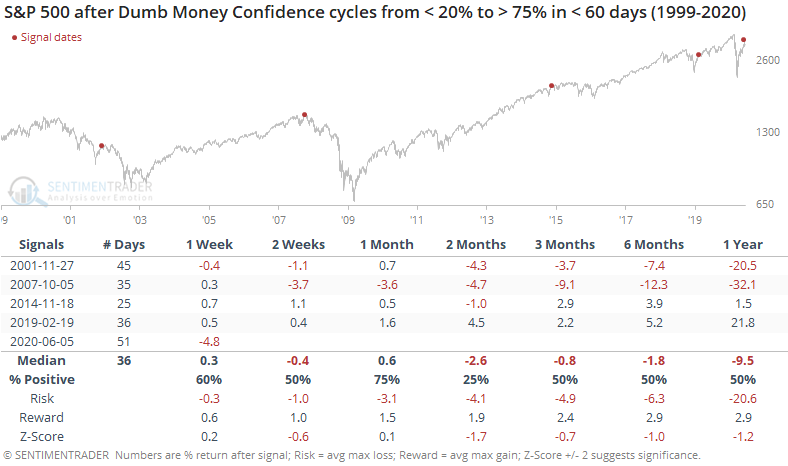
When Confidence goes from deep pessimism to high optimism, negative returns had a stronger tendency to be focused on the shorter-term. On average, it took 84 trading days for Confidence to go from below 20% to above 75%. This time, it took only 51 sessions.
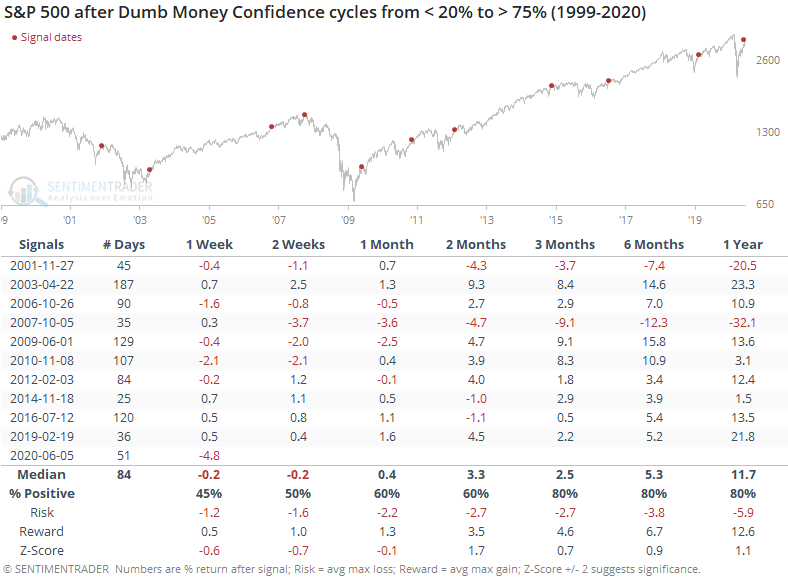
That was evident this time, with a 6% drawdown in the week after Dumb Money Confidence first surged above 75%. That's larger than every other signal's drawdown even up to a month later.
It's hard to know whether this is a good thing (the selling pressure has already been alleviated) or a bad thing (this signal is different from all the others). In a very general sense, when we see behavior like this, it's usually the former as opposed to the latter.
One concern is just how fast Confidence returned. There have been only a handful of times when it made a round trip from pessimism to optimism within three months.
After these, prices ultimately gave back any further gains. It happened immediately after signals in 2001 and 2007, but took a long while after the ones in 2014 and 2019.
The most compelling aspects about stocks since late March, and which have continued recently, are the breadth thrusts and recoveries have an almost unblemished record at preceding higher prices over a 6-12 month time frame. Shorter-term, there have been an increasing number of warning signs, and we'd rate the return of Dumb Money Confidence among them.
BOTTOM LINE
We're about 100 days from the presidential election. Looking at past elections, the summer and fall months had a strong tendency to be positive if the White House remained in Republican hands. But if a Republican ended up losing to a Democrat, the summer was usually a rocky affair.
FORECAST / TIMEFRAME
None
|
With a rise in social unrest, confusion over the pandemic response, and a highly volatile market, the probability of President Trump holding onto his office has dwindled.
Whatever one's political associations, there seems to be a clear correlation between re-election odds and the price path of the Dow Industrials.
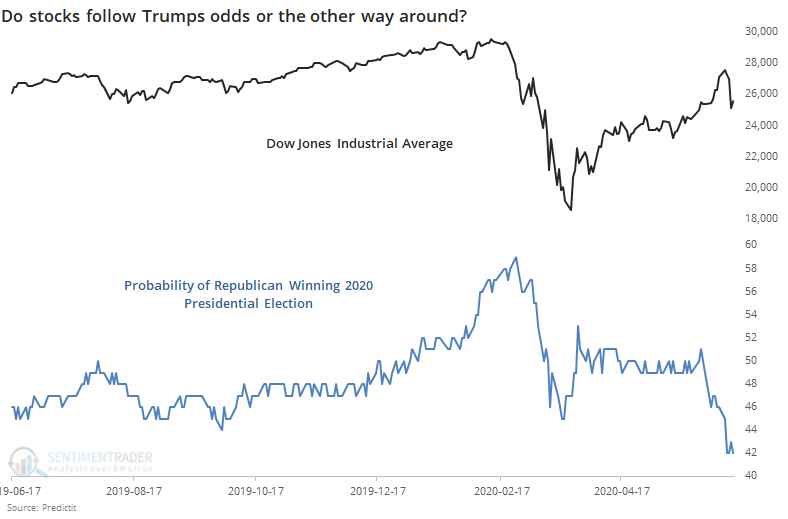
Like any correlation, it's hard to know whether it's just happenstance, or even which one might be causing the other. Whatever the underlying cause and effect, there does seem to be a rise in anxiety among traders when approval numbers drop.
We're about 100 trading days from the election, so let's look at returns in the Dow Jones Industrial Average once we reach the 100-days-before-election mark, depending on whether an incumbent Republican wins (or loses to another Republican).
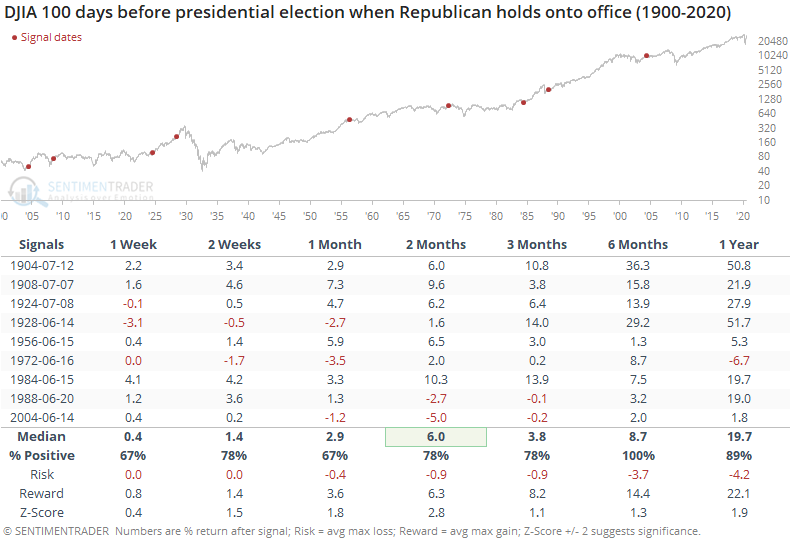
Over the next six months, roughly the time frame until the election, the Dow didn't suffer a single loss. In recent decades, its returns weren't great, but they were mostly positive or only slightly negative in the months leading up to the elections.
If a sitting Republican lost to a Democratic Party rival, then there was a starkly different tone.
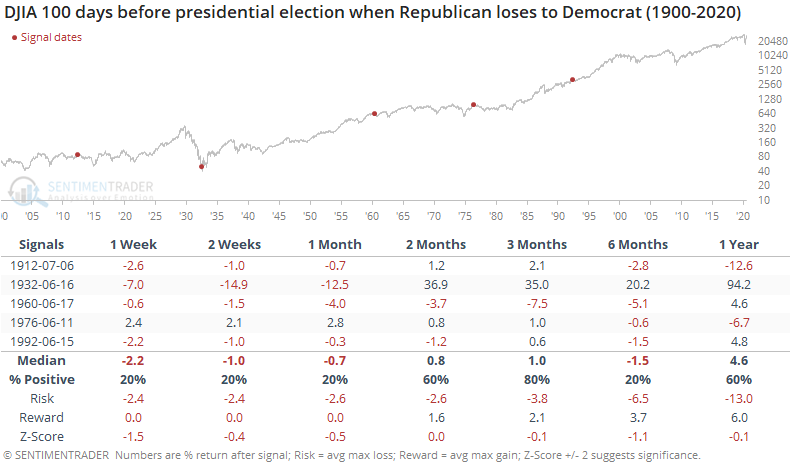
During the summer months leading up to the election, the Dow often struggled. Over the next 1-2 months, roughly July-August, any upside was limited and the risk/reward was mostly "risk." While the Dow ended up doing very well in 1932, the others all saw negative returns over the next six months.
Based on these suggestions and the recent behavior of markets in correlation to President Trump's re-election chances, bulls should hope his probabilities improve.
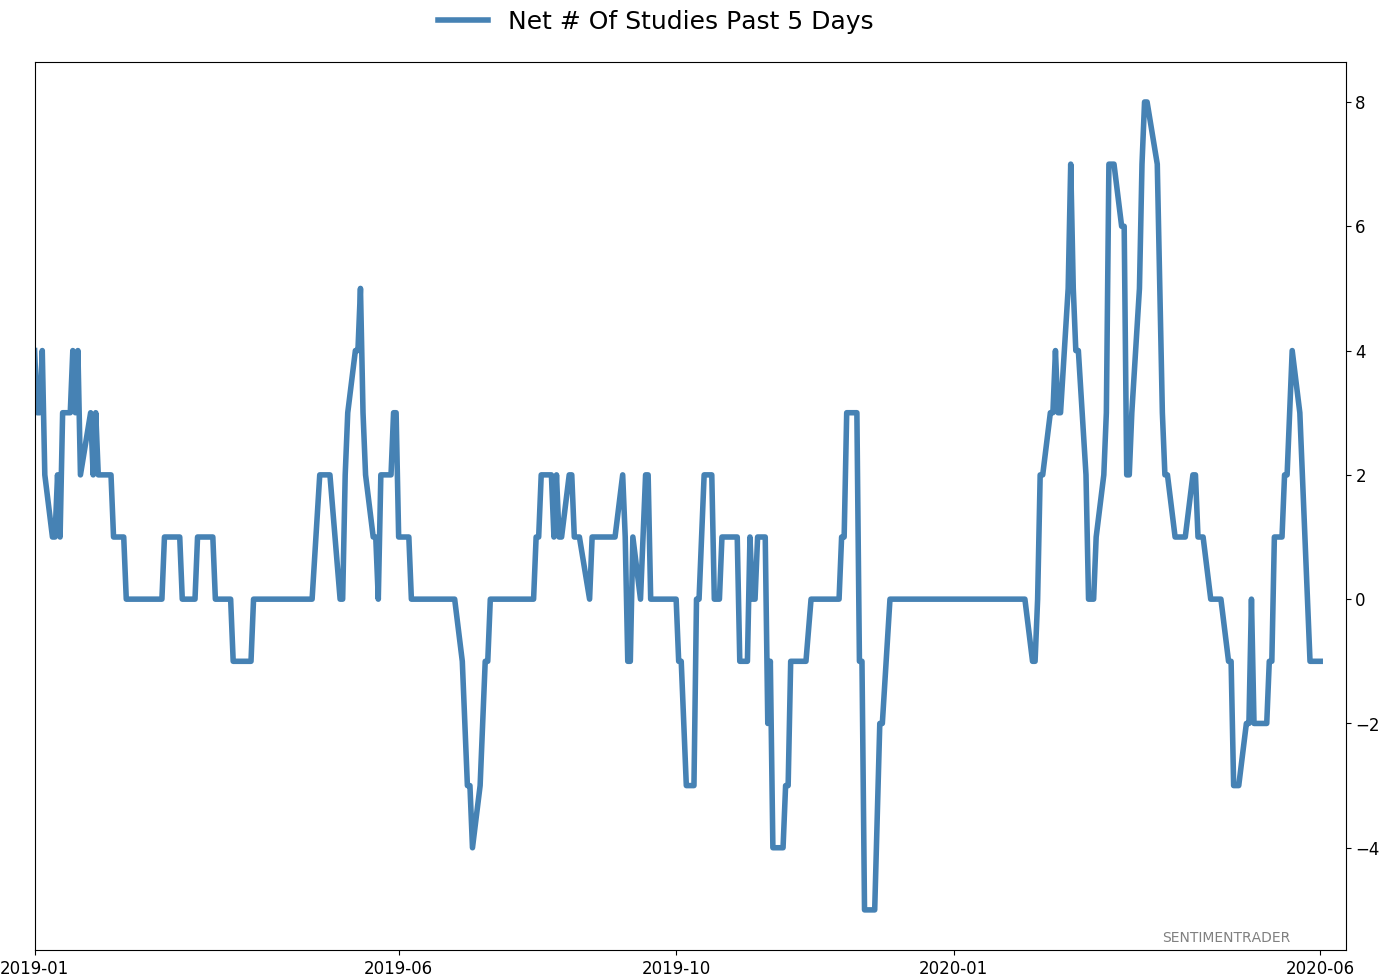
Active Studies
| Time Frame | Bullish | Bearish | | Short-Term | 0 | 1 | | Medium-Term | 8 | 6 | | Long-Term | 40 | 1 |
|
Indicators at Extremes
Portfolio
| Position | Weight % | Added / Reduced | Date | | Stocks | 29.8 | Reduced 9.1% | 2020-06-11 | | Bonds | 0.0 | Reduced 6.7% | 2020-02-28 | | Commodities | 5.2 | Added 2.4%
| 2020-02-28 | | Precious Metals | 0.0 | Reduced 3.6% | 2020-02-28 | | Special Situations | 0.0 | Reduced 31.9% | 2020-03-17 | | Cash | 65.0 | | |
|
Updates (Changes made today are underlined)
In the first months of the year, we saw manic trading activity. From big jumps in specific stocks to historic highs in retail trading activity to record highs in household confidence to almost unbelievable confidence among options traders. All of that came amid a market where the average stock couldn't keep up with their indexes. There were signs of waning momentum in stocks underlying the major averages, which started triggering technical warning signs in late January. After stocks bottomed on the 23rd, they enjoyed a historic buying thrust and retraced a larger amount of the decline than "just a bear market rally" tends to. Those thrusts are the most encouraging sign we've seen in years. Through early June, we were still seeing thrusts that have led to recoveries in longer-term breadth metrics. The longer-term prospects for stocks (6-12 months) still look decent given the above. On a short- to medium-term basis, it was getting harder to make that case. Dumb Money Confidence spiked and there were multiple signs of a historic level of speculation. Given that, I reduced my exposure a bit when stocks gapped down and failed to hold the lows of late last week. This is likely the lowest I will go given what I still consider to be compelling positives over a longer time frame. There is not a slam-dunk case to be made for either direction, so it will seem like a mistake whether stocks keep dropping (why didn't I sell more?) or if they turn and head higher (why did I let short-term concerns prevail?). After nearly three decades of trading, I've learned to let go of the idea of perfection.
RETURN YTD: -5.8% 2019: 12.6%, 2018: 0.6%, 2017: 3.8%, 2016: 17.1%, 2015: 9.2%, 2014: 14.5%, 2013: 2.2%, 2012: 10.8%, 2011: 16.5%, 2010: 15.3%, 2009: 23.9%, 2008: 16.2%, 2007: 7.8%
|
|
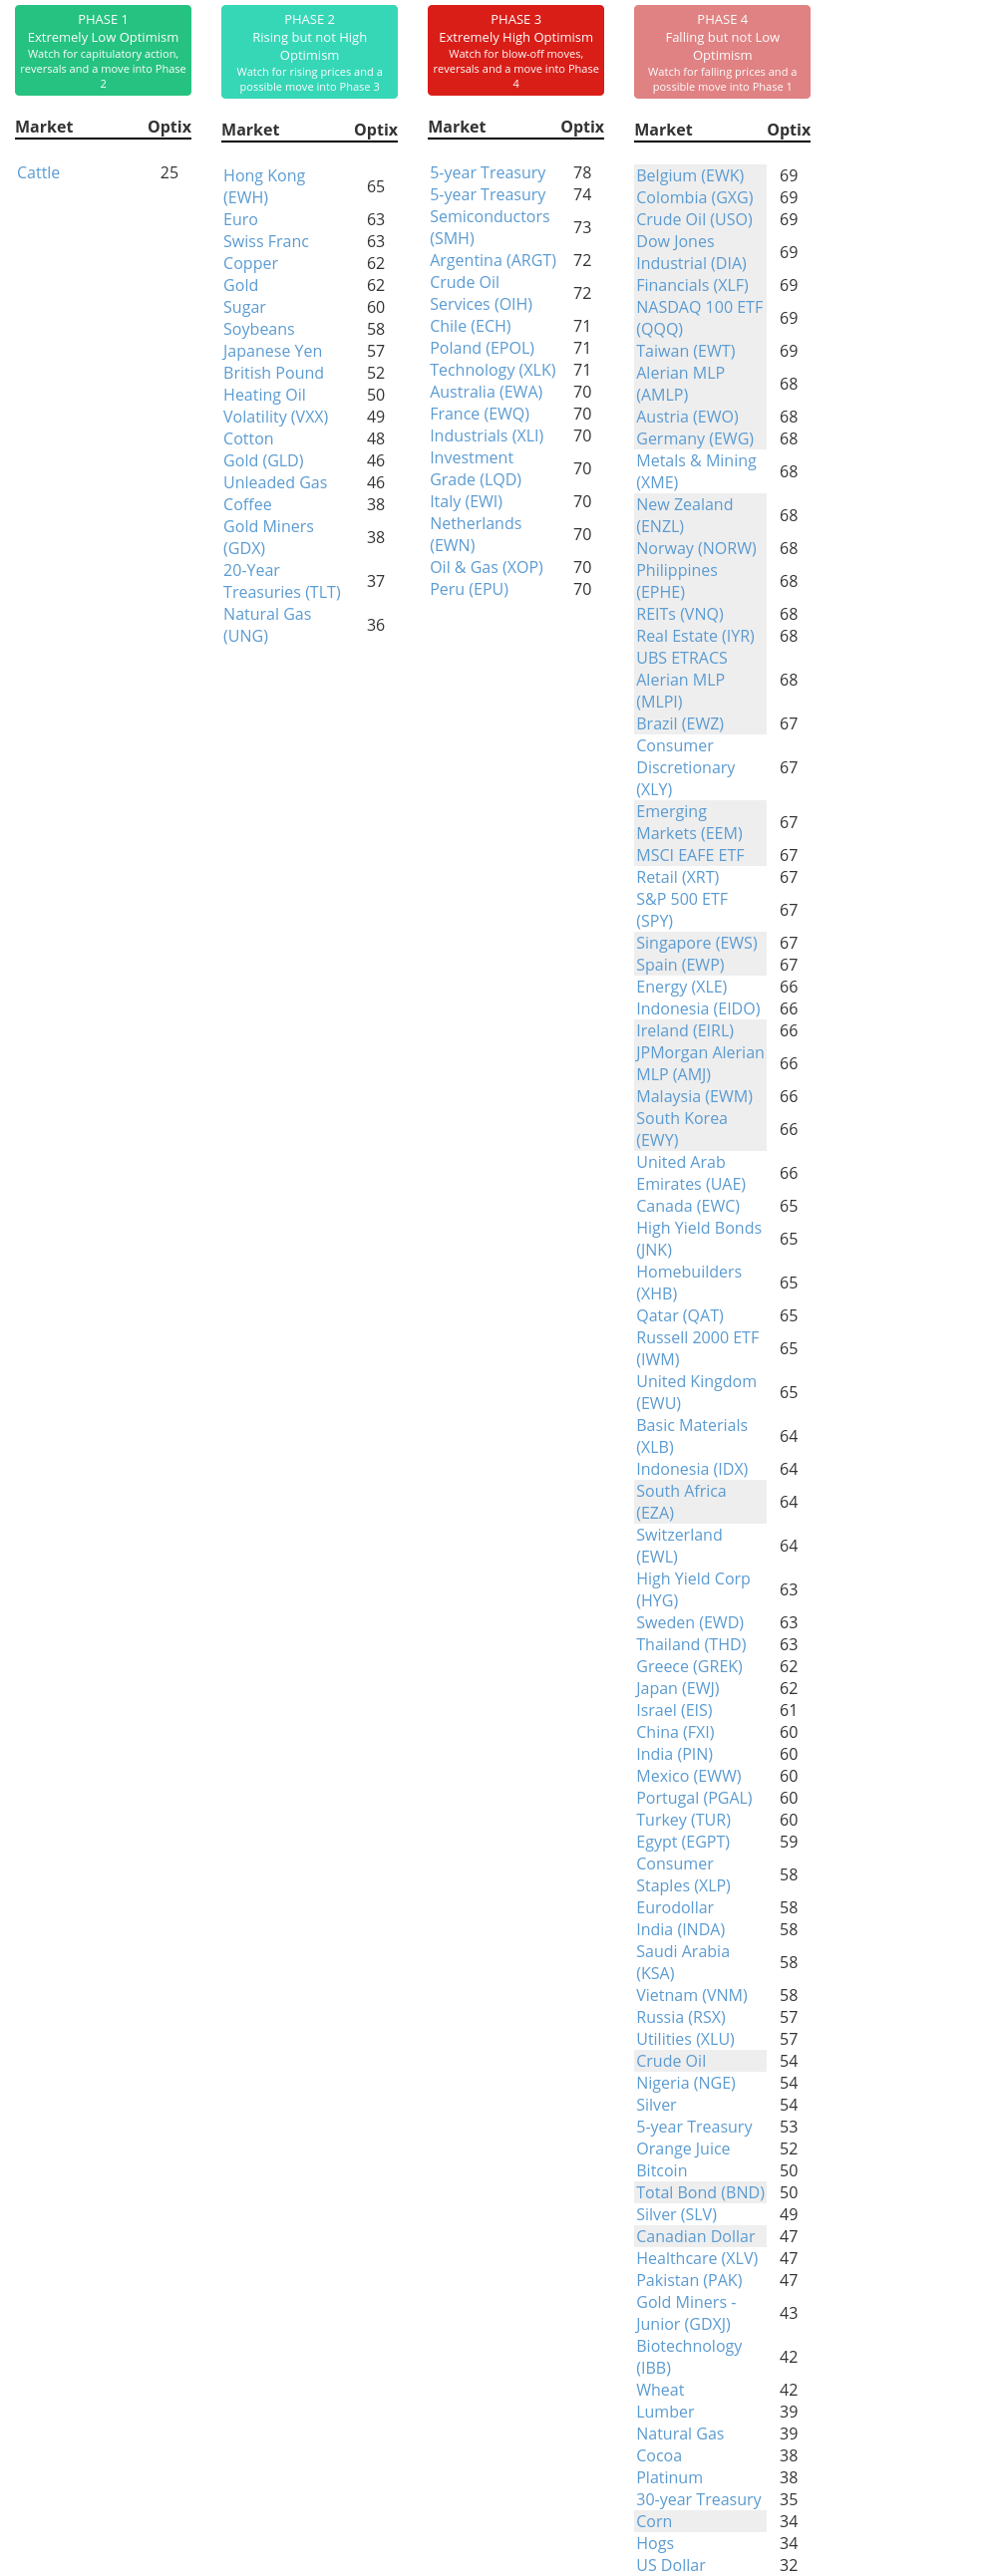
Phase Table
Ranks
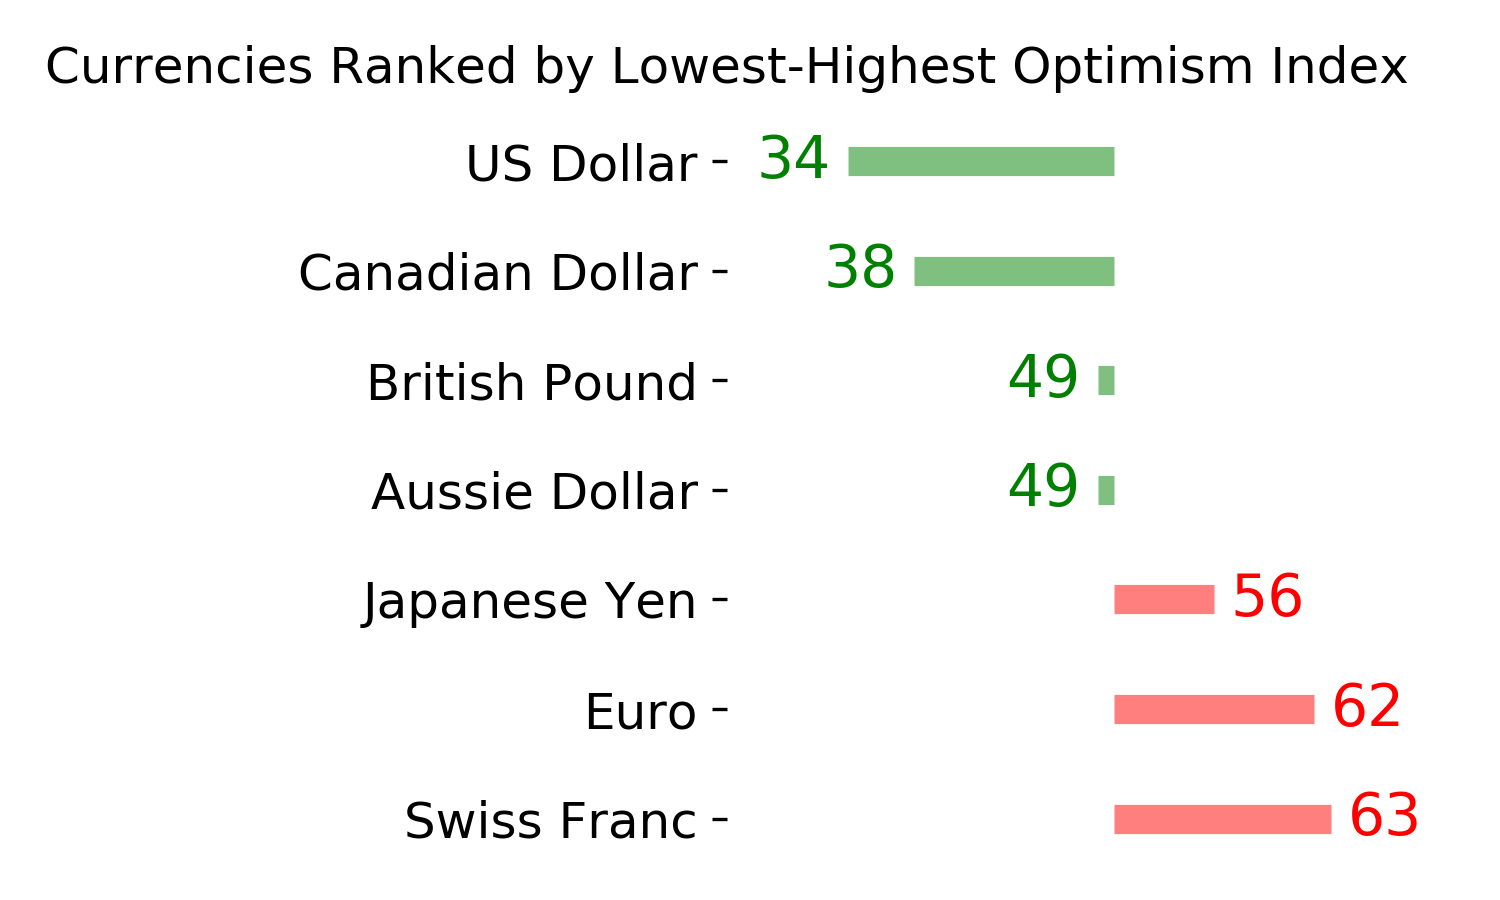
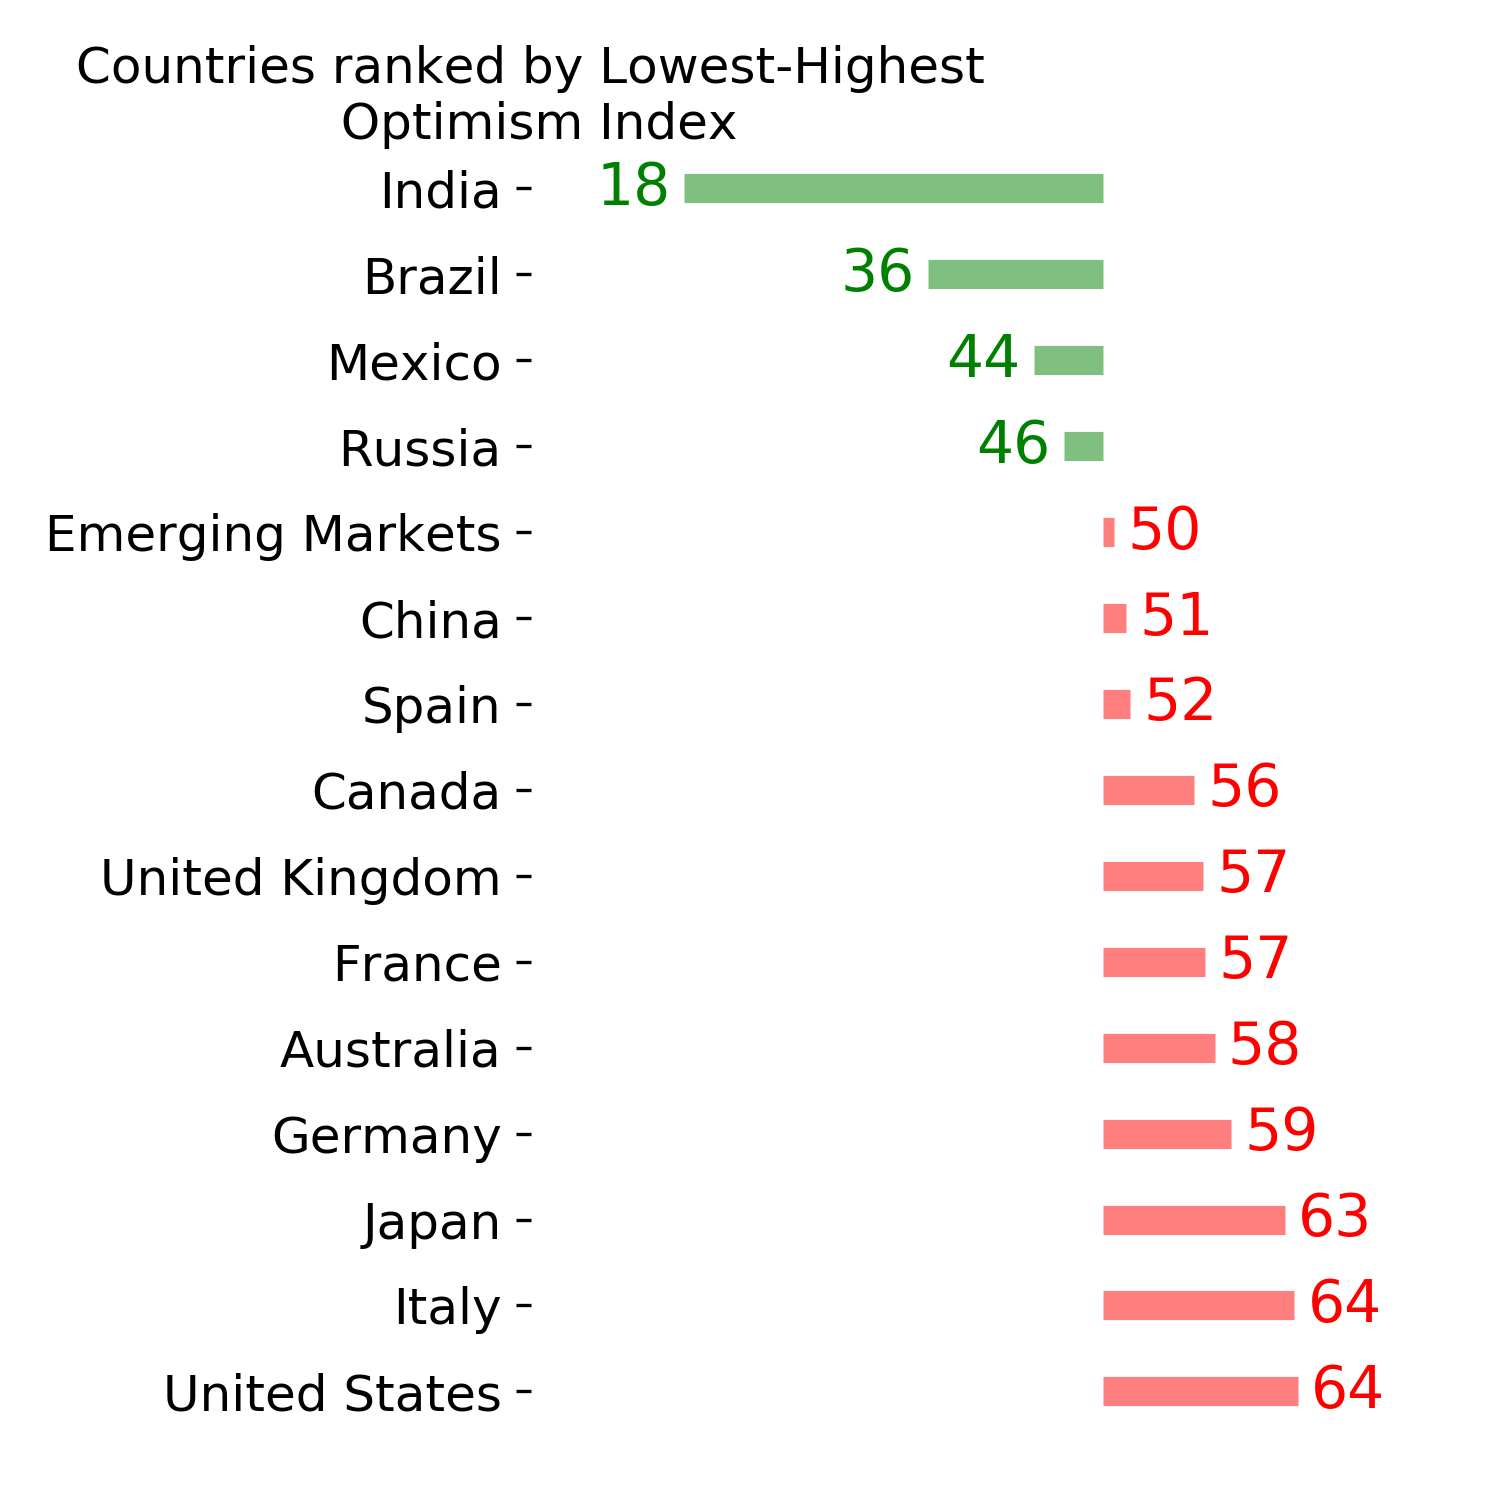
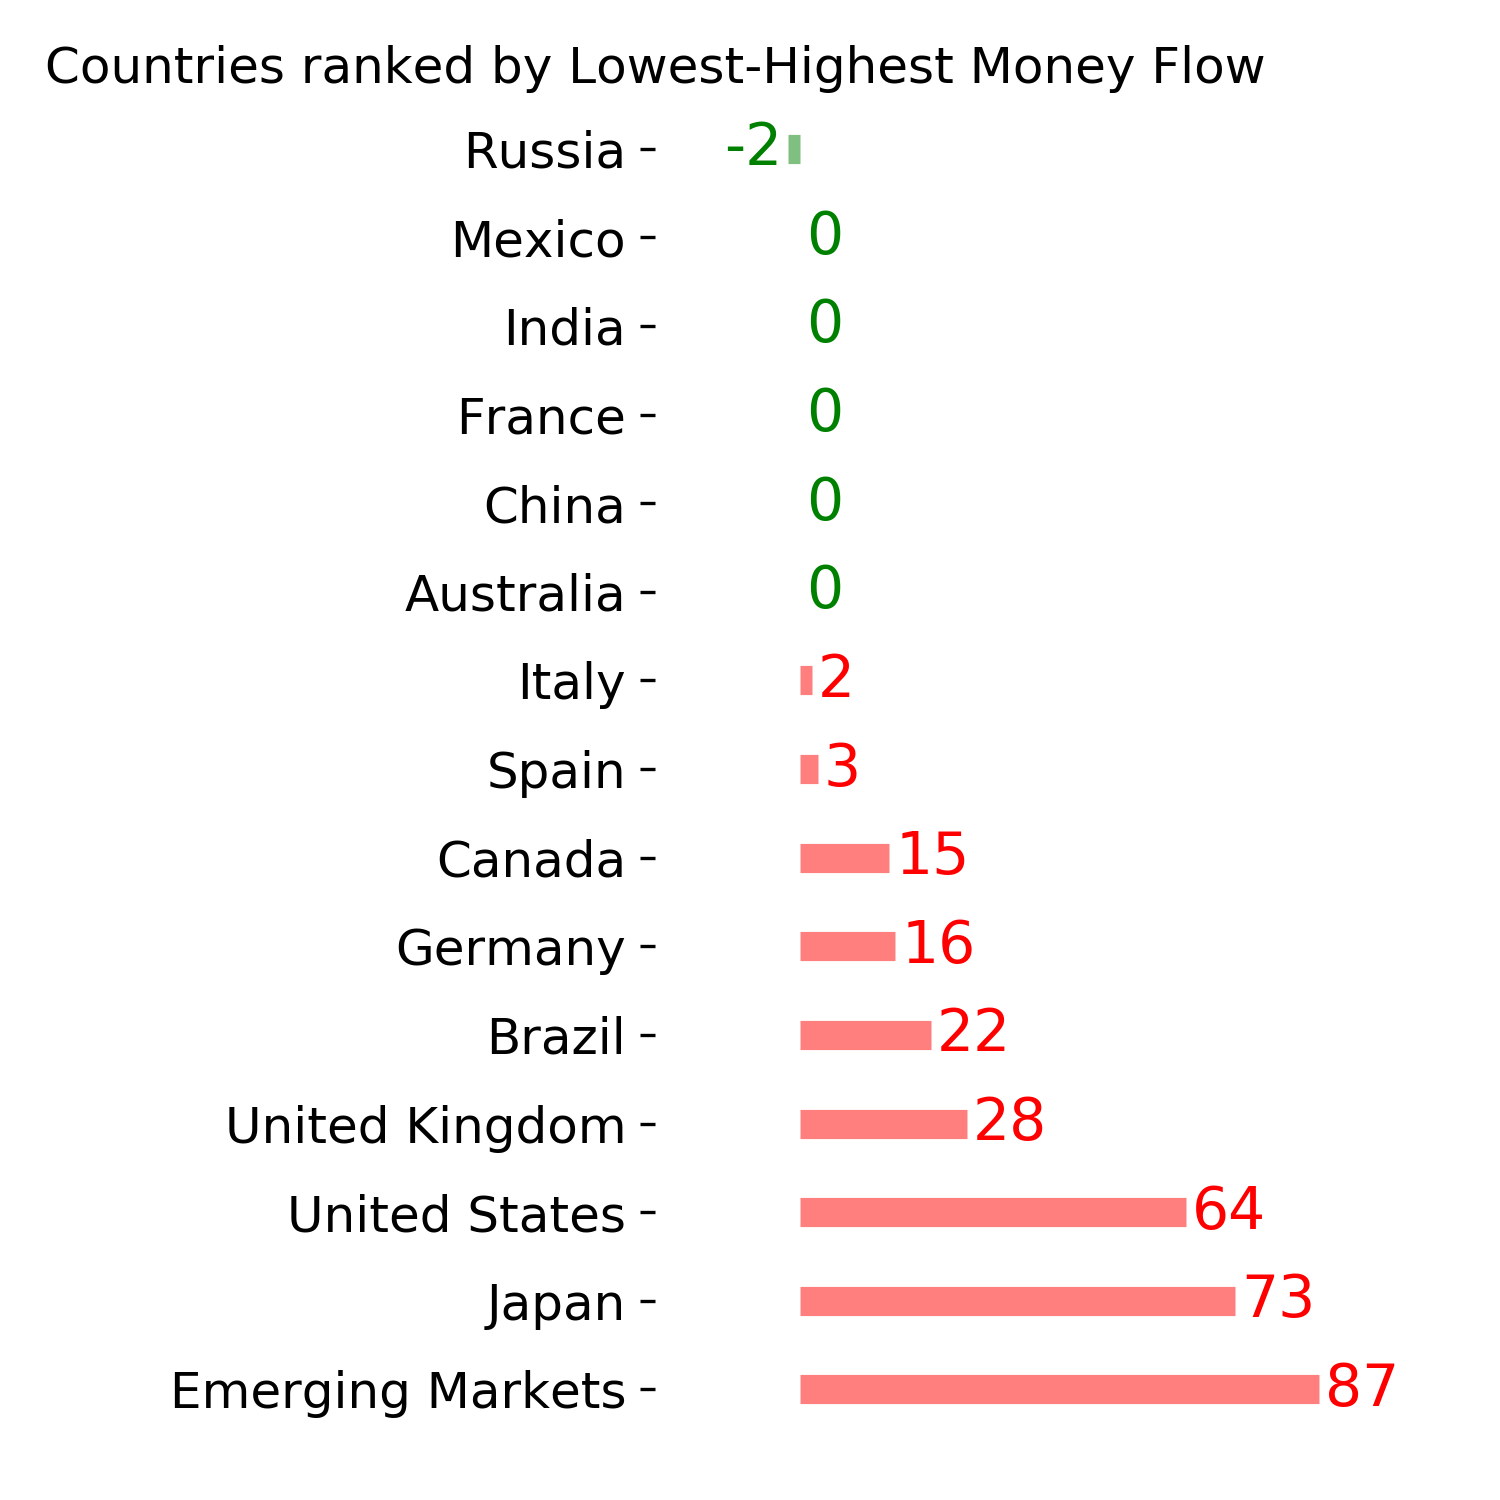
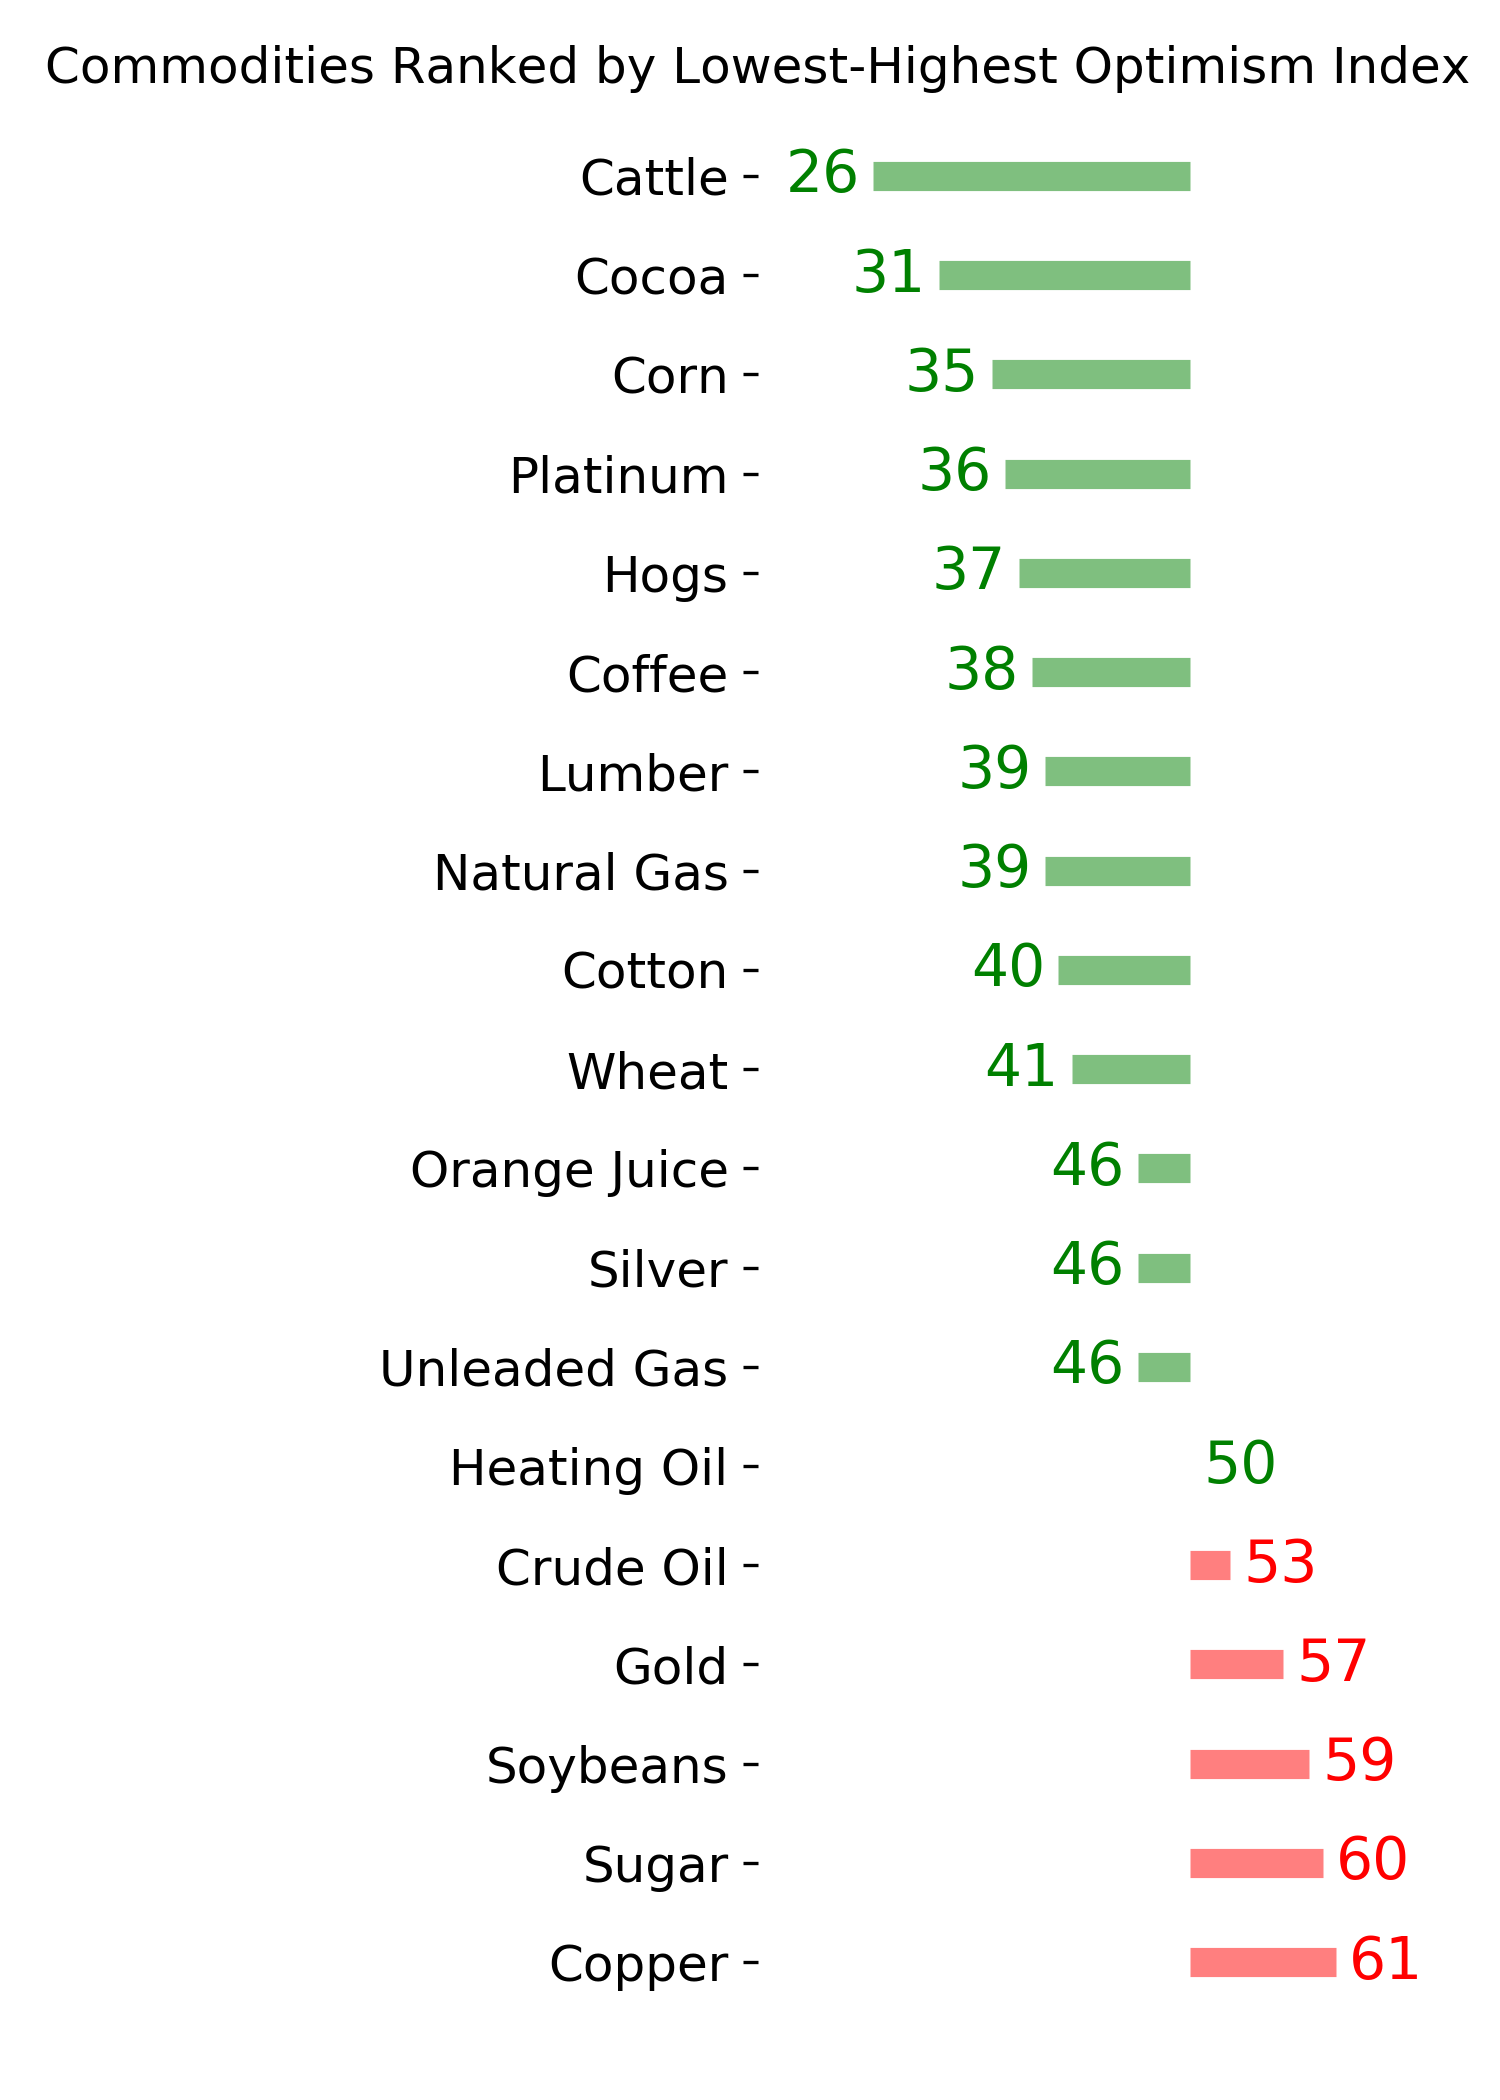
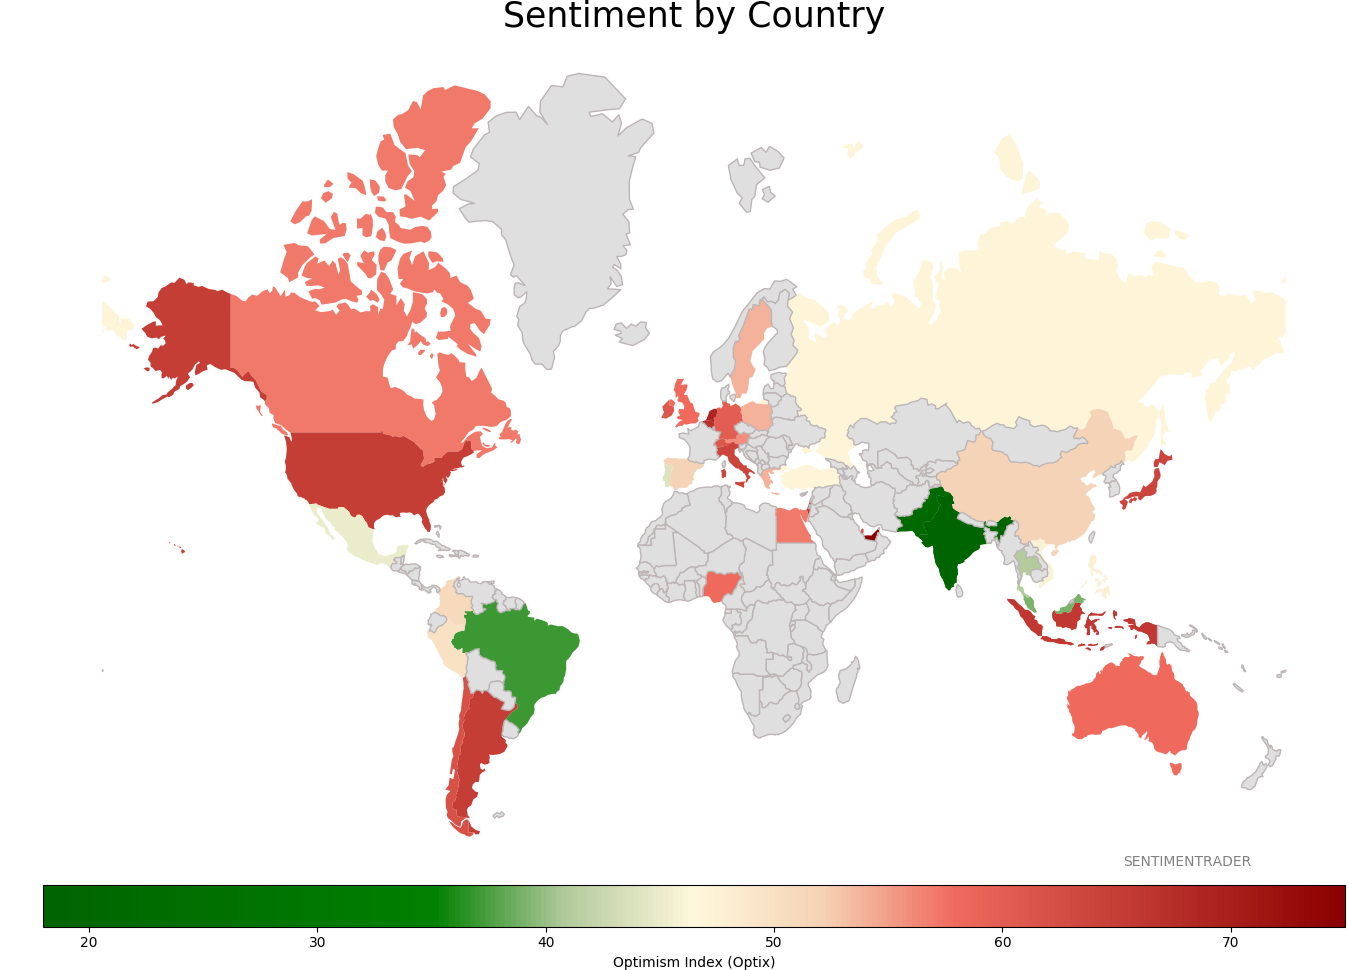
Sentiment Around The World
Optimism Index Thumbnails
|
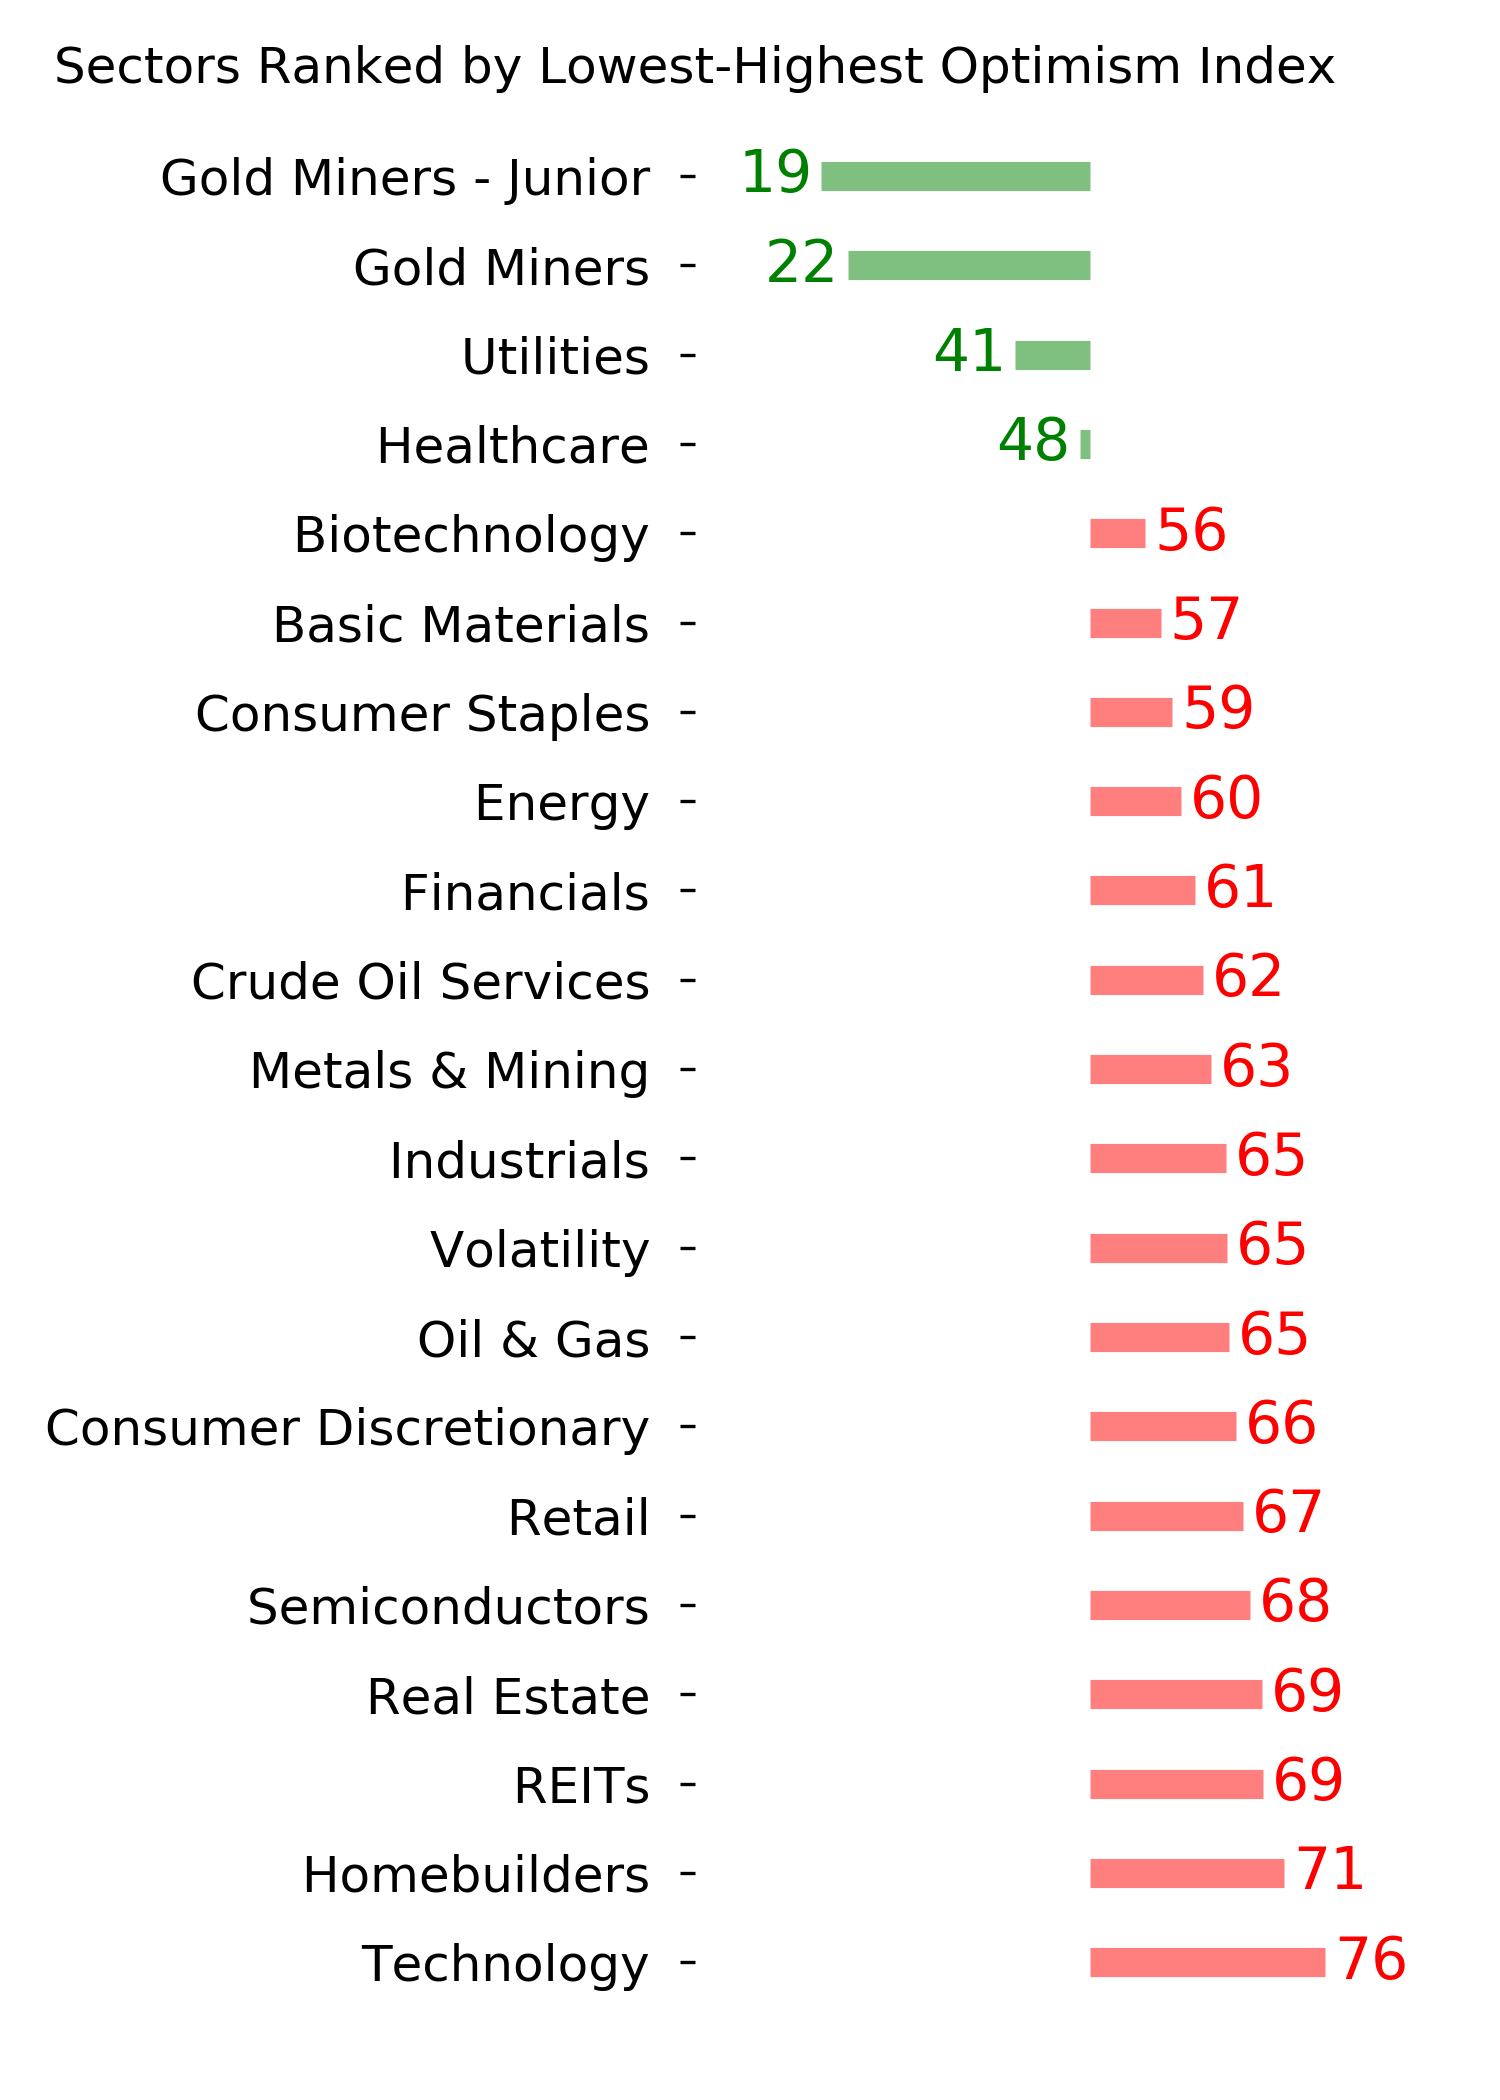
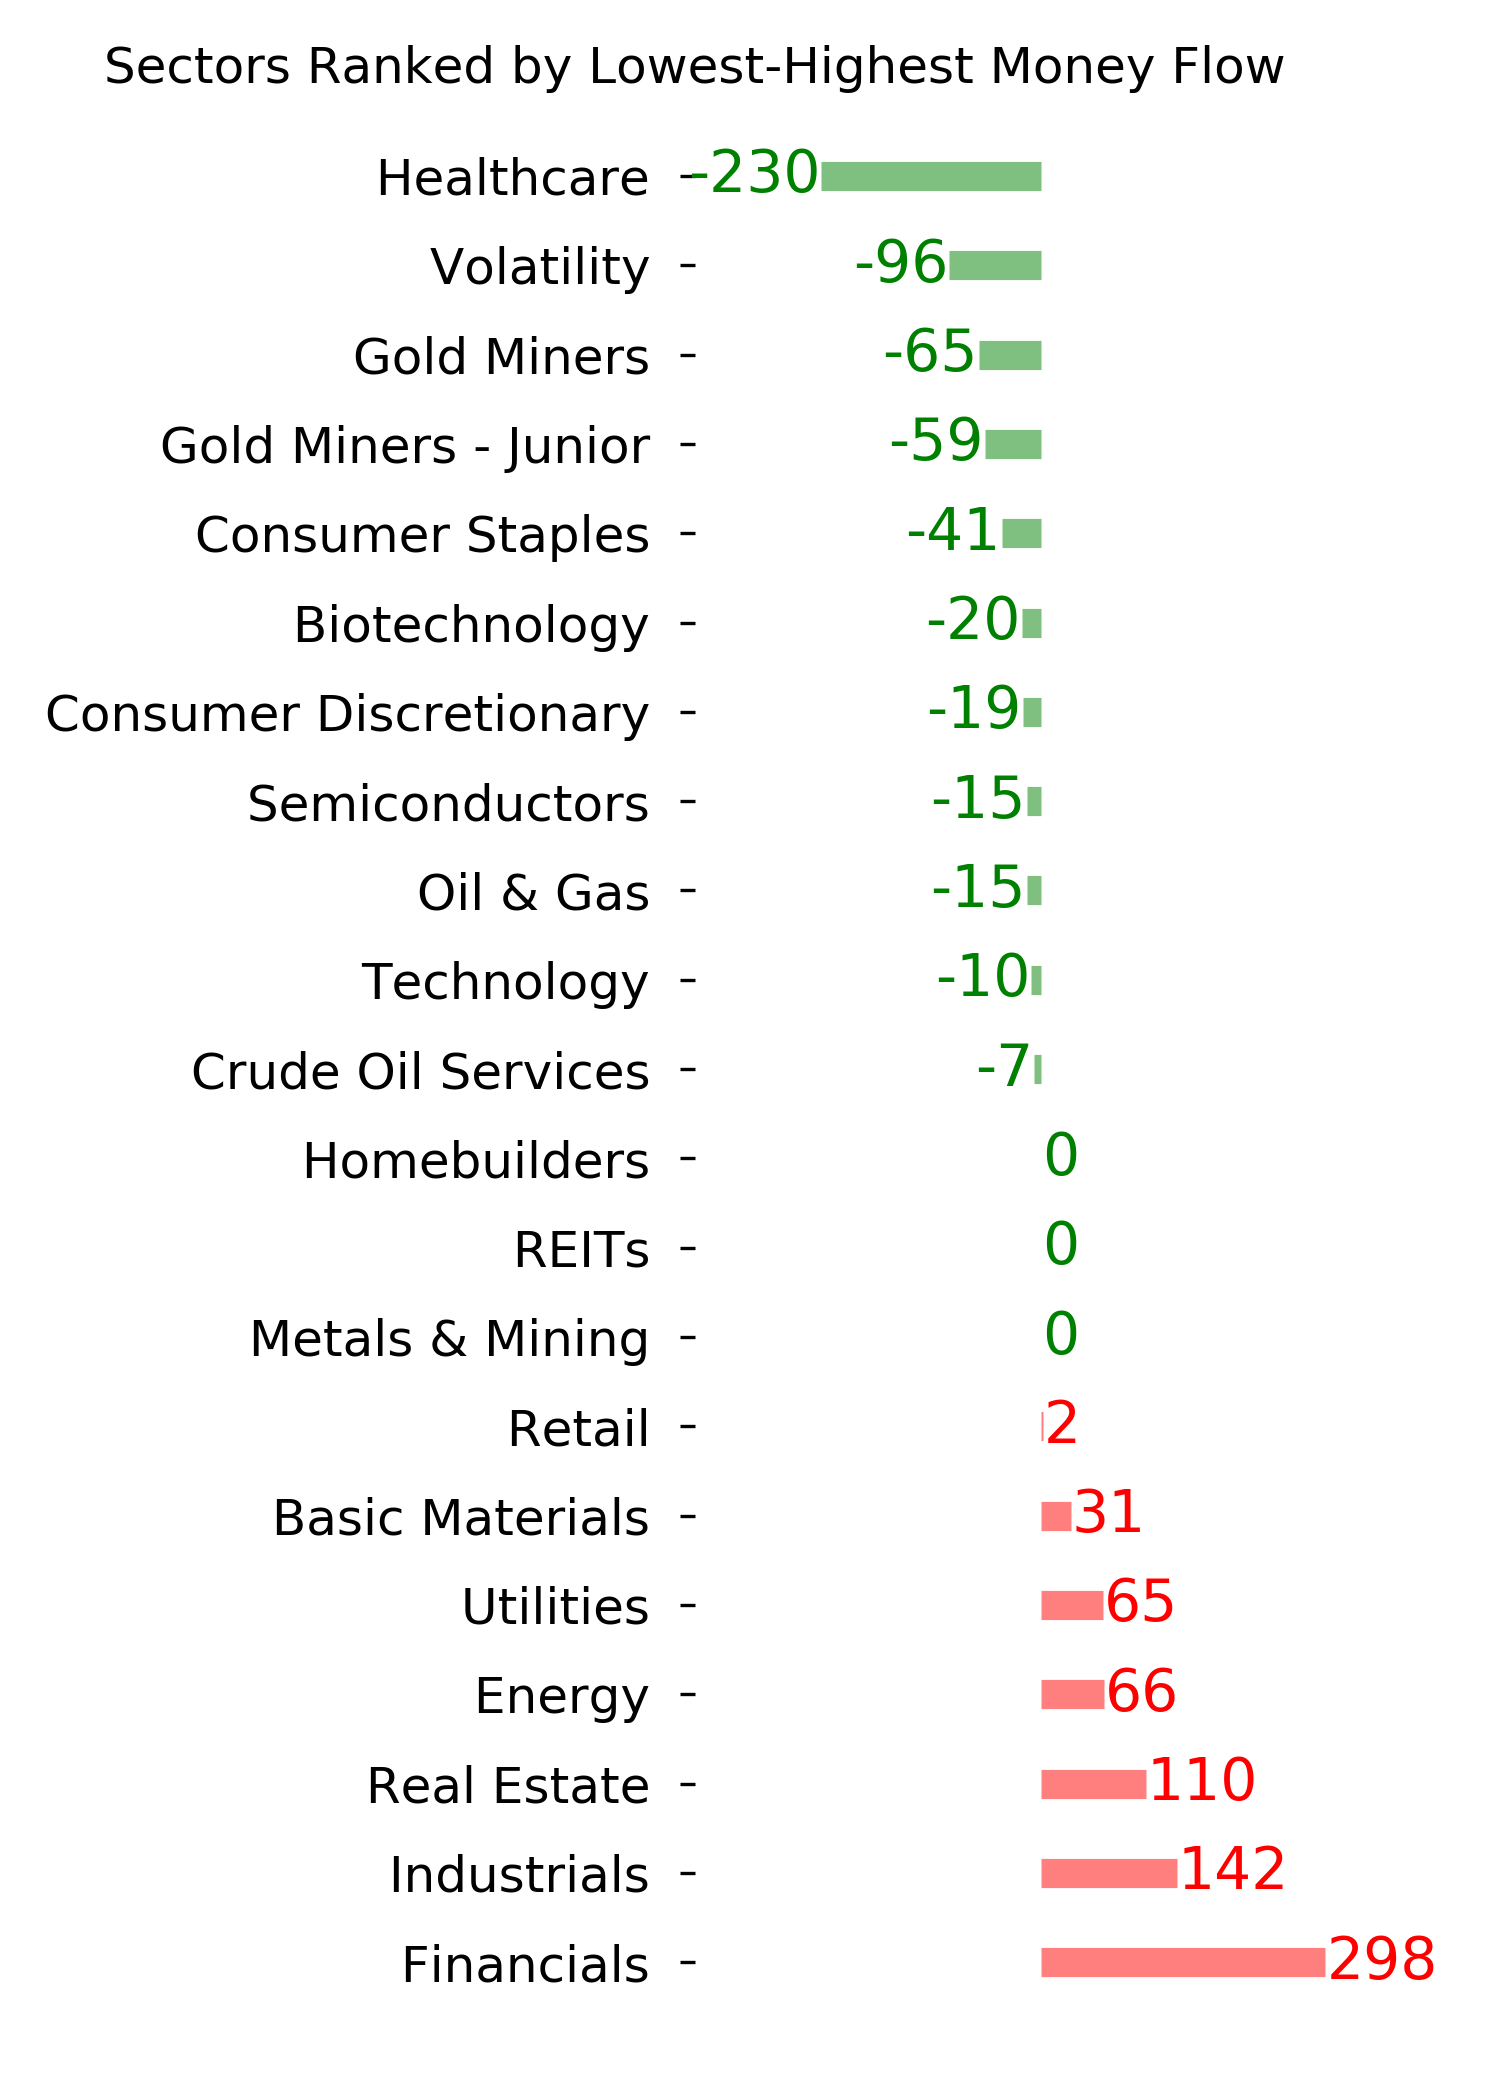
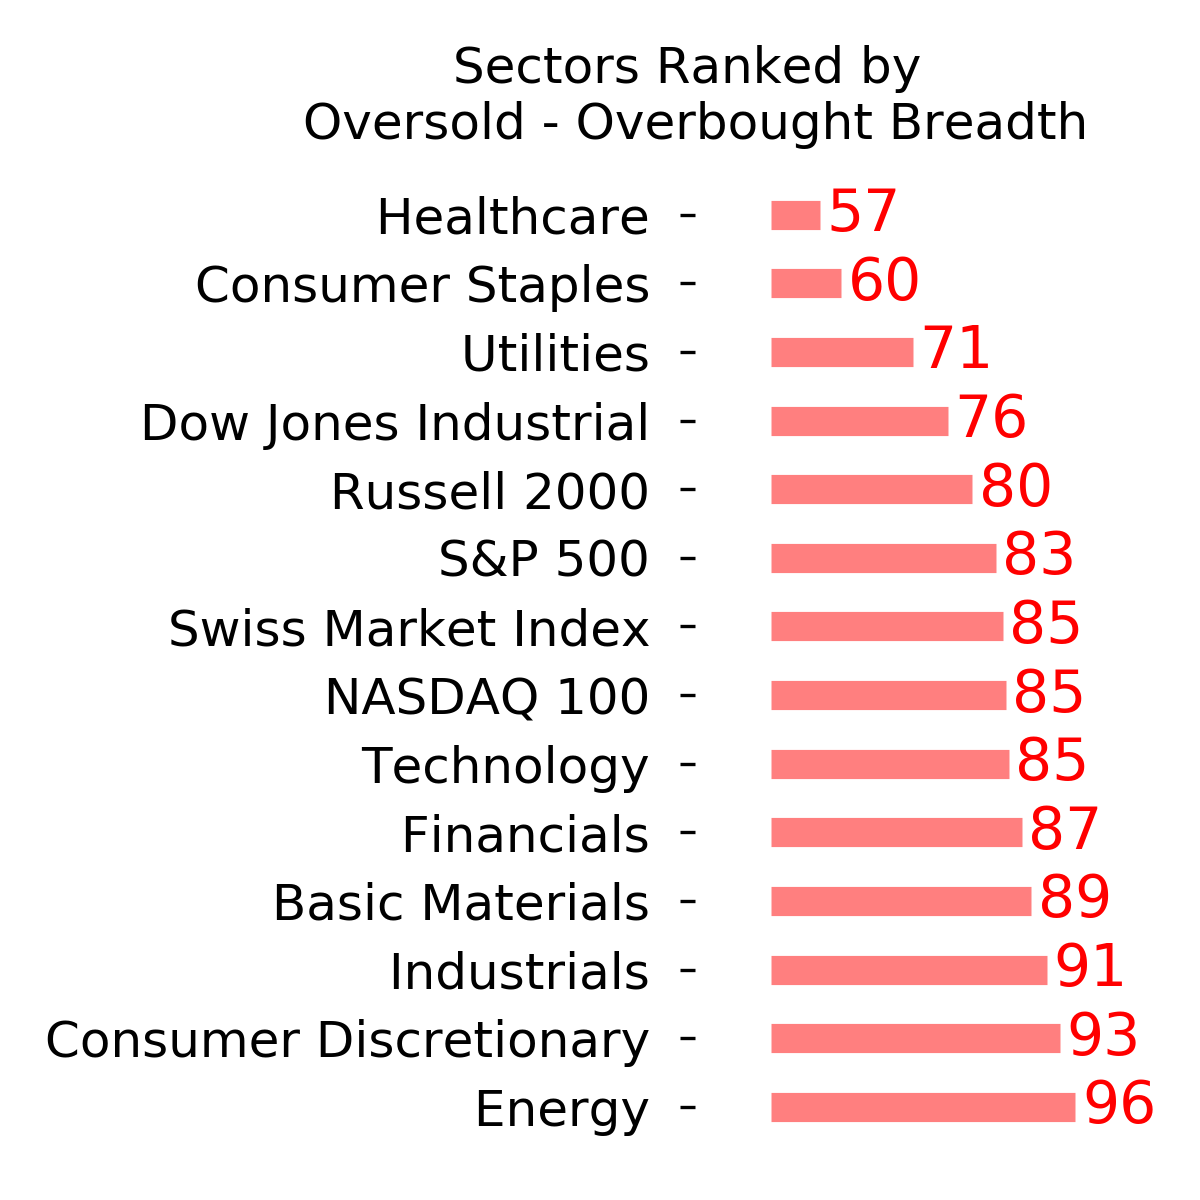
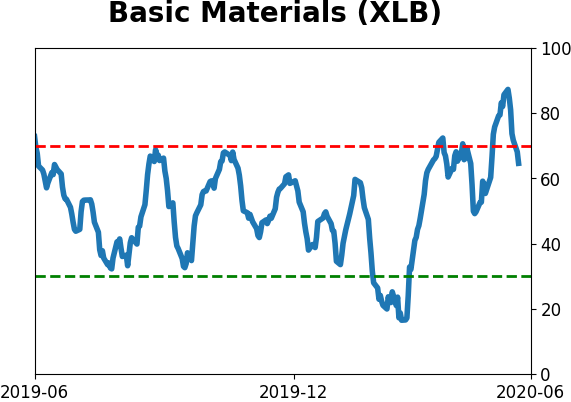
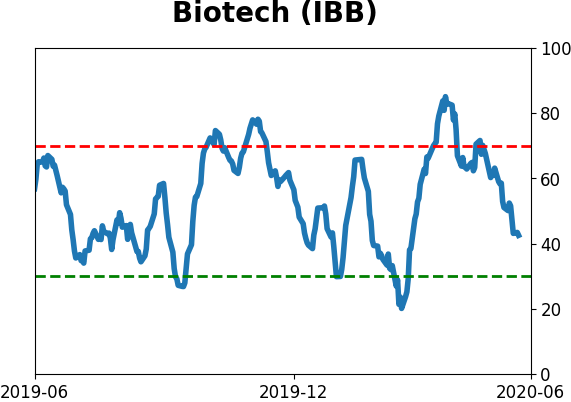
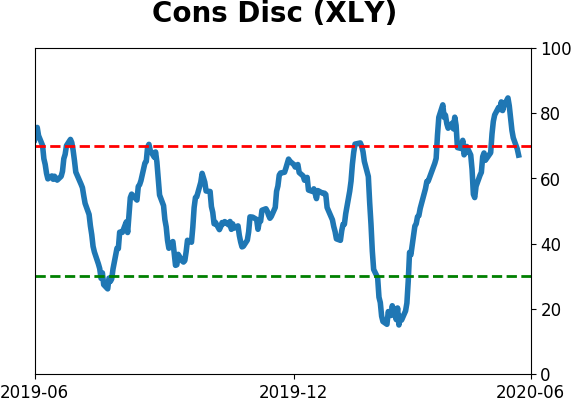
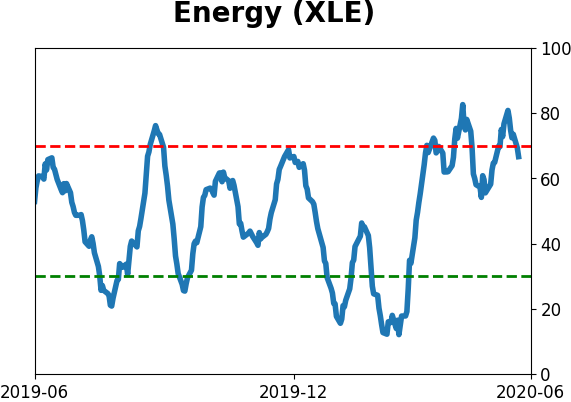
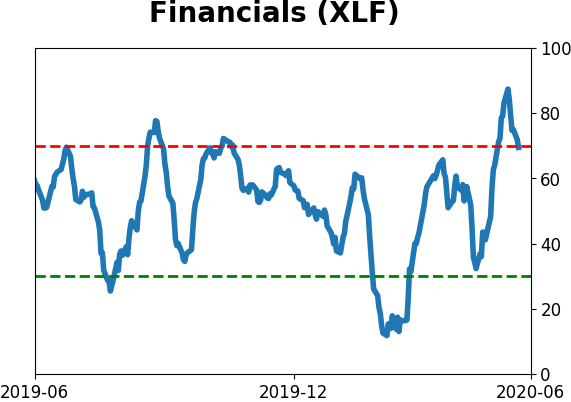
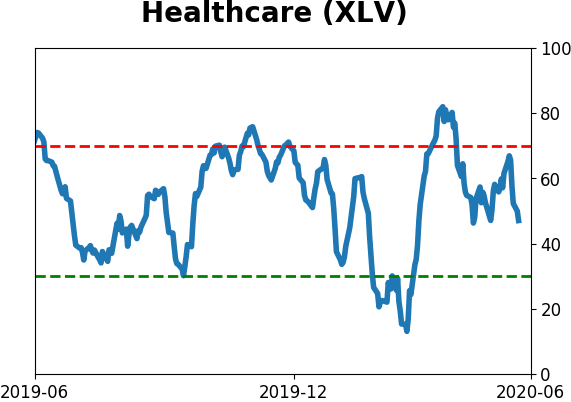
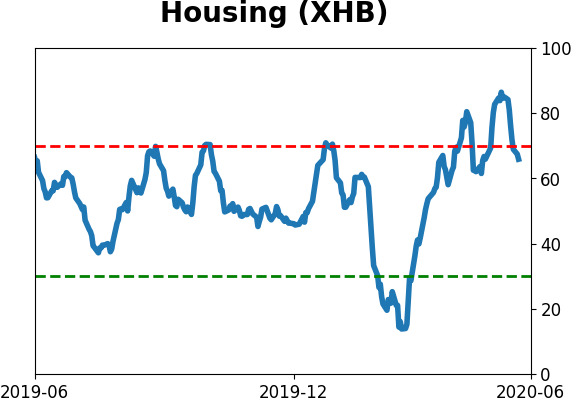
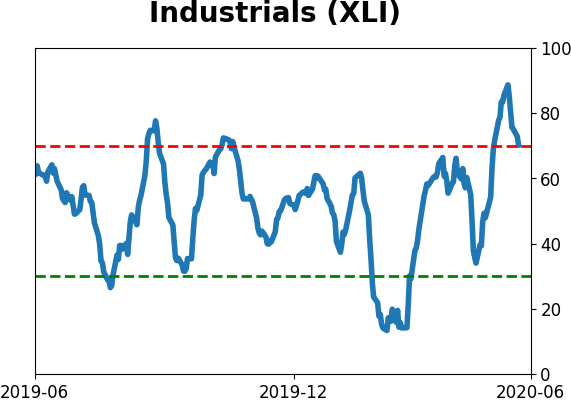
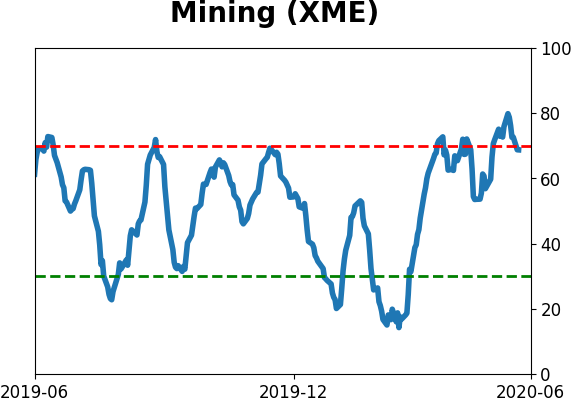
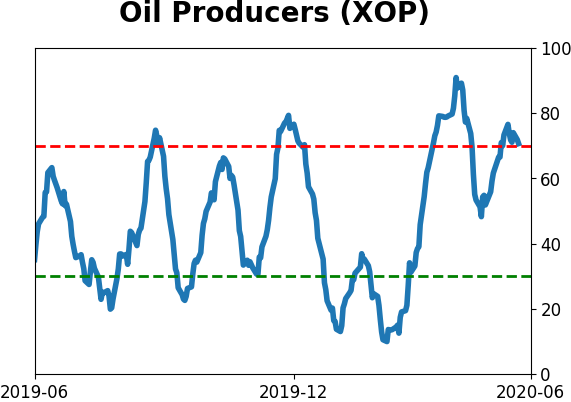
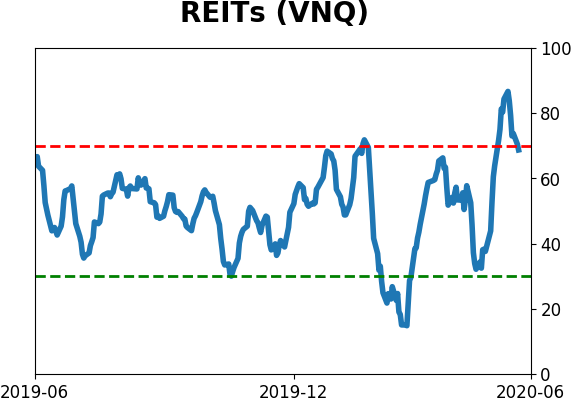
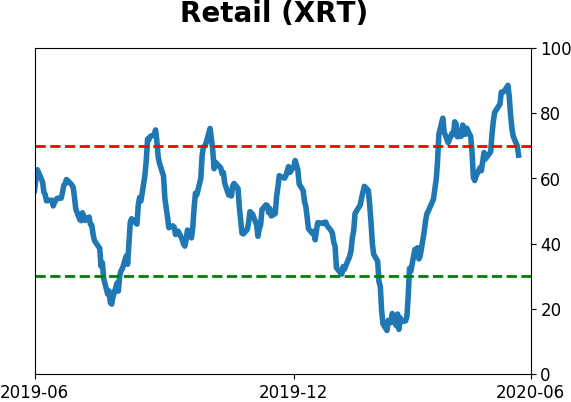
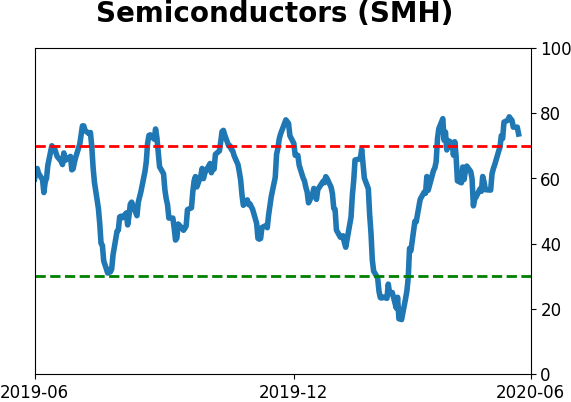
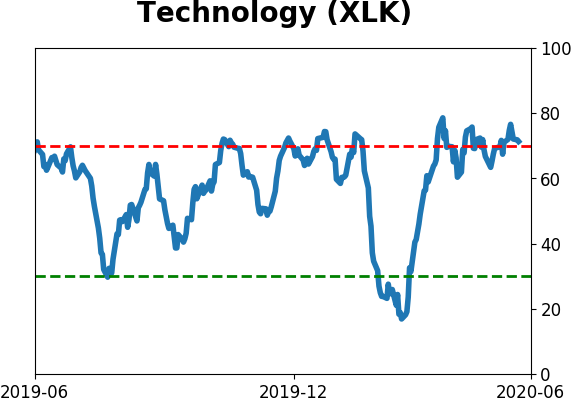
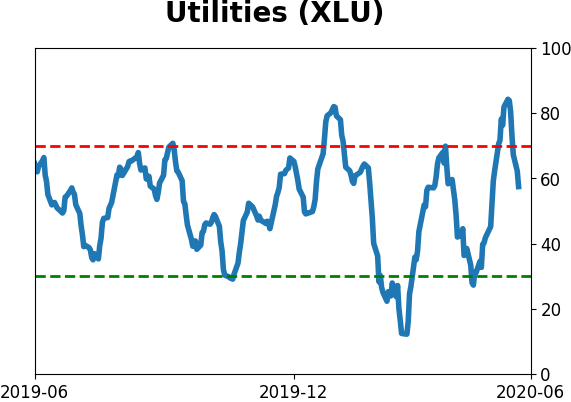
Sector ETF's - 10-Day Moving Average
|
|
|
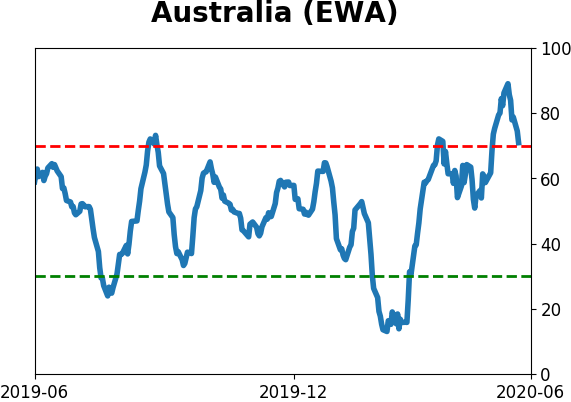
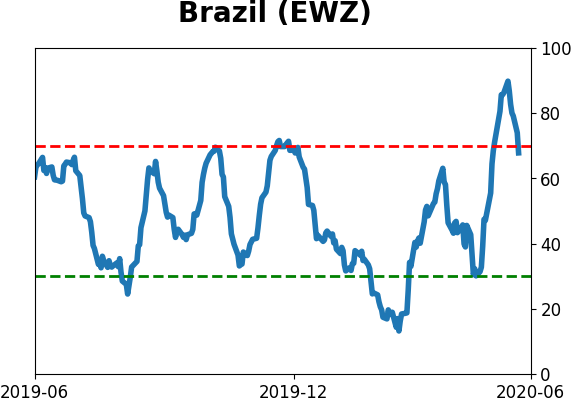
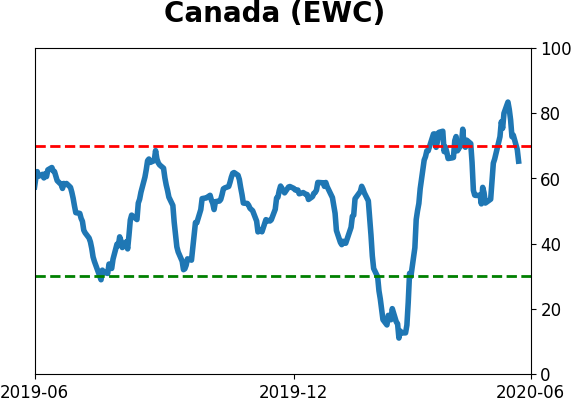
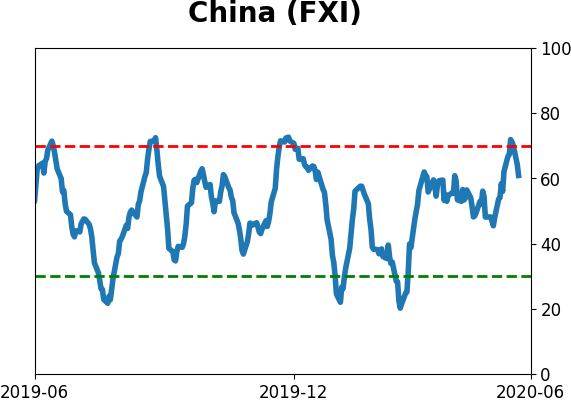
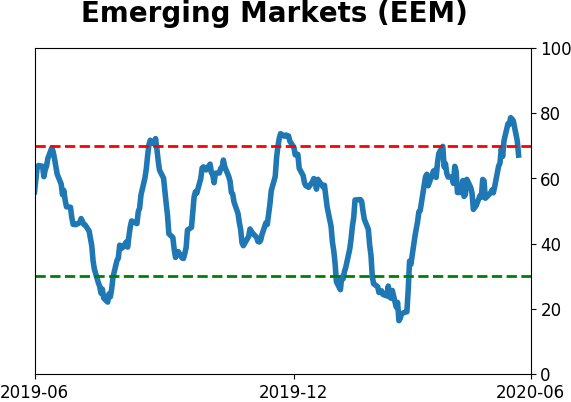
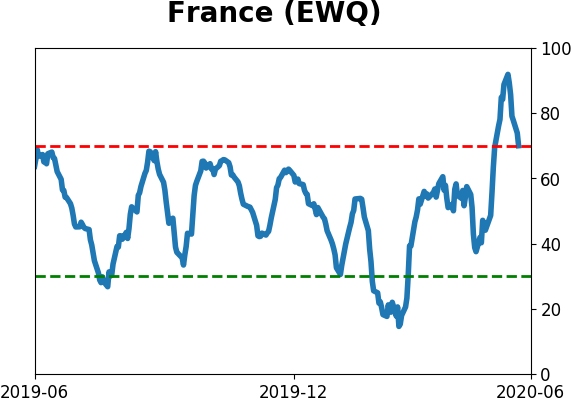
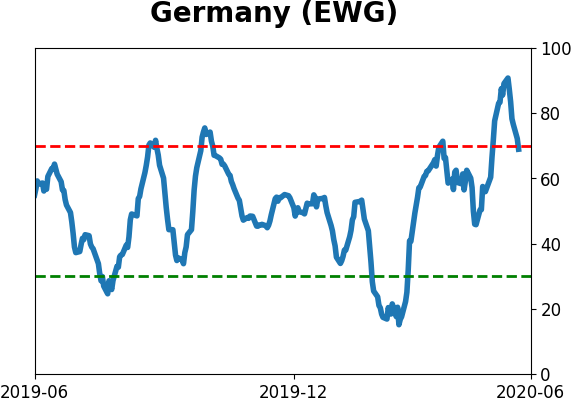
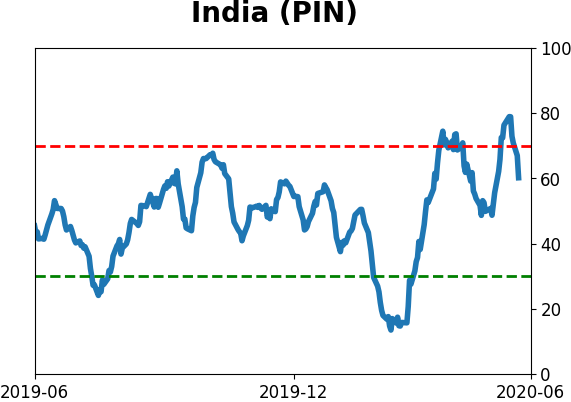
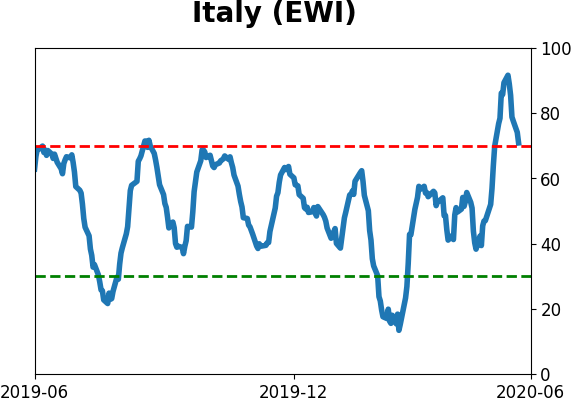
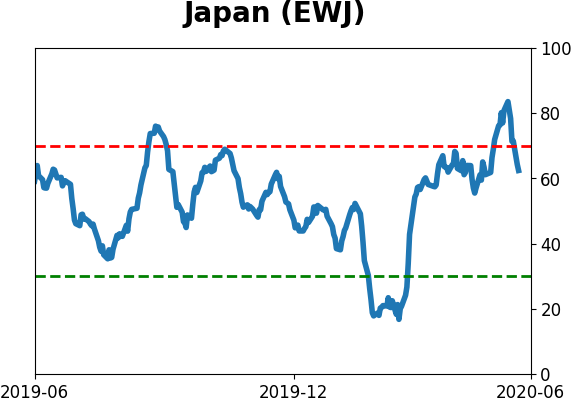
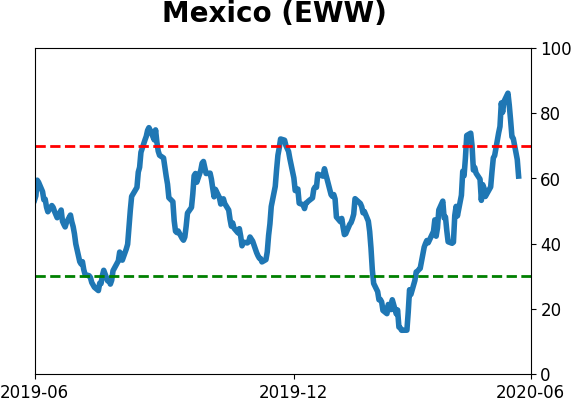
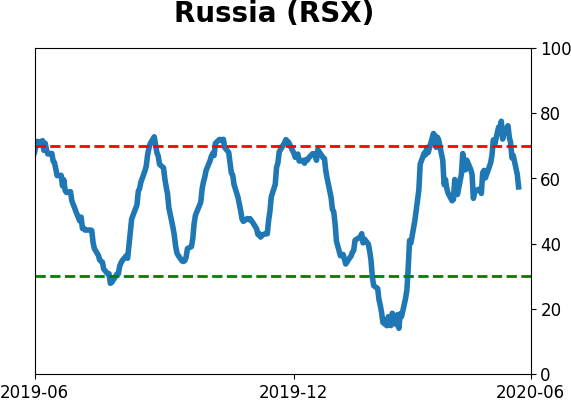
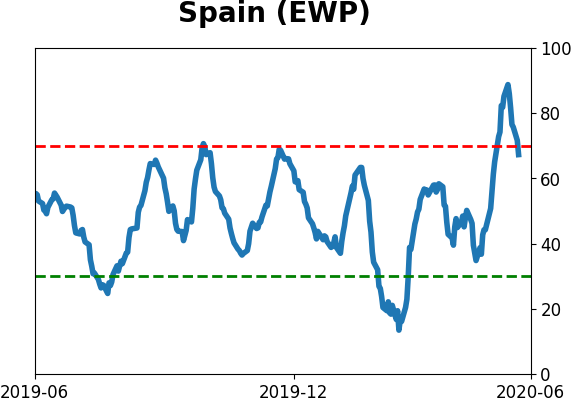
Country ETF's - 10-Day Moving Average
|
|
|
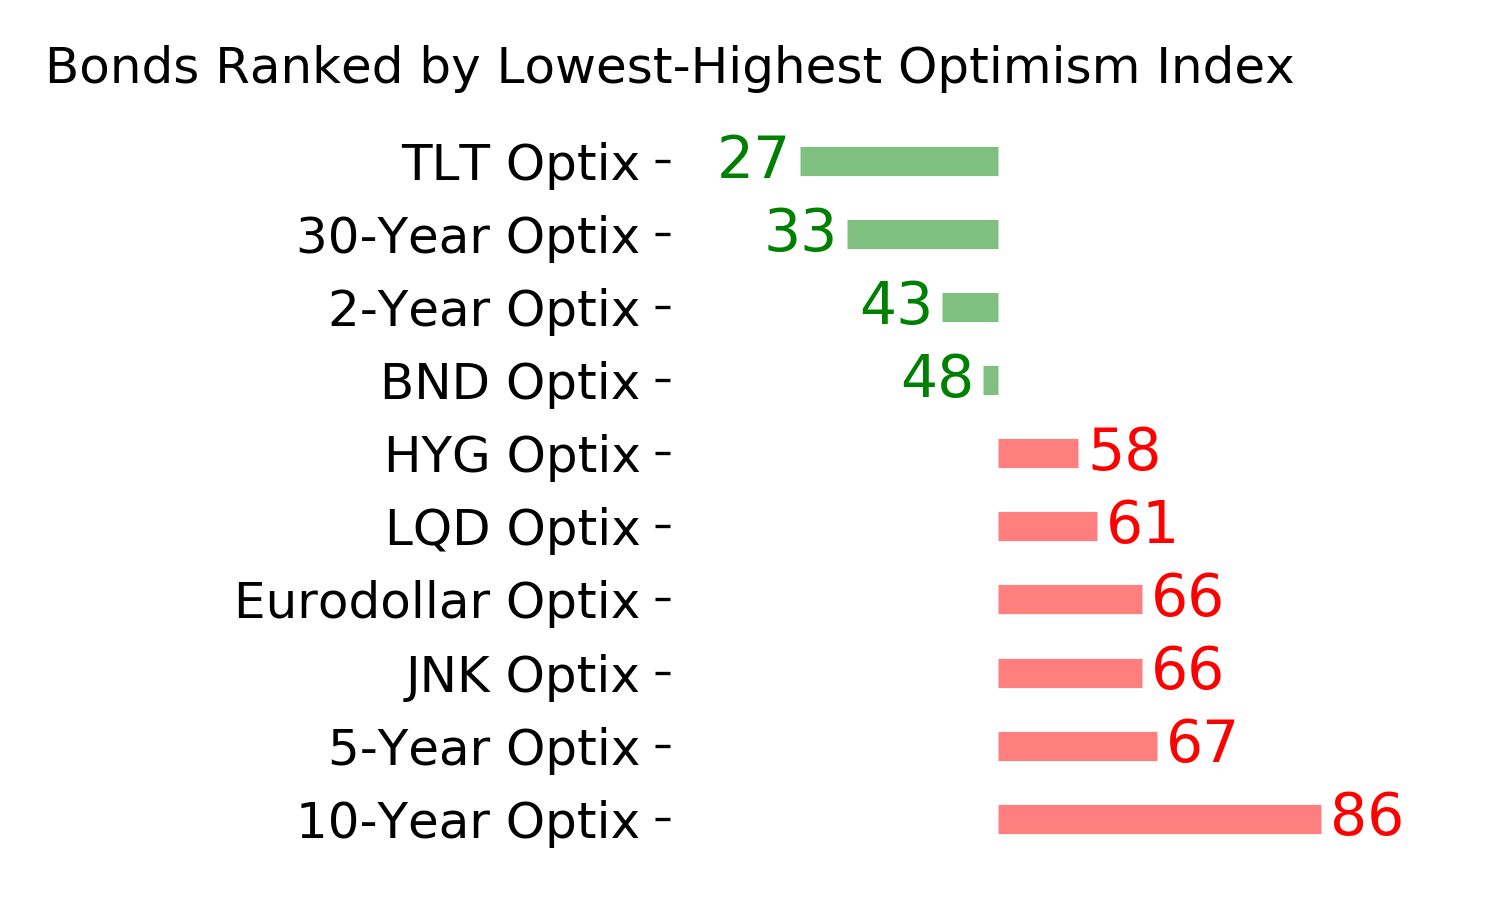
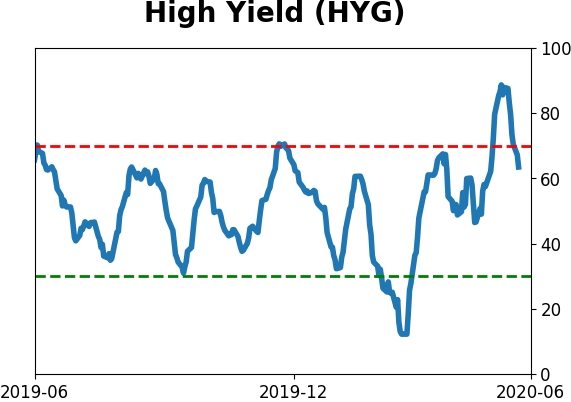
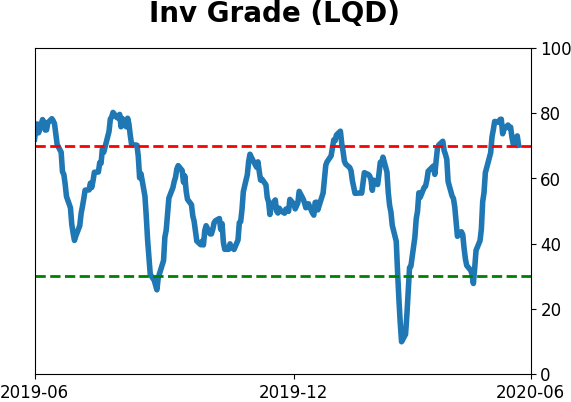
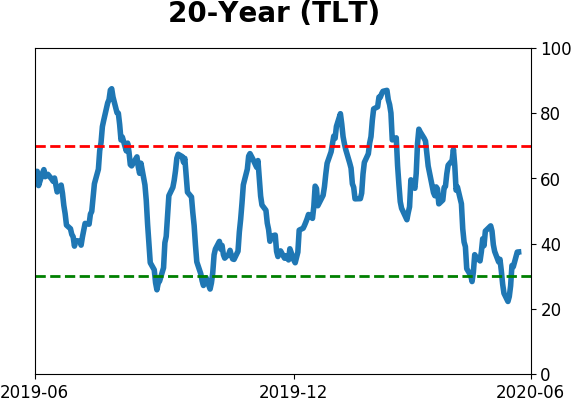
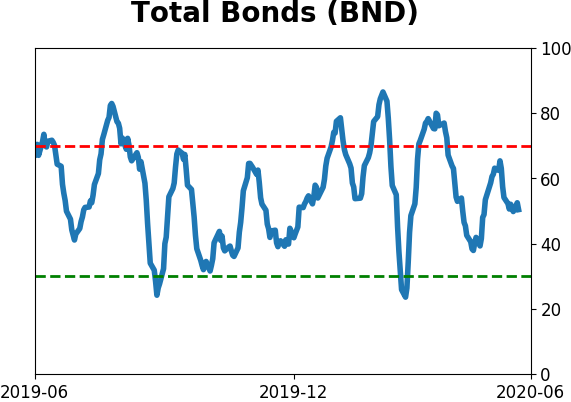
Bond ETF's - 10-Day Moving Average
|
|
|
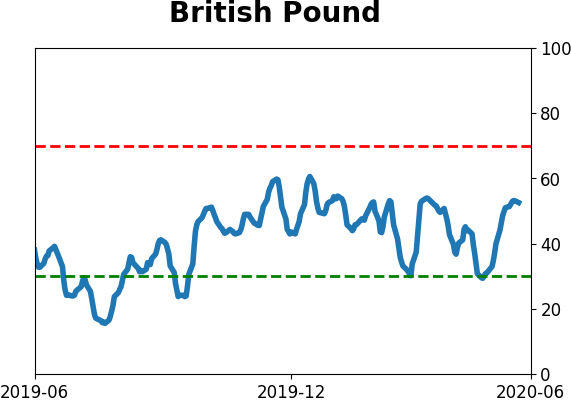
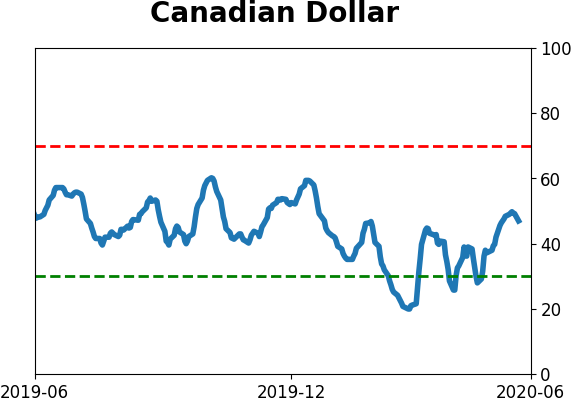
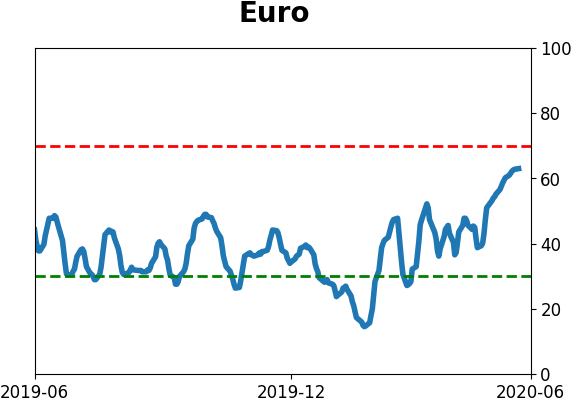
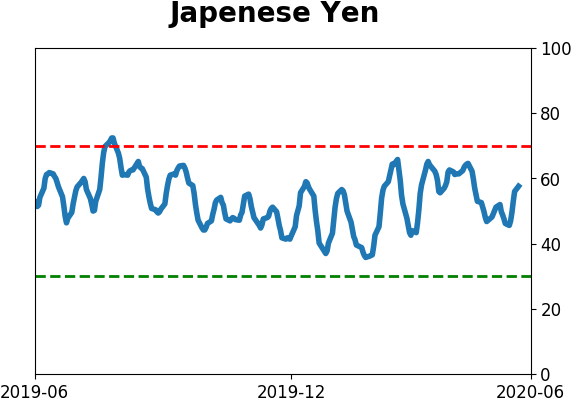
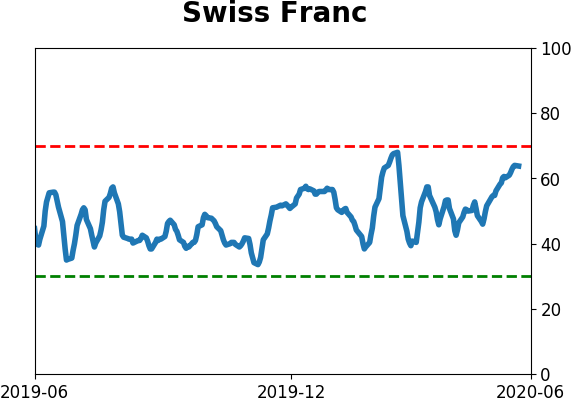
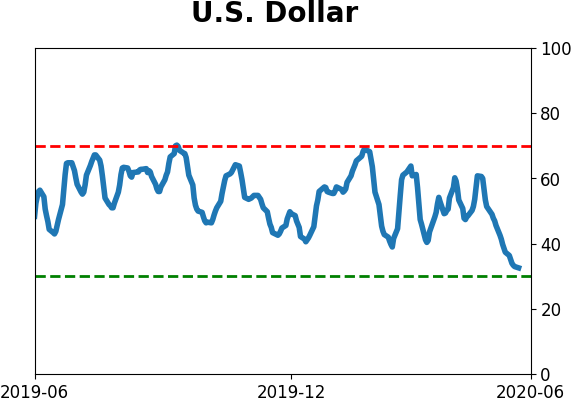
Currency ETF's - 5-Day Moving Average
|
|
|
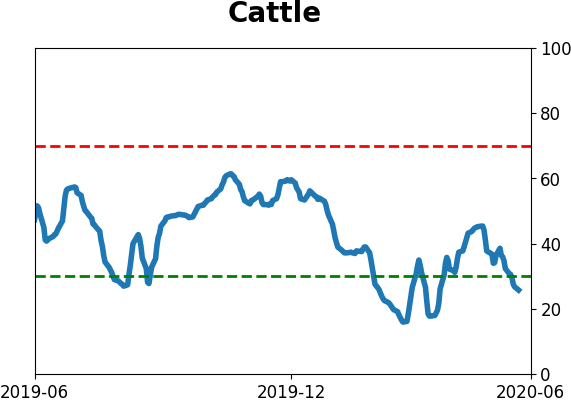
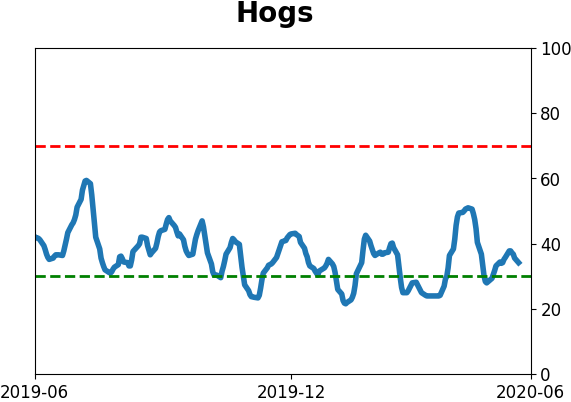
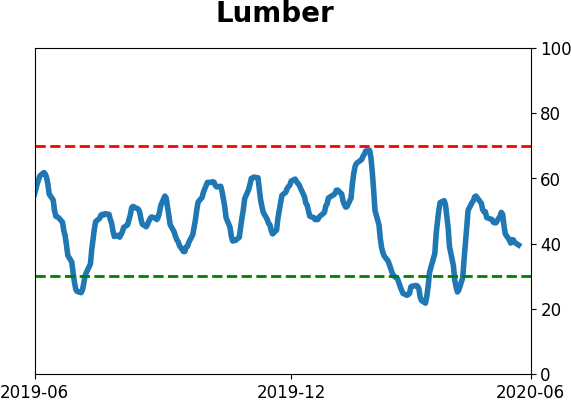
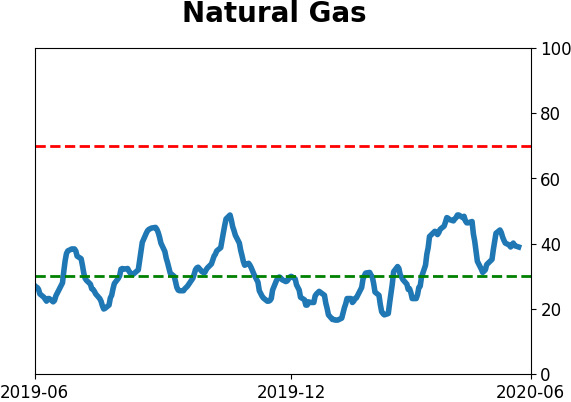
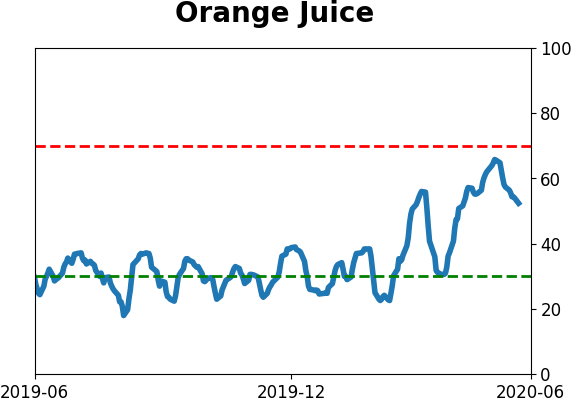
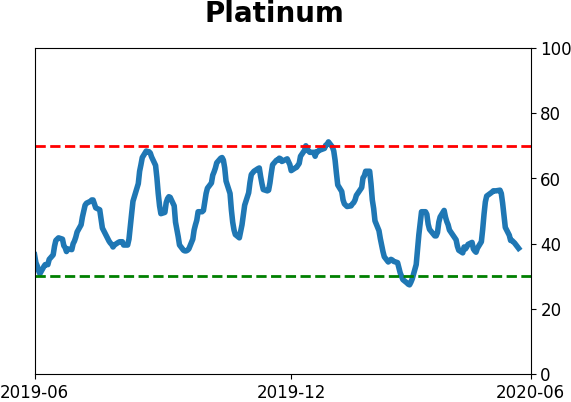
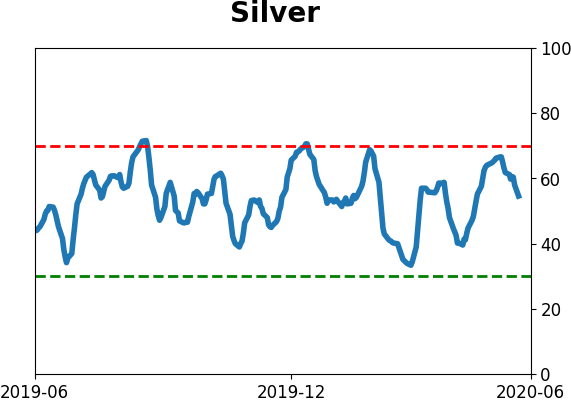
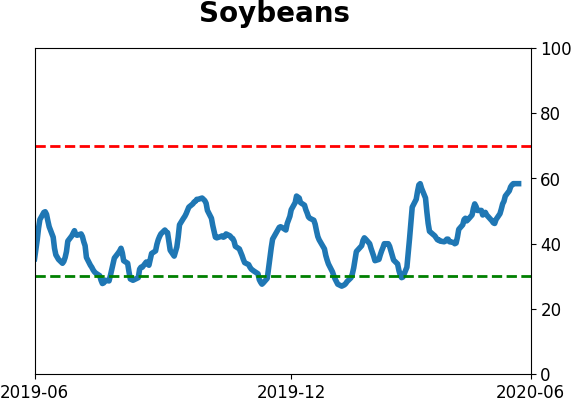
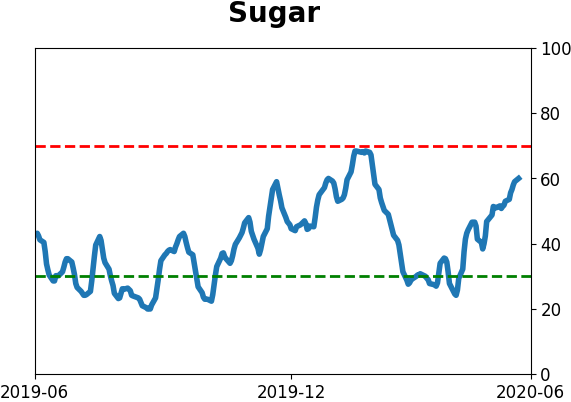
Commodity ETF's - 5-Day Moving Average
|
|