Headlines
|
|
The Ratio of Lumber to Gold Prices is Crashing:
The price of lumber is crashing relative to gold. This is considered a signal that investors have a risk-off mentality, but previous signals were not a consistent sell signal for stocks. It did tend to precede further declines in lumber prices, as well as homebuilding stocks.
Bottom Line:
See the Outlook & Allocations page for more details on these summaries STOCKS: Hold
The speculative frenzy in February is wrung out. Internal dynamics have mostly held up, with some exceptions. Many of our studies still show a mixed to poor short-term view, with medium- and long-term ones turning more positive. BONDS: Hold
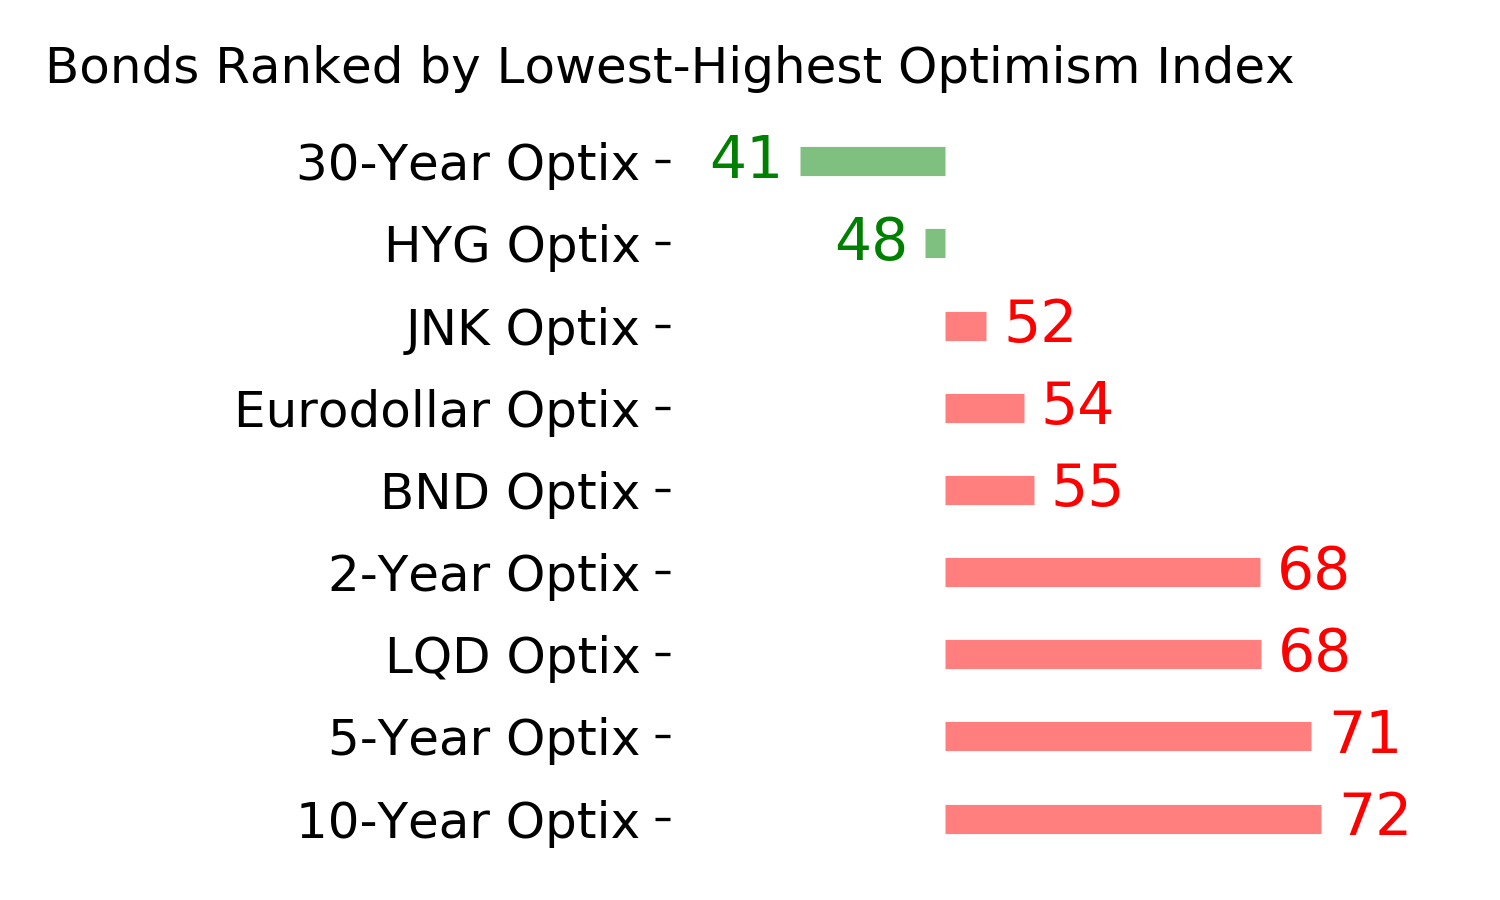
Various parts of the market got hit in March, with the lowest Bond Optimism Index we usually see during healthy environments. After a shaky couple of weeks, the broad bond market has modestly recovered. Not a big edge here either way. GOLD: Hold
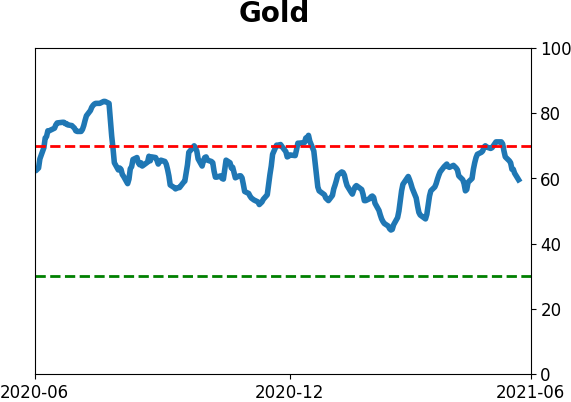
Gold and miners have done very well, recovering above long-term trend lines. The issue is that both have tended to perform poorly after similar situations - will have to wait and see how it plays out.
|
Smart / Dumb Money Confidence
|
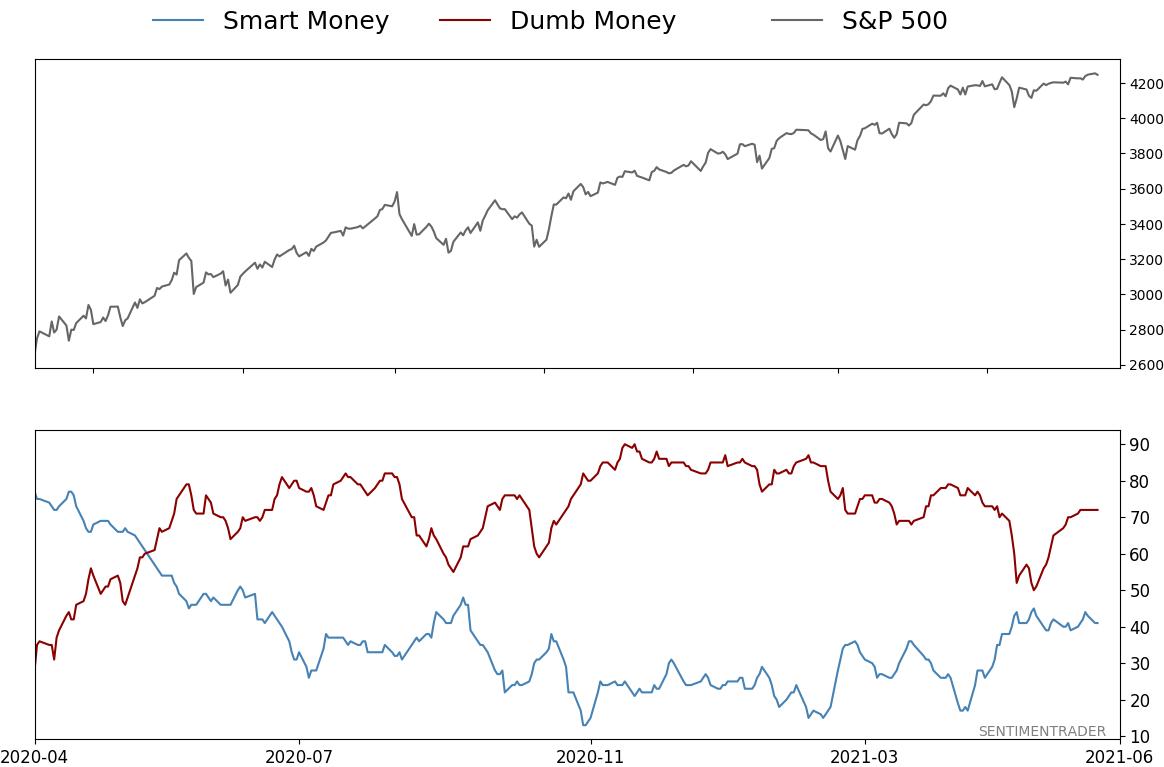
Smart Money Confidence: 41%
Dumb Money Confidence: 72%
|
|
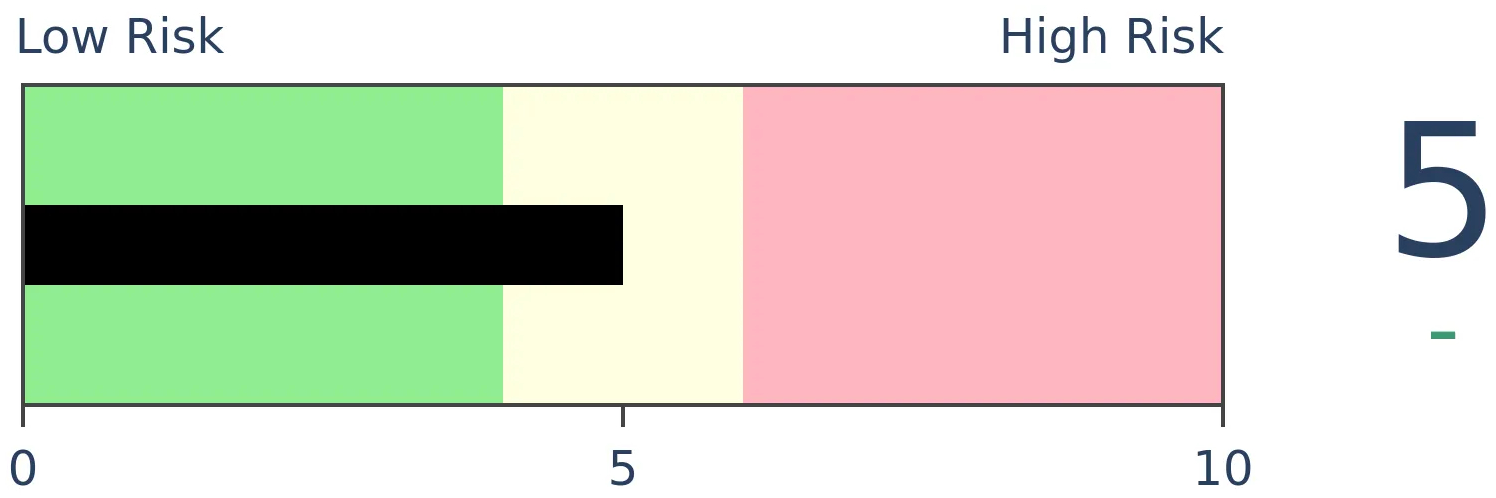
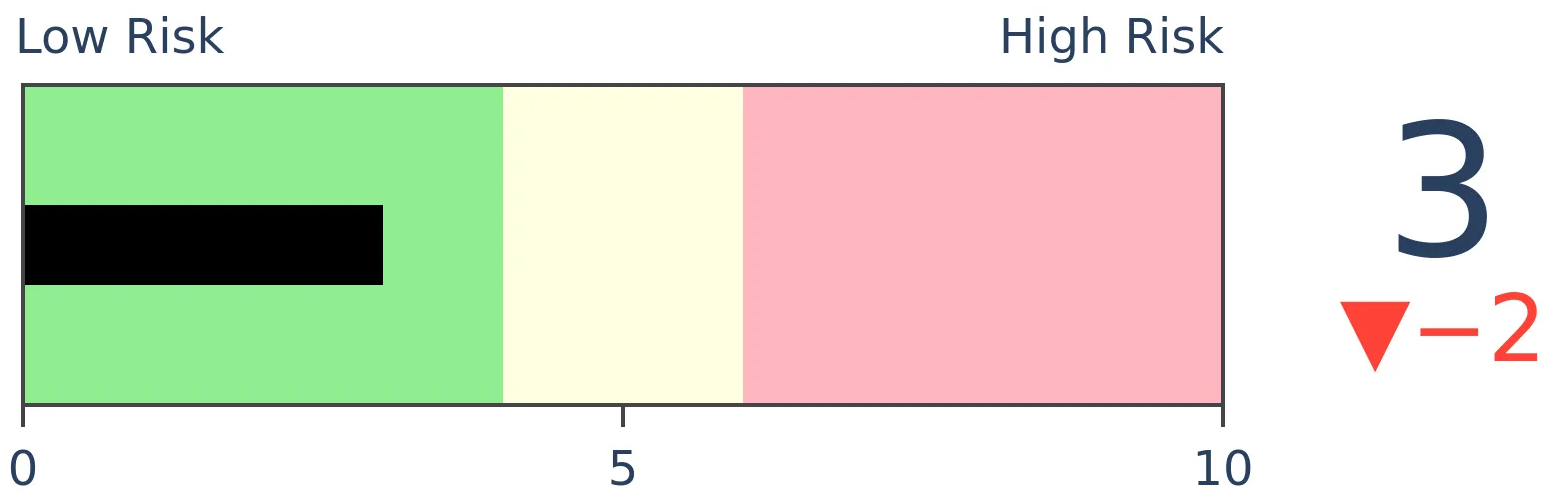
Risk Levels
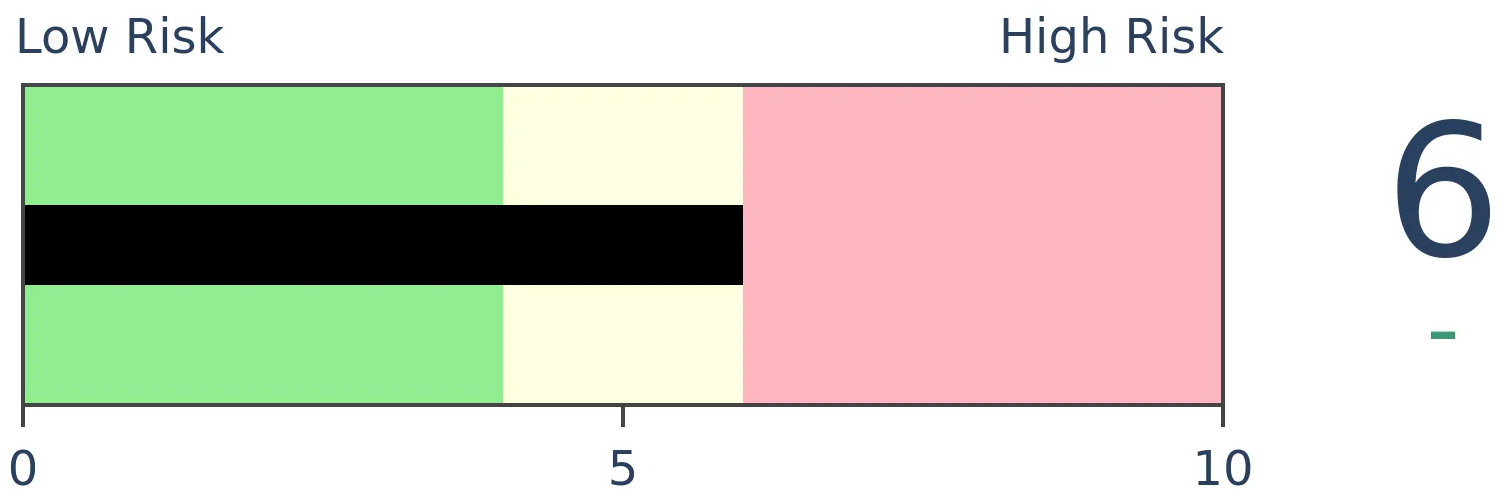
Stocks Short-Term
|
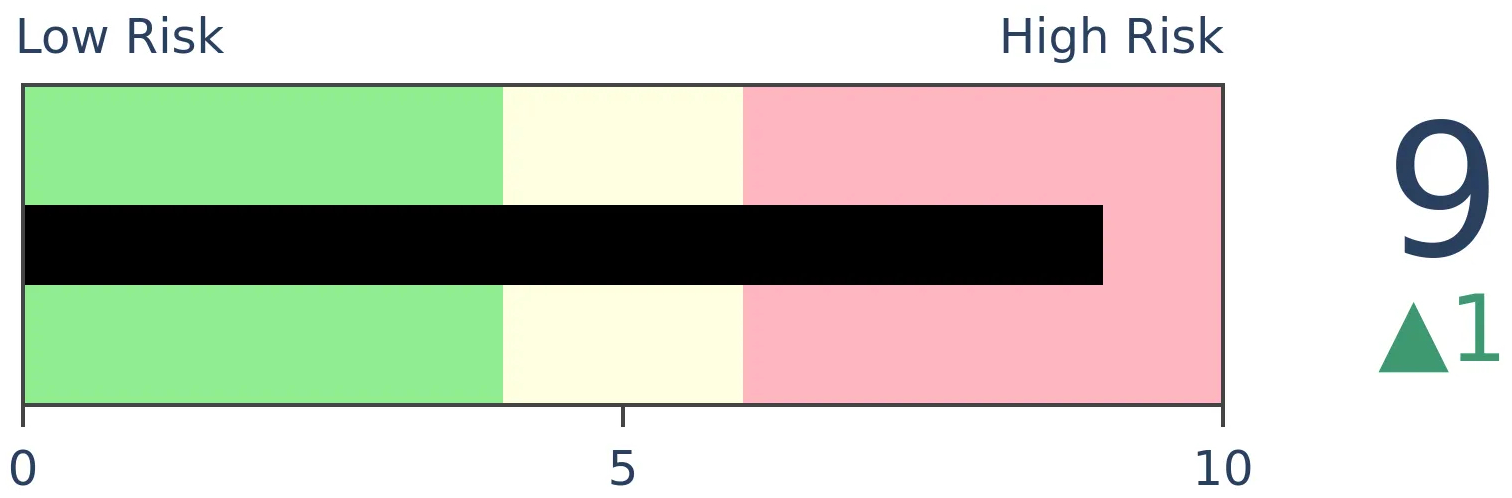
Stocks Medium-Term
|
|
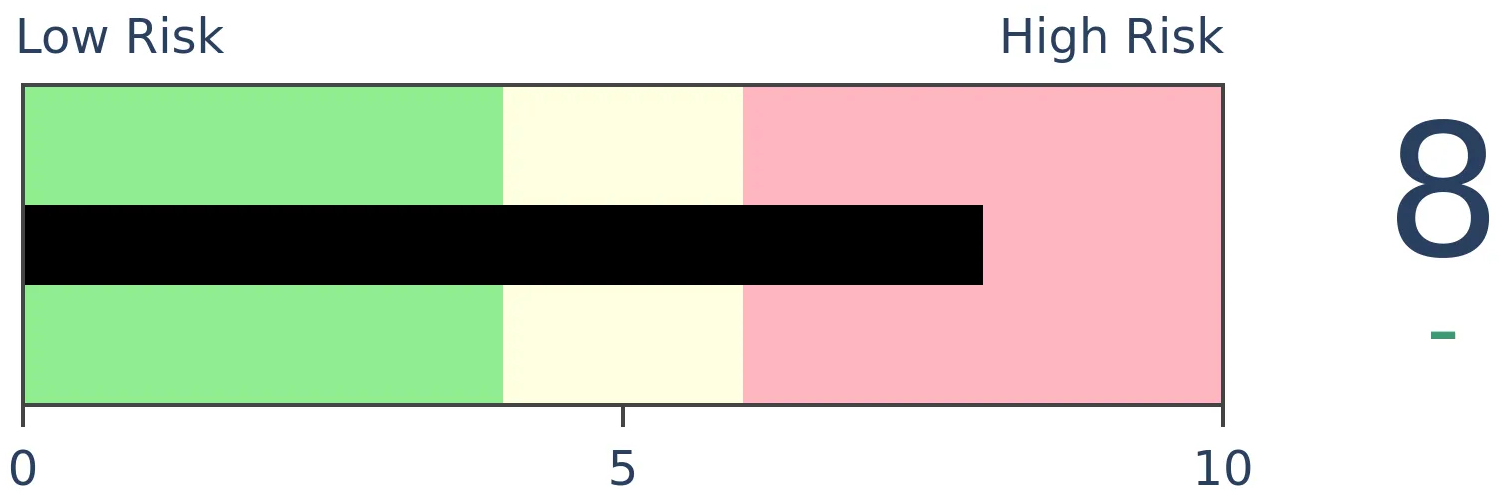
Bonds
|
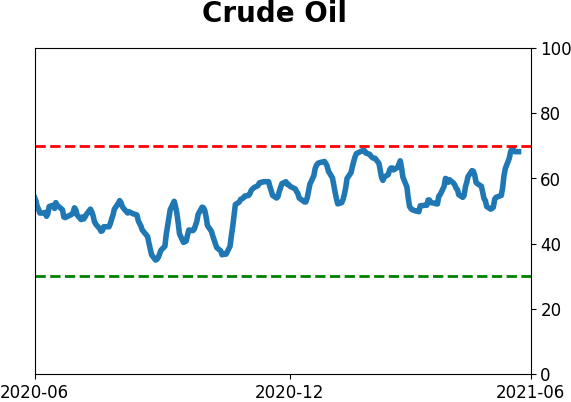
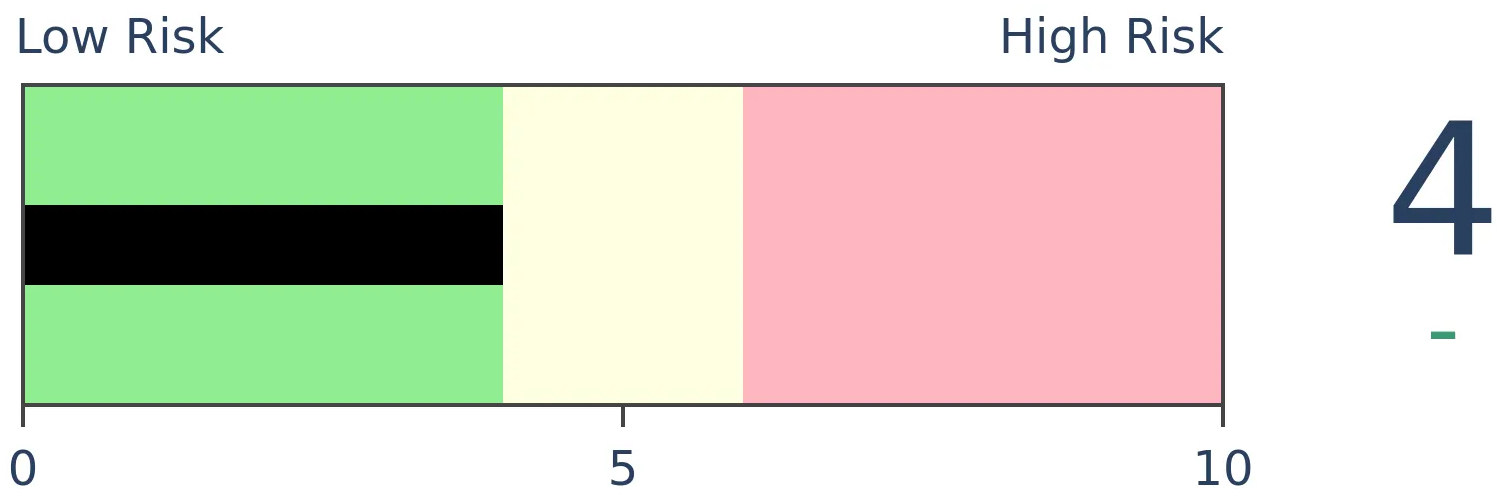
Crude Oil
|
|
Gold
|
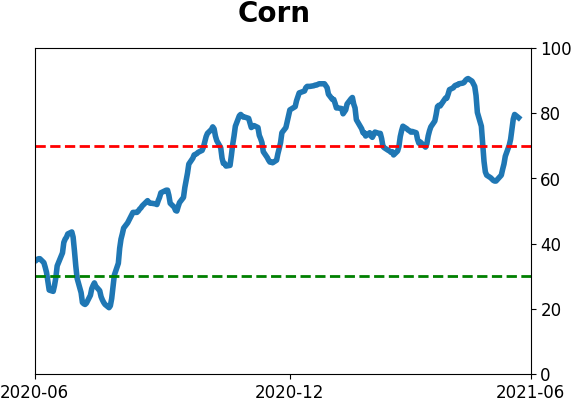
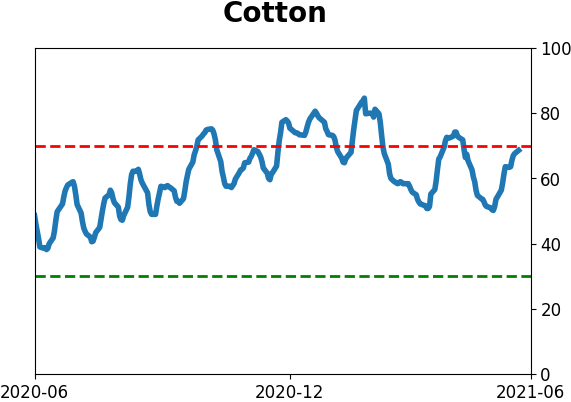
Agriculture
|
|
Research
BOTTOM LINE
The price of lumber is crashing relative to gold. This is considered a signal that investors have a risk-off mentality, but previous signals were not a consistent sell signal for stocks. It did tend to precede further declines in lumber prices, as well as homebuilding stocks.
FORECAST / TIMEFRAME
XHB -- Down, Medium-Term
|
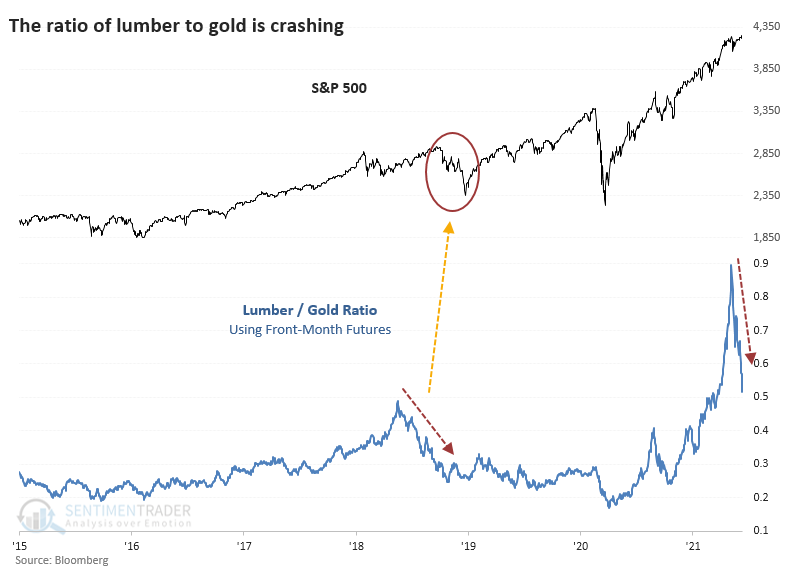
The ratio of lumber to gold is crashing, and it's raising concerns among some investors.
Lumber is considered a proxy for economic growth since it's an input to many construction projects. Gold is considered a "safe haven" asset that investors flock to in times of duress. Both assertions are questionable, but when the ratio of lumber to gold is rising, the theory is that investors are focused more on growth than safety, and it's a risk-on environment.
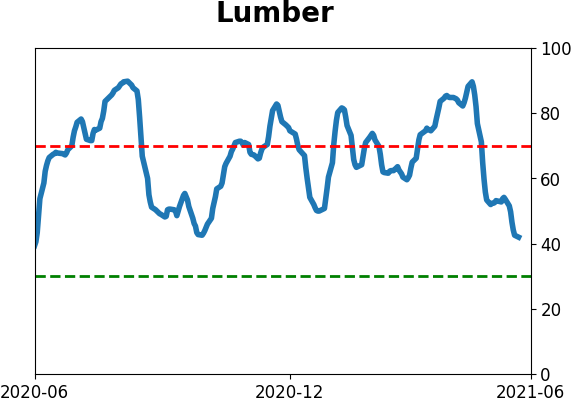
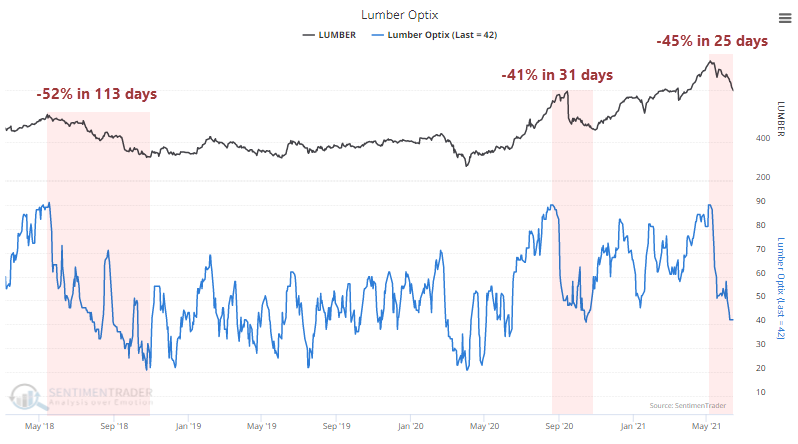
Ever since the Optimism Index on lumber hit 90%, lumber has been in a free-fall, surpassing the last couple of post-euphoria crashes in speed, if not magnitude.
The last time the ratio crash, it preceded trouble in the S&P.
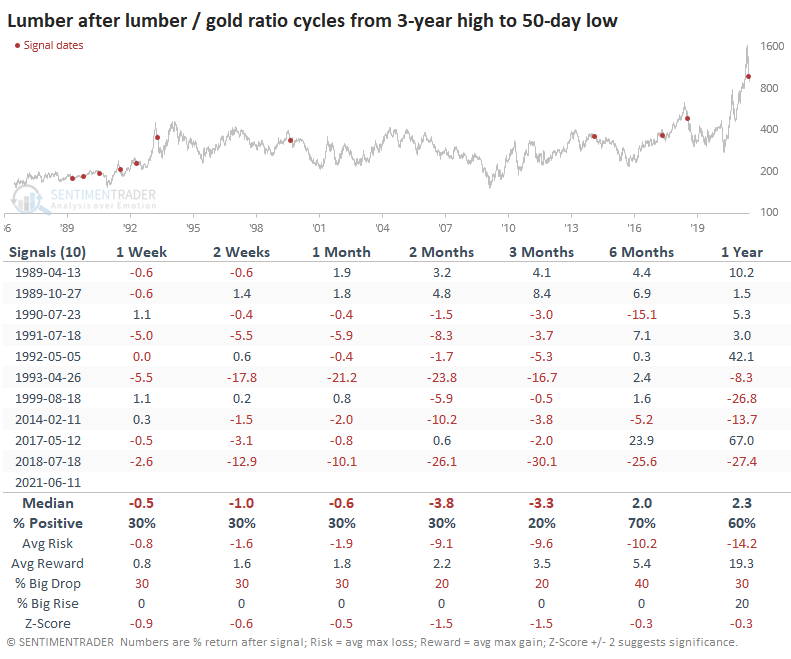
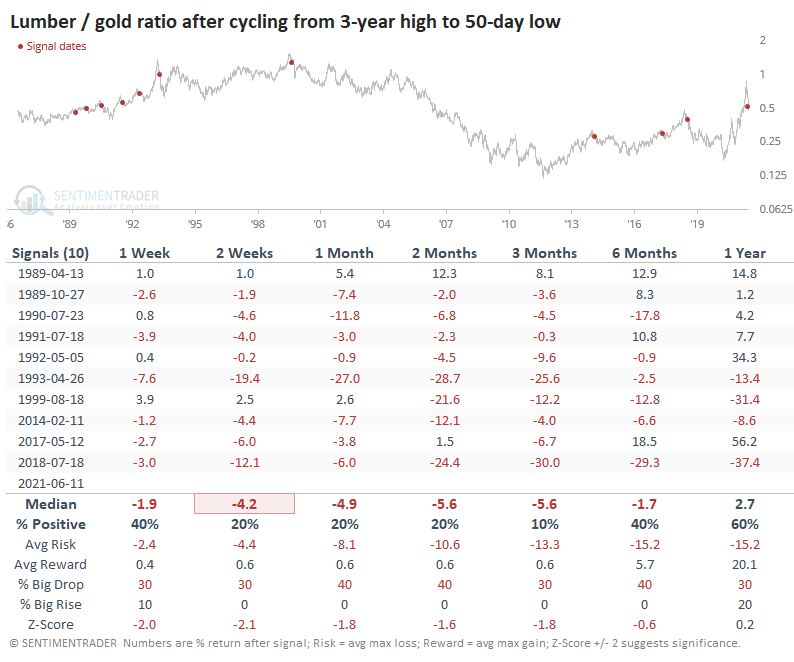
The trouble with charts is their subjectivity. So, let's go back to the inception of the futures market for both contracts and look at every time when the lumber / gold ratio cycled from a 3-year high to a 50-day low. On average, it took 29 days for the ratio to cycle like this, which is quick. The current one took 24 days, so about in line with average.
It was not a good reason to sell stocks. The S&P 500 did crack a couple of times, including the one noted above. It preceded the 1990 recession scare and kinda-sorta the popping of the 2000 bubble, but it's a big stretch to include that one in a list of warning signs.
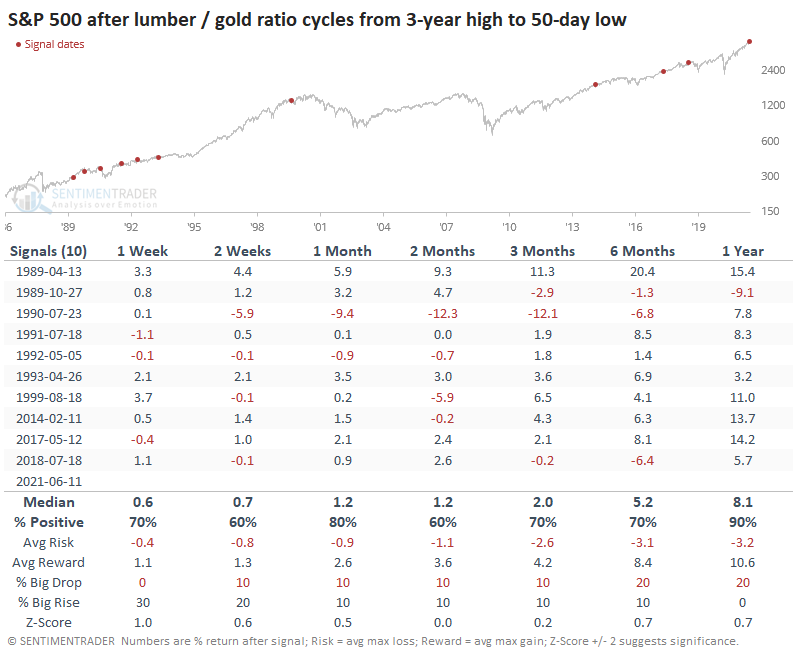
It was, however, a pretty good reason to sell lumber. The contract continued to plunge most of the time, with the first signal in 1989 being the only sustained exception.
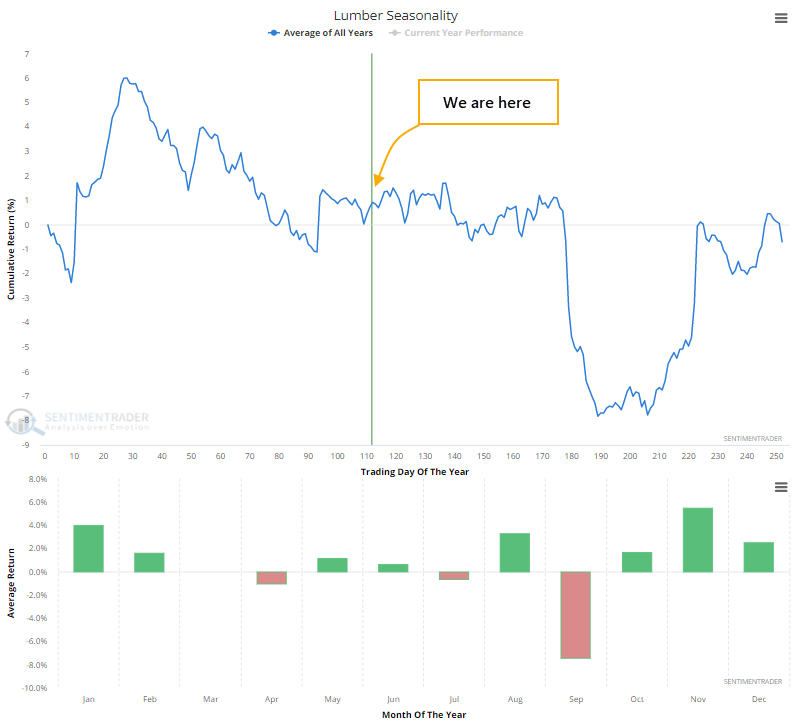
Over the next several months, lumber really struggled. This coincides with a weak seasonal window as lumber prices typically bottom in the late fall.
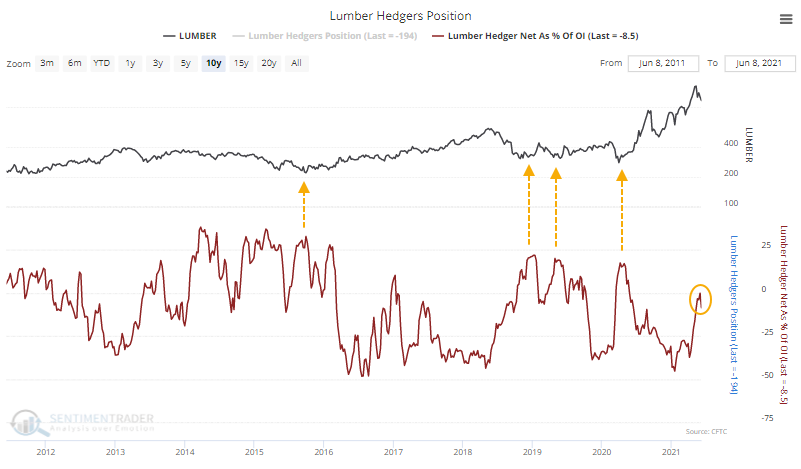
There isn't much support from "smart money" traders yet, either. In recent years, lumber had bottomed when commercial hedgers held about 25% or more of open interest net long. Currently, they're still net short.
Gold prices tended to hold up much better than lumber after cycles in the ratio.
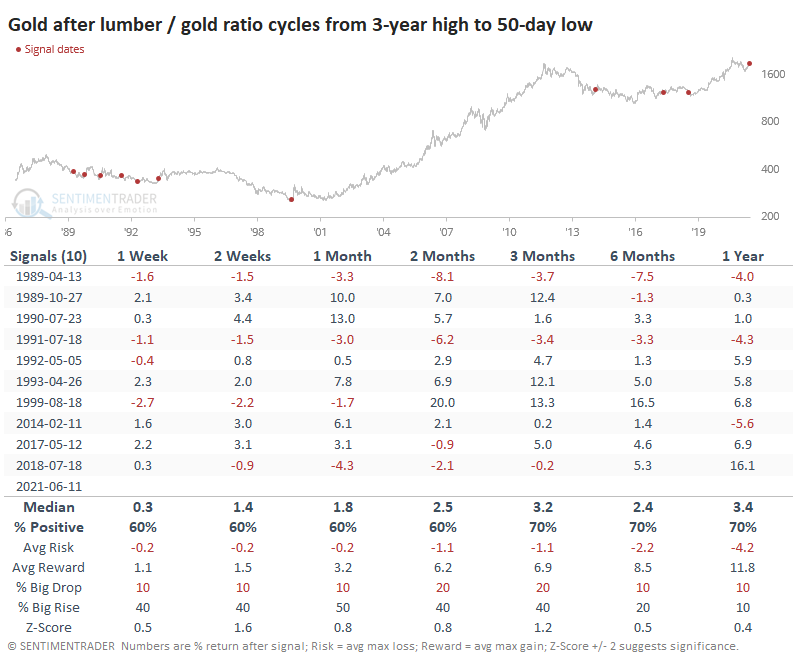
This dynamic means that the ratio of lumber to gold had a strong tendency to keep declining.
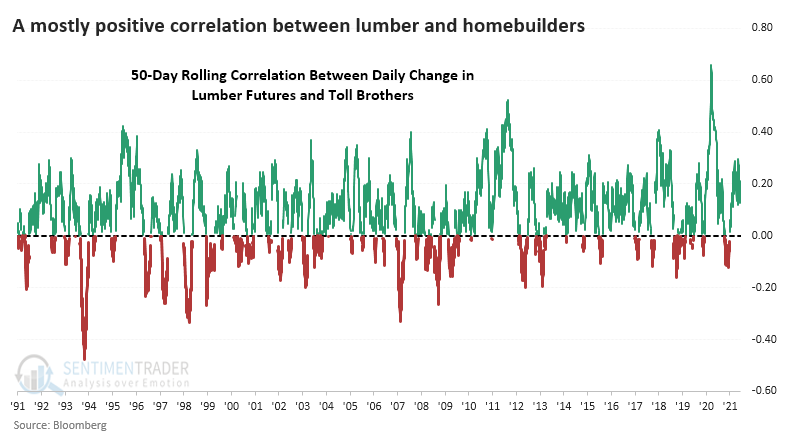
While it's not perfect, lumber prices do have an impact on homebuilding stocks. The chart below shows the rolling 50-day correlation between daily price changes in lumber and the homebuilder Toll Brothers. This is mostly well above zero, especially over the past decade.
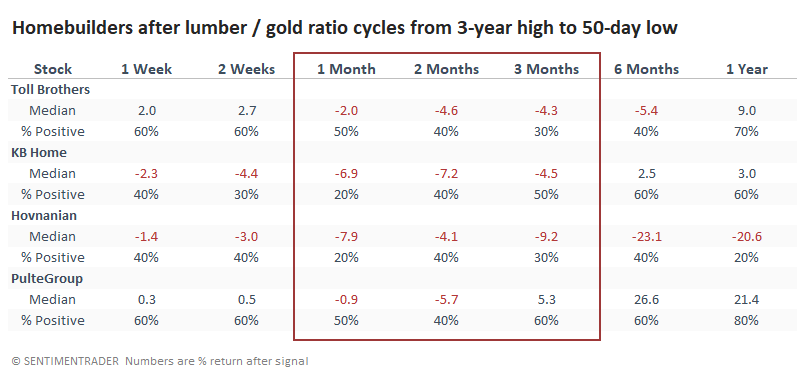
That means if lumber tended to continue to fall after these cycles in the lumber / gold ratio, then homebuilders should have too. And they did. Medium-term returns for several of the builders with the longest histories as public companies were not impressive.
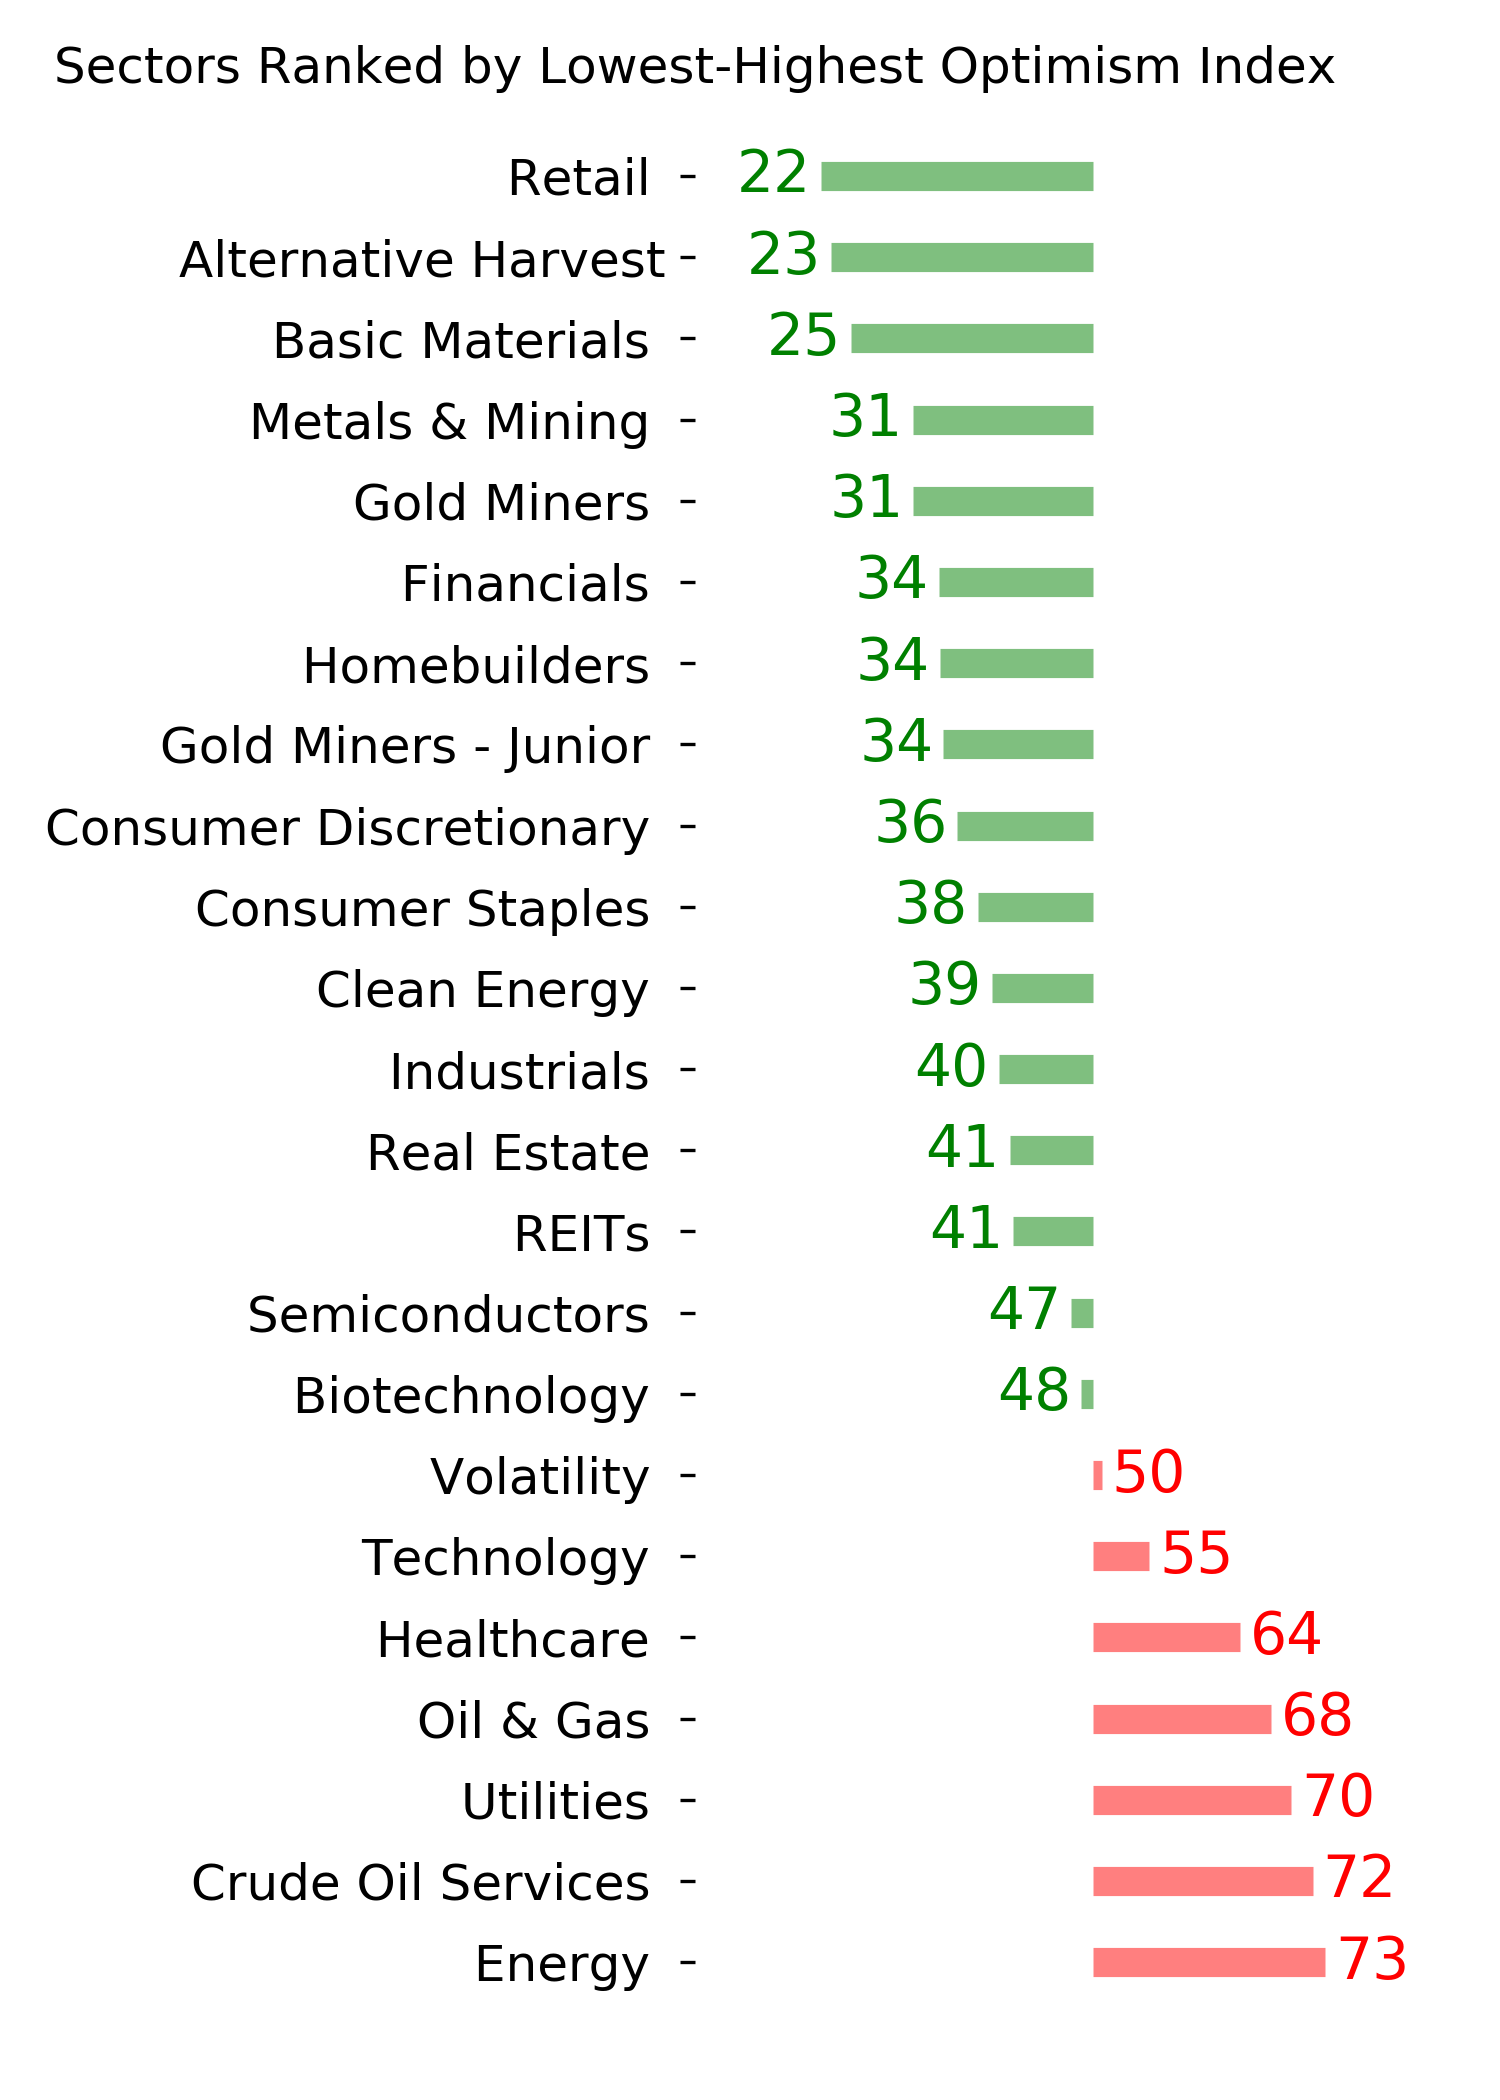
As for major sectors and factors, there was not a huge difference in future returns. Materials, Tech, and Discretionary stocks showed poor medium-term returns. Utilities and Health Care were among the strongest, so it's not a shocker that Defensive stocks were the best-performing factor.
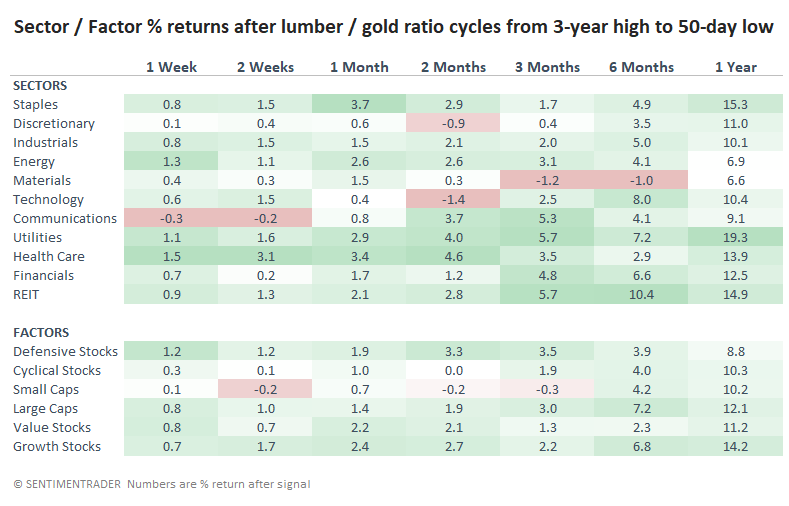
There isn't much support here to consider a crash in the price of lumber relative to gold as a reason to be concerned about the stock market, at least on an aggregate level. A more defensible position is that higher-beta, higher-risk sectors may be more vulnerable, and homebuilding stocks have suffered the most.
Active Studies
| Time Frame | Bullish | Bearish | | Short-Term | 0 | 0 | | Medium-Term | 2 | 12 | | Long-Term | 11 | 5 |
|
Indicators at Extremes
|
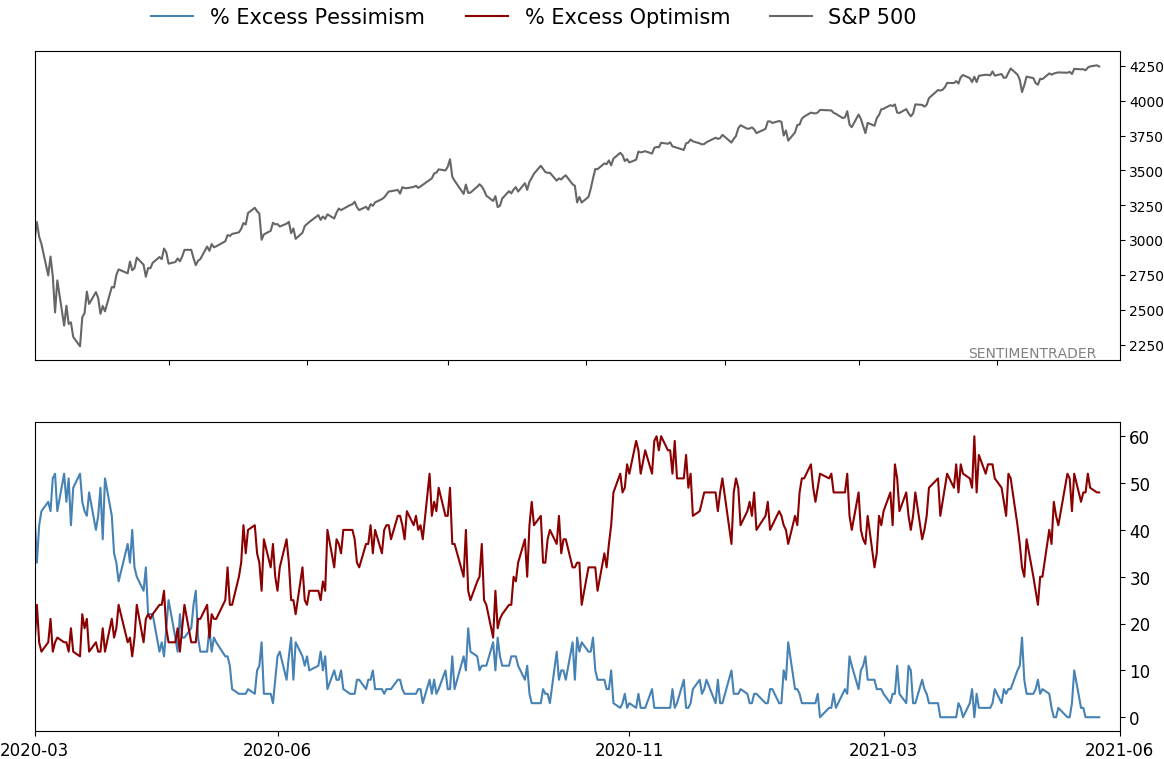
% Showing Pessimism: 0%
Bullish for Stocks
|
|
Portfolio
| Position | Description | Weight % | Added / Reduced | Date | | Stocks | RSP | 4.1 | Added 4.1% | 2021-05-19 | | Bonds | 23.9% BND, 6.9% SCHP | 30.7 | Reduced 7.1% | 2021-05-19 | | Commodities | GCC | 2.6 | Reduced 2.1%
| 2020-09-04 | | Precious Metals | GDX | 5.6 | Reduced 4.2% | 2021-05-19 | | Special Situations | 4.3% XLE, 2.2% PSCE | 7.6 | Reduced 5.6% | 2021-04-22 | | Cash | | 49.4 | | |
|
Updates (Changes made today are underlined)
Much of our momentum and trend work has remained positive for several months, with some scattered exceptions. Almost all sentiment-related work has shown a poor risk/reward ratio for stocks, especially as speculation drove to record highs in exuberance in February. Much of that has worn off, and most of our models are back toward neutral levels. There isn't much to be excited about here. The same goes for bonds and even gold. Gold has been performing well lately and is back above long-term trend lines. The issue is that it has a poor record of holding onto gains when attempting a long-term trend change like this, so we'll take a wait-and-see approach. RETURN YTD: 10.1% 2020: 8.1%, 2019: 12.6%, 2018: 0.6%, 2017: 3.8%, 2016: 17.1%, 2015: 9.2%, 2014: 14.5%, 2013: 2.2%, 2012: 10.8%, 2011: 16.5%, 2010: 15.3%, 2009: 23.9%, 2008: 16.2%, 2007: 7.8%
|
|
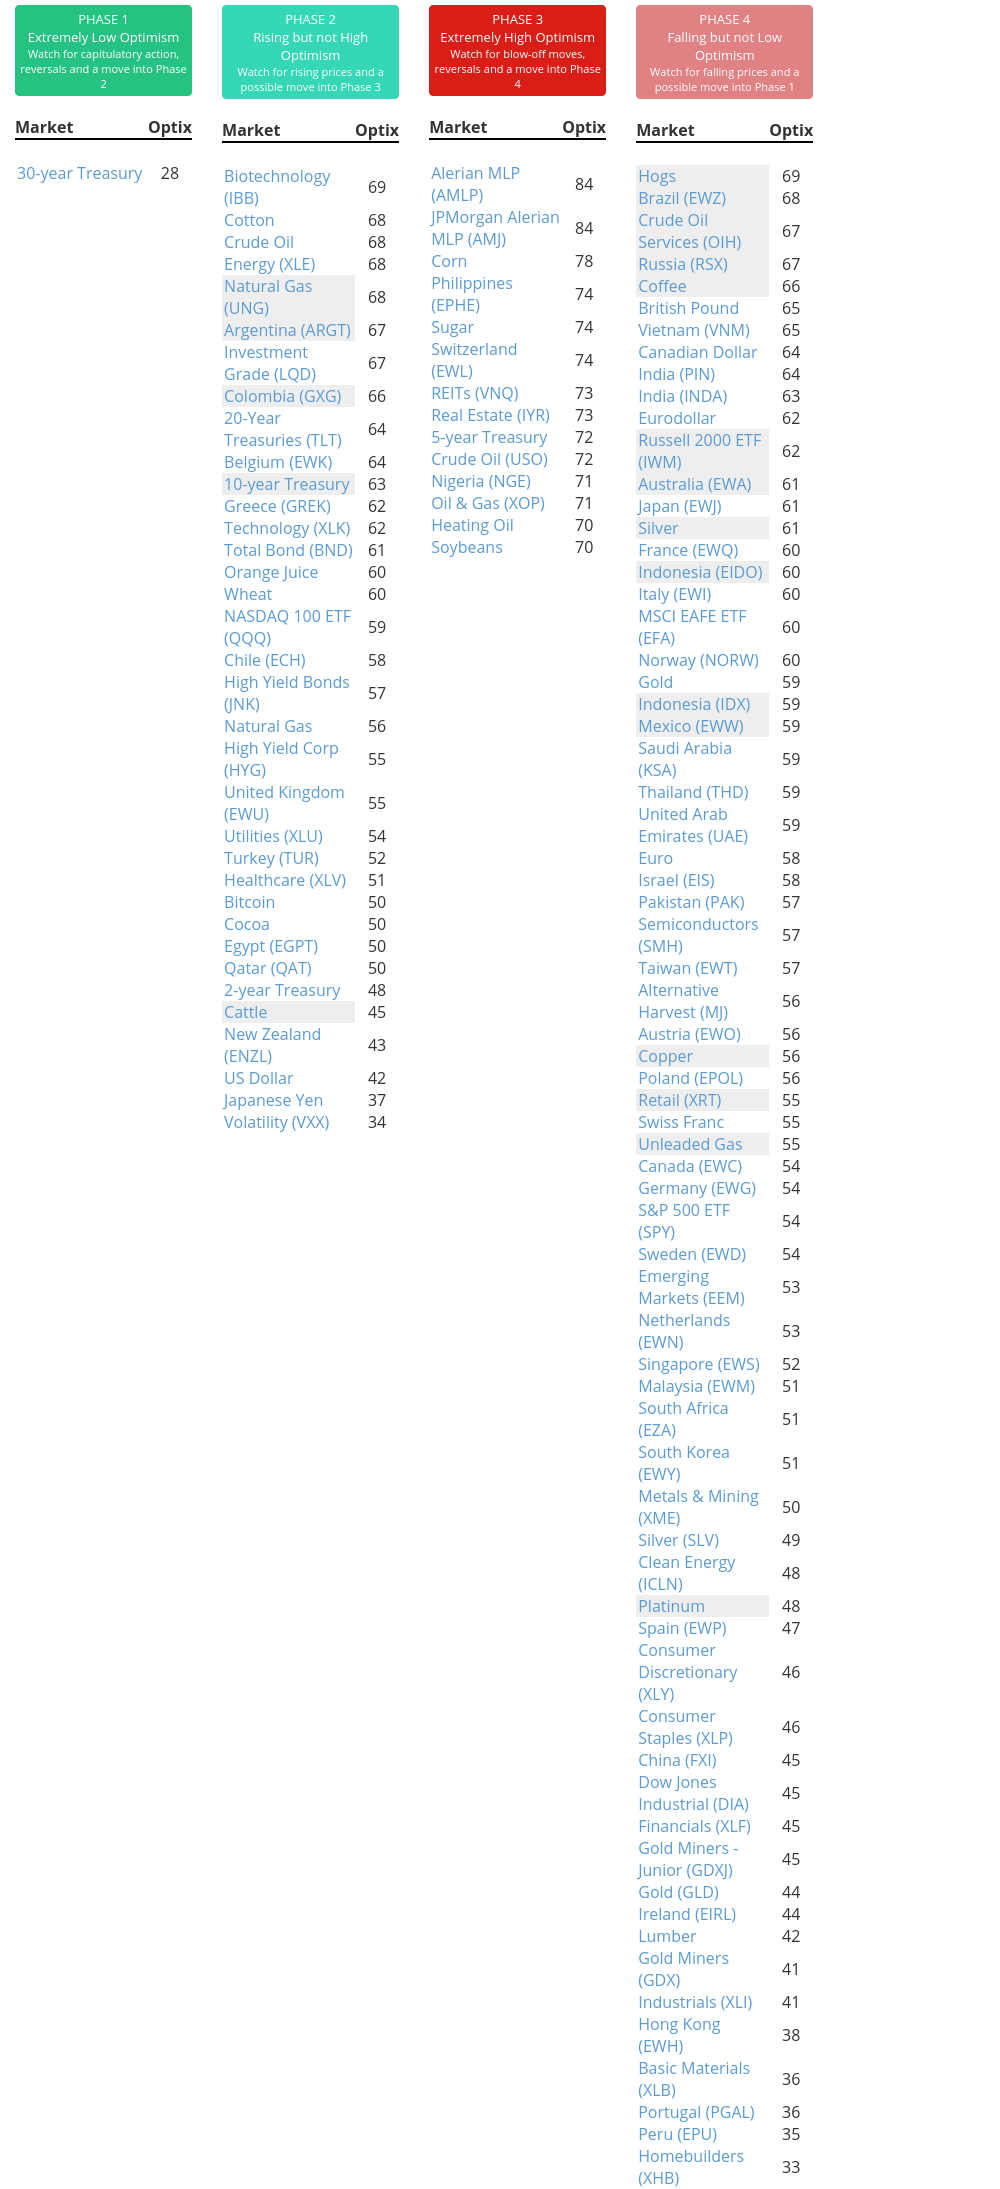
Phase Table
Ranks
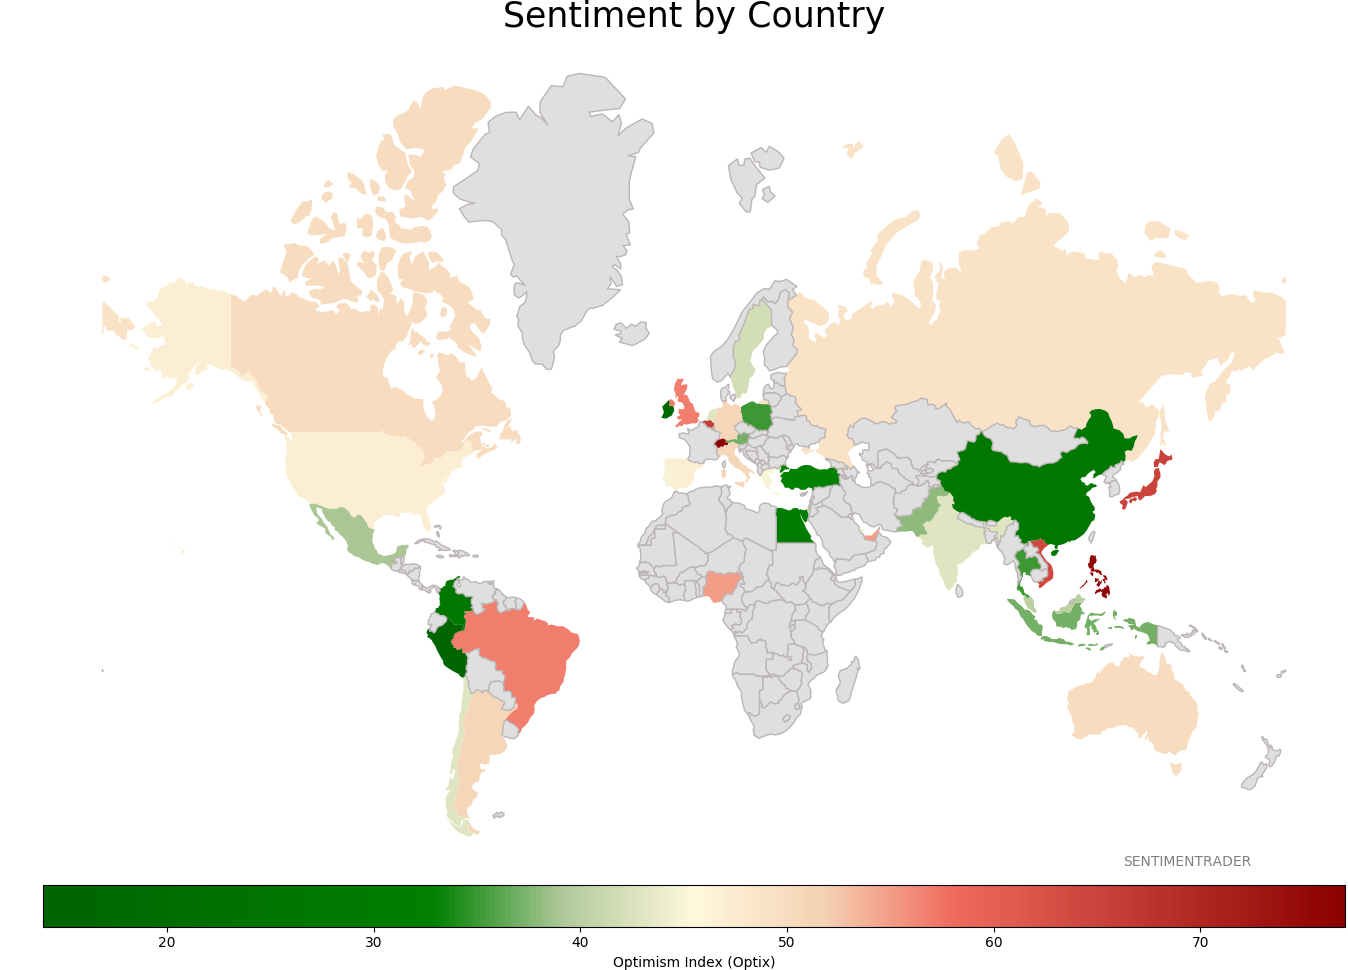
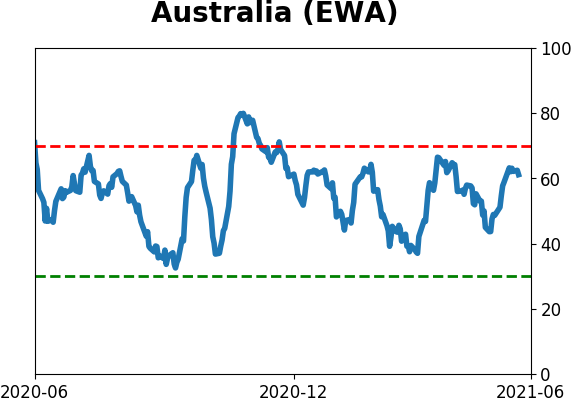
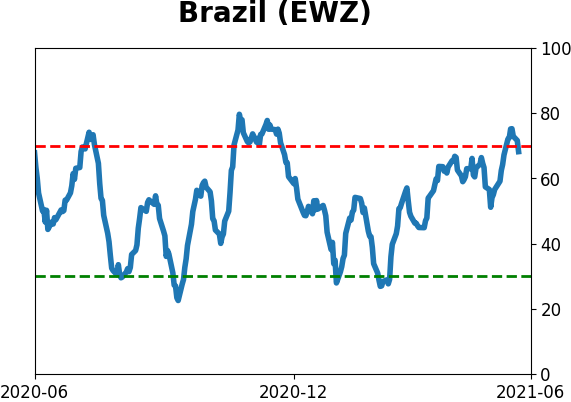
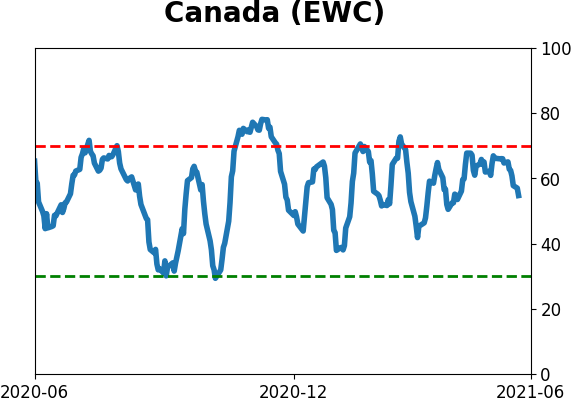
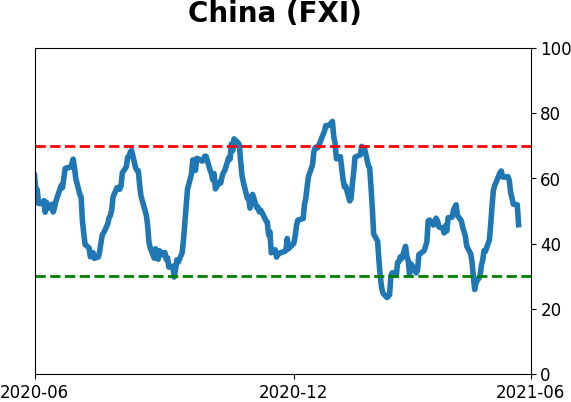
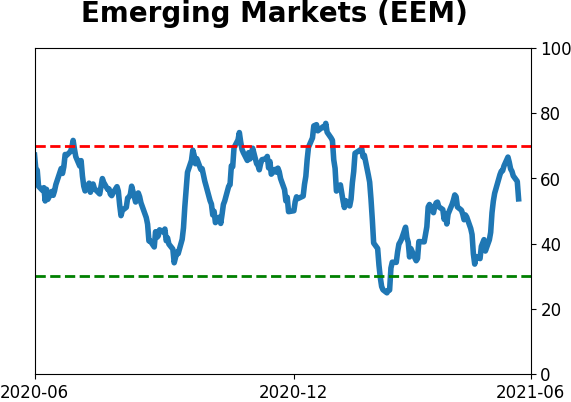
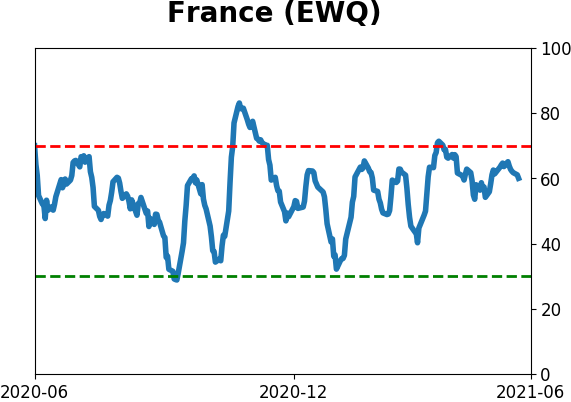
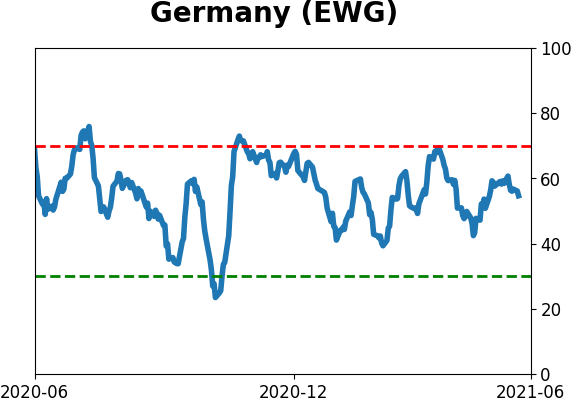
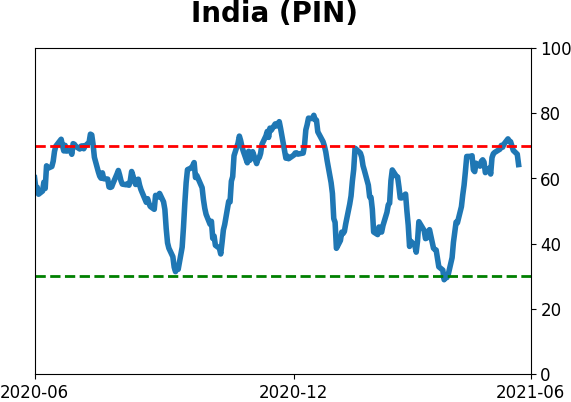
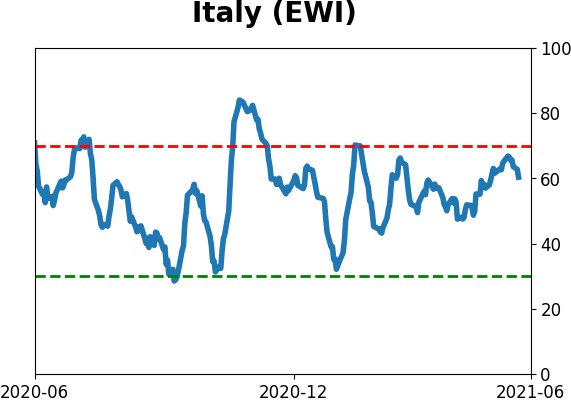
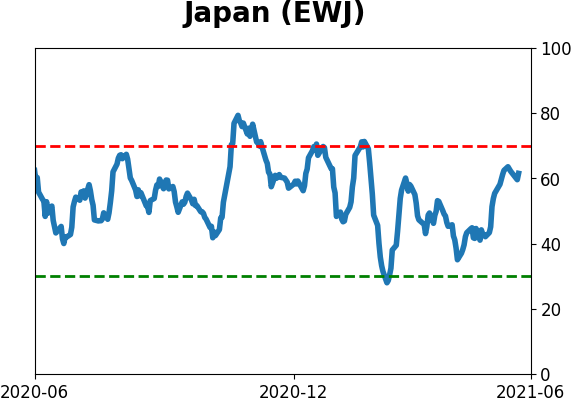
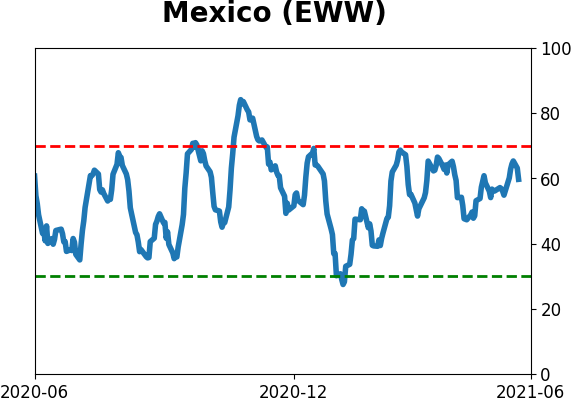
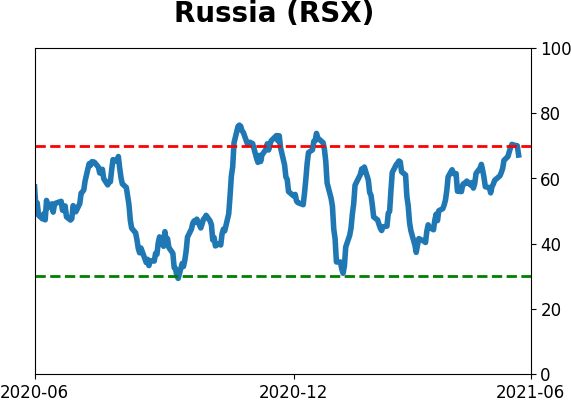
Sentiment Around The World
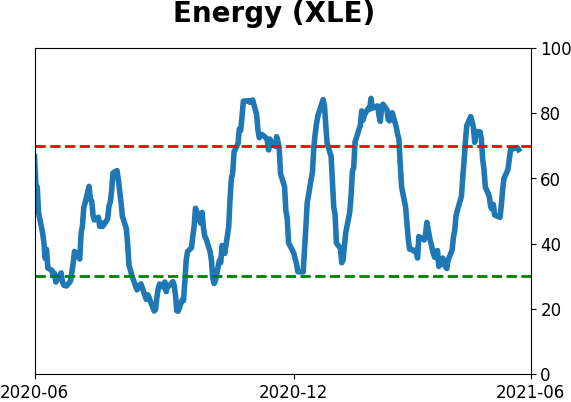
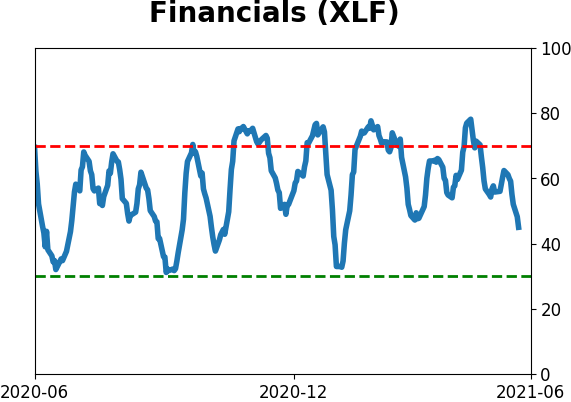
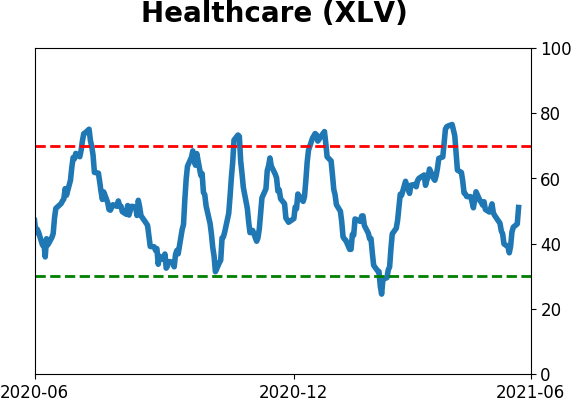
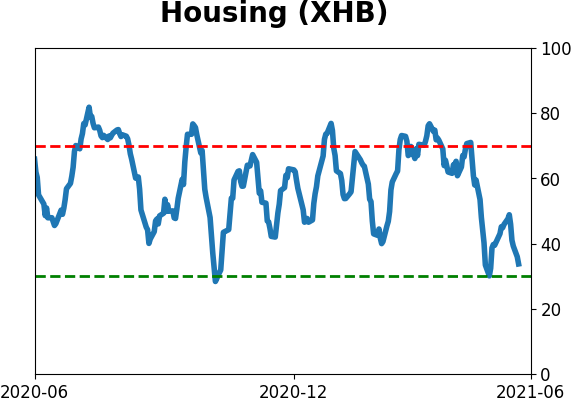
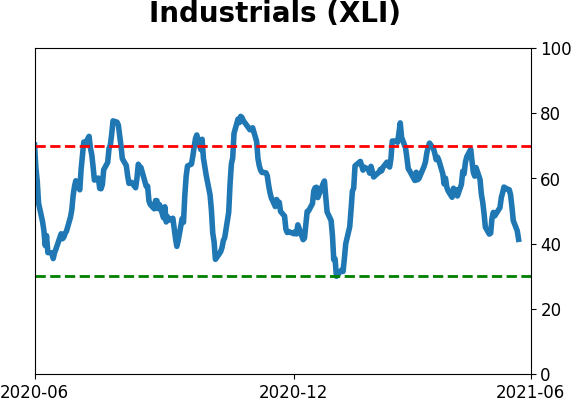
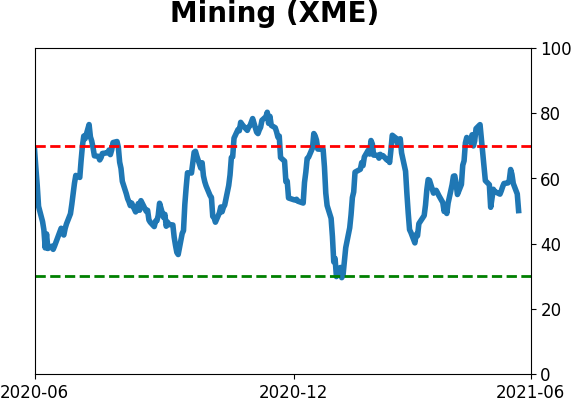
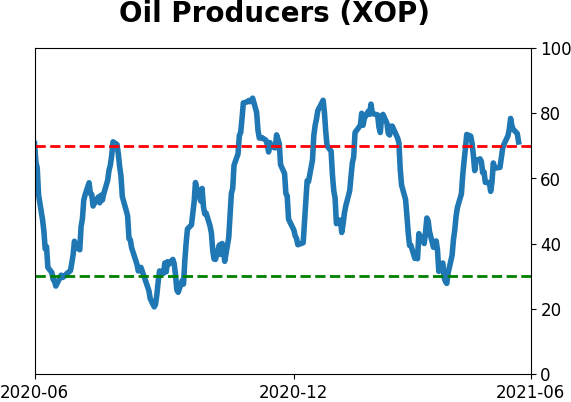
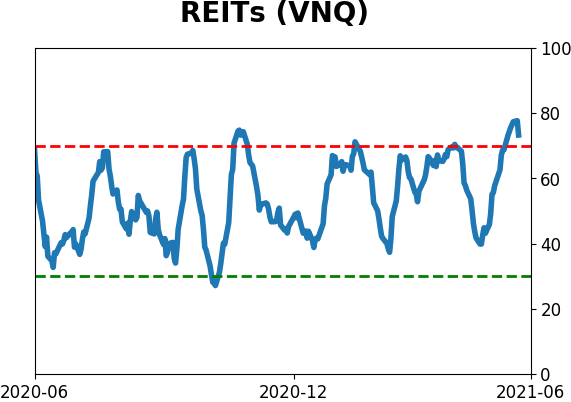
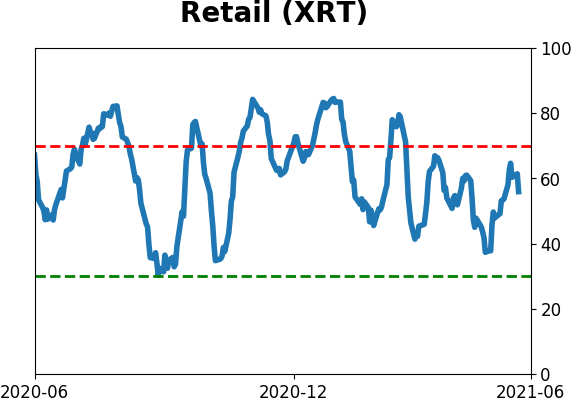
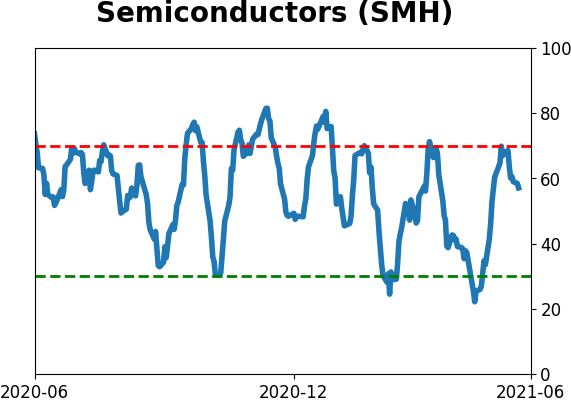
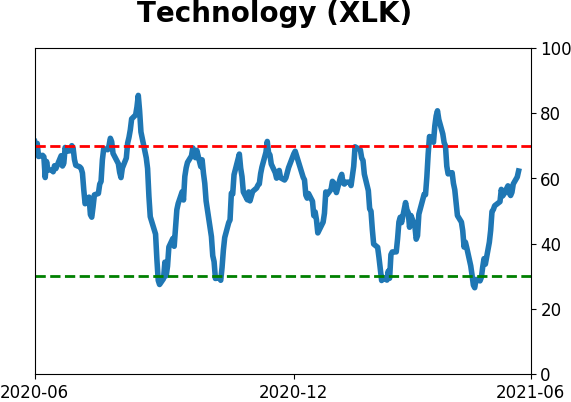
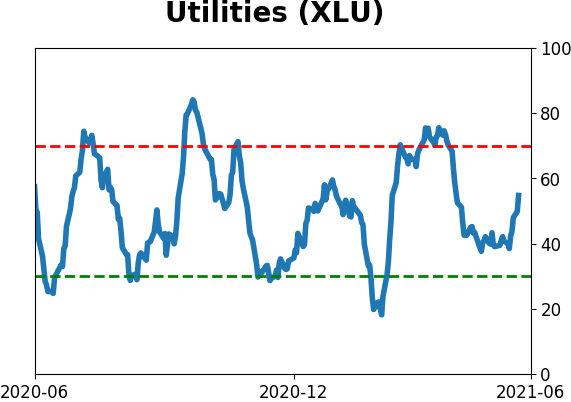
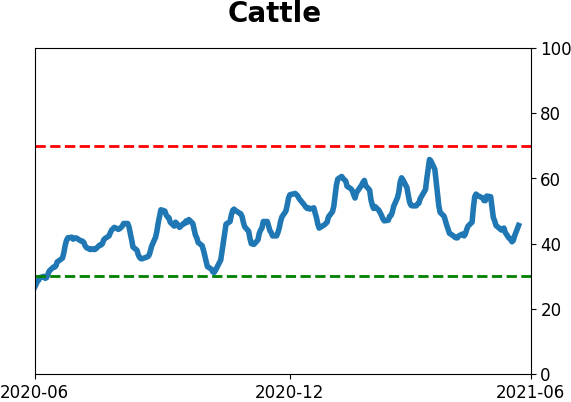
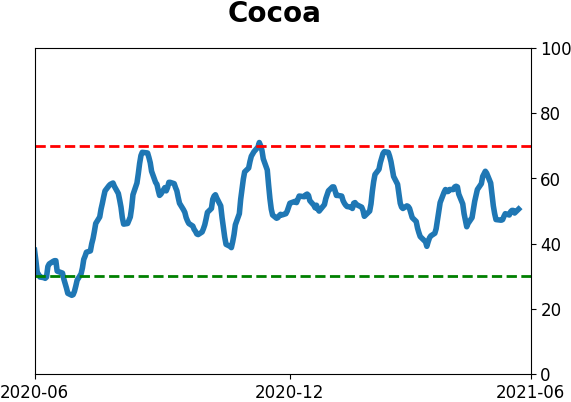
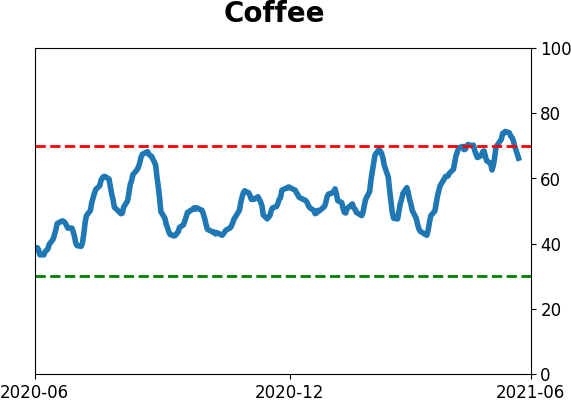
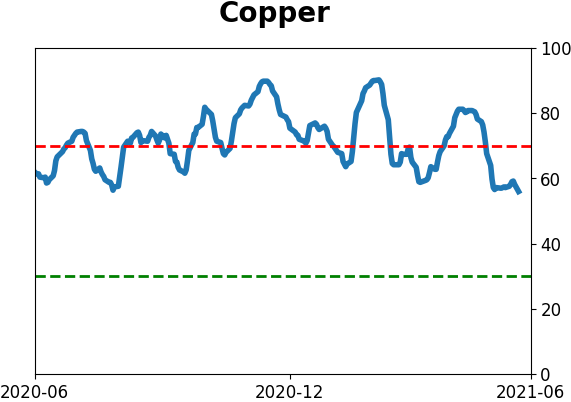
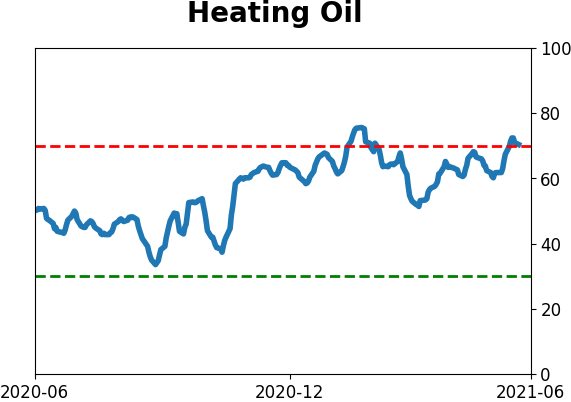
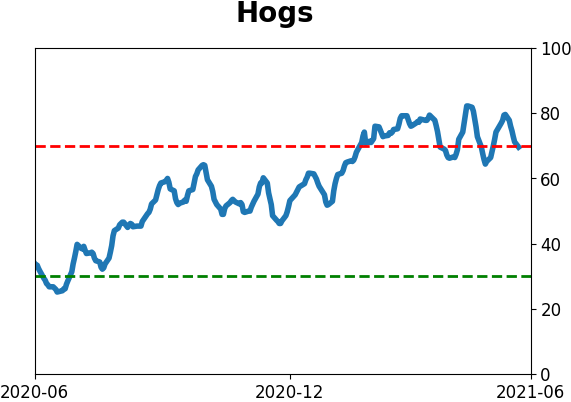
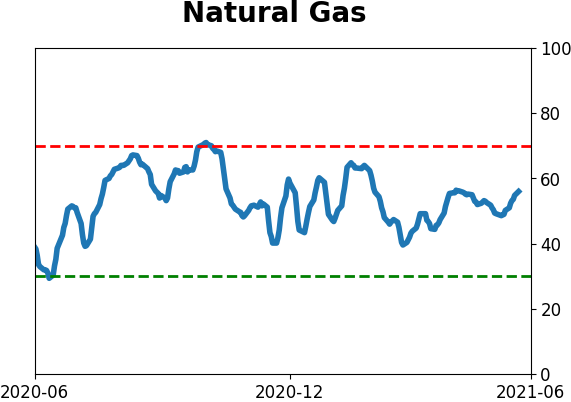
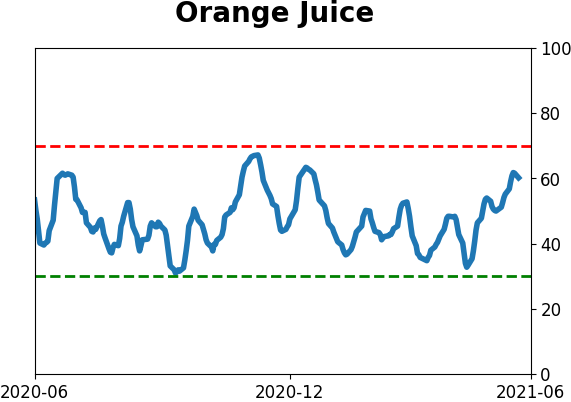
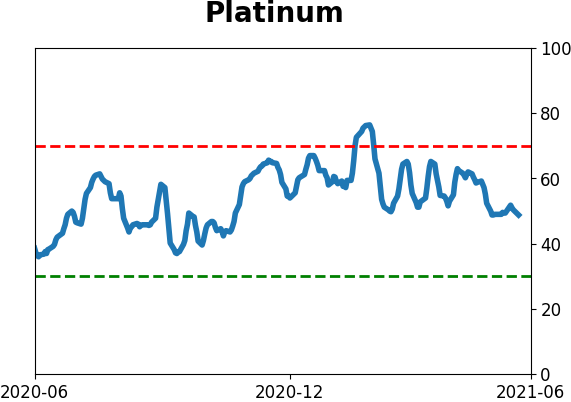
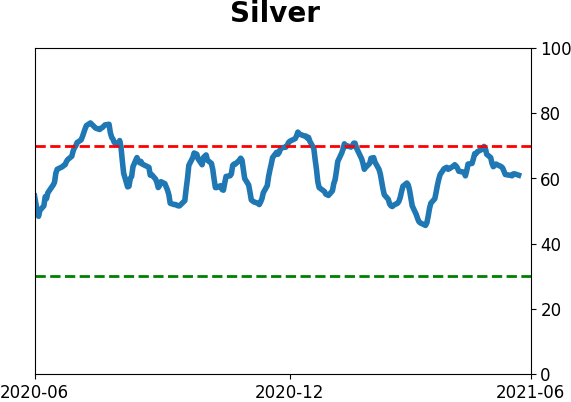
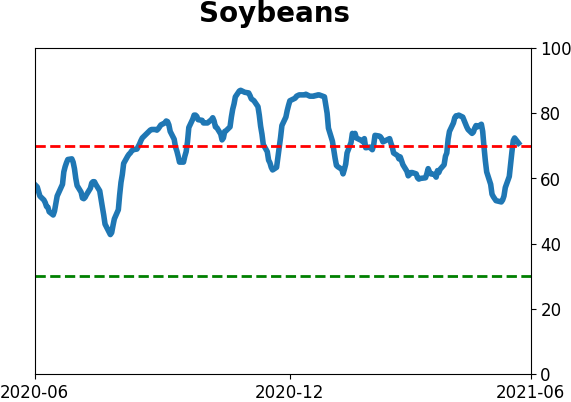
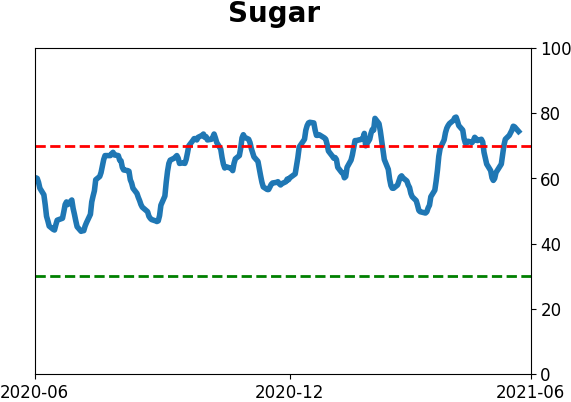
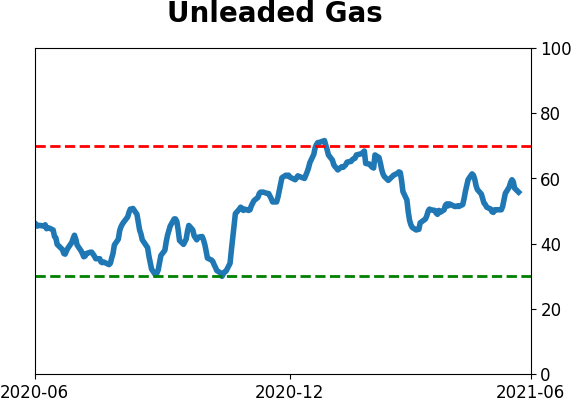
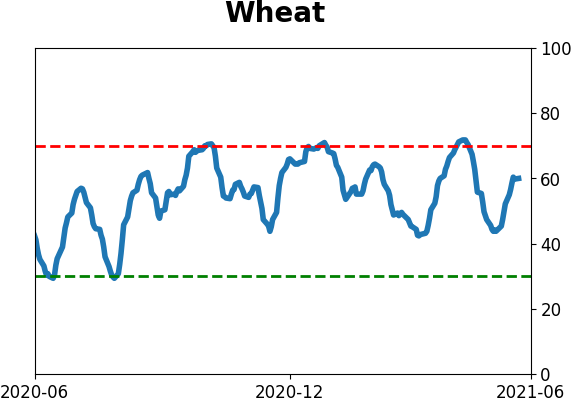
Optimism Index Thumbnails
|
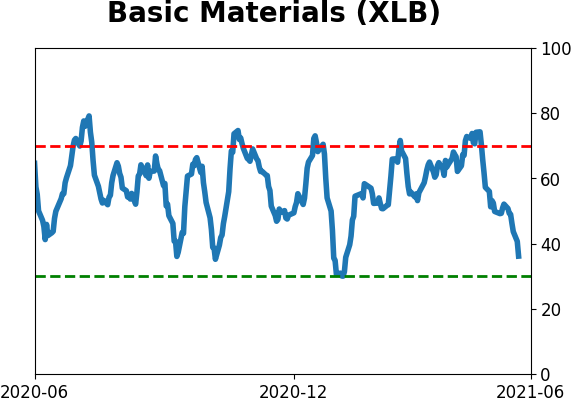
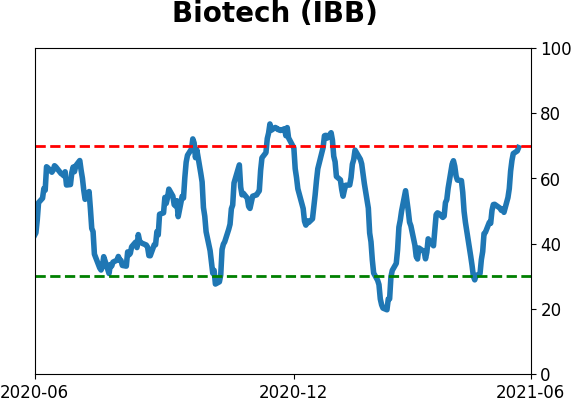
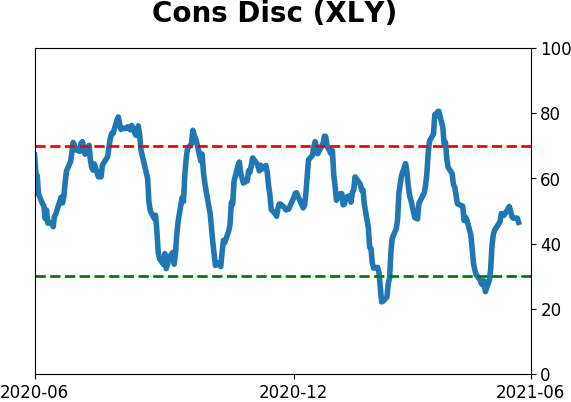
Sector ETF's - 10-Day Moving Average
|
|
|
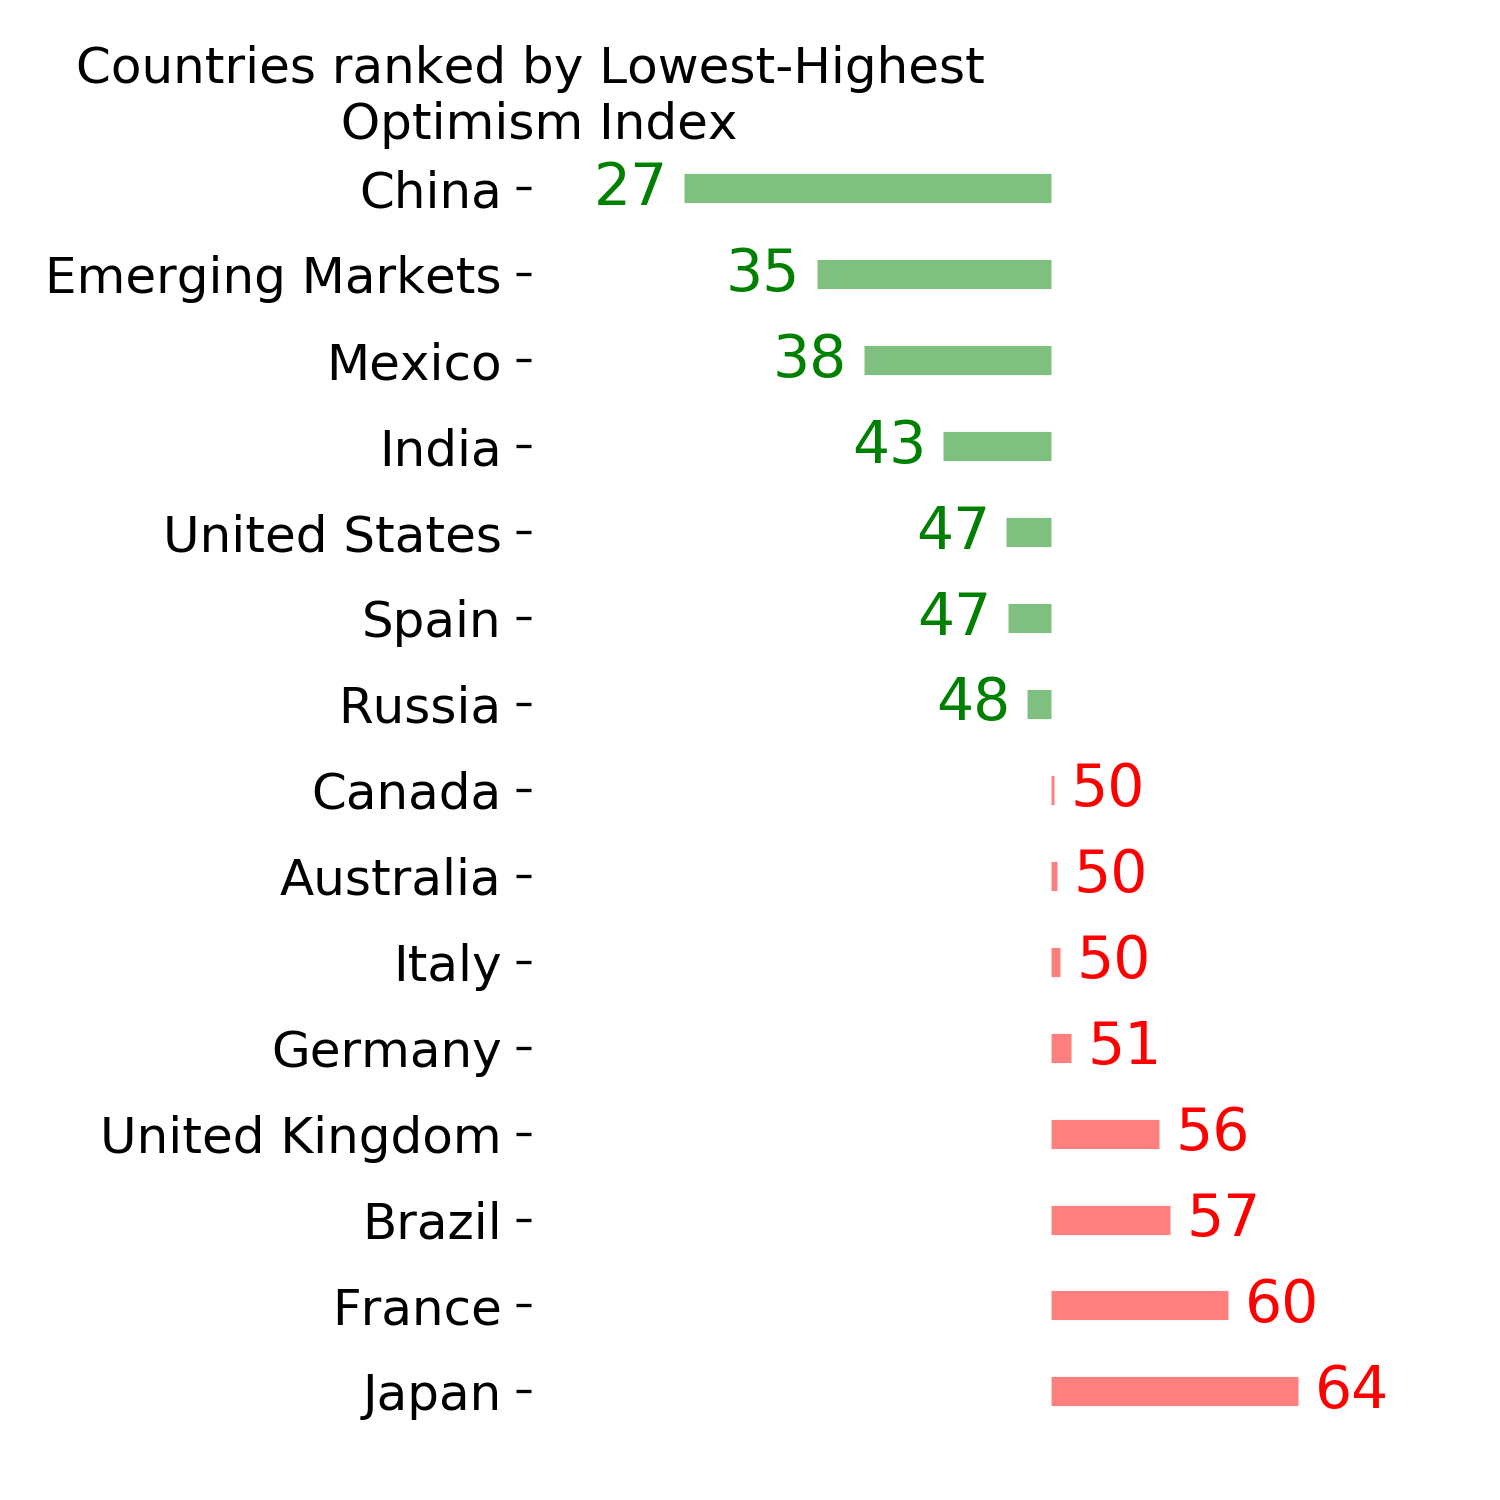
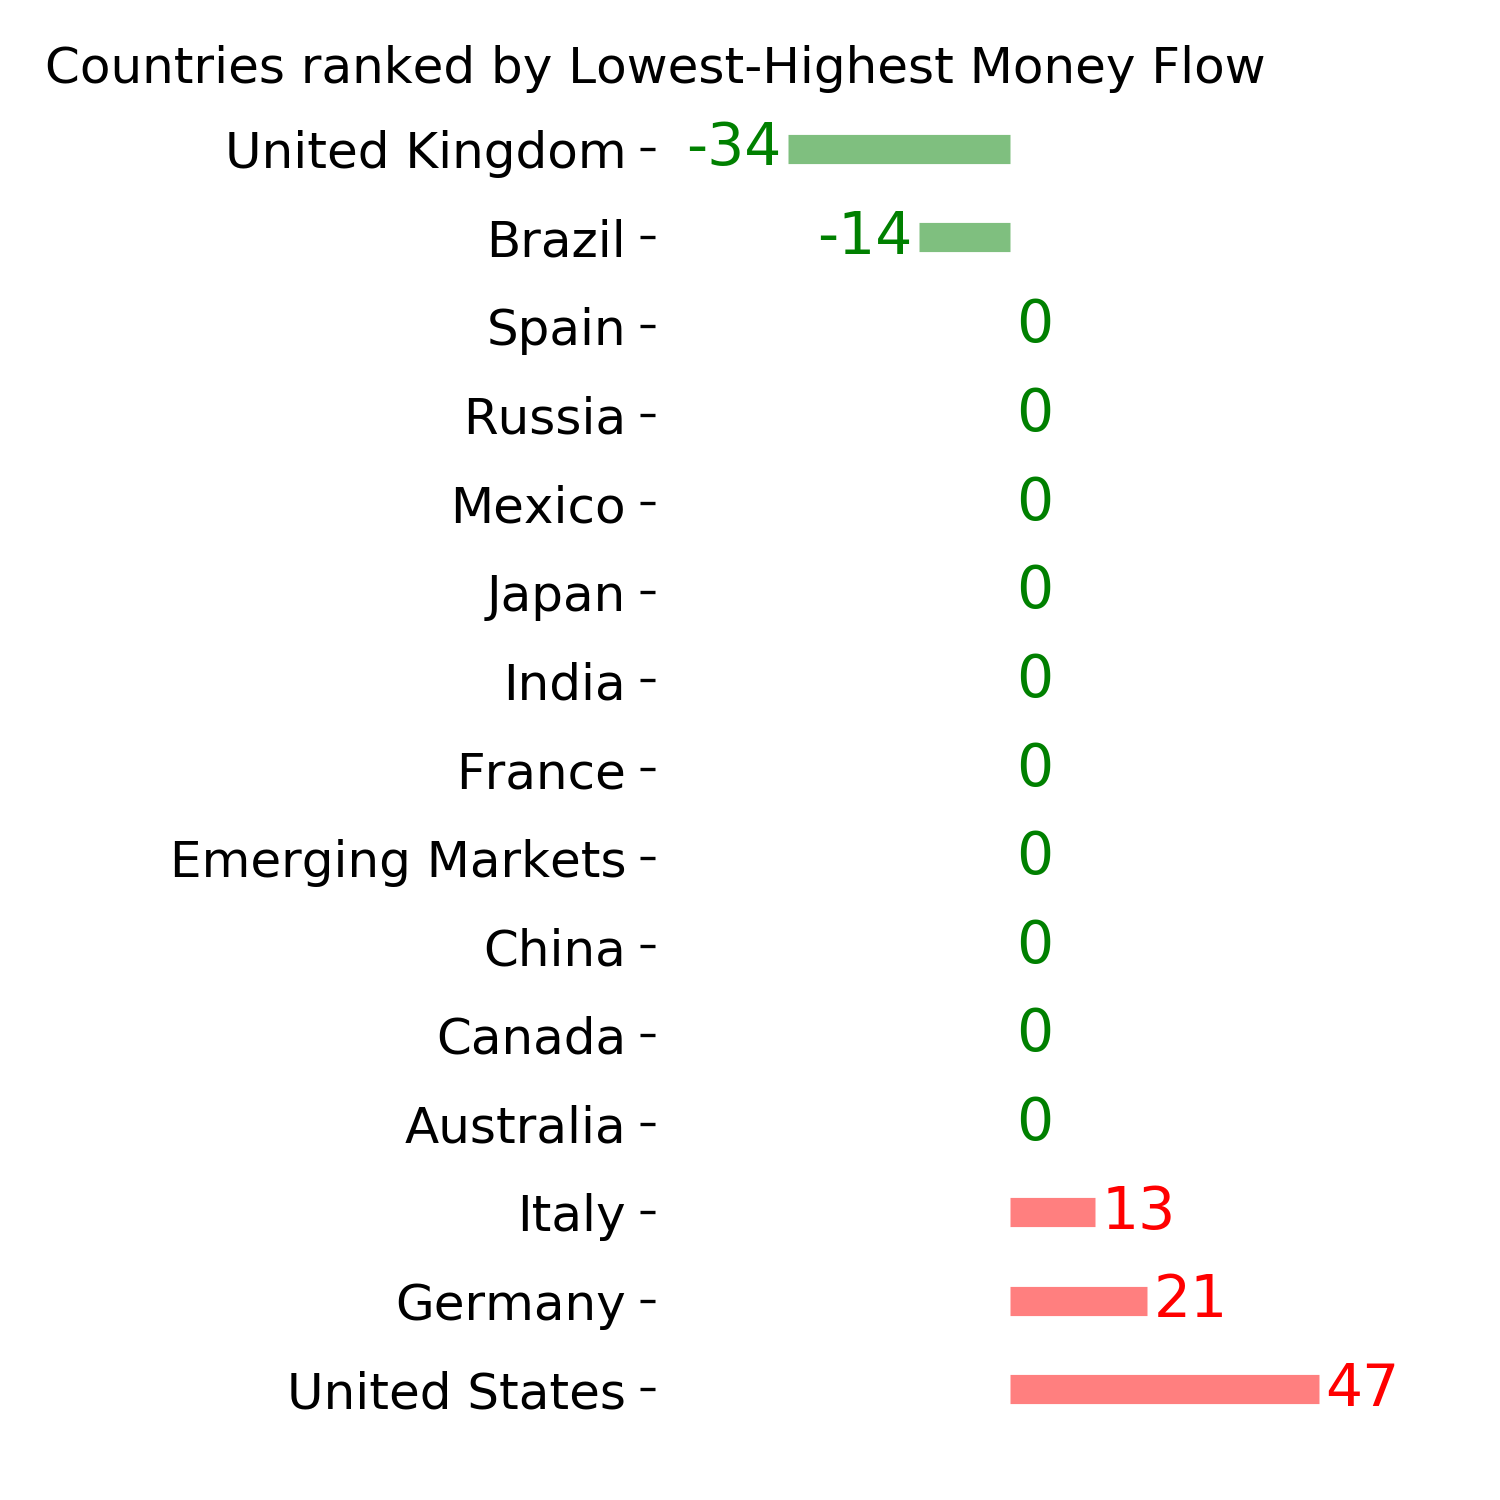
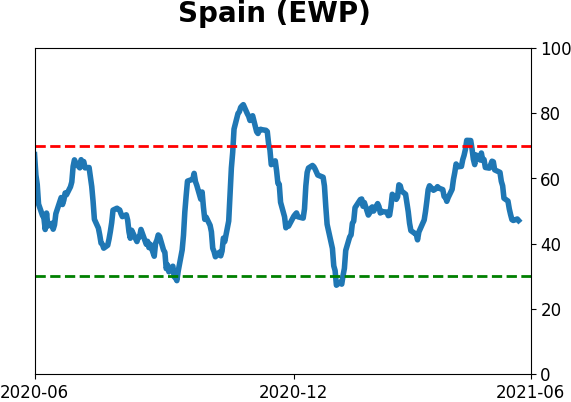
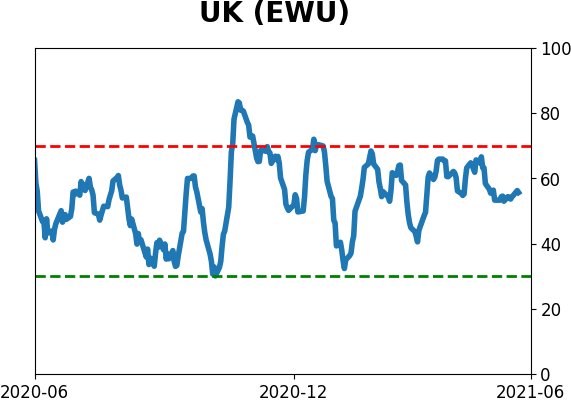
Country ETF's - 10-Day Moving Average
|
|
|
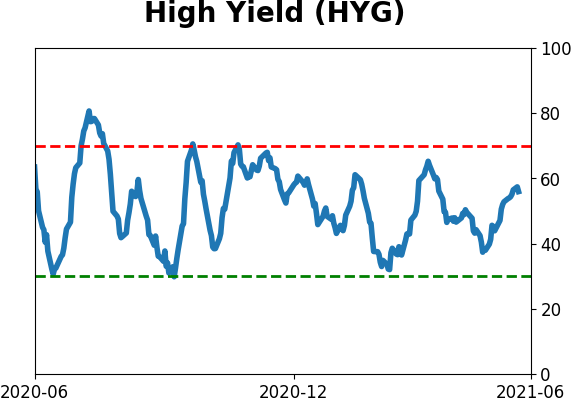
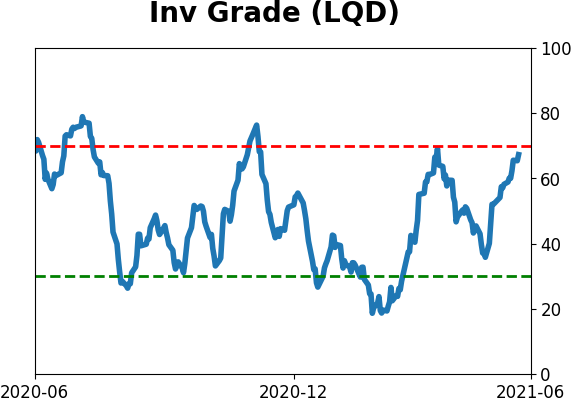
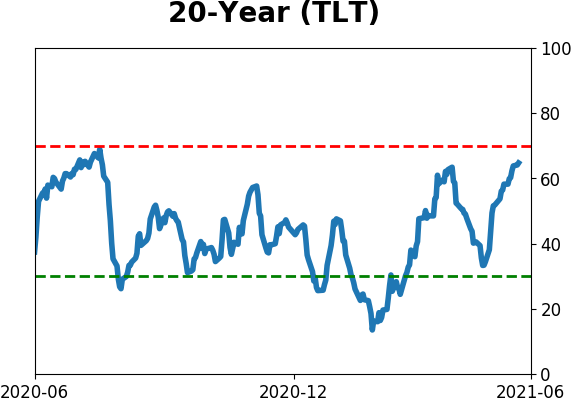
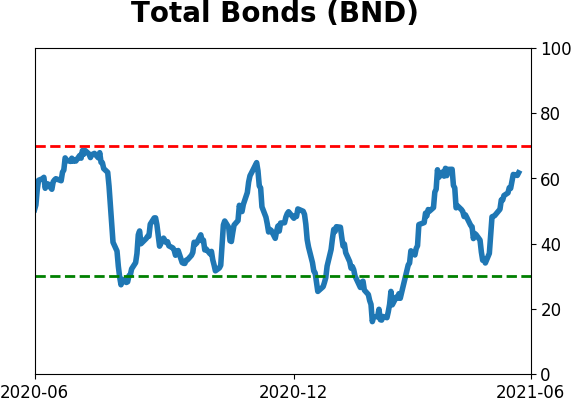
Bond ETF's - 10-Day Moving Average
|
|
|
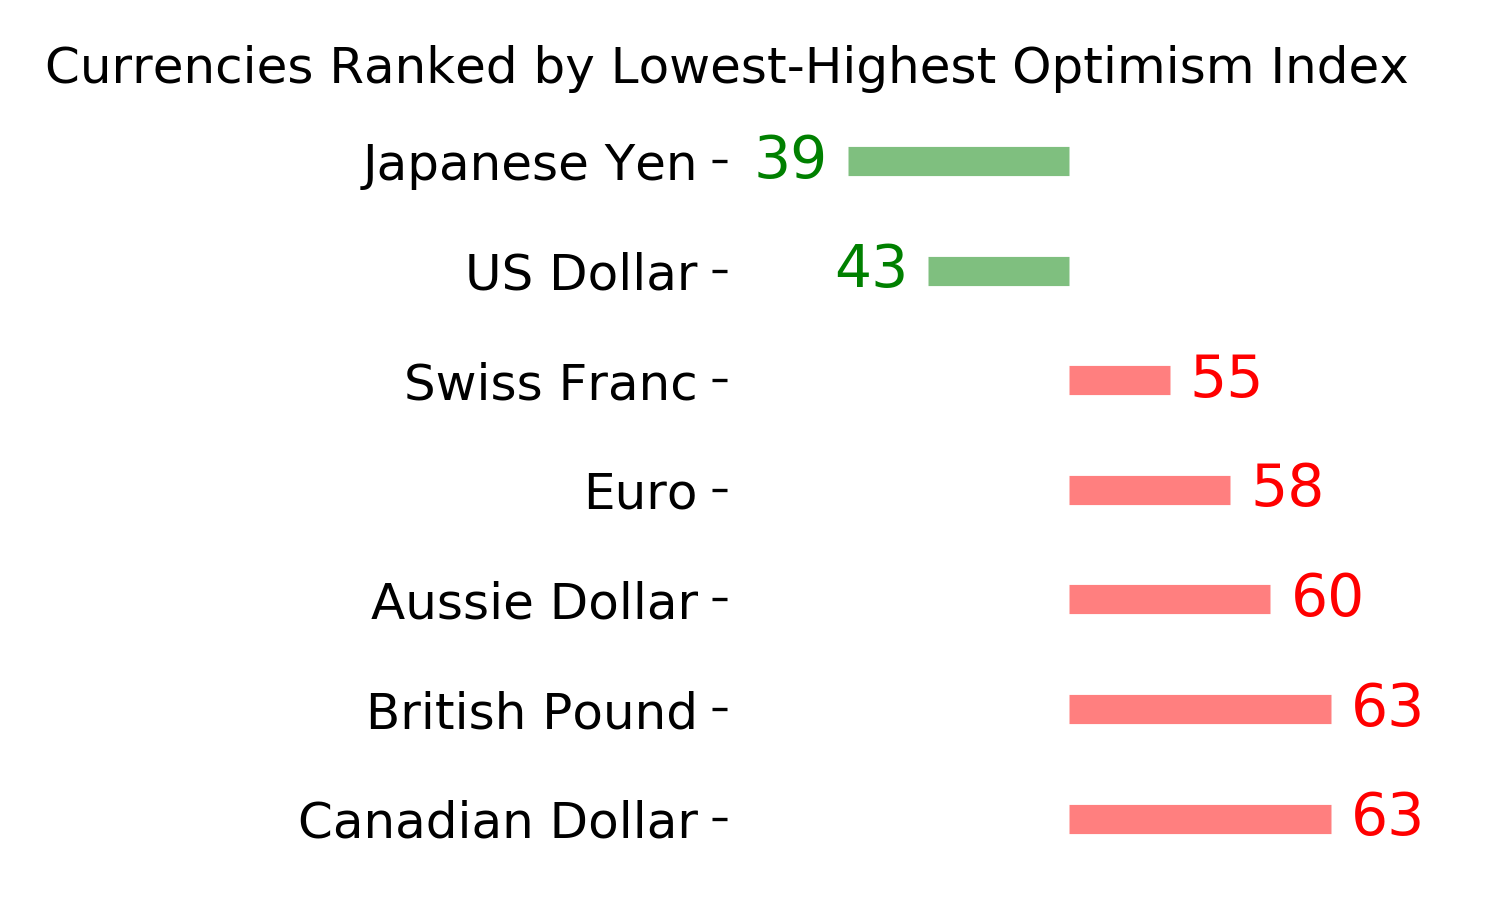
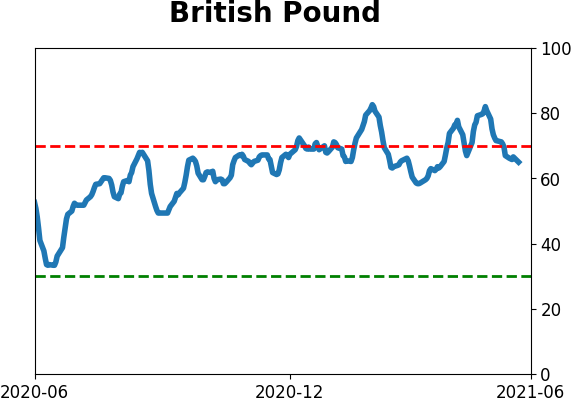
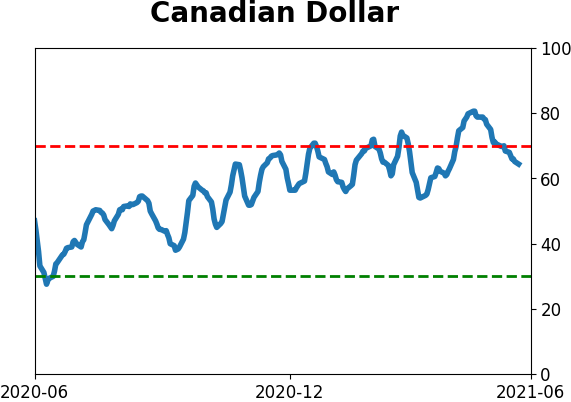
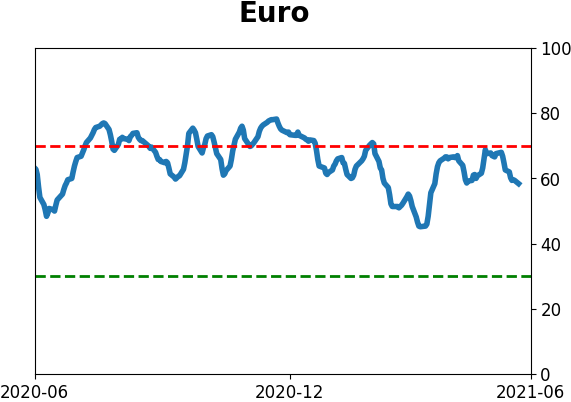
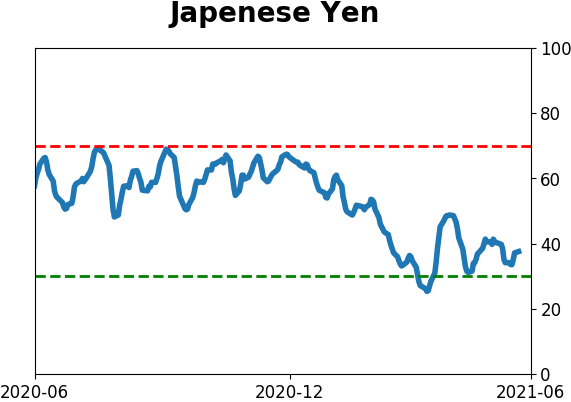
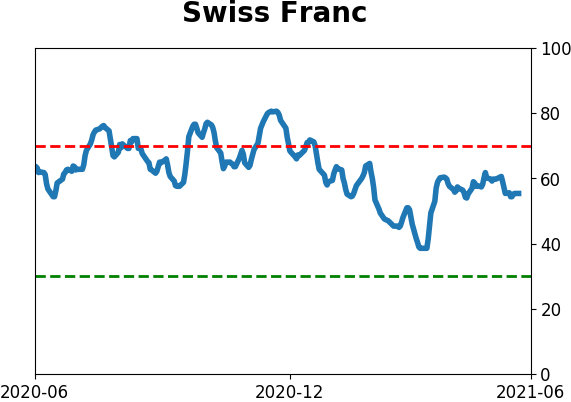
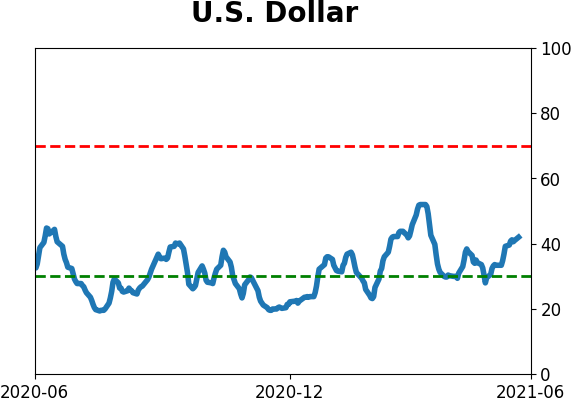
Currency ETF's - 5-Day Moving Average
|
|
|
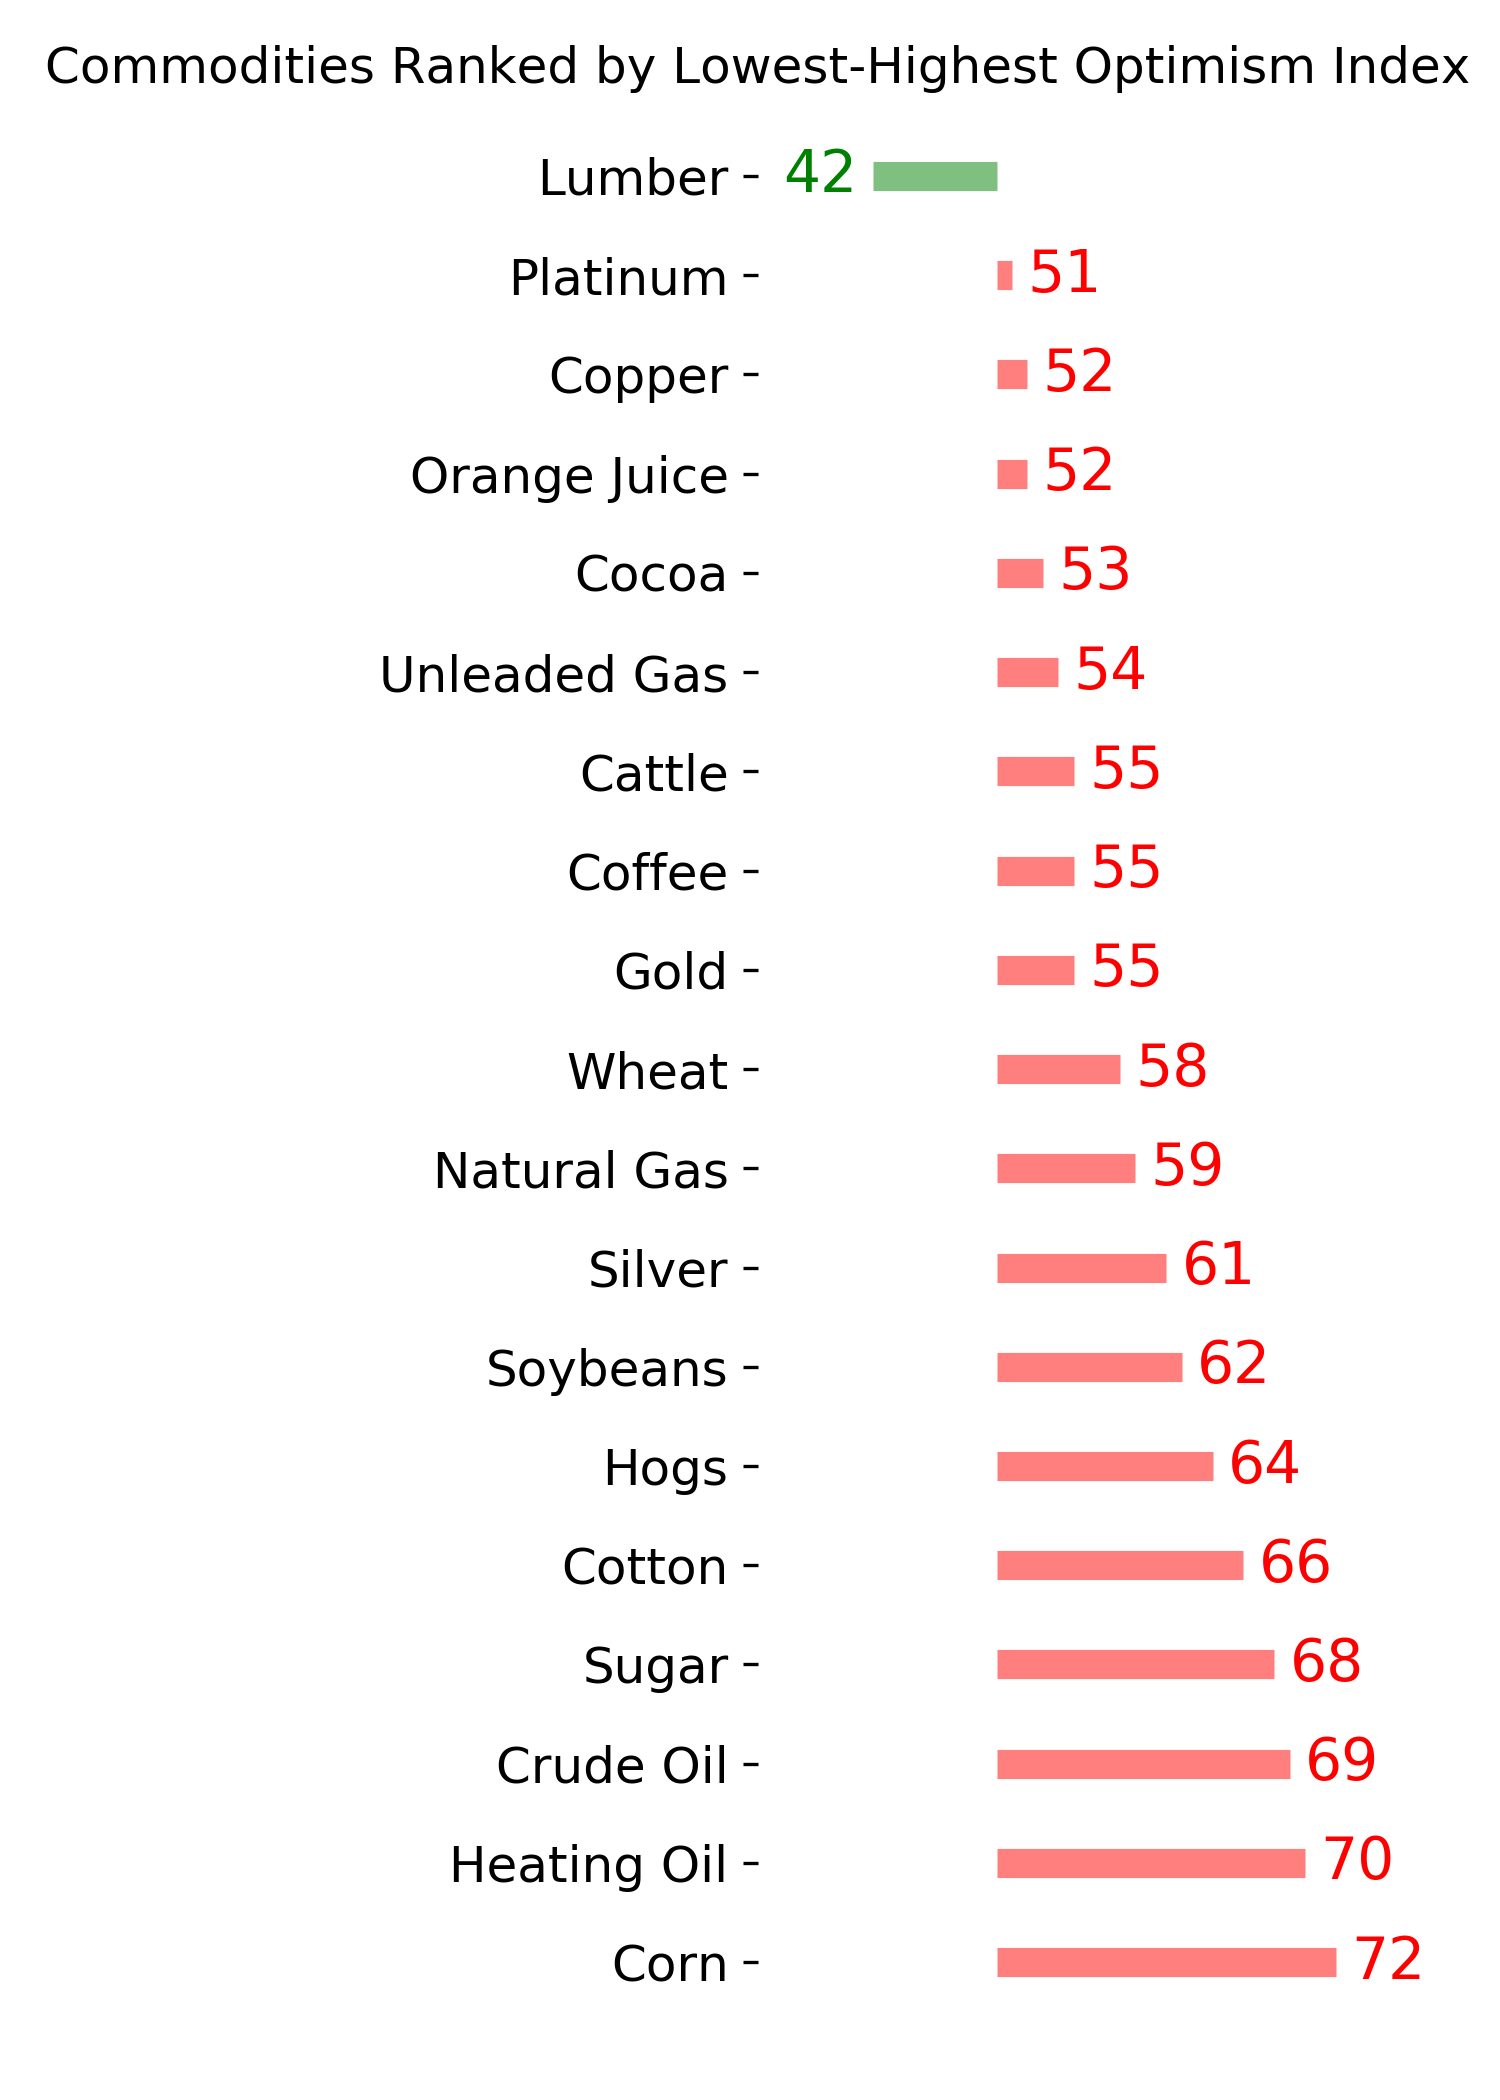
Commodity ETF's - 5-Day Moving Average
|
|