Headlines
|
|
The S&P suffers a weekly reversal, then enjoys a daily one:
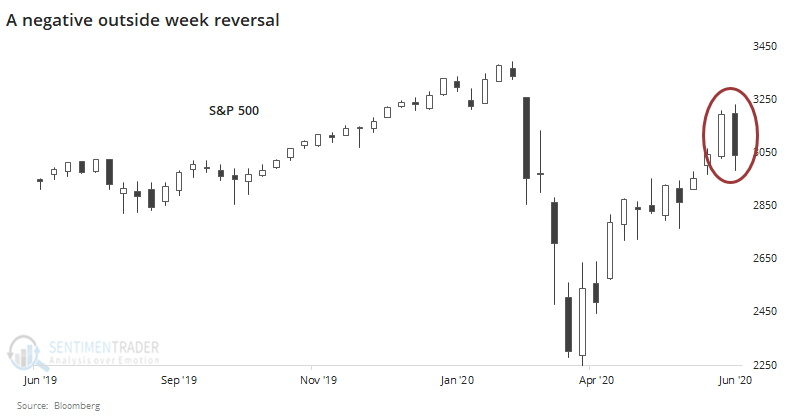
Last week, the S&P 500 suffered a negative outside reversal. It rallied above the prior week's high, then fell below the prior week's low, and a lower close as well. These have indicated exhausted buying pressure in the past, with a short-term bias. It tried to erase that with a large positive intraday reversal on Monday.
Speculative options activity becomes even more astounding:
Last week, speculative options activity moved to another record. The last few weeks have seen activity that far surpasses the previous record at the peak in February. Speculation was rampant among all traders but was especially extreme among the smallest of them. They bought a record number of calls versus puts and paid record premiums for them.
Weight of the evidence: The suggestion is flat/lower prices short- to medium-term, and higher prices long-term. Indicators are currently showing excessive optimism, with Dumb Money Confidence was recently near 80% and hasn't declined much despite 3 days of lower lows. Monday's reversal didn't change the odds much at all. The Active Studies show that when we look at stocks from various perspectives, there is a heavy positive skew over the medium-term long-term. Recently, there have been troubling signs of reckless speculation, but the breadth thrusts and recoveries have an almost unblemished record at preceding higher prices over a 6-12 month time frame. Indicators and studies for other markets are mixed with no strong conclusion.
|
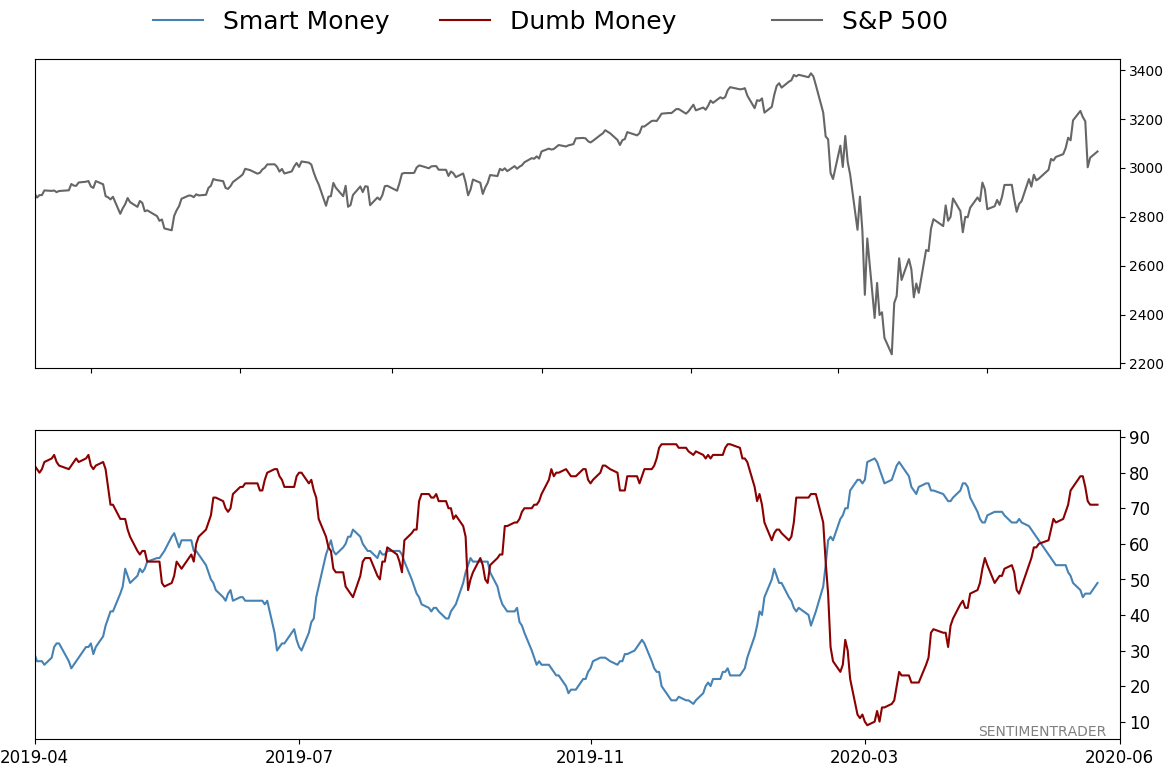
Smart / Dumb Money Confidence
|
Smart Money Confidence: 49%
Dumb Money Confidence: 71%
|
|
Risk Levels
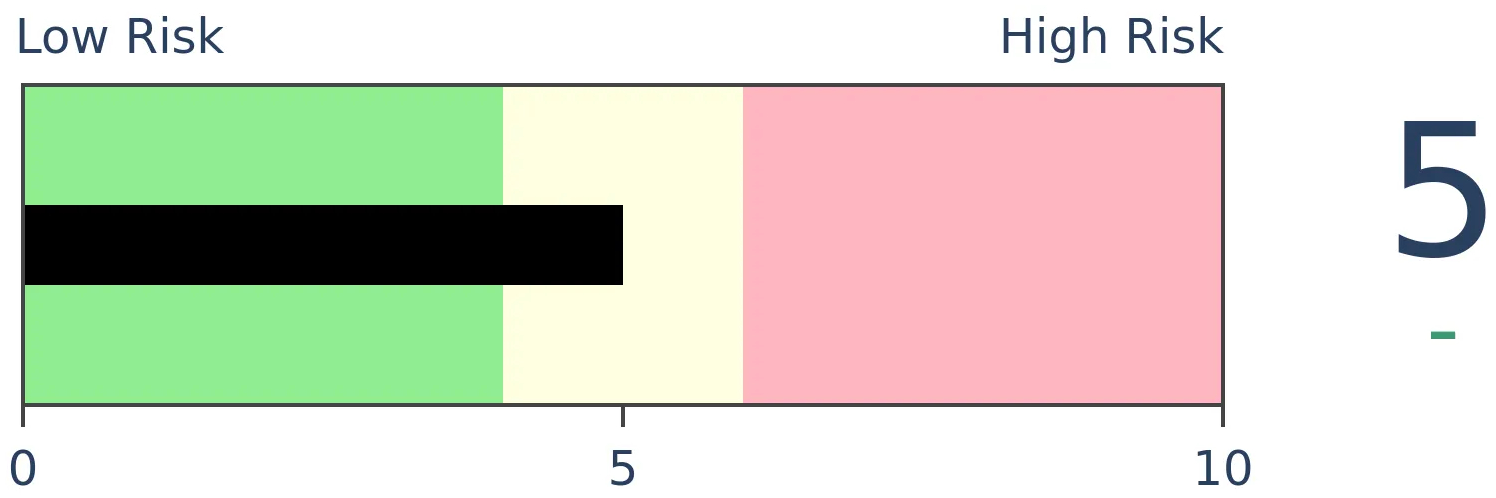
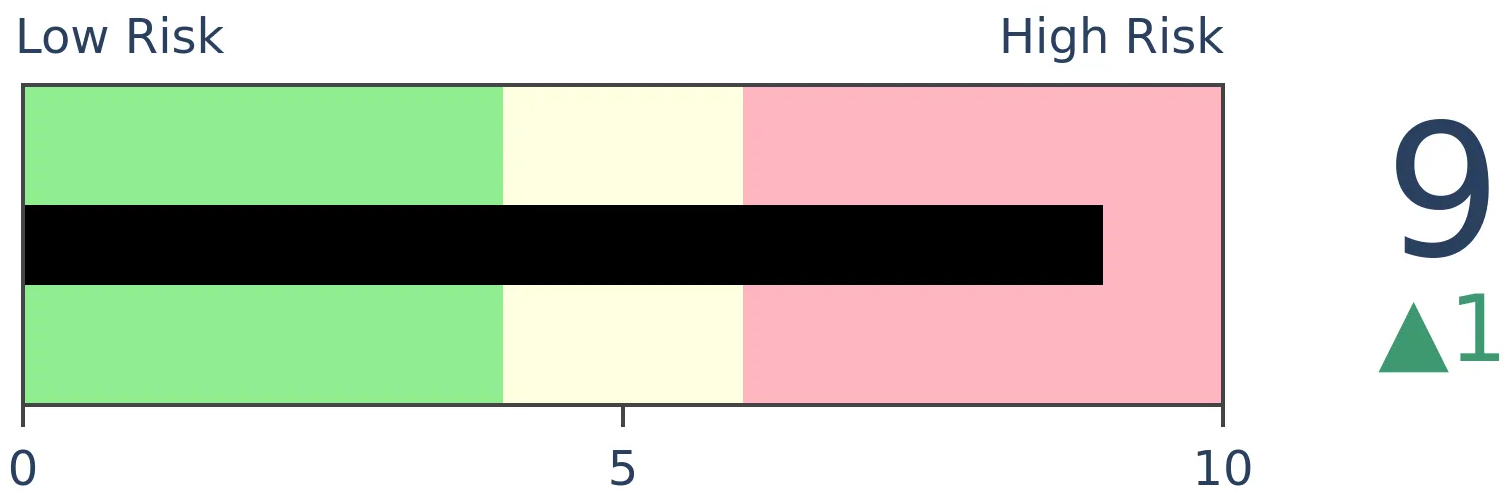
Stocks Short-Term
|
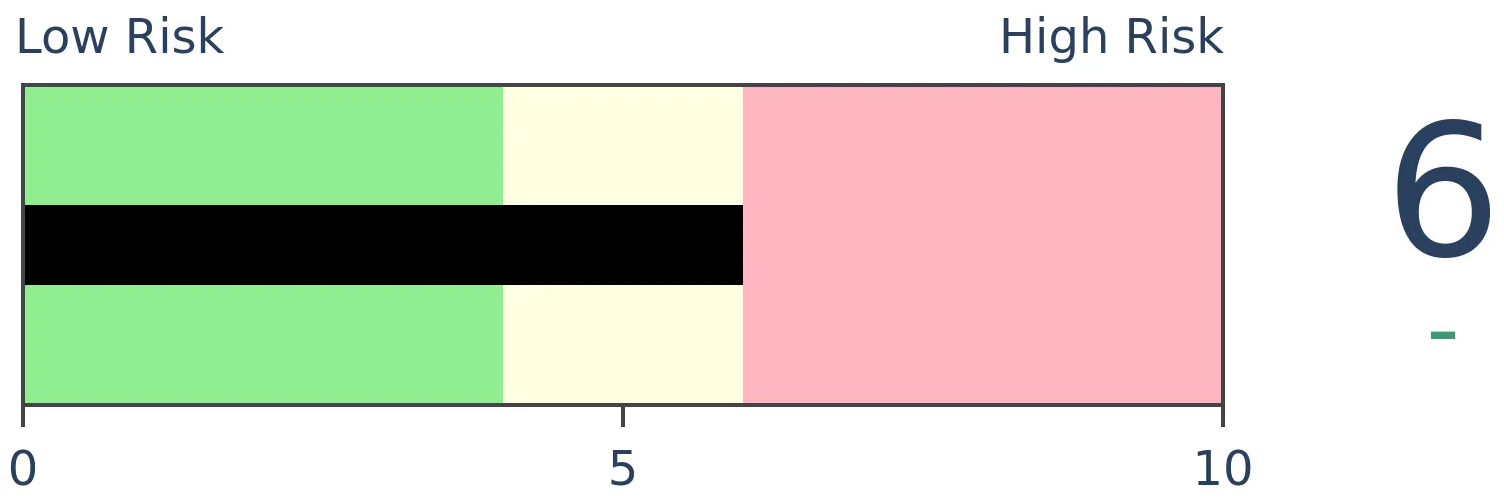
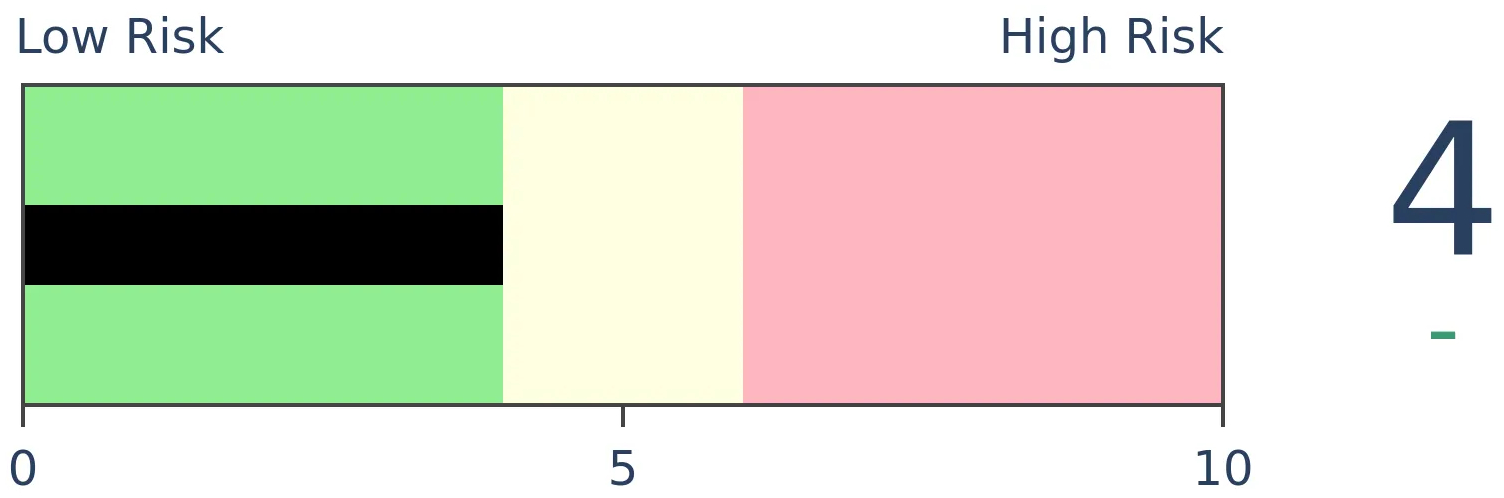
Stocks Medium-Term
|
|
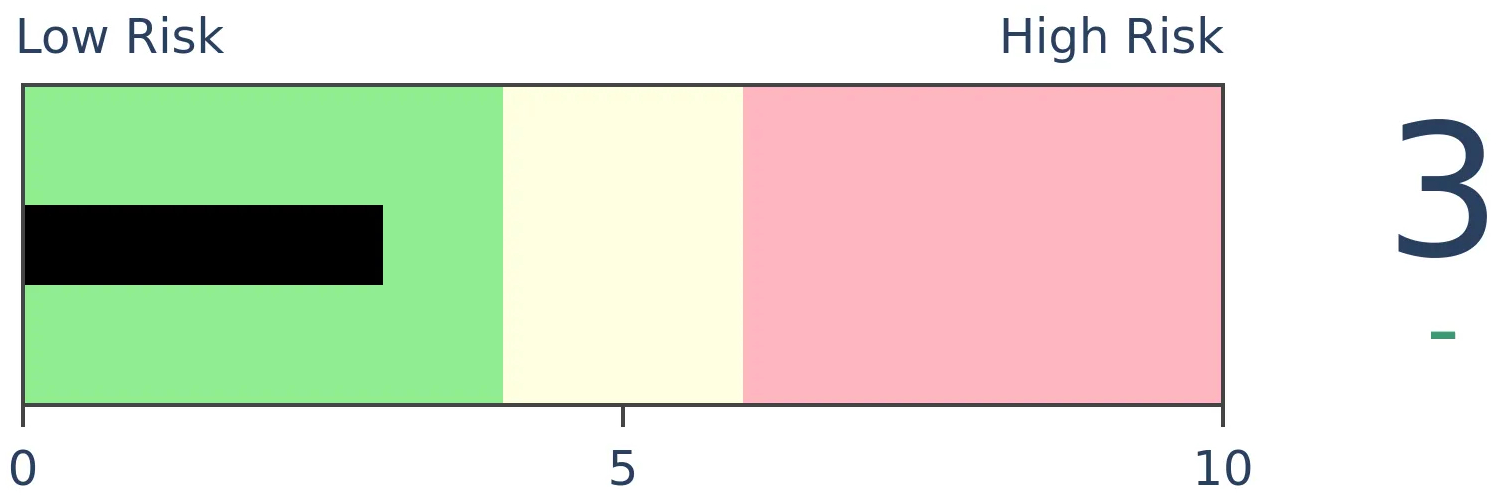
Bonds
|
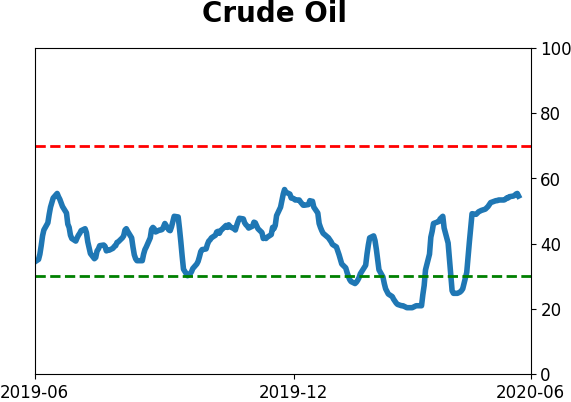
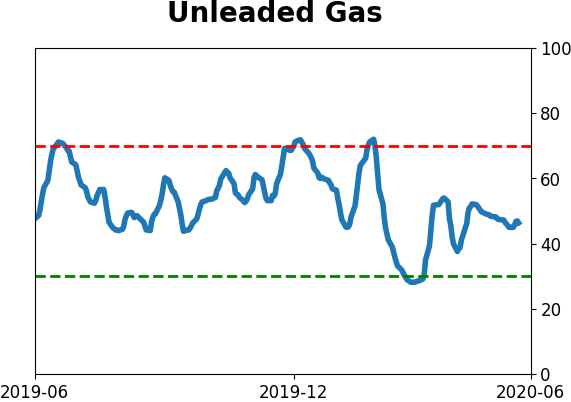
Crude Oil
|
|
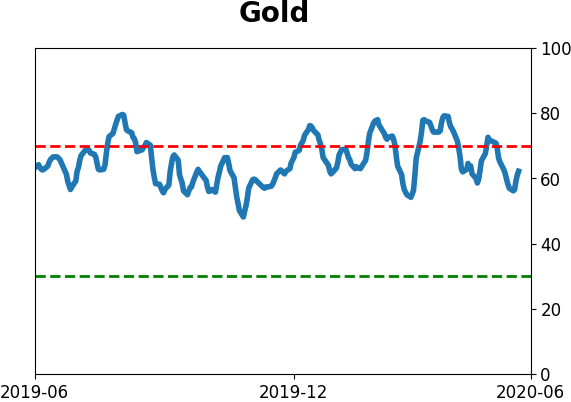
Gold
|
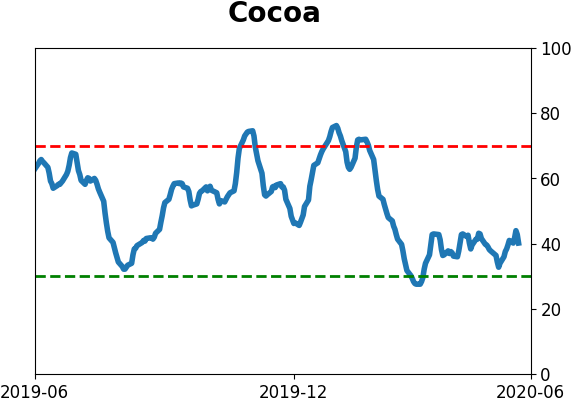
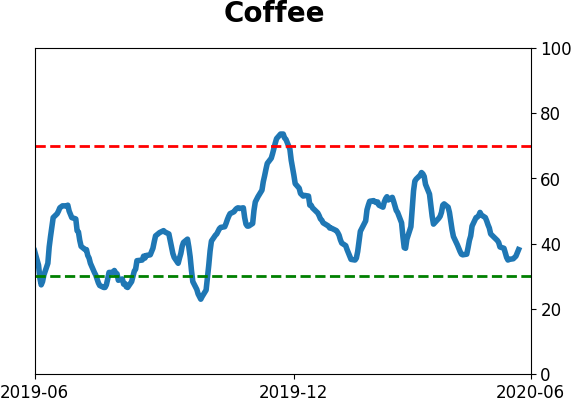
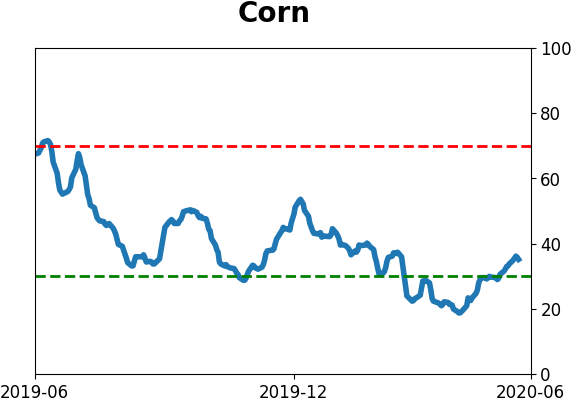
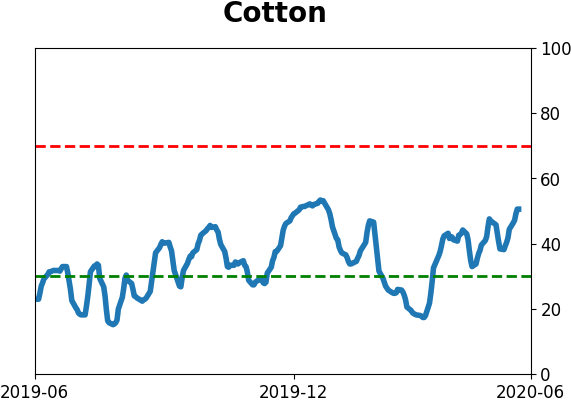
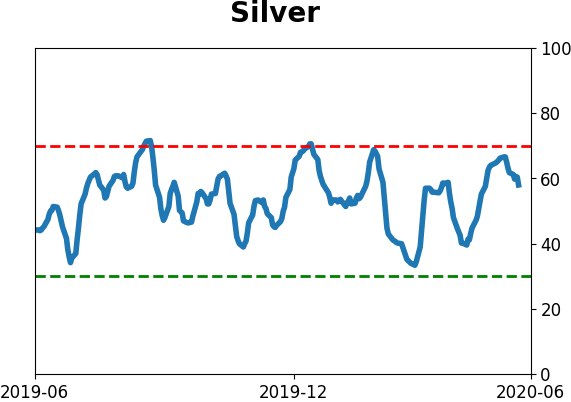
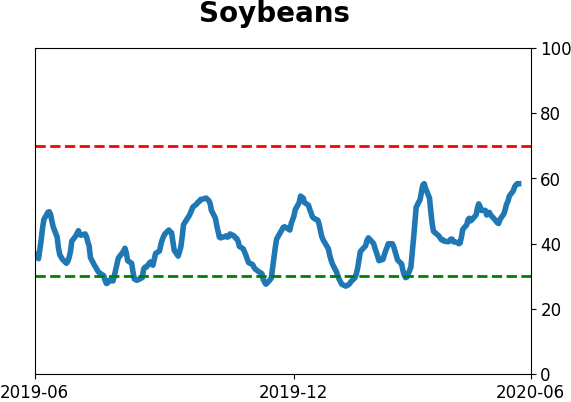
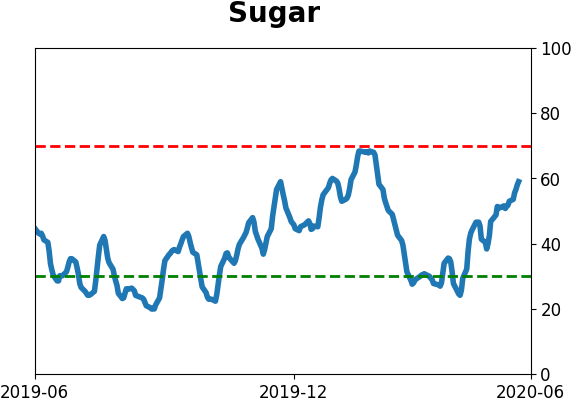
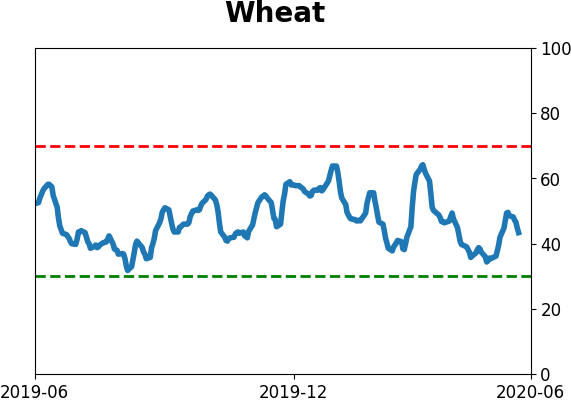
Agriculture

|
|
Research
BOTTOM LINE
Last week, the S&P 500 suffered a negative outside reversal. It rallied above the prior week's high, then fell below the prior week's low, and a lower close as well. These have indicated exhausted buying pressure in the past, with a short-term bias. It tried to erase that with a large positive intraday reversal on Monday.
FORECAST / TIMEFRAME
None
|
Based on price action alone, last week did not look promising for the most benchmarked index in the world. It suffered what most would consider a negative outside reversal week, typically taken as a sign of exhausted buyers.
To clarify exactly what we're looking at, we can go back to 1962 and look for any week that had:
- A higher high than the prior week
- A lower low than the prior week
- A lower close than the prior week
Using those definitions, we get the following returns going forward. To wrap some context around the reversals, we'll only include those weeks where the high was the highest in at least 12 weeks, but not so high that it was the highest in the past 52 weeks. These capture medium-term rallies within longer-term falling or gyrating markets.
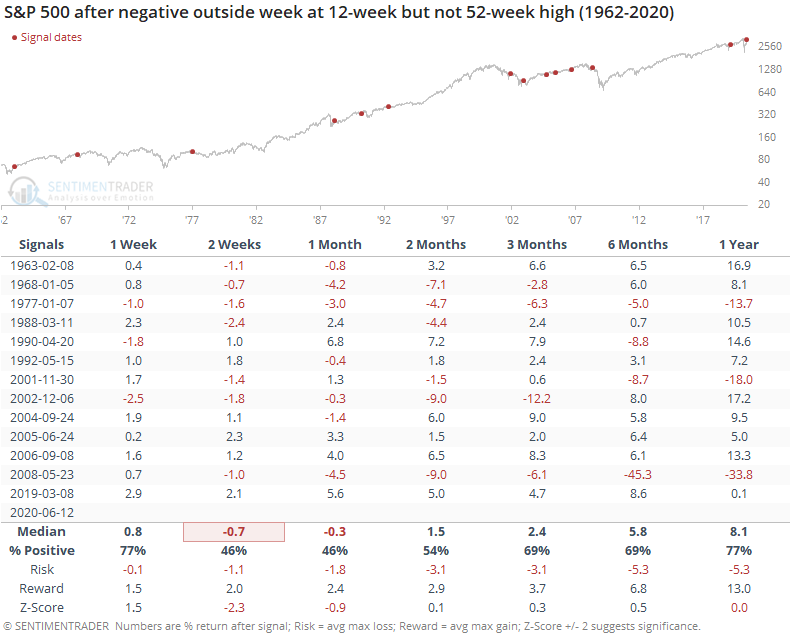
These patterns were decent at showing a slight headwind in the shorter-term. Up to two months later, risk was higher than reward, but overall returns were about in line with random after the first month. There also was not a consistent bias toward weakness after that first month. We'd rate the pattern as a slight shorter-term negative, but nothing beyond that.
Thanks perhaps to the latest Federal Reserve announcement on buying individual bonds, the S&P enjoyed a very large positive reversal, not quite an "outside up day" but it was close. It erased more than a 2% decline to close positive on the day.
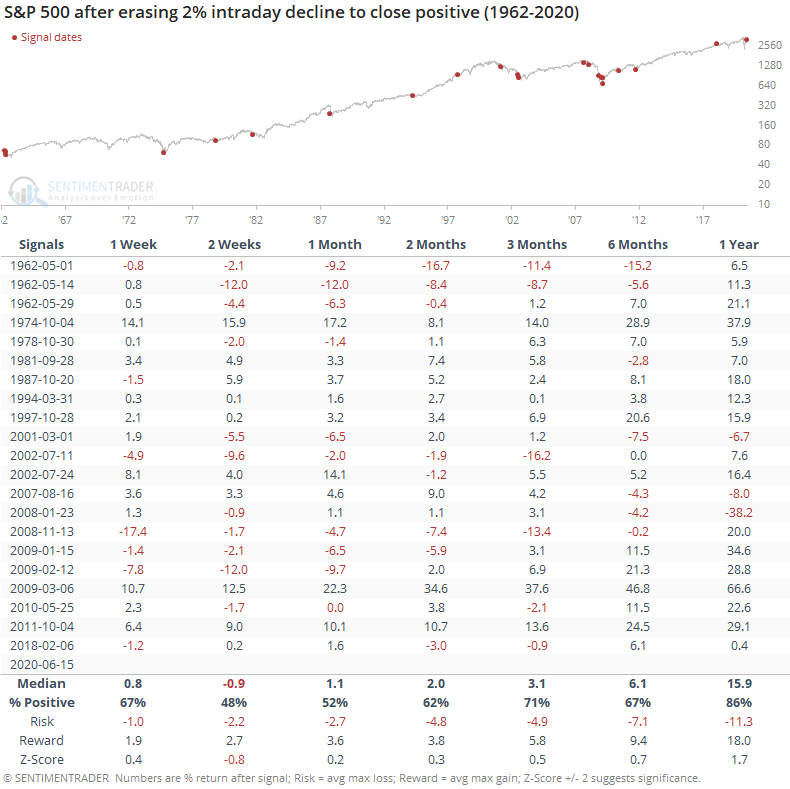
While it always looks impressive on a chart and gets people excited, it wasn't that great of a predictor. Returns over the next two weeks were negative, then slightly positive. Across most time frames, it wasn't far from random, with a z-score below 1 up to six months later.
Overall, there isn't much here to get too excited about on a daily basis, and maybe just a little bit to get negative about over the next couple of weeks.
BOTTOM LINE
Last week, speculative options activity moved to another record. The last few weeks have seen activity that far surpasses the previous record at the peak in February. Speculation was rampant among all traders but was especially extreme among the smallest of them. They bought a record number of calls versus puts and paid record premiums for them.
FORECAST / TIMEFRAME
SPY -- Down, Medium-Term
|
Over the past few weeks, we've looked at the high and increasing amount of speculative activity among options traders, particularly the smallest of them that transact 10 contracts or less.
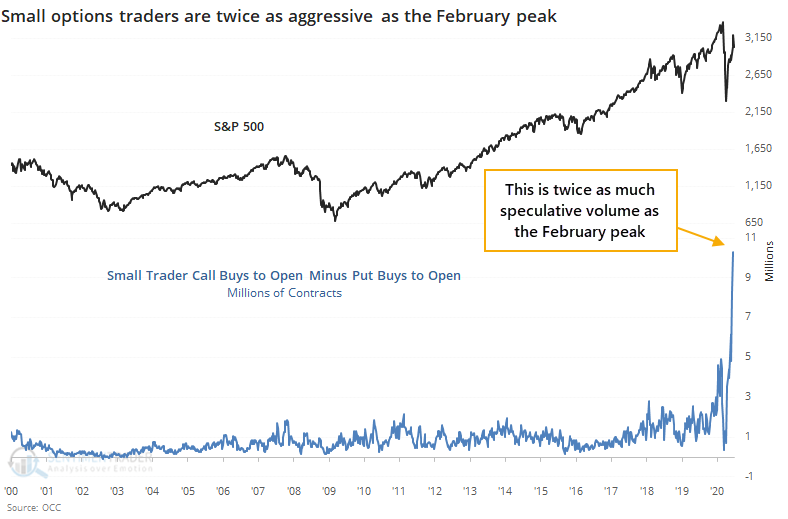
As stocks rose 3% or more each week, it was kinda-sorta understandable. But last week, stocks suffered high volatility and a big decline on Thursday, coupled with a mostly-failed rally attempt on Friday. That did not put off speculative traders - in fact, it emboldened them.
Last week, the net speculative activity (calls bought to open minus puts bought to open) of the smallest of traders was more than twice as extreme as it was at the peak in February.
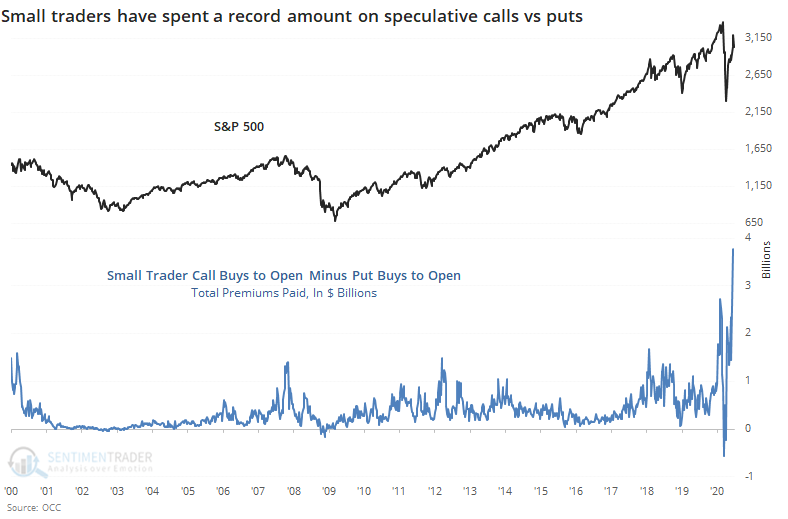
They spent nearly $4 billion more in premiums on these calls relative to the premiums they paid on puts.
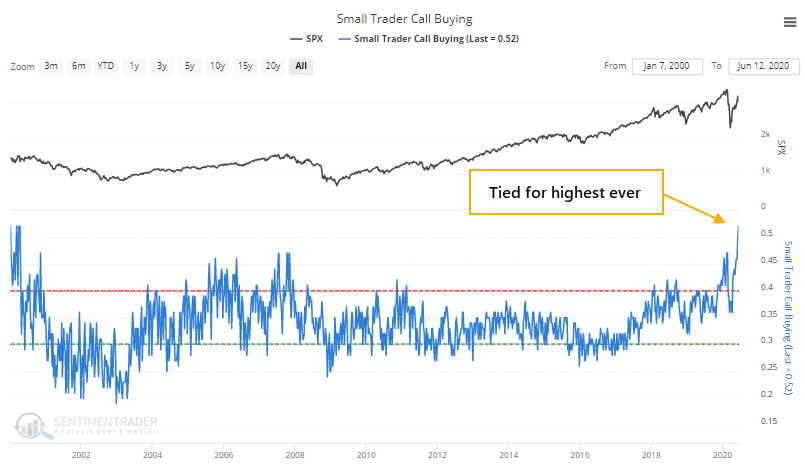
Using relative percentages, small traders spent 52% of their volume on buying call options to open. This is a record high, tied with the most extreme weeks in 2000.
Speculation wasn't rampant only among the smallest of traders. Even the largest of them, trading 50 or more contracts at a time, focused to a near-record degree on speculative calls.
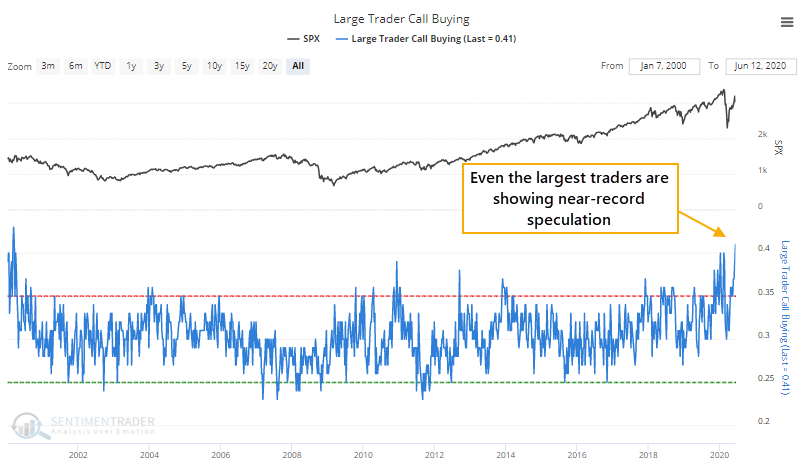
Among all traders, there were approximately 22 million more calls bought to open than puts. This is astounding.
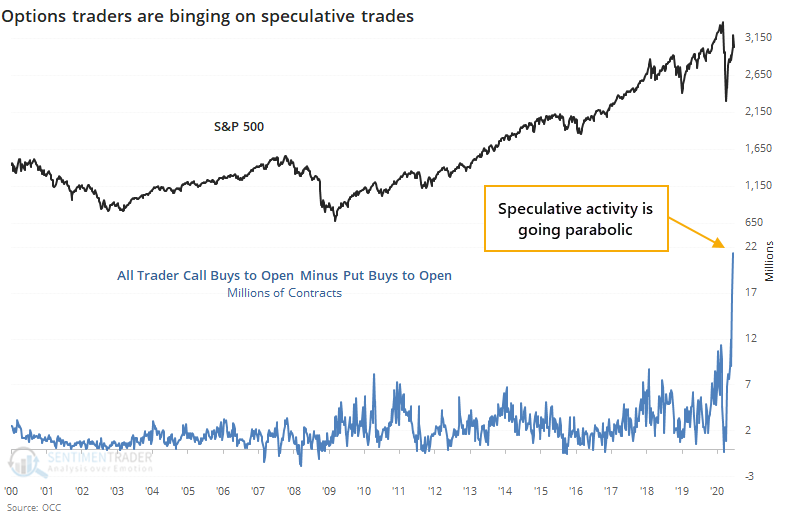
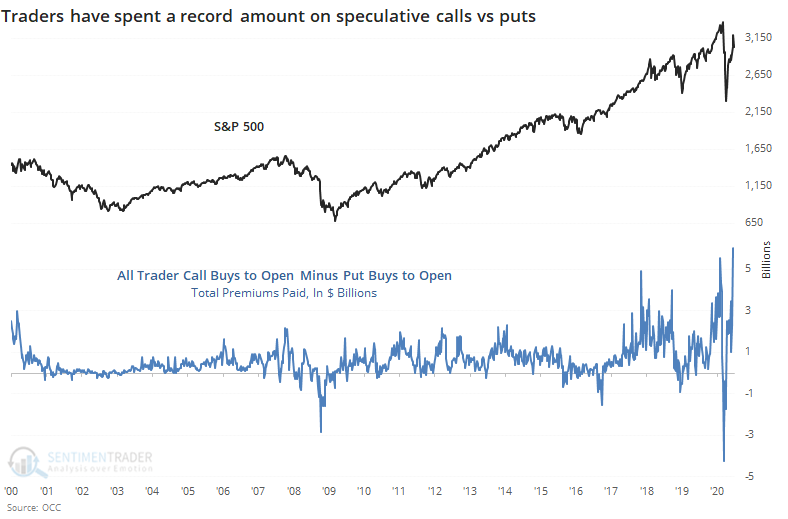
They spent over $6 billion more on calls than puts.
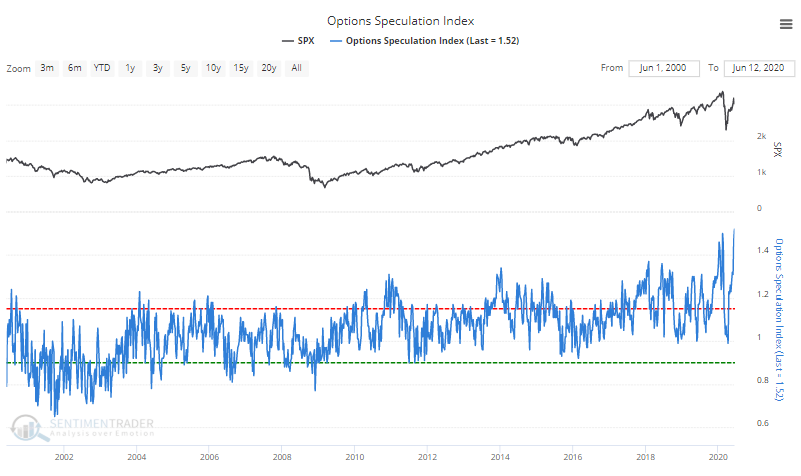
The Options Speculation Index, which is the most comprehensive look at how traders allocated their volume across speculative versus hedging activity, moved to the highest level since a few weeks in the year 2000.
Maybe the legions of new traders have spawned some kind of perverse front-running scheme among hedge funds, which are breaking their trades into tiny pieces and skewing this data. That's doubtful. More likely, it's a hoard of new traders stuck at home who have seen stocks only go up for months on end. This has never ended well and remains a large risk over the short- to medium-term.
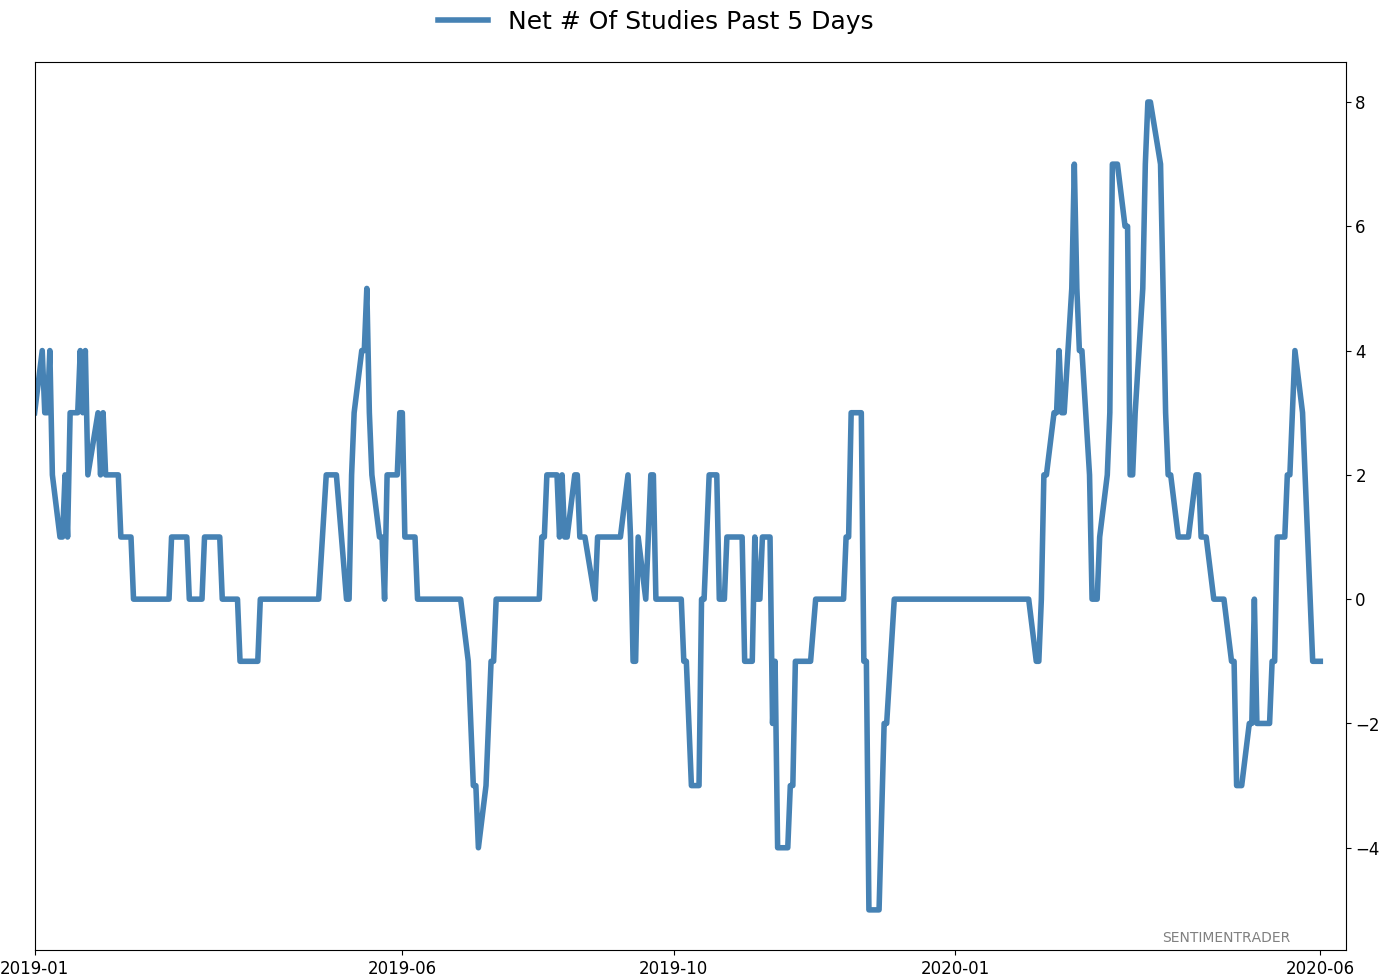
Active Studies
| Time Frame | Bullish | Bearish | | Short-Term | 0 | 1 | | Medium-Term | 8 | 6 | | Long-Term | 40 | 1 |
|
Indicators at Extremes
Portfolio
| Position | Weight % | Added / Reduced | Date | | Stocks | 29.8 | Reduced 9.1% | 2020-06-11 | | Bonds | 0.0 | Reduced 6.7% | 2020-02-28 | | Commodities | 5.2 | Added 2.4%
| 2020-02-28 | | Precious Metals | 0.0 | Reduced 3.6% | 2020-02-28 | | Special Situations | 0.0 | Reduced 31.9% | 2020-03-17 | | Cash | 65.0 | | |
|
Updates (Changes made today are underlined)
In the first months of the year, we saw manic trading activity. From big jumps in specific stocks to historic highs in retail trading activity to record highs in household confidence to almost unbelievable confidence among options traders. All of that came amid a market where the average stock couldn't keep up with their indexes. There were signs of waning momentum in stocks underlying the major averages, which started triggering technical warning signs in late January. After stocks bottomed on the 23rd, they enjoyed a historic buying thrust and retraced a larger amount of the decline than "just a bear market rally" tends to. Those thrusts are the most encouraging sign we've seen in years. Through early June, we were still seeing thrusts that have led to recoveries in longer-term breadth metrics. The longer-term prospects for stocks (6-12 months) still look decent given the above. On a short- to medium-term basis, it was getting harder to make that case. Dumb Money Confidence spiked and there were multiple signs of a historic level of speculation. Given that, I reduced my exposure a bit when stocks gapped down and failed to hold the lows of late last week. This is likely the lowest I will go given what I still consider to be compelling positives over a longer time frame. There is not a slam-dunk case to be made for either direction, so it will seem like a mistake whether stocks keep dropping (why didn't I sell more?) or if they turn and head higher (why did I let short-term concerns prevail?). After nearly three decades of trading, I've learned to let go of the idea of perfection.
RETURN YTD: -6.2% 2019: 12.6%, 2018: 0.6%, 2017: 3.8%, 2016: 17.1%, 2015: 9.2%, 2014: 14.5%, 2013: 2.2%, 2012: 10.8%, 2011: 16.5%, 2010: 15.3%, 2009: 23.9%, 2008: 16.2%, 2007: 7.8%
|
|
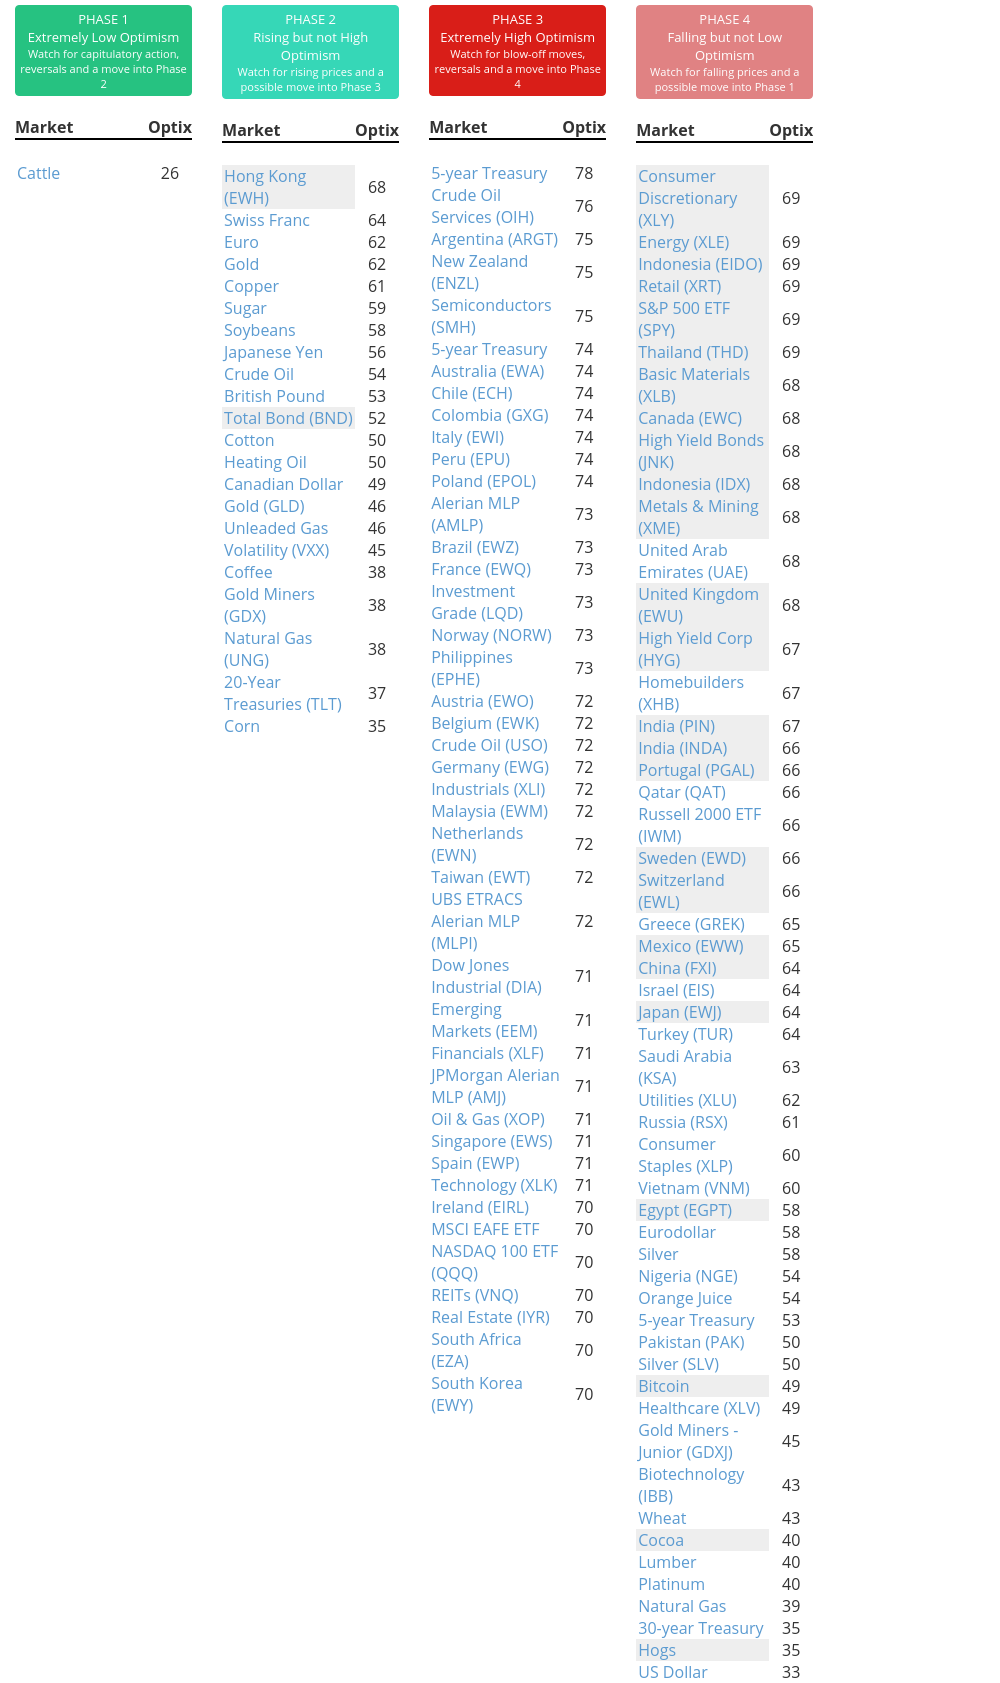
Phase Table
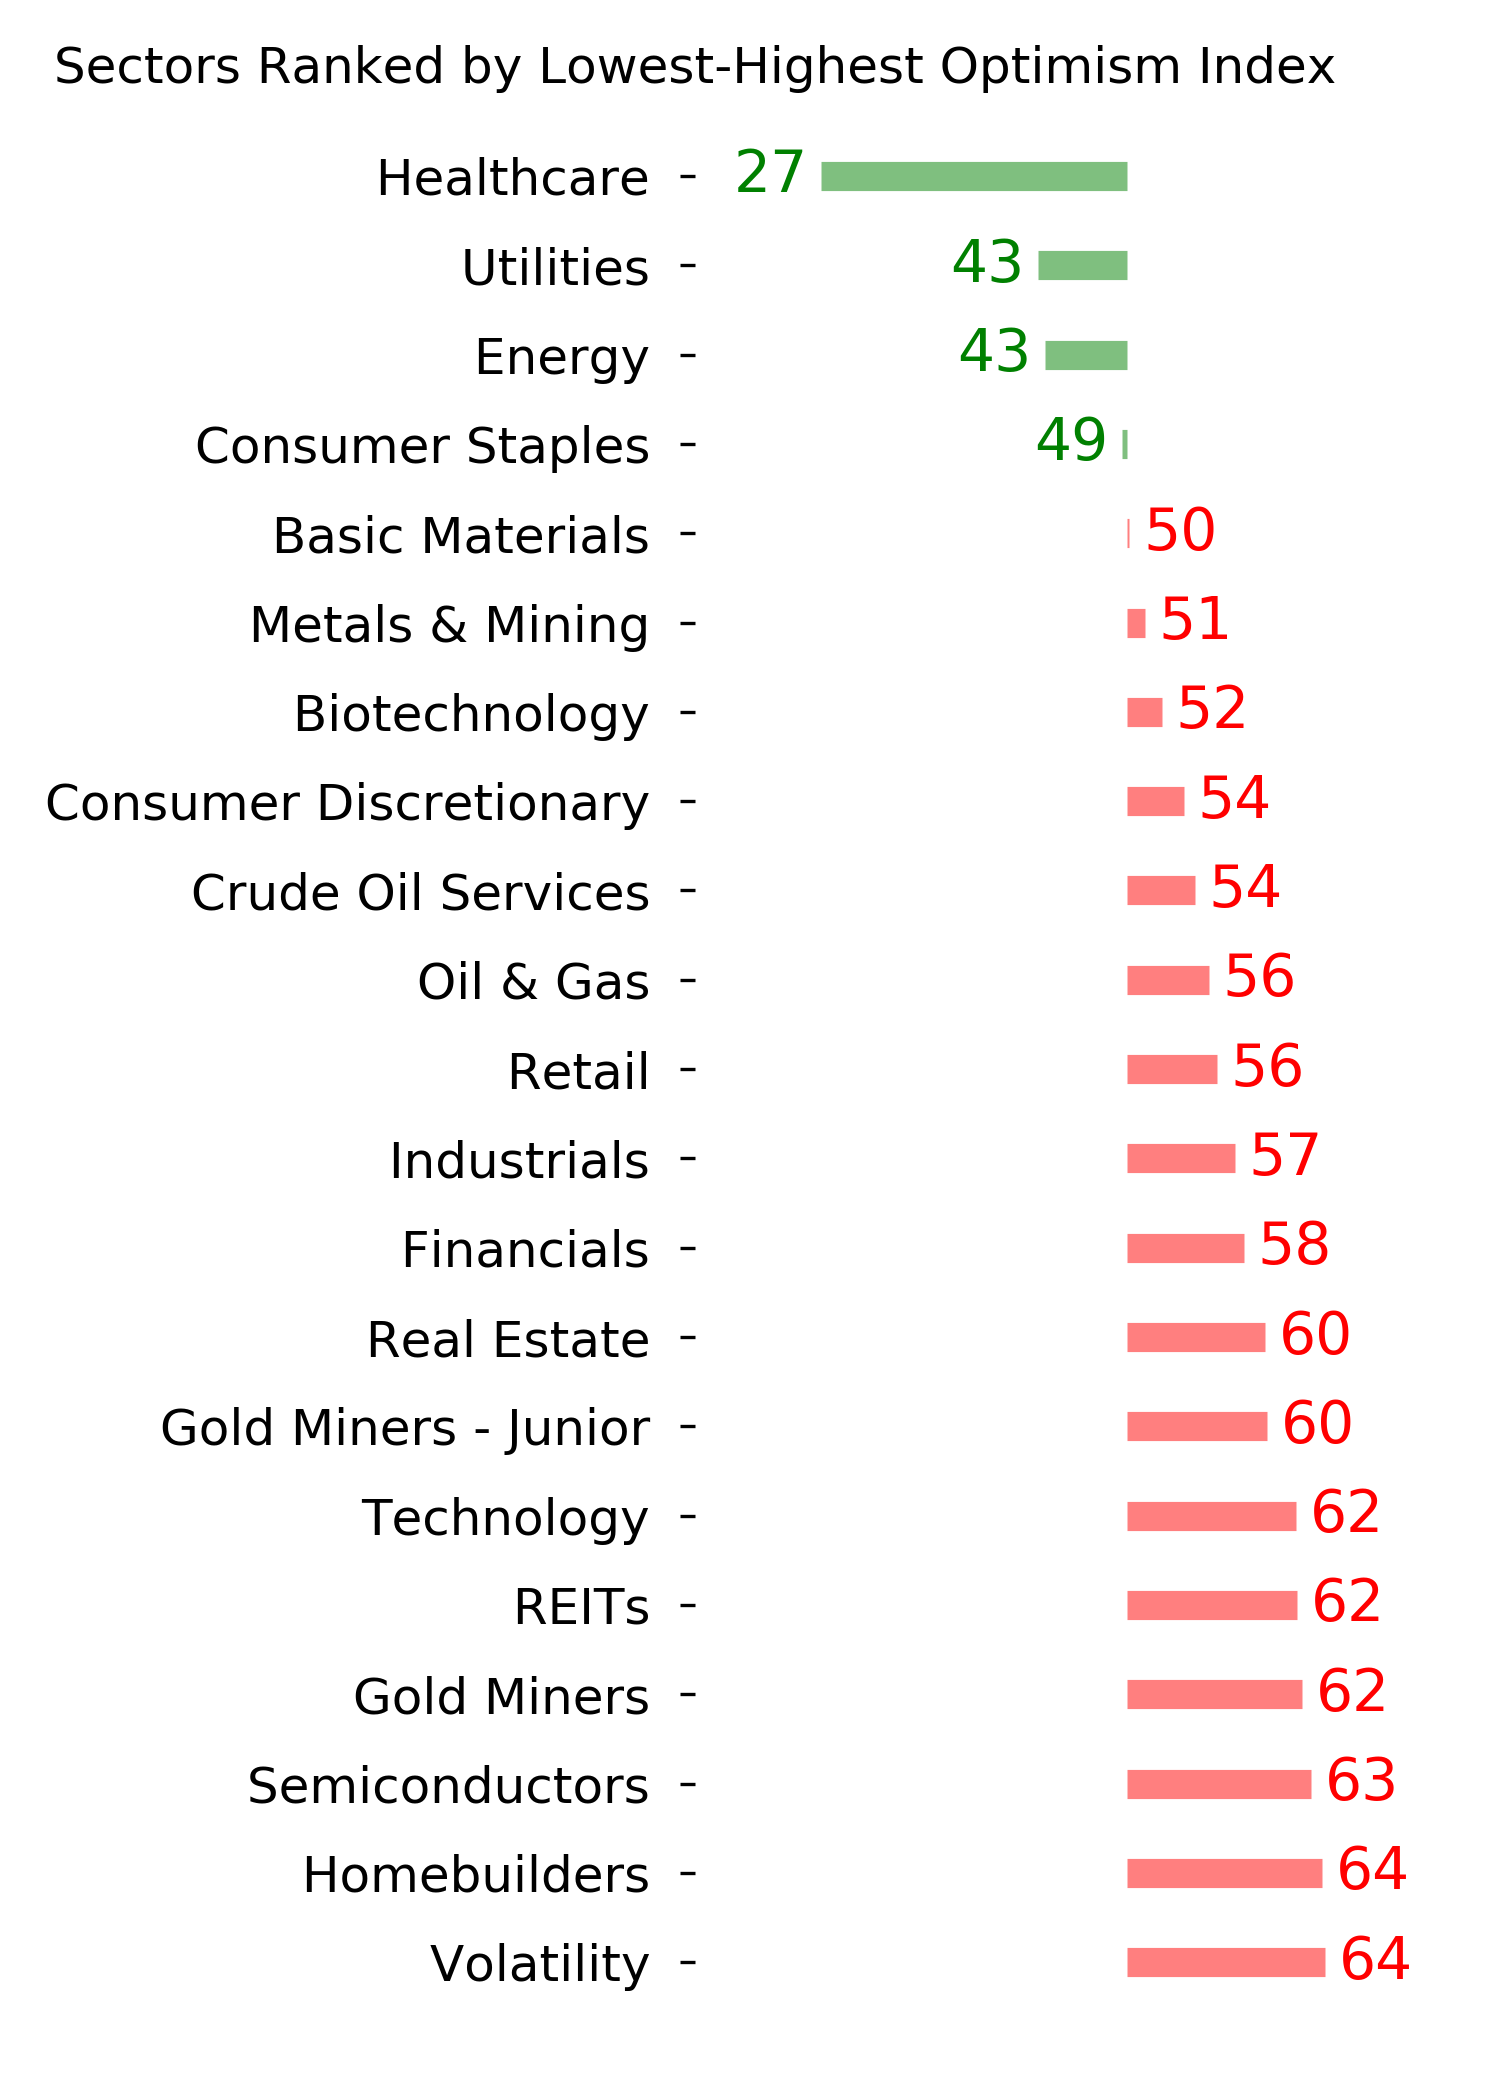
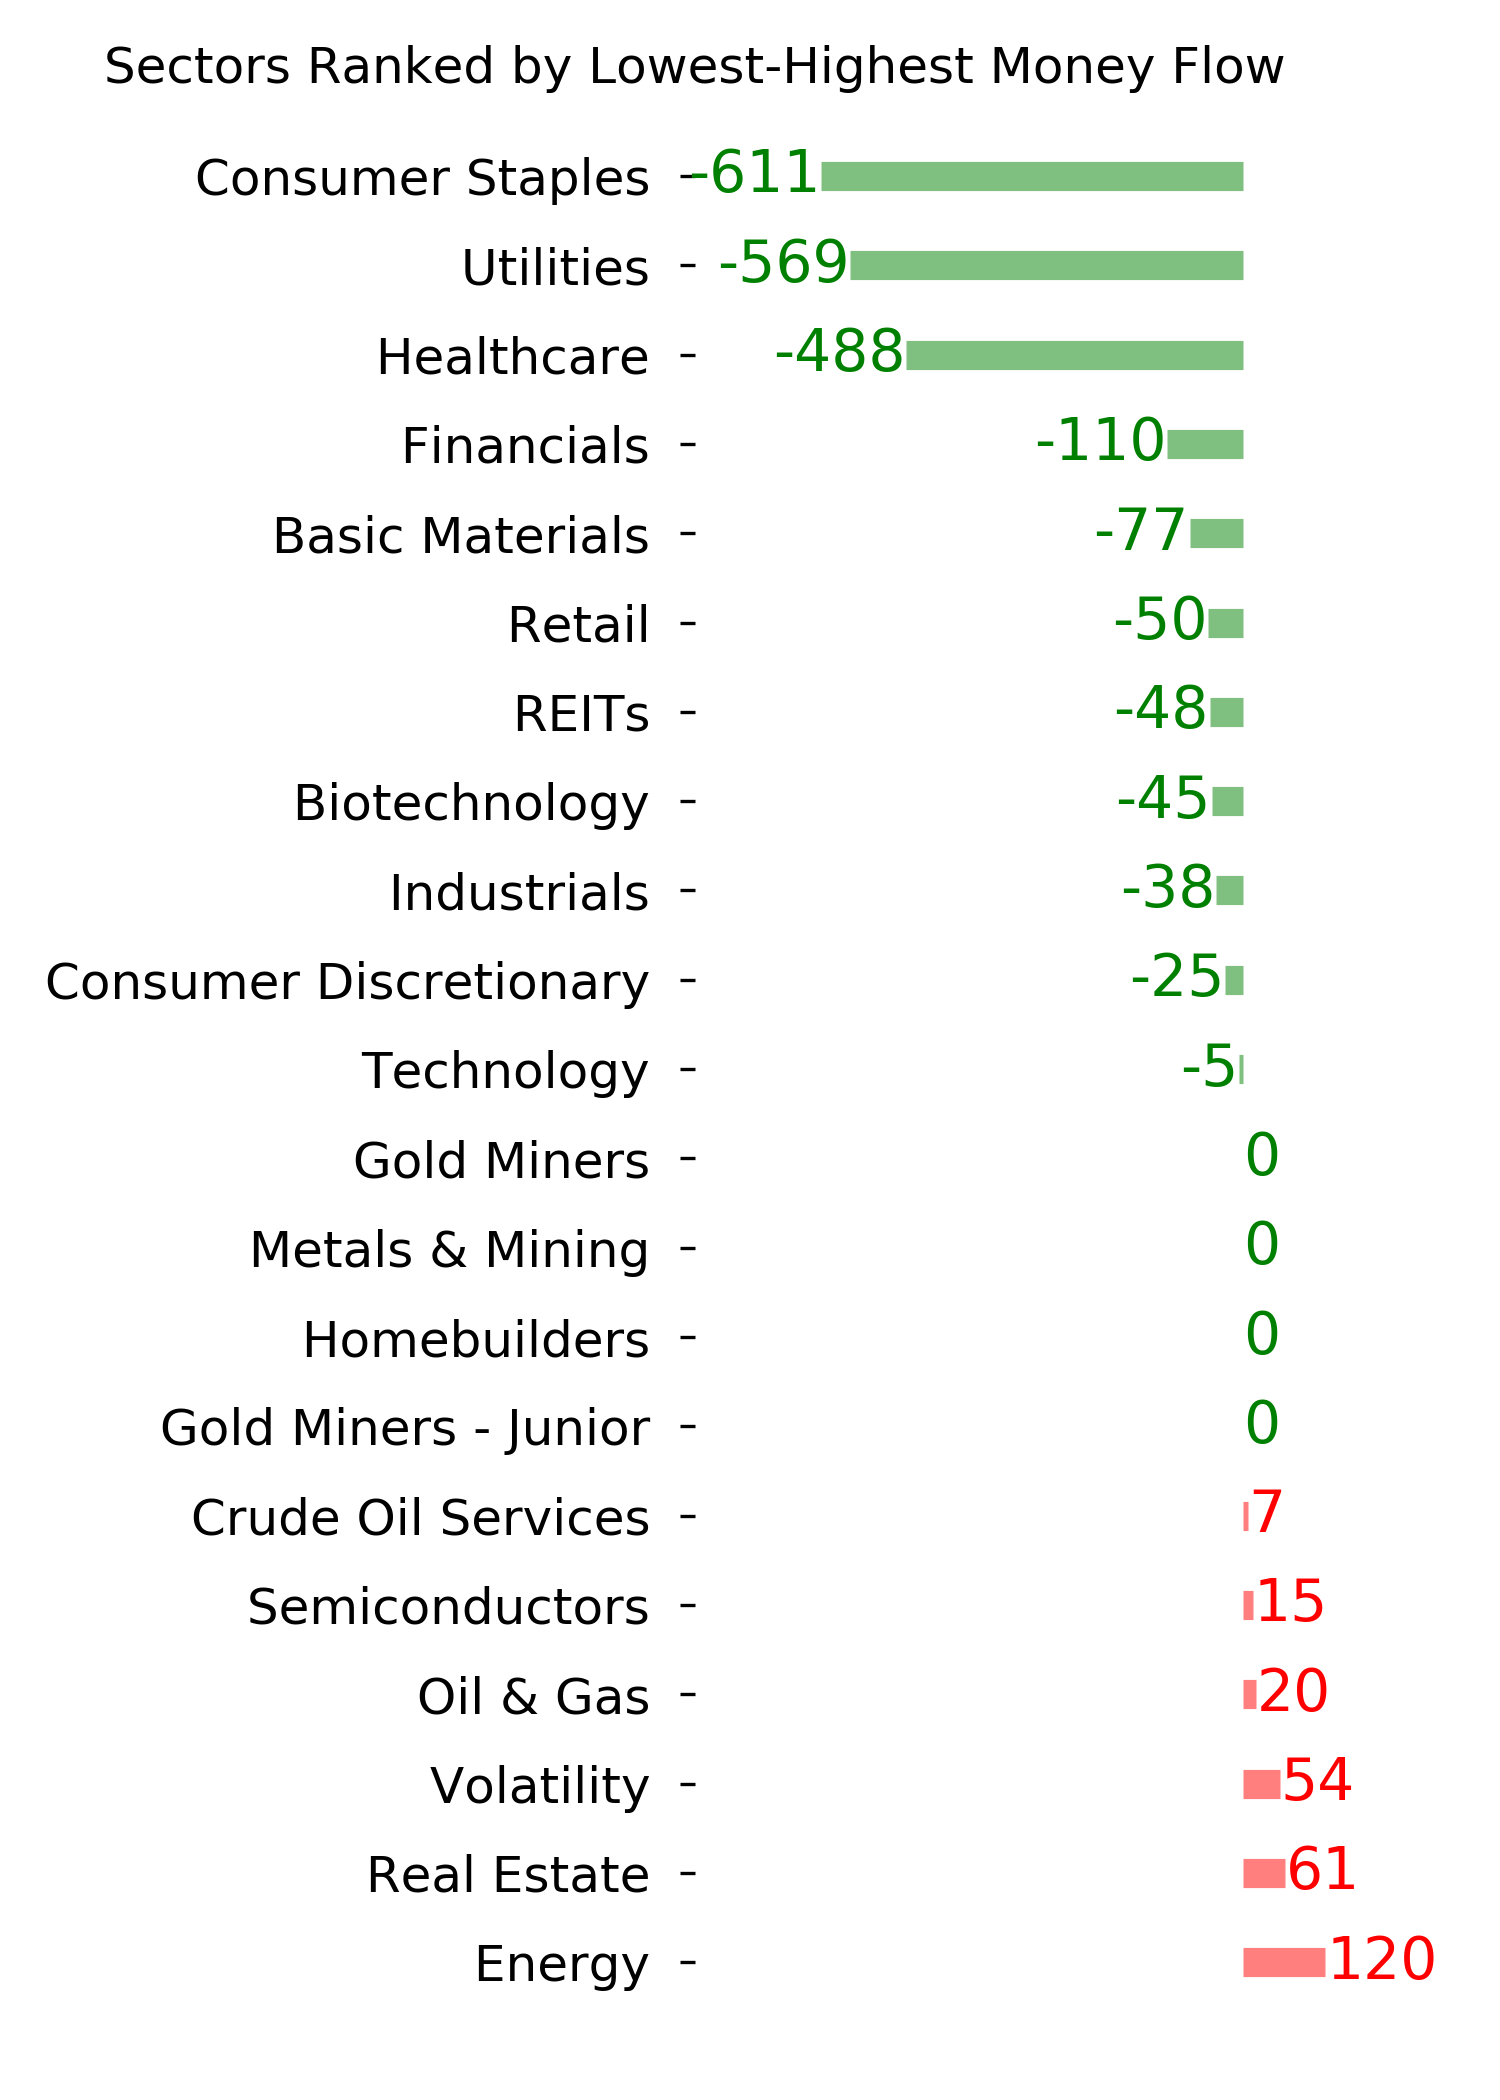
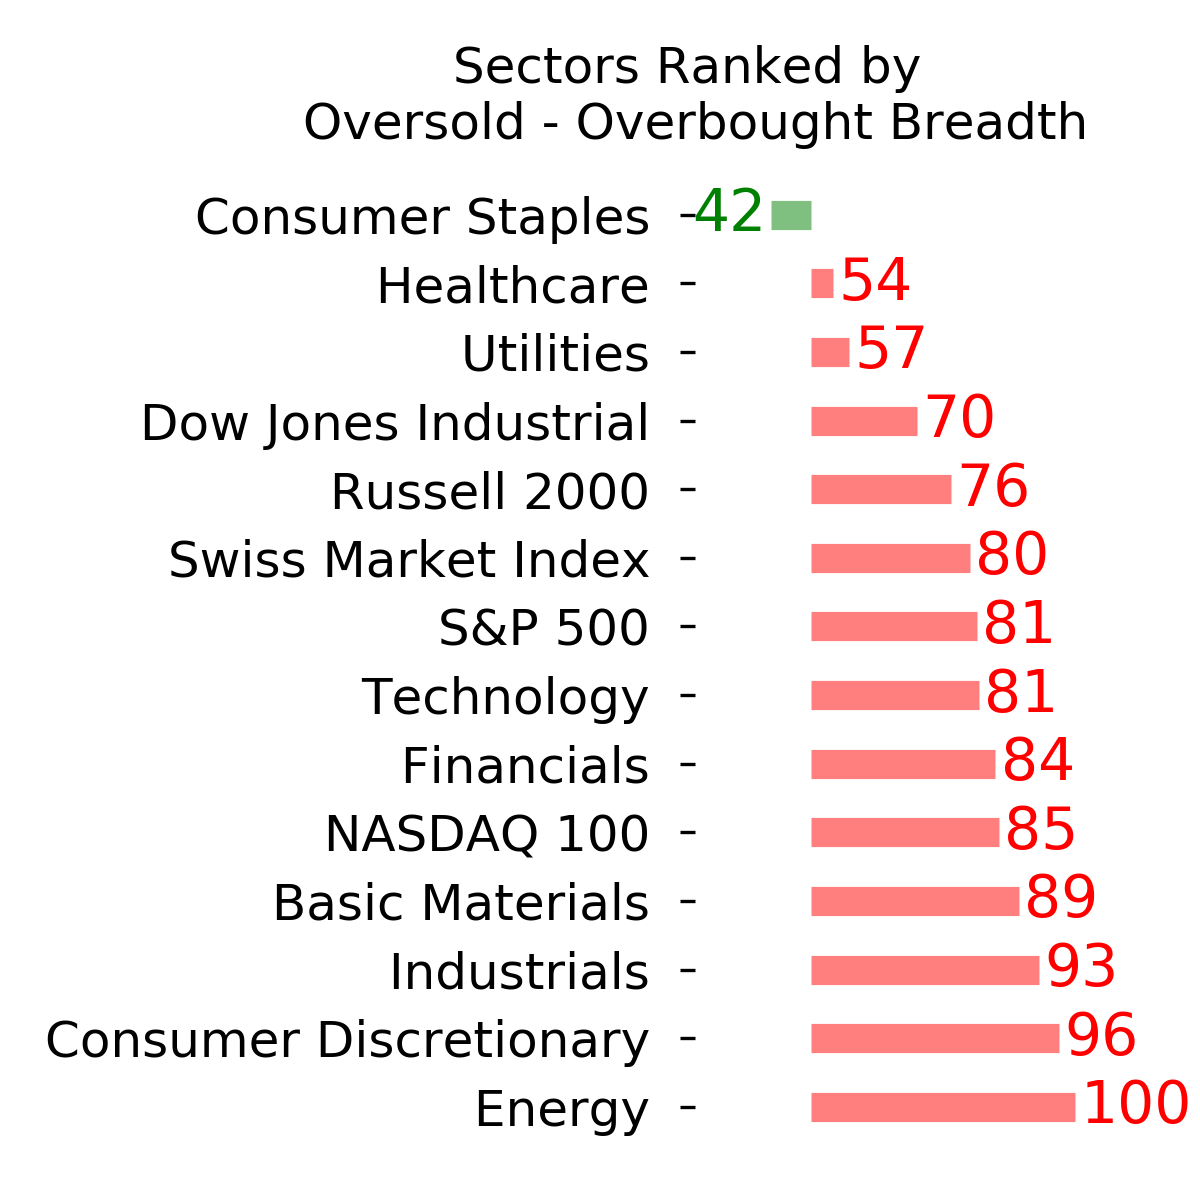
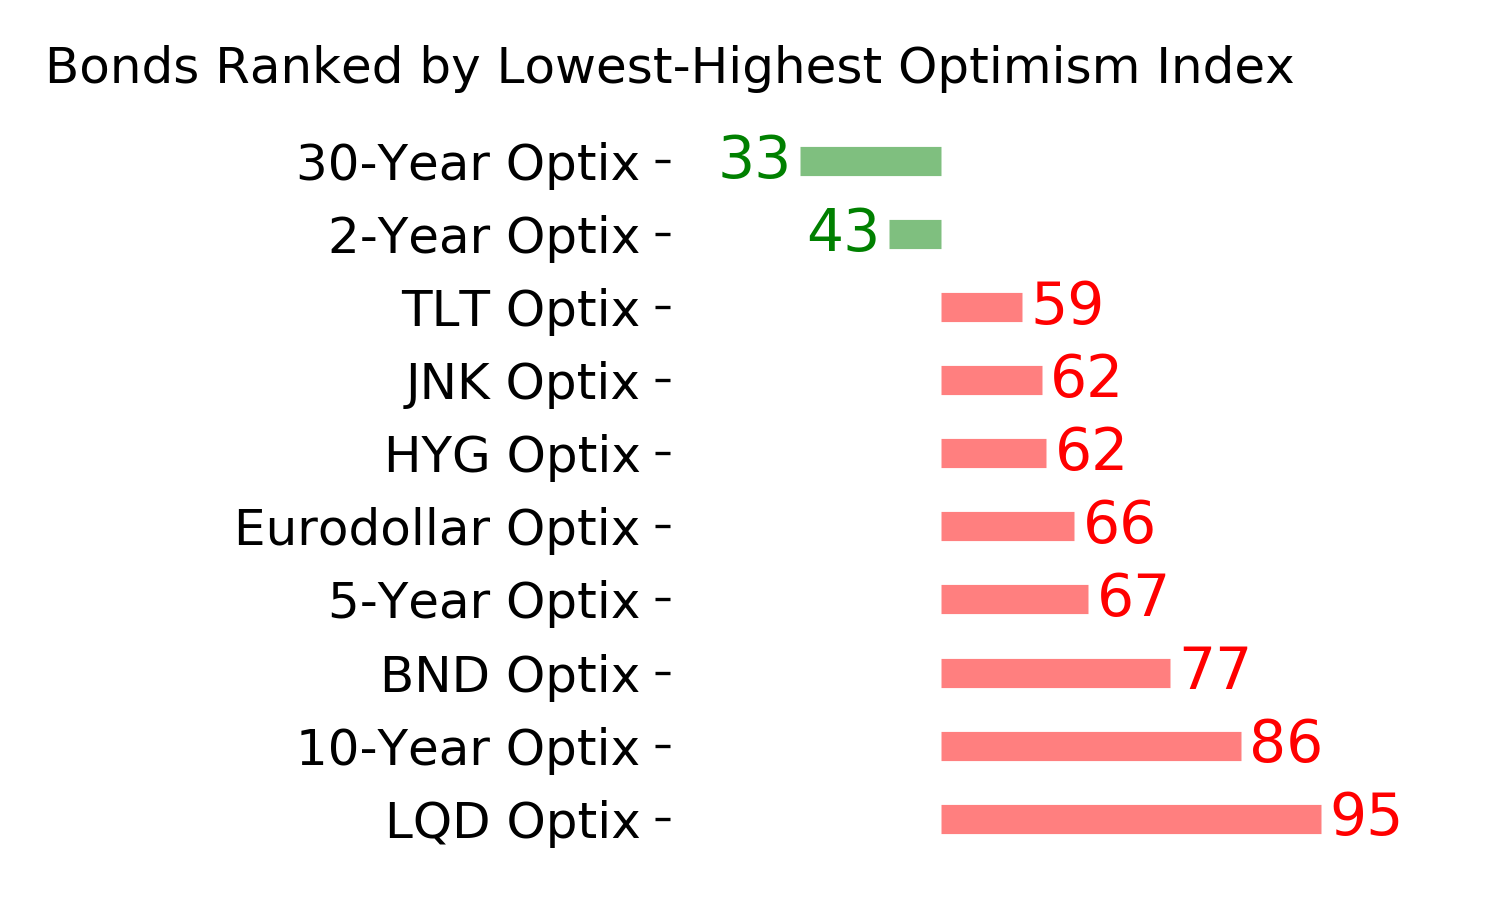
Ranks
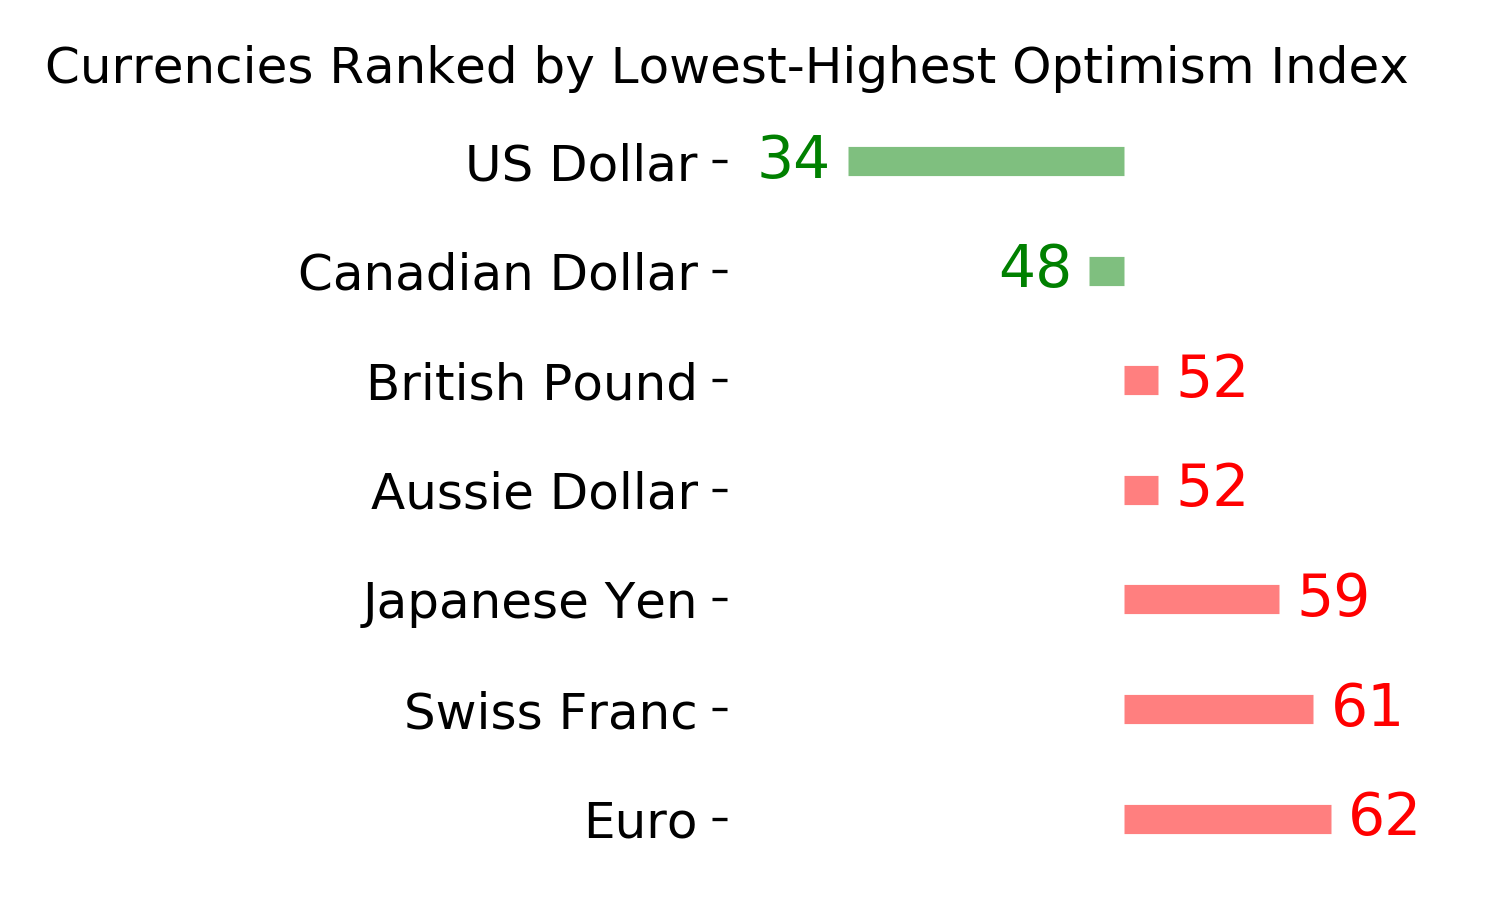
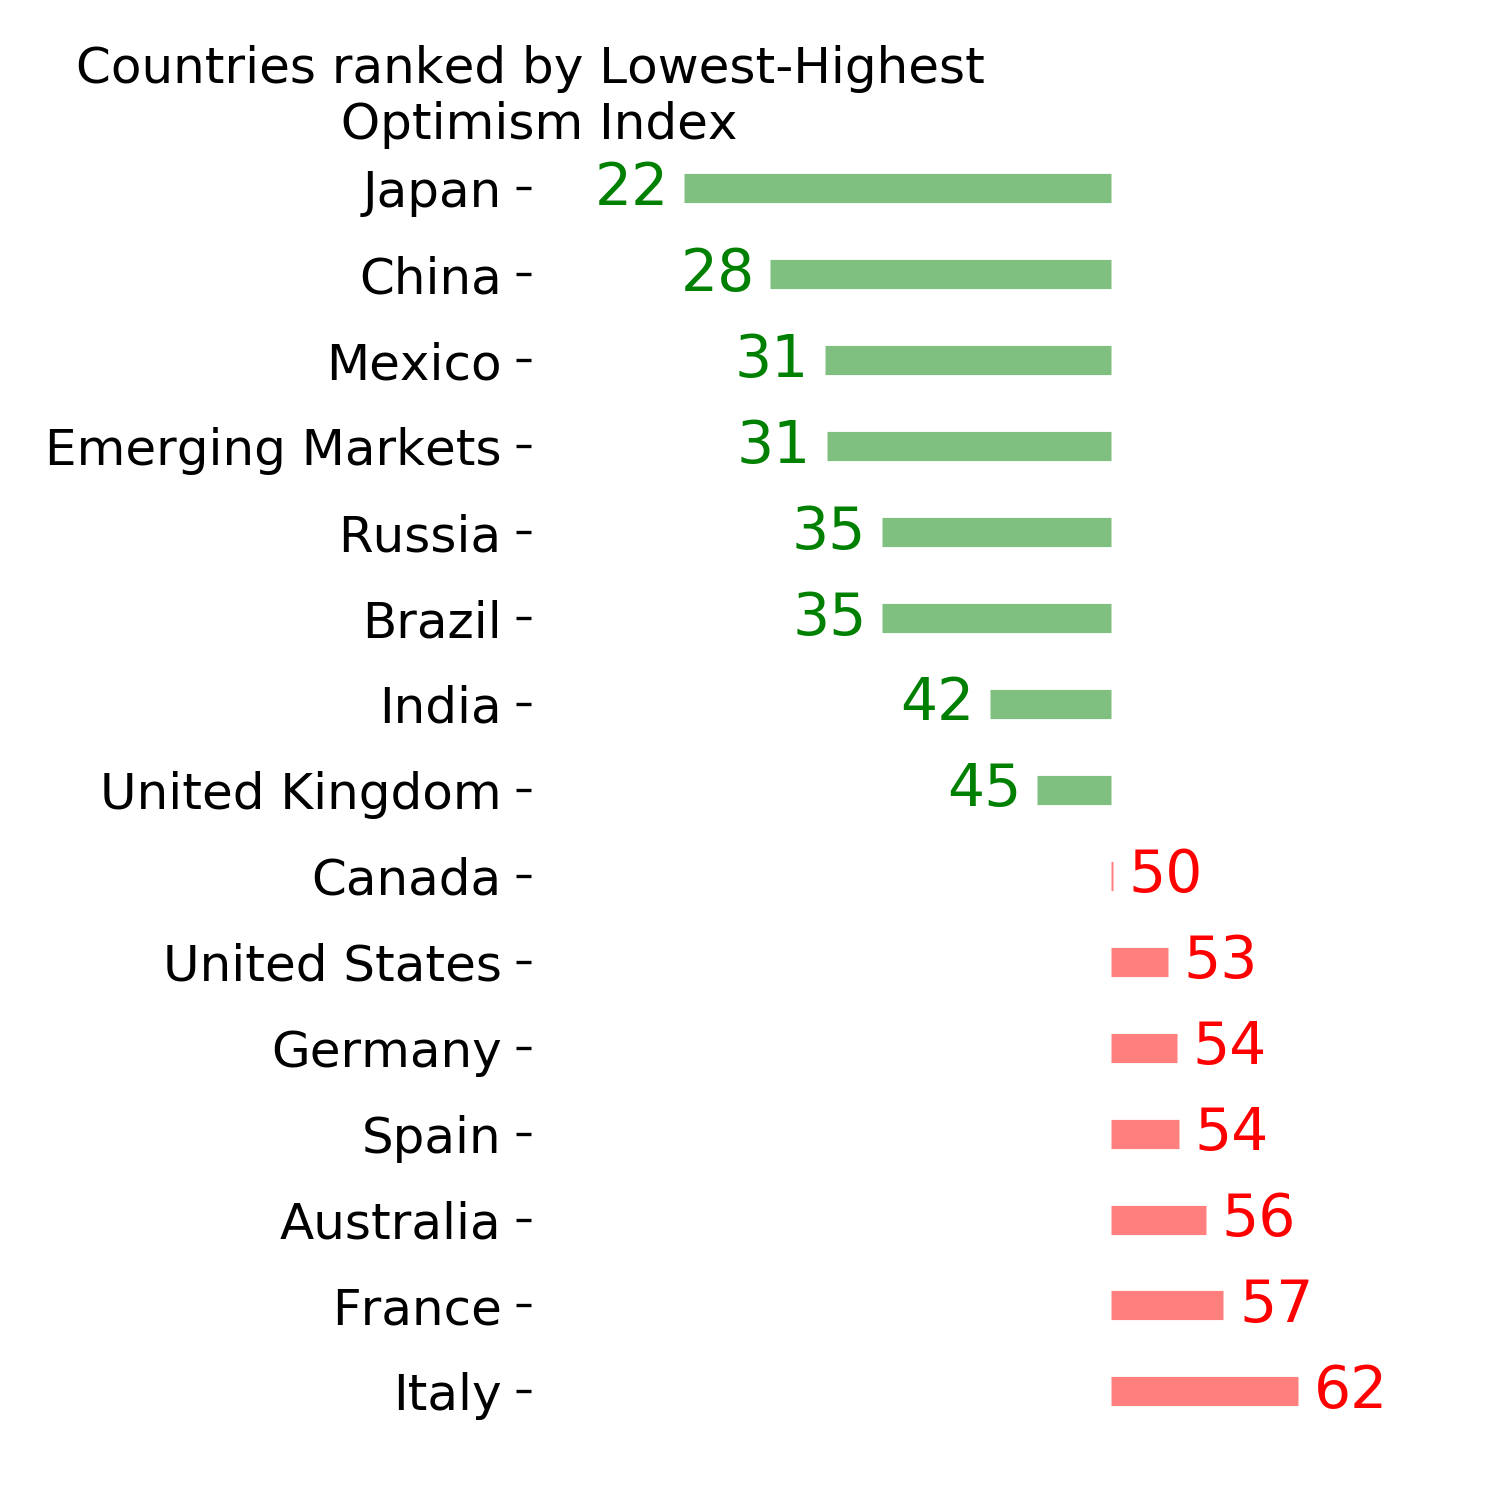
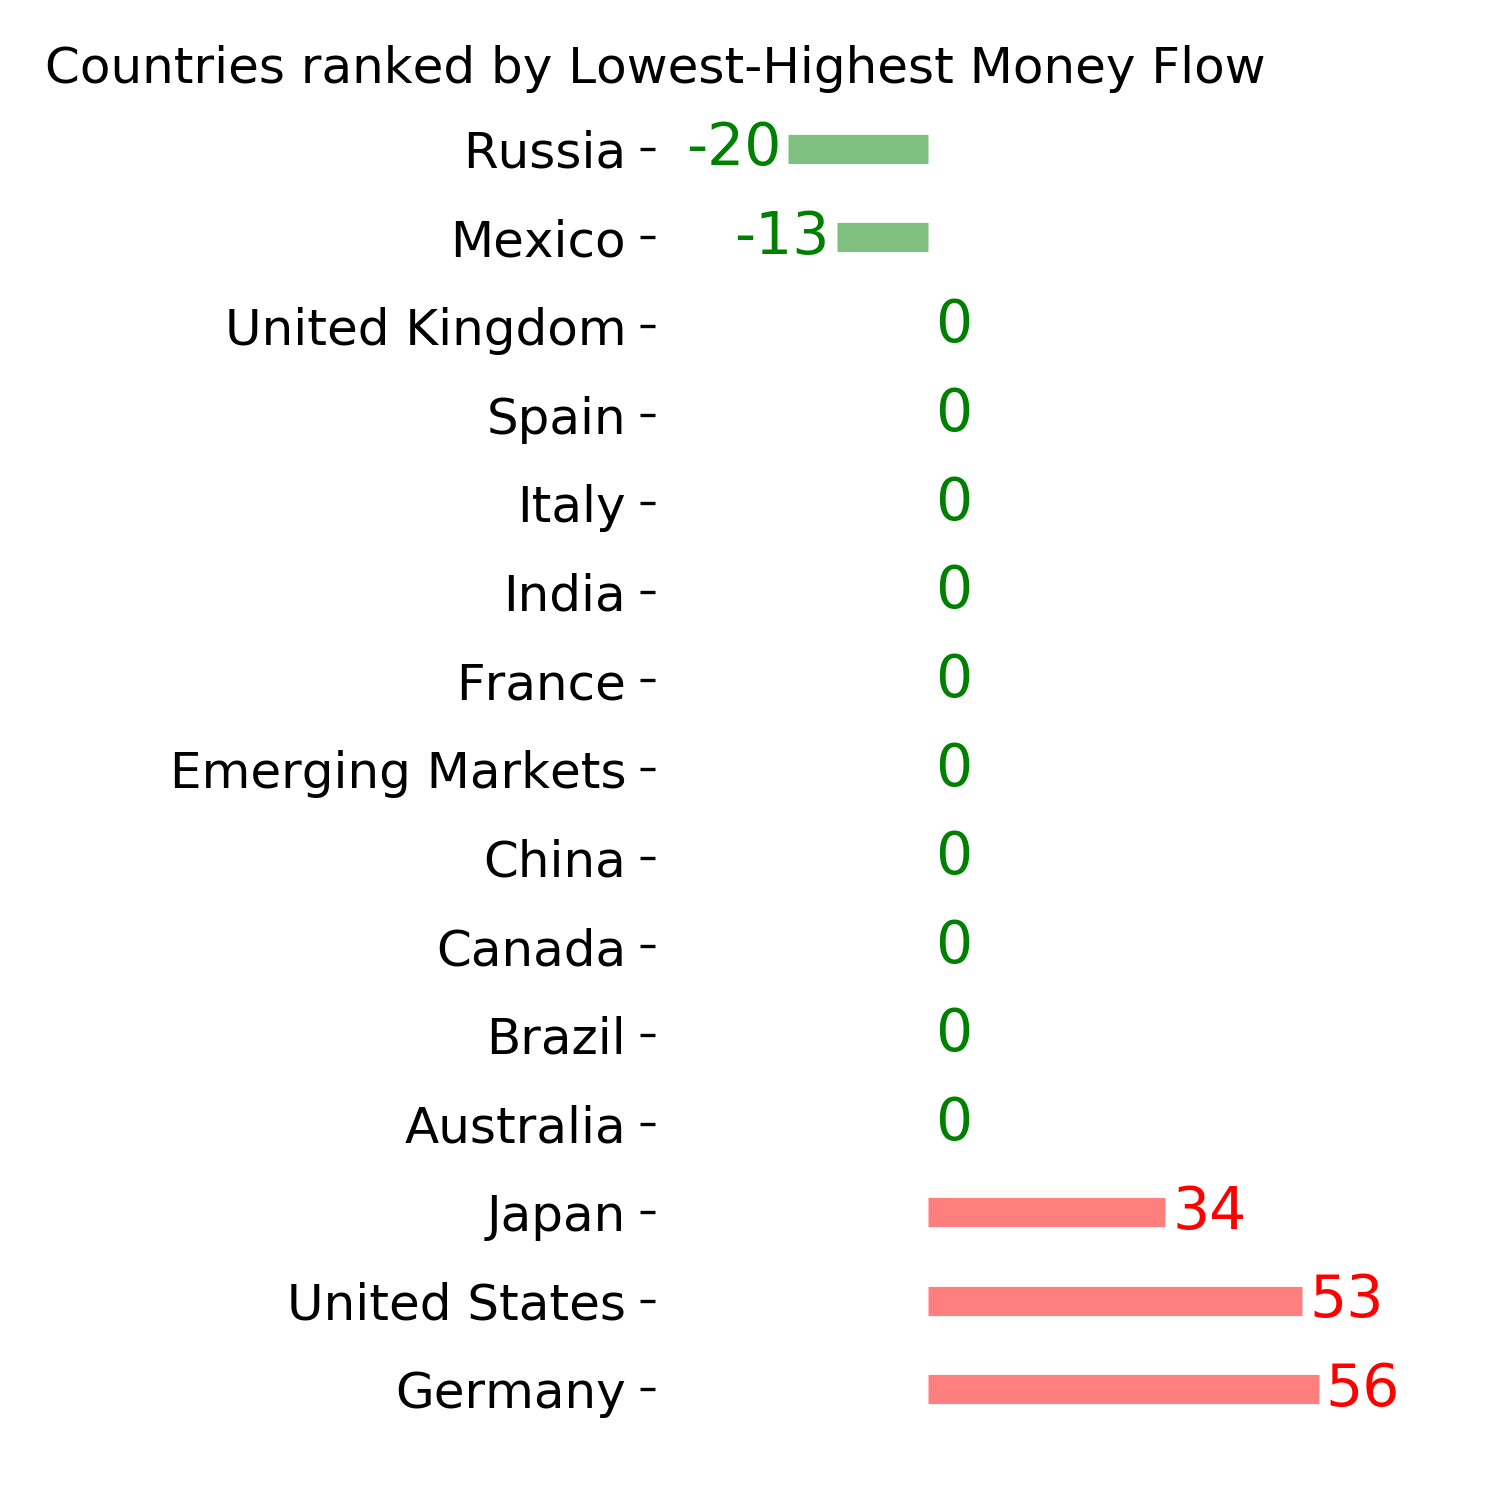
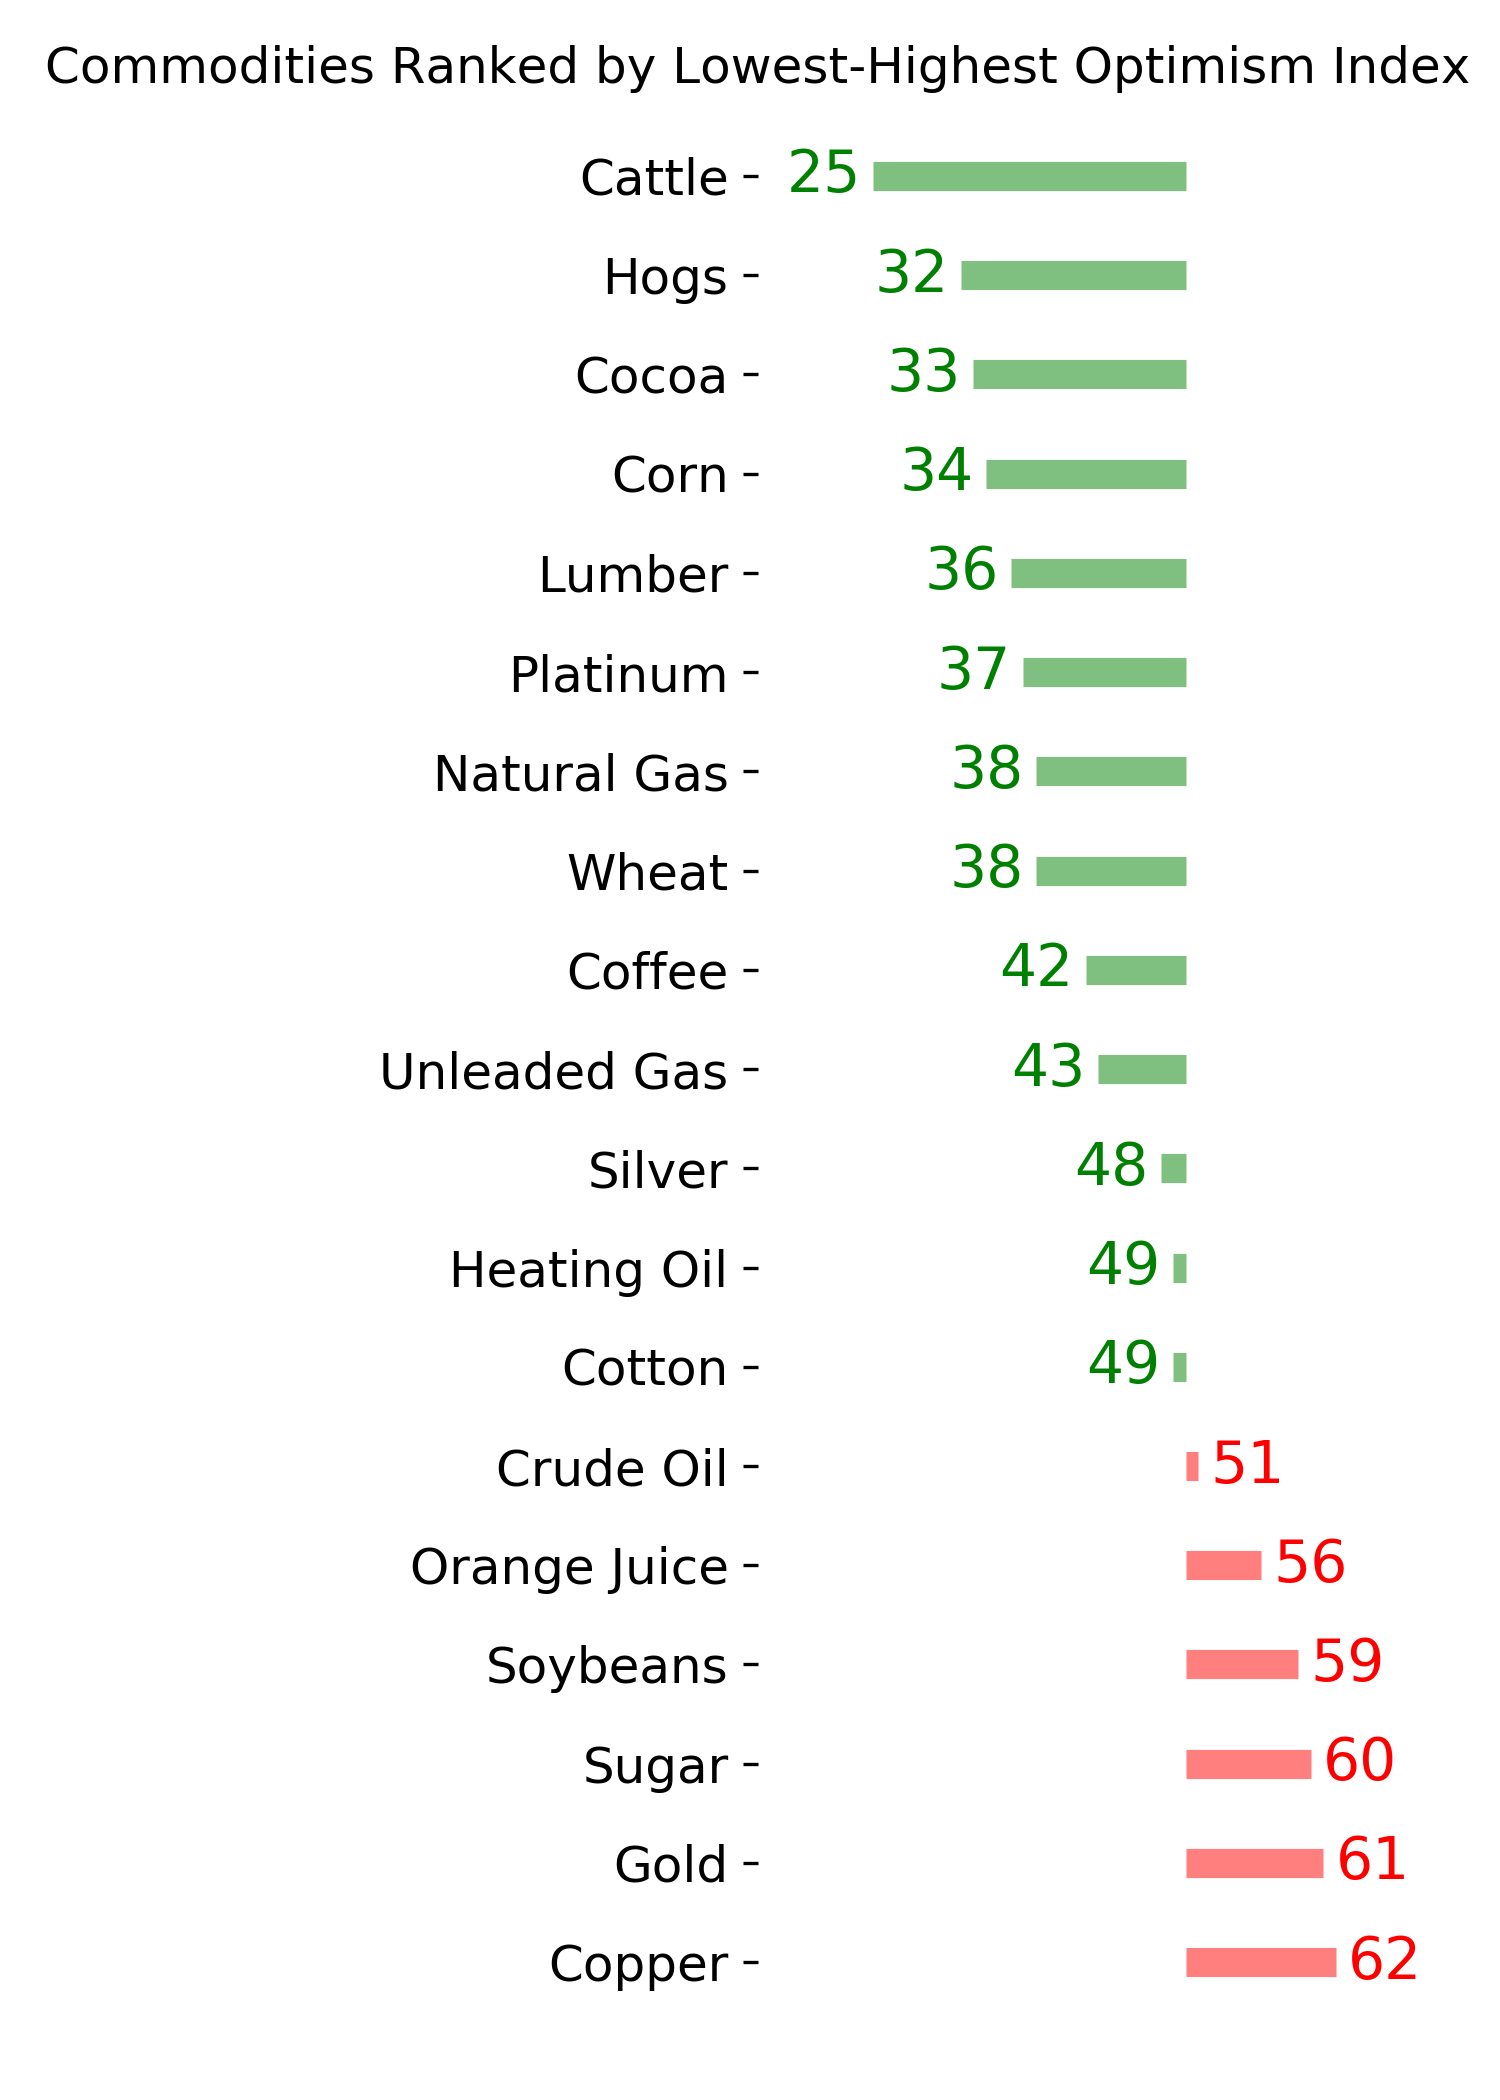
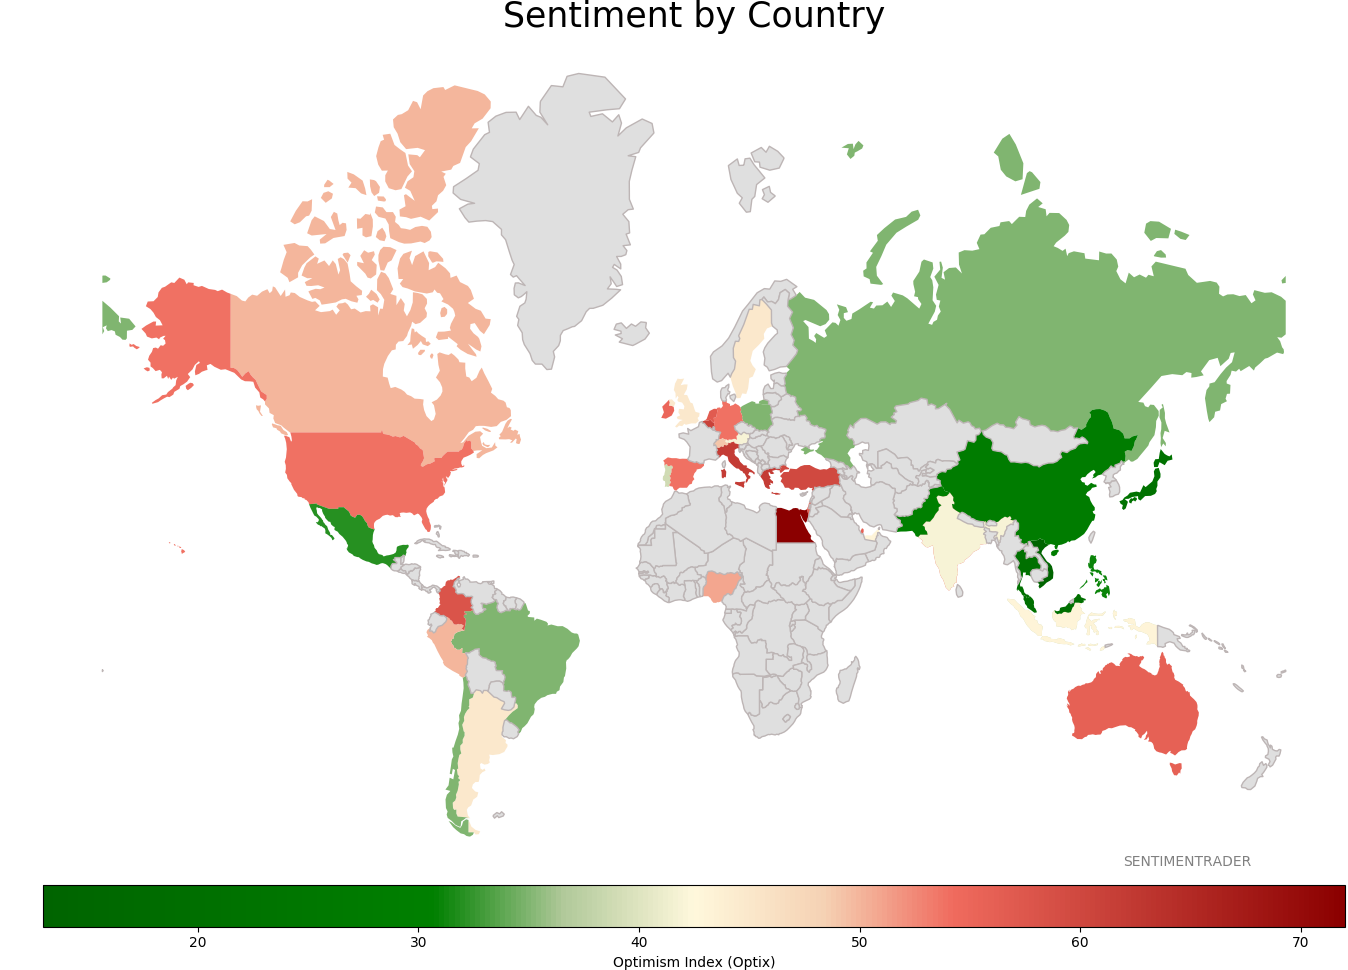
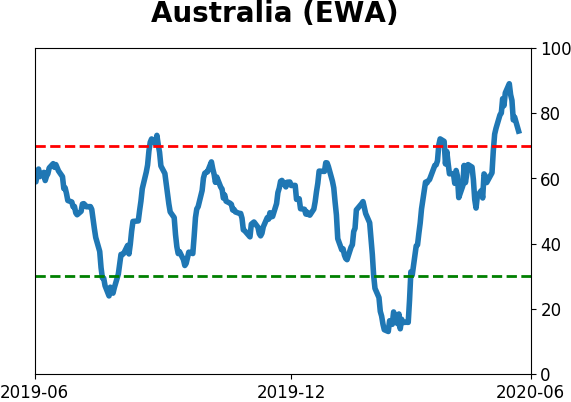
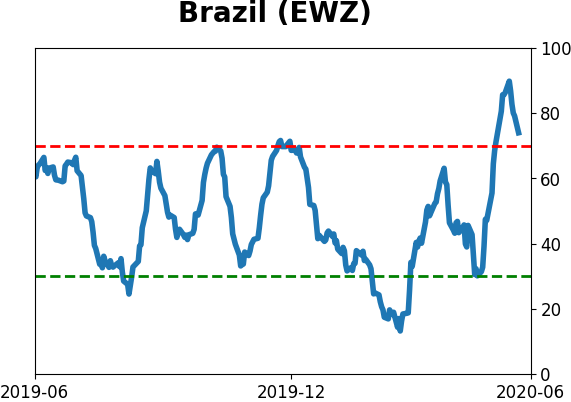
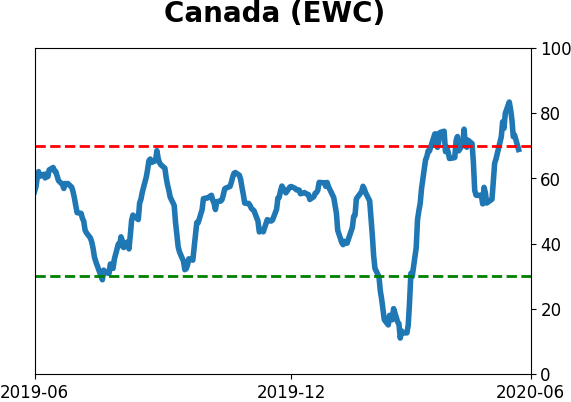
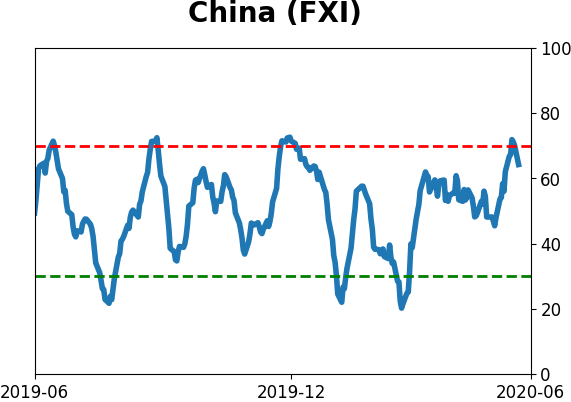
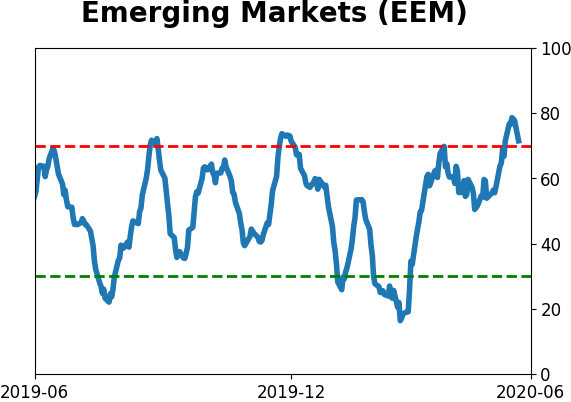
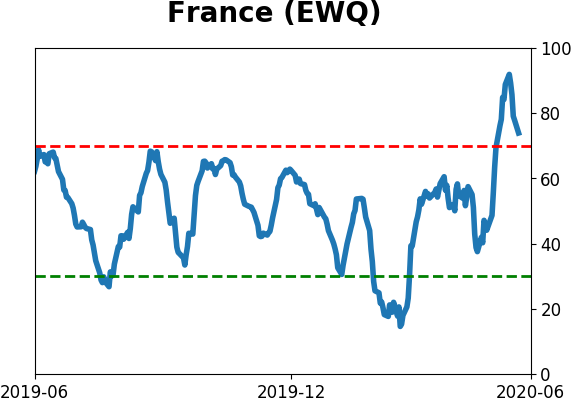
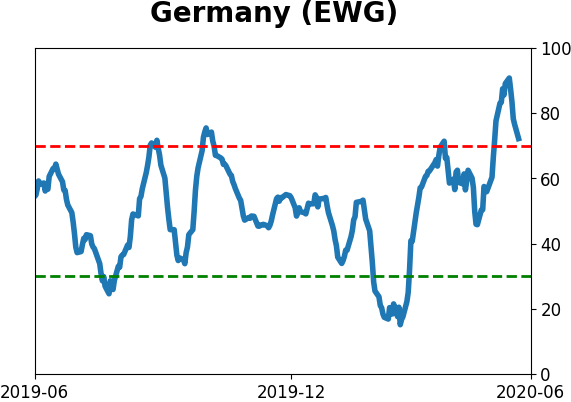
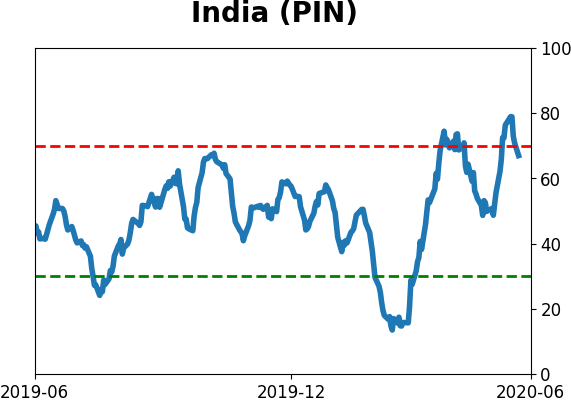
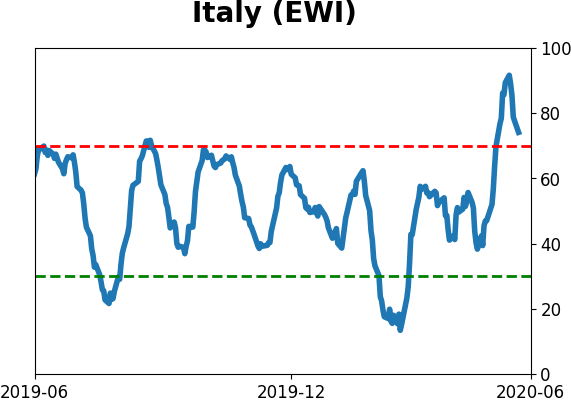
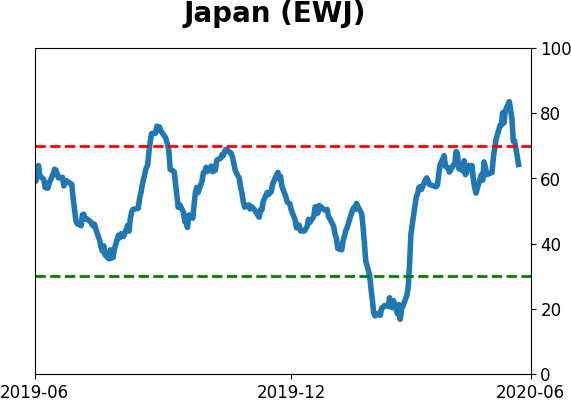
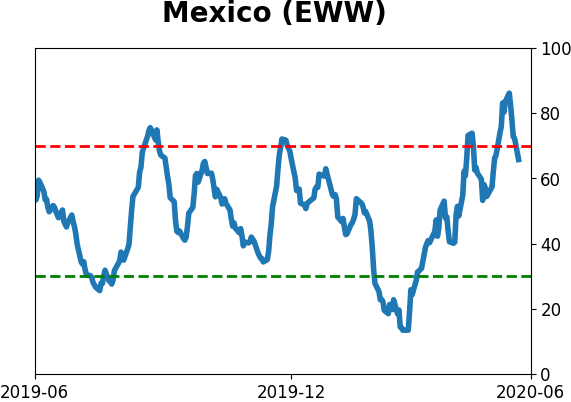
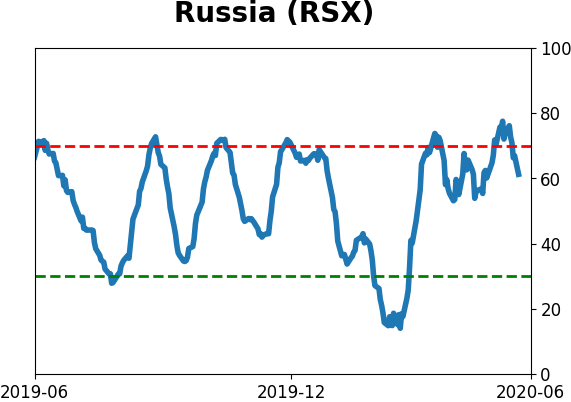
Sentiment Around The World
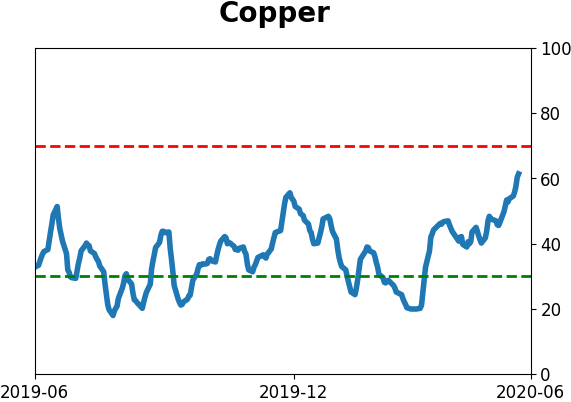
Optimism Index Thumbnails
|
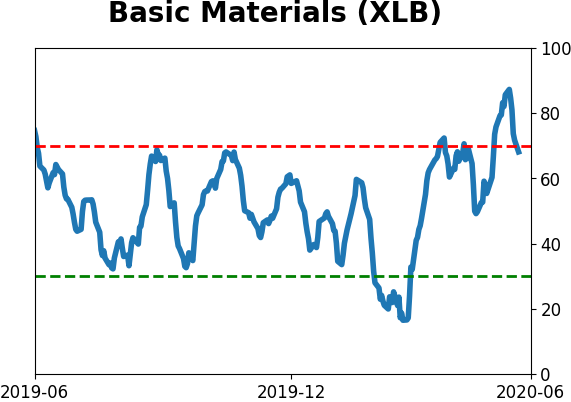
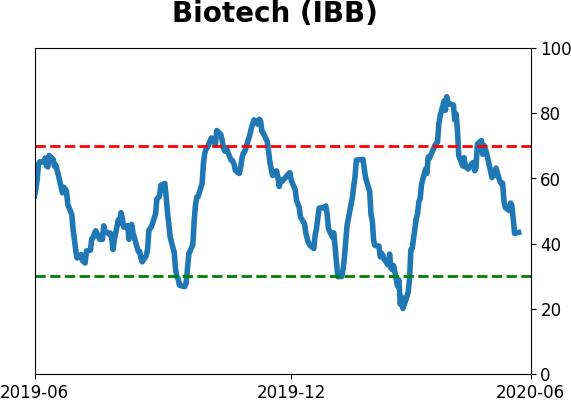
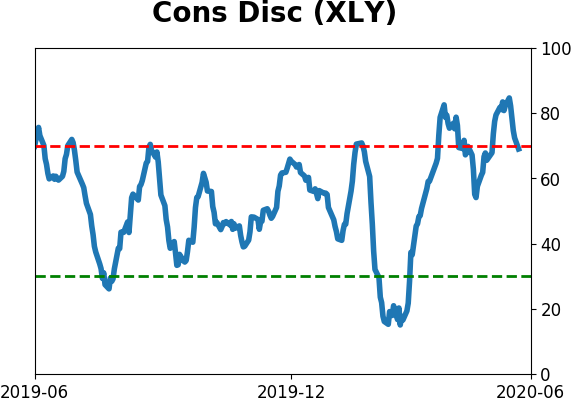
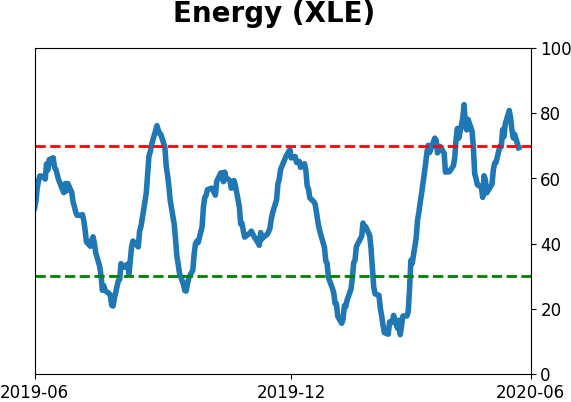
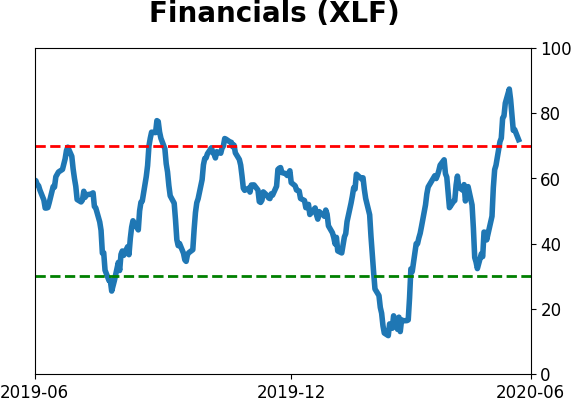
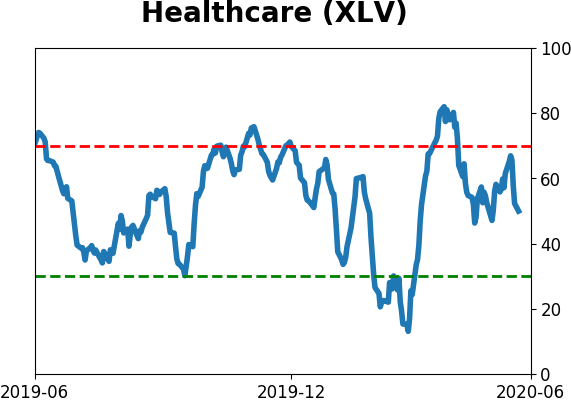
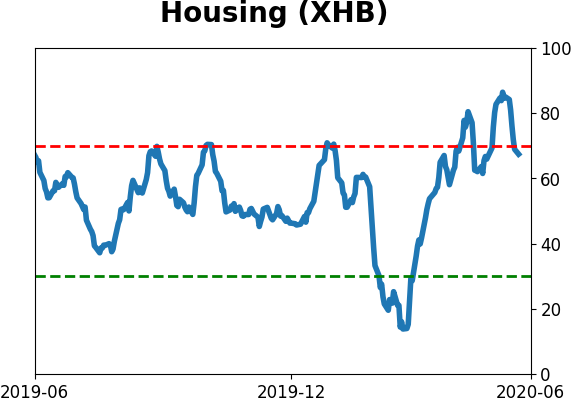
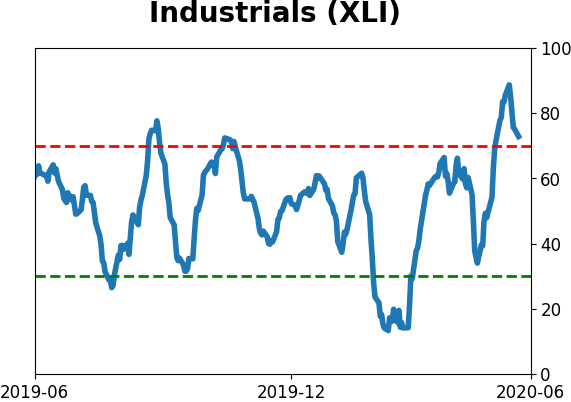
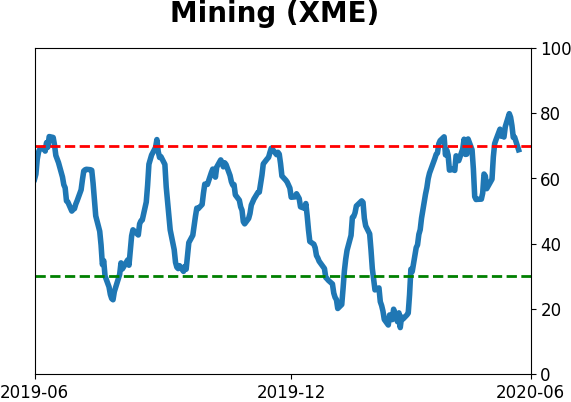
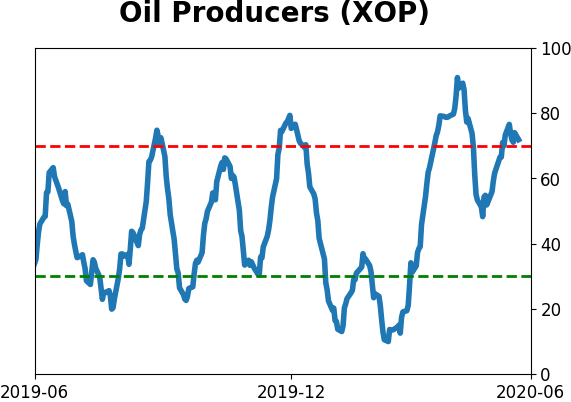
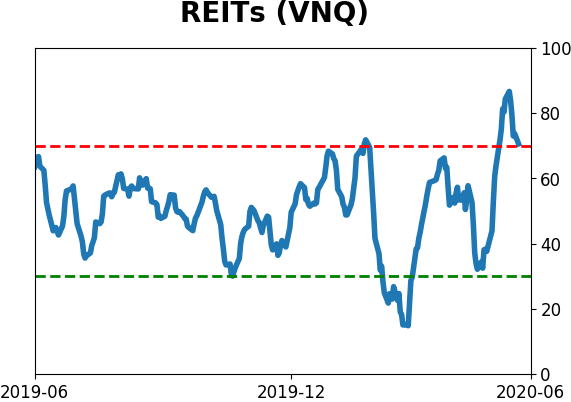
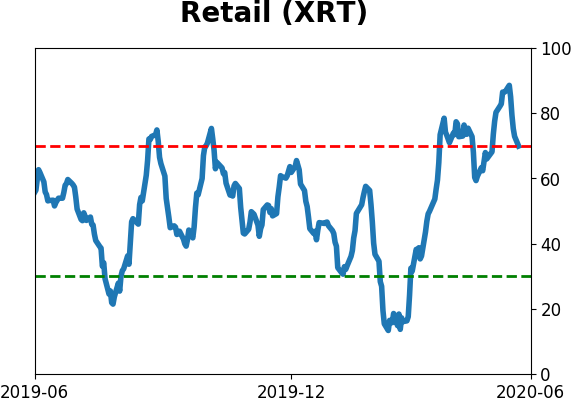
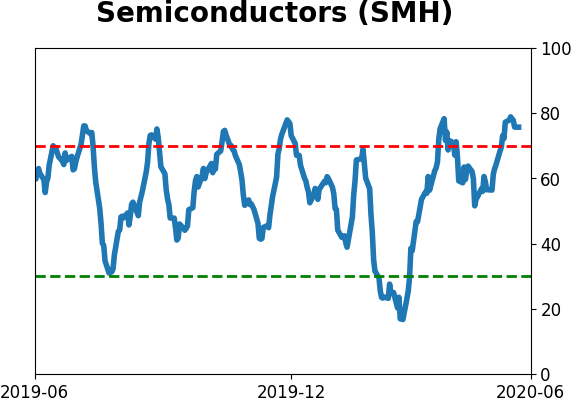
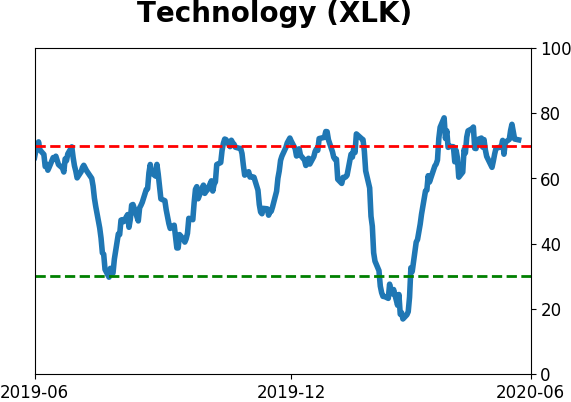
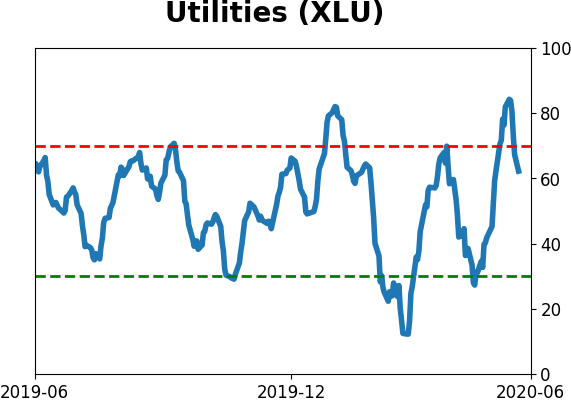
Sector ETF's - 10-Day Moving Average
|
|
|
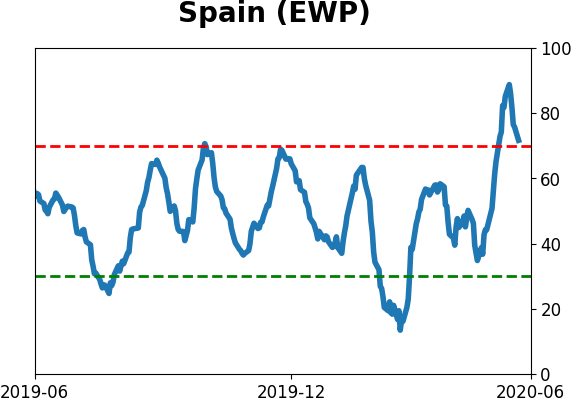
Country ETF's - 10-Day Moving Average
|
|
|
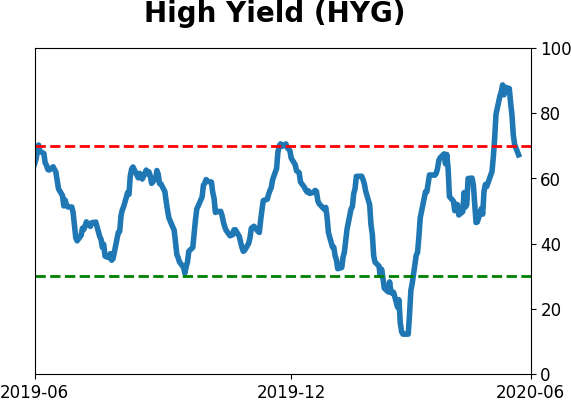
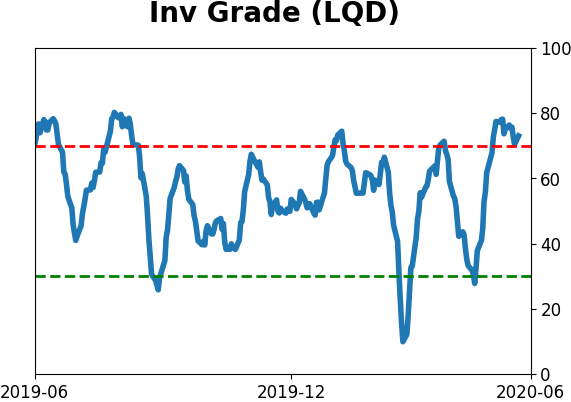
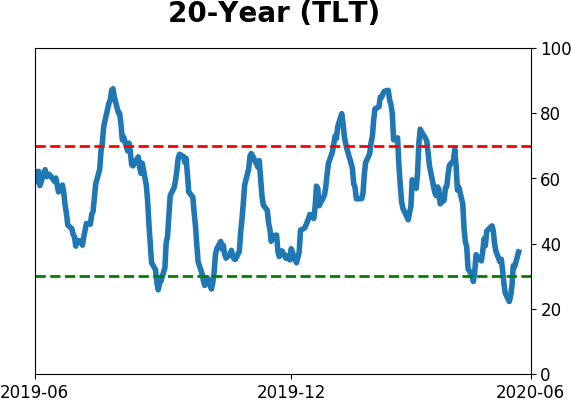
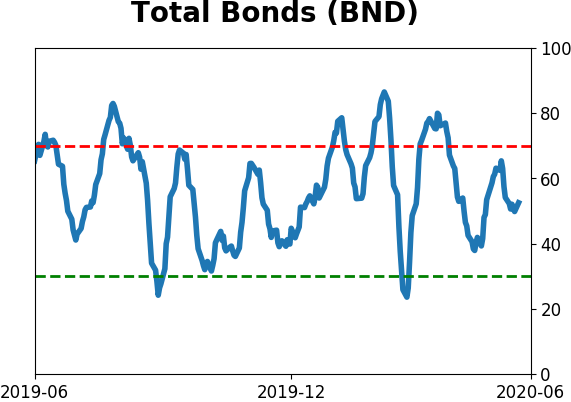
Bond ETF's - 10-Day Moving Average
|
|
|
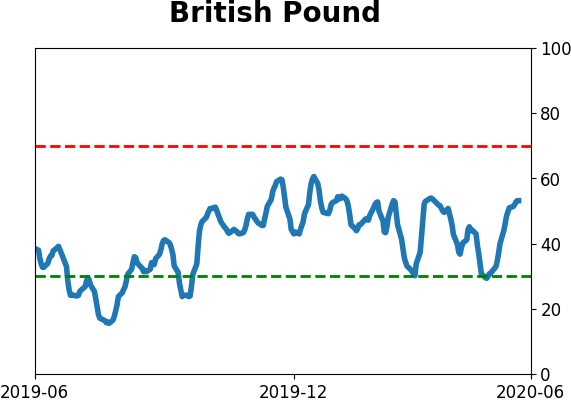
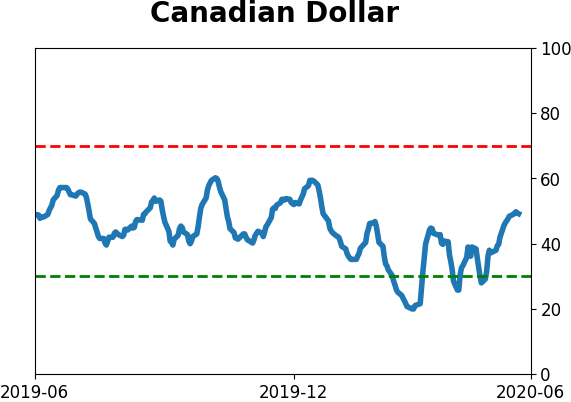
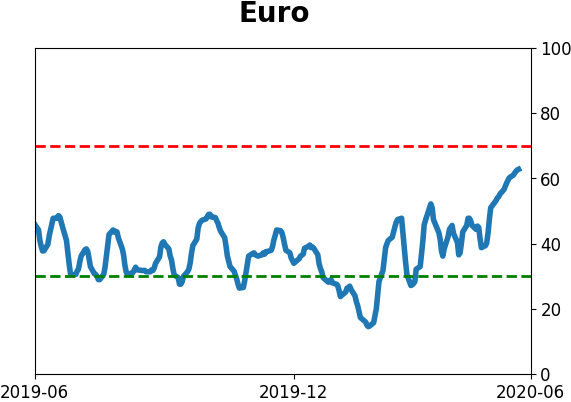
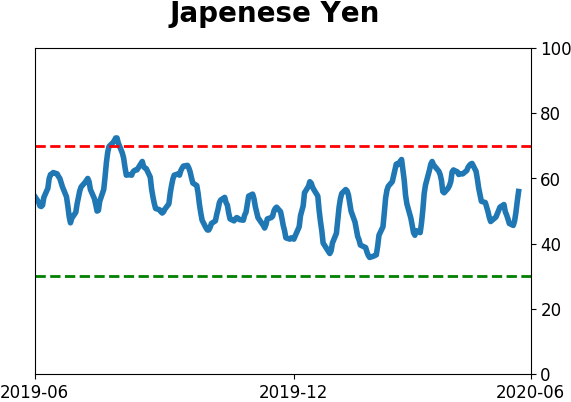
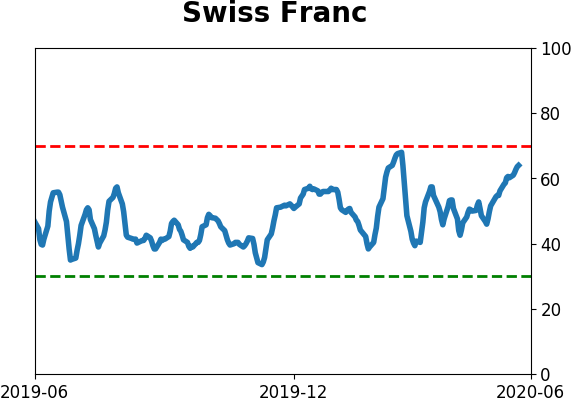
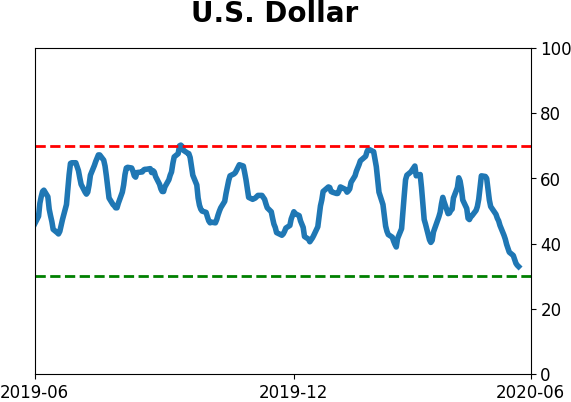
Currency ETF's - 5-Day Moving Average
|
|
|
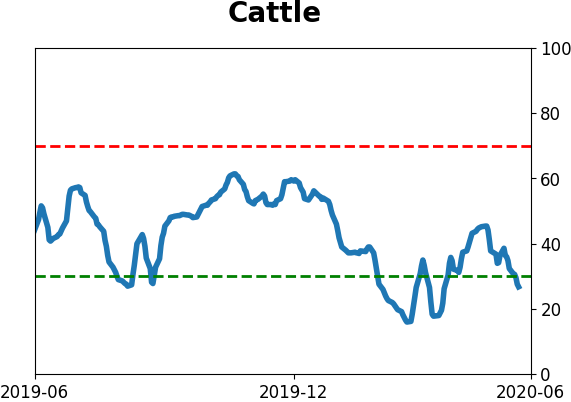
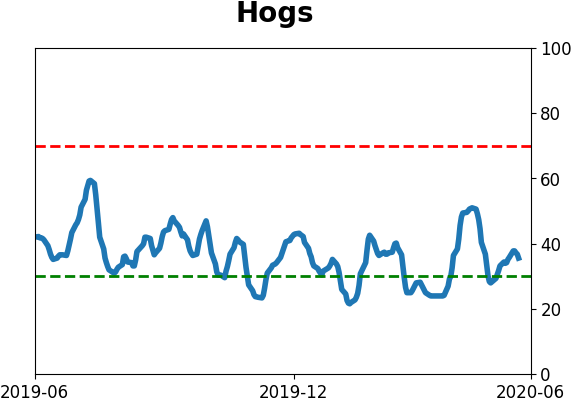
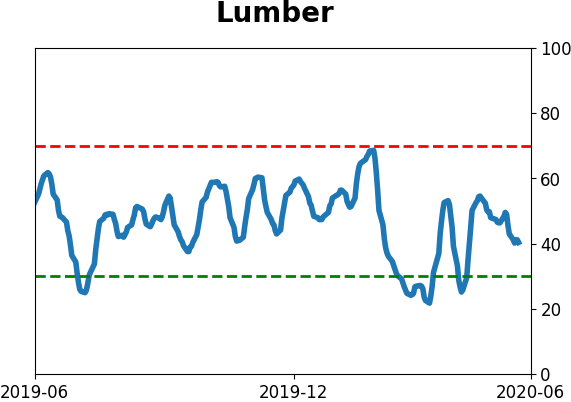
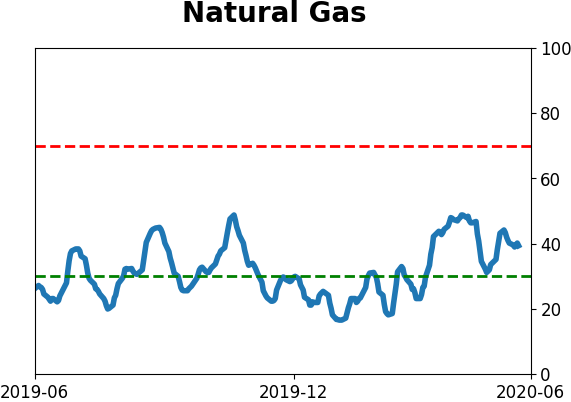
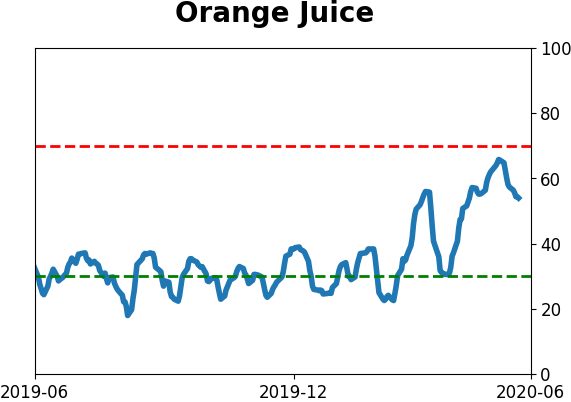
Commodity ETF's - 5-Day Moving Average
|
|