Headlines
|
|
Speculative Options Volume Nears Record as Hedging Disappears:
Small options traders continue to push their speculative volume last week, nearing the peak from February. This behavior has helped to push the Equity Hedging Index close to its lowest reading ever as new highs in the S&P 500 signal the futility in hedging against losses.
Bottom Line:
See the Outlook & Allocations page for more details on these summaries STOCKS: Hold
The speculative frenzy in February is wrung out. Internal dynamics have mostly held up, with some exceptions. Many of our studies still show a mixed to poor short-term view, with medium- and long-term ones turning more positive. BONDS: Hold
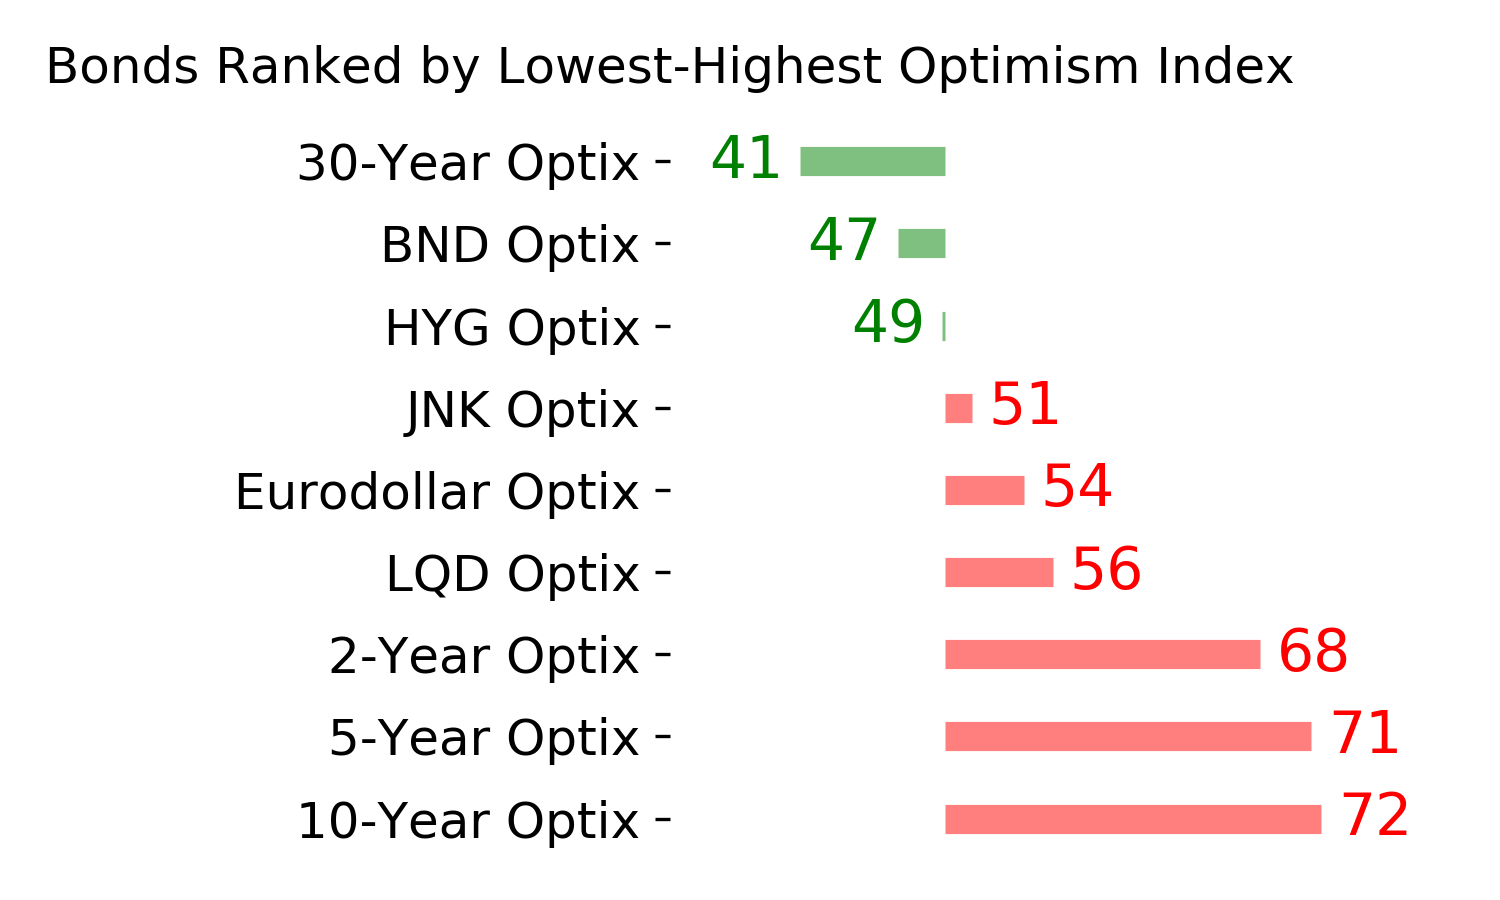
Various parts of the market got hit in March, with the lowest Bond Optimism Index we usually see during healthy environments. After a shaky couple of weeks, the broad bond market has modestly recovered. Not a big edge here either way. GOLD: Hold
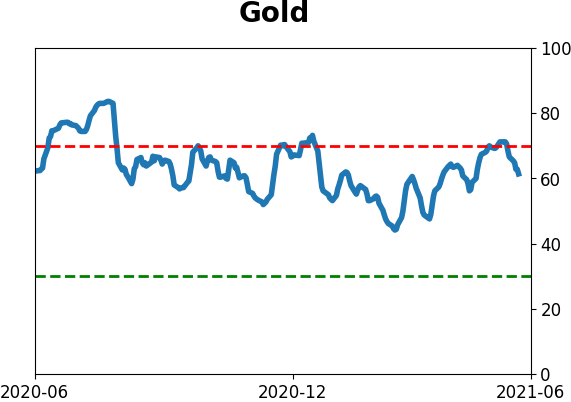
Gold and miners have done very well, recovering above long-term trend lines. The issue is that both have tended to perform poorly after similar situations - will have to wait and see how it plays out.
|
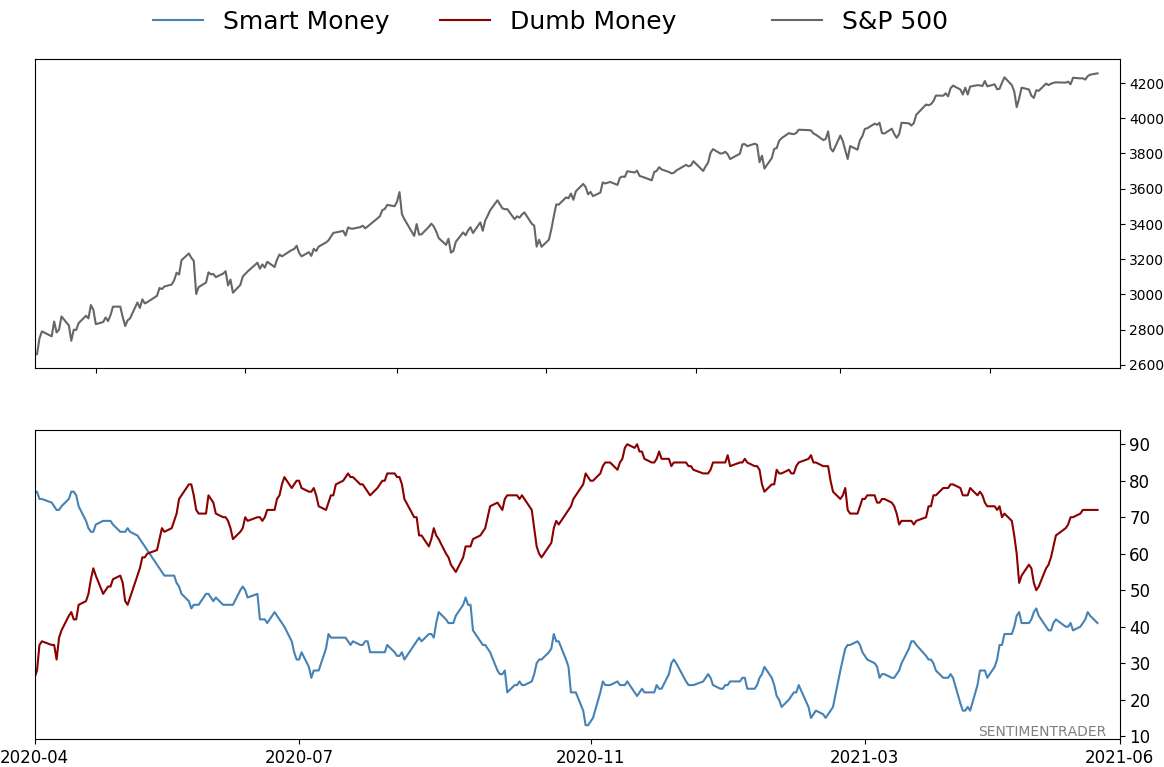
Smart / Dumb Money Confidence
|
Smart Money Confidence: 41%
Dumb Money Confidence: 72%
|
|
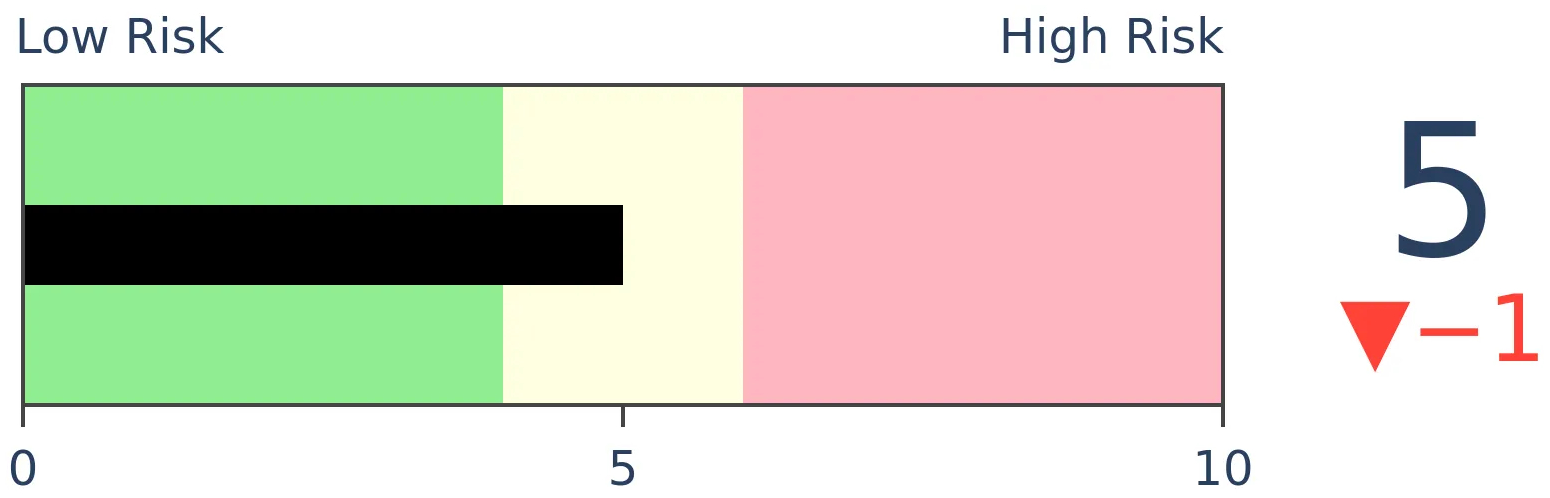
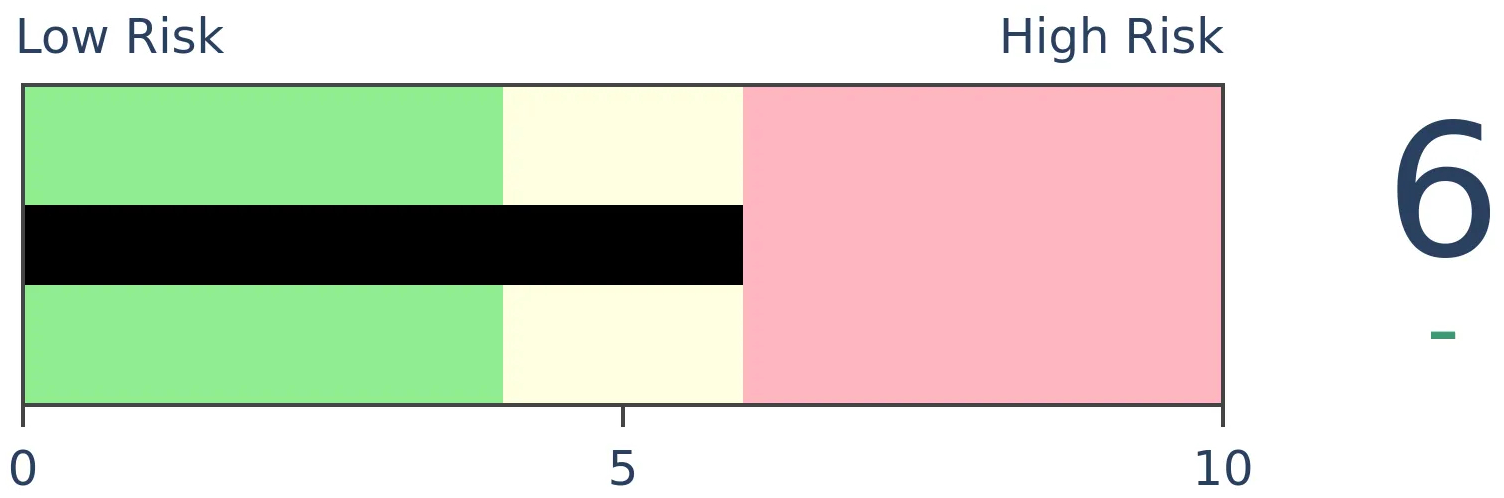
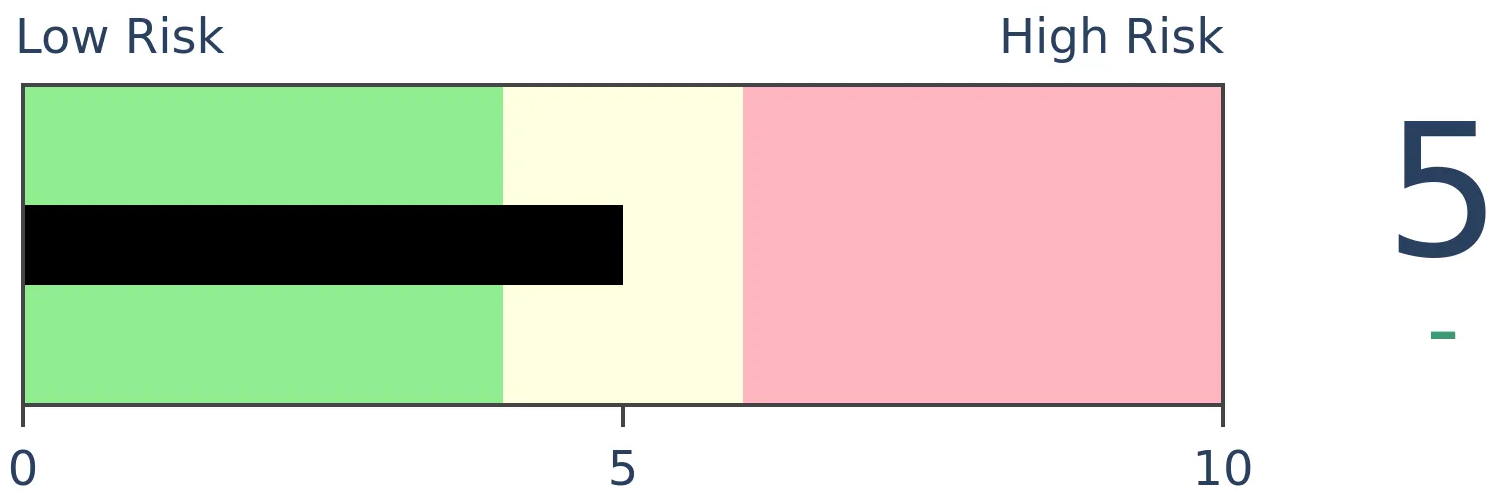
Risk Levels
Stocks Short-Term
|
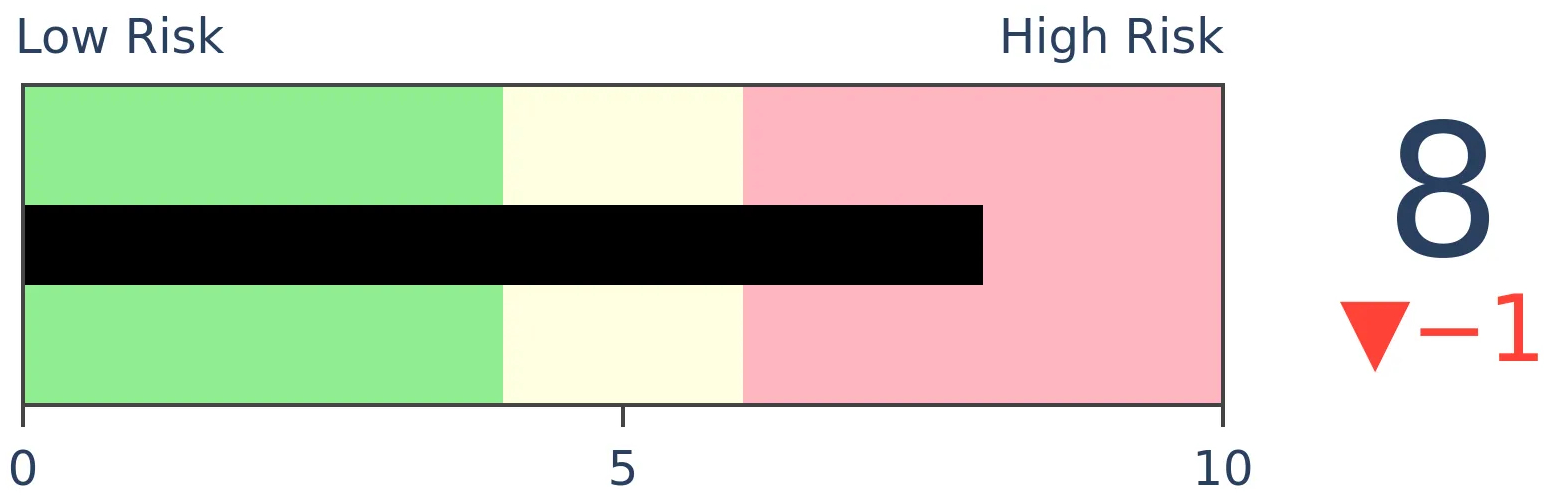
Stocks Medium-Term
|
|
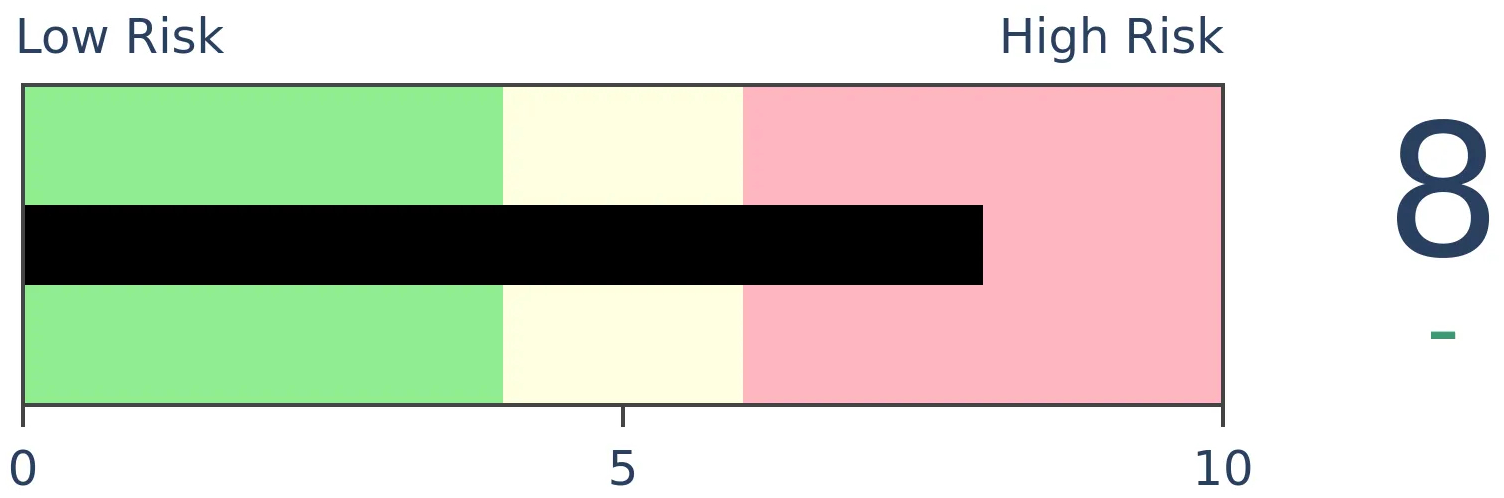
Bonds
|
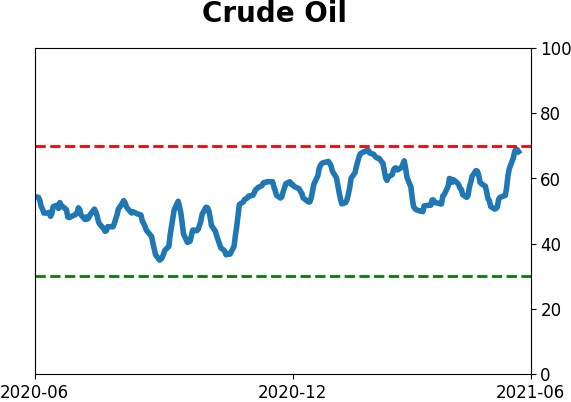
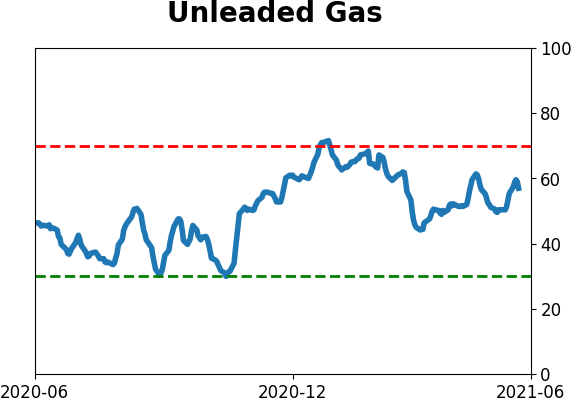
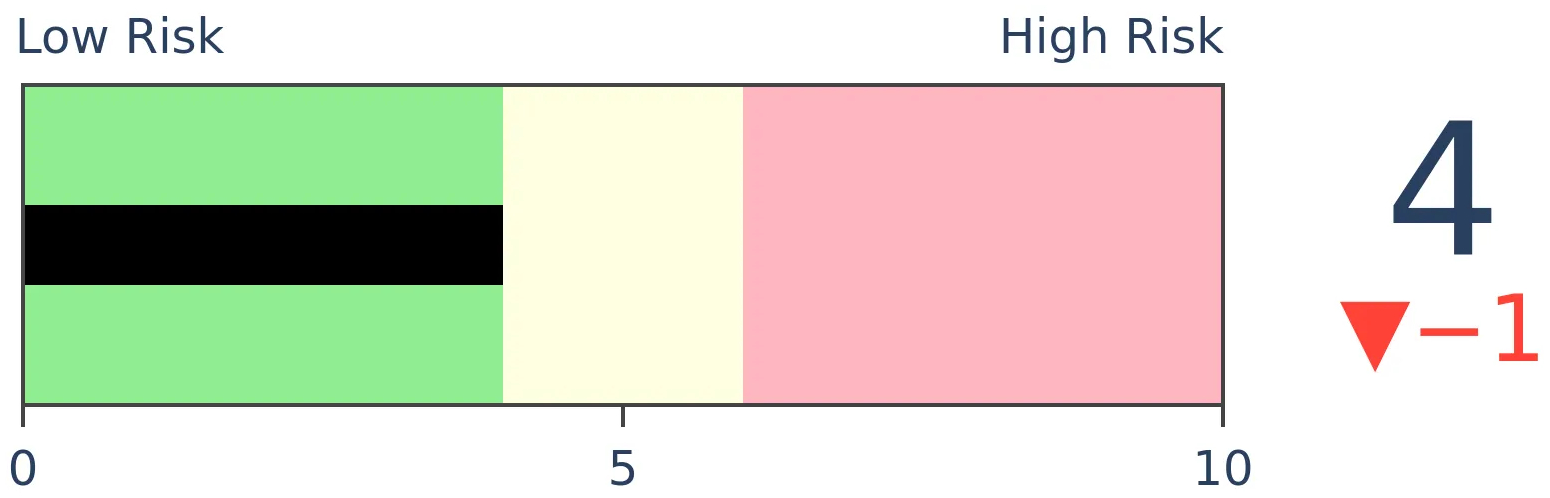
Crude Oil
|
|
Gold
|
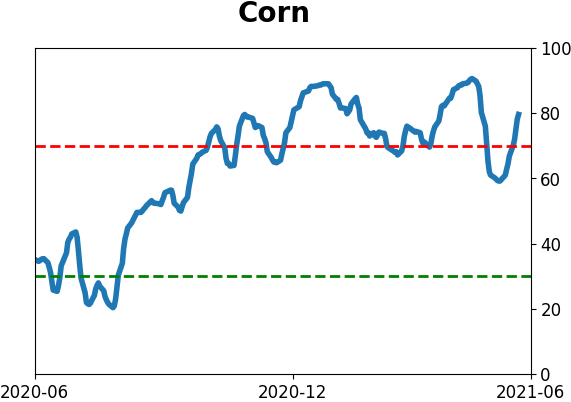
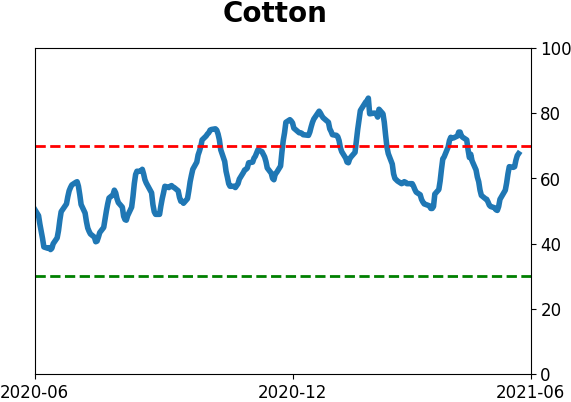
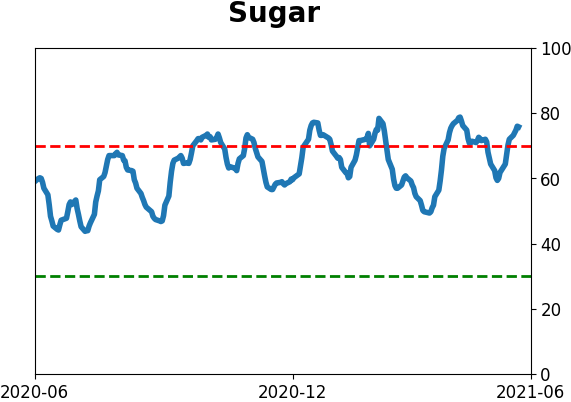
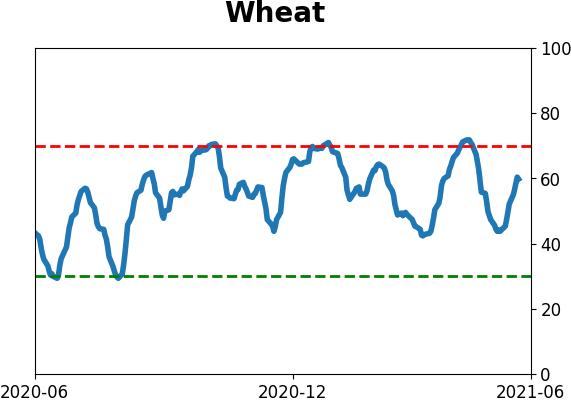
Agriculture
|
|
Research
BOTTOM LINE
Small options traders continue to push their speculative volume last week, nearing the peak from February. This behavior has helped to push the Equity Hedging Index close to its lowest reading ever as new highs in the S&P 500 signal the futility in hedging against losses.
FORECAST / TIMEFRAME
None
|
After taking a pounding from almost certain options-related losses following a speculative surge in February, small options traders stormed back at the beginning of June.
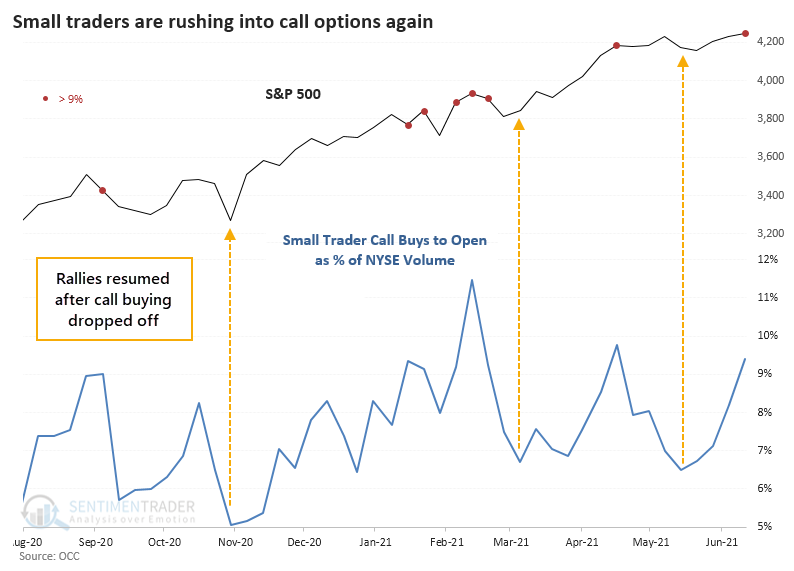
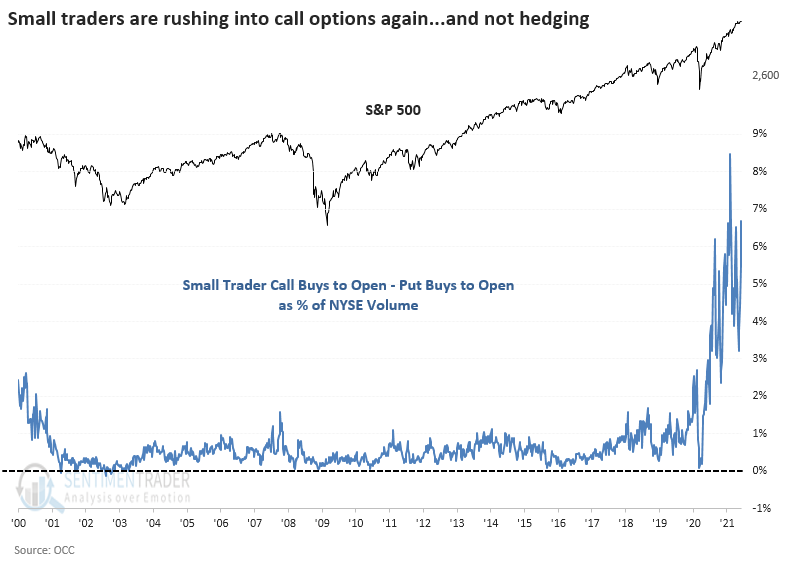
With some indexes moving to new highs last week, these traders have no intent on missing out, with speculative call buying flooding the markets once again. The smallest of traders, those executing 10 or fewer contracts at a time, spent 53% of their total volume on speculative call buying last week, just under their all-time high.
This call buying accounted for over 9% of all NYSE volume, below the peak of around 11% in February. The other times it got this high, the S&P chopped around for a while. Clearly, the uptrend was not interrupted for long, but rallies didn't resume in earnest until speculative call volume dropped to 7% or less of NYSE volume.
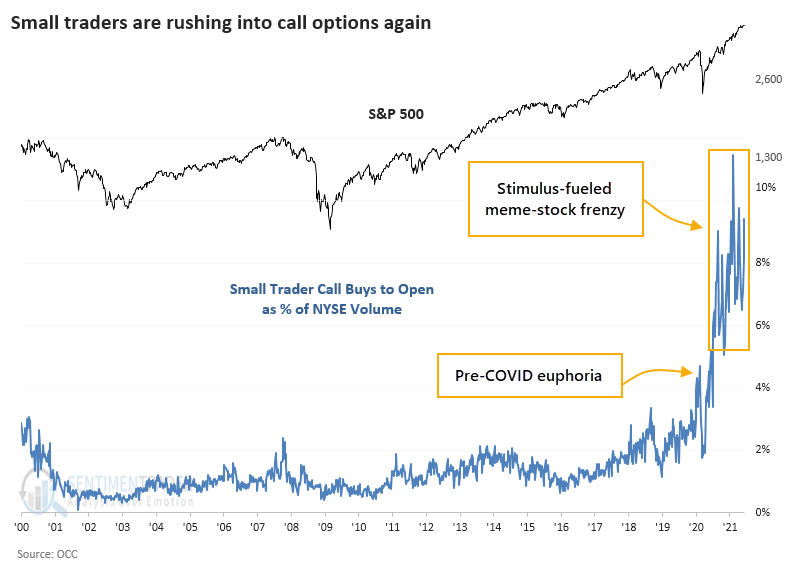
Note that this is raw volume and does not account for the fact that options control 100 shares or dealers on the other side are being forced to buy shares to hedge their exposure. Also, it's helpful to gain some perspective by zooming out and looking at this activity relative to the past two decades.
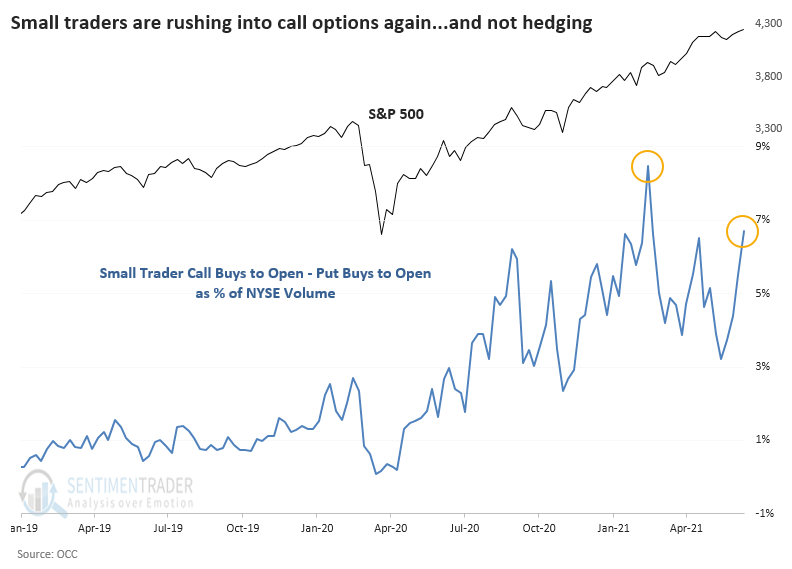
It's not like these traders are hedging by buying some puts, either. When we look at small traders' call buying volume and subtract their put buying to get a net figure of speculative behavior, it's even more egregious. The only week in 22 years that exceeds last week's activity was the week ending February 12 of this year.
Again, some perspective. This is pretty much the same story as the other zoomed-out chart but even more extreme.
Across all traders and all options volume, there was 67% more volume in trades that profit on a bullish move in stocks and ETFs than volume that profits on a market decline. That pushed the Options Speculation Index close to its record high.
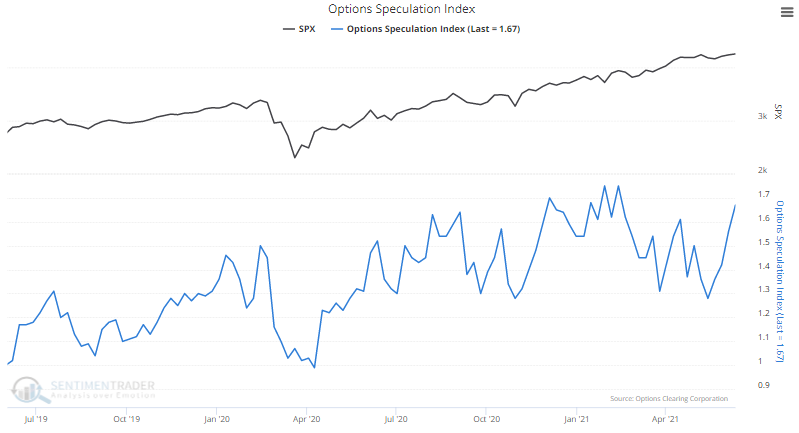
The fact that the Options Speculative Index is close to its high indicates that the rise in speculative trading is not solely due to the smallest of traders. But it primarily is, as we've shown before. Unlike any other period in 20 years, the smallest traders are the dominant factor in speculative options trading, accounting for 40% - 50% of all call buys to open.
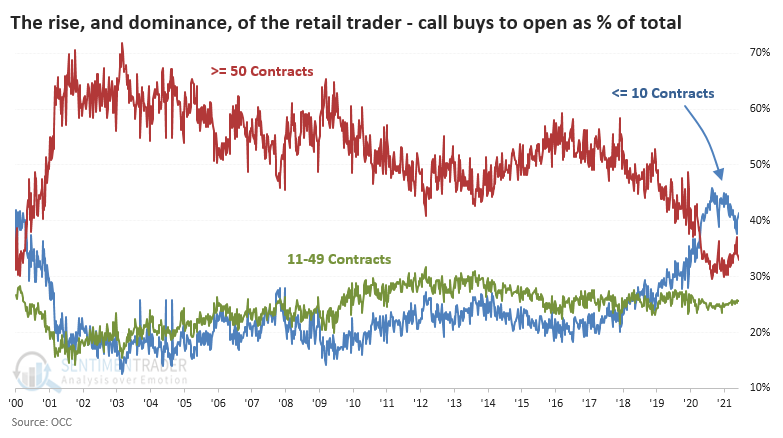
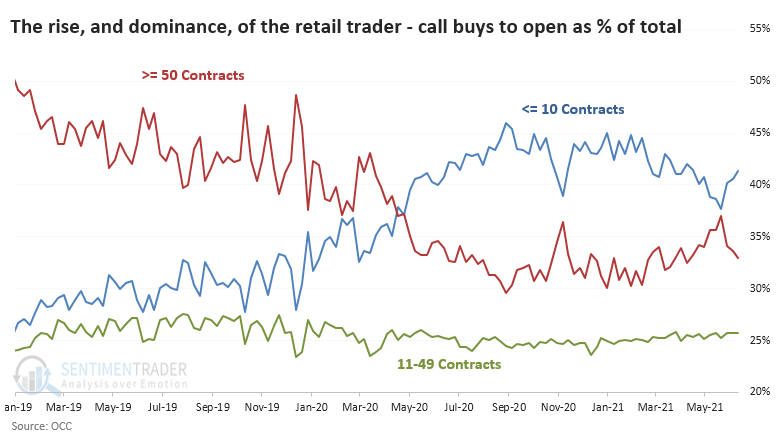
If we zoom in on this activity, we can see we changed regimes almost exactly one year ago. Mid-market traders of 11-49 contracts held steady at about 25% of call buying volume, while institutional-level traders fell from more than 45% of the market to 30% - 35% as the retail trading force took over.
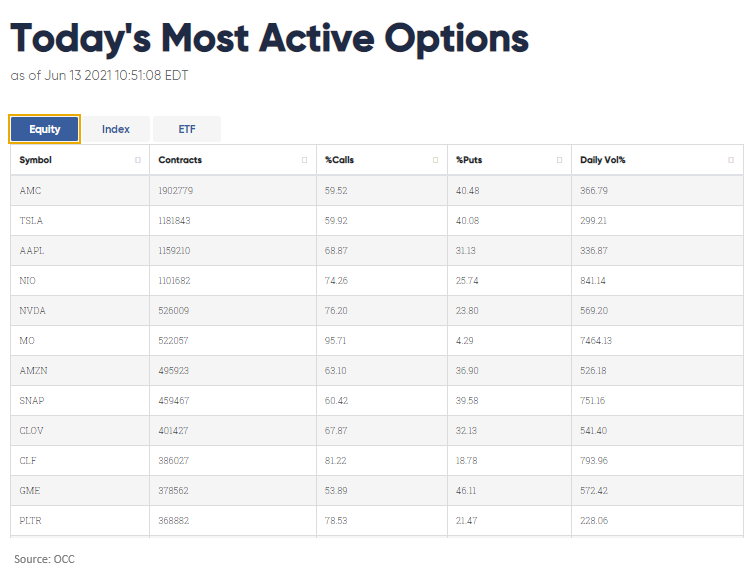
It's not a big shocker to see the usual suspects dominating the most active list. Meme stocks like AMC and CLOV are right up there, along with the go-to's like AAPL and TSLA.
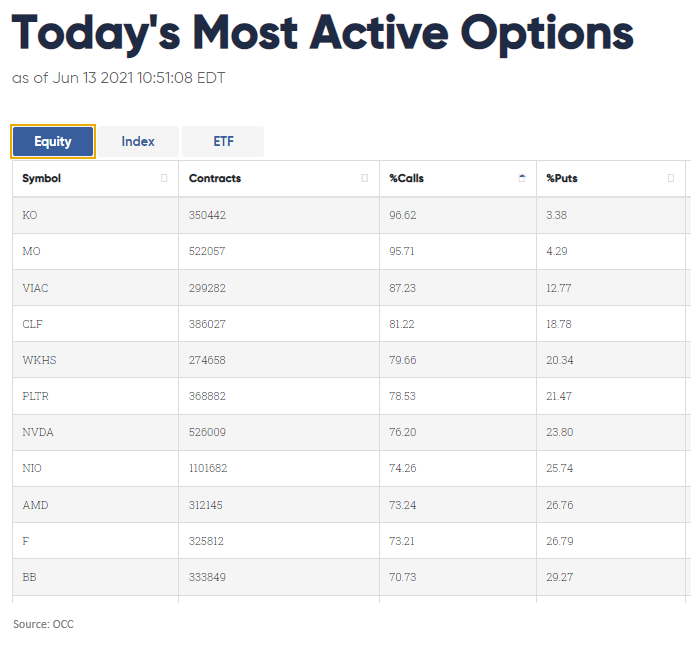
If we sort the table by the stocks with the greatest concentration of call activity at the end of last week, we can get a sense of where this speculative volume has been especially concentrated. These should be among the most vulnerable stocks should there be a shift in sentiment.
With this drop in hedging activity in options, seemingly little interest in shorting futures, little cash on hand relative to other assets, and similar behavior, the Equity Hedging Index plunged to the 2nd lowest reading on record
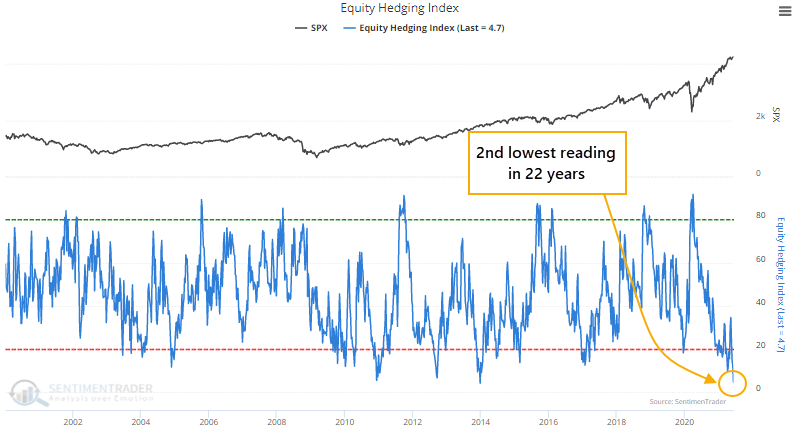
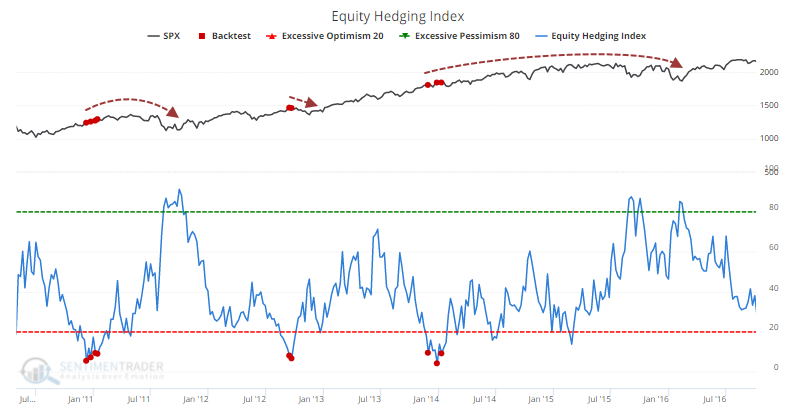
Like most sentiment indicators, this tends to be more immediately actionable when there is a spike in hedging activity during times of panic. At the opposite extreme, like now, it has generally resulted in rounding tops as stocks chop higher but ultimately give most or all of those gains back during a subsequent pullback. It can take a long time for this to play out.
There are some major caution signs regarding valuations, some fundamental inputs like inflation readings, and some recent sentiment indicators like the above. There are also some rare and probably minor internal breadth warnings. And yet, most of the trend and risk warning signals have not triggered, and it would be relatively rare (but not unprecedented) to see a large and sustained decline without those. As the general warning signs pile up, we'll be placing ever-more attention on hints of internal deterioration and signs of increasing risk-off behaviors.
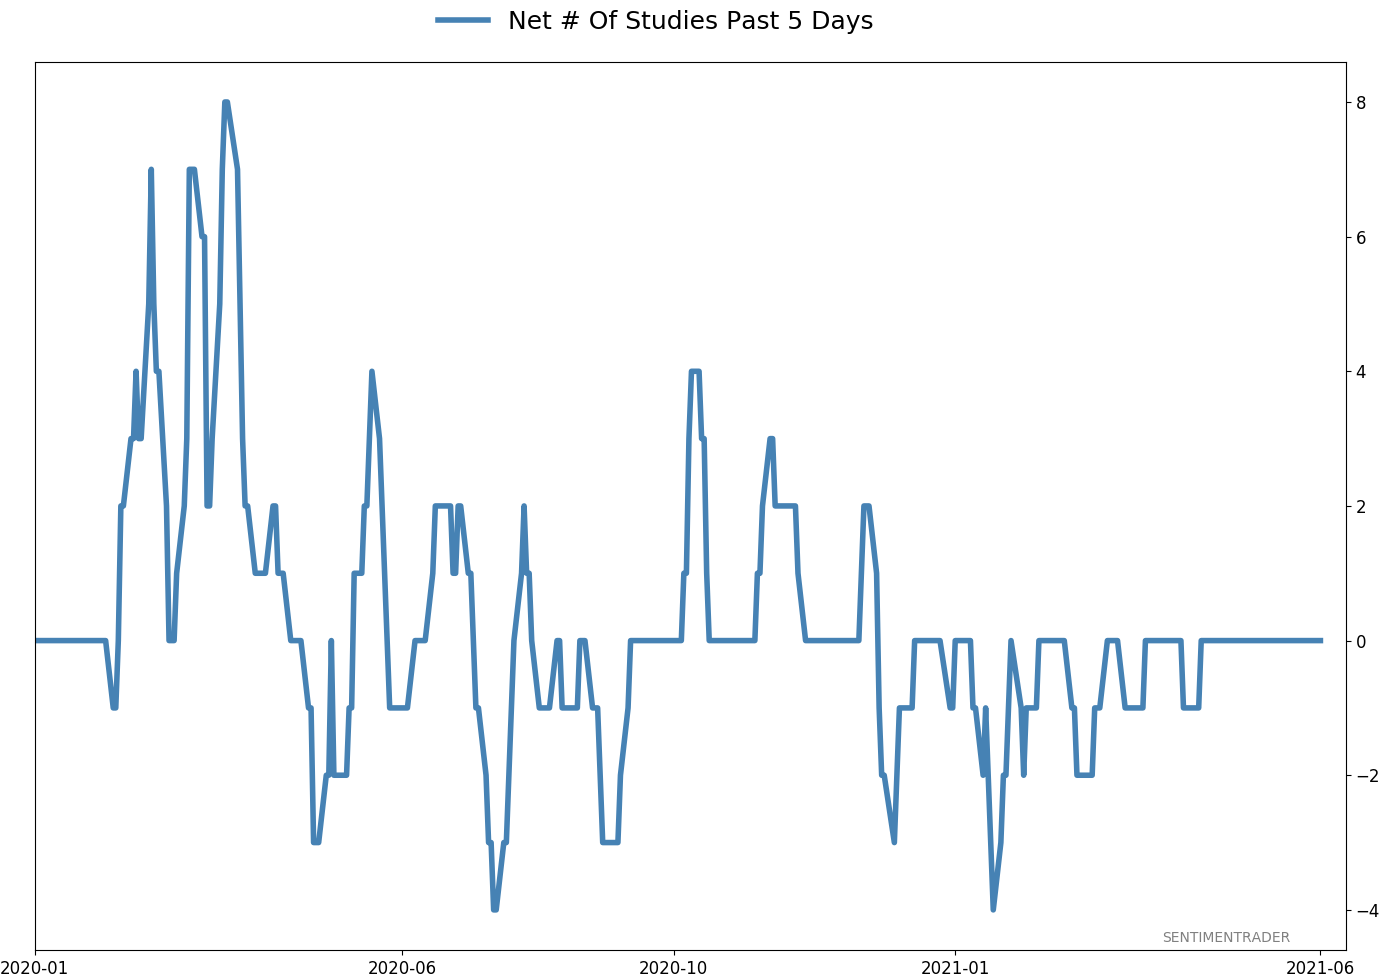
Active Studies
| Time Frame | Bullish | Bearish | | Short-Term | 0 | 0 | | Medium-Term | 2 | 12 | | Long-Term | 11 | 5 |
|
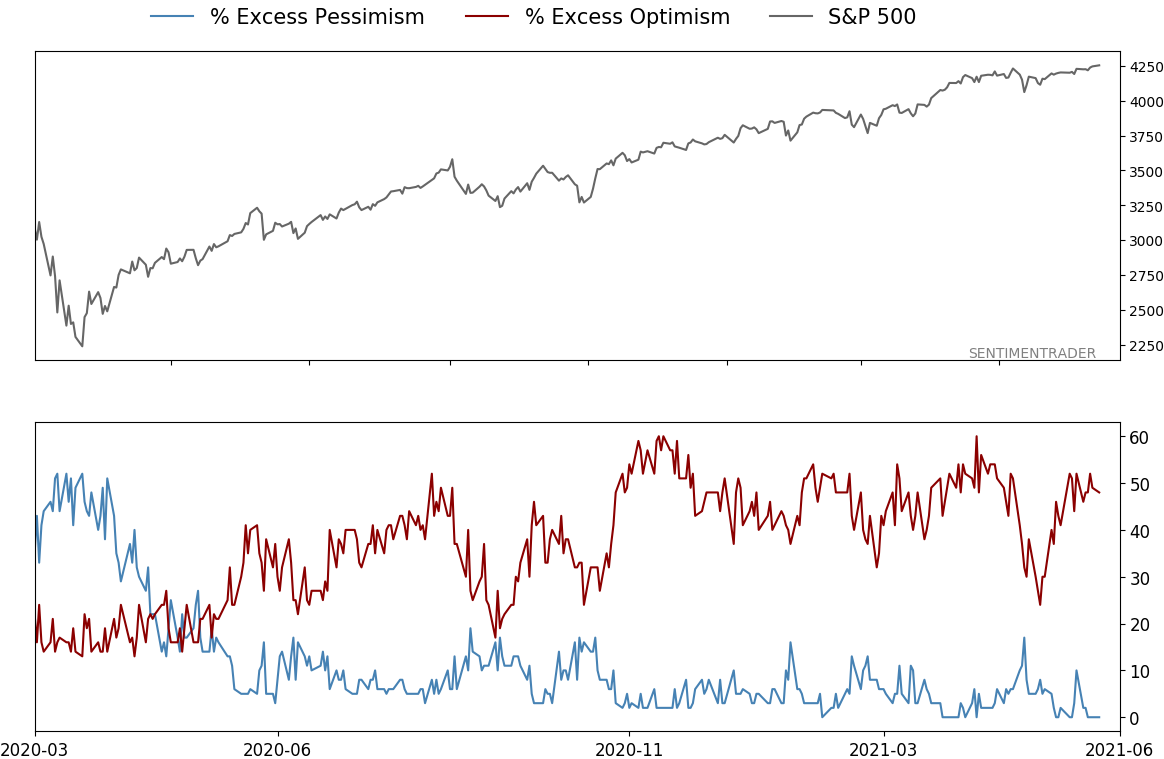
Indicators at Extremes
|
% Showing Pessimism: 0%
Bullish for Stocks
|
|
Portfolio
| Position | Description | Weight % | Added / Reduced | Date | | Stocks | RSP | 4.1 | Added 4.1% | 2021-05-19 | | Bonds | 23.9% BND, 6.9% SCHP | 30.7 | Reduced 7.1% | 2021-05-19 | | Commodities | GCC | 2.6 | Reduced 2.1%
| 2020-09-04 | | Precious Metals | GDX | 5.6 | Reduced 4.2% | 2021-05-19 | | Special Situations | 4.3% XLE, 2.2% PSCE | 7.6 | Reduced 5.6% | 2021-04-22 | | Cash | | 49.4 | | |
|
Updates (Changes made today are underlined)
Much of our momentum and trend work has remained positive for several months, with some scattered exceptions. Almost all sentiment-related work has shown a poor risk/reward ratio for stocks, especially as speculation drove to record highs in exuberance in February. Much of that has worn off, and most of our models are back toward neutral levels. There isn't much to be excited about here. The same goes for bonds and even gold. Gold has been performing well lately and is back above long-term trend lines. The issue is that it has a poor record of holding onto gains when attempting a long-term trend change like this, so we'll take a wait-and-see approach. RETURN YTD: 10.0% 2020: 8.1%, 2019: 12.6%, 2018: 0.6%, 2017: 3.8%, 2016: 17.1%, 2015: 9.2%, 2014: 14.5%, 2013: 2.2%, 2012: 10.8%, 2011: 16.5%, 2010: 15.3%, 2009: 23.9%, 2008: 16.2%, 2007: 7.8%
|
|
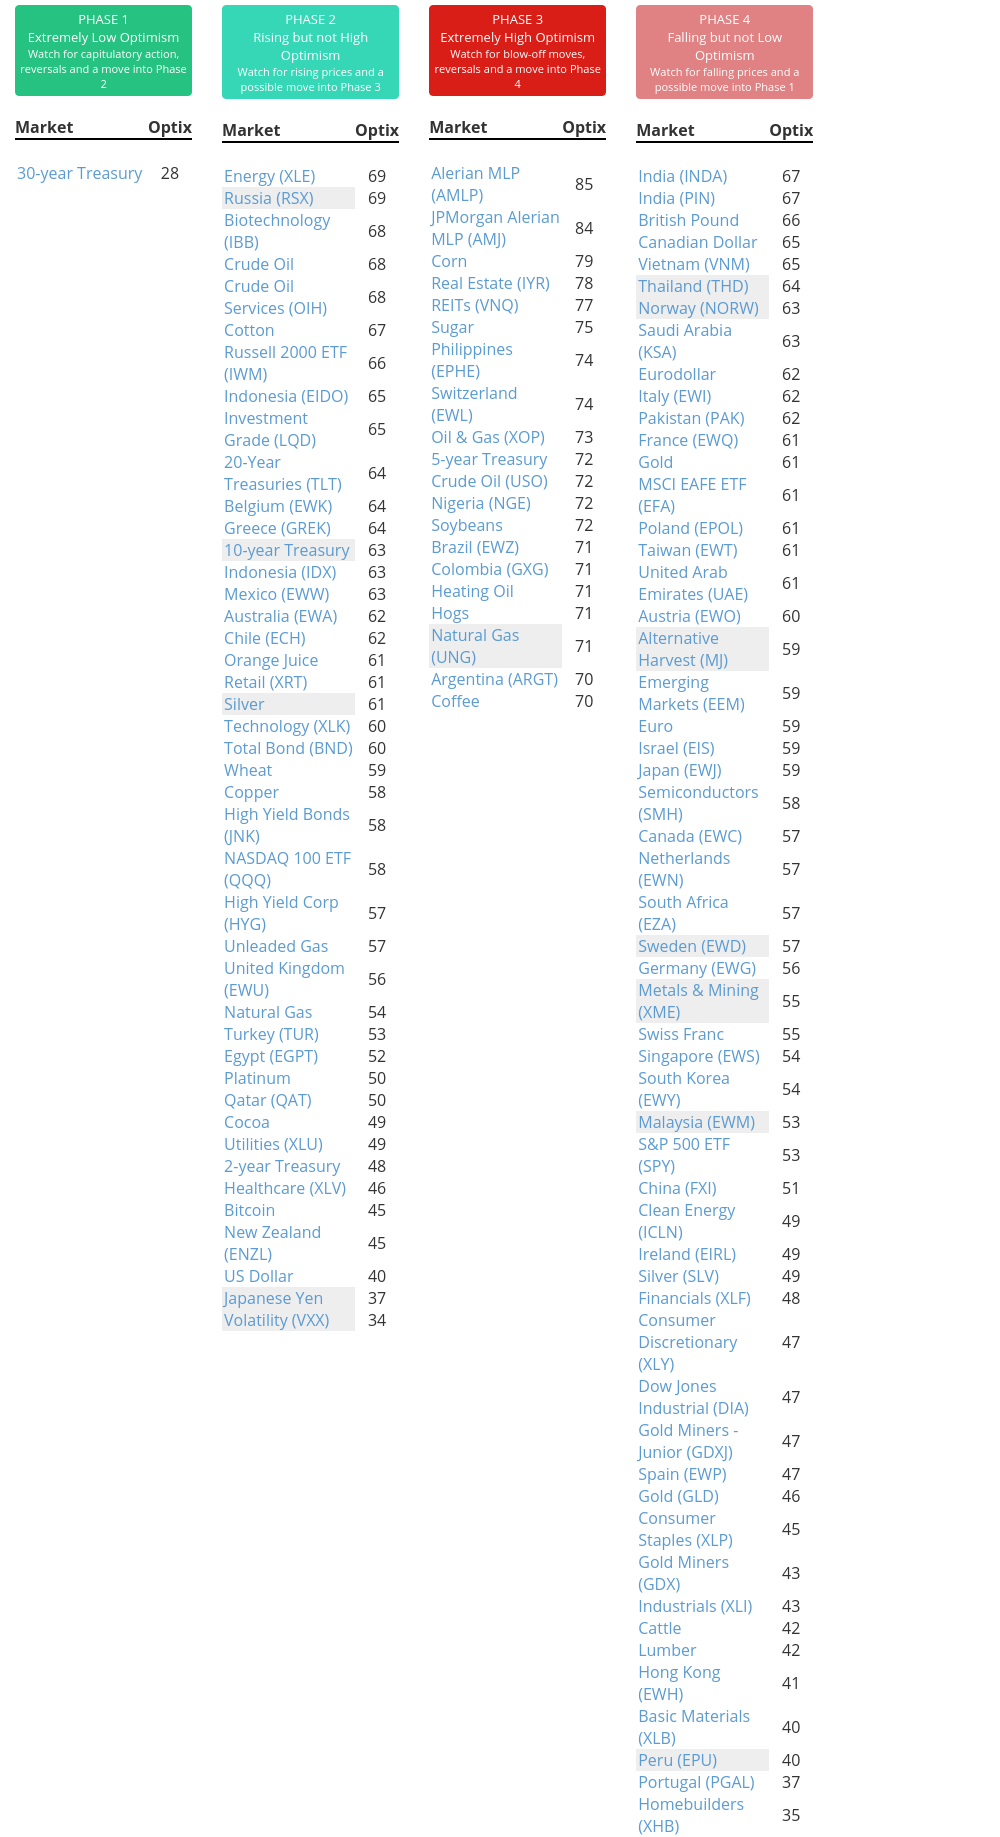
Phase Table
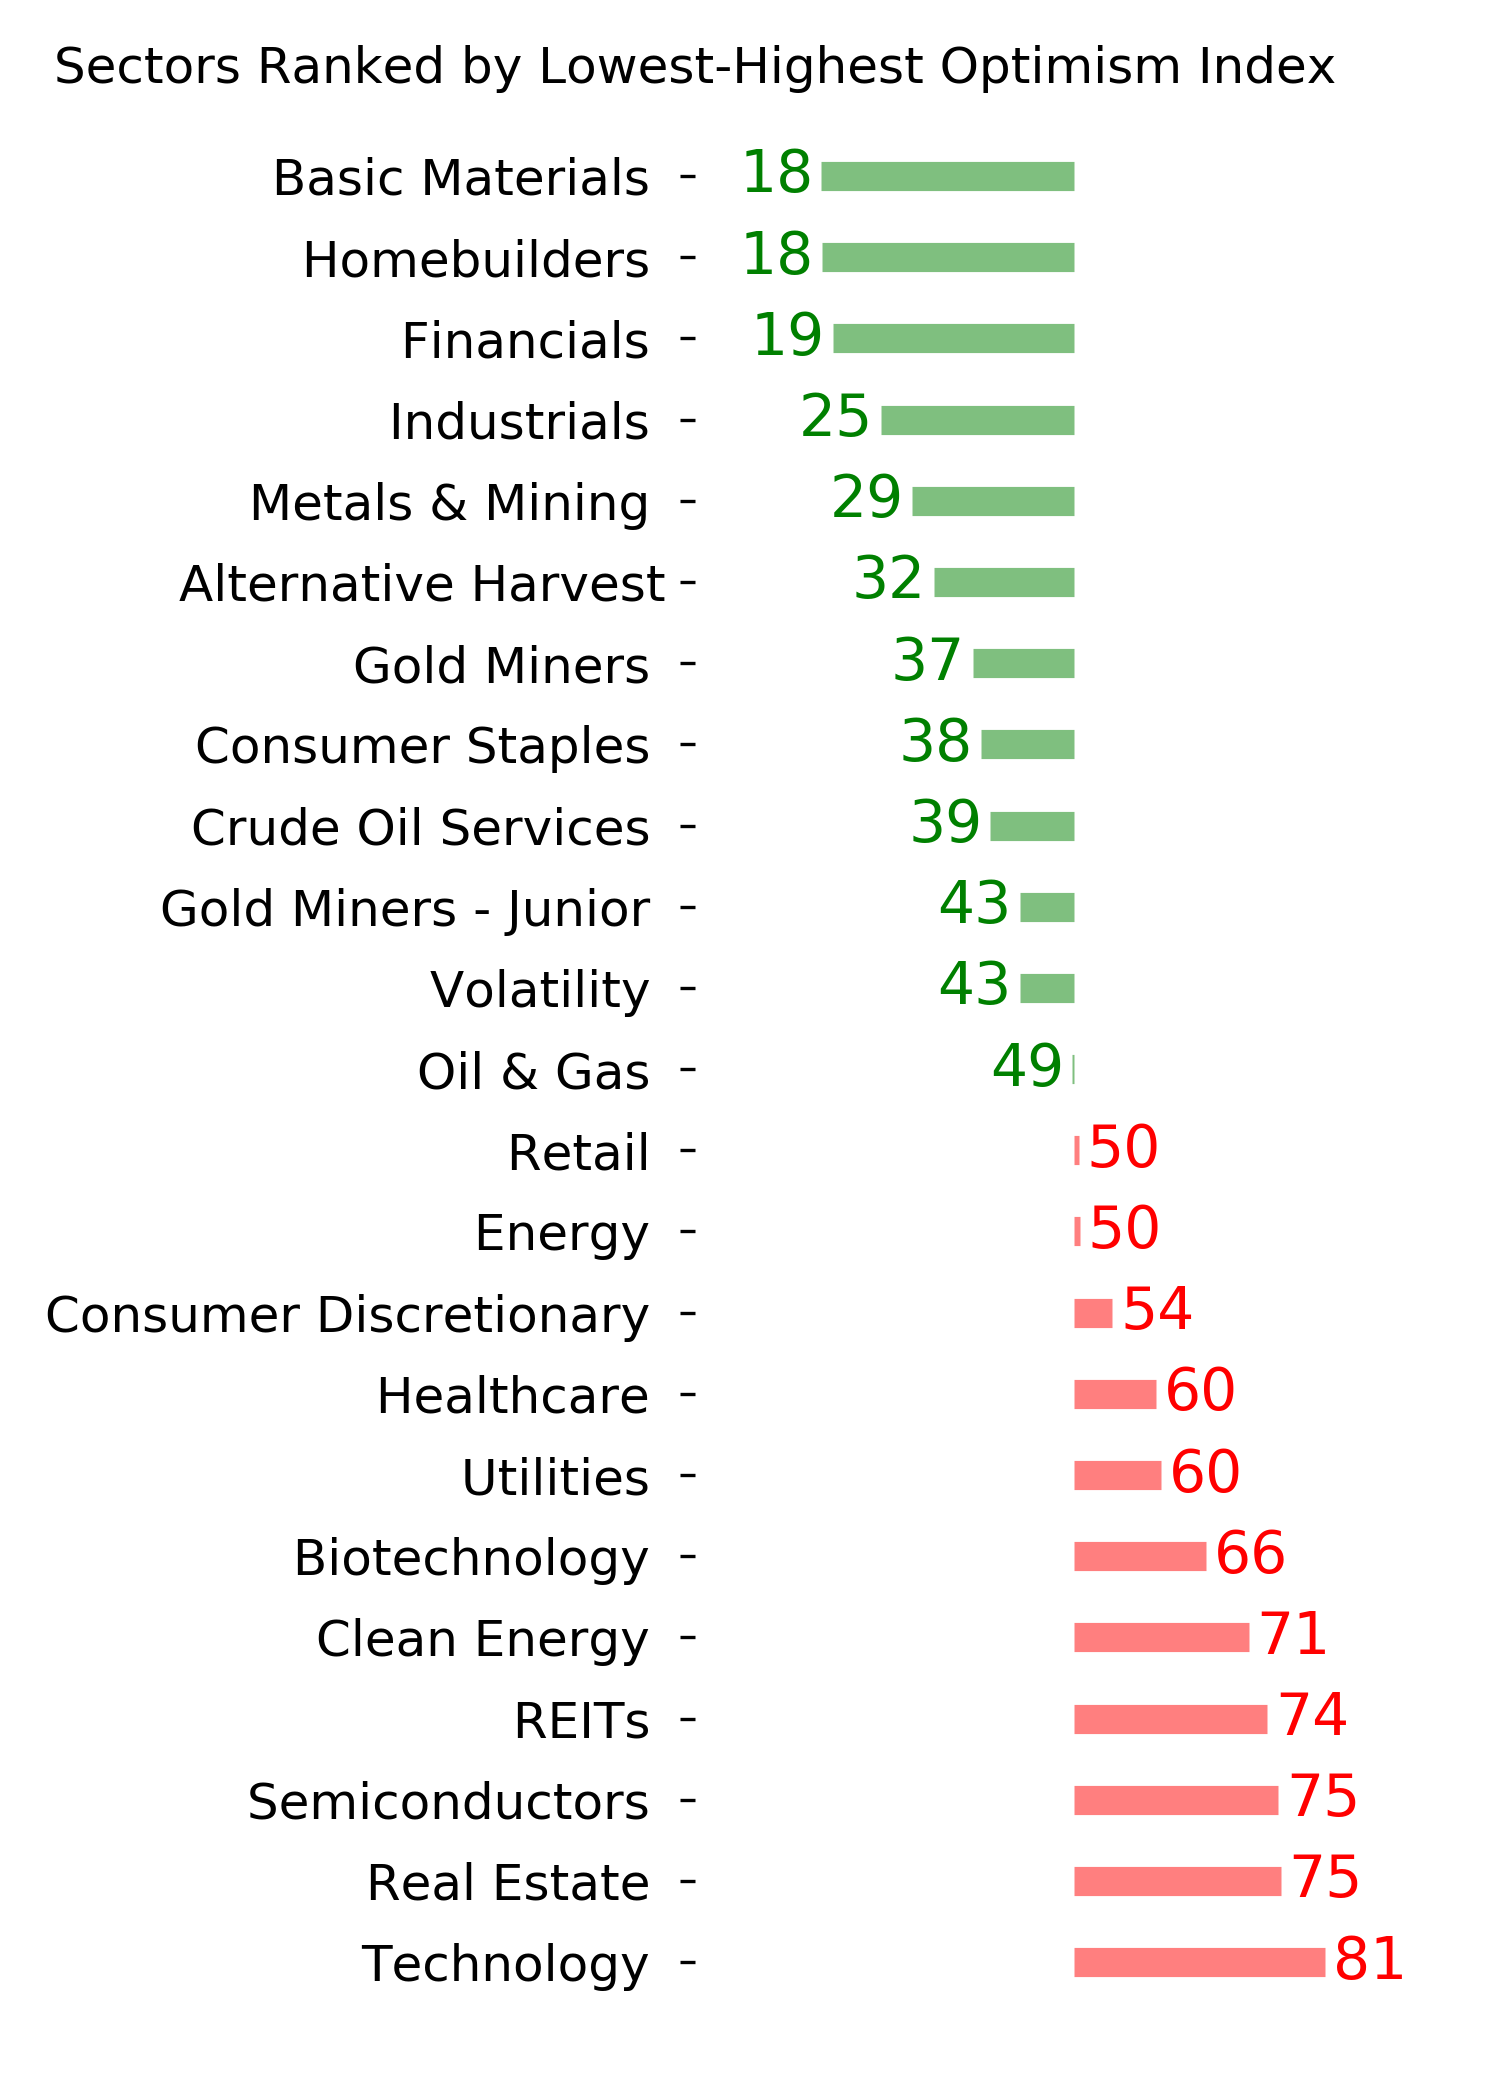
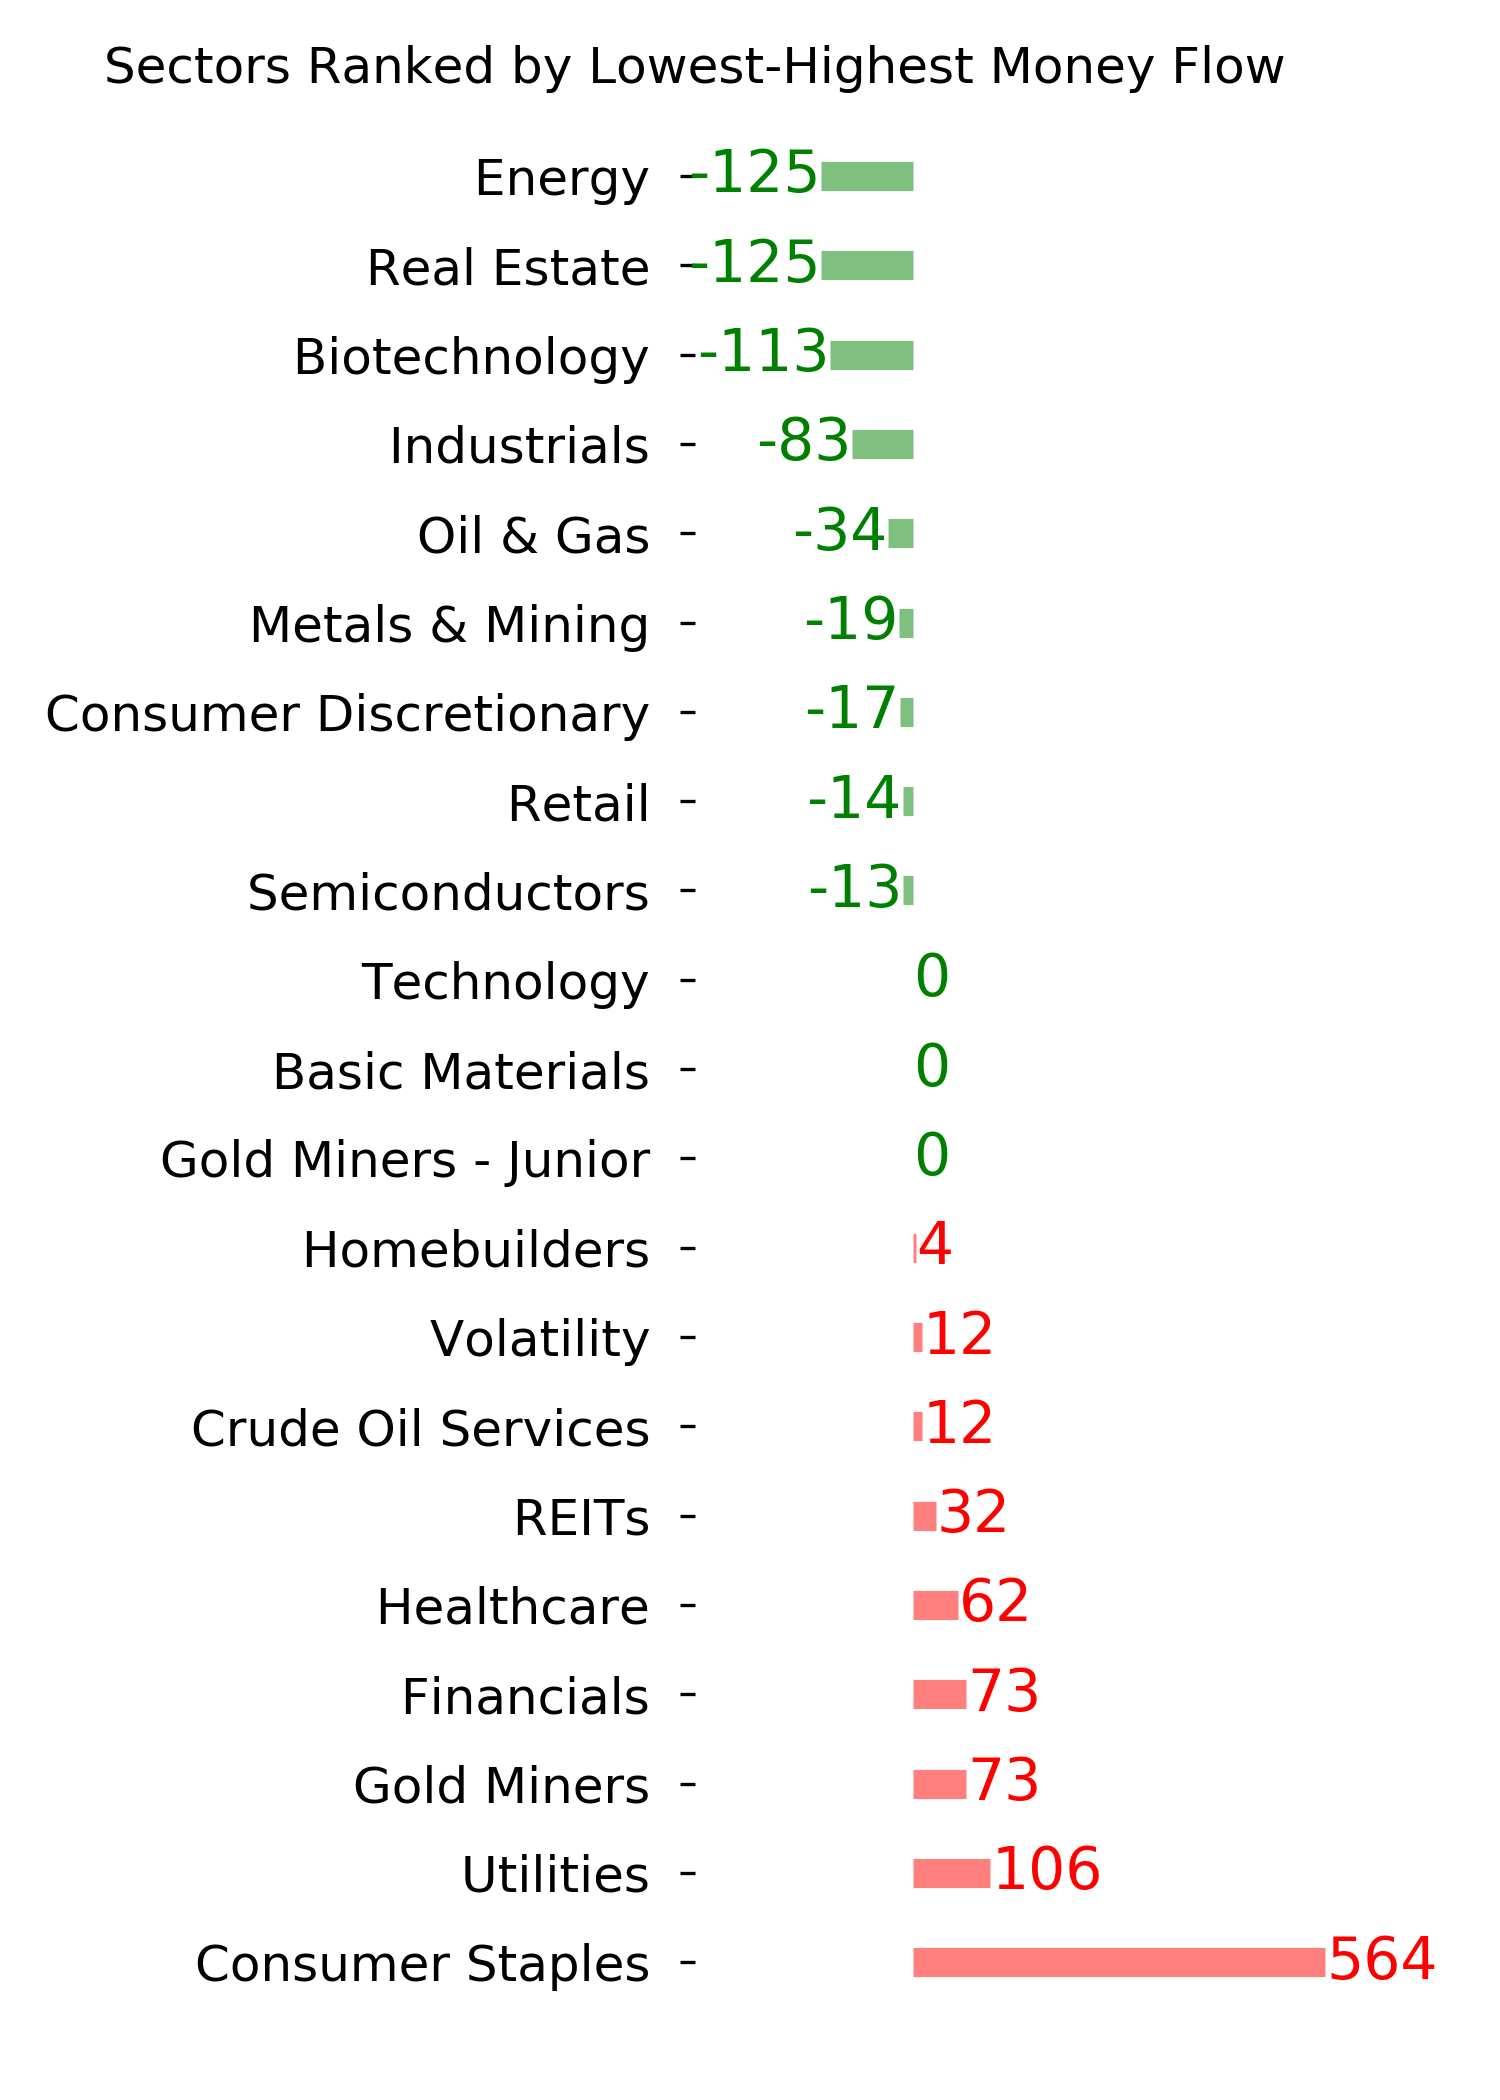
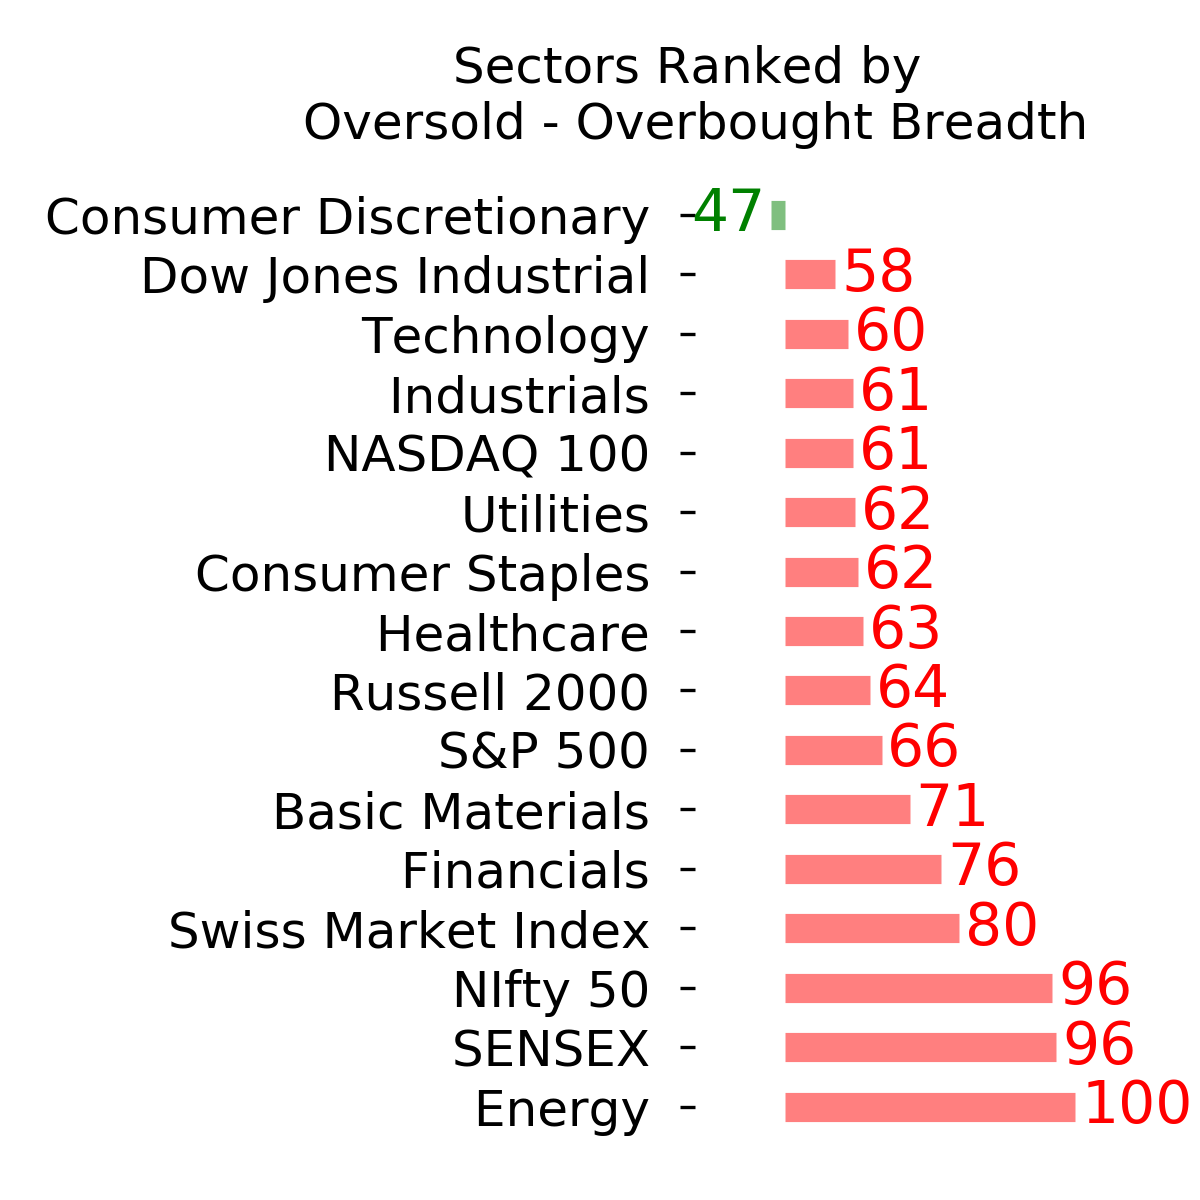
Ranks
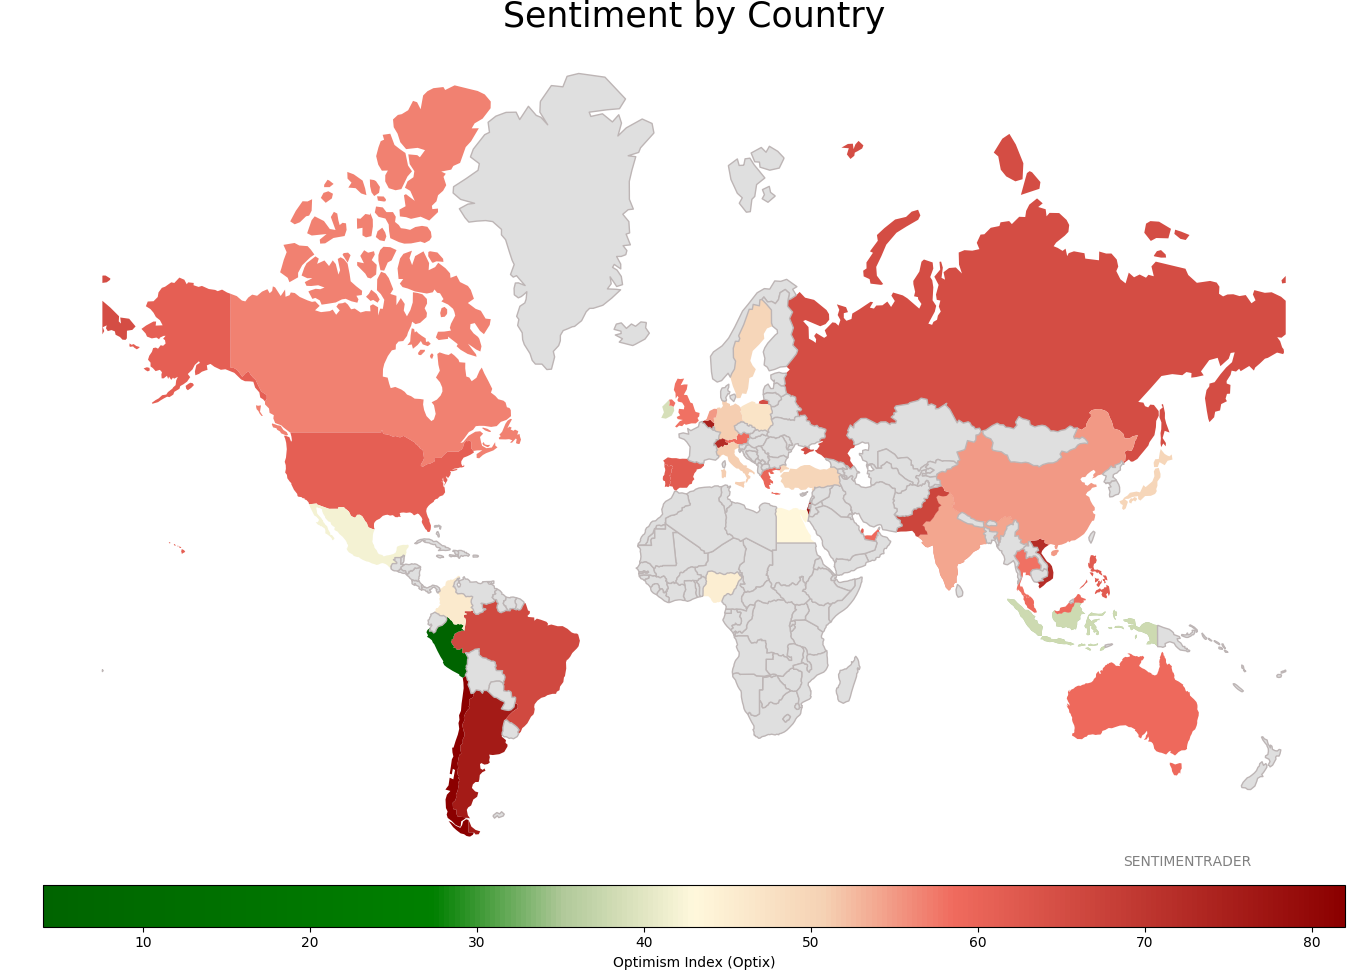
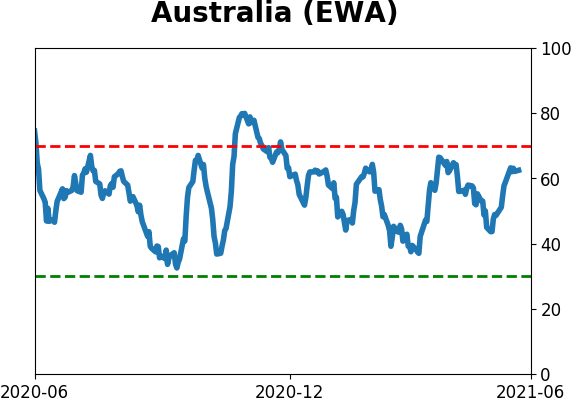
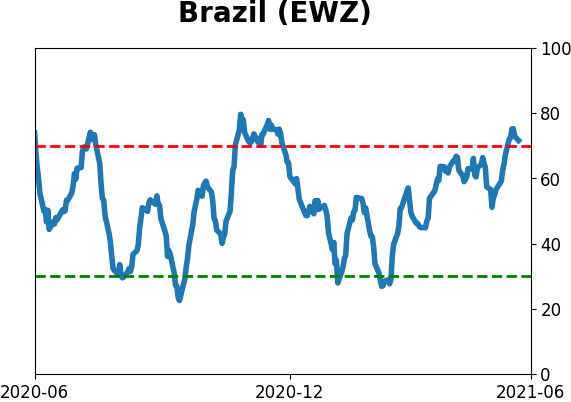
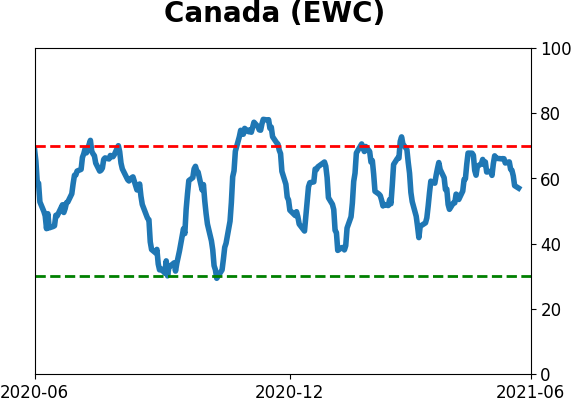
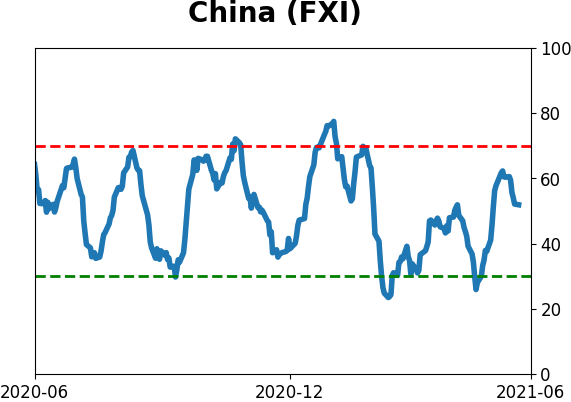
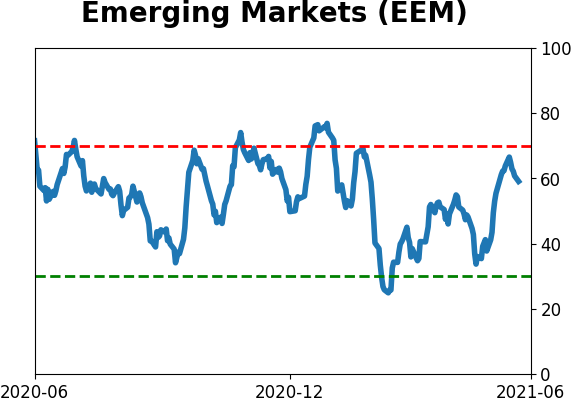
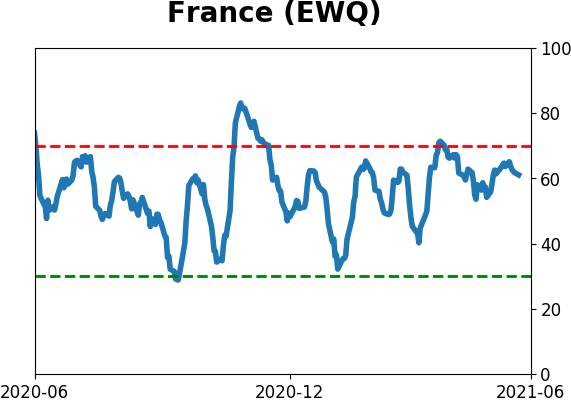
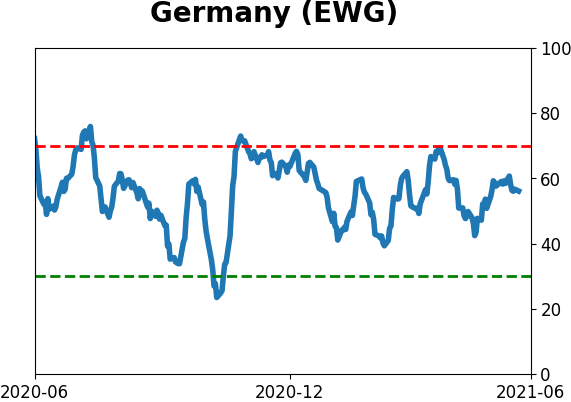
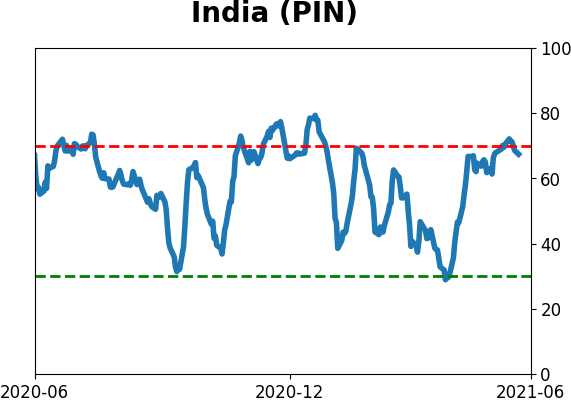
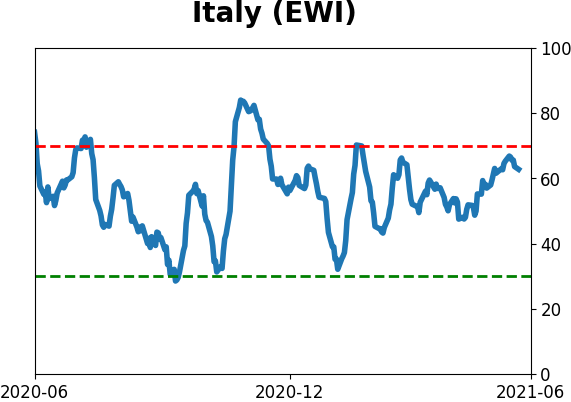
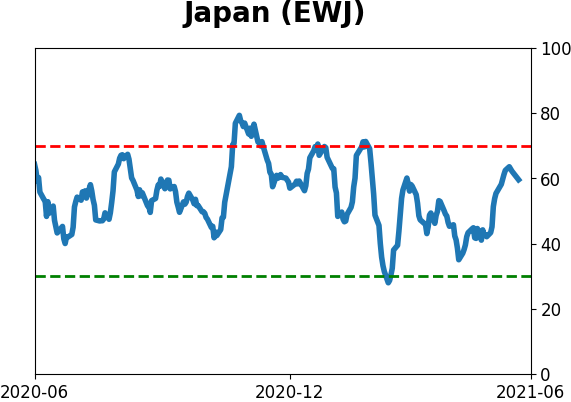
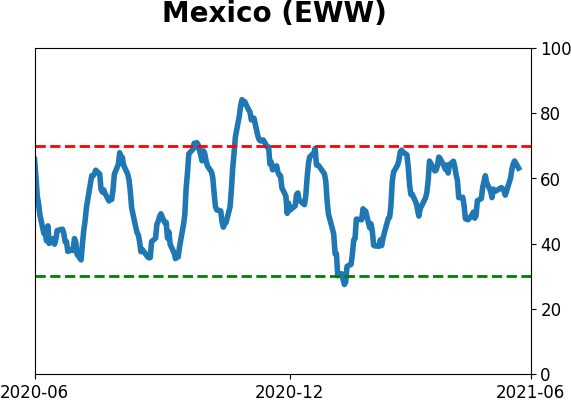
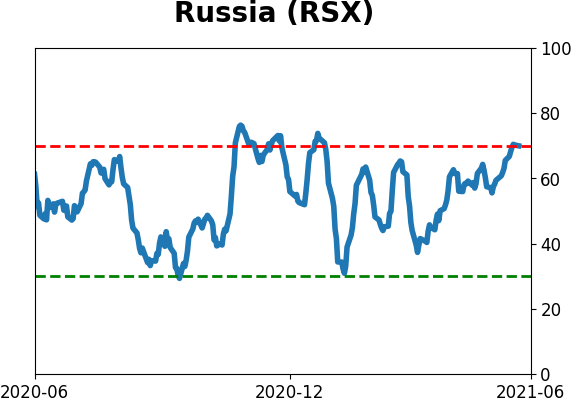
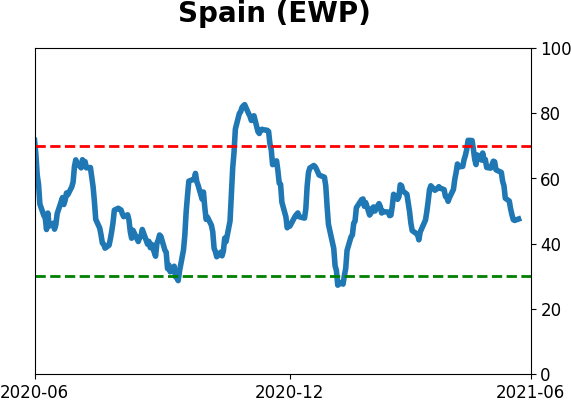
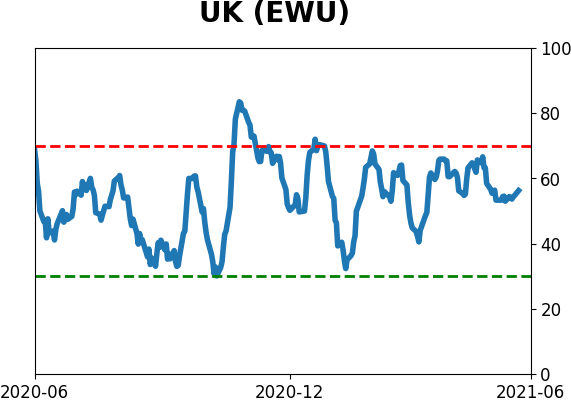
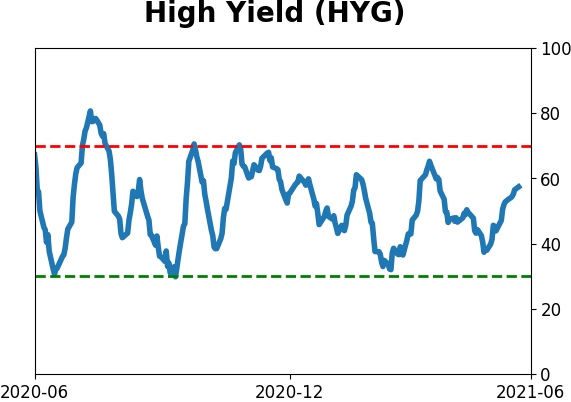
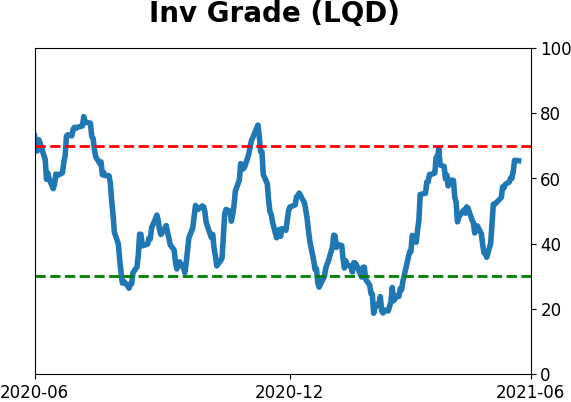
Sentiment Around The World
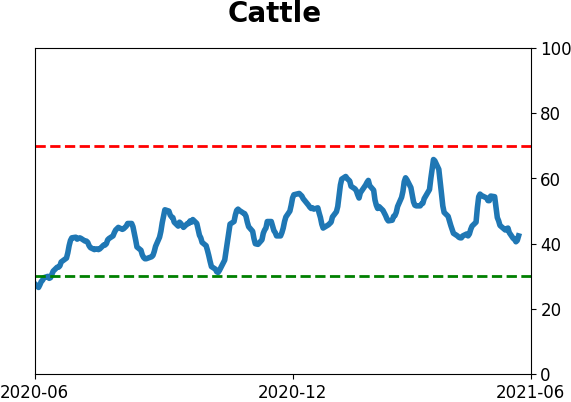
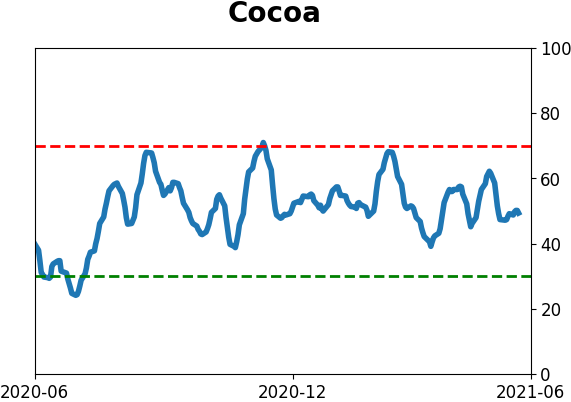
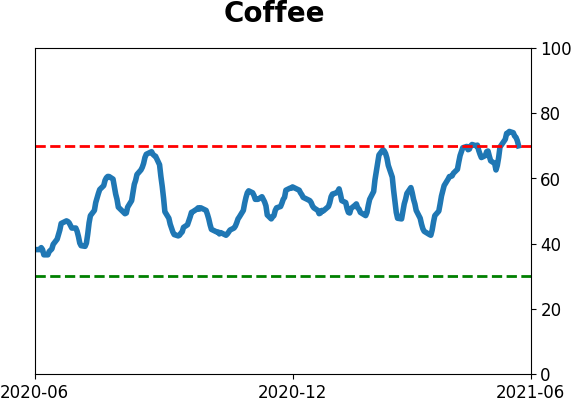
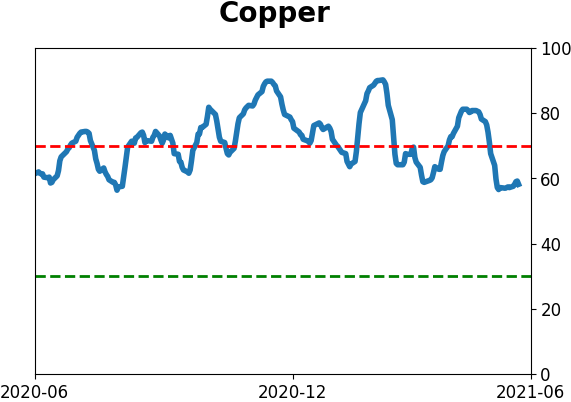
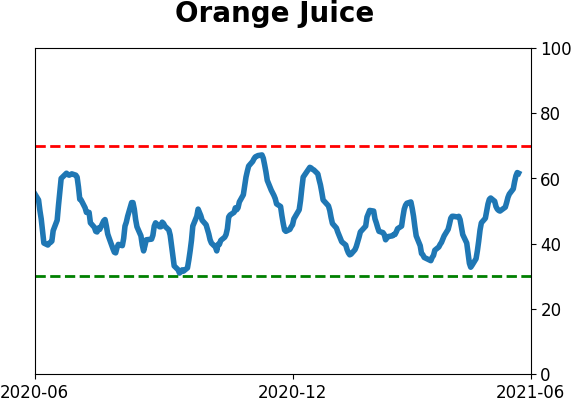
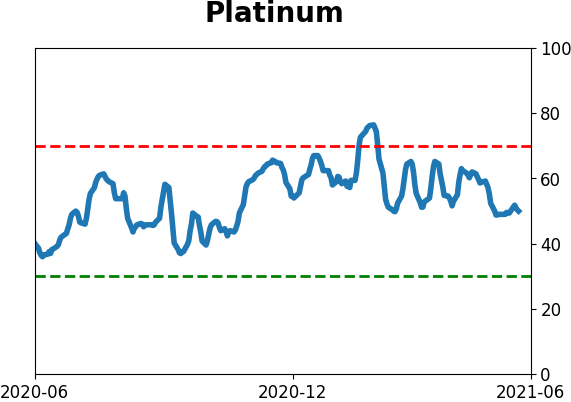
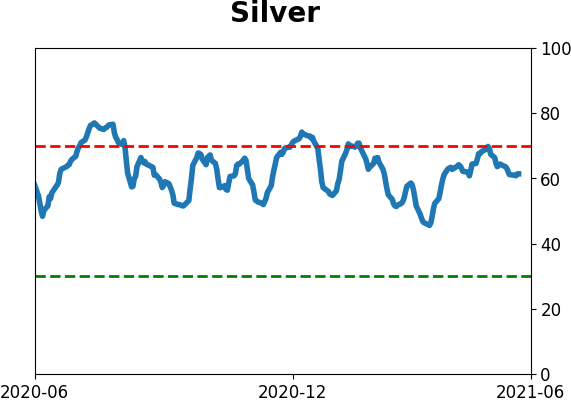
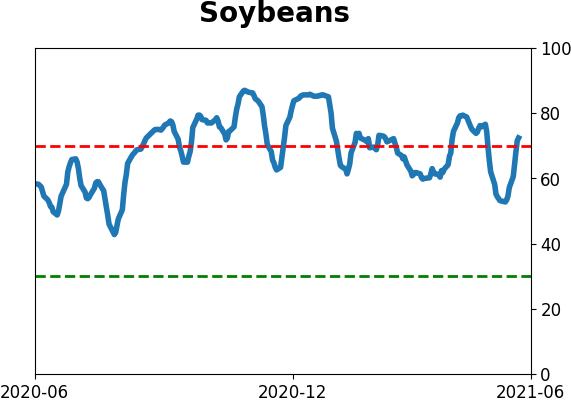
Optimism Index Thumbnails
|
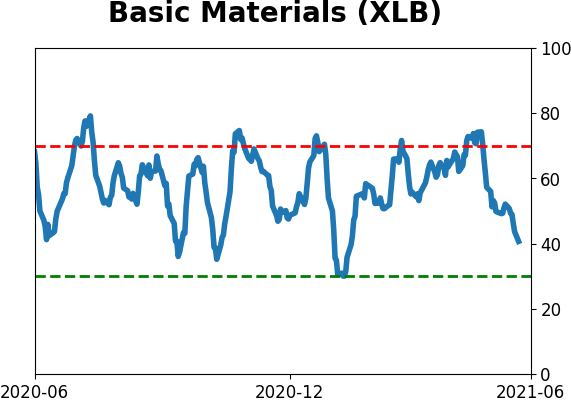
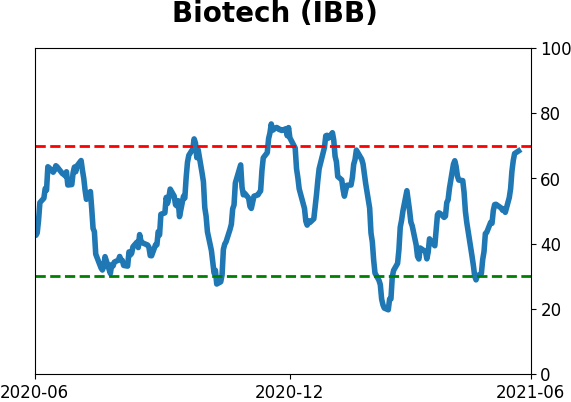
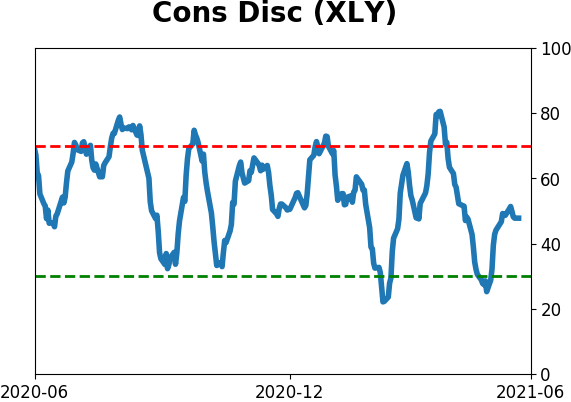
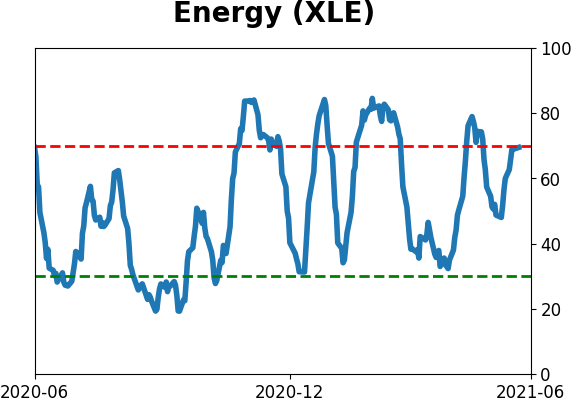
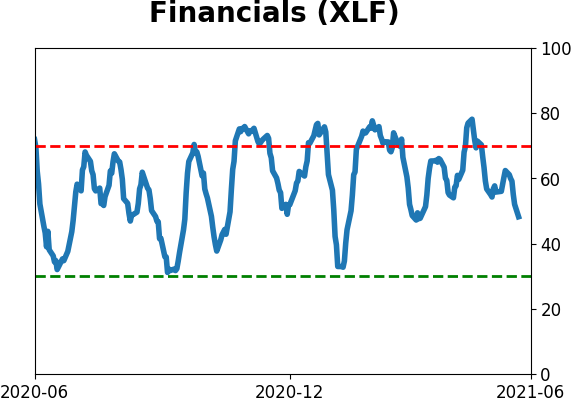
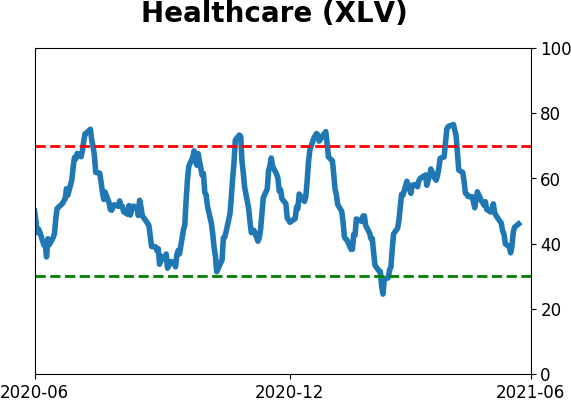
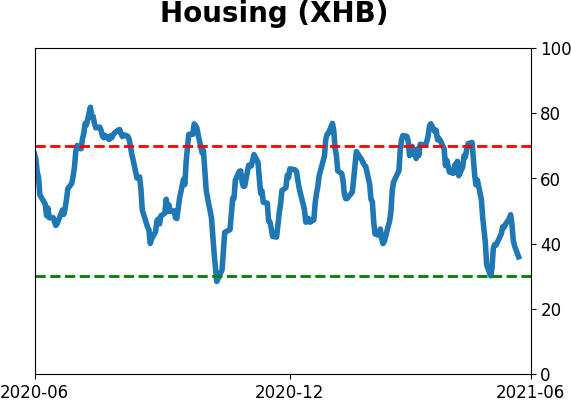
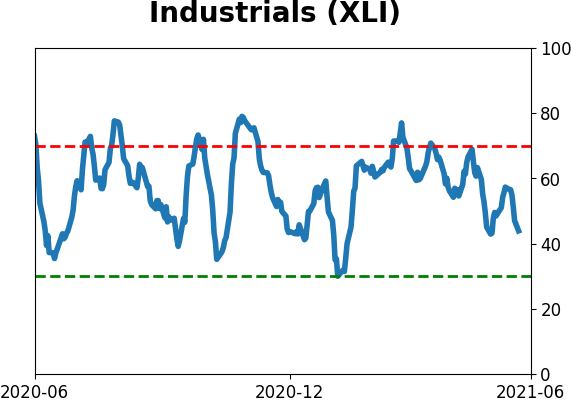
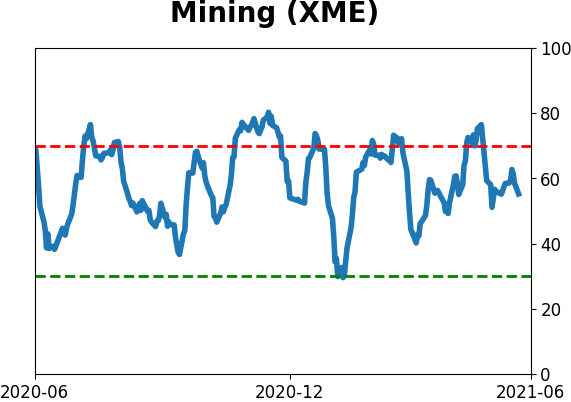
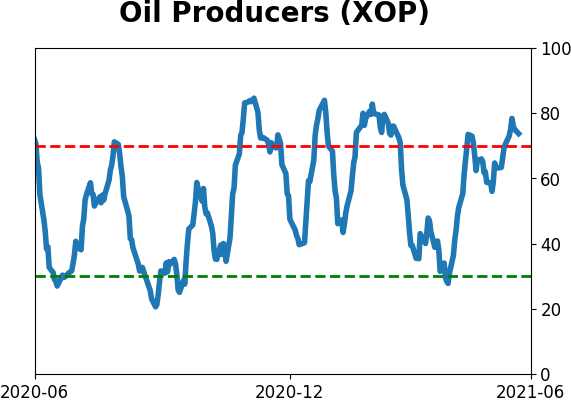
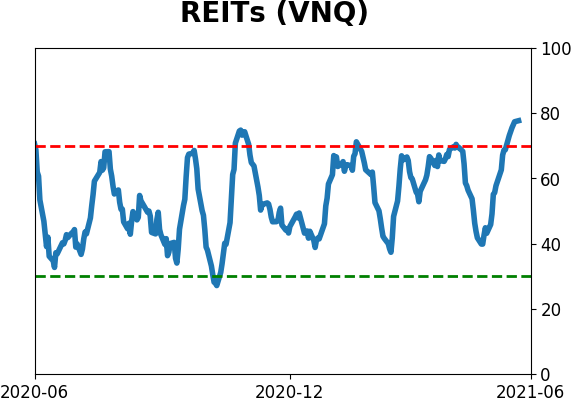
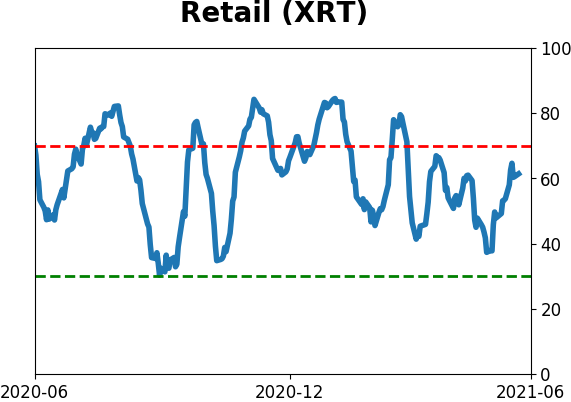
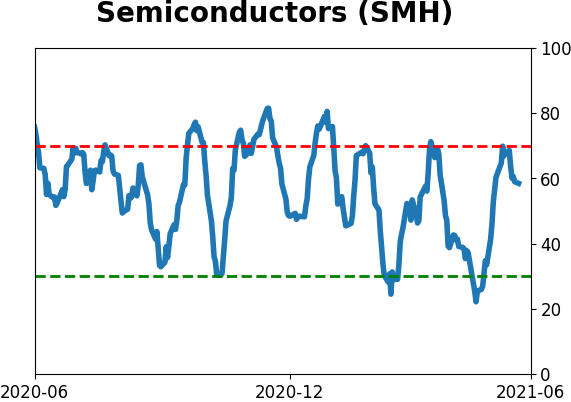
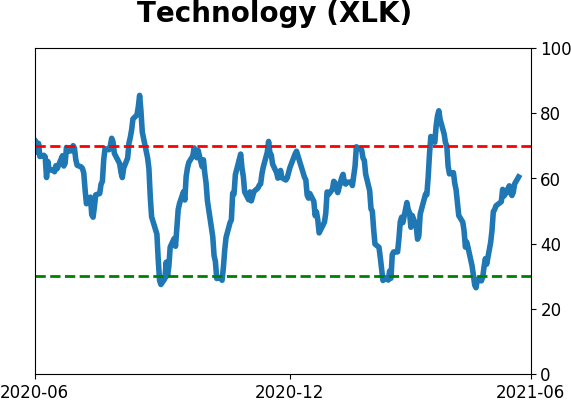
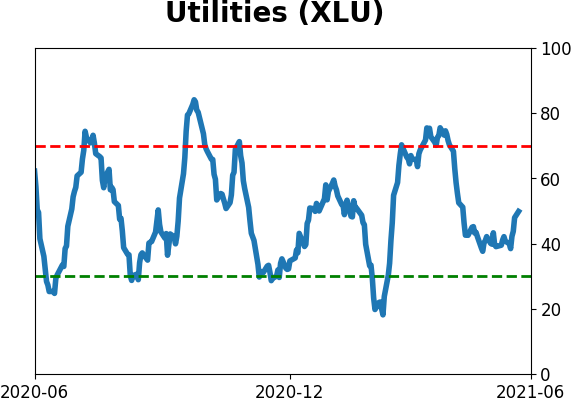
Sector ETF's - 10-Day Moving Average
|
|
|
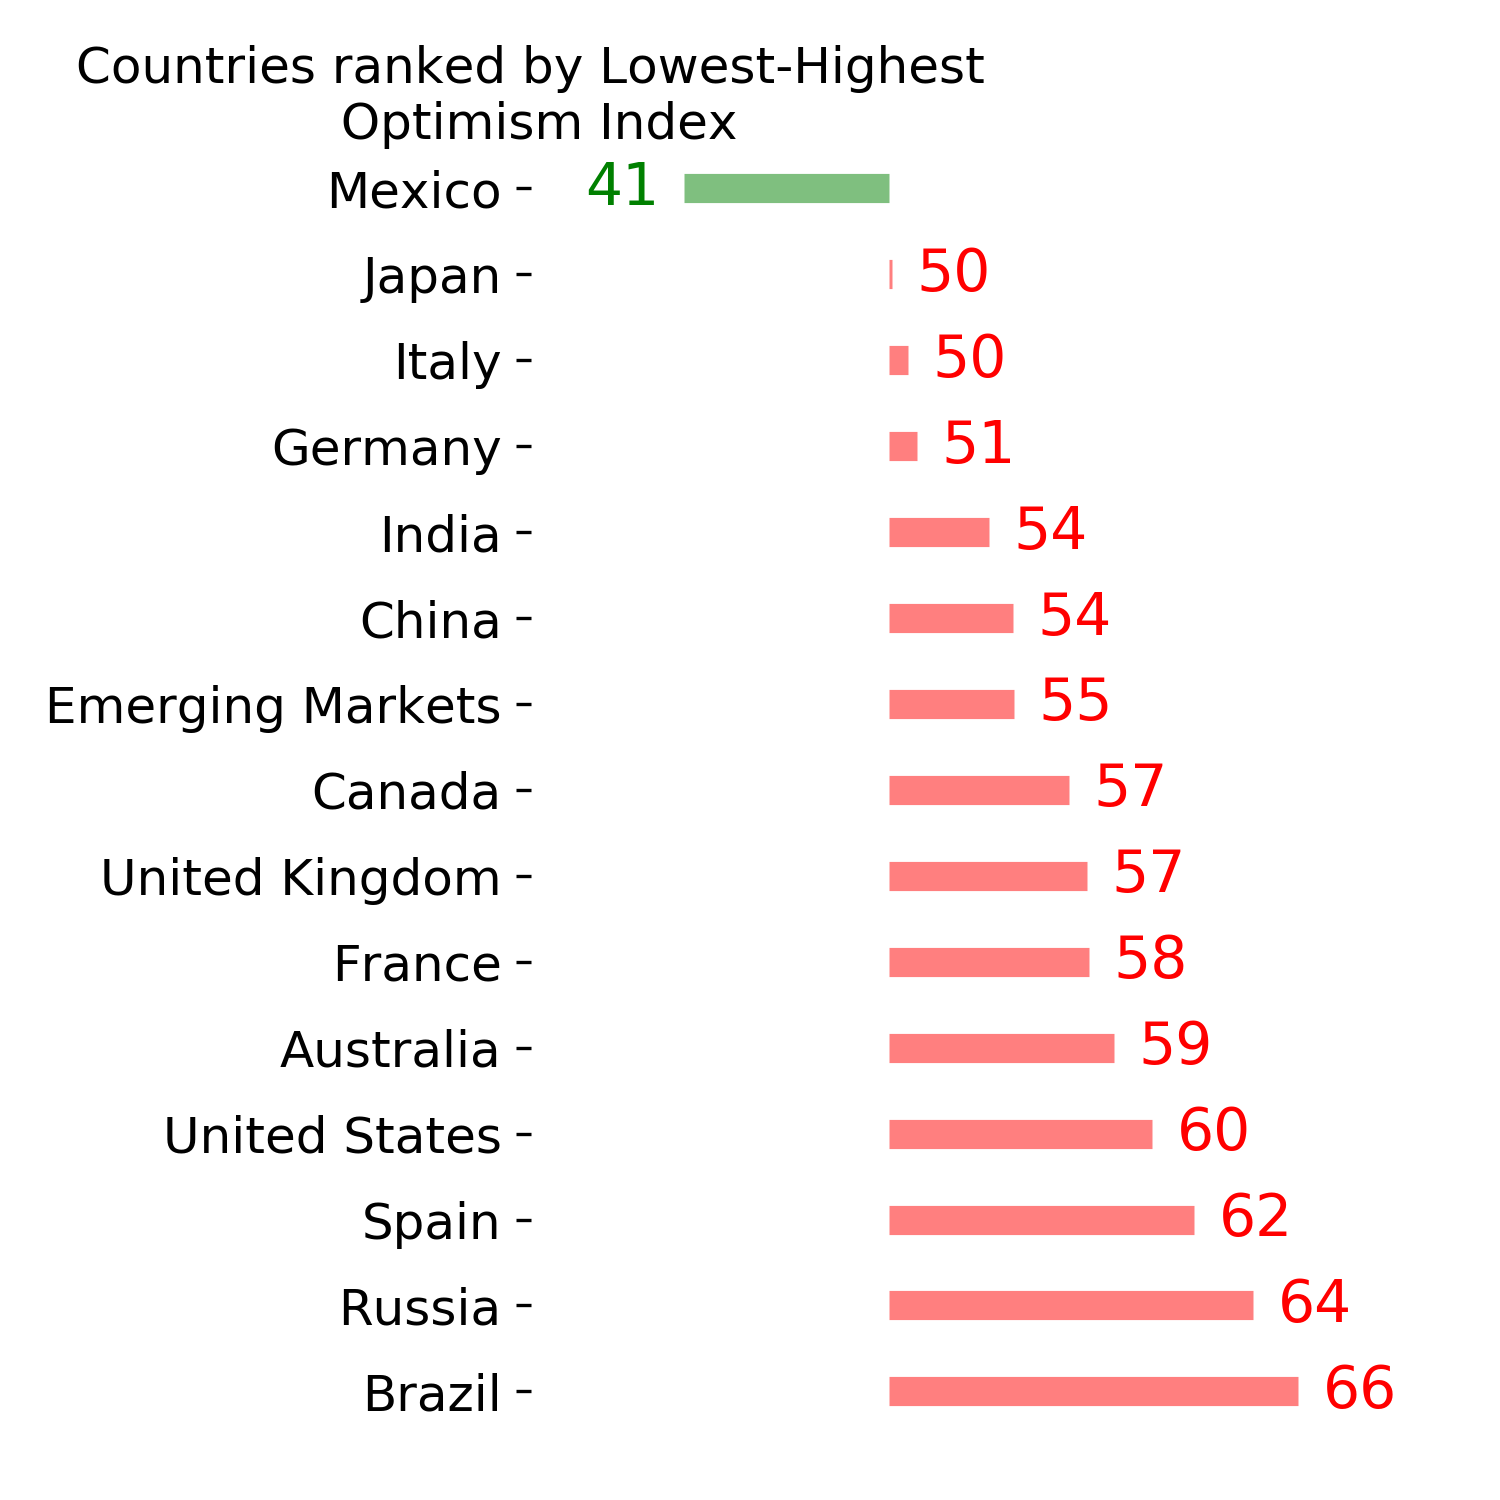
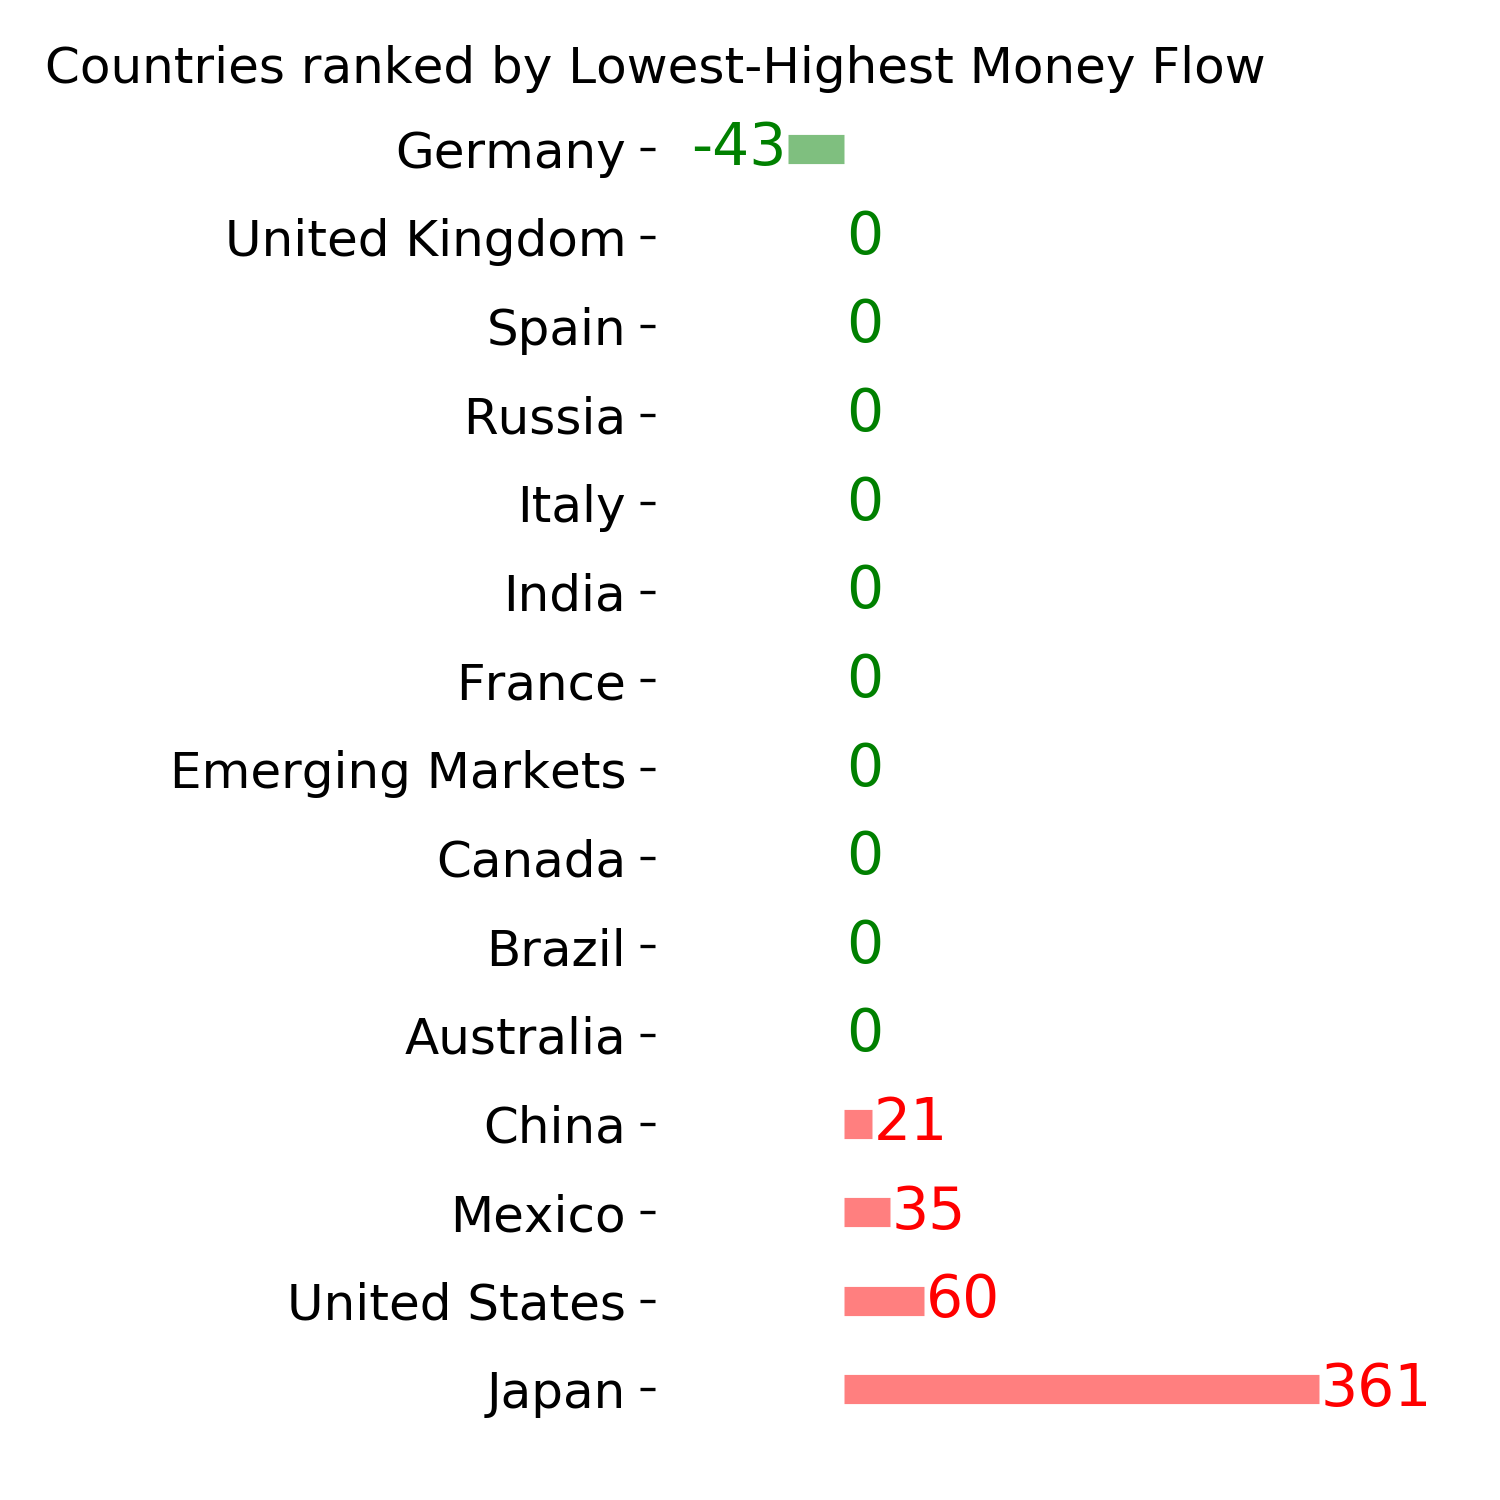
Country ETF's - 10-Day Moving Average
|
|
|
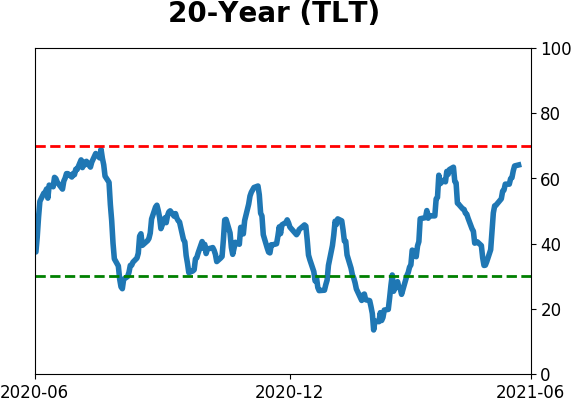
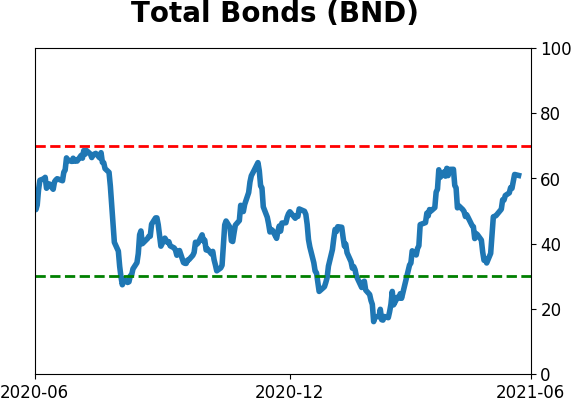
Bond ETF's - 10-Day Moving Average
|
|
|
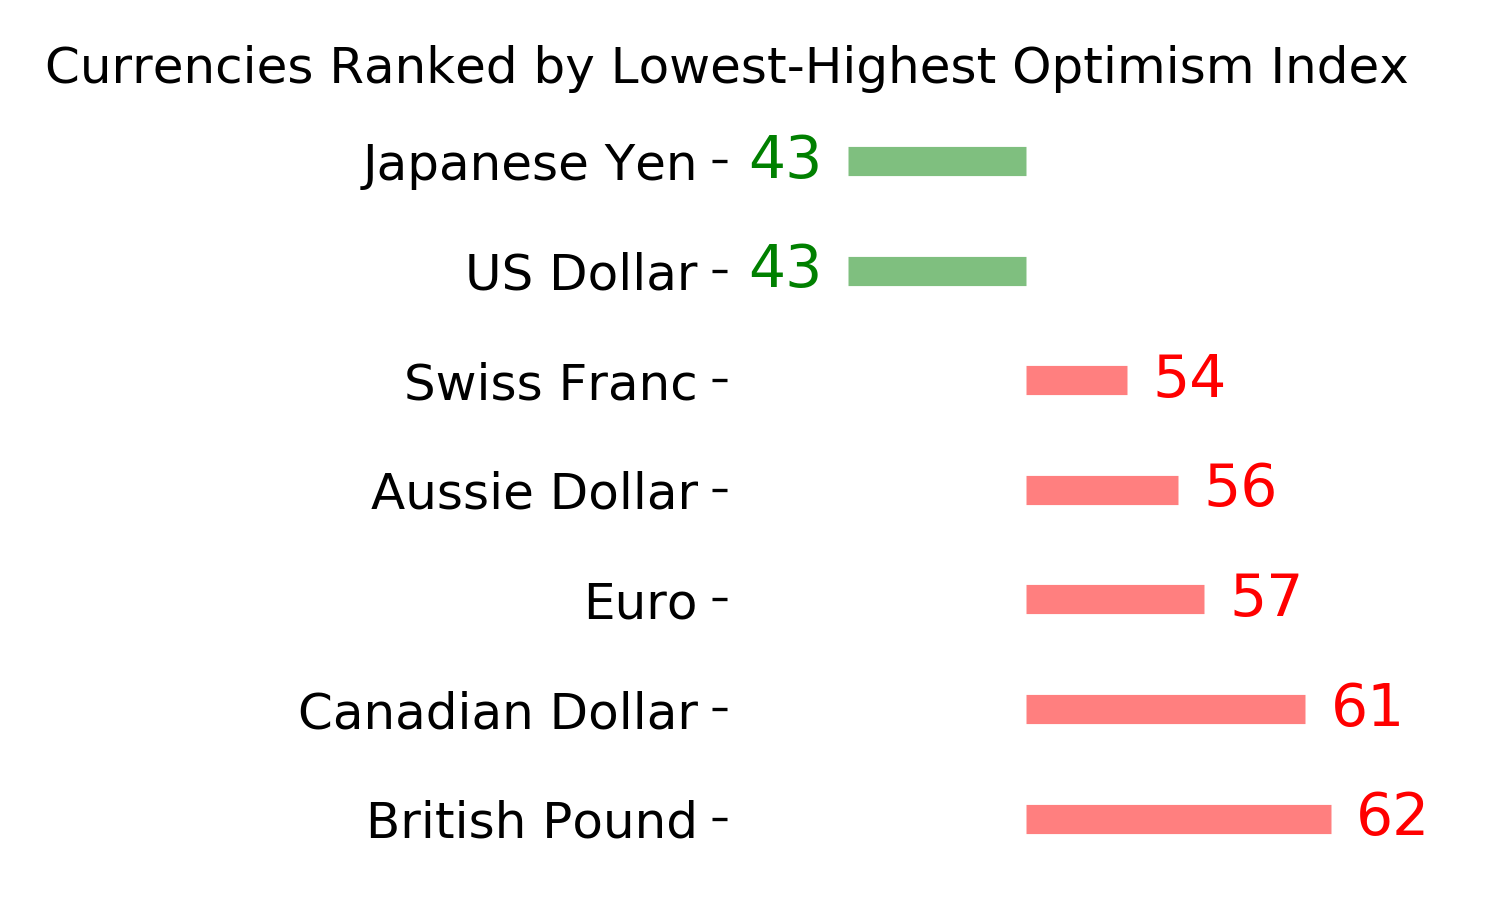
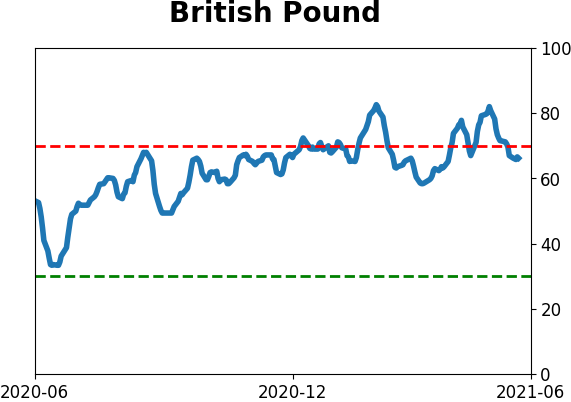
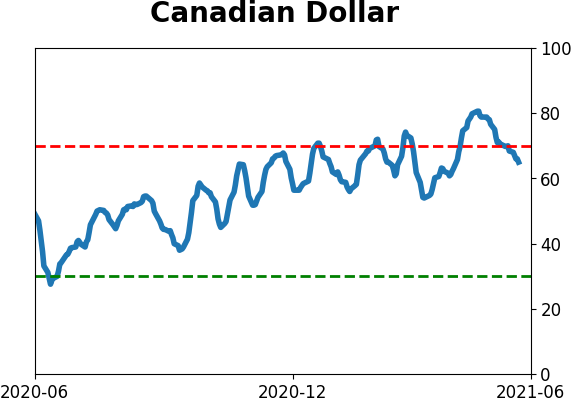
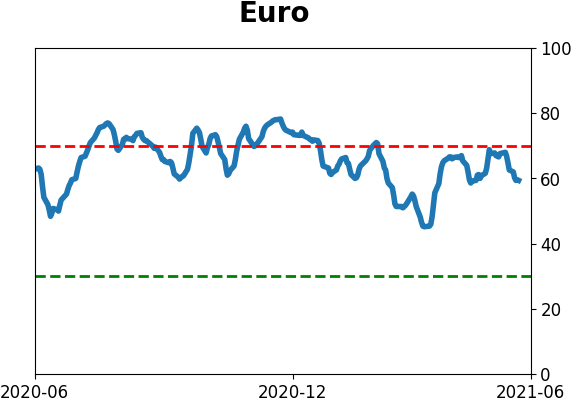
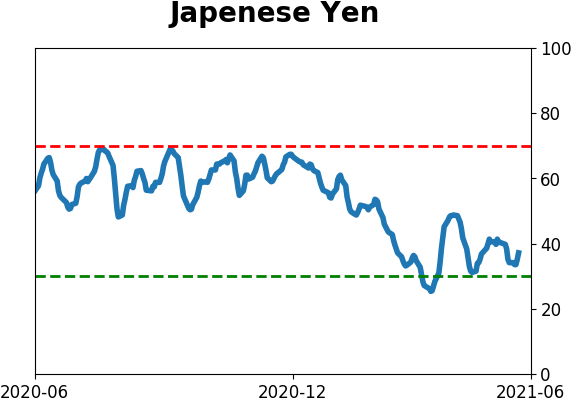
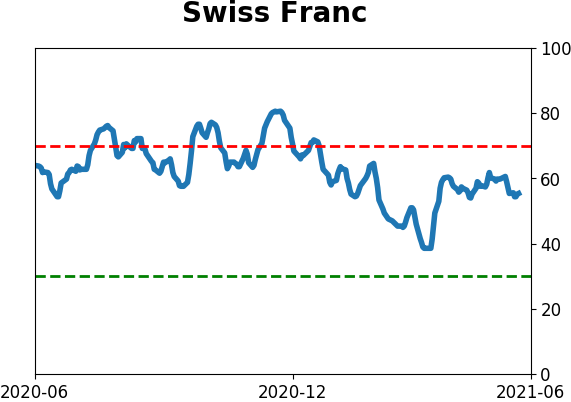
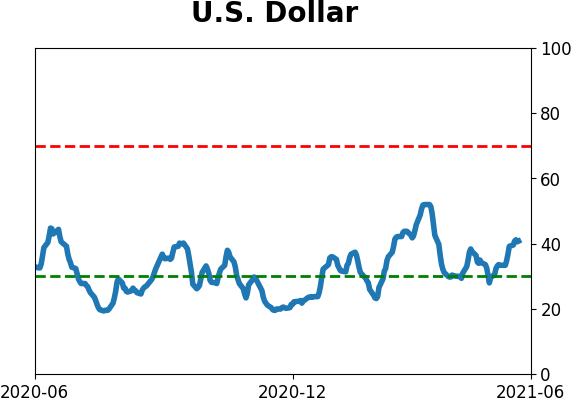
Currency ETF's - 5-Day Moving Average
|
|
|
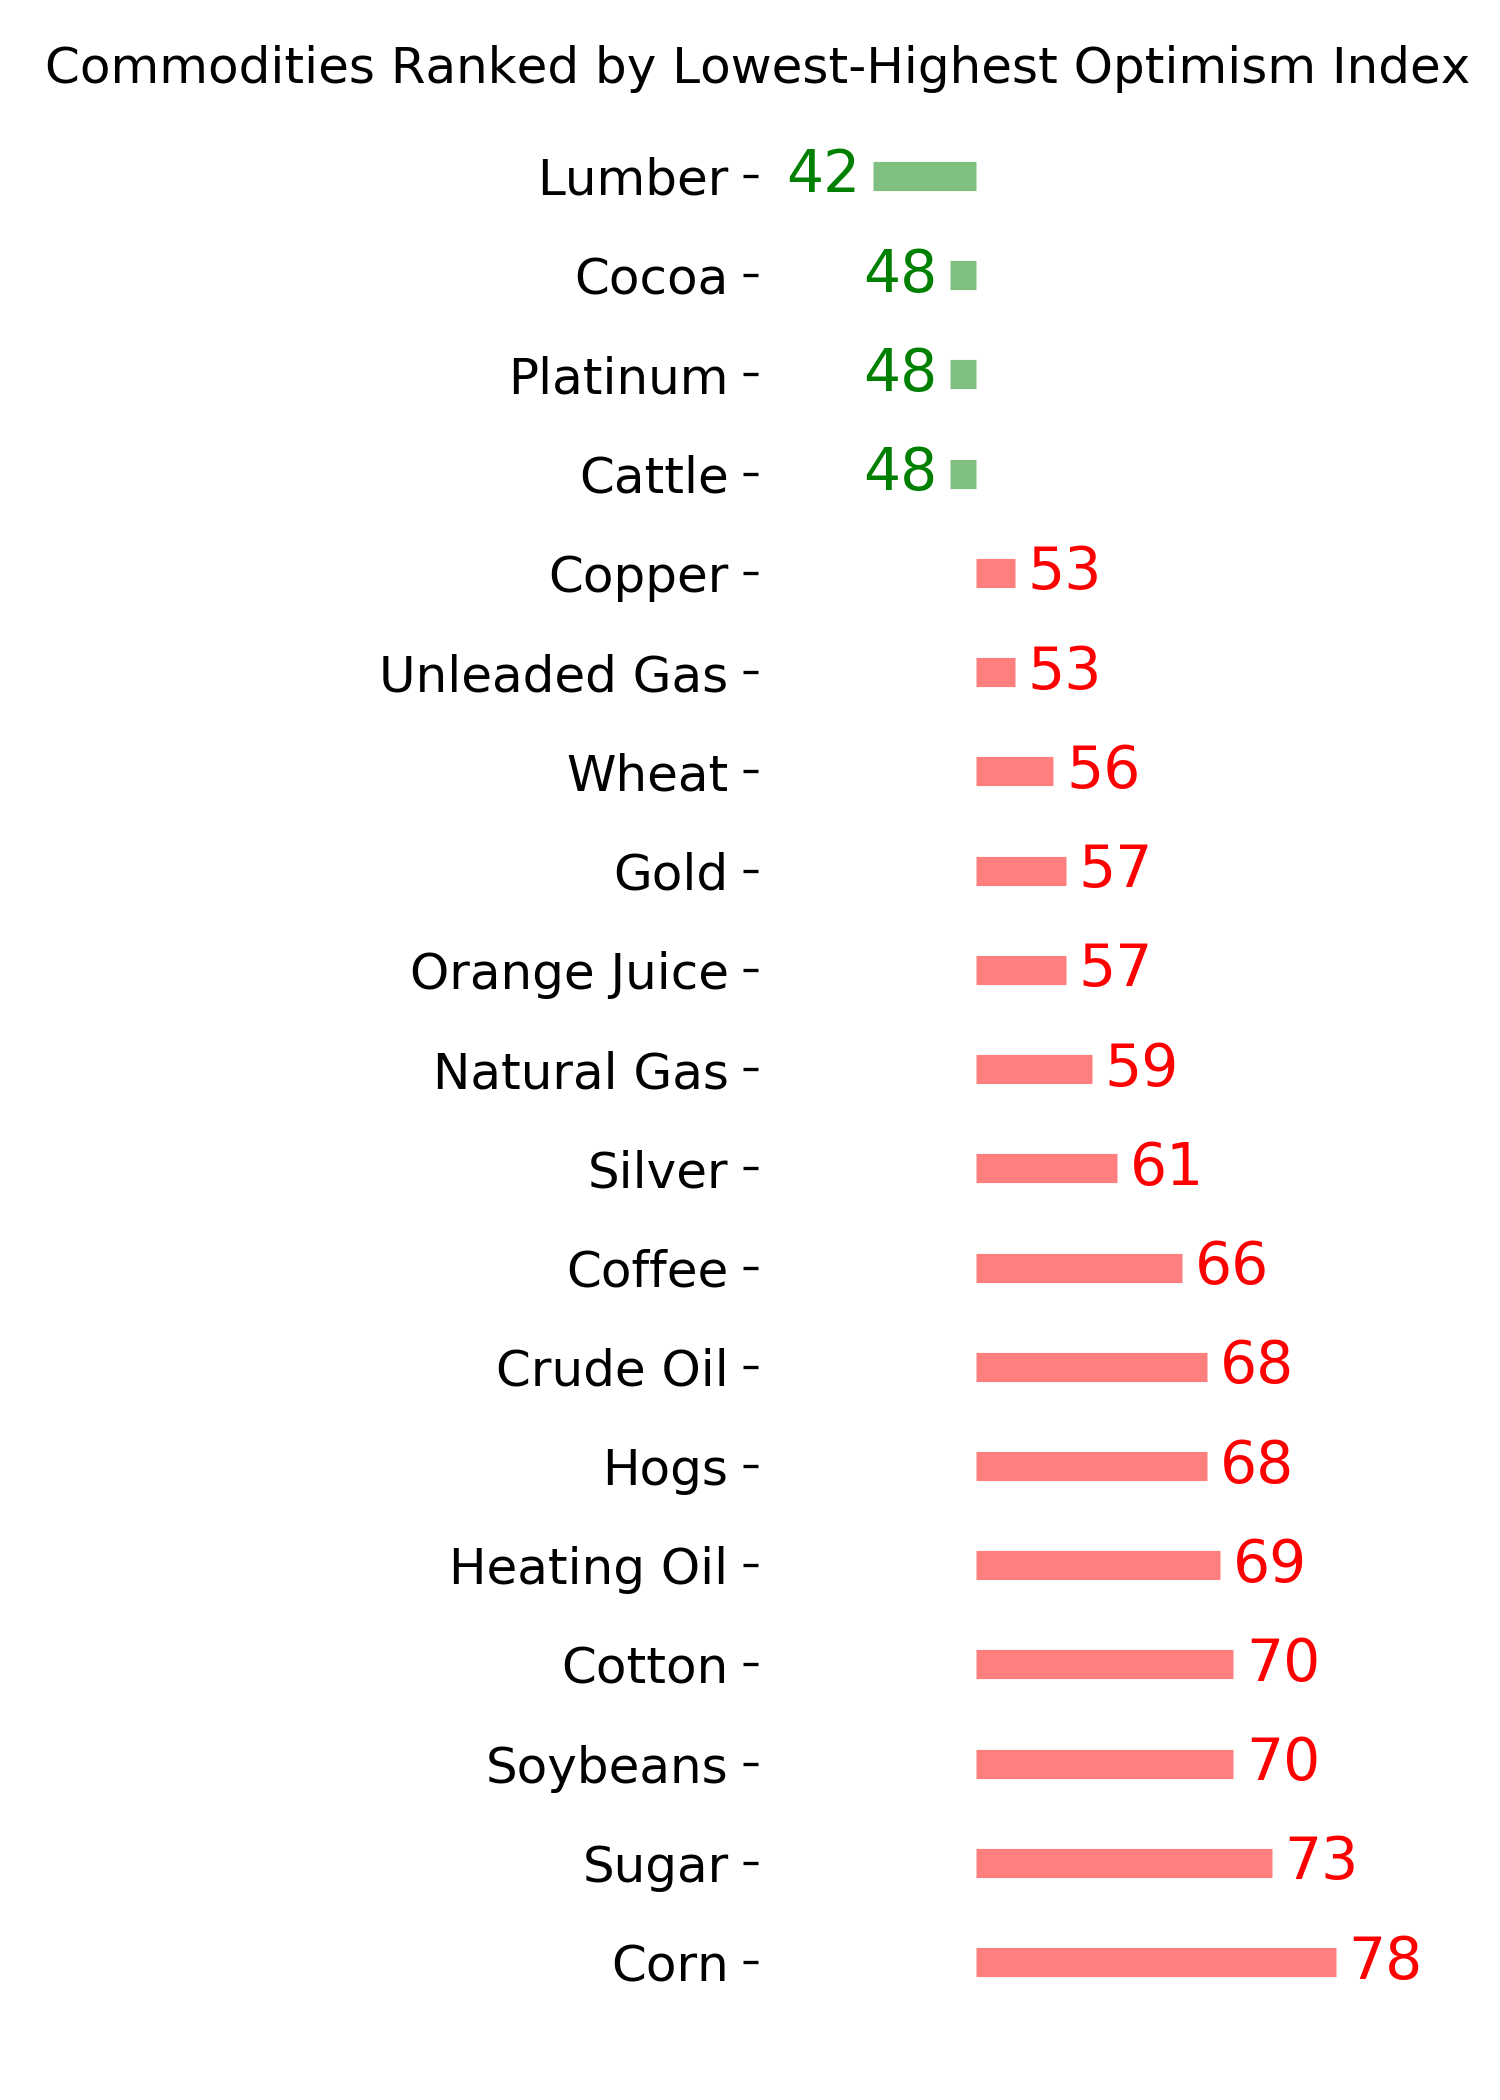
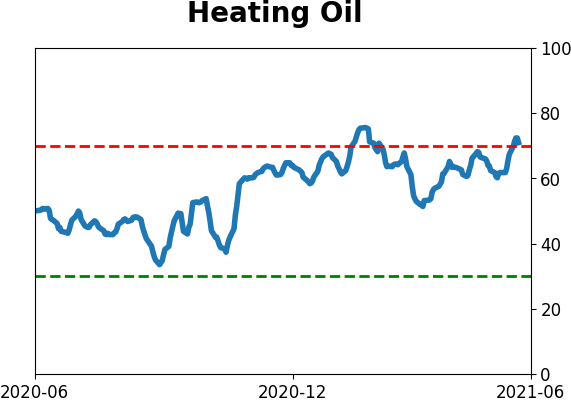
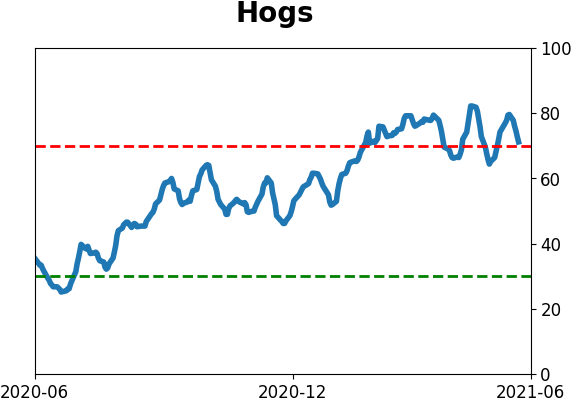
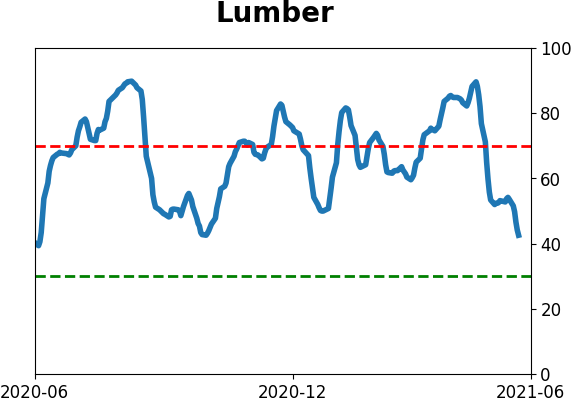
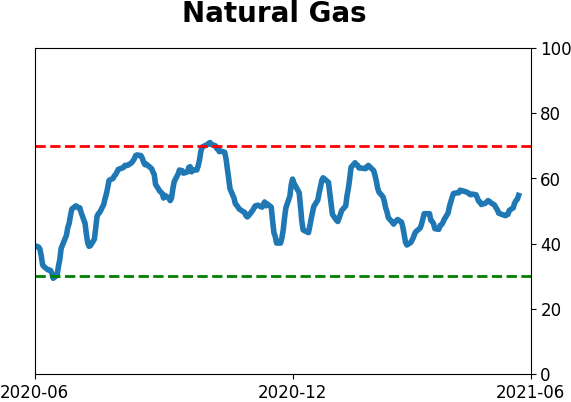
Commodity ETF's - 5-Day Moving Average
|
|