Headlines
|
|
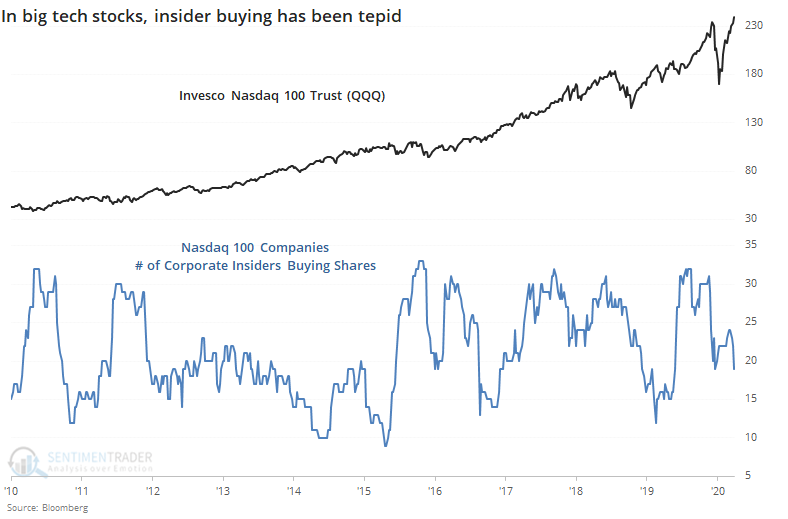
Corporate insiders favor S&P 500 stocks, not Nasdaq 100, as trends diverge:
Corporate insiders in S&P 500 companies greatly picked up their pace of buying as shares fell in March, and they're continuing to buy. In Nasdaq 100 companies, though, insider buying has been tepid. The ratio between insider buys in the S&P 500 versus Nasdaq 100 is now at a decade high. This comes even as the Nasdaq has been above its 20-day average for more than two months, while the S&P has not.
Short-term breadth is as horrid as longer-term is impressive:
Over a 10-day period, we recently witnessed a historic thrust of positive breadth, with the 10-day Up Volume Ratio reaching near-record highs. The past 3 days, however, have seen overwhelmingly negative breadth. It doesn't completely cancel the longer-term positives, but it makes the shorter-term more of a worry.
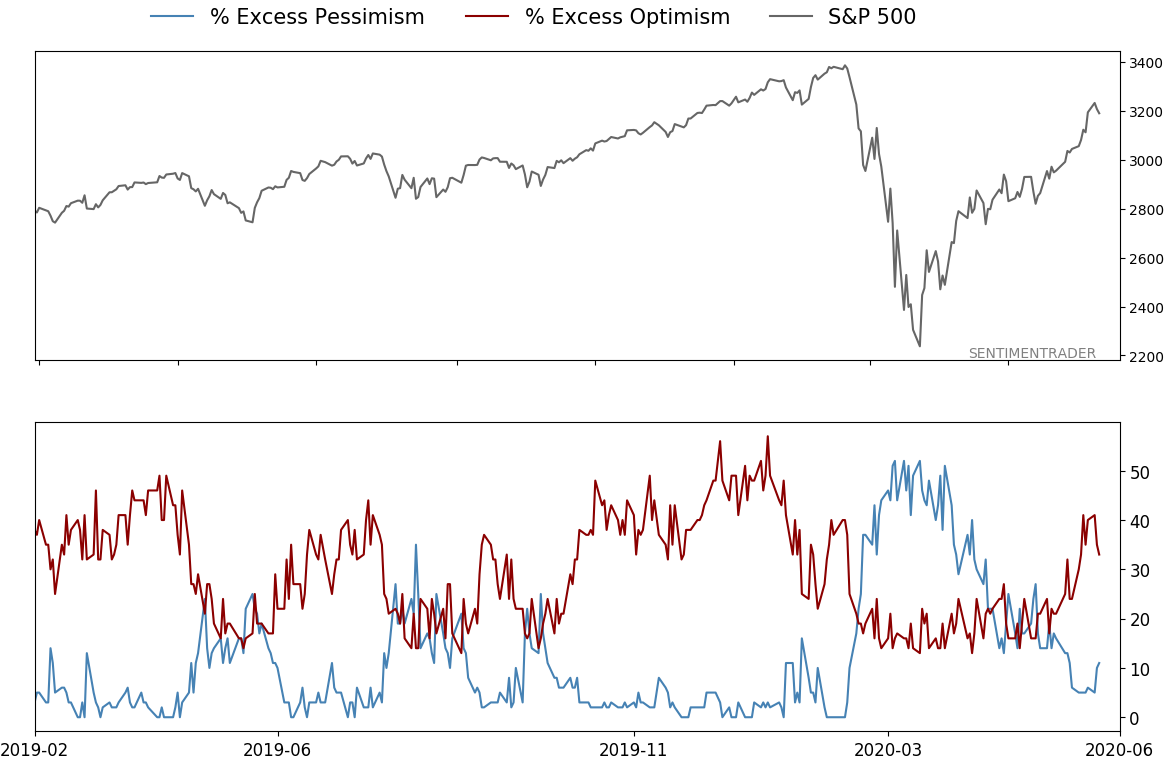
Weight of the evidence: The suggestion is flat/lower prices short- to medium-term, and higher prices long-term. Indicators are currently showing excessive optimism, with Dumb Money Confidence was recently near 80% and more than a third of indicators showing excessive optimism. The Active Studies show that when we look at stocks from various perspectives, there is a heavy positive skew over the medium-term long-term. Recently, there have been troubling signs of reckless speculation, but the breadth thrusts and recoveries have an almost unblemished record at preceding higher prices over a 6-12 month time frame. Indicators and studies for other markets are mixed with no strong conclusion.
|
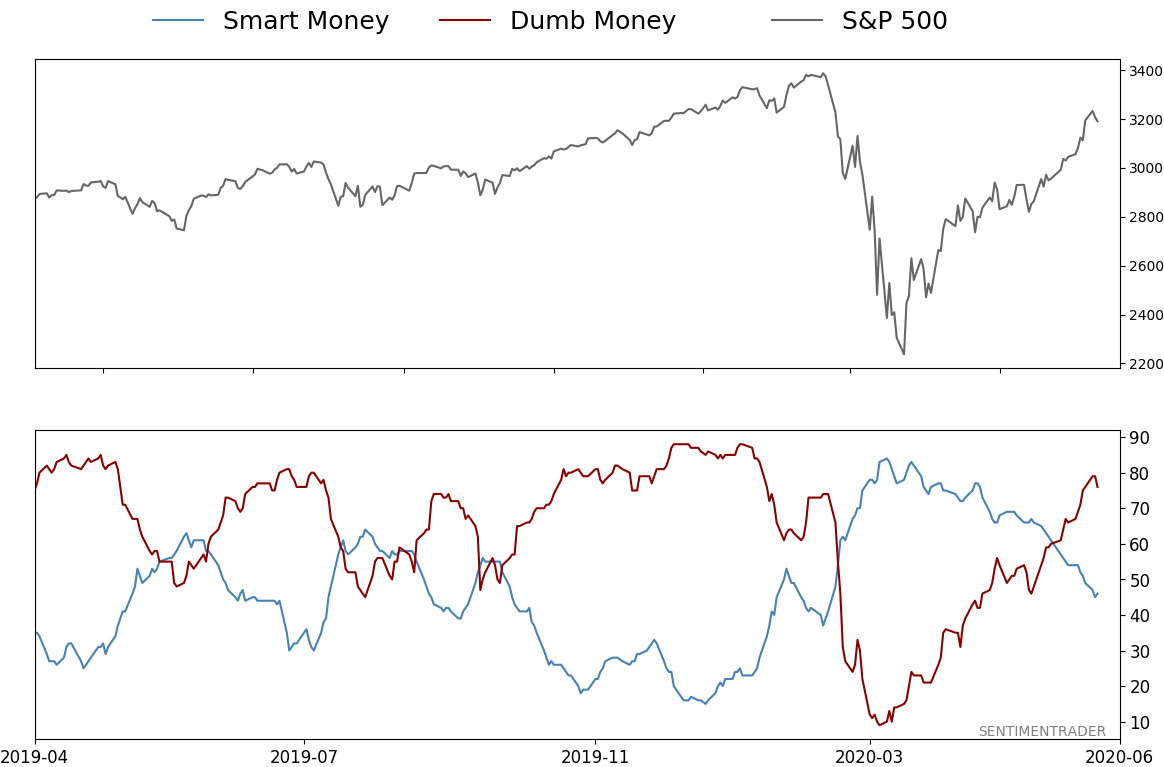
Smart / Dumb Money Confidence
|
Smart Money Confidence: 46%
Dumb Money Confidence: 76%
|
|
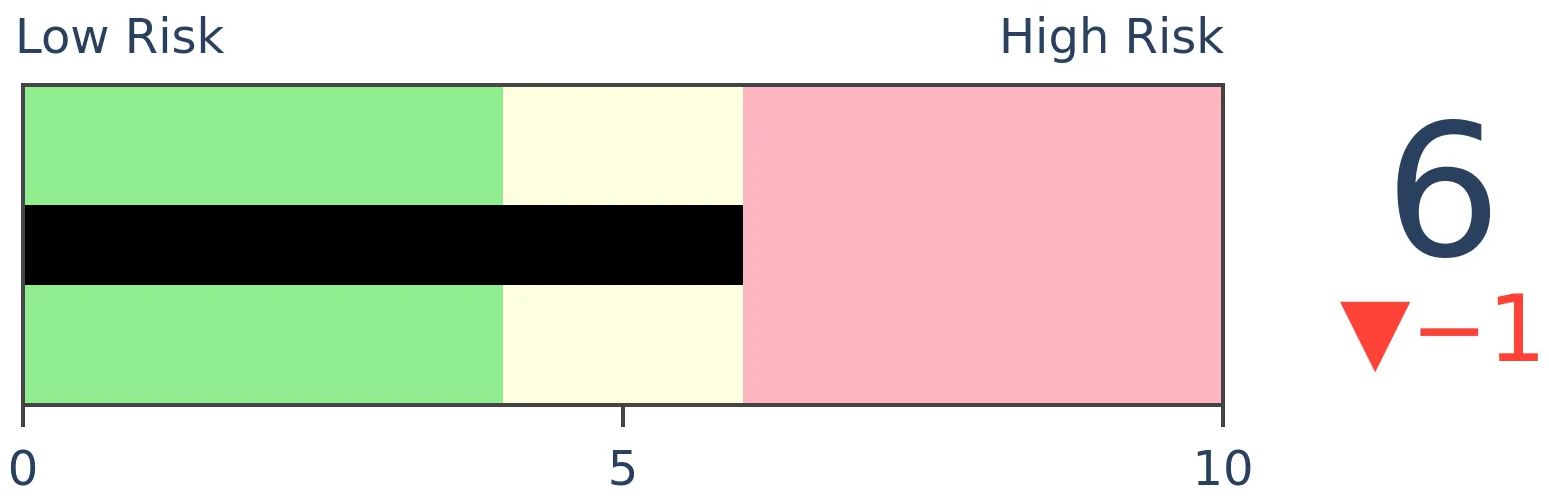
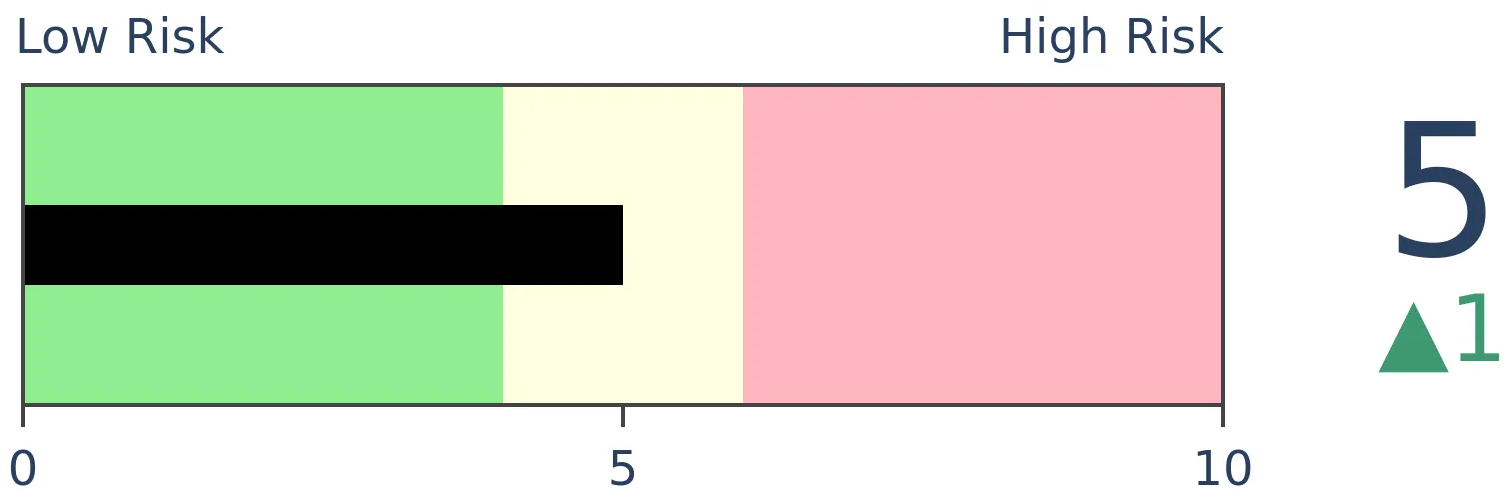
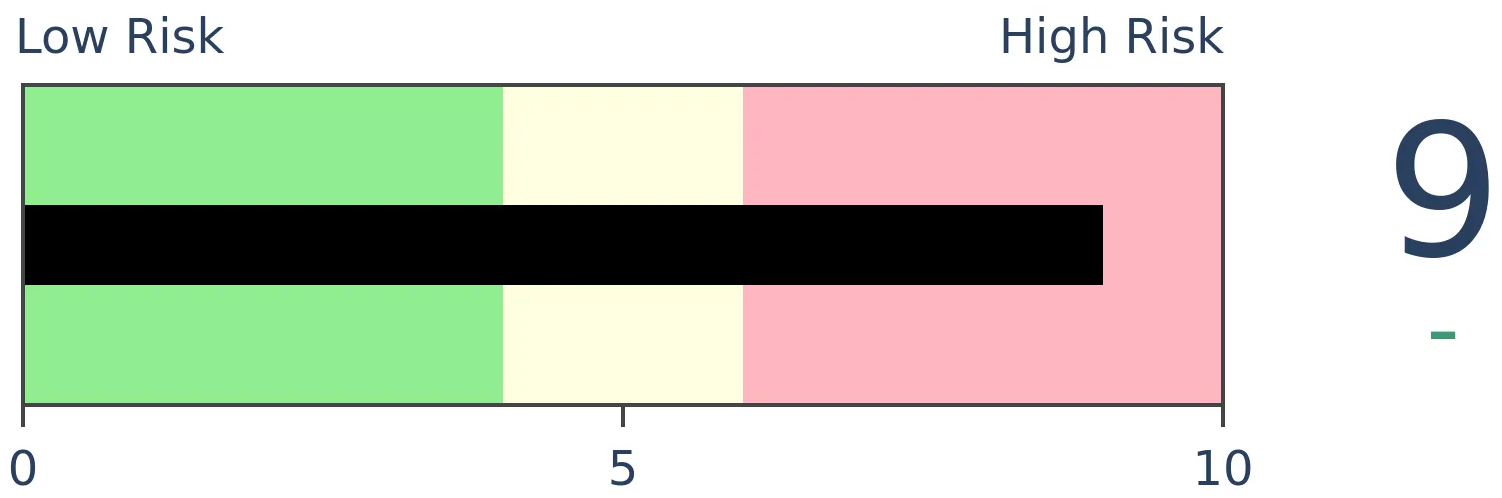
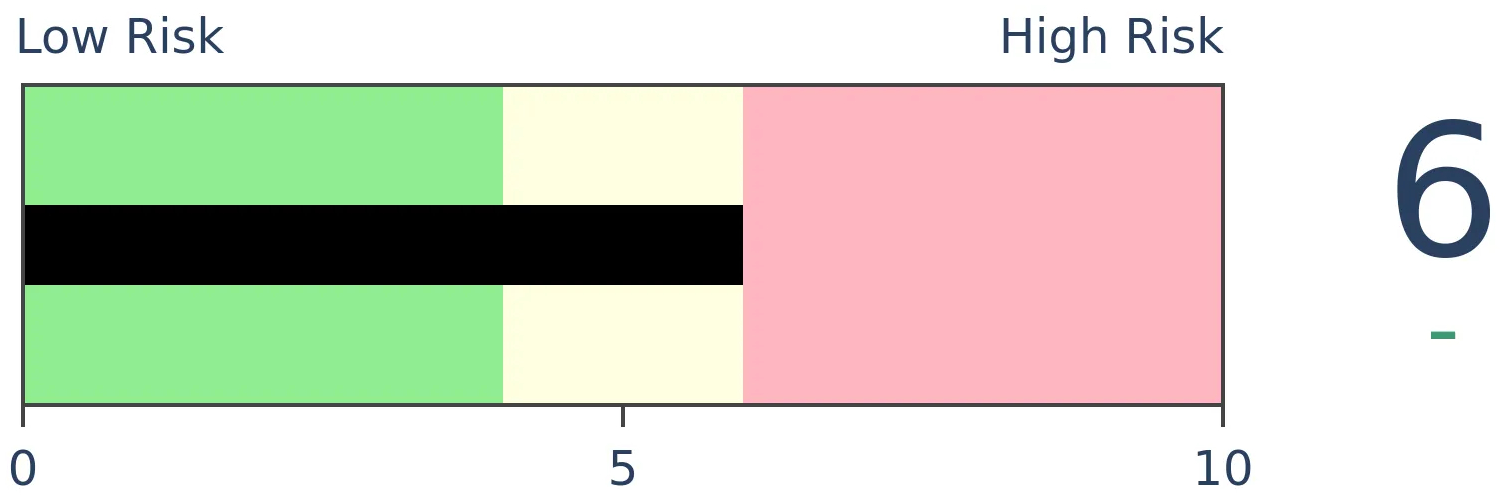
Risk Levels
Stocks Short-Term
|
Stocks Medium-Term
|
|
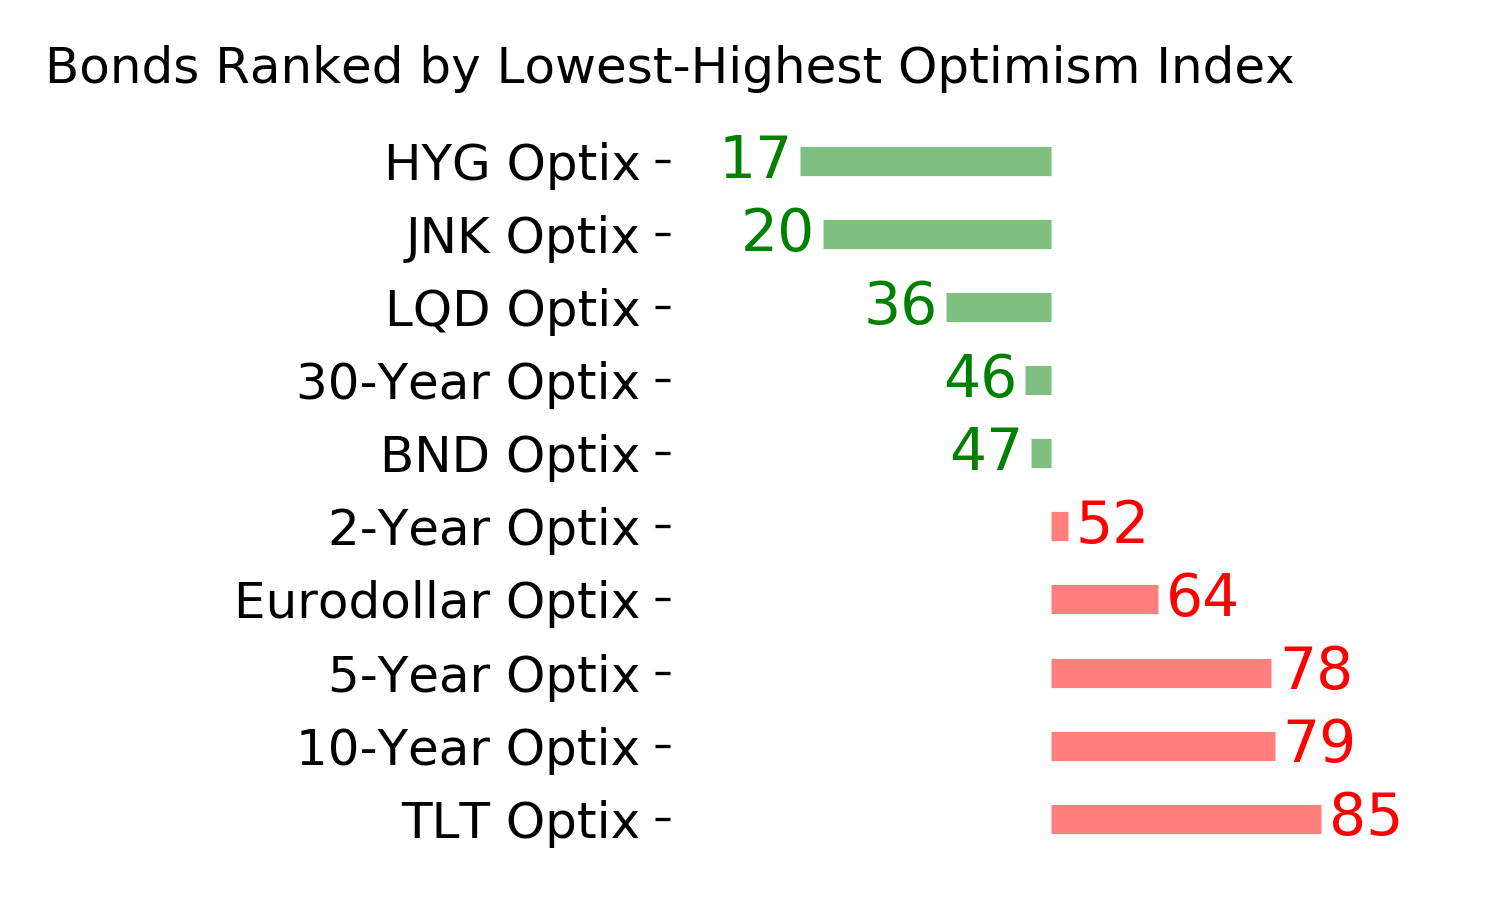
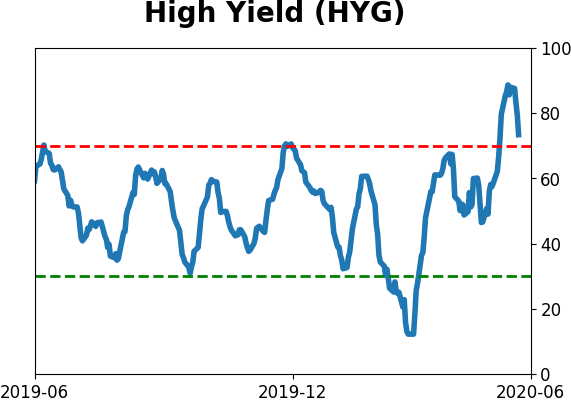
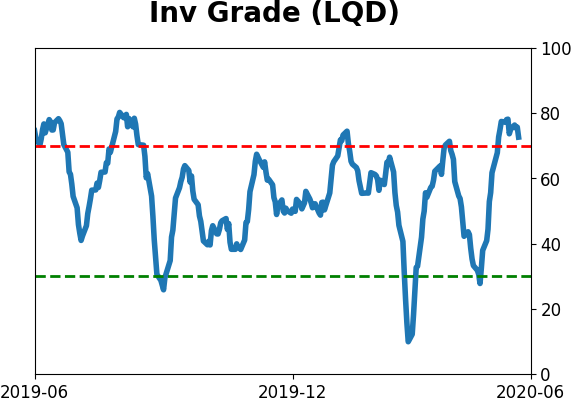
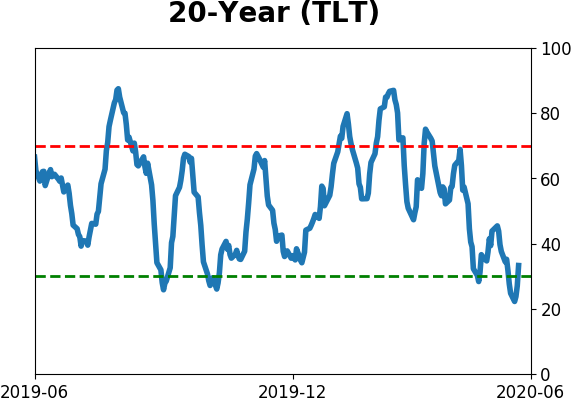
Bonds
|
Crude Oil
|
|
Gold

|
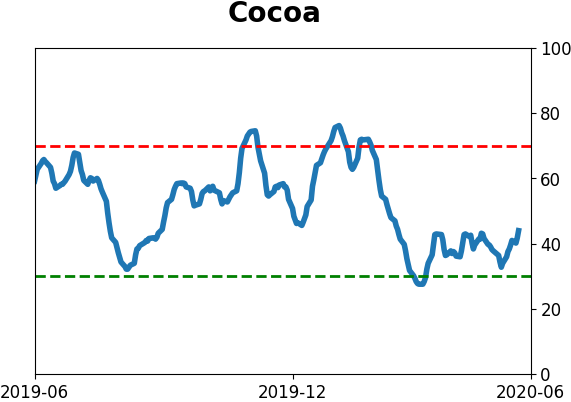
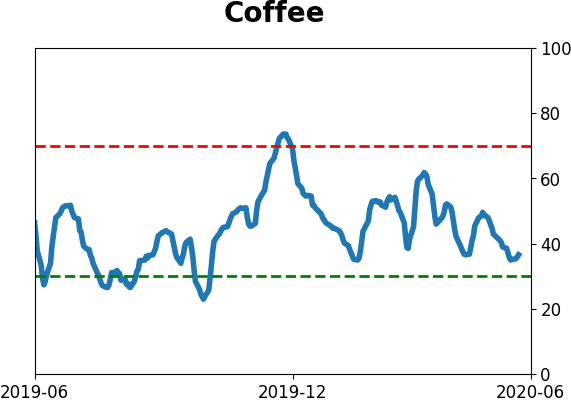
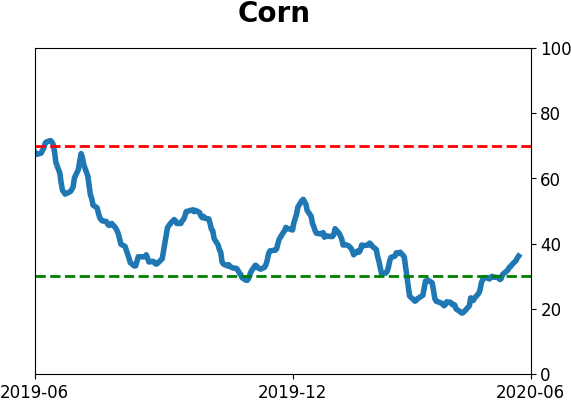
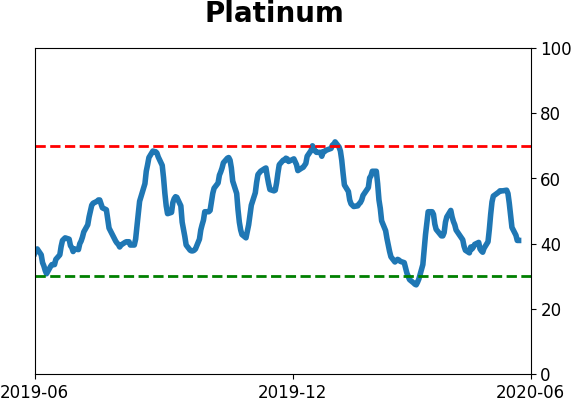
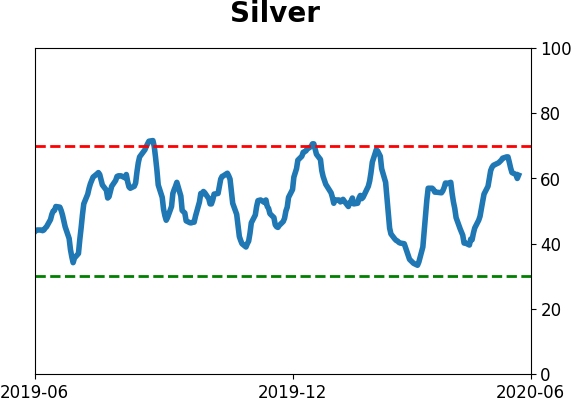
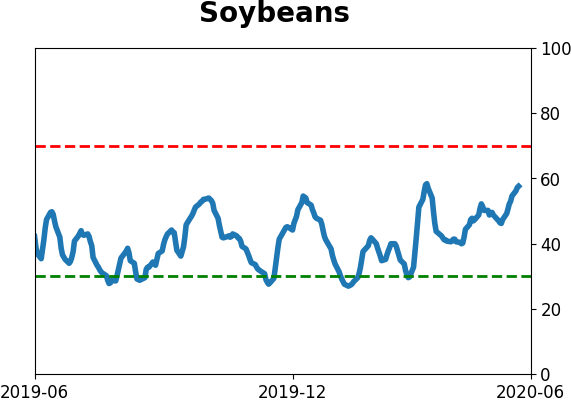
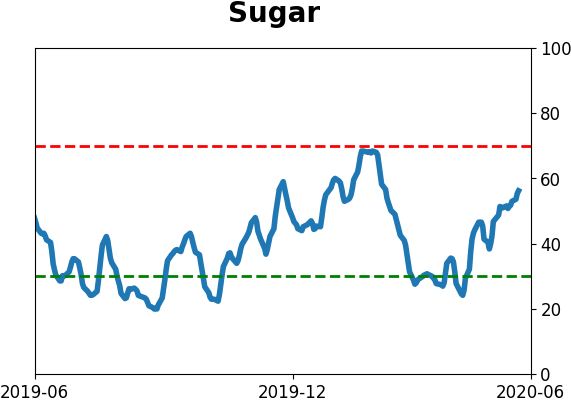
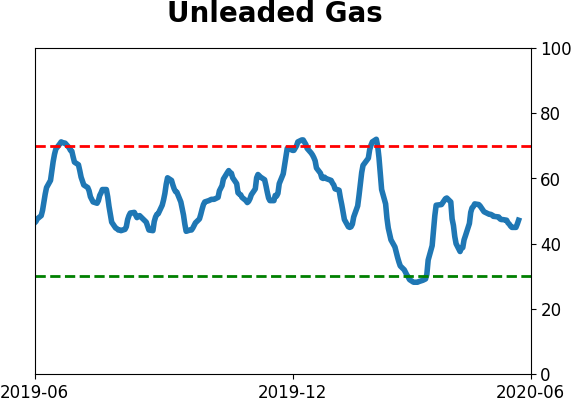
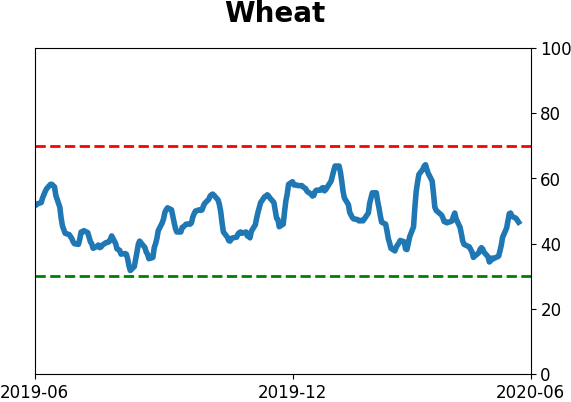
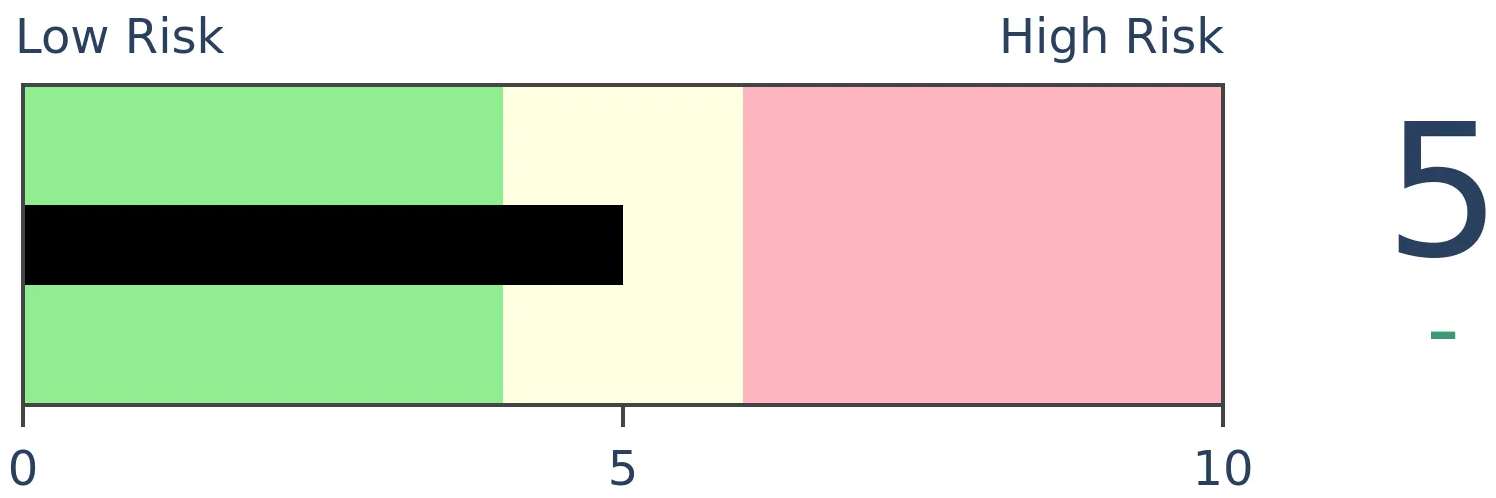
Agriculture
|
|
Research
BOTTOM LINE
Corporate insiders in S&P 500 companies greatly picked up their pace of buying as shares fell in March, and they're continuing to buy. In Nasdaq 100 companies, though, insider buying has been tepid. The ratio between insider buys in the S&P 500 versus Nasdaq 100 is now at a decade high. This comes even as the Nasdaq has been above its 20-day average for more than two months, while the S&P has not.
FORECAST / TIMEFRAME
None
|
As stocks climbed incessantly higher to start the year, corporate insiders became hesitant. Among S&P 500 companies, there was a multi-year low in the number of insiders buying their firm's shares on the open market.
The pandemic changed all that. As other investors panicked, insiders picked up shares on the cheap. They're still going. The number of insiders that have bought shares in S&P 500 companies within the past six months has soared to a decade high.
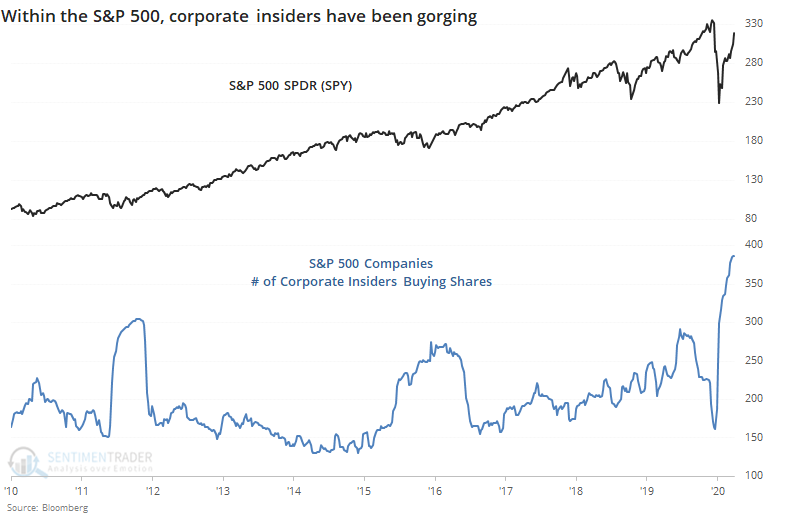
They're maybe not seeing quite the same values in big tech stocks. Insider buying among Nasdaq 100 companies has been tepid.
Insider buying is now 20 times greater in S&P 500 stocks than Nasdaq 100 stocks. While we should expect the ratio to be high simply because there are more stocks, this is still the highest ratio since at least 2010.
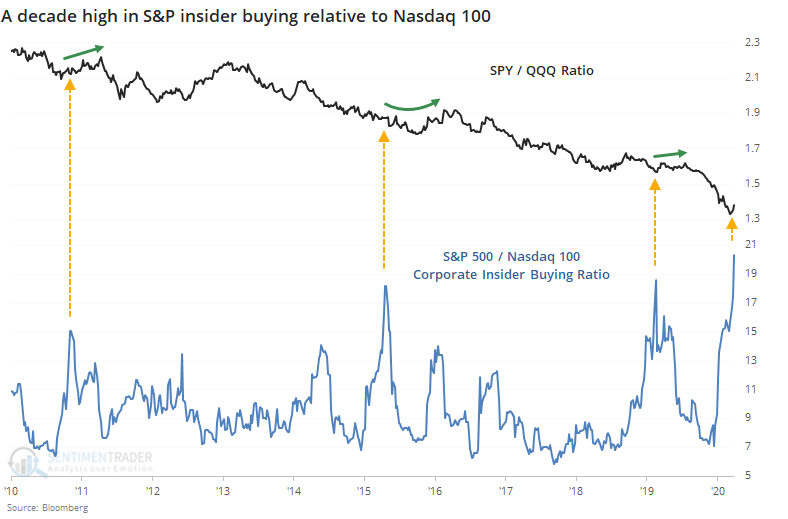
This wasn't a slam-dunk, but other times when insiders in S&P stocks were much more aggressive buyers than insiders of Nasdaq 100 stocks, the ratio between SPY and QQQ showed a modest tendency to rebound in the months ahead. Once the ratio of insider buying settled down, QQQ resumed its relative outperformance.
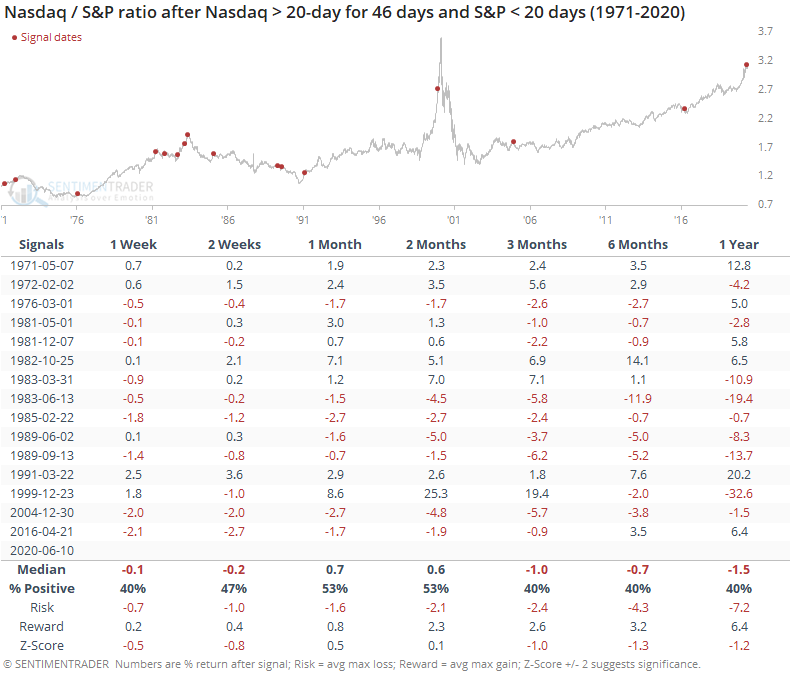
Insider appetite for their own shares in S&P stocks comes despite the Nasdaq's torrid trend (or perhaps because of it). In a premium note, Troy mentioned that the Nasdaq has levitated above its 20-day moving average for 46 days, a historically long stretch. That's the case for both the Nasdaq 100 and Nasdaq Composite.
It's interesting to note that while the Nasdaq indexes have been on such a sustained trend, the S&P 500 has not. It hasn't spent even 20 days above its 20-day average.
When the Nasdaq's trend has been so much stronger than the S&P's, we typically saw mean reversion in the months ahead. The ratio between the Nasdaq Composite and S&P 500 showed a tendency to decline.
Contrast that to times when the S&P had enjoyed a sustained trend above its 20-day average along with the Nasdaq. Then, then Nasdaq showed more of a tendency to outperform.
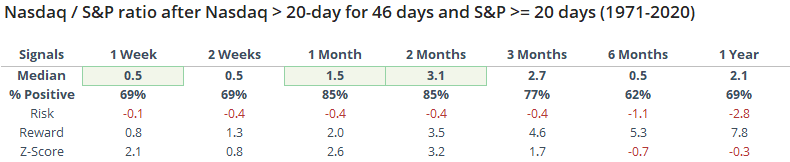
Anytime the indexes enjoyed such a run above their 20-day average, shorter-term returns were generally poor but quite good in the medium- to long-term. We've seen that time and time again - bouts of extreme momentum often suffer mean-reversion in the short-term but are a sign of intense buying interest that doesn't die easily longer-term.
Given insider positioning and trend divergences, the likelihood is increasing that broader indexes like the S&P should start to do better relative to the hot Nasdaq.
BOTTOM LINE
Over a 10-day period, we recently witnessed a historic thrust of positive breadth, with the 10-day Up Volume Ratio reaching near-record highs. The past 3 days, however, have seen overwhelmingly negative breadth. It doesn't completely cancel the longer-term positives, but it makes the shorter-term more of a worry.
FORECAST / TIMEFRAME
None
|
Some of the most compelling aspects about stocks since late March, and which have continued recently, are the breadth thrusts and recoveries have an almost unblemished record at preceding higher prices over a 6-12 month time frame.
That seems like it's in jeopardy now. Over the past few days, there has been a tremendous thrust down. It's very rare to see such extremes in close proximity - unprecedented, really. Welcome to 2020.
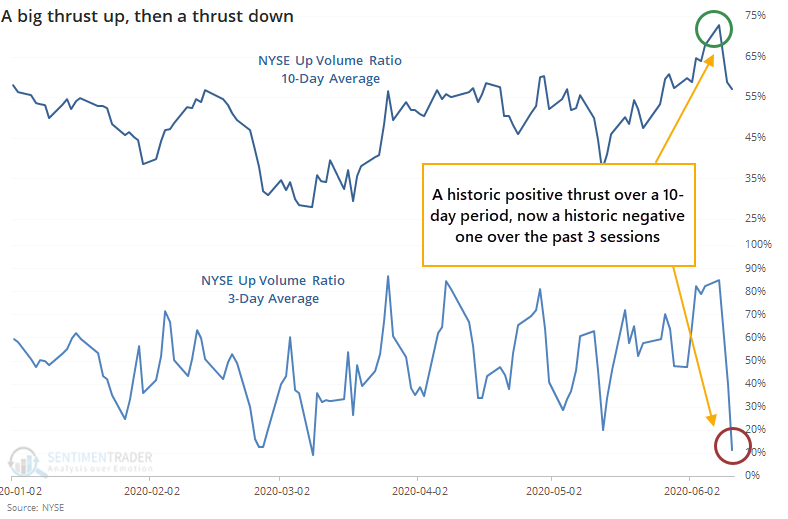
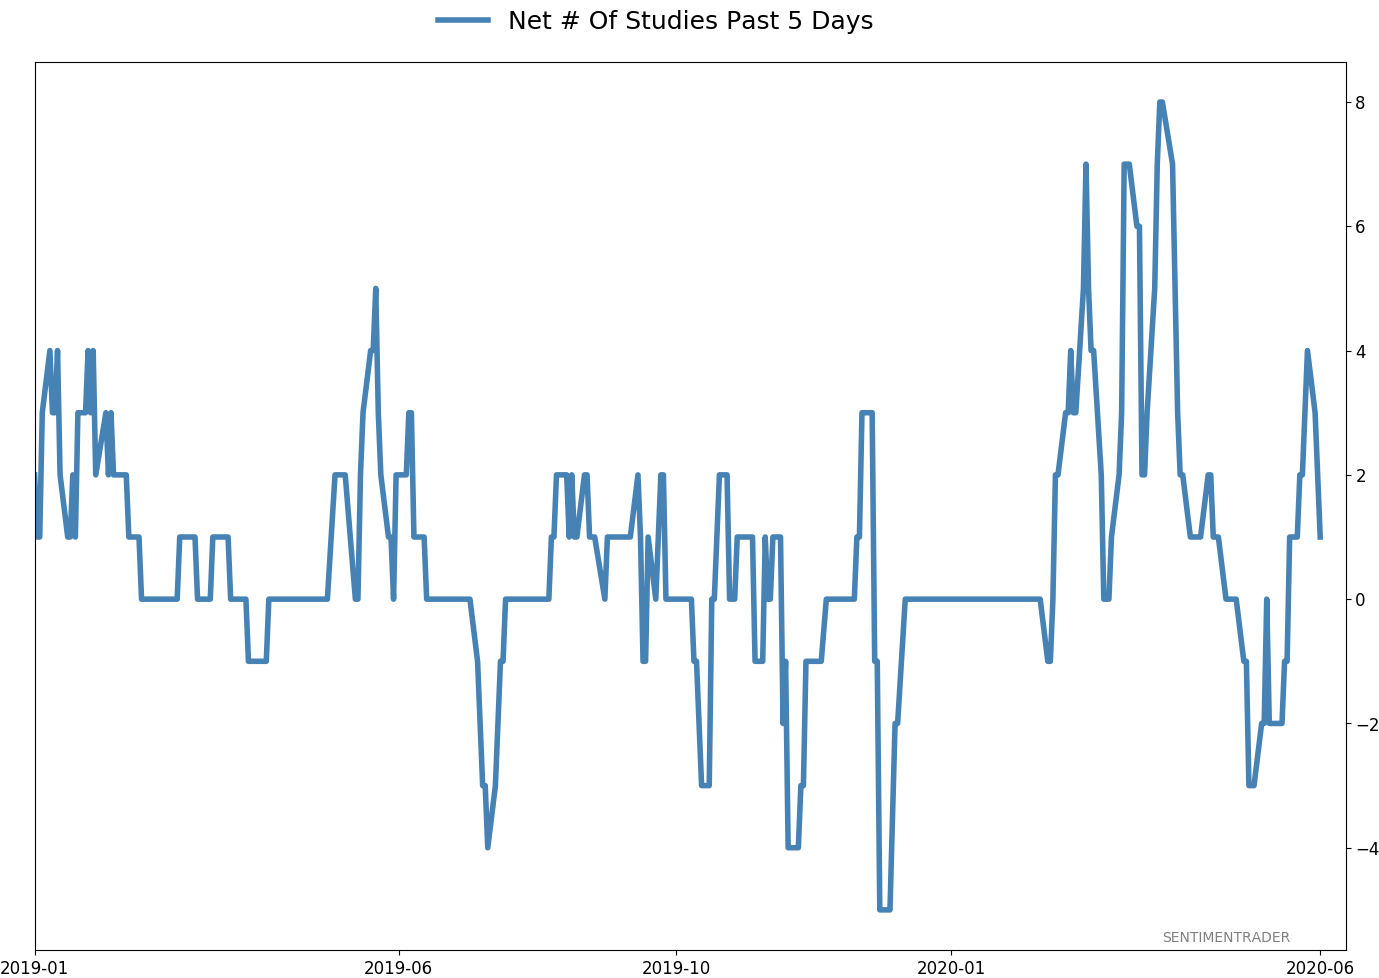
The worry is that selling pressure like this tends to cancel out any potential positives from the positive thrust. To check, below we can see every time since 1962 when the 10-day average of the NYSE Up Volume Ratio was above 65% then the 3-day average plunged below 15%.
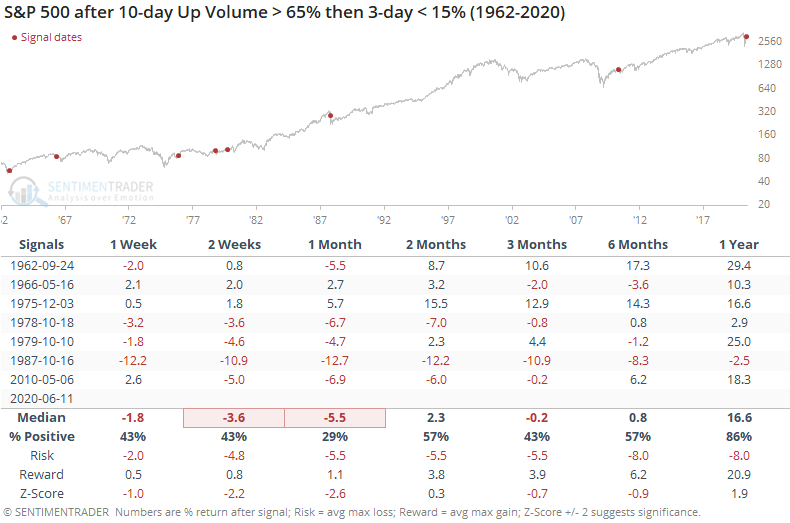
Like a lot of things over the past few months, there is a small sample size. Of the 7 other times we've seen an up/down thrust like this, 6 of them traded lower over the next 1-3 months. Only December 1975 managed to turn higher immediately and never look back.
By a year later, all but one of them were positive, and that exception was small.
This is another suggestion that the short- to medium-term could (should) be rocky, but these kinds of developments are also typically seen during long-term recoveries.
Active Studies
| Time Frame | Bullish | Bearish | | Short-Term | 0 | 1 | | Medium-Term | 8 | 5 | | Long-Term | 40 | 1 |
|
Indicators at Extremes
Portfolio
| Position | Weight % | Added / Reduced | Date | | Stocks | 29.8 | Reduced 9.1% | 2020-06-11 | | Bonds | 0.0 | Reduced 6.7% | 2020-02-28 | | Commodities | 5.2 | Added 2.4%
| 2020-02-28 | | Precious Metals | 0.0 | Reduced 3.6% | 2020-02-28 | | Special Situations | 0.0 | Reduced 31.9% | 2020-03-17 | | Cash | 65.0 | | |
|
Updates (Changes made today are underlined)
In the first months of the year, we saw manic trading activity. From big jumps in specific stocks to historic highs in retail trading activity to record highs in household confidence to almost unbelievable confidence among options traders. All of that came amid a market where the average stock couldn't keep up with their indexes. There were signs of waning momentum in stocks underlying the major averages, which started triggering technical warning signs in late January. After stocks bottomed on the 23rd, they enjoyed a historic buying thrust and retraced a larger amount of the decline than "just a bear market rally" tends to. Those thrusts are the most encouraging sign we've seen in years. Through early June, we were still seeing thrusts that have led to recoveries in longer-term breadth metrics. The longer-term prospects for stocks (6-12 months) still look decent given the above. On a short- to medium-term basis, it was getting harder to make that case. Dumb Money Confidence spiked and there were multiple signs of a historic level of speculation. Given that, I reduced my exposure a bit when stocks gapped down and failed to hold the lows of late last week. This is likely the lowest I will go given what I still consider to be compelling positives over a longer time frame. There is not a slam-dunk case to be made for either direction, so it will seem like a mistake whether stocks keep dropping (why didn't I sell more?) or if they turn and head higher (why did I let short-term concerns prevail?). After nearly three decades of trading, I've learned to let go of the idea of perfection.
RETURN YTD: -6.9% 2019: 12.6%, 2018: 0.6%, 2017: 3.8%, 2016: 17.1%, 2015: 9.2%, 2014: 14.5%, 2013: 2.2%, 2012: 10.8%, 2011: 16.5%, 2010: 15.3%, 2009: 23.9%, 2008: 16.2%, 2007: 7.8%
|
|
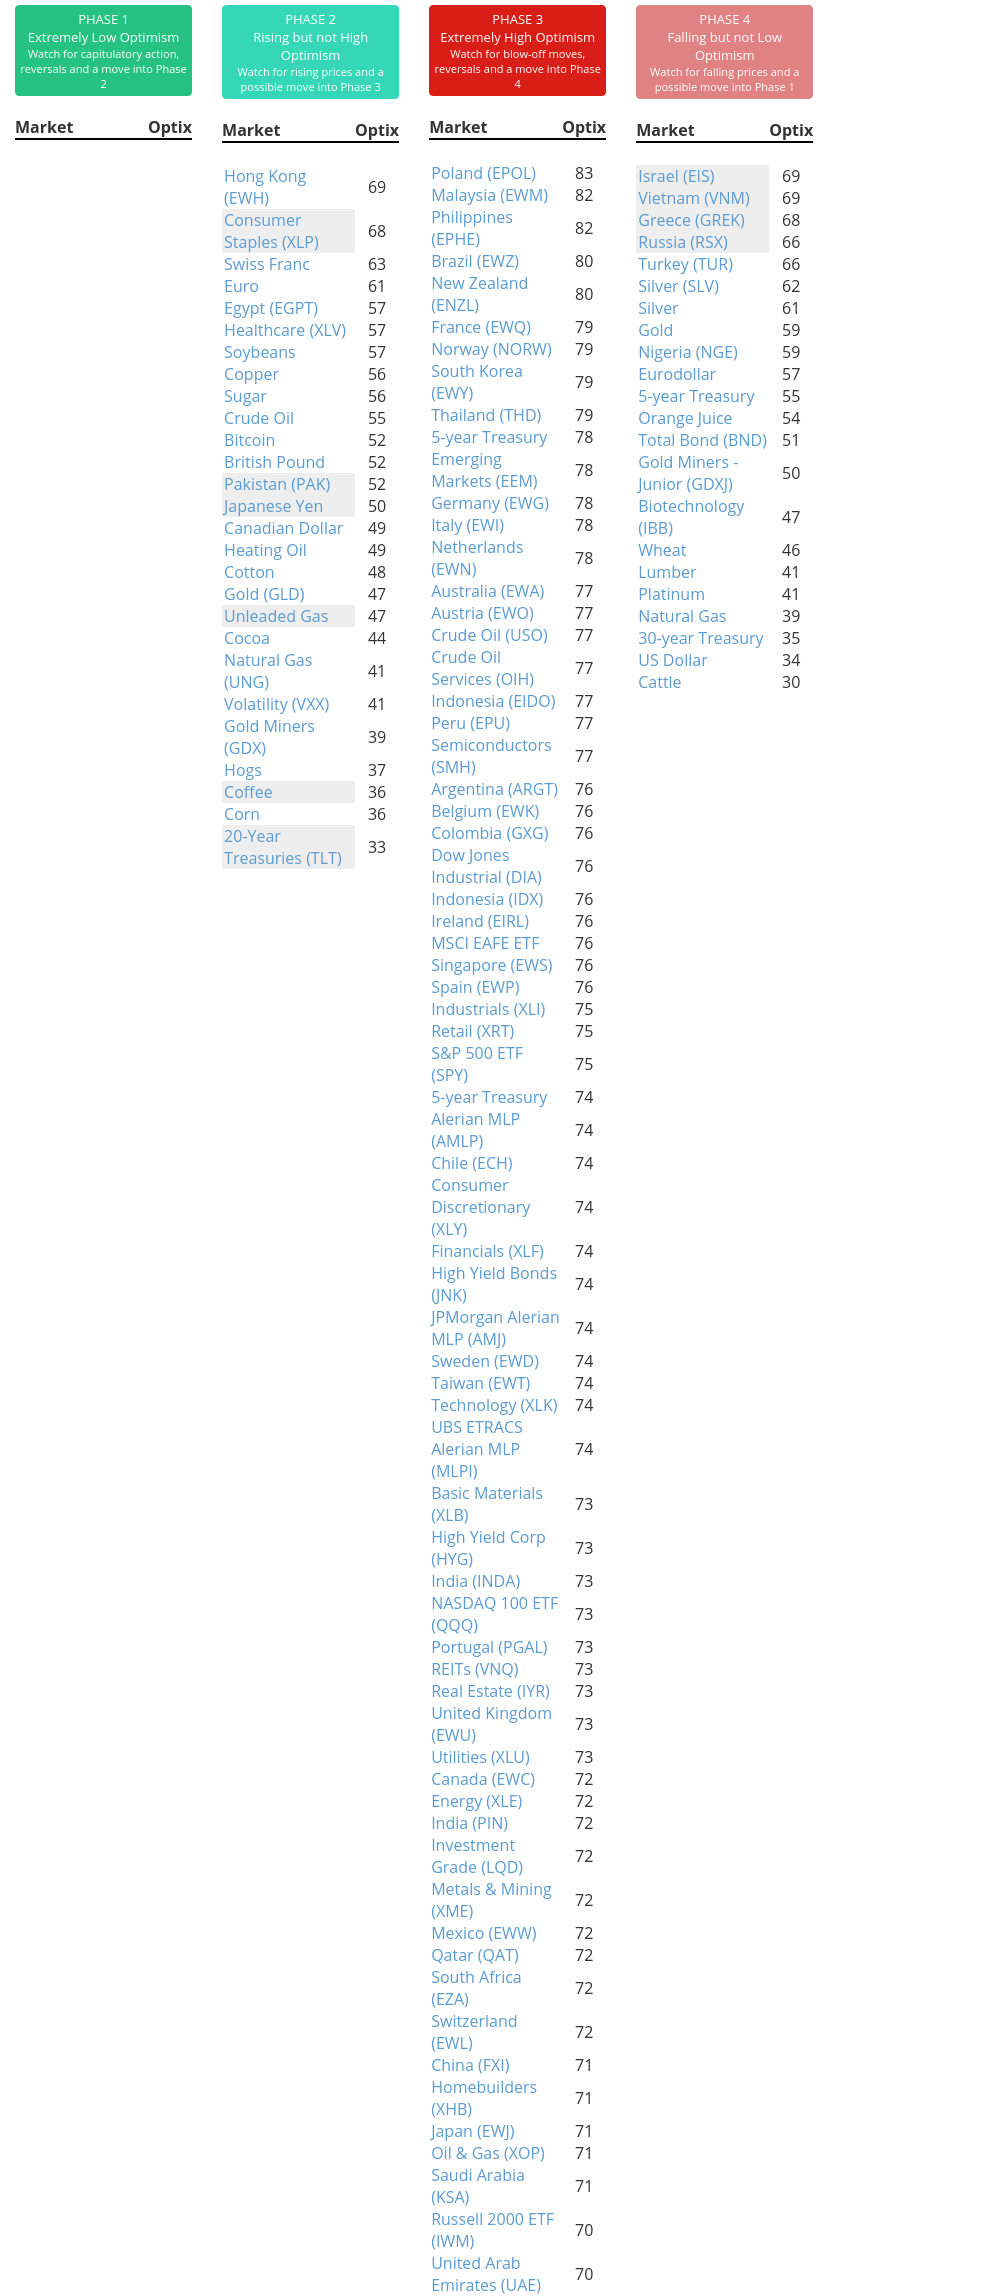
Phase Table
Ranks
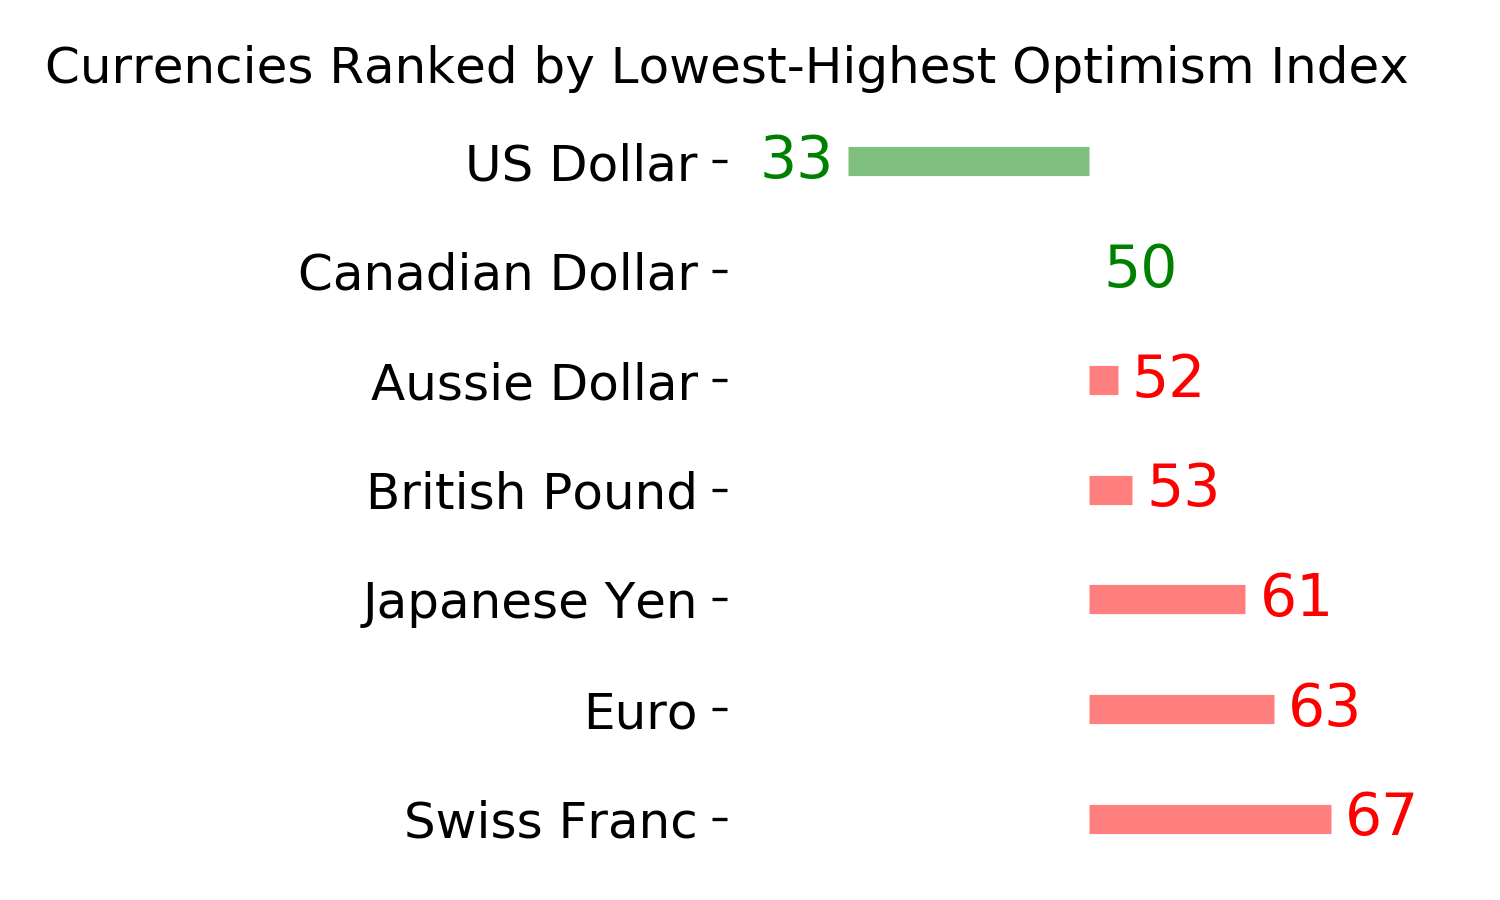
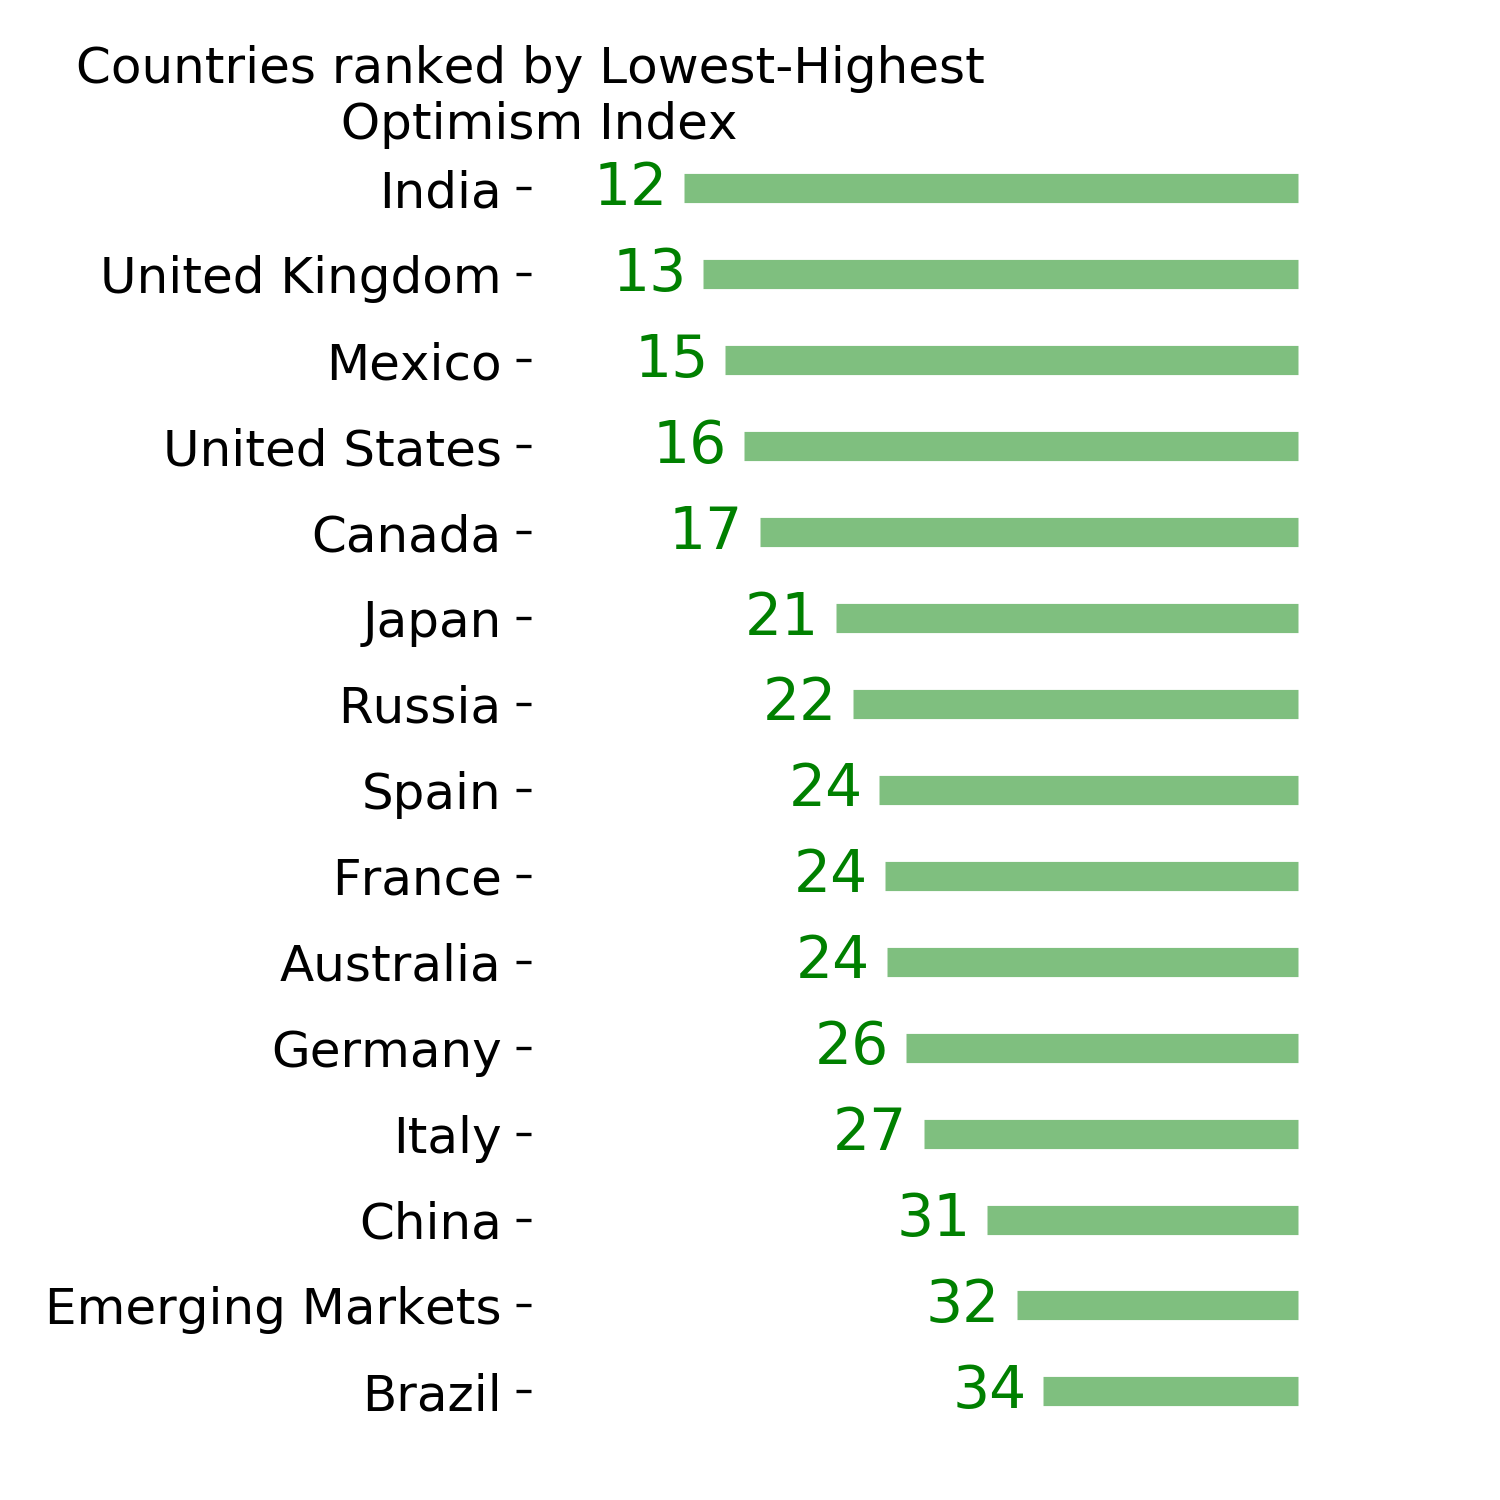
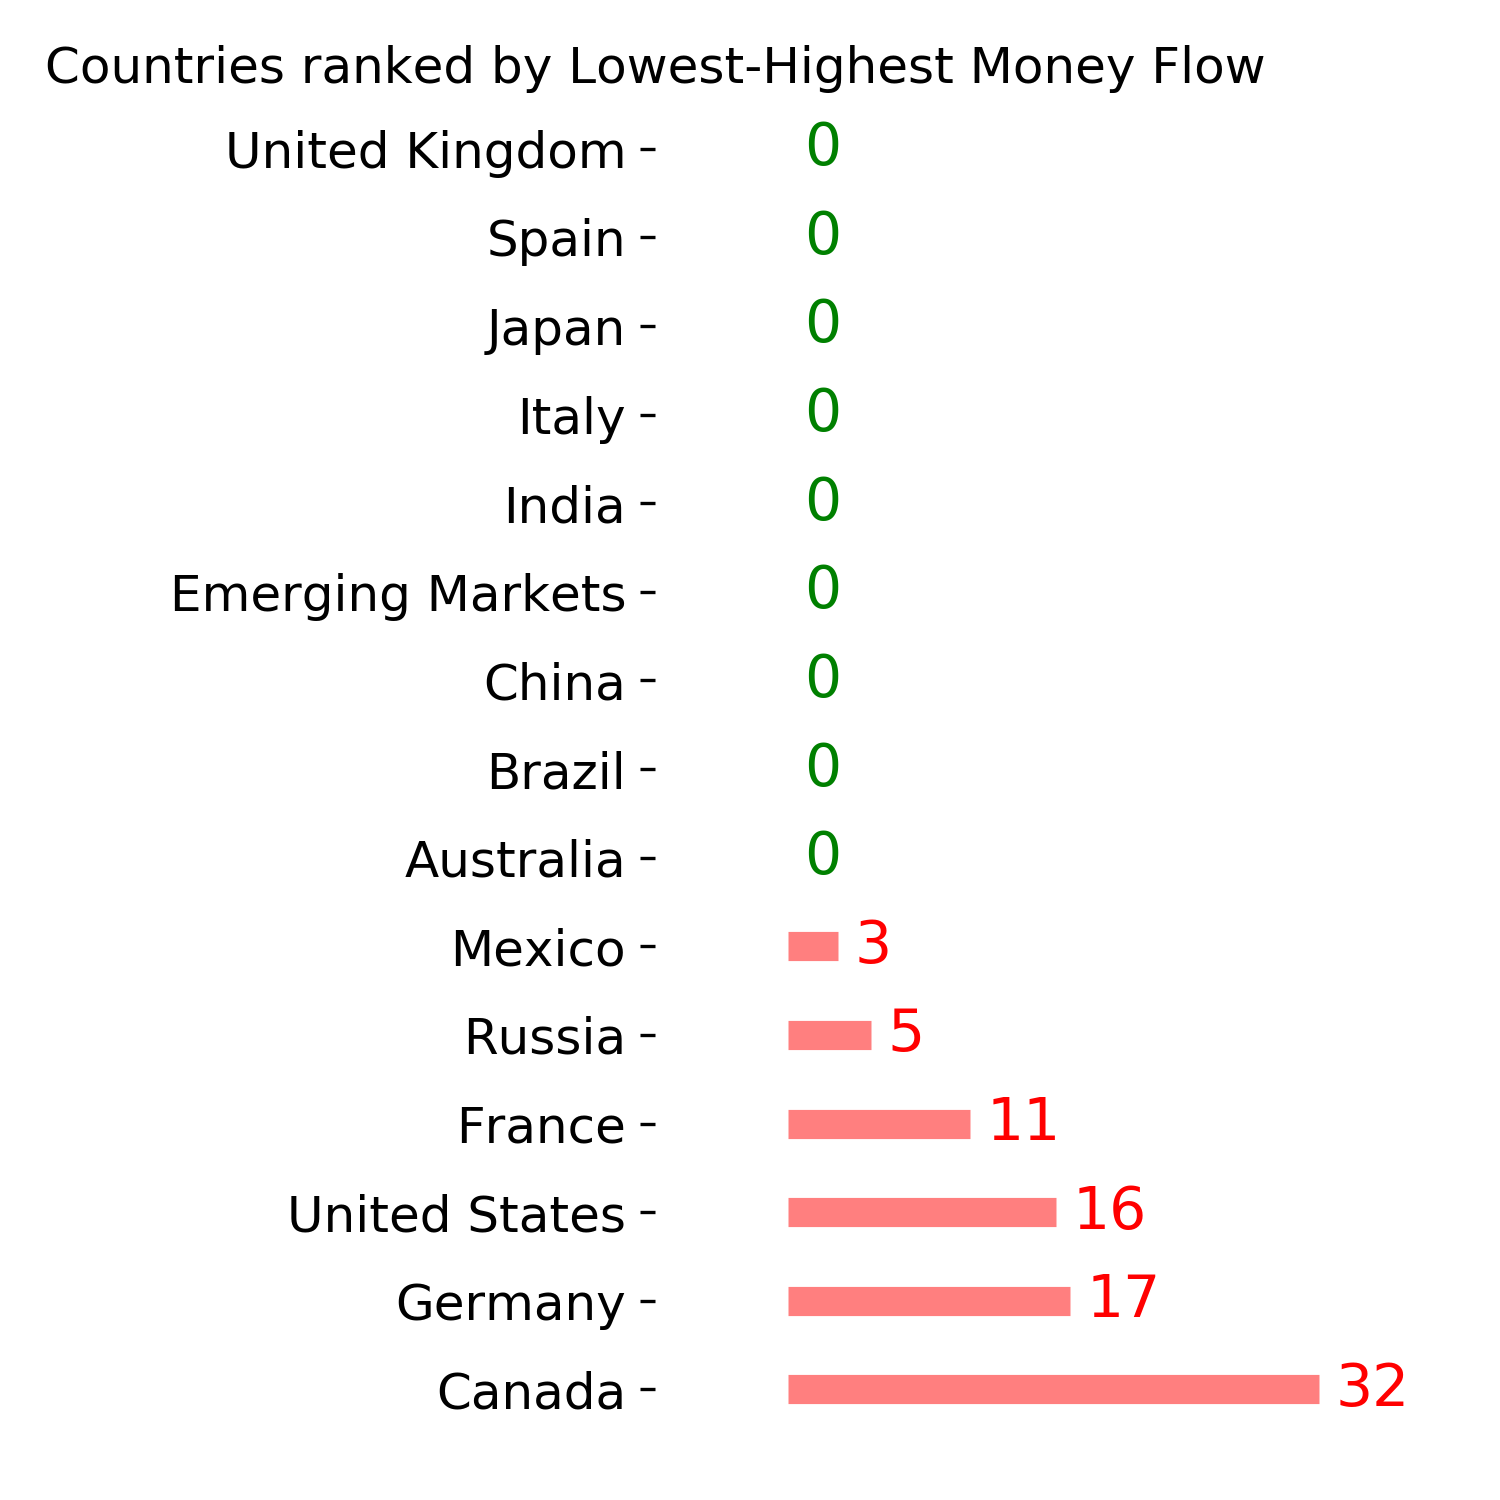
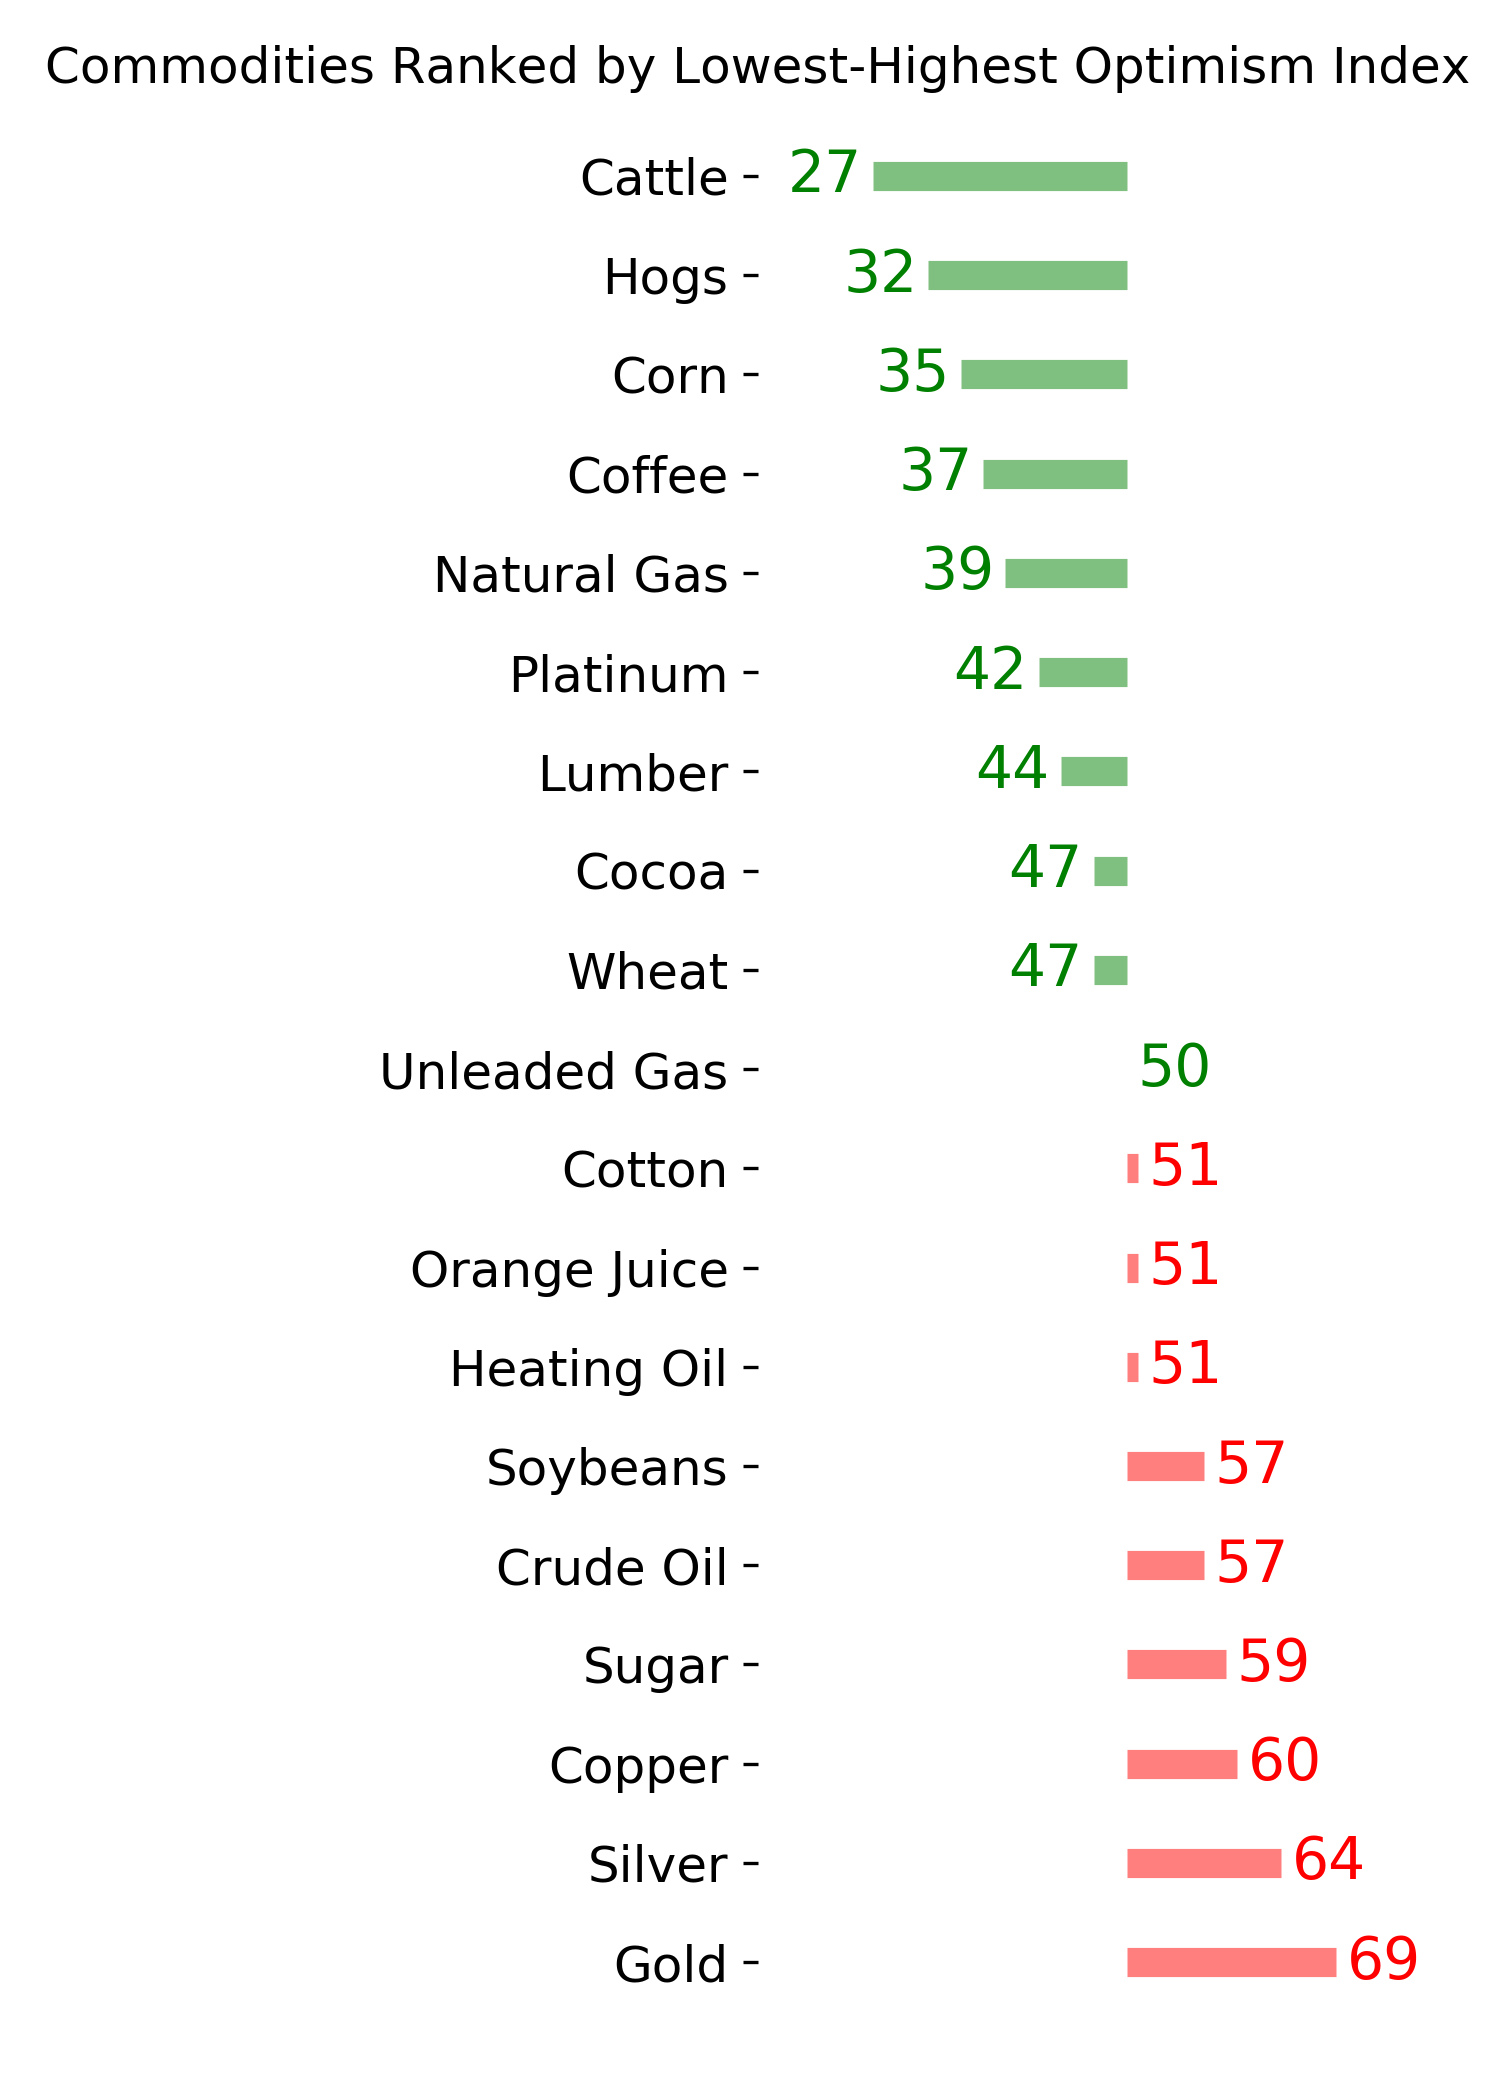
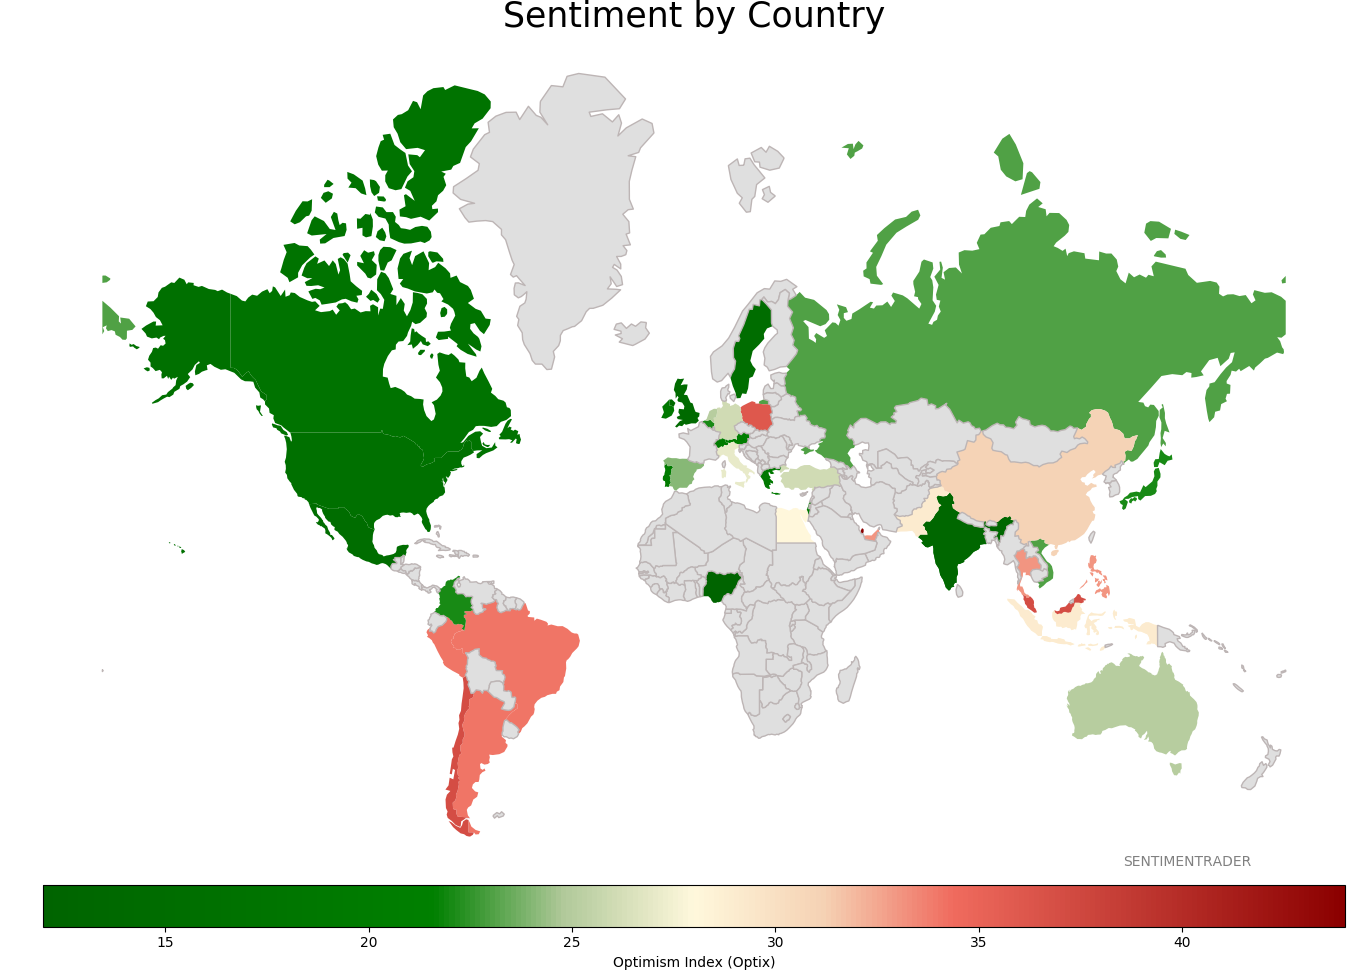
Sentiment Around The World
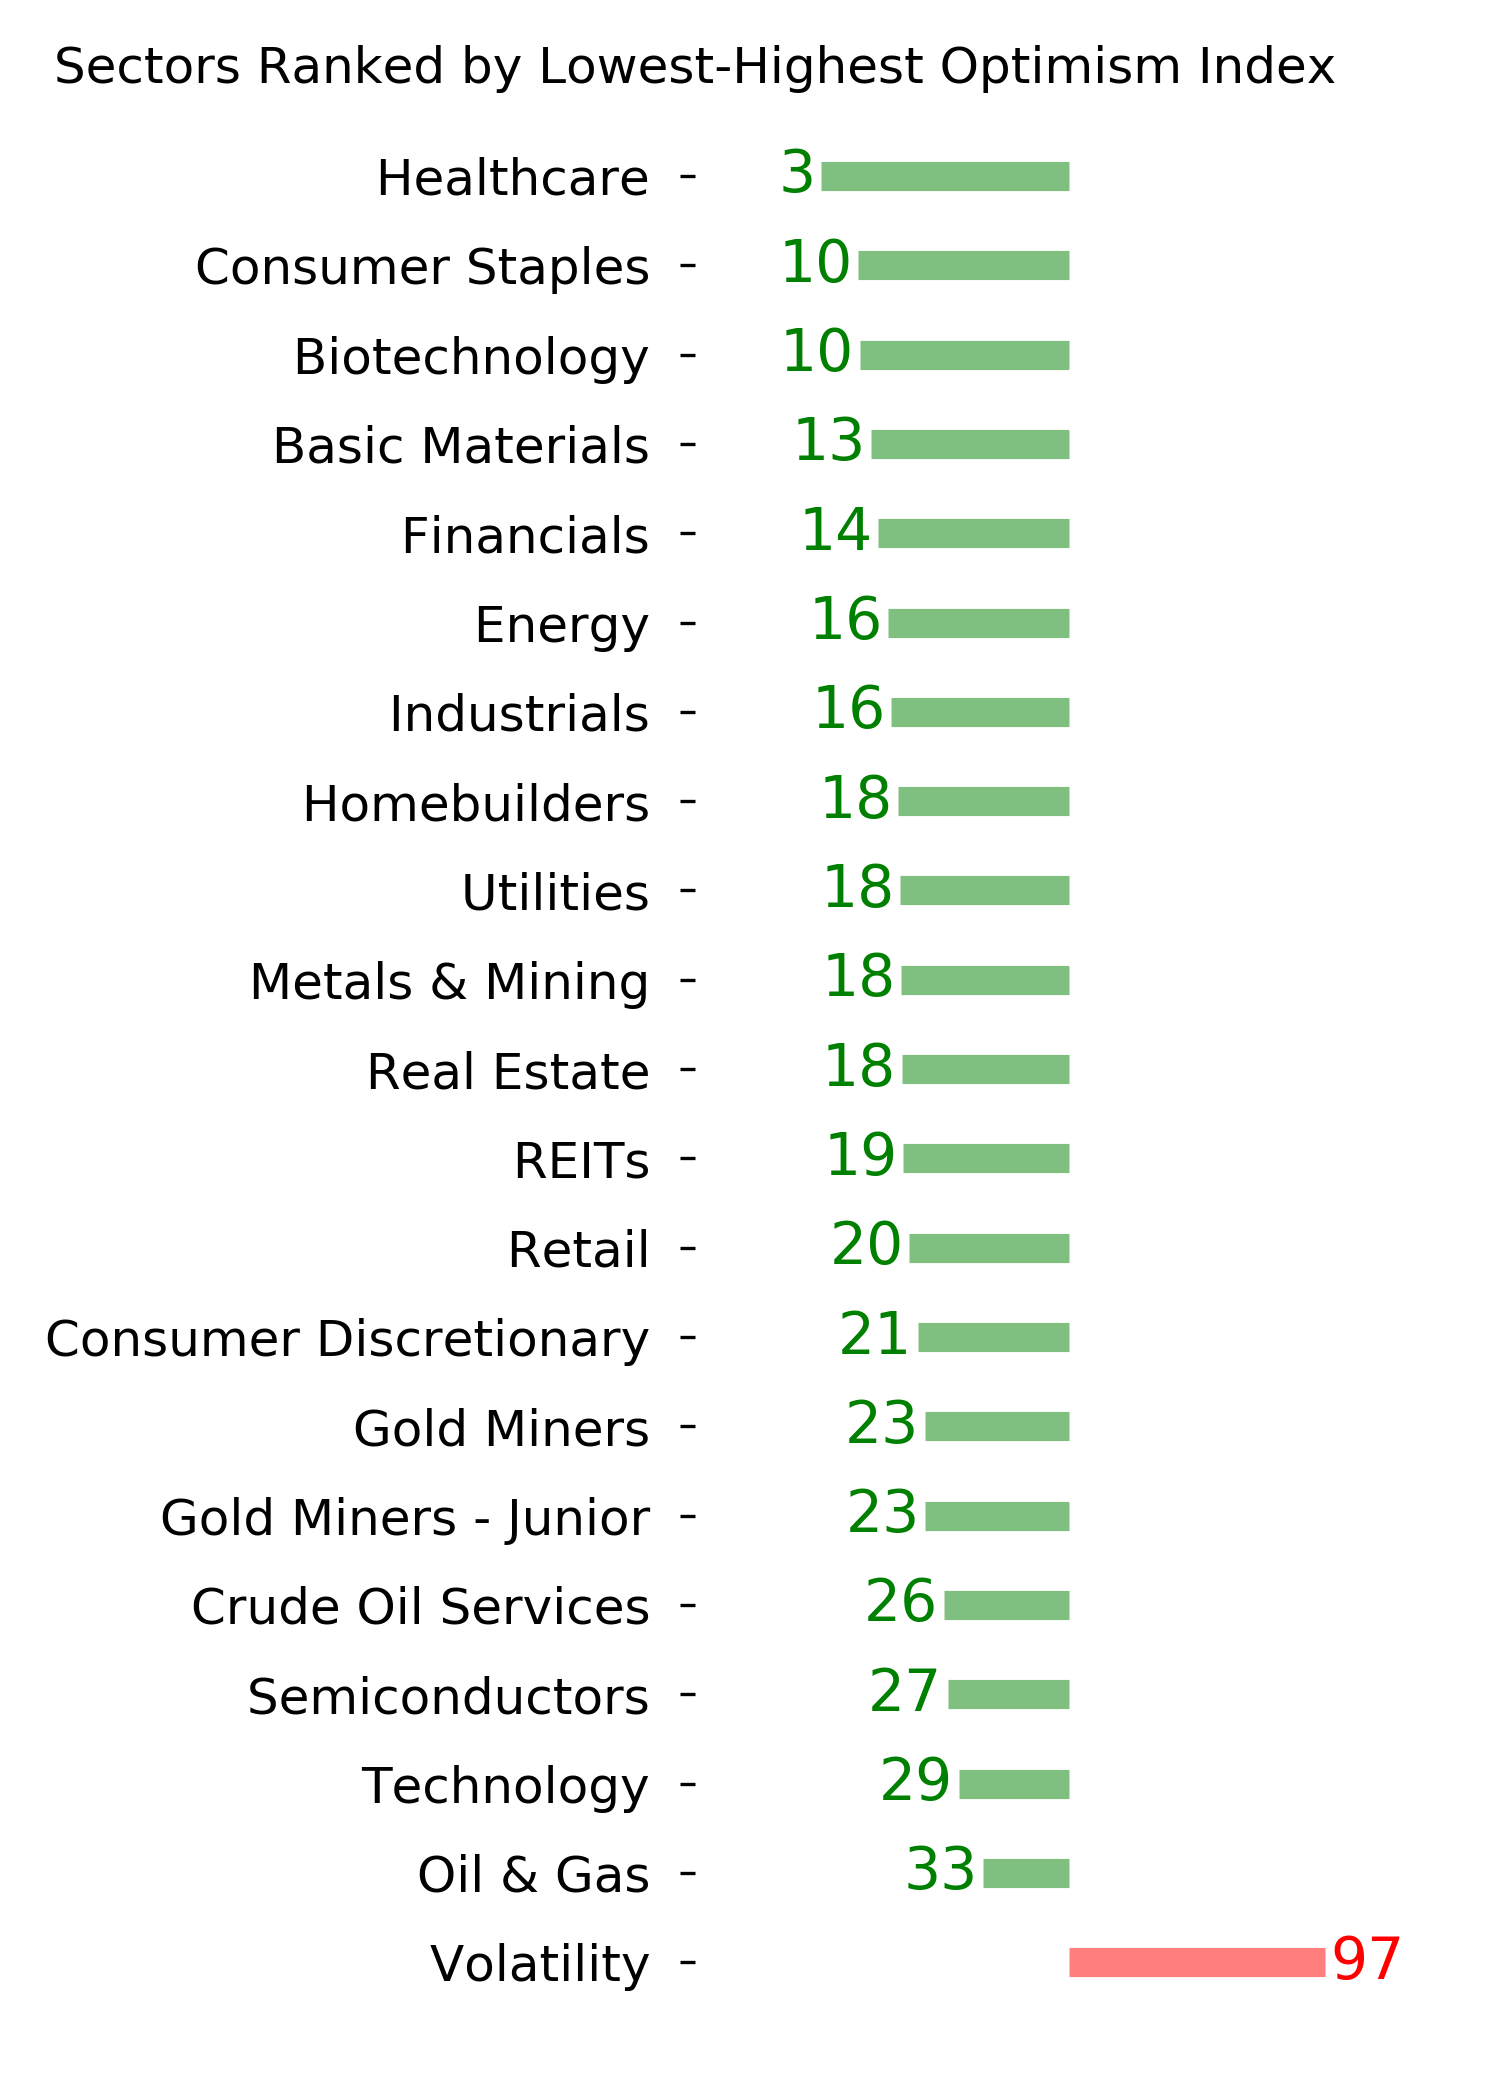
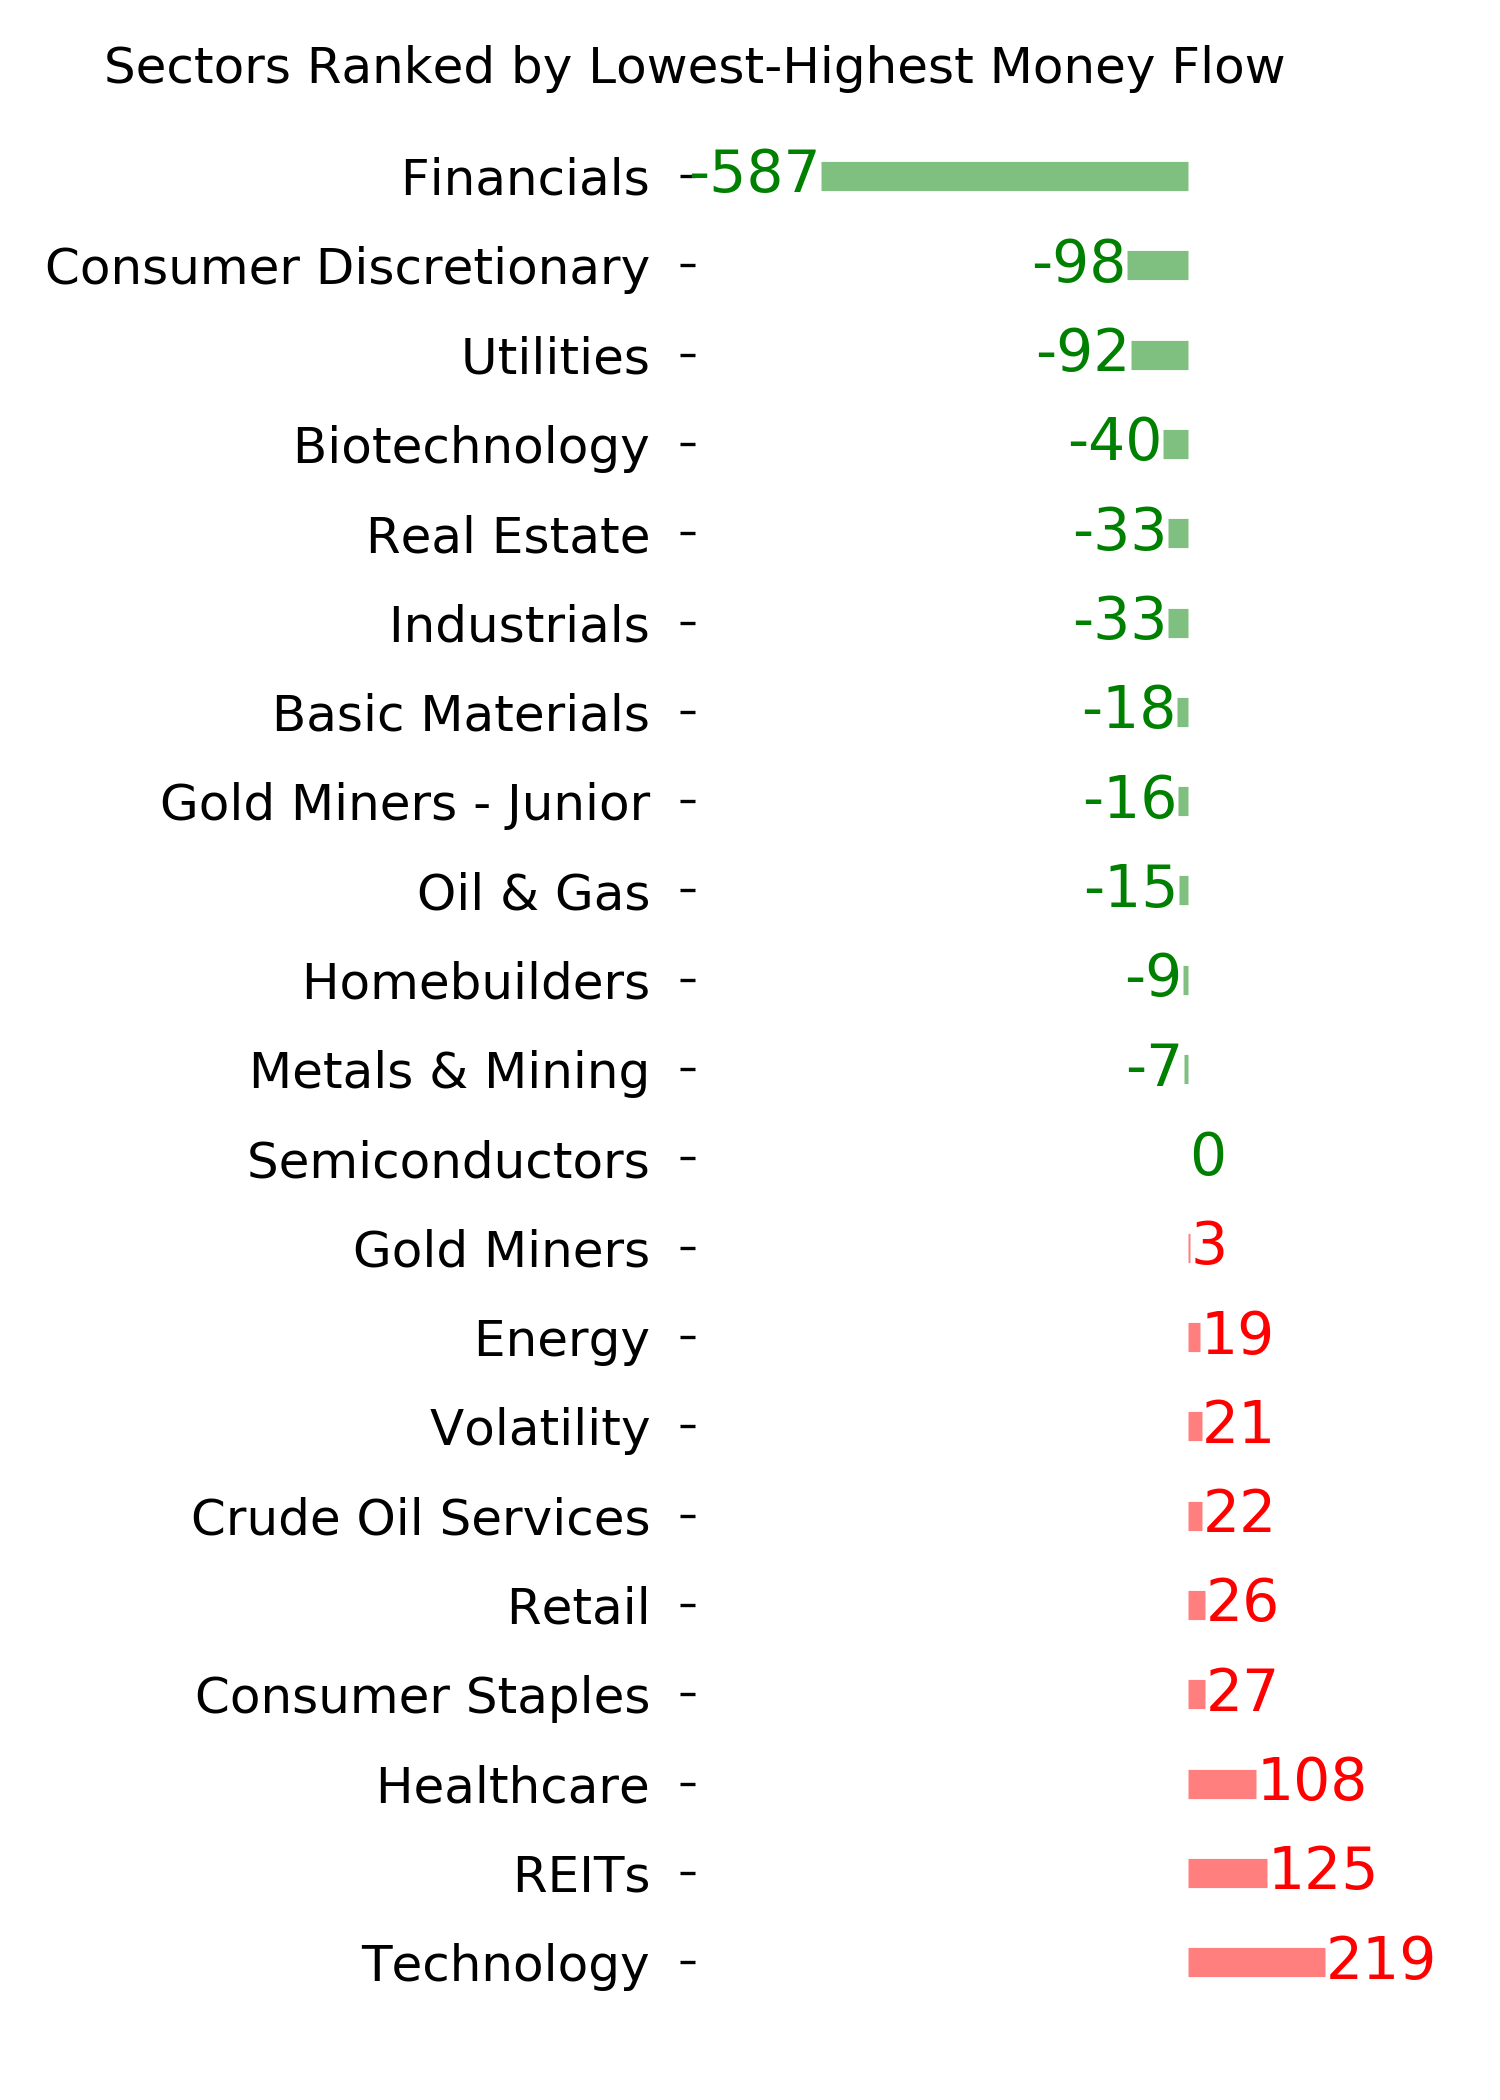
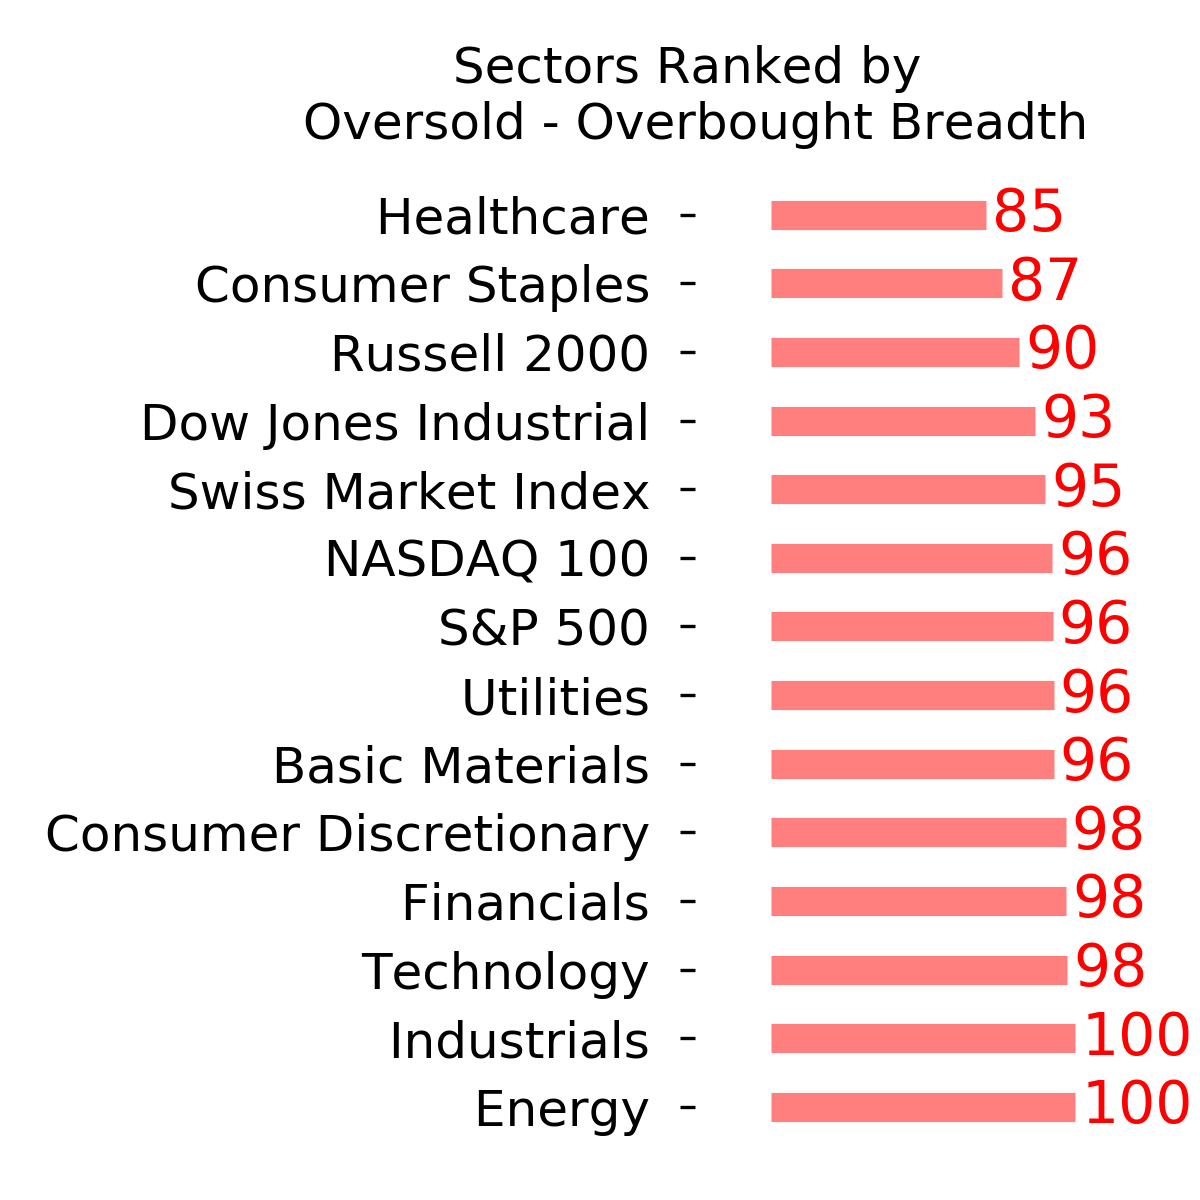
Optimism Index Thumbnails
|
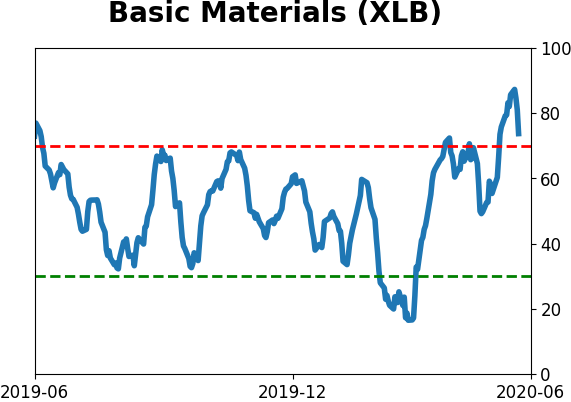
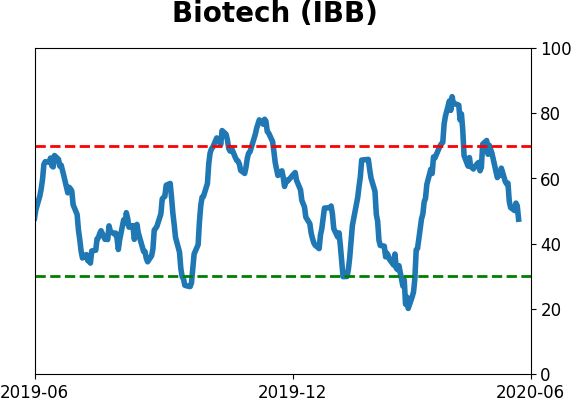
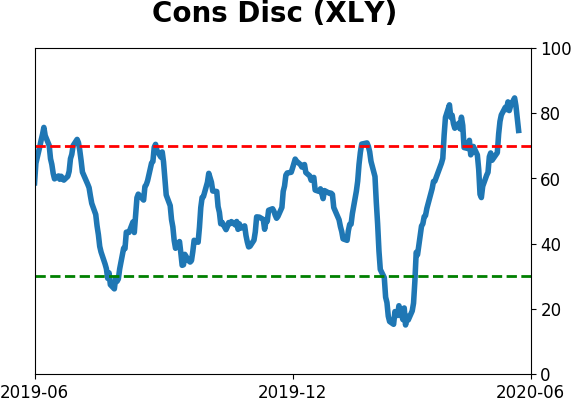
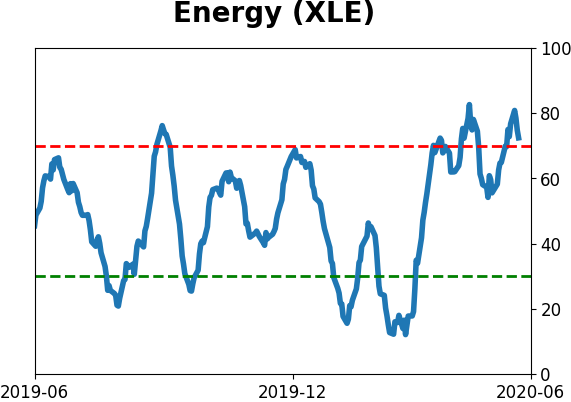
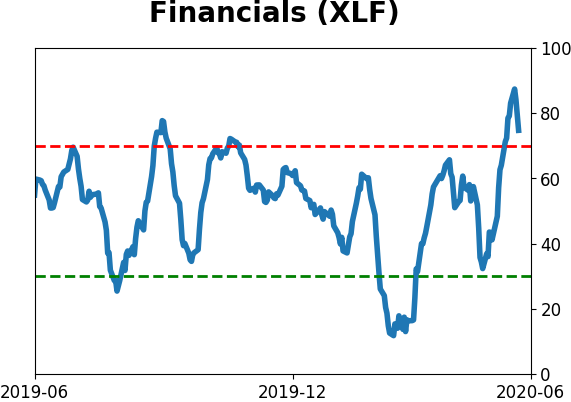
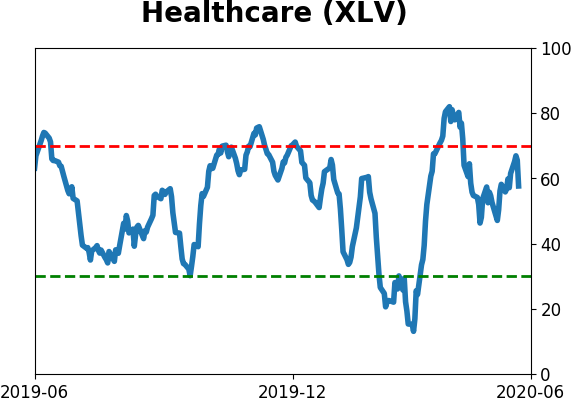
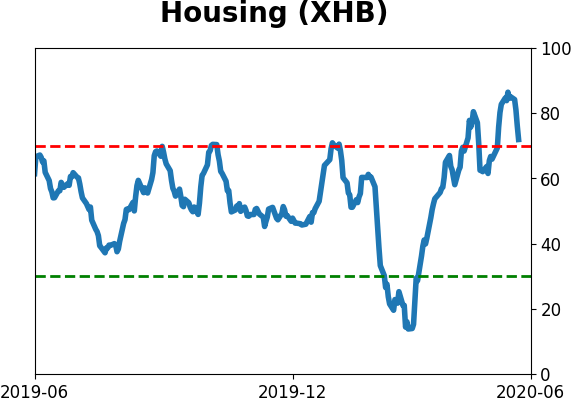
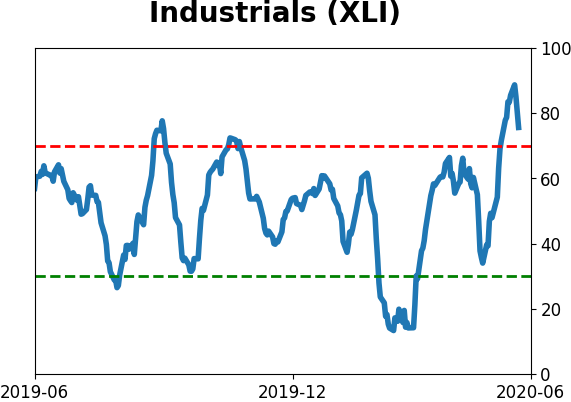
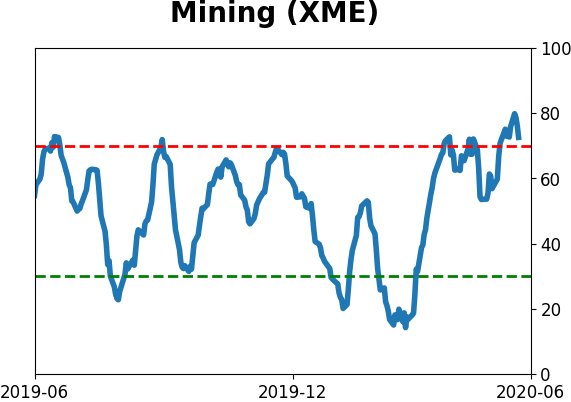
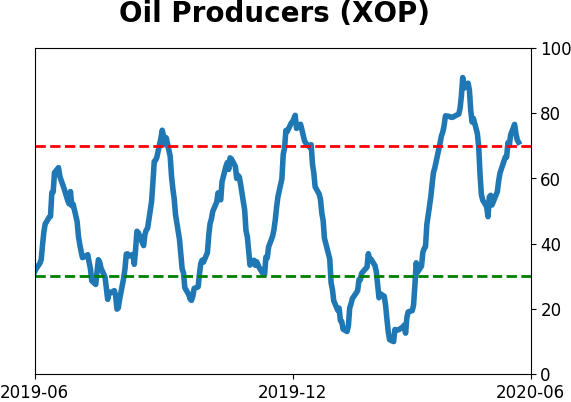
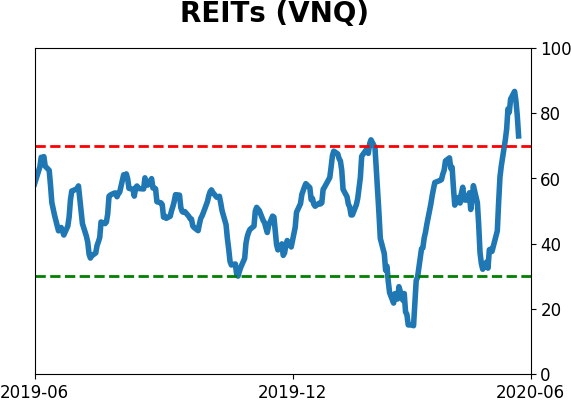
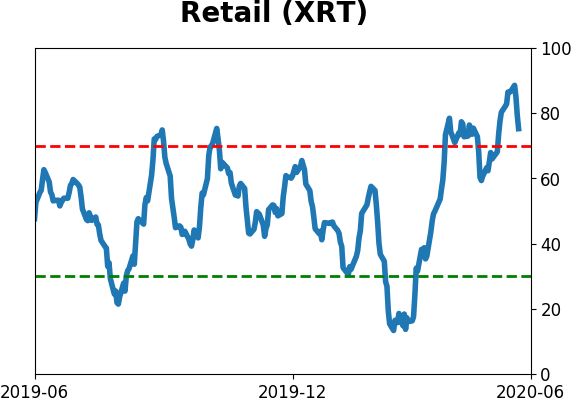
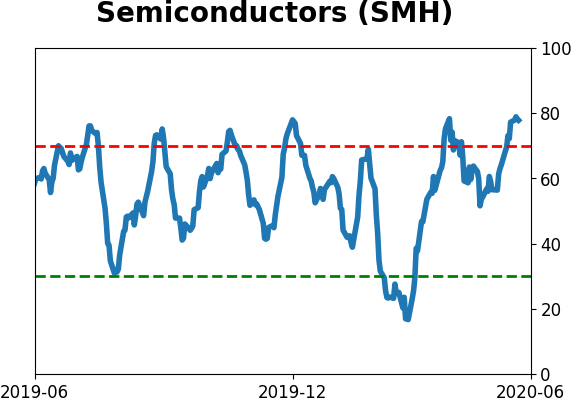
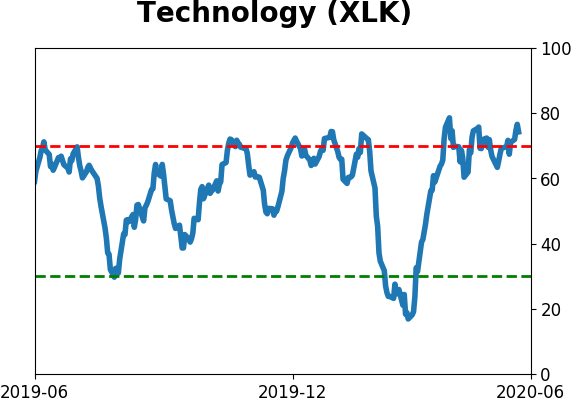
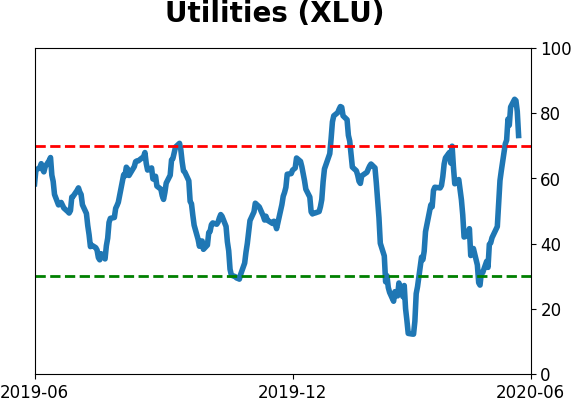
Sector ETF's - 10-Day Moving Average
|
|
|
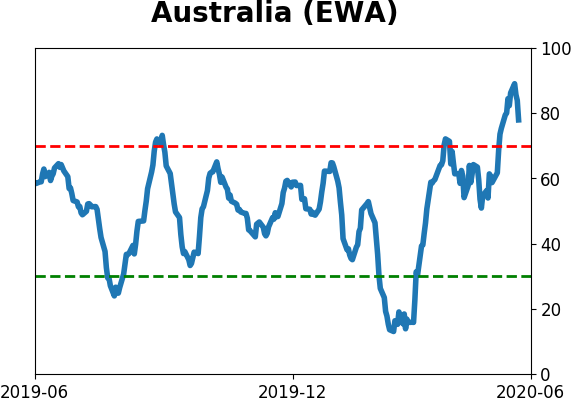
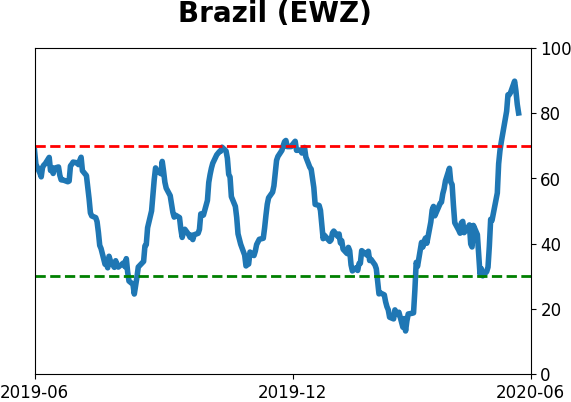
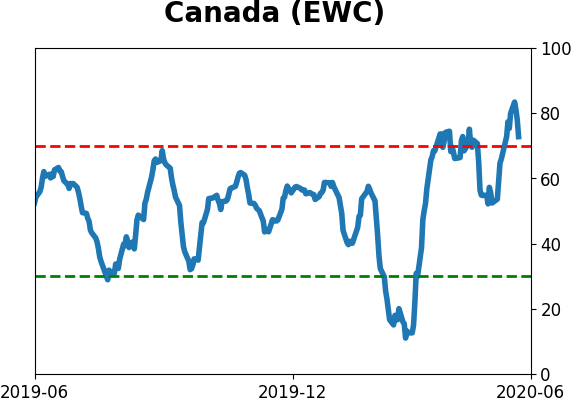
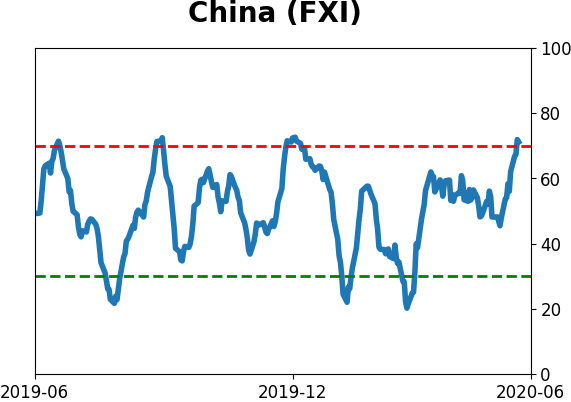
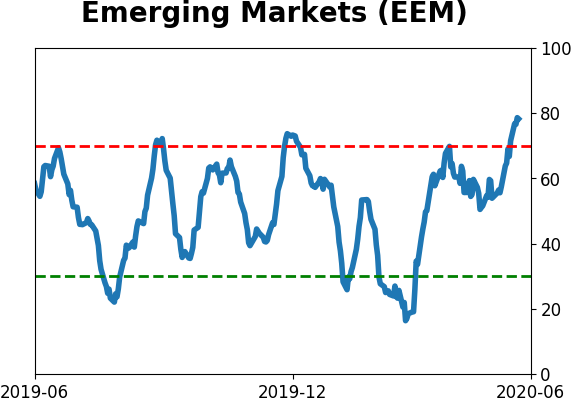
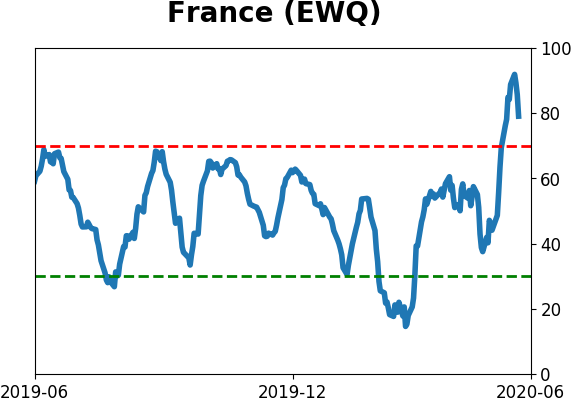
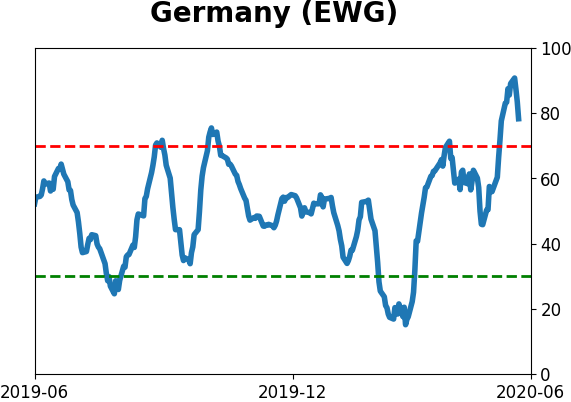
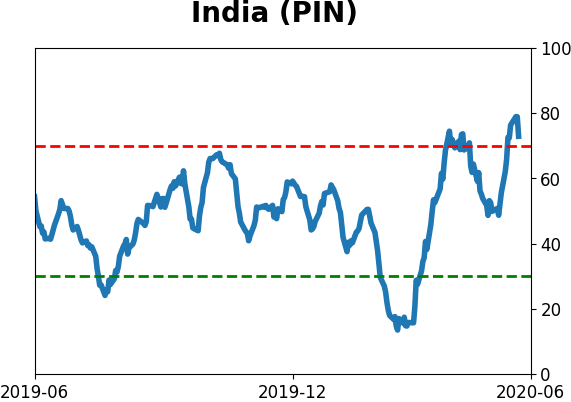
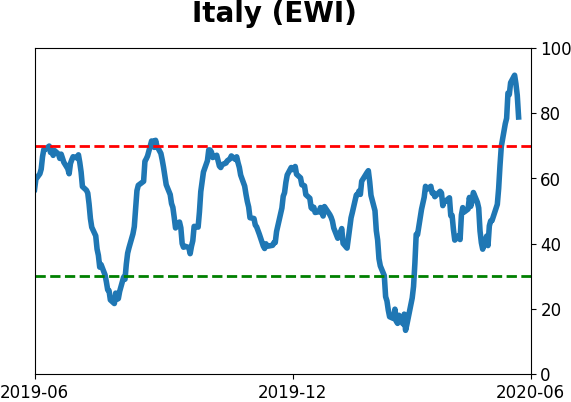
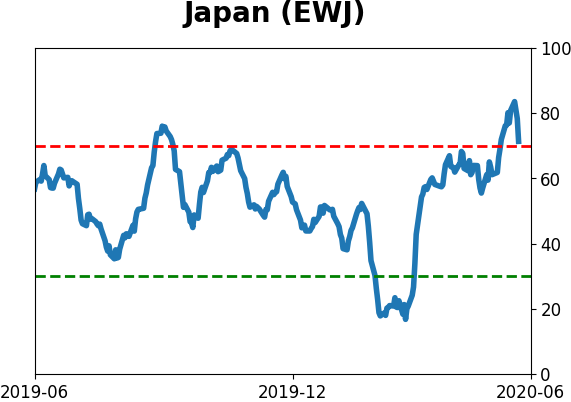
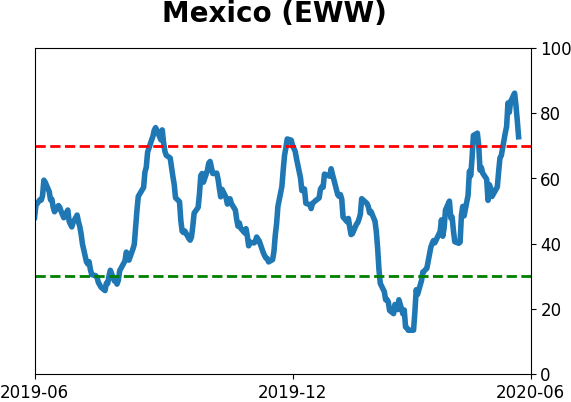
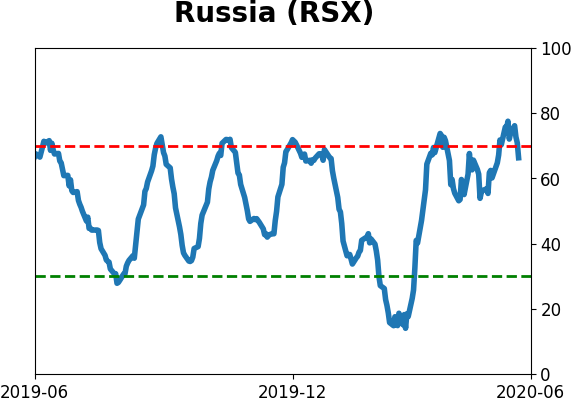
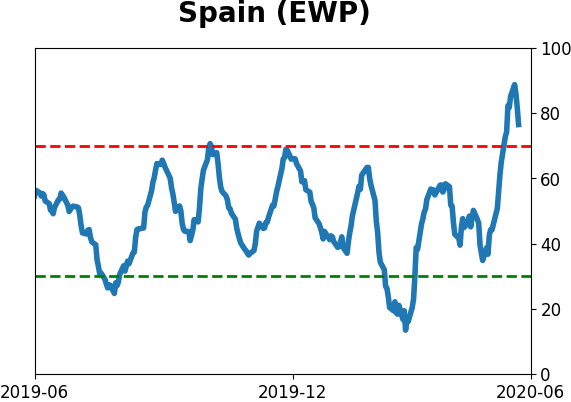
Country ETF's - 10-Day Moving Average
|
|
|
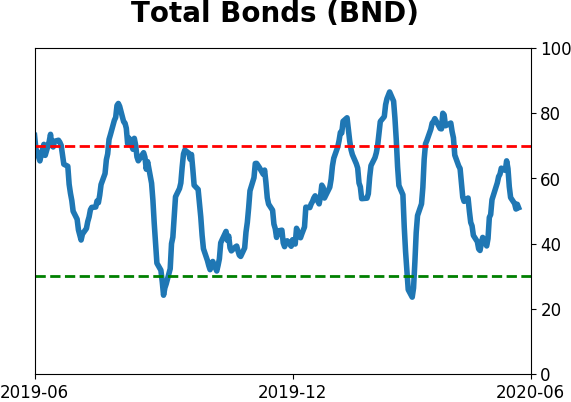
Bond ETF's - 10-Day Moving Average
|
|
|
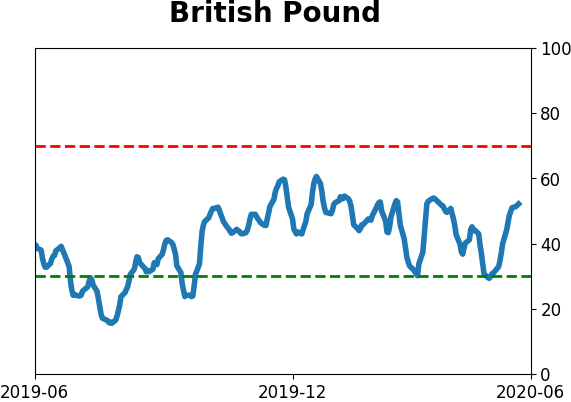
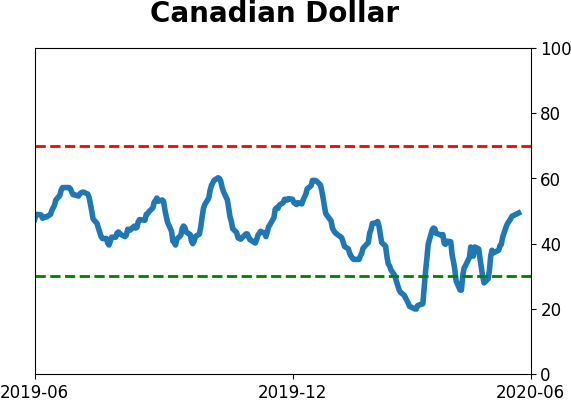
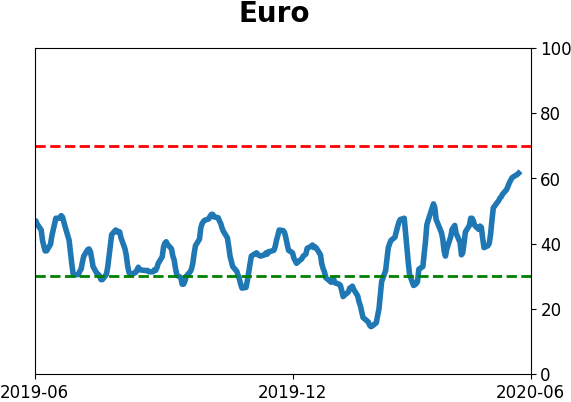
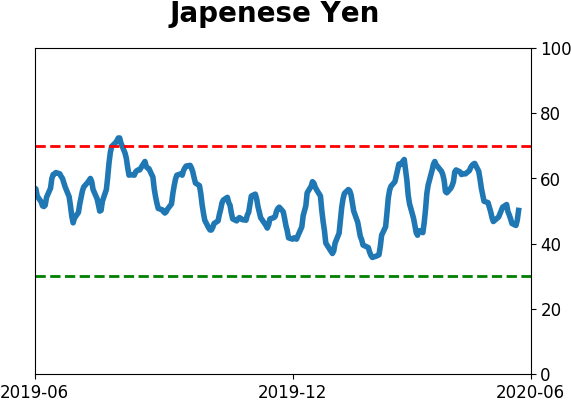
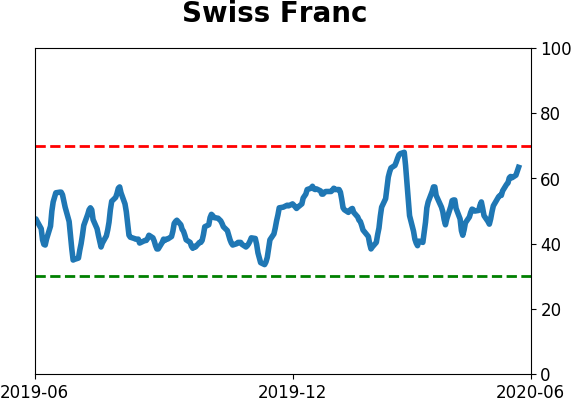
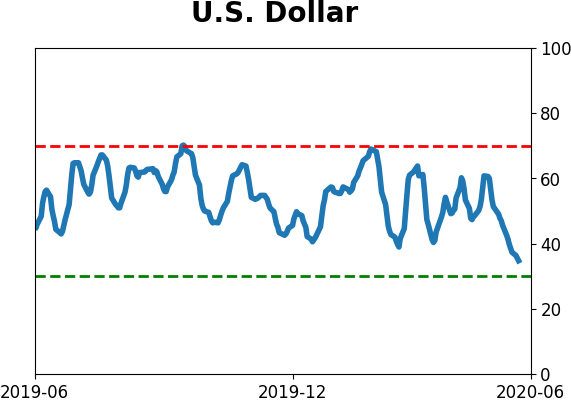
Currency ETF's - 5-Day Moving Average
|
|
|
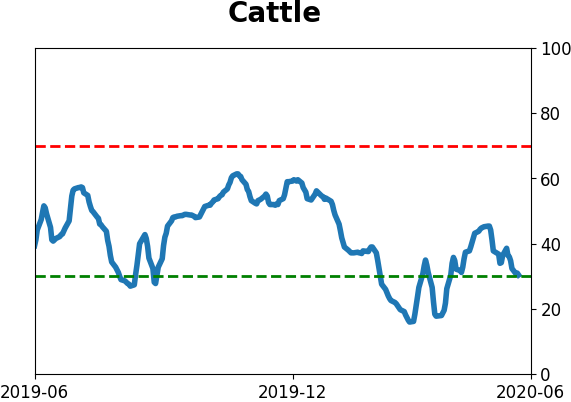
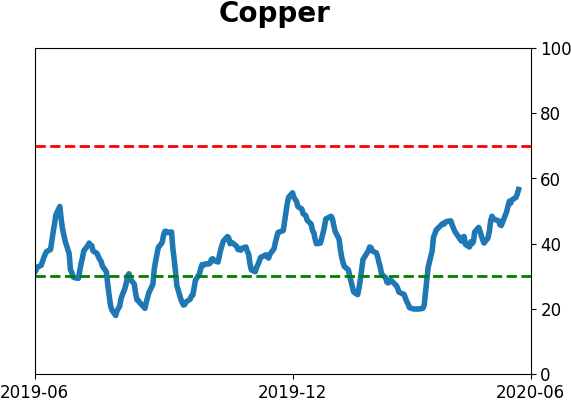
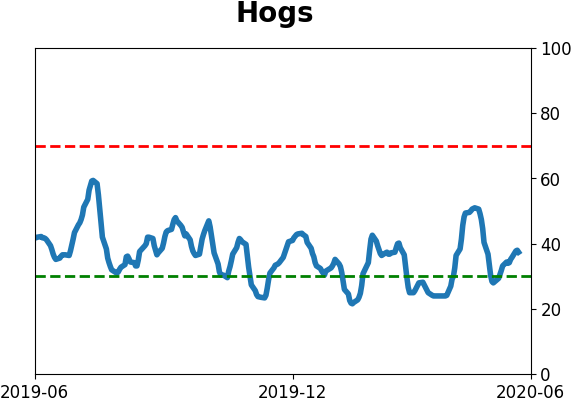
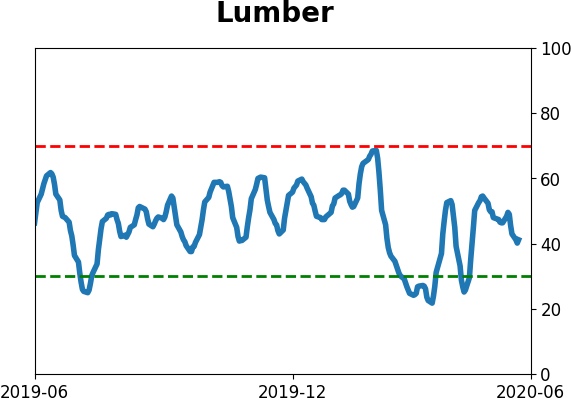
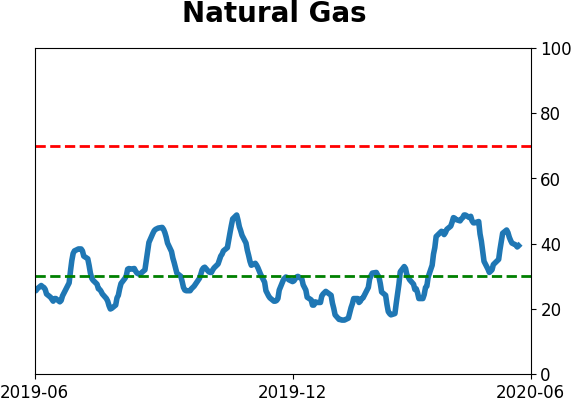
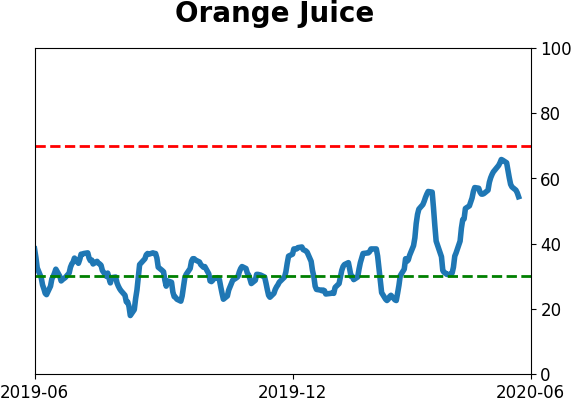
Commodity ETF's - 5-Day Moving Average
|
|