Headlines
|
|
Prices are surging and Wall Street can't keep up:
Share prices are surging, and Wall Street can't keep up. The S&P 500 is now nearly 10% above where strategists think it should end the year, the widest spread in more than 20 years. Analysts have been rushing to upgrade price targets, but even that hasn't been enough to keep up with gains in Apple, the largest stock in the market.
Cyclical stocks are outperforming again:
Driven by some of the most popular big tech firms, cyclical stocks just made a new high relative to defensive stocks for the first time in several months. Other times when cyclical stocks made a fresh relative high versus defensive stocks, it was good for the broader market, though the ratio is high enough now to be concerning on a long time frame.
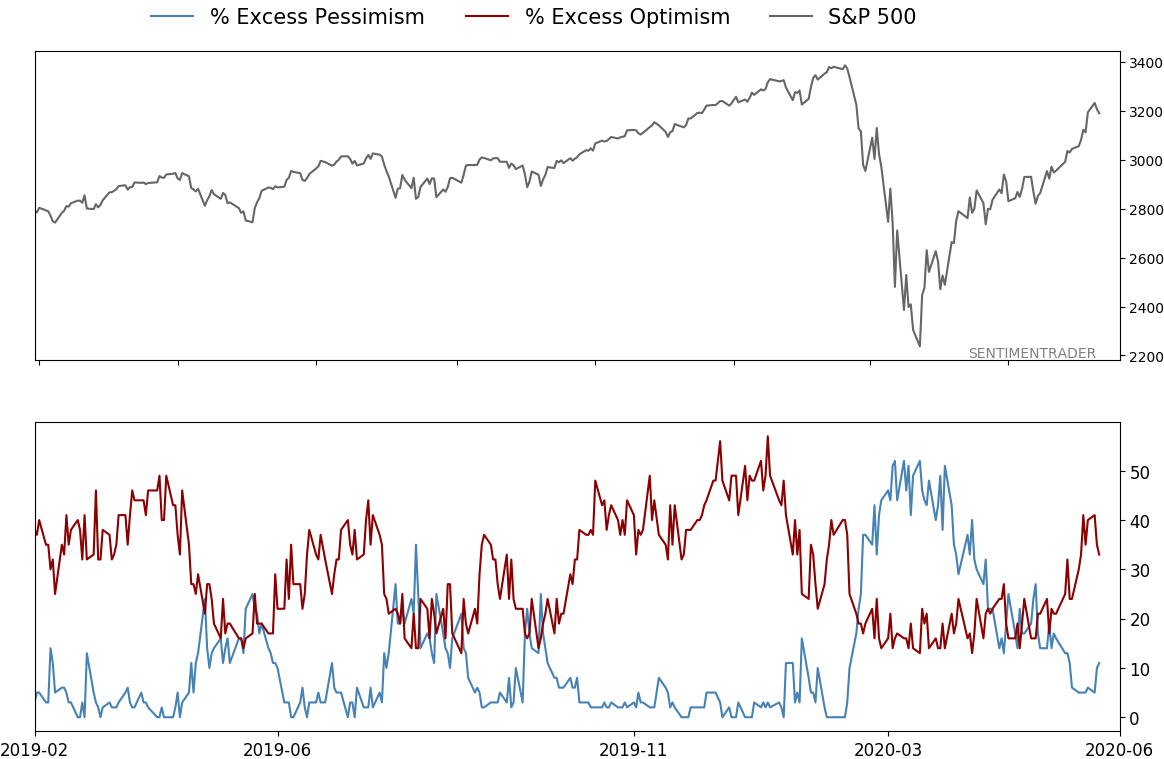
Bottom line: Weight of the evidence suggests flat/lower prices short- to medium-term, and higher prices long-term. Indicators are currently showing excessive optimism, with Dumb Money Confidence at 79% and more than a third of indicators showing excessive optimism. This tends to lead to poor short- to medium-term returns. The Active Studies show that when we look at stocks from various perspectives, there is a heavy positive skew over the medium-term long-term. Recently, there have been troubling signs of reckless speculation, but the breadth thrusts and recoveries have an almost unblemished record at preceding higher prices over a 6-12 month time frame. Indicators and studies for other markets are mixed with no strong conclusion.
|
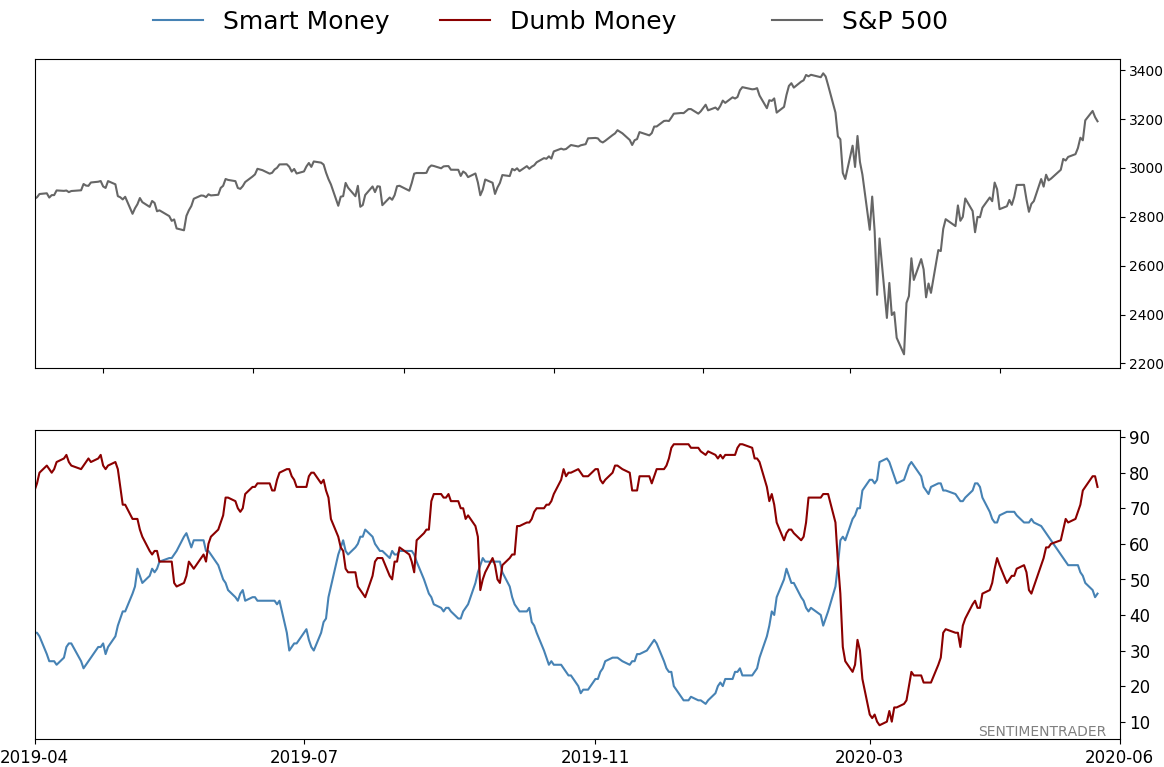
Smart / Dumb Money Confidence
|
Smart Money Confidence: 46%
Dumb Money Confidence: 76%
|
|
Risk Levels
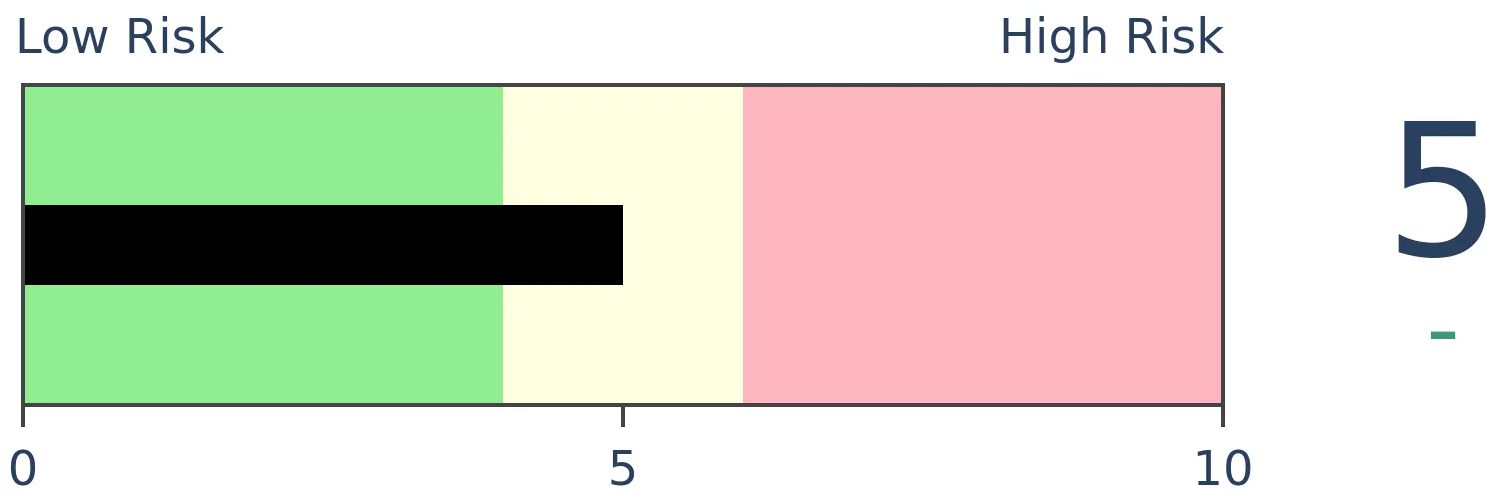
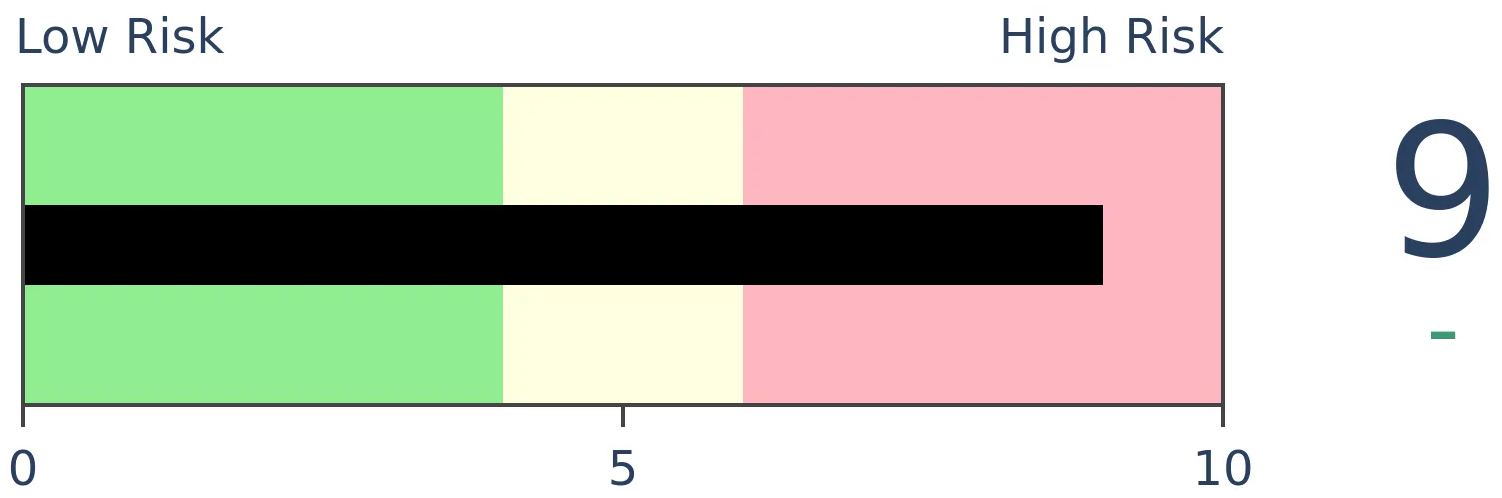
Stocks Short-Term
|
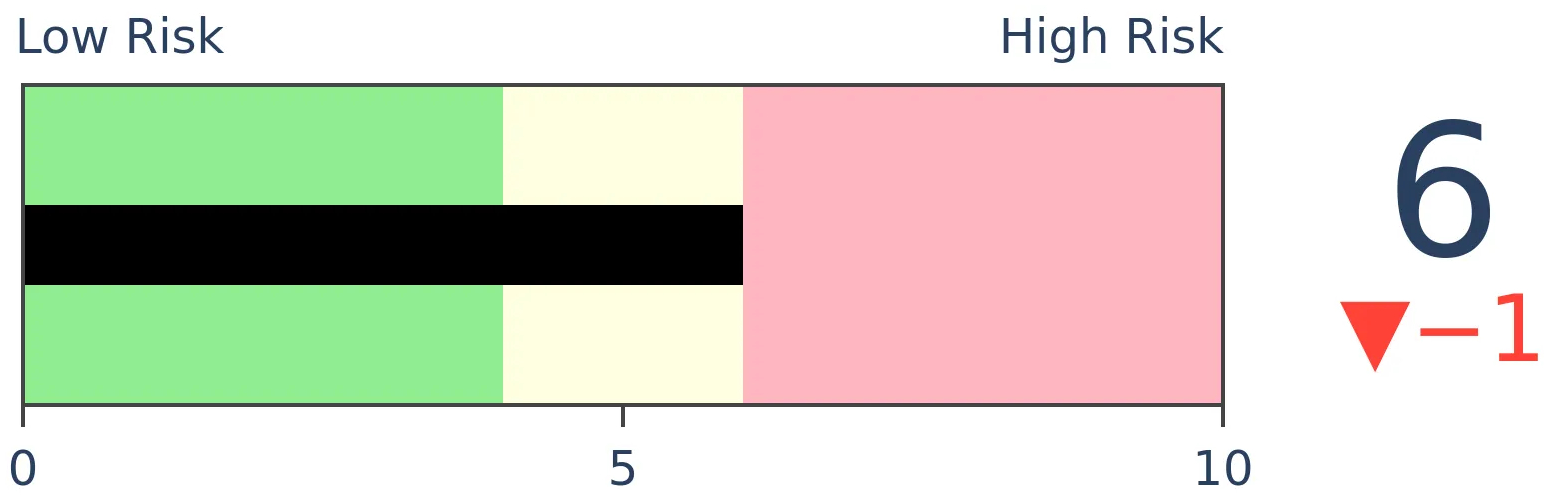
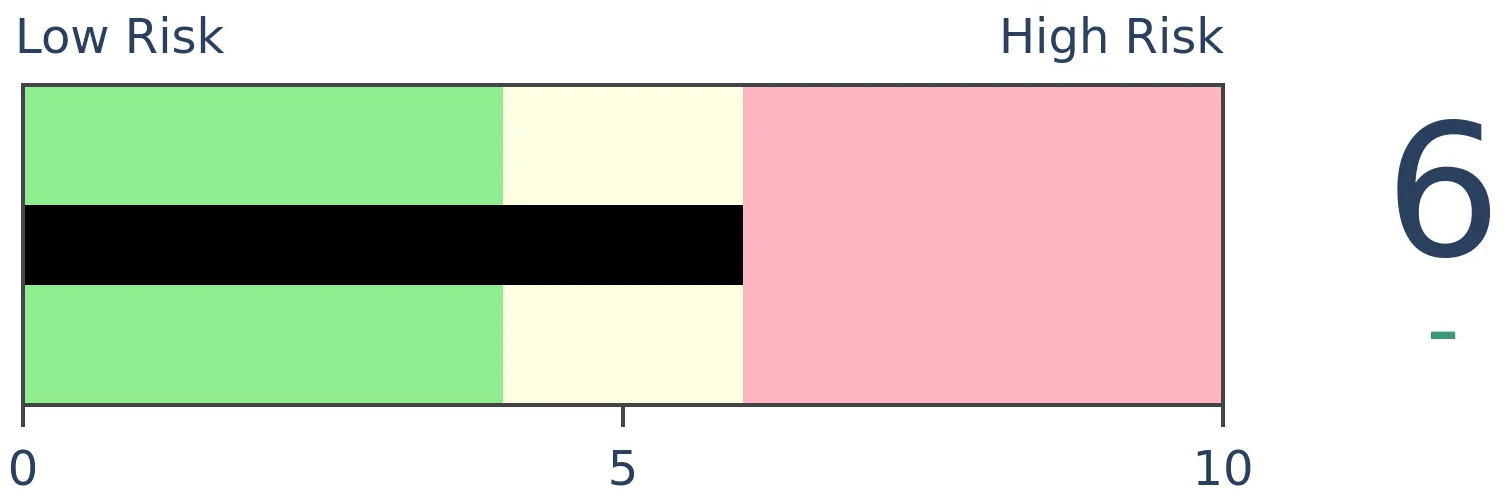
Stocks Medium-Term
|
|
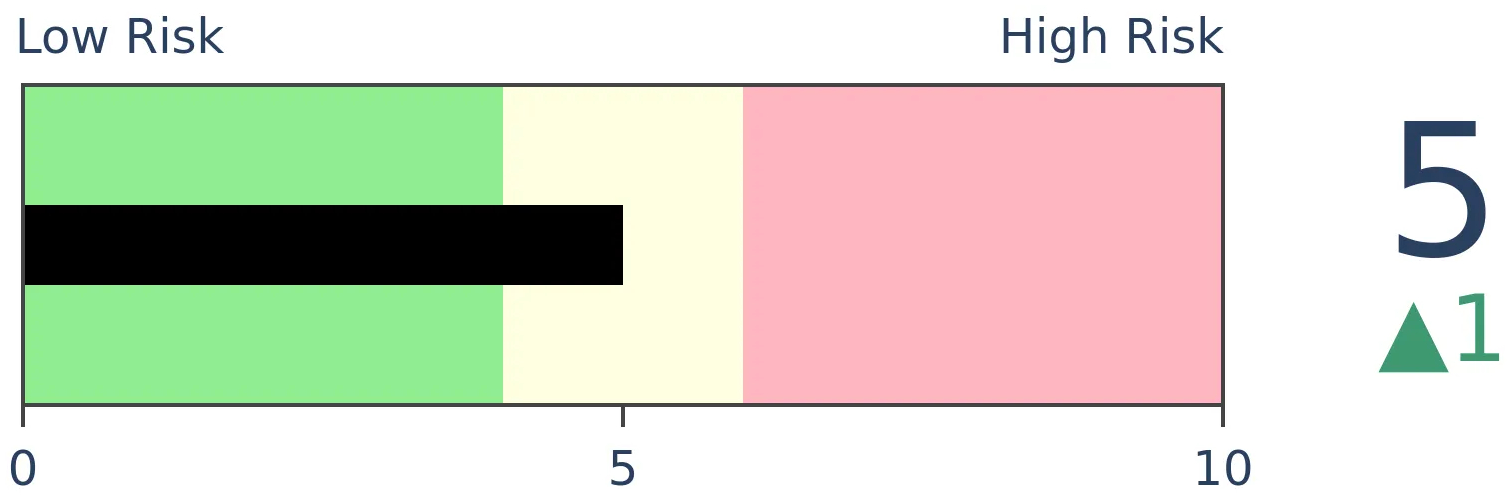
Bonds
|
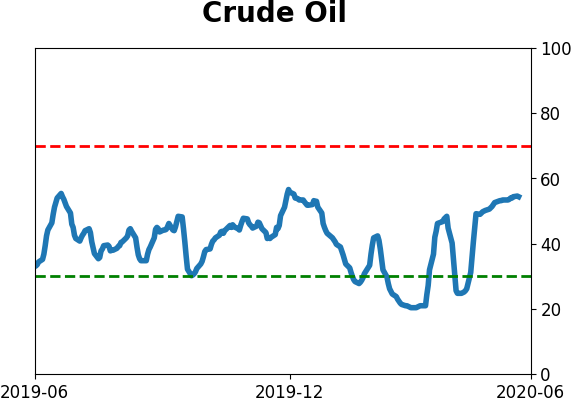
Crude Oil
|
|
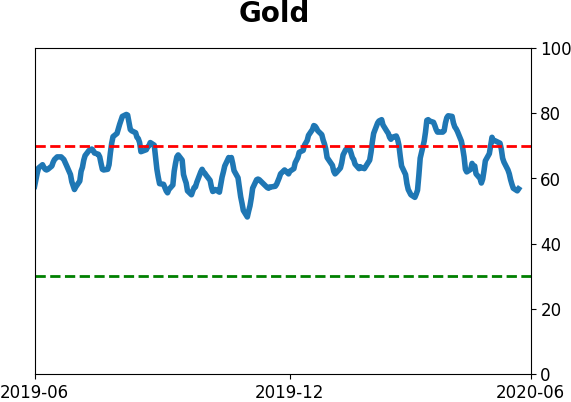
Gold

|
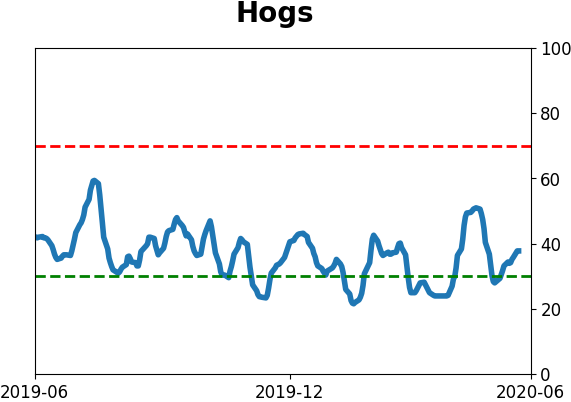
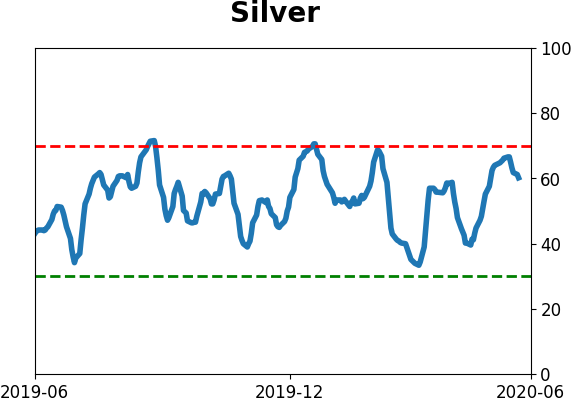
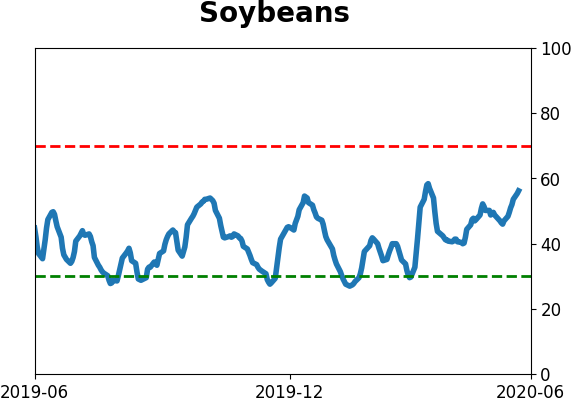
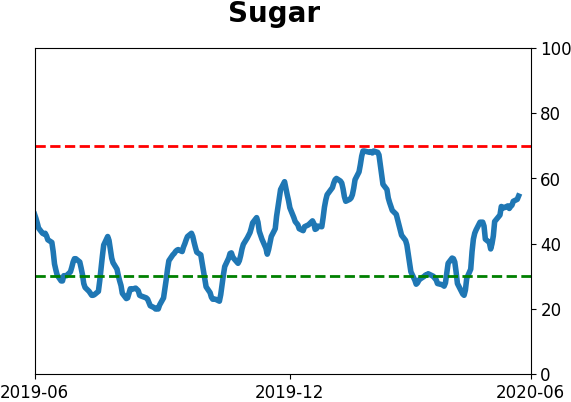
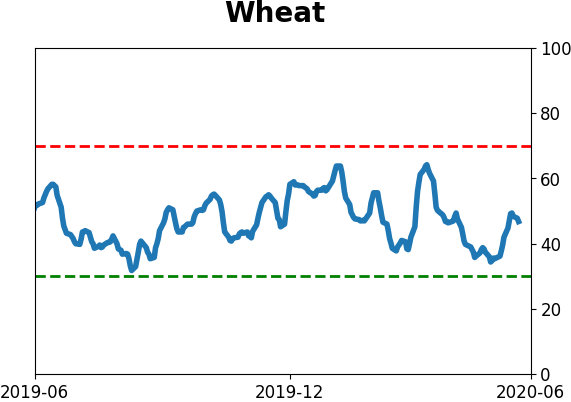
Agriculture
|
|
Research
BOTTOM LINE
Share prices are surging, and Wall Street can't keep up. The S&P 500 is now nearly 10% above where strategists think it should end the year, the widest spread in more than 20 years. Analysts have been rushing to upgrade price targets, but even that hasn't been enough to keep up with gains in Apple, the largest stock in the market.
FORECAST / TIMEFRAME
None
|
In June 2019, the S&P 500 had rallied enough to already meet Wall Street strategists' year-end target. Even by late 2019, they were not very optimistic about the S&P 500's prospects for 2020. That's usually been a good sign over the medium-term.
We've seen in prior years that when the S&P becomes 20% or more "undervalued" according to strategists, it's been a very good sign. It was again this year though it doubled that discount before rebounding. Now, strategists are not really buying into the rally. In aggregate, they haven't been raising their year-end price target for the S&P 500 nearly fast enough to keep up with the index.
The S&P is now nearly 10% higher than the average strategist year-end target, the highest since at least 1999, as noted by Bloomberg.
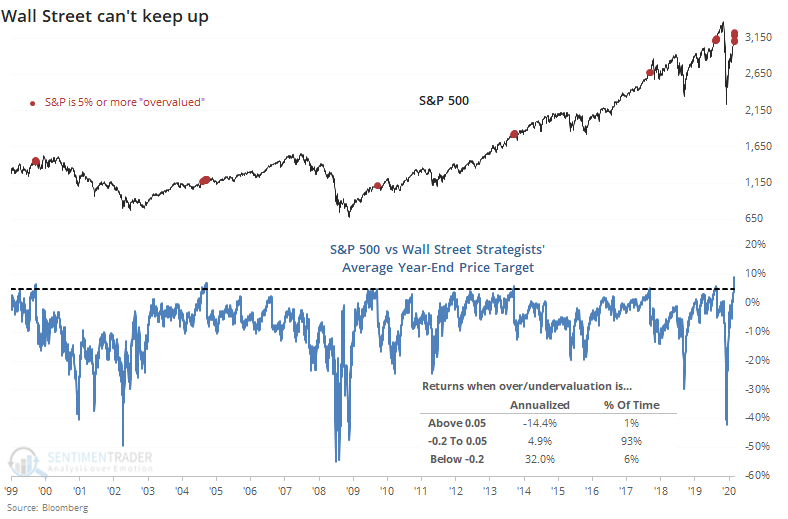
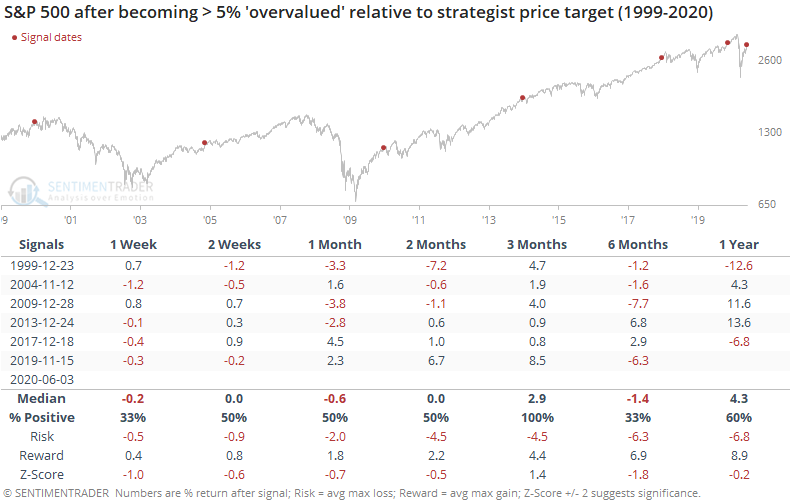
We can see from the chart that the S&P 500's annualized return after becoming at least 5% overvalued relative to strategists' expectations is a terrible -14.4%, versus +32.0% when it's 20% or more undervalued.
When the S&P first runs more than 5% ahead of strategists' estimates, returns over the next six months were questionable.
Strategists tend to work from the top down, utilizing macro inputs to gauge the likelihood of higher or lower prices. Analysts tend to work from the bottom up, evaluating earnings prospects for individual companies. After a historic panic in March, they've been busy upgrading the price targets on stocks they follow.
Their optimism has generally not been rewarded.
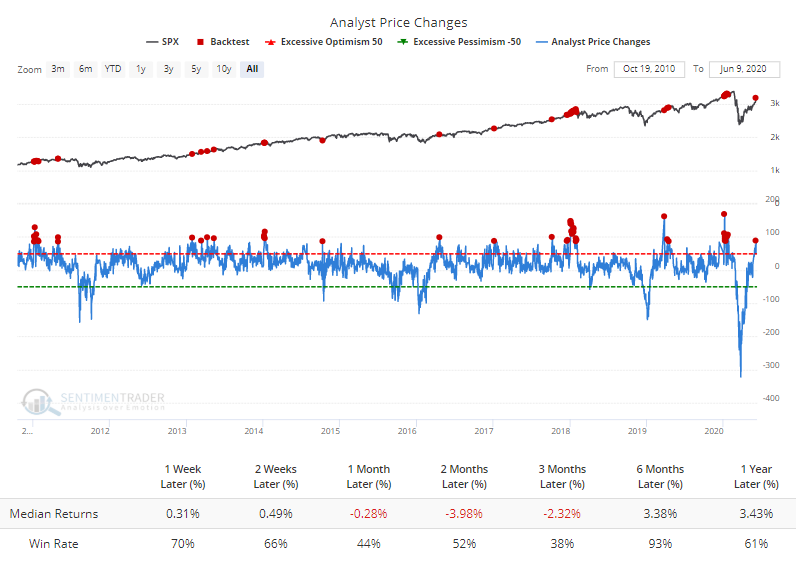
The Backtest Engine shows that when analysts upgraded their price targets on more than a net 85 stocks within the S&P 500, returns in the index over the next three months were poor and consistently negative.
Curiously, they remain tepid on prospects for the largest stock in the U.S. The share price of Apple has run far ahead of where analysts think it should be, indicating that the stock is nearly 10% overvalued.
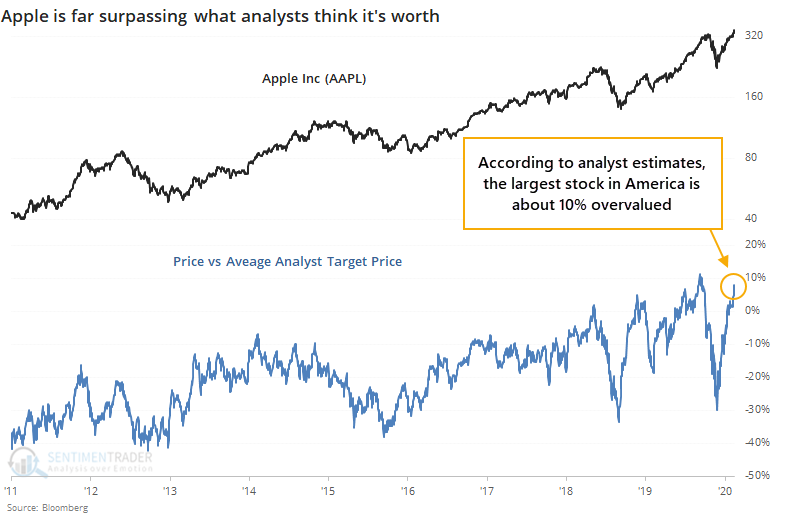
While this has not been a precise timing signal, when the stock has run this far ahead of analysts, its future returns were mediocre, with short-term gains usually given back during subsequent pullbacks.
There are quite a few conflicting cross-currents right now, with (mostly) shorter-term signs of speculation and rates of change suggesting a period of short- to medium-term digestion at least. This sudden price surge, over and above fundamental expectations, is another shorter-term warning sign. Longer-term, we continue to see massive thrusts and recoveries in stocks, which have led to higher prices 6-12 months later almost without fail.
BOTTOM LINE
Driven by some of the most popular big tech firms, cyclical stocks just made a new high relative to defensive stocks for the first time in several months. Other times when cyclical stocks made a fresh relative high versus defensive stocks, it was good for the broader market, though the ratio is high enough now to be concerning on a long time frame.
FORECAST / TIMEFRAME
None
|
During the height of the pandemic panic, investors dumped stocks that were deemed most exposed to economic growth, favoring ones that are typically considered defensive.
Now that risk-on appetite is firmly in control, cyclical stocks are back in fashion. The ratio between them and defensive stocks just captured a new high for the first time in months.
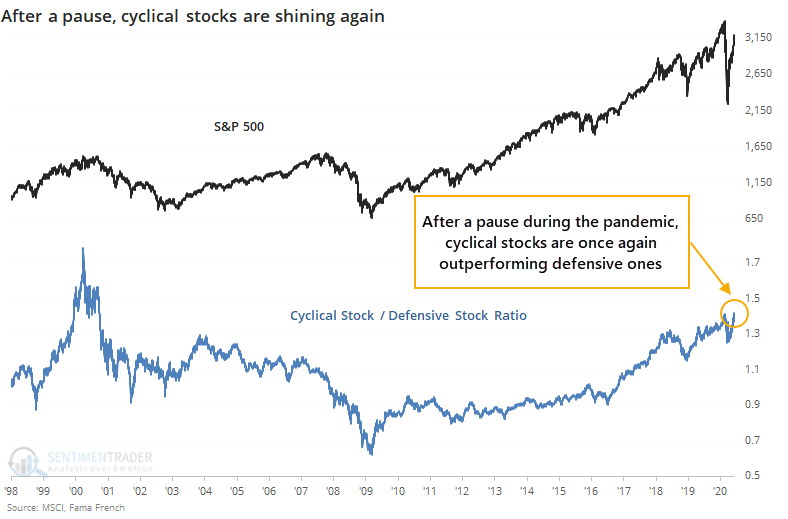
Cyclical stocks are being driven by the usual culprits like Apple, Amazon, Microsoft, but also include JP Morgan, Visa, and Home Depot. Defensive stocks include Johnson & Johnson, Procter & Gamble, and UnitedHealth - companies making products that consumers tend to need no matter what the economy does.
Over a very long time frame, the ratio has gone much further, but even now it could be considered high. Extreme levels in the ratio tended to coincide with peaks in the S&P 500.
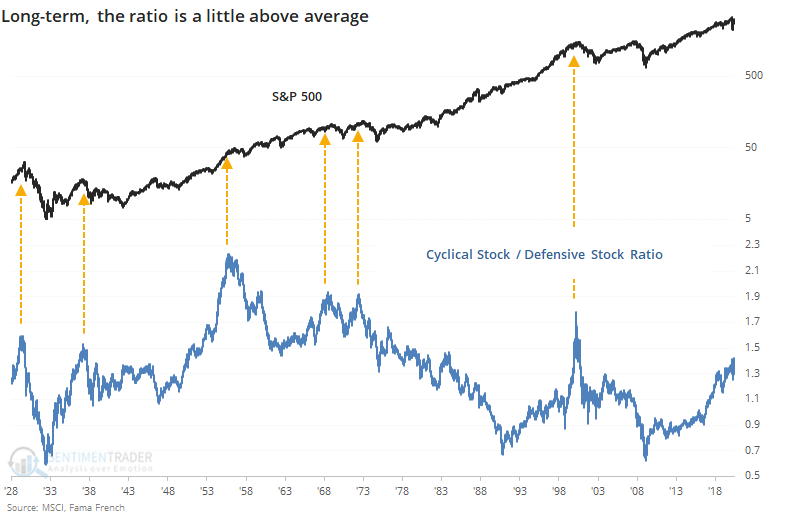
The problem is identifying when those peaks actually occurred in real-time, but using something like a 200-day average of the ratio was a decent trend identifier. Regardless, it doesn't matter right now since the ratio just hit a decade-high, so clearly it hasn't rolled over yet.
This evidence of risk-on behavior was mostly a good sign for the S&P.
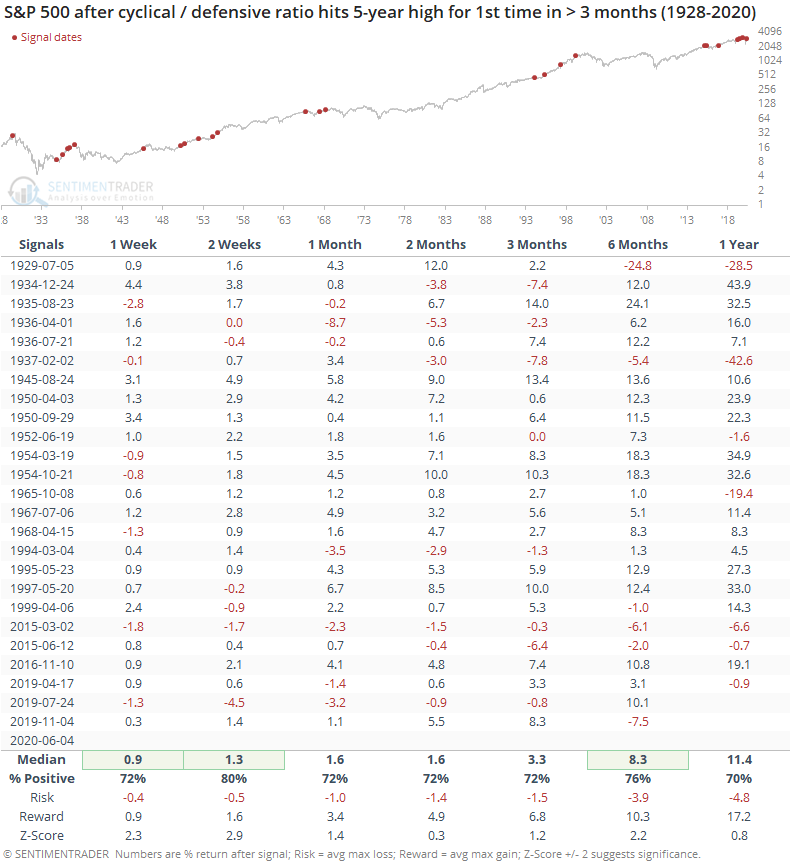
Returns over the short-term were good, medium-term were okay, and long-term were well above-average again. Over the next 6 months, there were few losses, and most of them were small. The risk/reward skew was more than 3-to-1 to the "reward" side, a rough gauge for what could be considered an edge.
For other factors, there was not a strong edge.
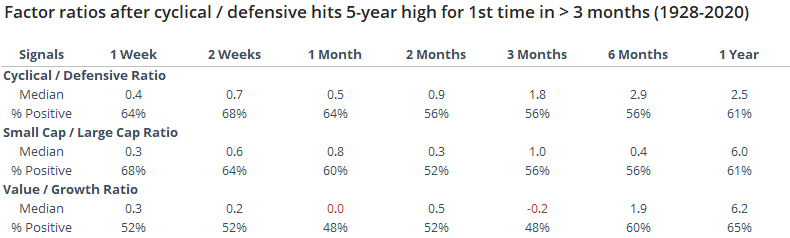
Because the ratio is already high, this breakout was not a good reason to expect cyclical stocks to continue to outperform defensive ones. Similarly, small-cap stocks did not consistently outperform large-cap ones, and value didn't consistently outperform growth.
Overall, the new relative high in cyclical stocks should be a modest positive for stock indexes like the S&P 500, but the ratio is high enough to be concerning and a turn lower in the ratio would likely signal a risk-off environment that's been tough for stocks to hold gains.
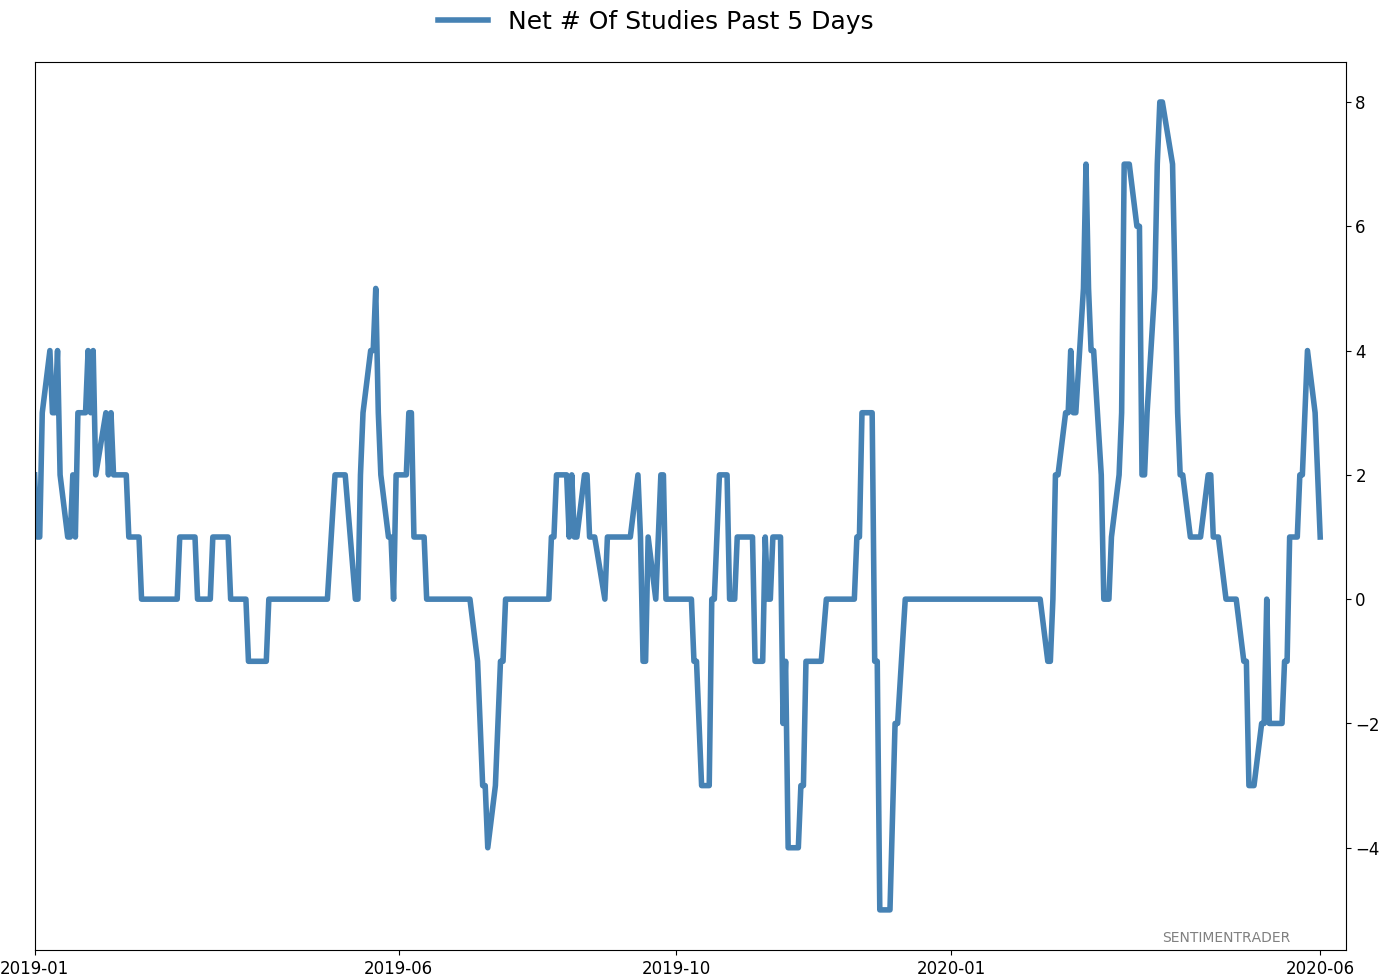
Active Studies
| Time Frame | Bullish | Bearish | | Short-Term | 0 | 1 | | Medium-Term | 8 | 5 | | Long-Term | 40 | 1 |
|
Indicators at Extremes
Portfolio
| Position | Weight % | Added / Reduced | Date | | Stocks | 38.9 | Reduced 10% | 2020-05-13 | | Bonds | 0.0 | Reduced 6.7% | 2020-02-28 | | Commodities | 5.1 | Added 2.4%
| 2020-02-28 | | Precious Metals | 0.0 | Reduced 3.6% | 2020-02-28 | | Special Situations | 0.0 | Reduced 31.9% | 2020-03-17 | | Cash | 56.0 | | |
|
Updates (Changes made today are underlined)
In the first months of the year, we saw manic trading activity. From big jumps in specific stocks to historic highs in retail trading activity to record highs in household confidence to almost unbelievable confidence among options traders. All of that came amid a market where the average stock couldn't keep up with their indexes. There were signs of waning momentum in stocks underlying the major averages, which started triggering technical warning signs in late January. The kinds of extremes we saw in December and January typically take months to wear away, but the type of selling in March went a long way toward getting there. When we place the kind of moves we saw into March 23 into the context of coming off an all-time high, there has been a high probability of a multi-month rebound. After stocks bottomed on the 23rd, they enjoyed a historic buying thrust and retraced a larger amount of the decline than "just a bear market rally" tends to. Those thrusts are the most encouraging sign we've seen in years. Even through early June, we're still seeing thrusts that have led to recoveries in longer-term breadth metrics. By early May, we were seeing some troubling signs of shorter-term speculation, and buyers have run right over those. This is what bull markets do. In bear markets, they don't get a chance, as sellers tend to come in as soon as sentiment moves to neutral or slightly optimistic. That didn't happen this time, and the rally has gone way further, and way longer, than "just a bear market rally" does. I am the world's worst momentum trader, and this is one of the most anguishing kinds of markets for me. I detest chasing prices higher, especially in the face of readings like high Dumb Money Confidence and small trader call buying. I recognize the overwhelming positives of the recoveries noted above, and it's impossible to ignore the medium- to long-term positive implications. I'm holding out on adding exposure for now, based on the negatives that have been generated (and so far failed), at the risk of falling further behind a new roaring bull market.
RETURN YTD: -4.9% 2019: 12.6%, 2018: 0.6%, 2017: 3.8%, 2016: 17.1%, 2015: 9.2%, 2014: 14.5%, 2013: 2.2%, 2012: 10.8%, 2011: 16.5%, 2010: 15.3%, 2009: 23.9%, 2008: 16.2%, 2007: 7.8%
|
|
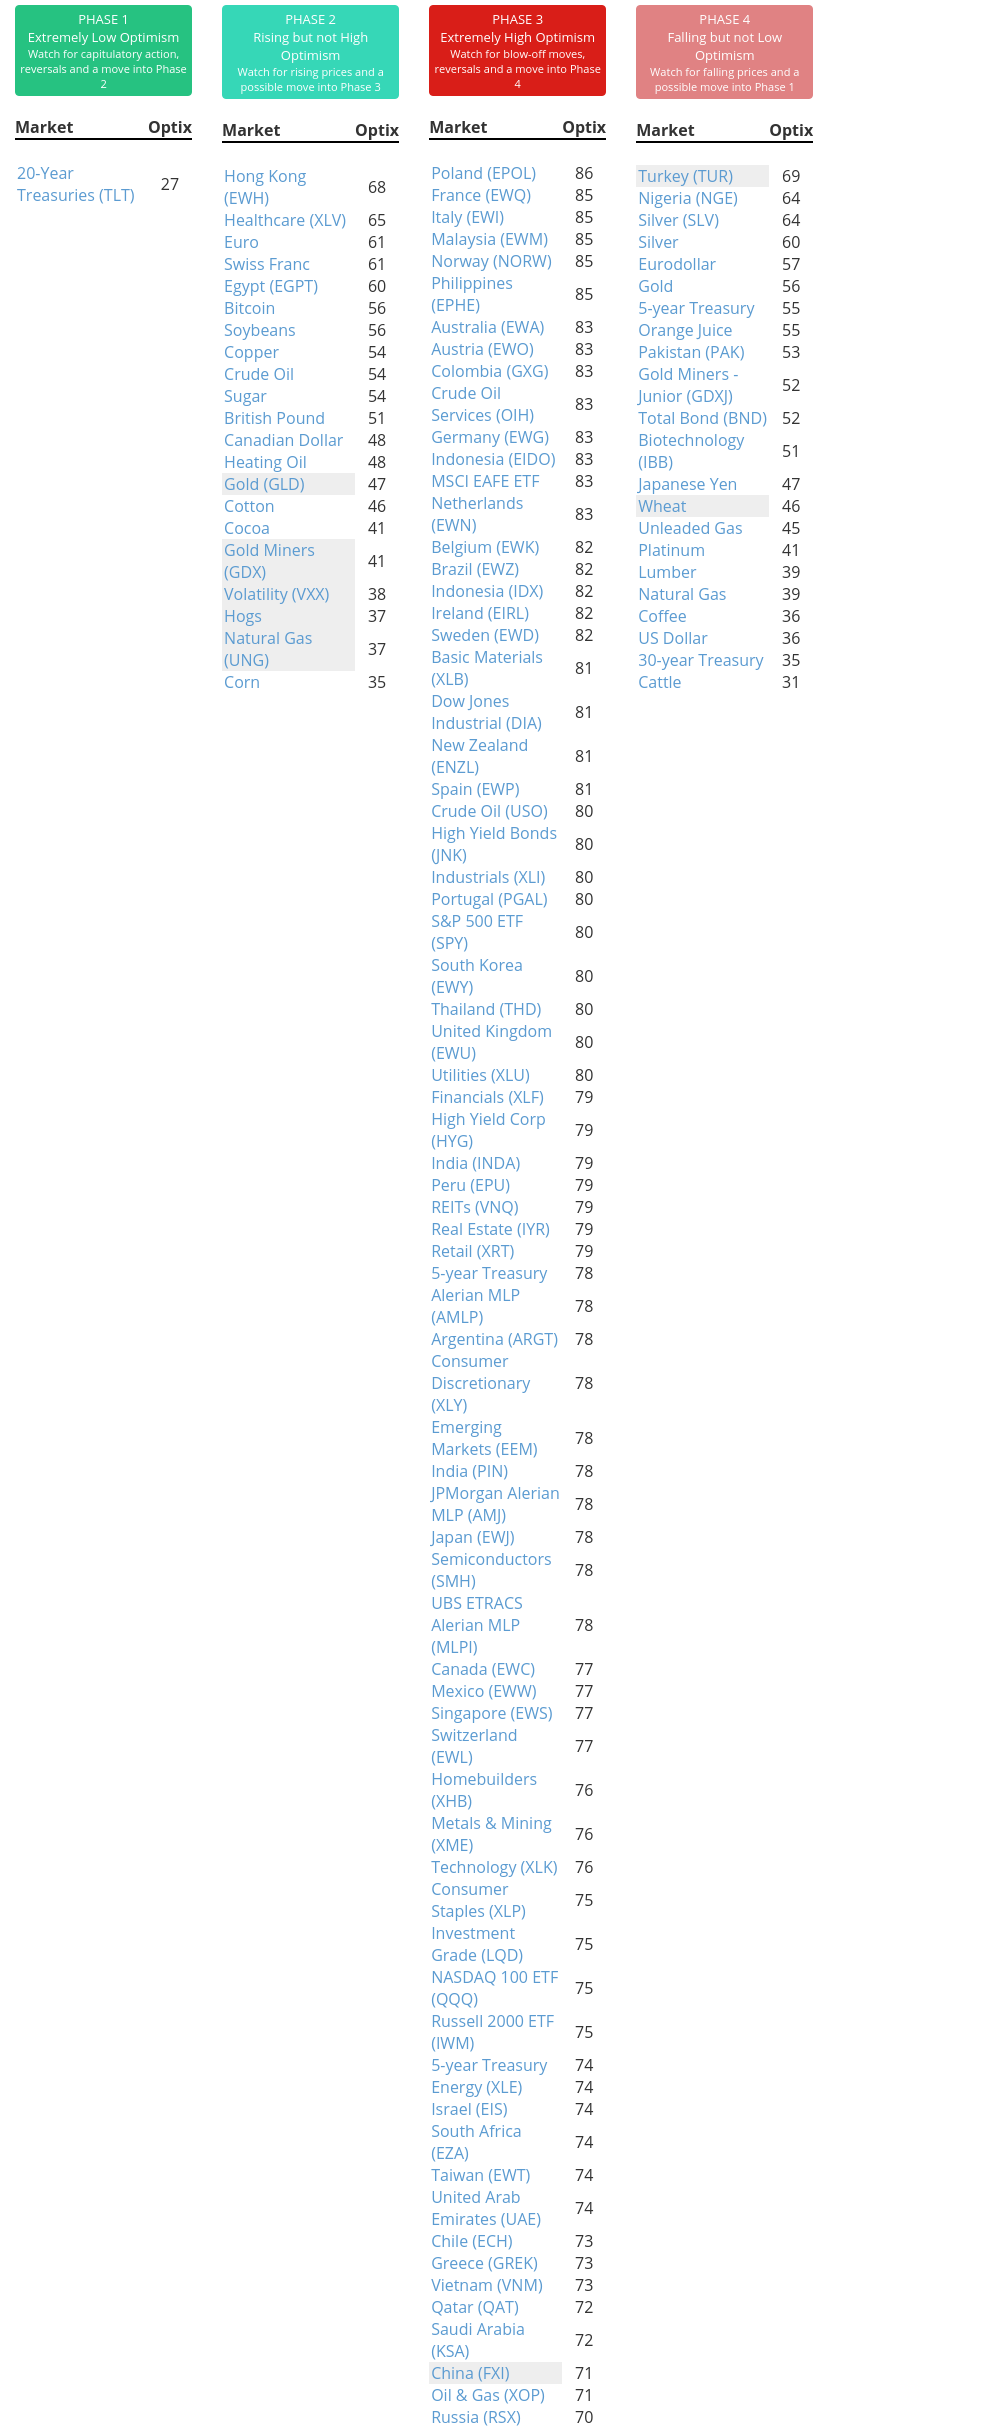
Phase Table
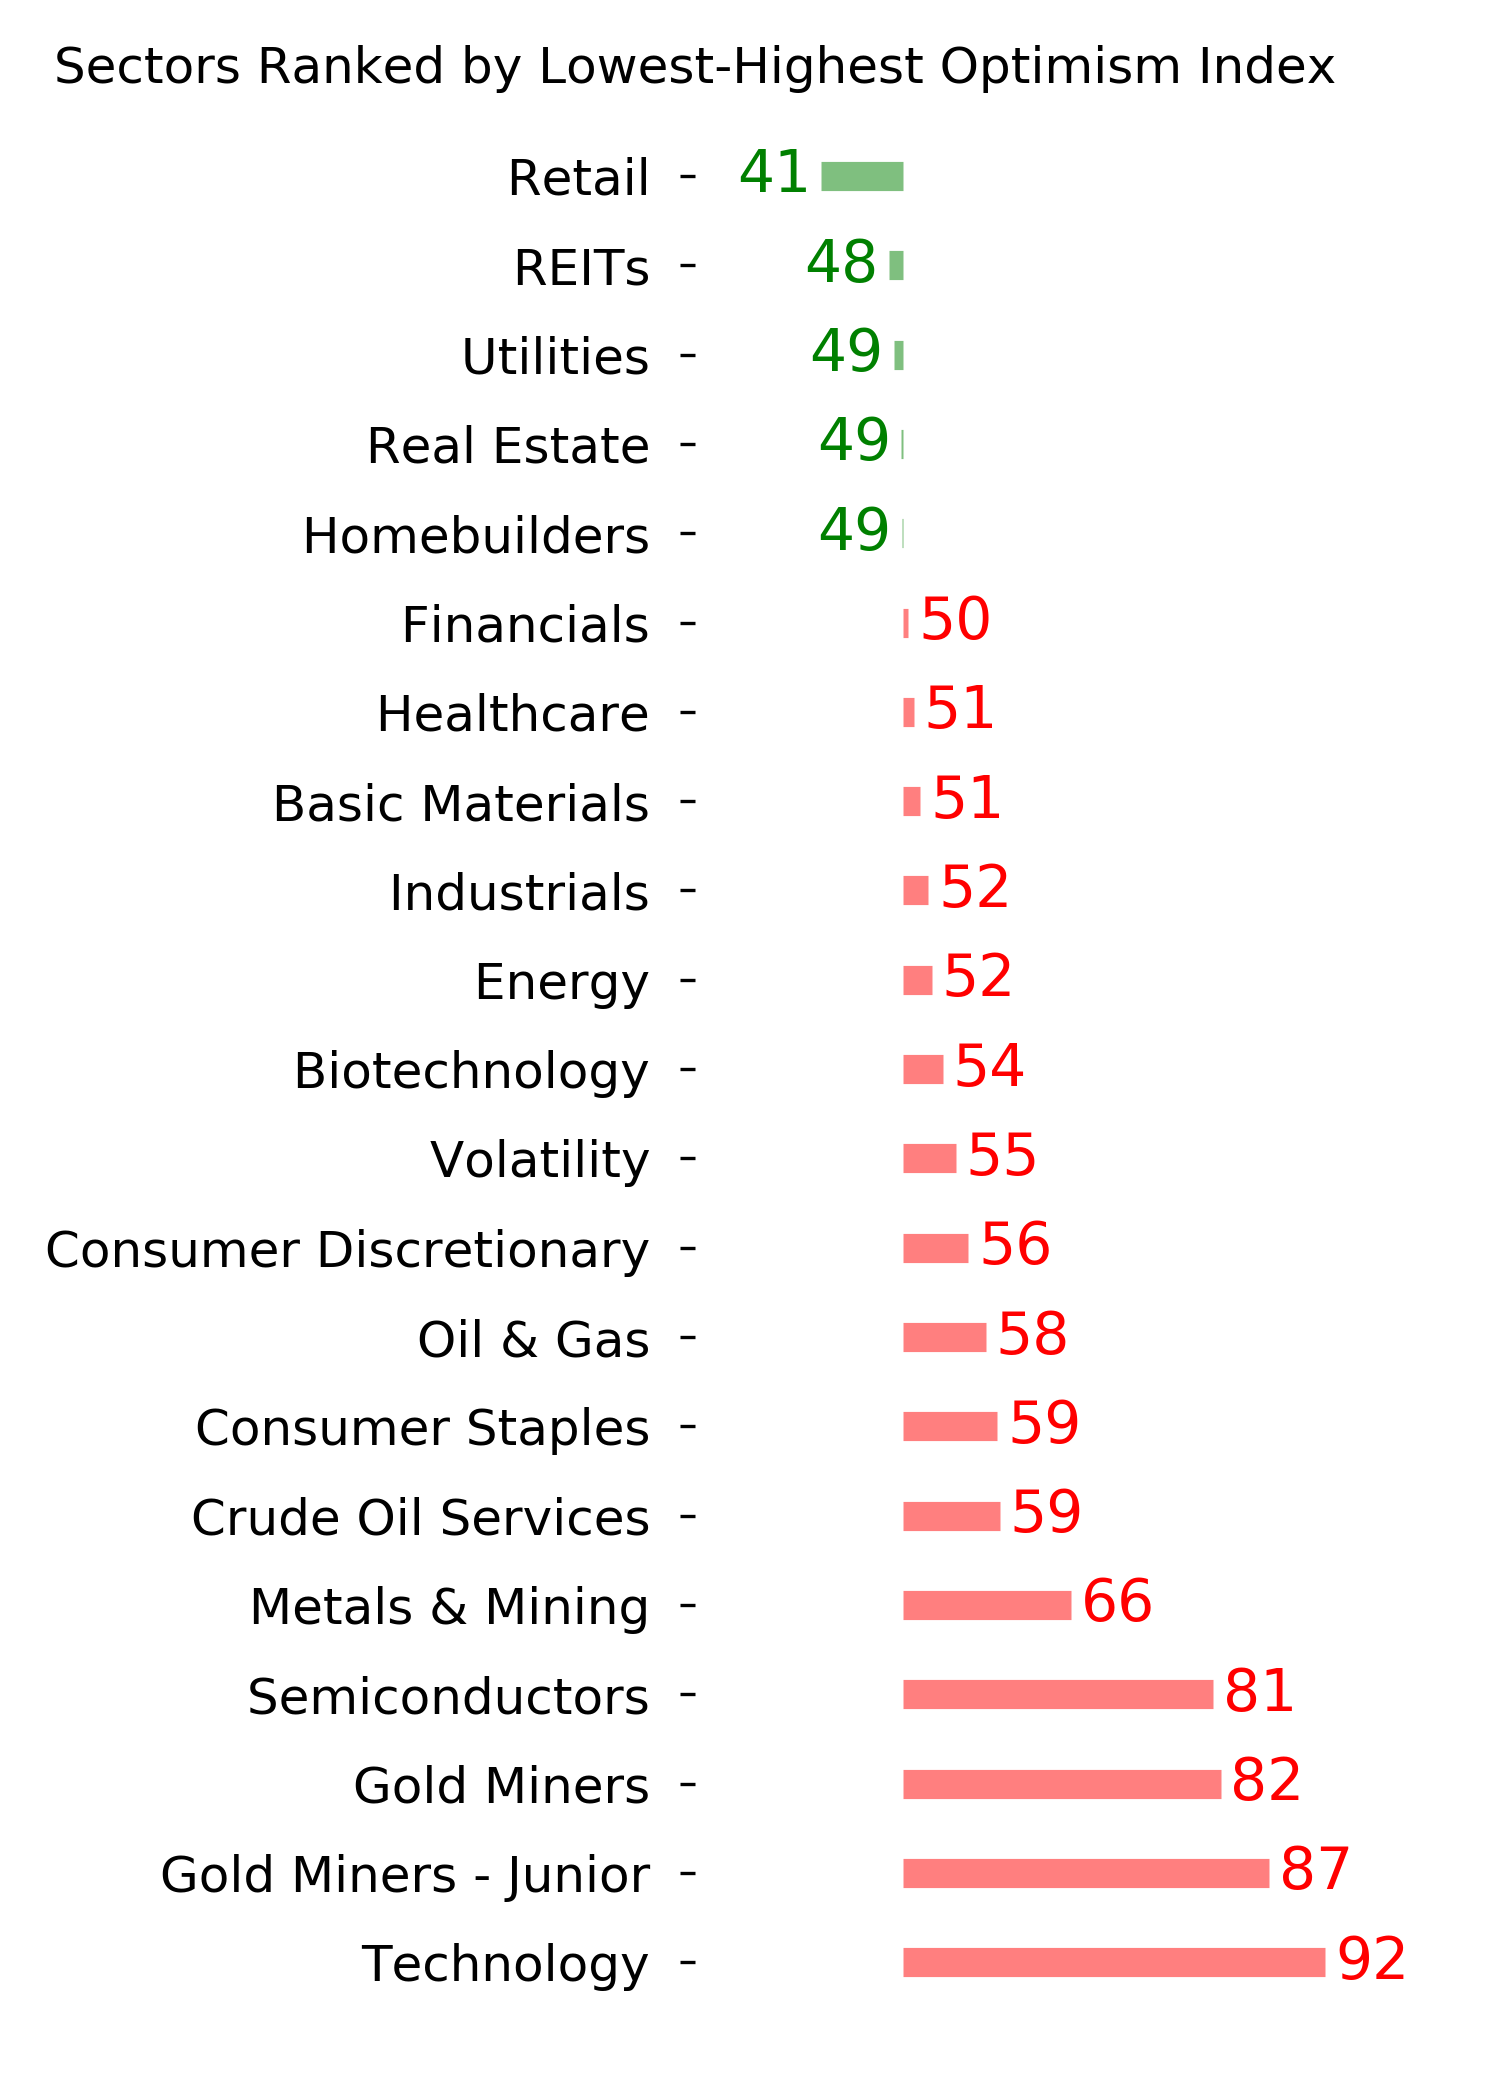
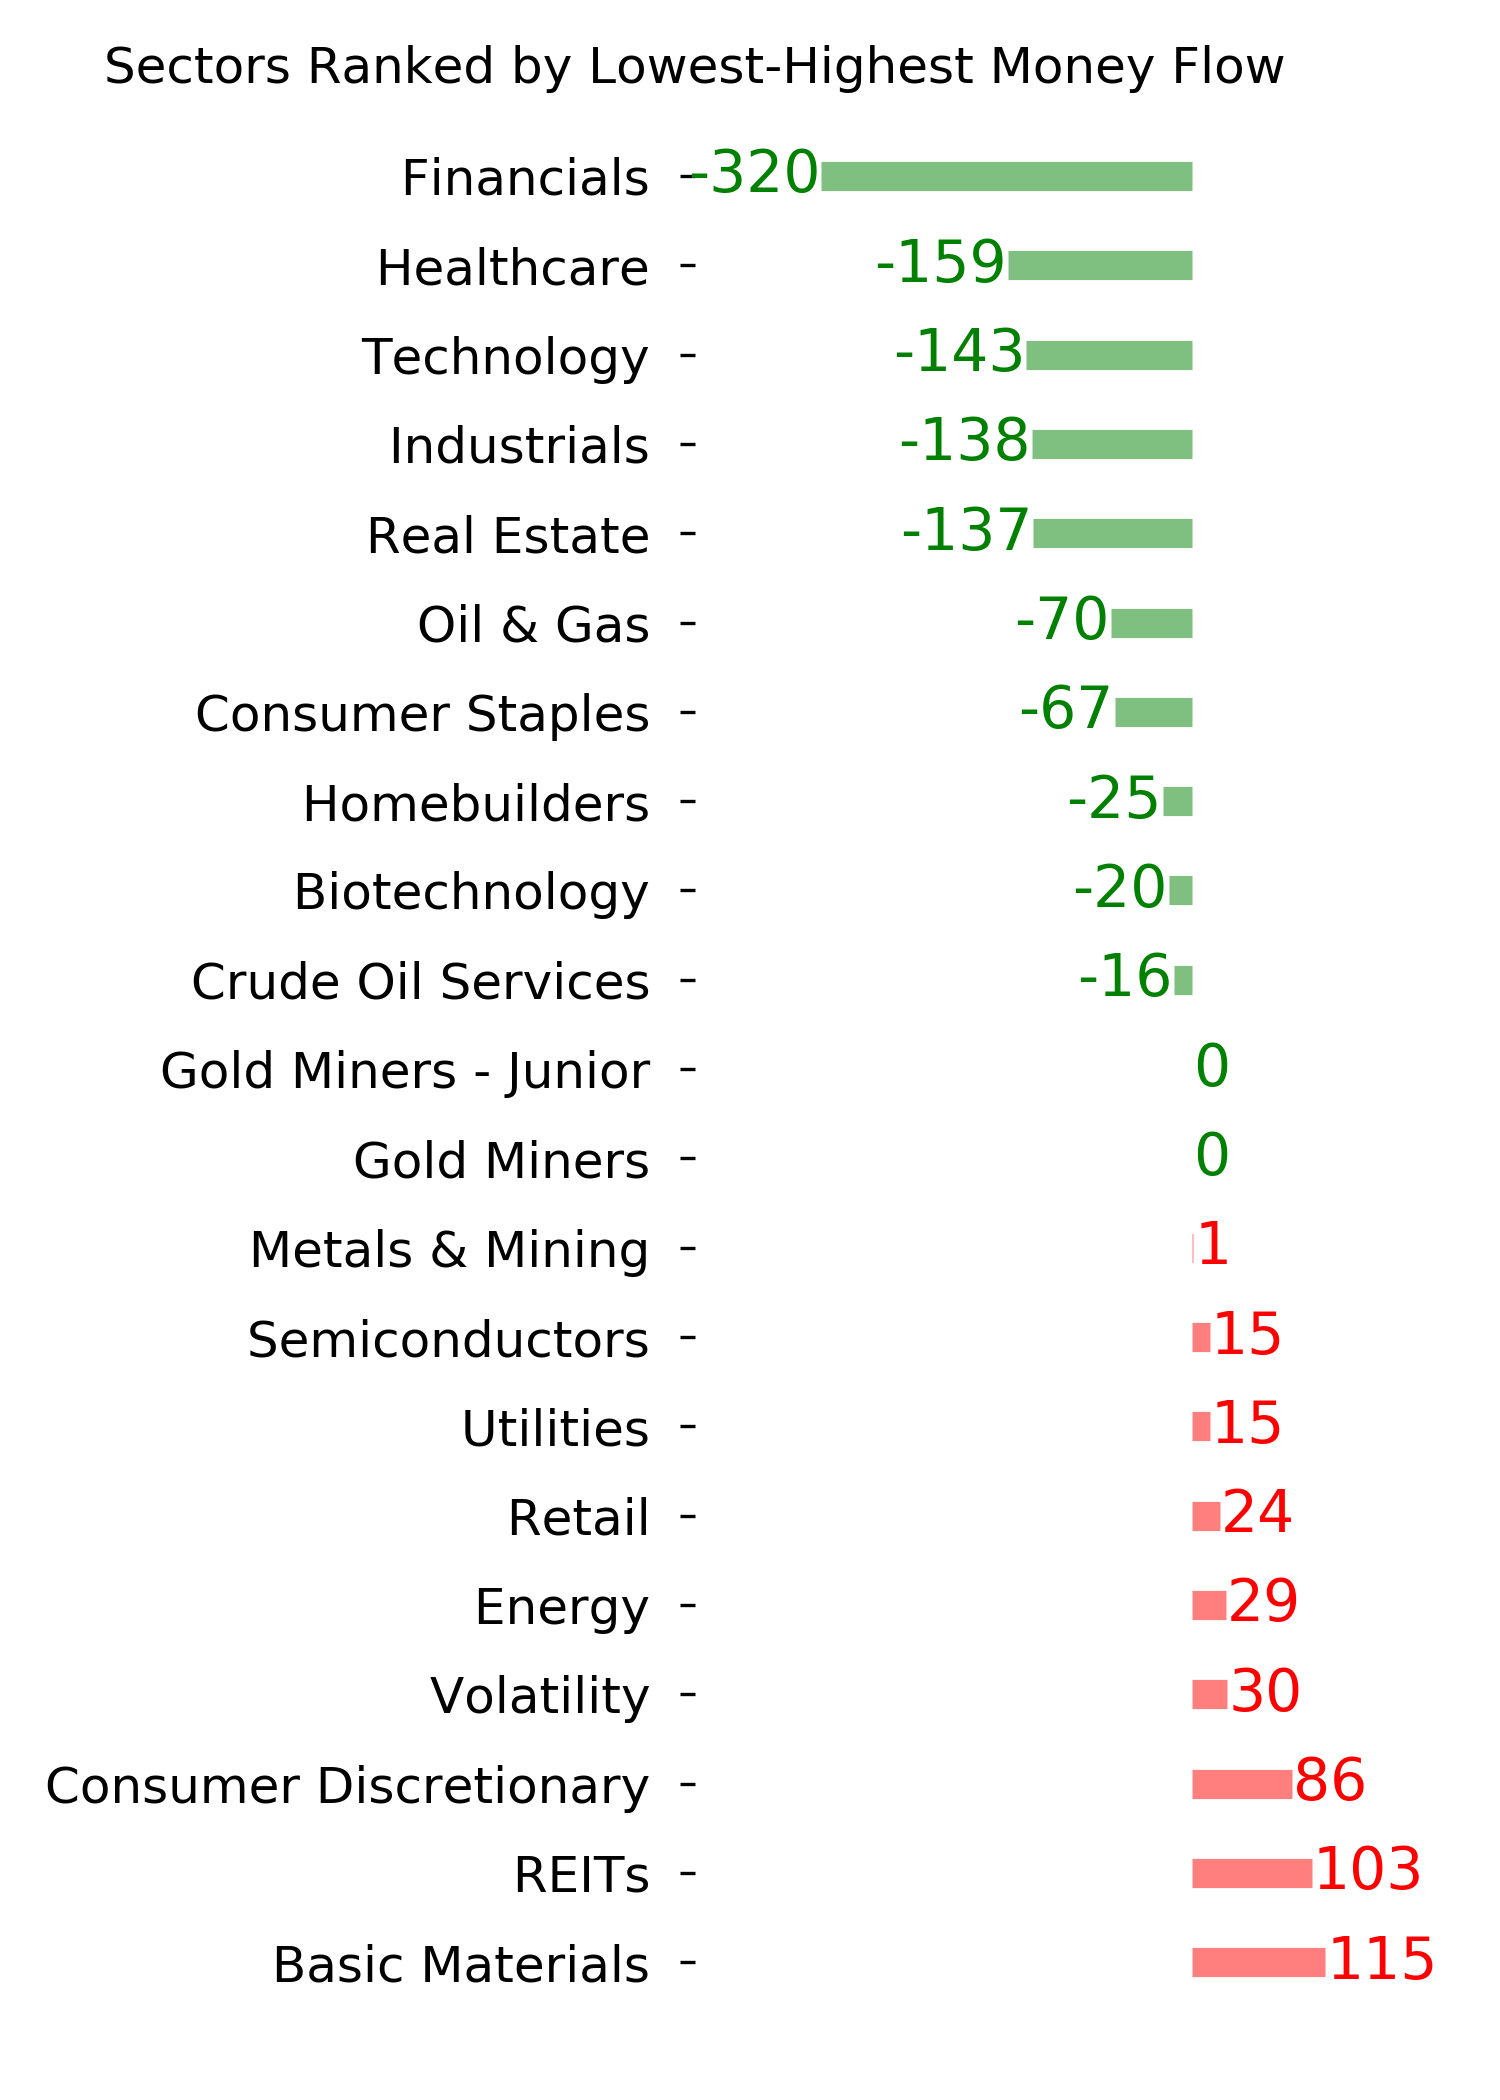
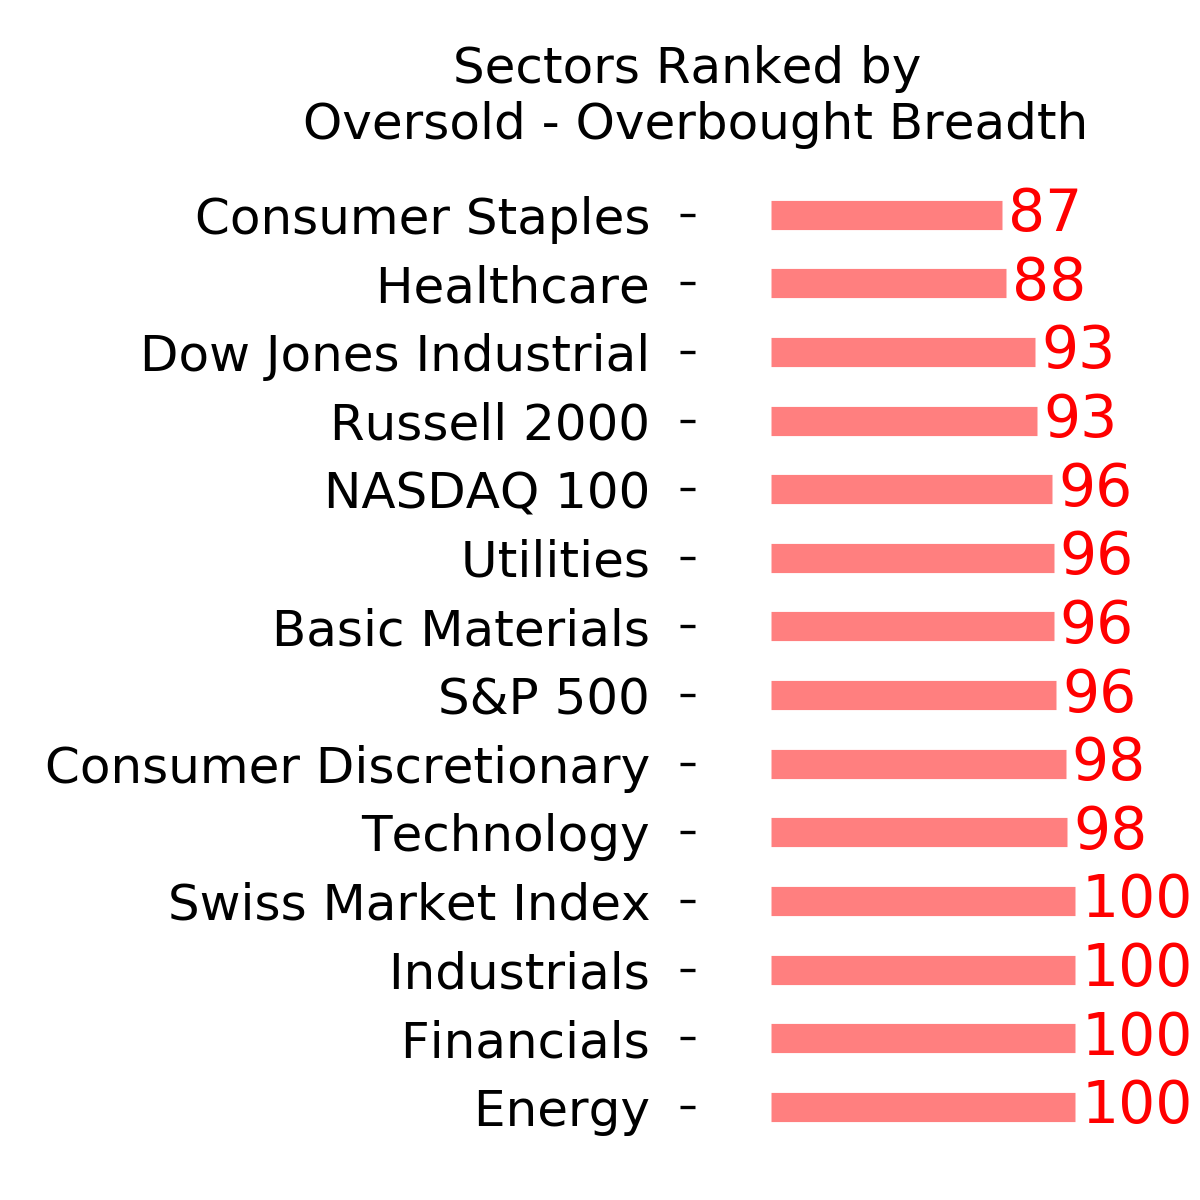
Ranks
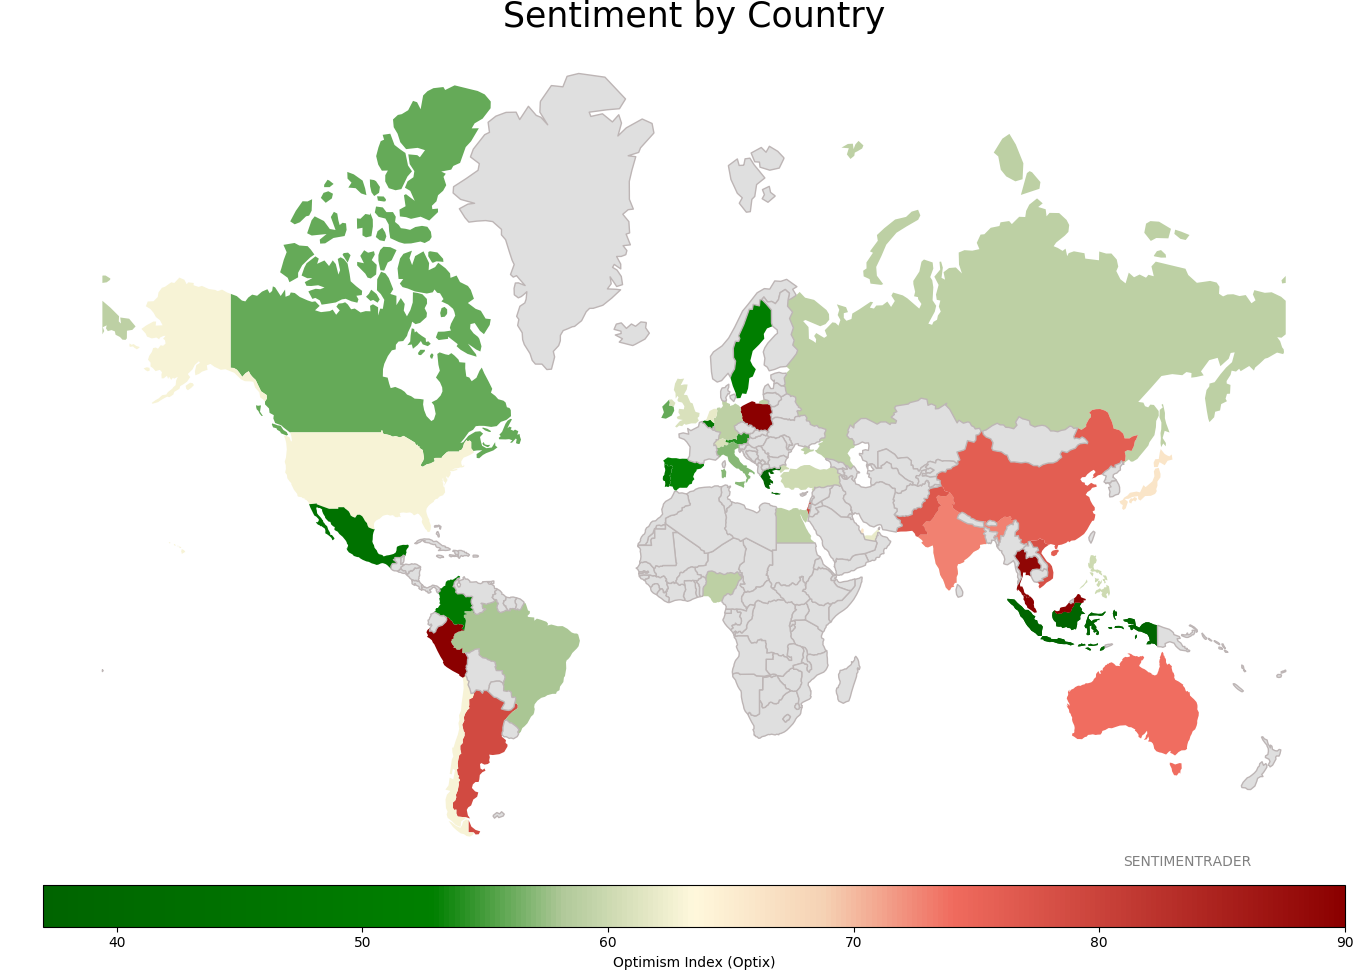
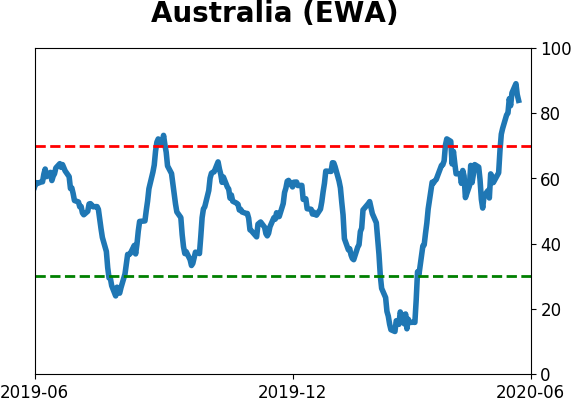
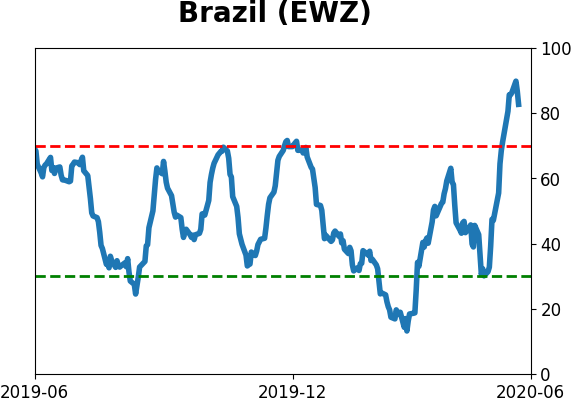
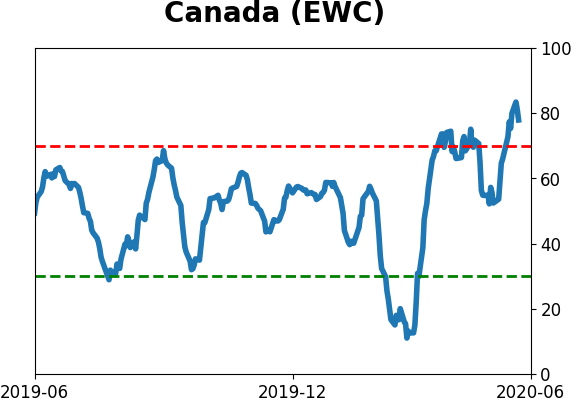
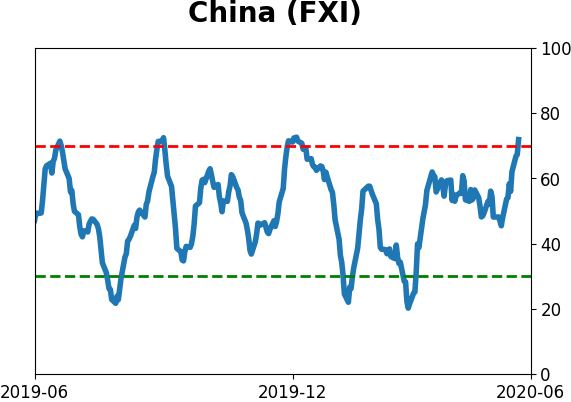
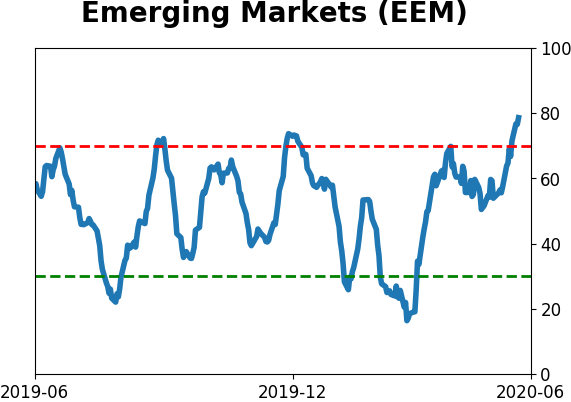
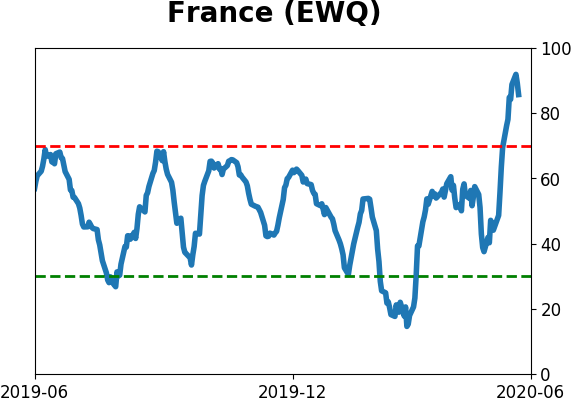
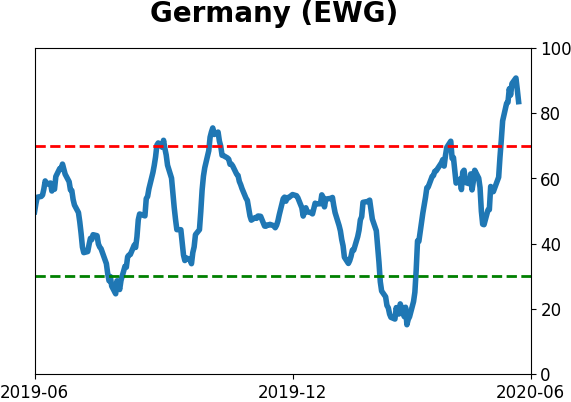
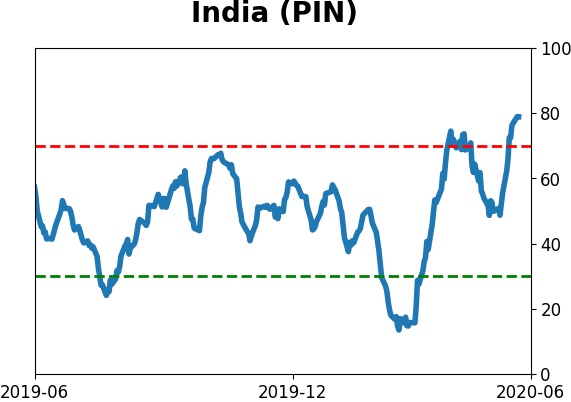
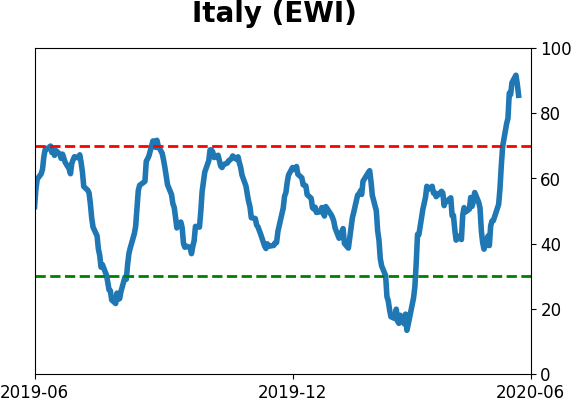
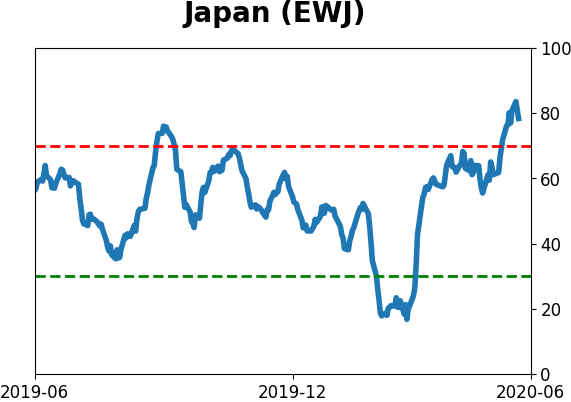
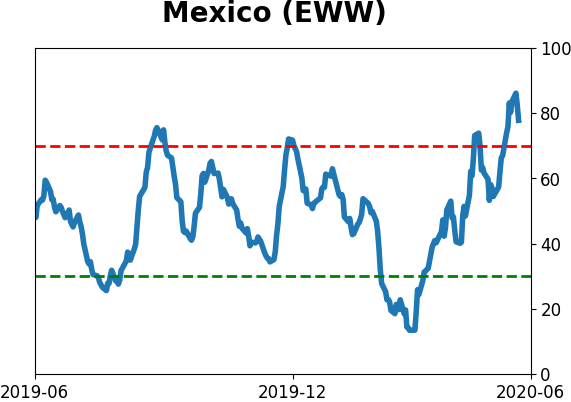
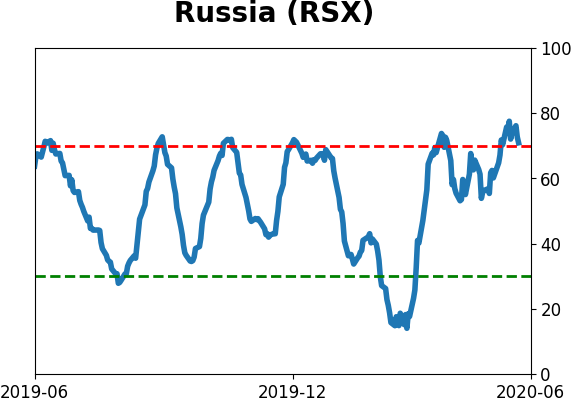
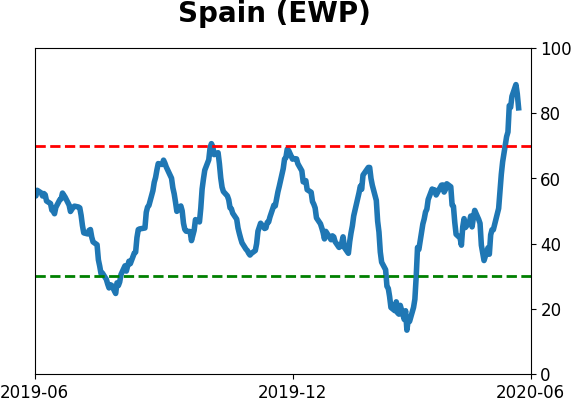
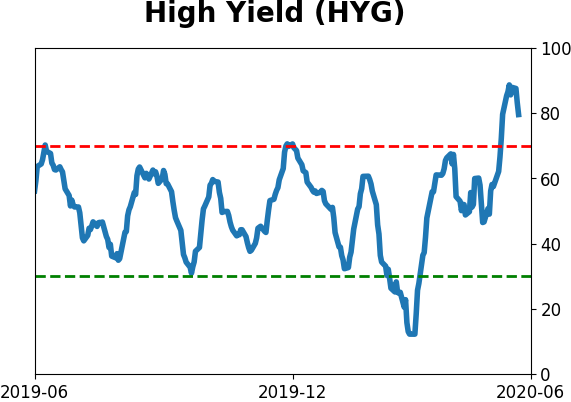
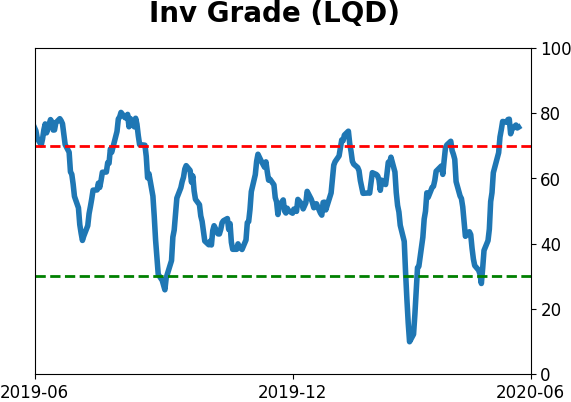
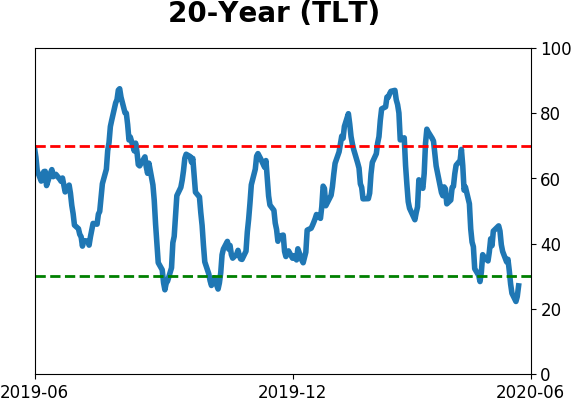
Sentiment Around The World
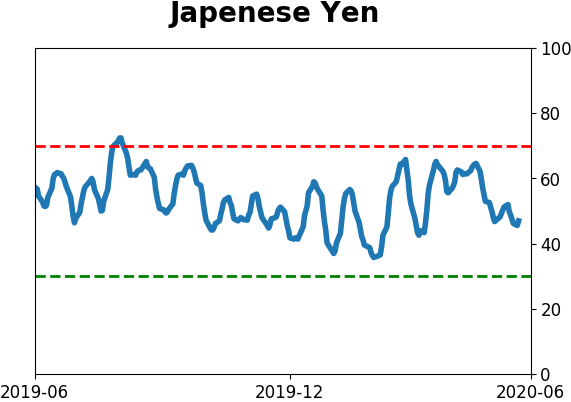
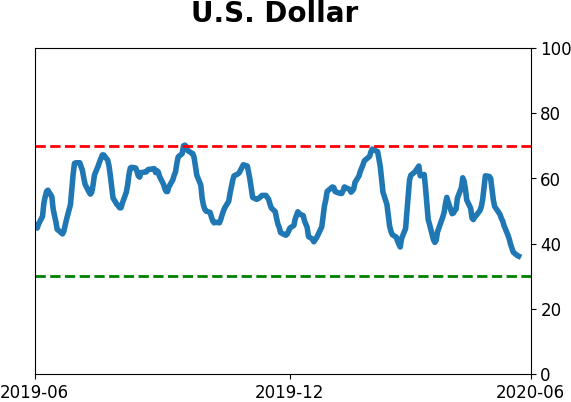
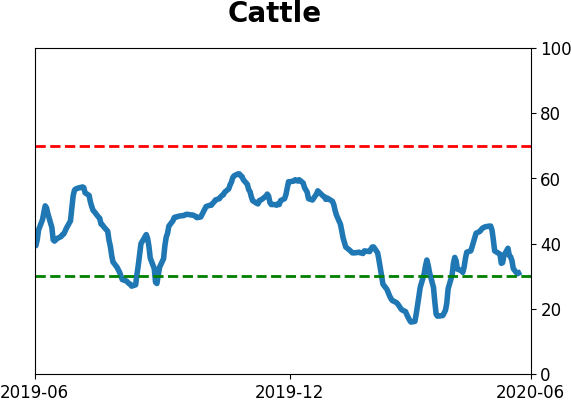
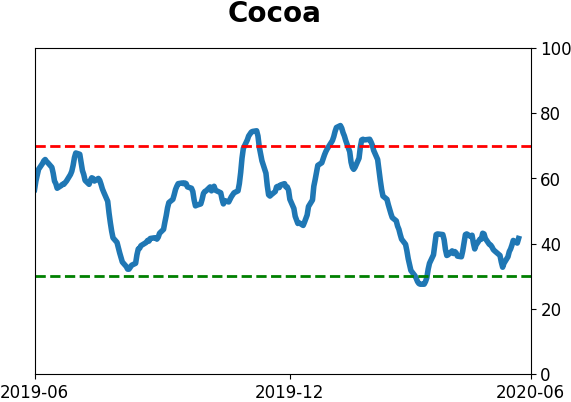
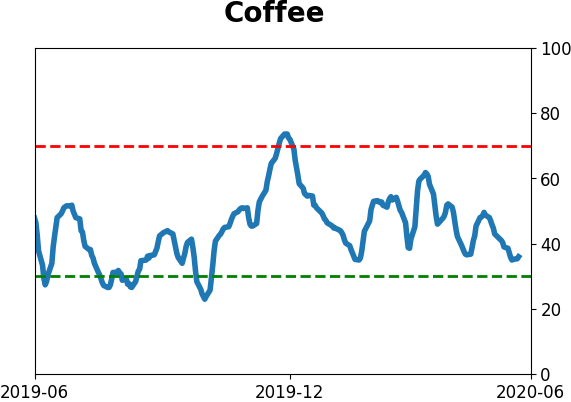
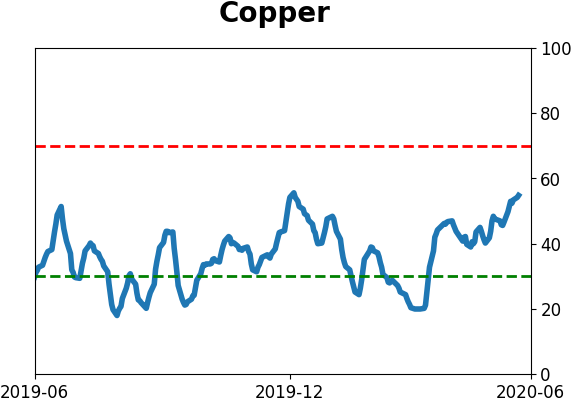
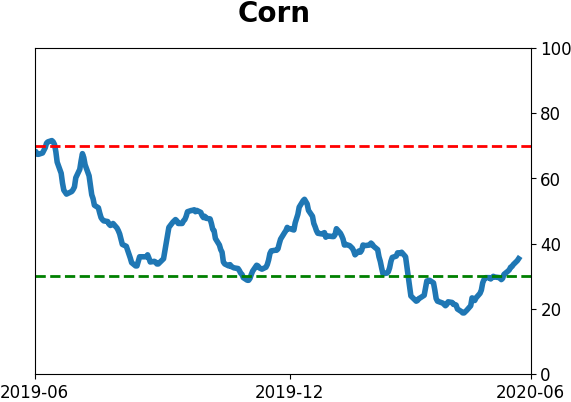
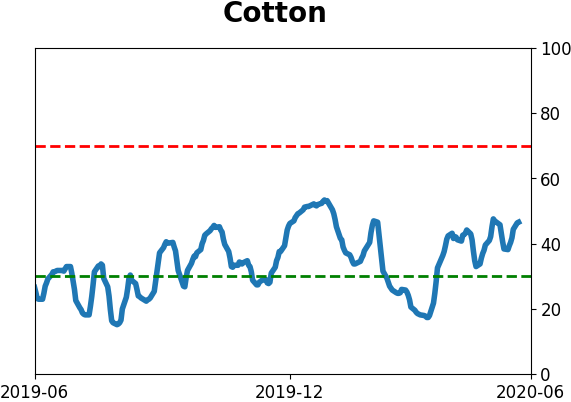
Optimism Index Thumbnails
|
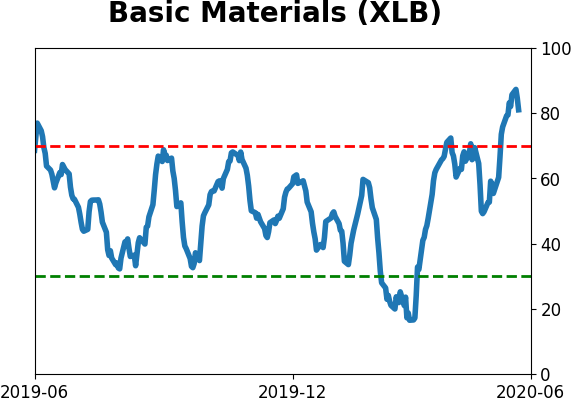
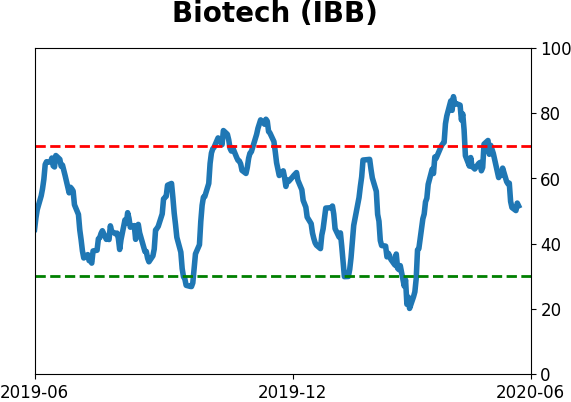
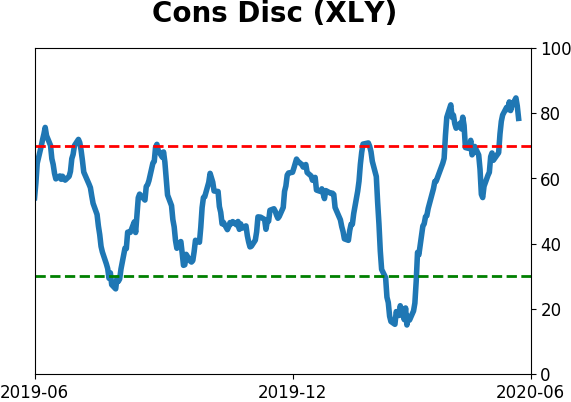
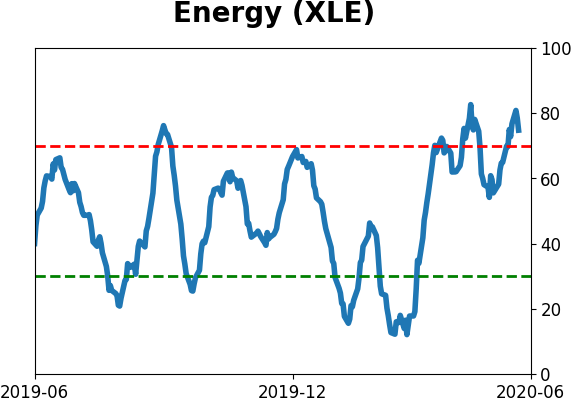
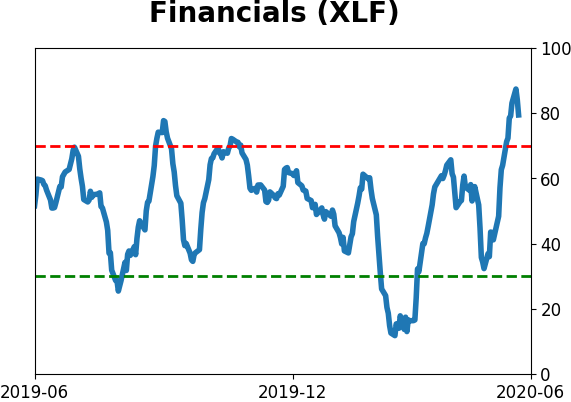
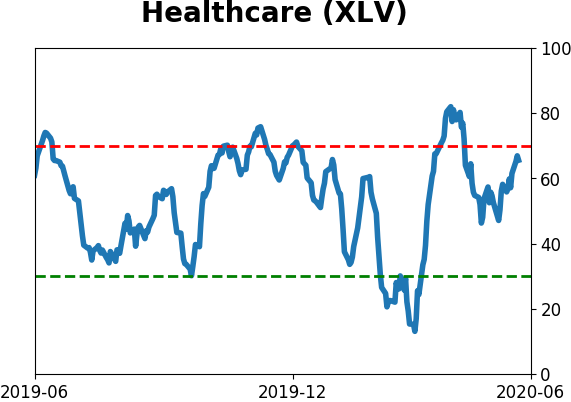
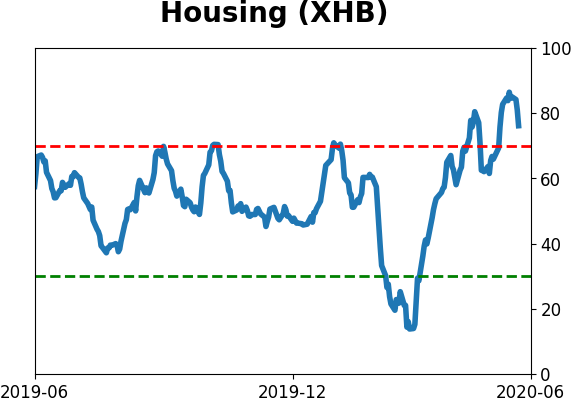
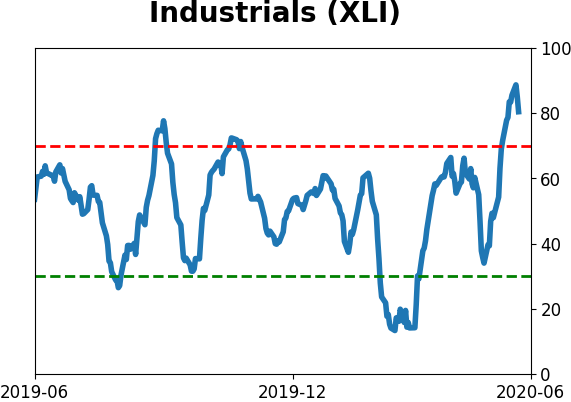
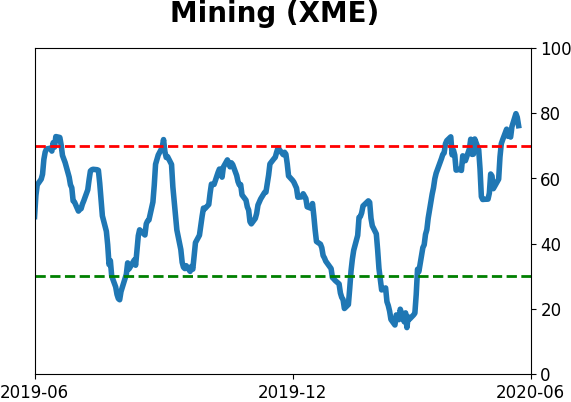
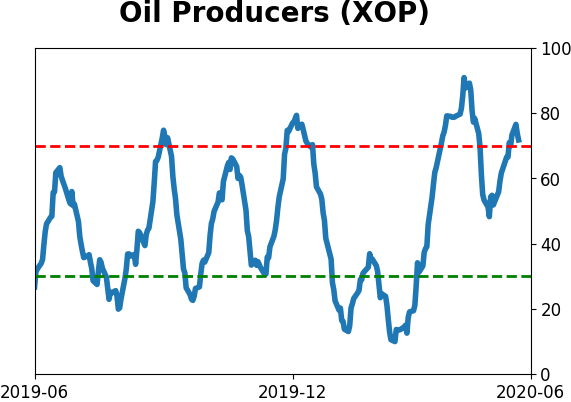
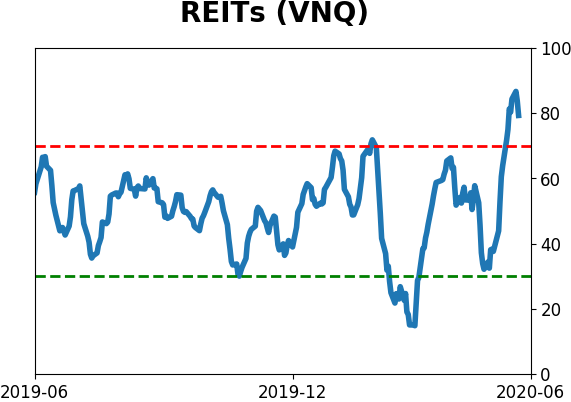
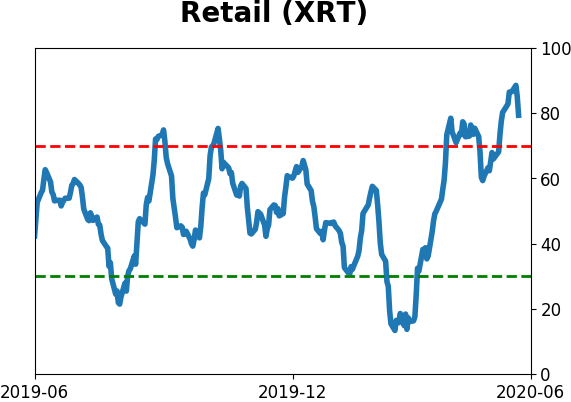
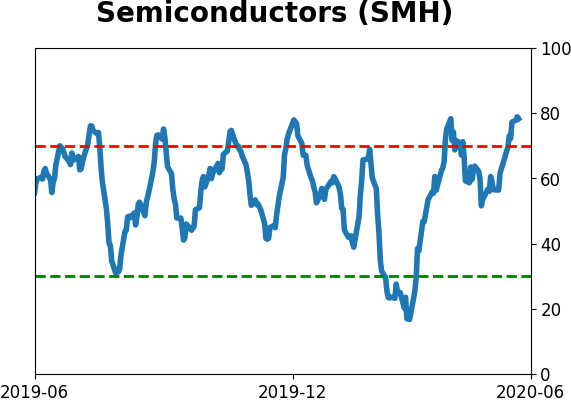
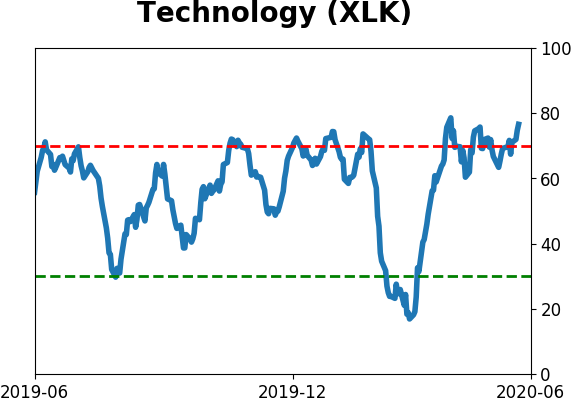
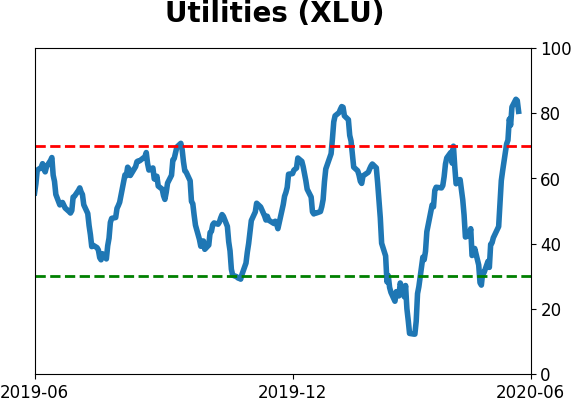
Sector ETF's - 10-Day Moving Average
|
|
|
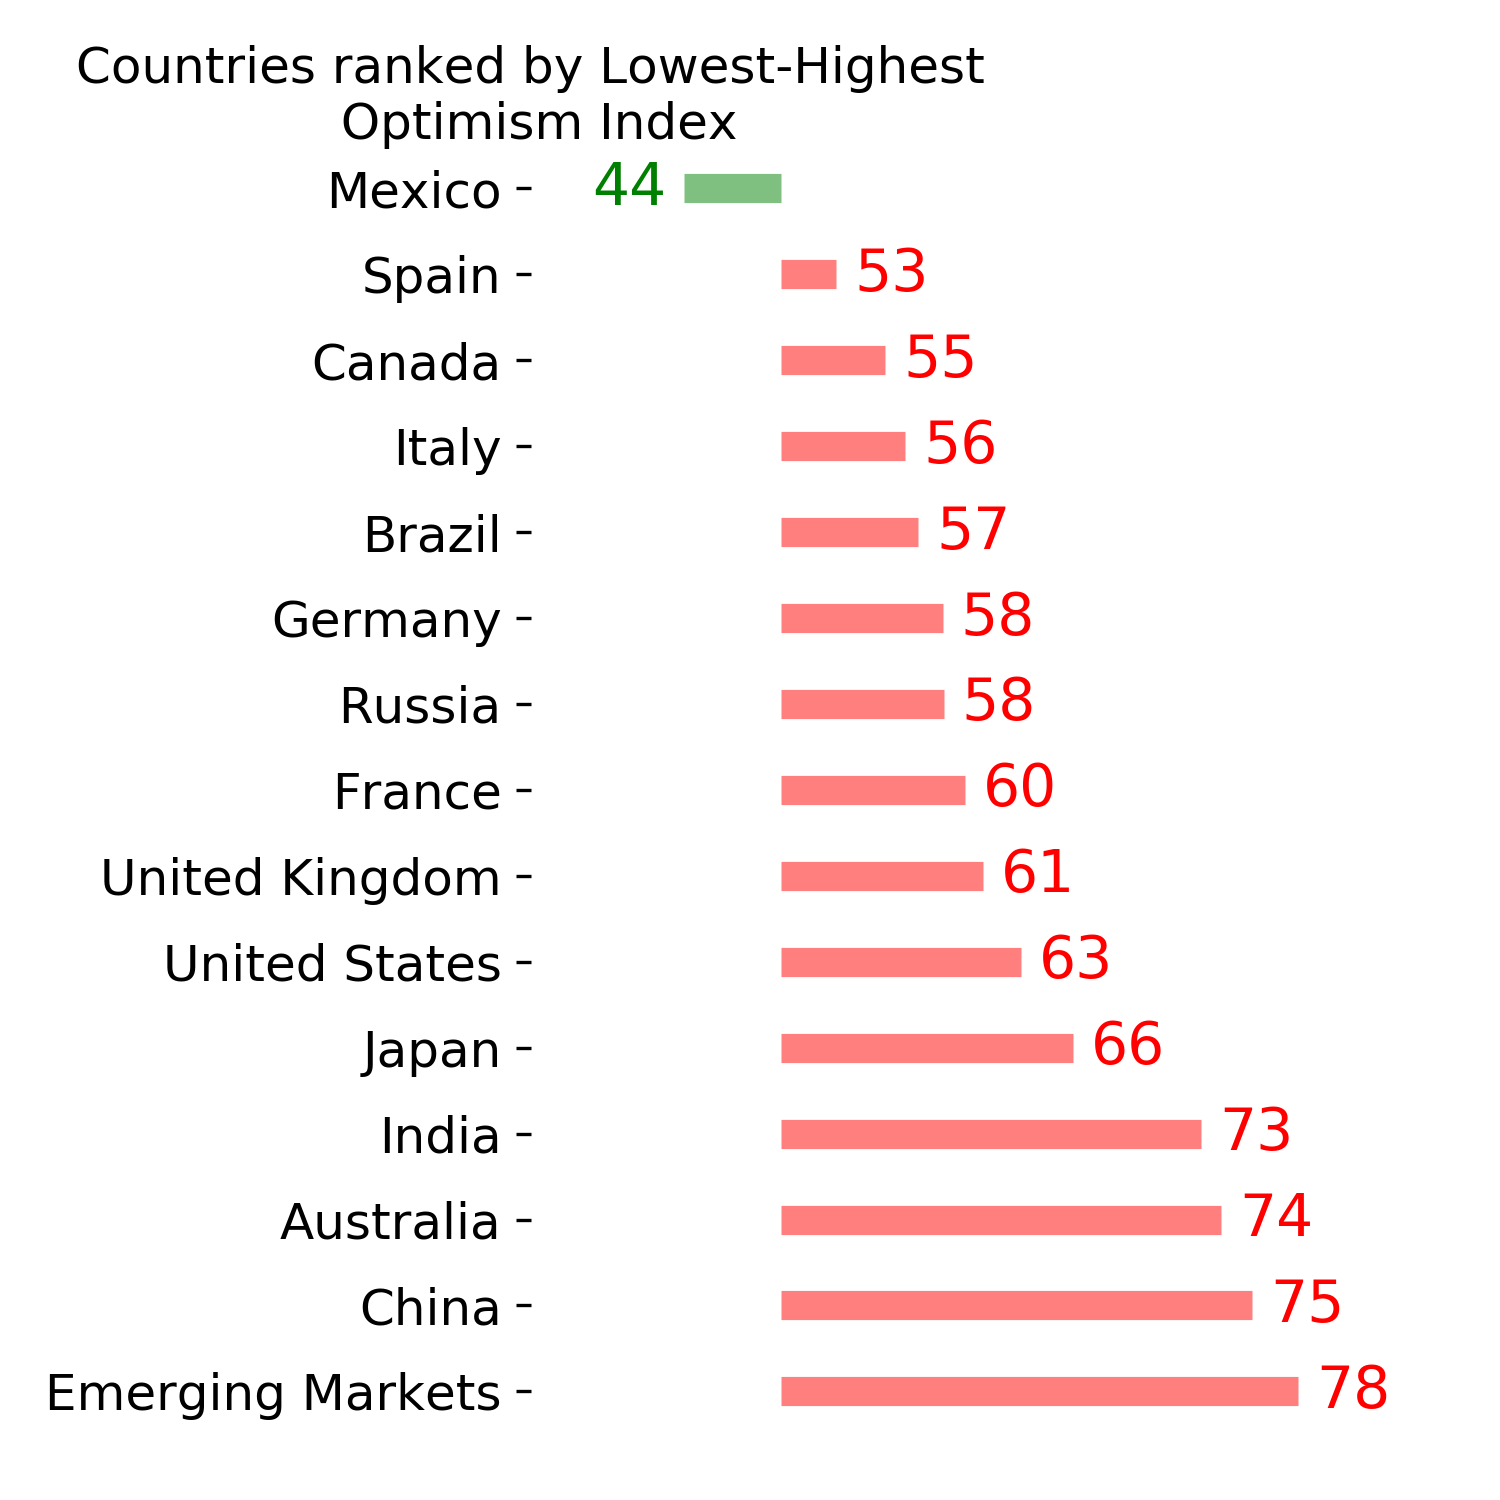
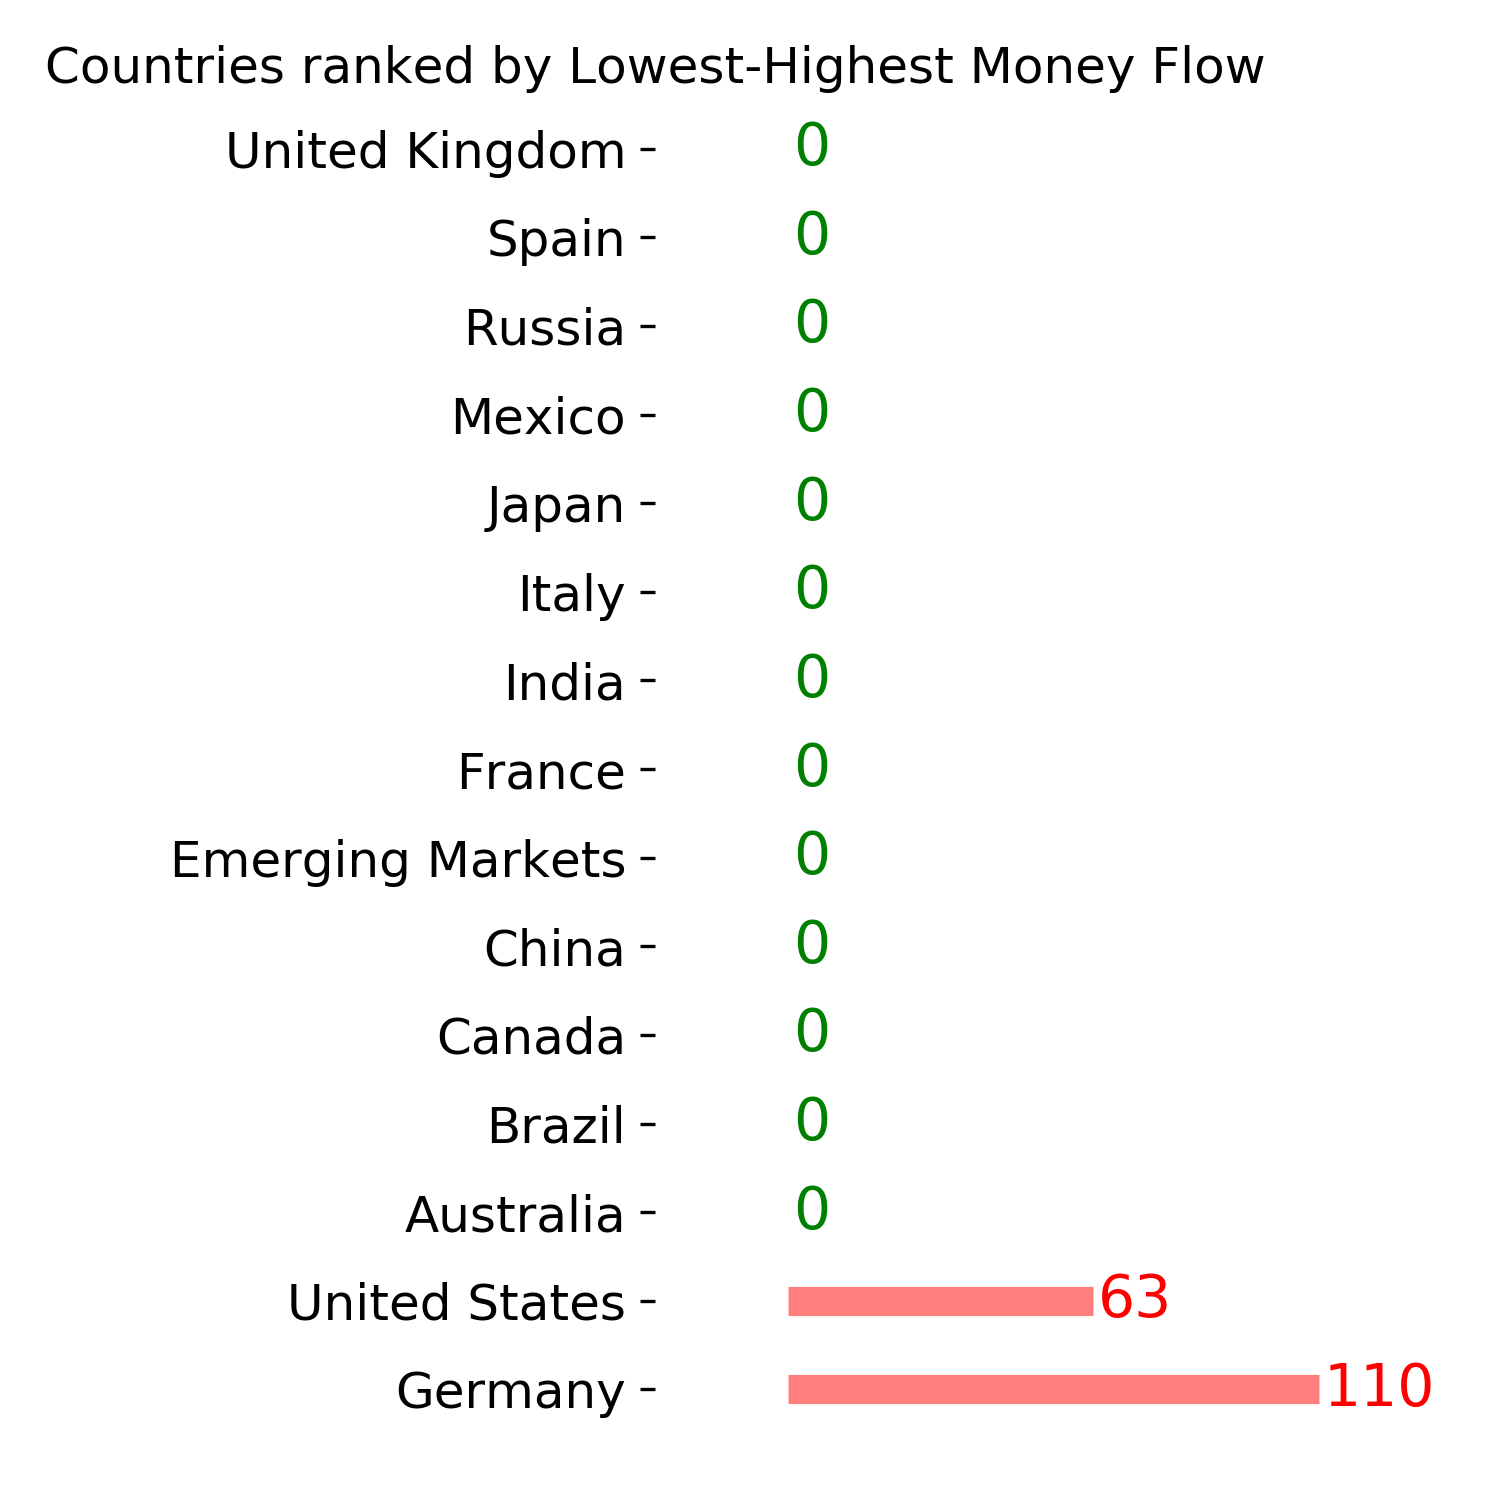
Country ETF's - 10-Day Moving Average
|
|
|
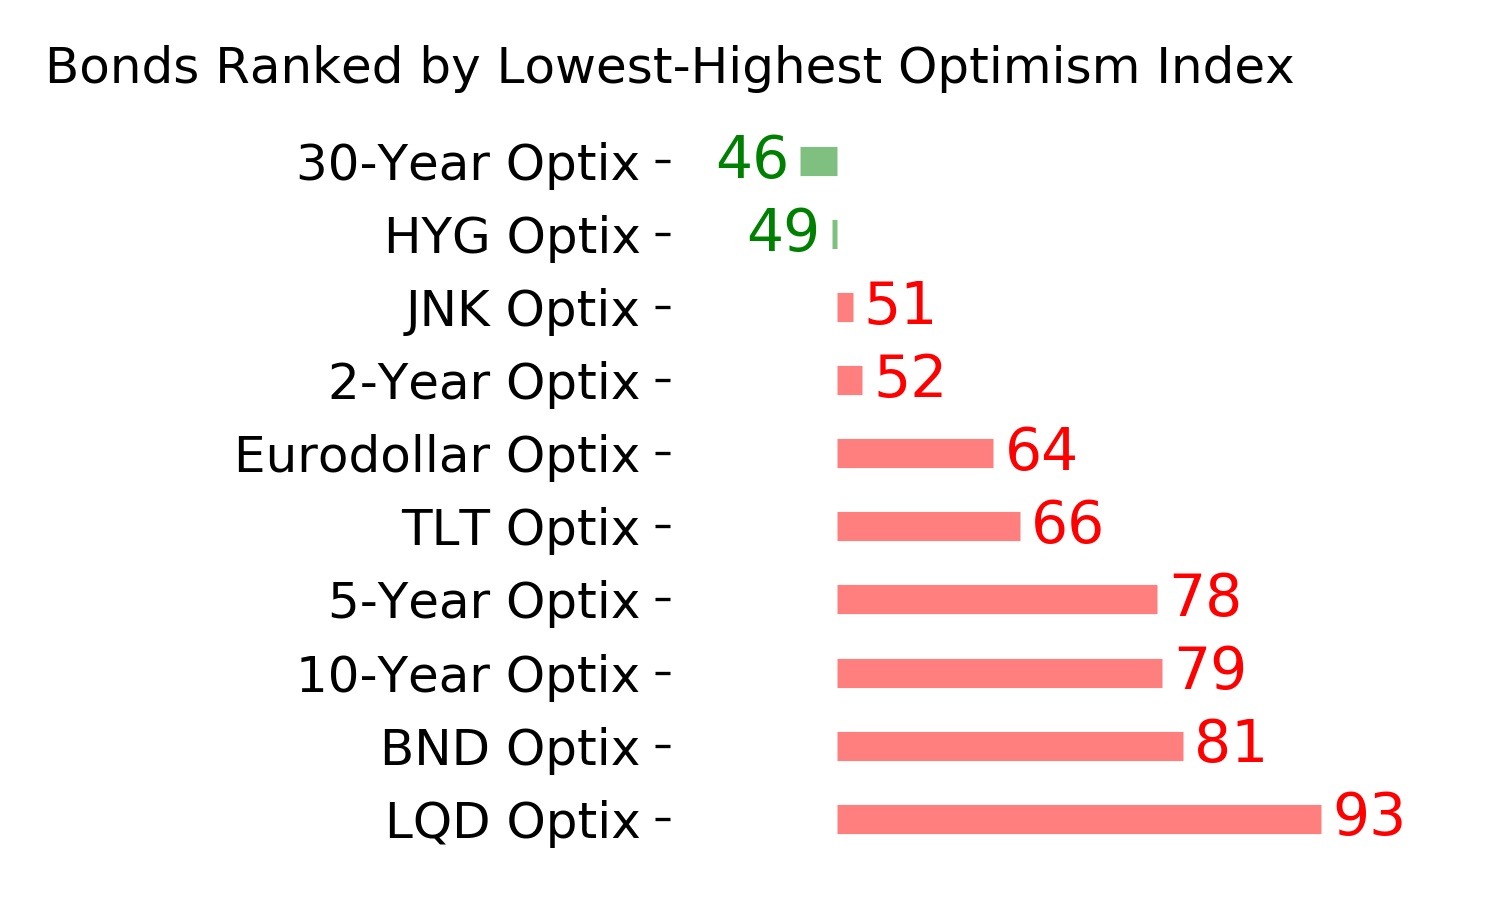
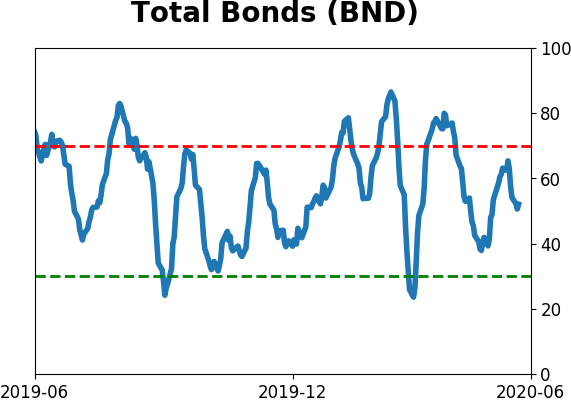
Bond ETF's - 10-Day Moving Average
|
|
|
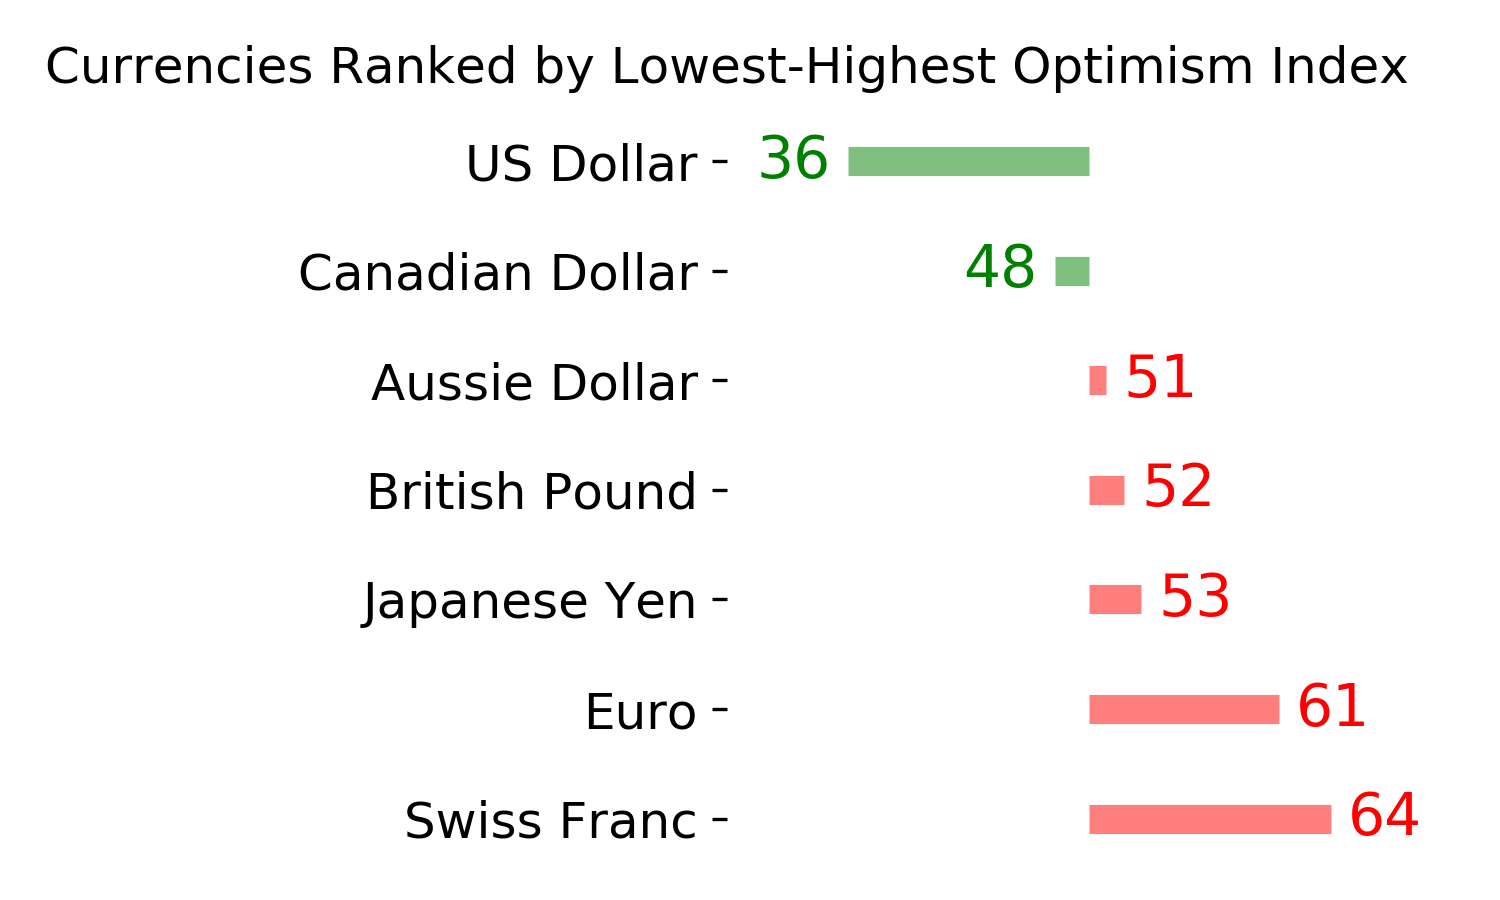
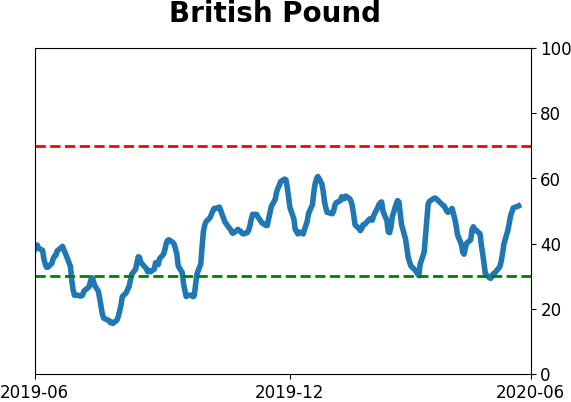
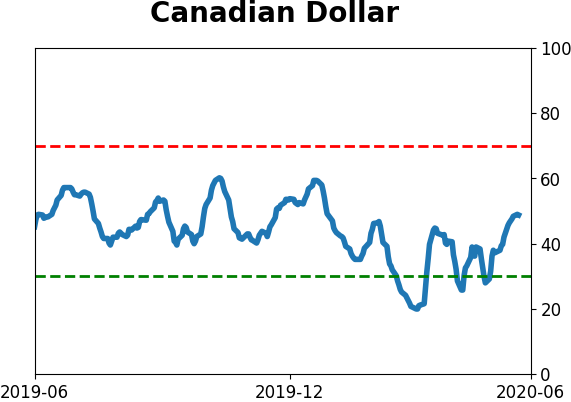
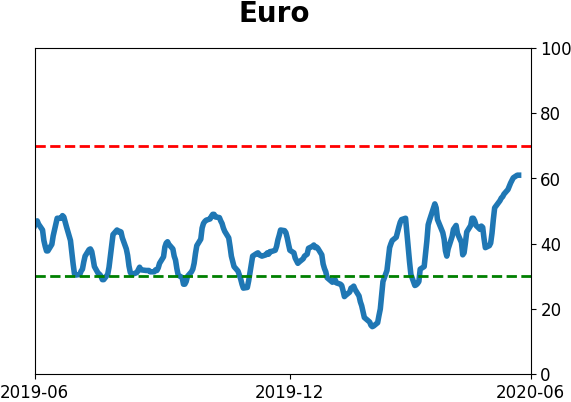
Currency ETF's - 5-Day Moving Average
|
|
|
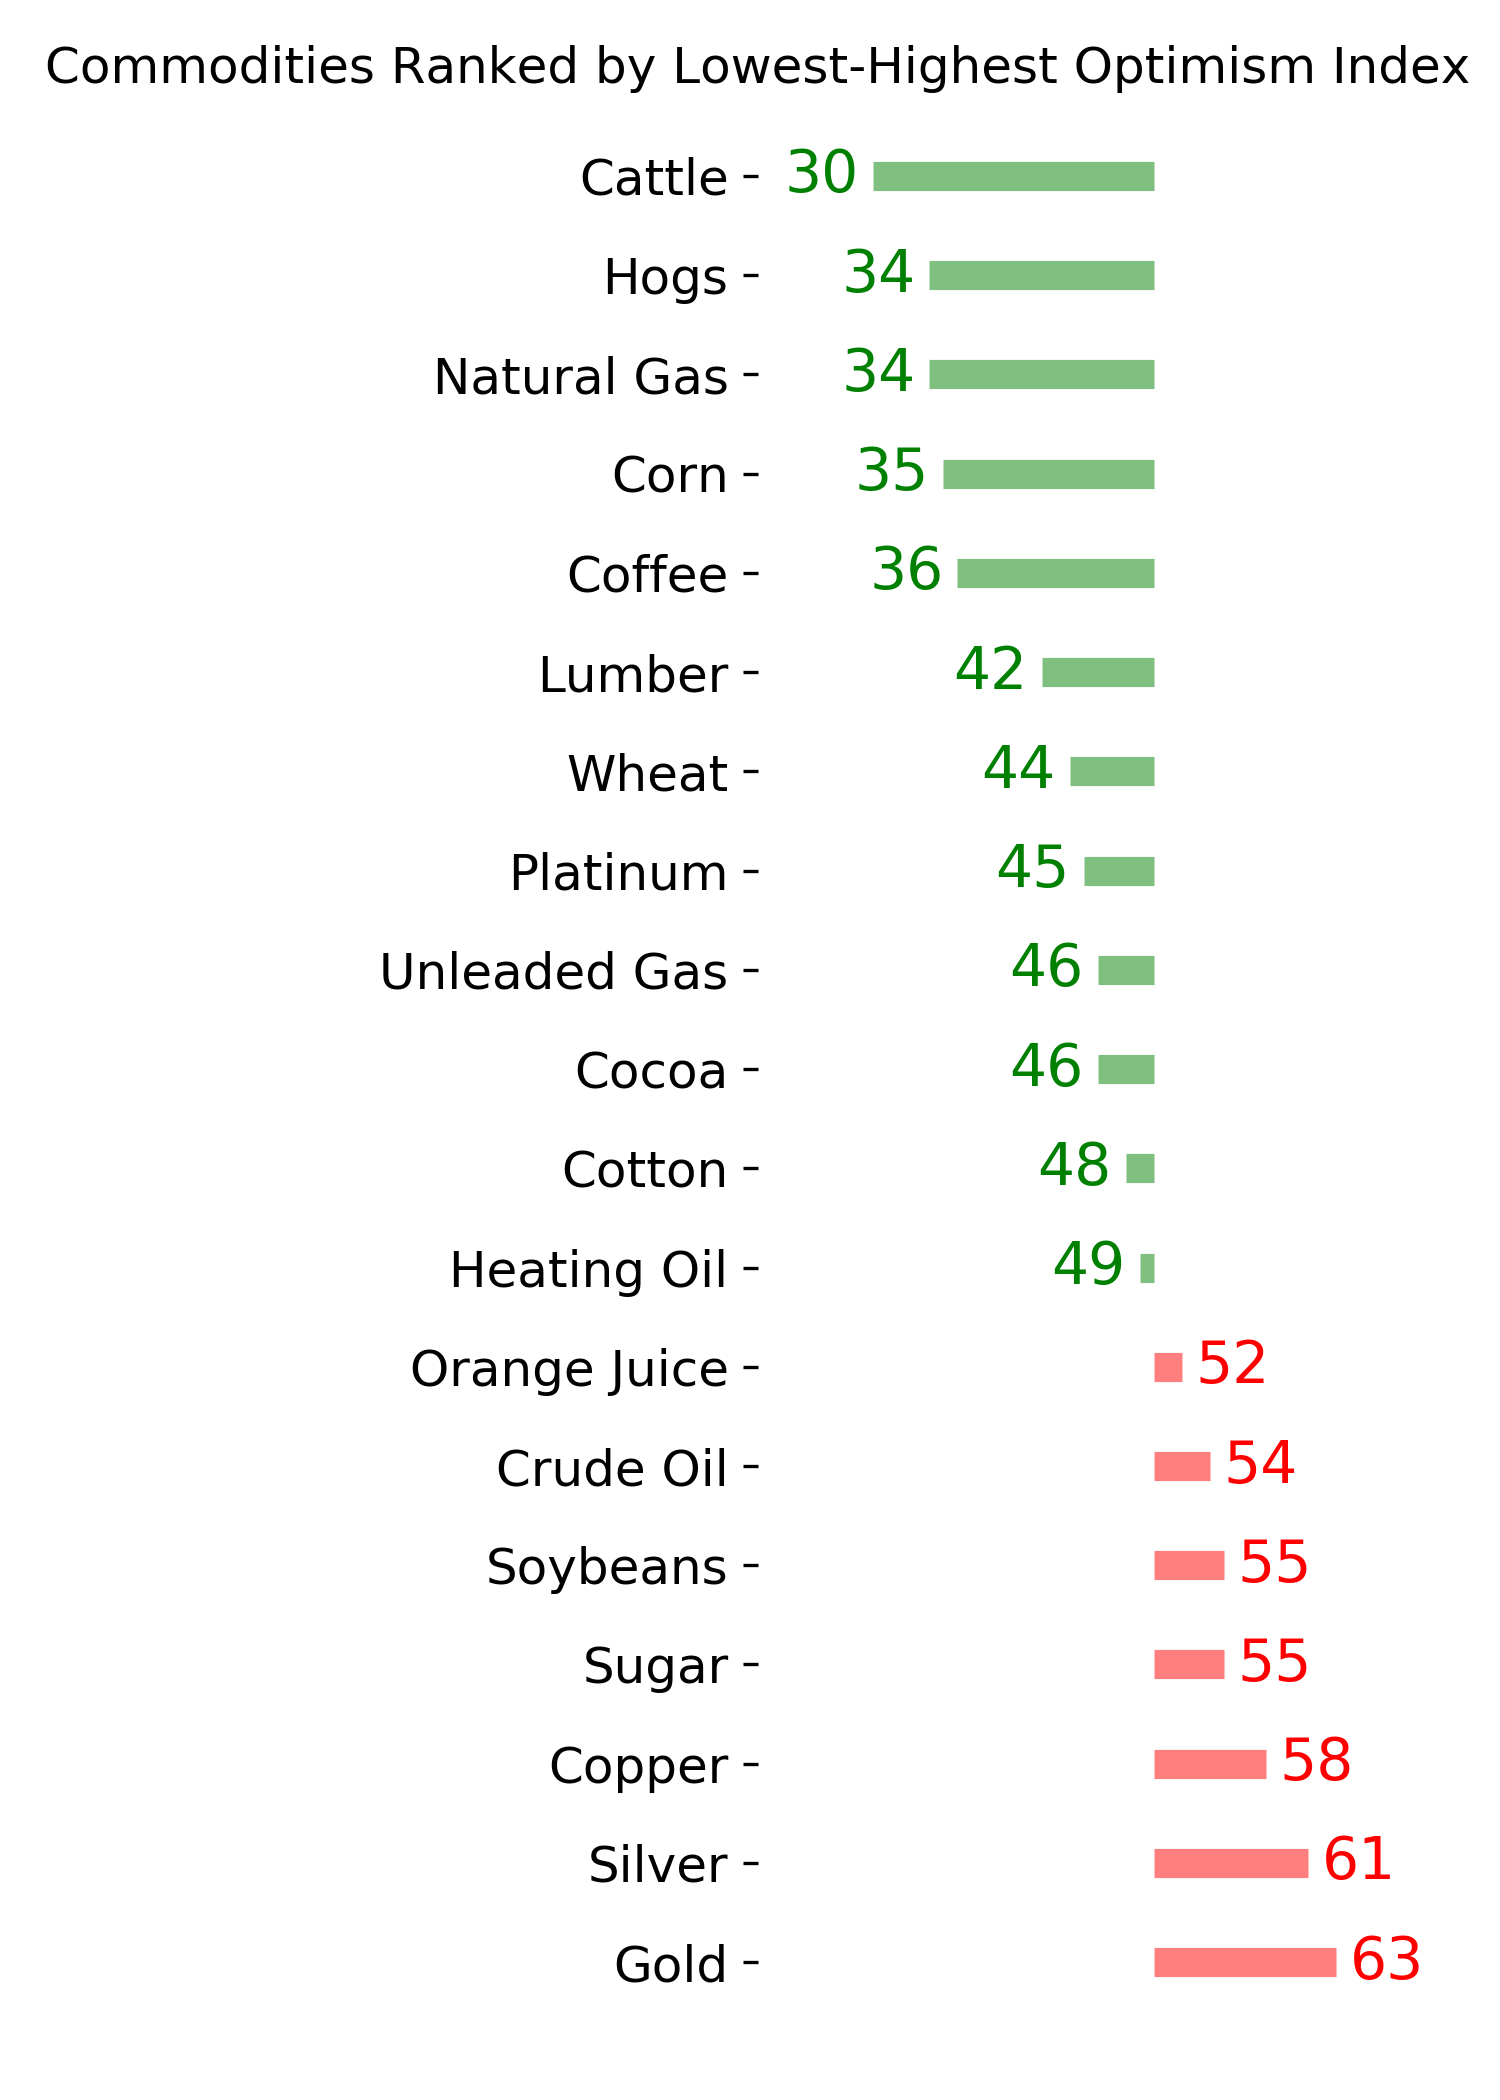
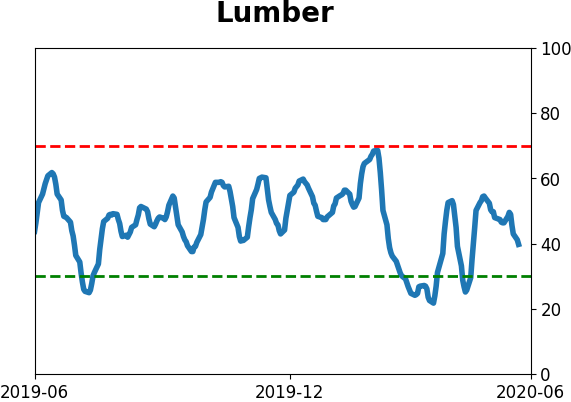
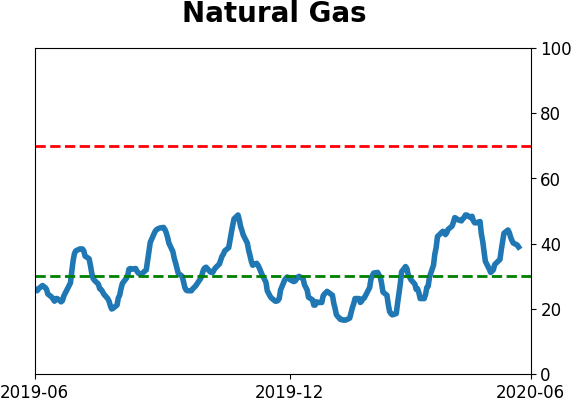
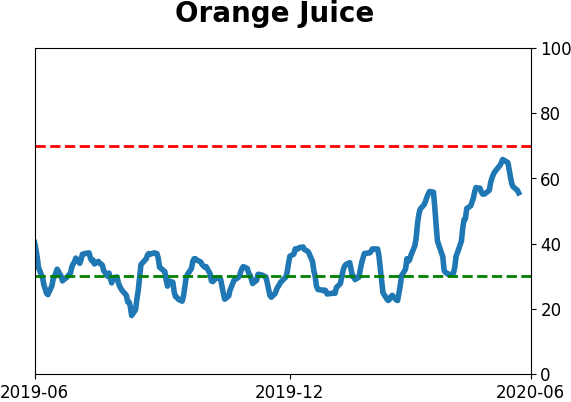
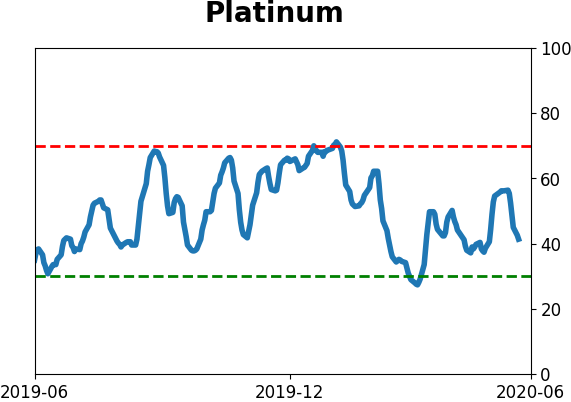
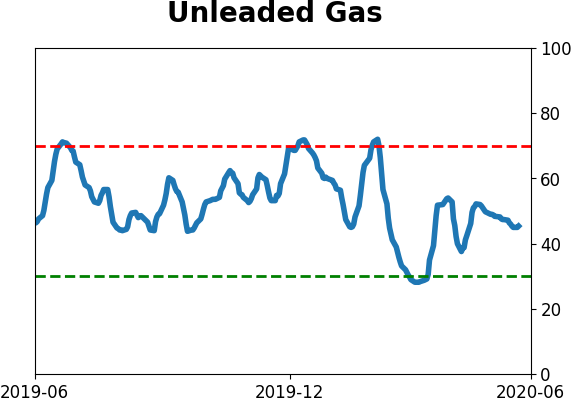
Commodity ETF's - 5-Day Moving Average
|
|