Headlines
|
|
We're officially in a recession:
The NBER has declared a peak in the business cycle. Obviously, stocks already priced much of that in, and then an eventual recovery. This isn't all that unusual since this particular organization tends to be conservative. By the time it feels comfortable declaring a recession, most losses have already been realized.
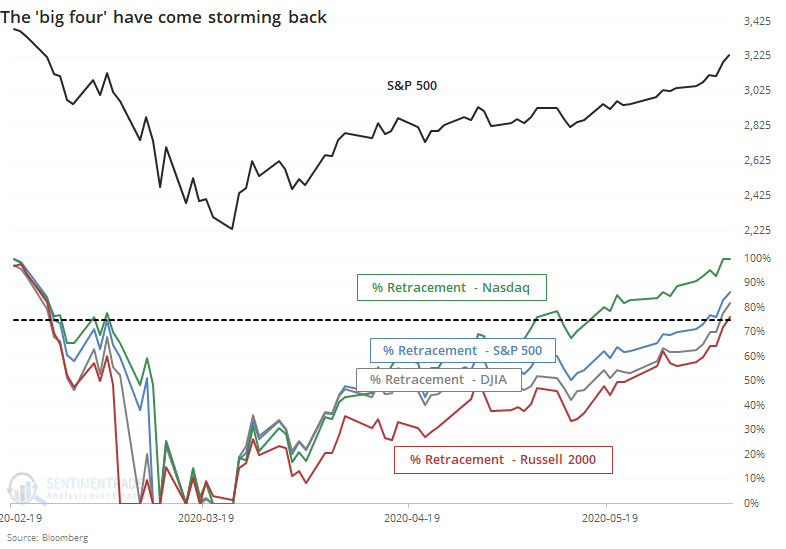
The 'big four' have stormed back:
All four of the 'big four' stock indexes (S&P 500, DJIA, Nasdaq Composite, and Russell 2000) have made back more than 75% of their losses. By the time all four have recovered to this degree, it has indicated sustained recoveries.
Another back-to-back thrust: One of the most compelling reasons to believe that something had changed came on March 25 when stocks witnessed back-to-back days with overwhelming buying interest. There have been several thrusts since then, including just in the past week. As Troy shows in a premium note, consecutive 90% up volume days triggered once again on Friday and Monday. The 5-day average of Up Volume is now 84%, the highest since at least 1962. The Backtest Engine shows that the 5-day average crossed 80% only a few times (1982-08-23, 1982-10-11, 1987-01-08, 1991-12-30, and 2011-07-01) with only the latter one preceding any kind of meaningful decline.
|
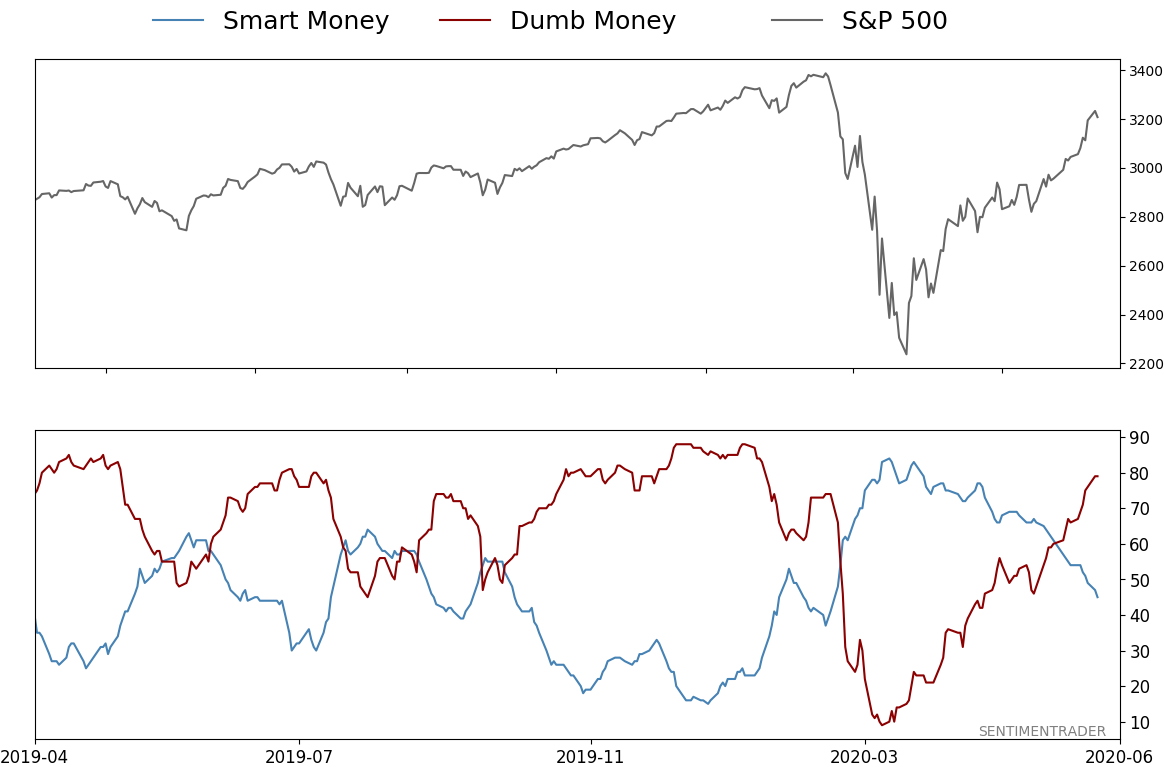
Smart / Dumb Money Confidence
|
Smart Money Confidence: 45%
Dumb Money Confidence: 79%
|
|
Risk Levels
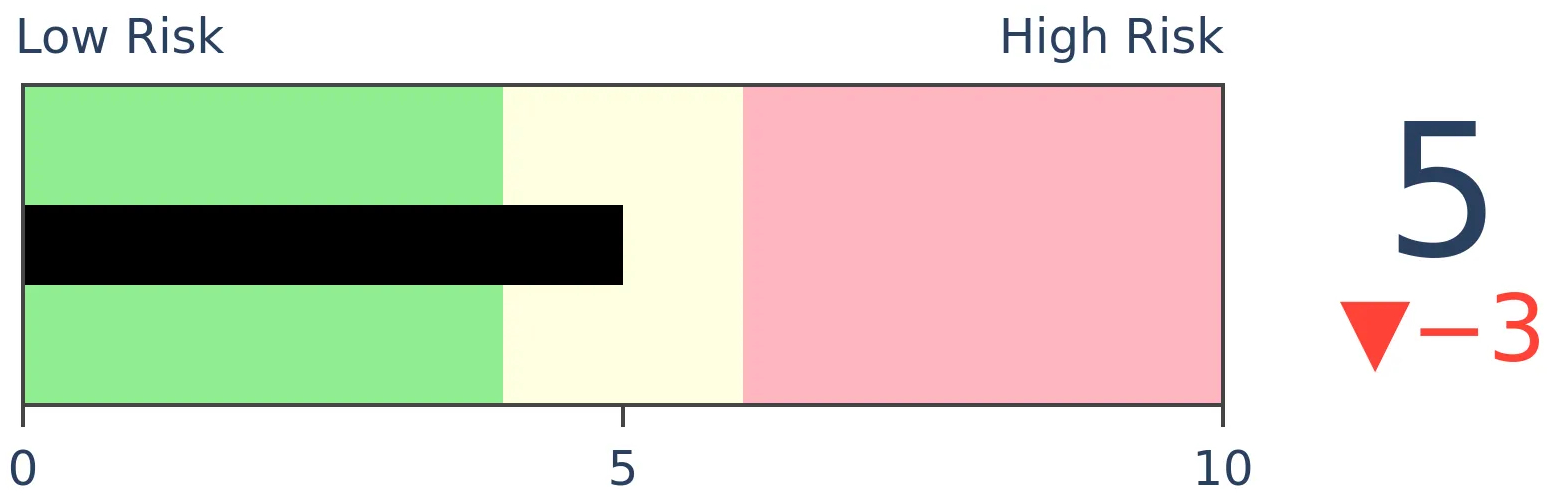
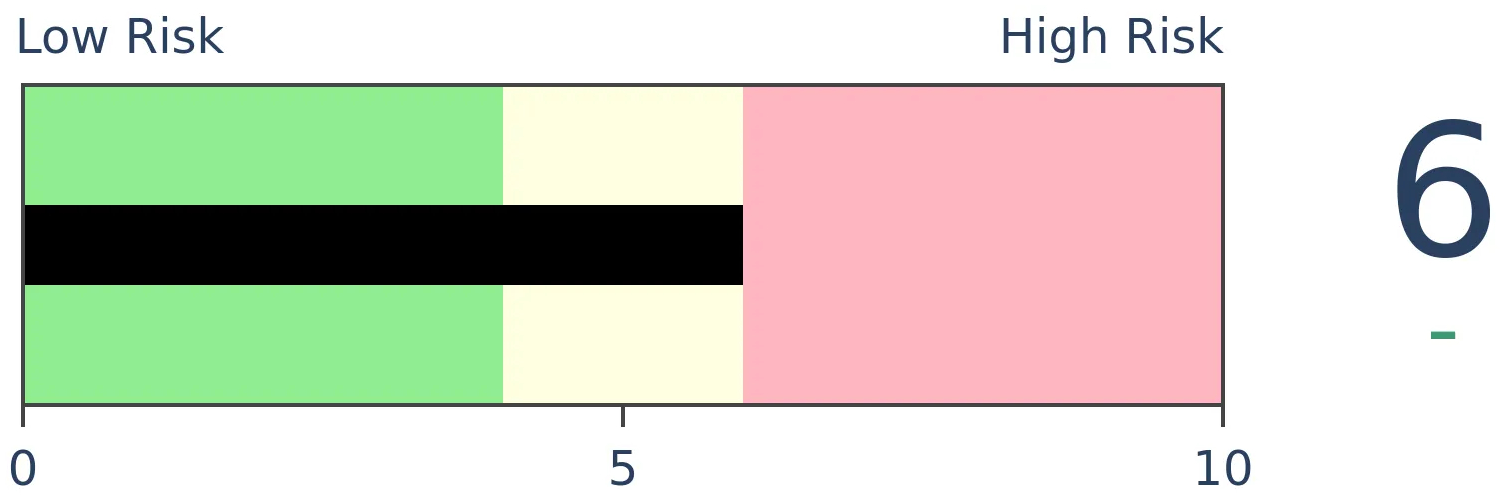
Stocks Short-Term
|
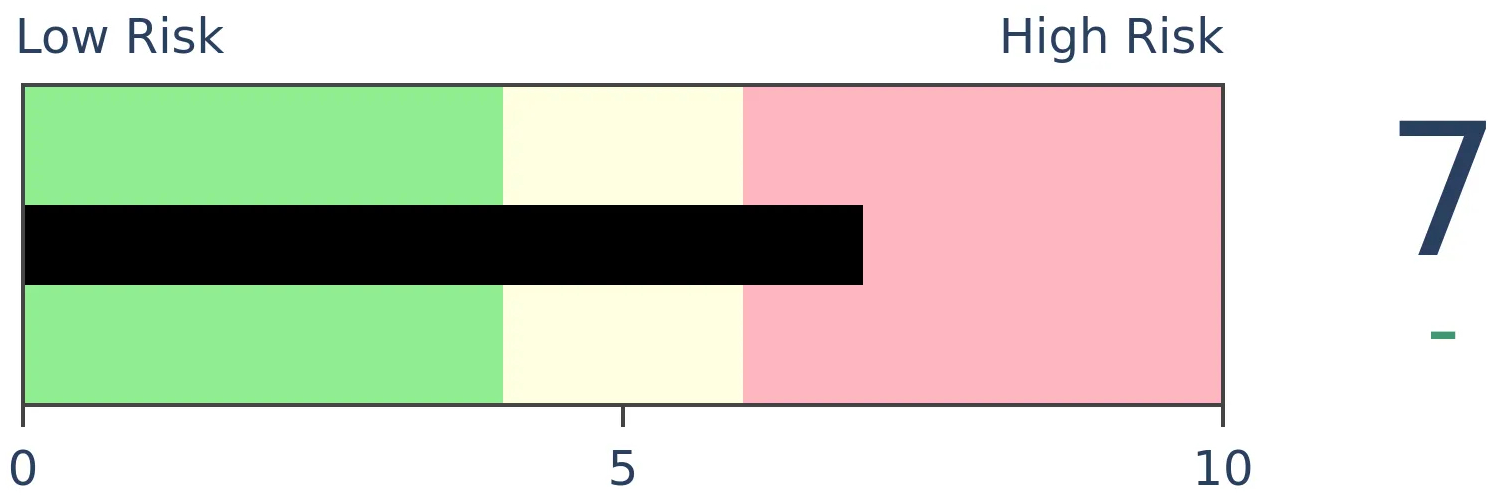
Stocks Medium-Term
|
|
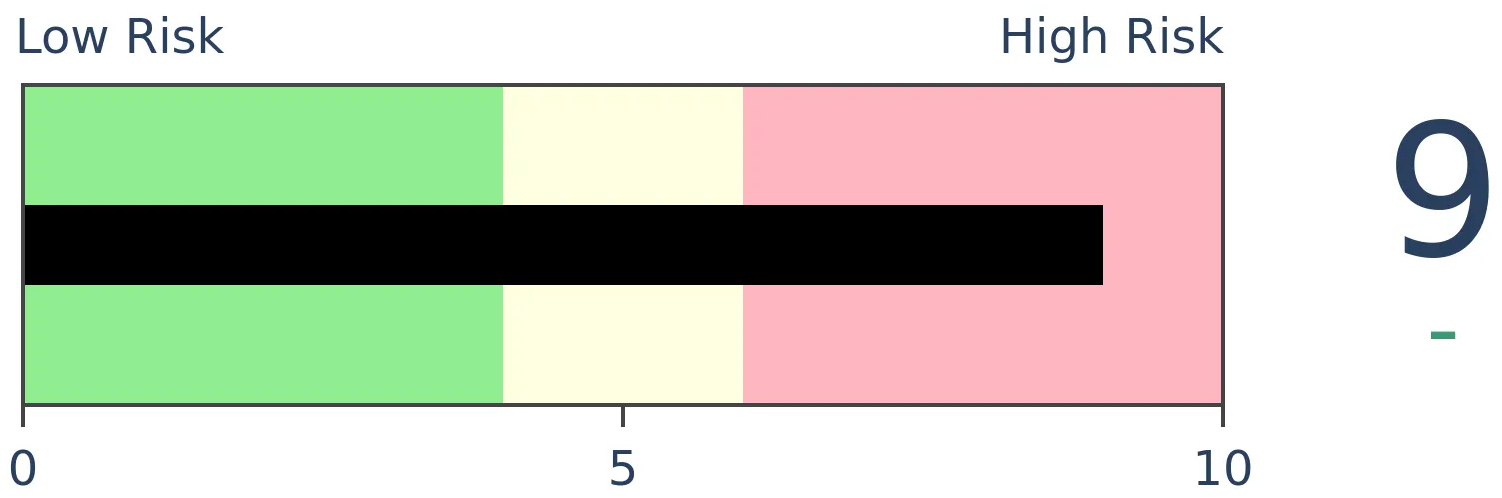
Bonds

|
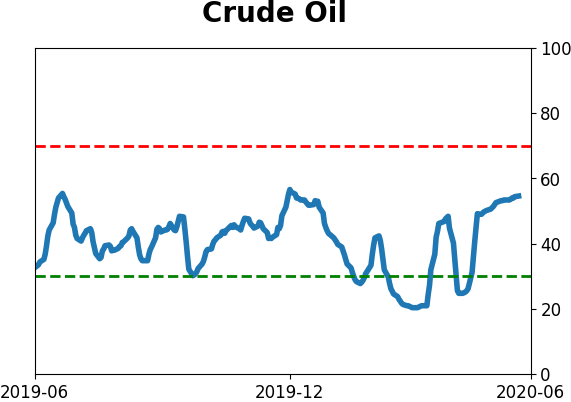
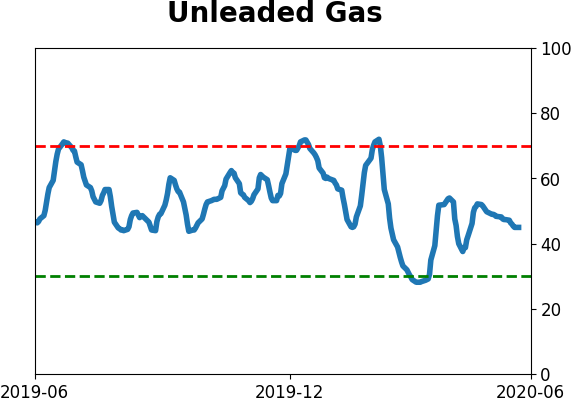
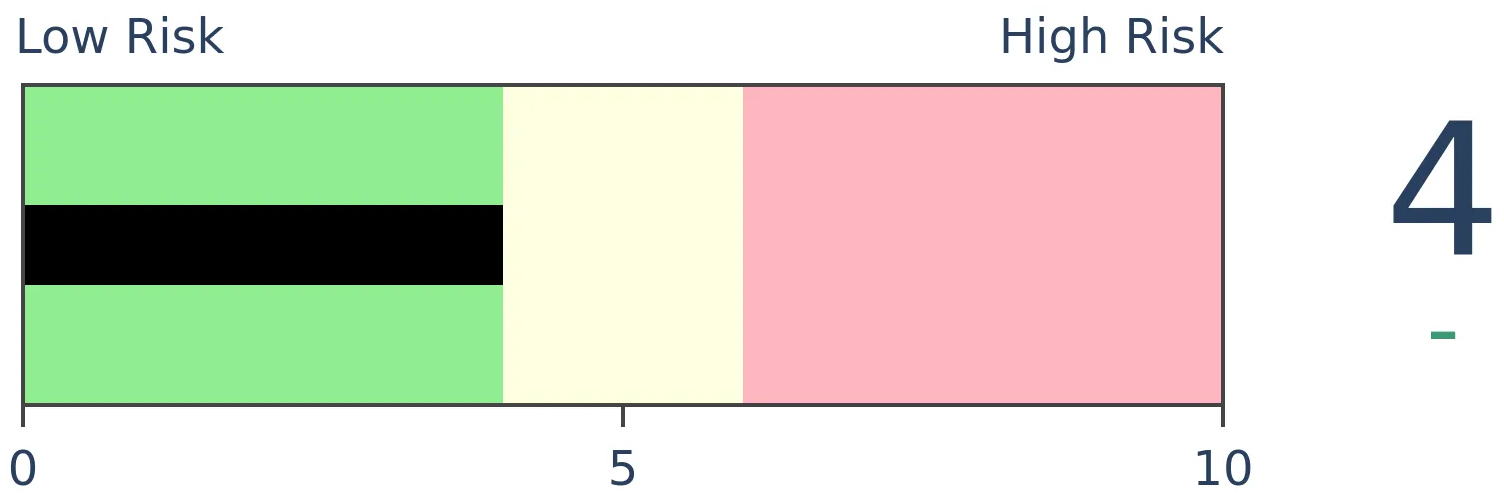
Crude Oil
|
|
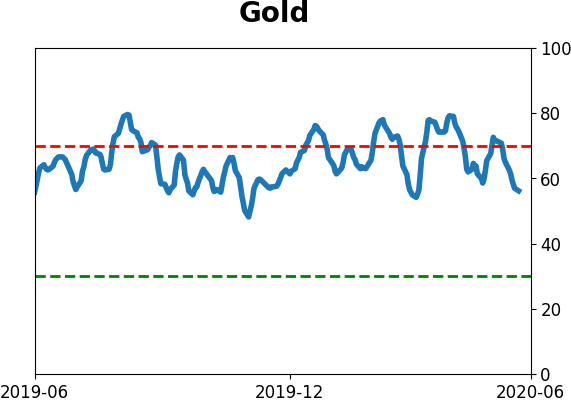
Gold
|
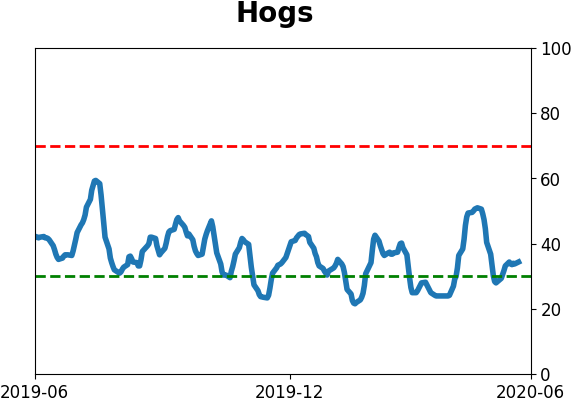
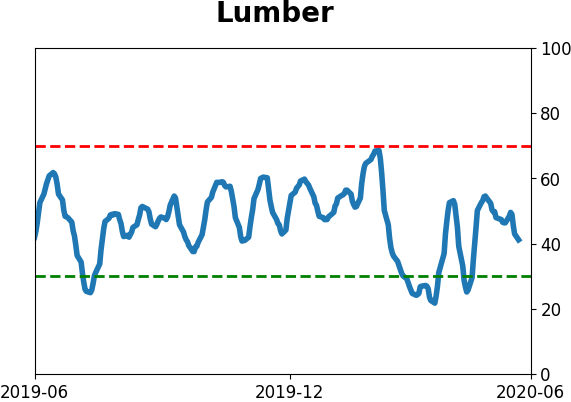
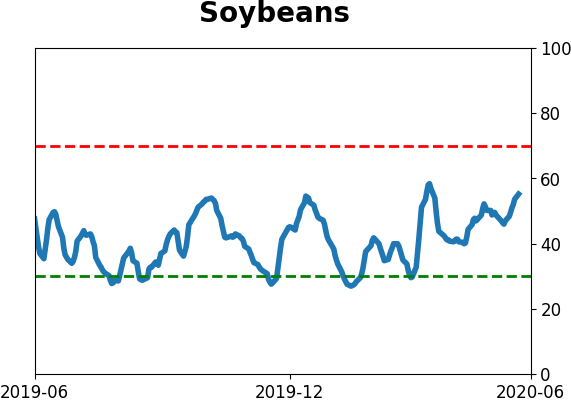
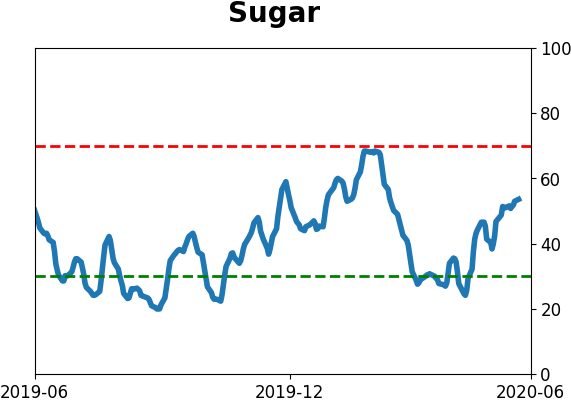
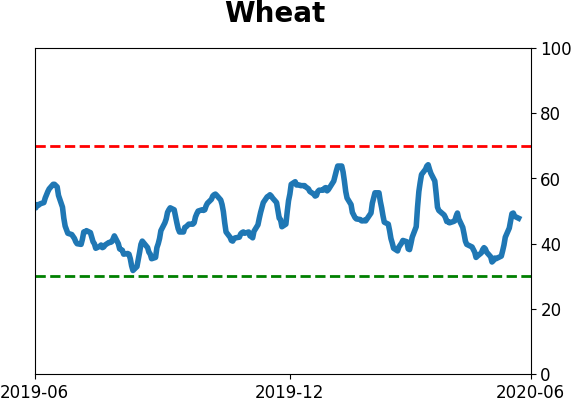
Agriculture
|
|
Research
BOTTOM LINE
The NBER has declared a peak in the business cycle. Obviously, stocks already priced much of that in, and then an eventual recovery. This isn't all that unusual since this particular organization tends to be conservative. By the time it feels comfortable declaring a recession, most losses have already been realized.
FORECAST / TIMEFRAME
None
|
The U.S. is "officially" in recession. According to the National Bureau of Economic Research (NBER), the business cycle peaked in February. No big surprise there.
This is a conservative group, and by the time they declare a peak in the cycle, there has to be a lot of evidence that it has actually peaked. So by the time they make the declaration, markets could have moved significantly. And usually have.
The table below shows returns in the S&P 500 after the NBER announces a business cycle peak. Note that the signals are as of the date of the announcement, NOT the peak of the cycle.
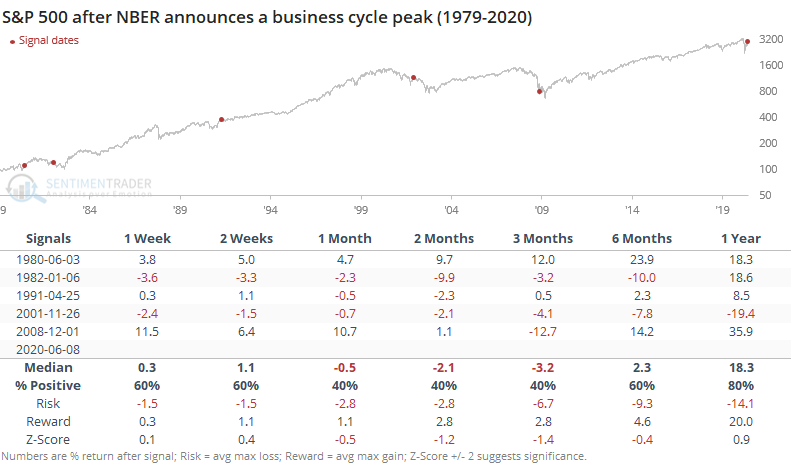
Over the medium-term, the S&P suffered some severe volatility a few times, once to the upside and twice to the downside. The others showed only minor losses. By a year later, though, the S&P showed a positive return each time except for 2001. The cycle peaks announced in 1980 and 1991 occurred once stocks had already quickly recovered from the bulk of their recession-anticipating declines, much like now.
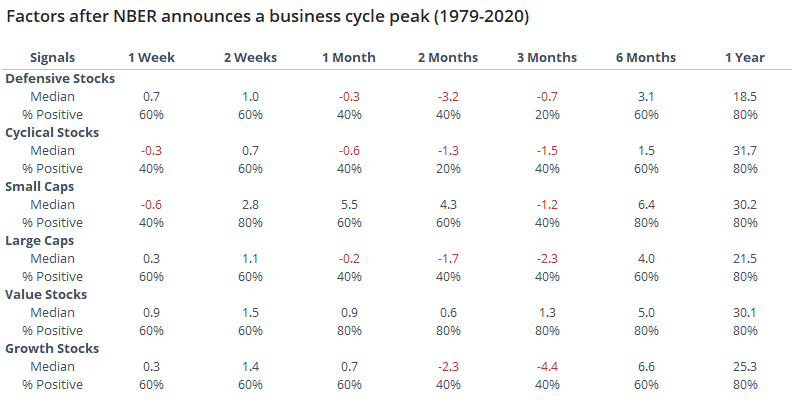
Among factors, there wasn't as clear a pattern as we might expect. Both cyclical and defensive stocks saw losses over the next 2-3 months, though cyclical stocks enjoyed a much larger average return over the next year. Same goes for small-cap and value stocks.
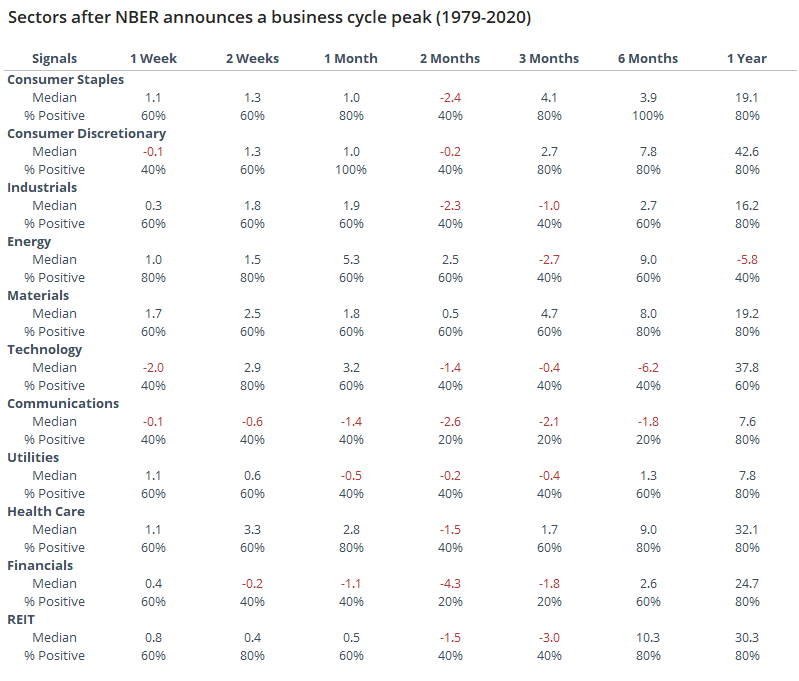
Among sectors, staples did well, but surprisingly so did discretionary stocks, especially over the next 6-12 months. Tech, communications, and financials tended to suffer the most over the medium-term.
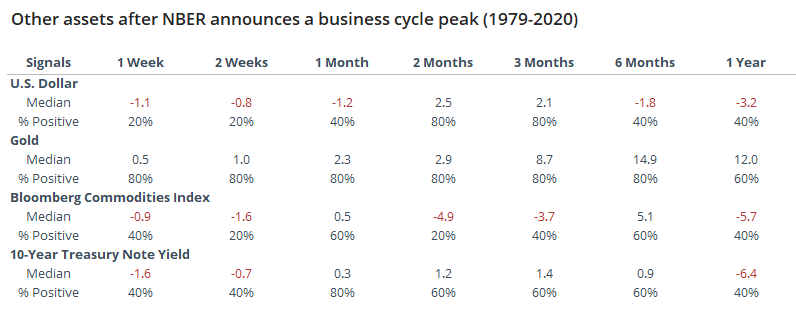
For other assets, the dollar and gold both tended to rally over the medium-term, but commodities did not.
Economic reports have a strong tendency to be backward-looking, and economic projections aren't much better. For this organization, in particular, their record at highlighting business cycles may be a good one in hindsight, but it's not much use to investors in real-time.
BOTTOM LINE
All four of the 'big four' stock indexes (S&P 500, DJIA, Nasdaq Composite, and Russell 2000) have made back more than 75% of their losses. By the time all four have recovered to this degree, it has indicated sustained recoveries.
FORECAST / TIMEFRAME
SPY -- Up, Long-Term
|
With the latest surge in small-cap stocks, all of the 'big four' equity indexes have made back at least 75% of their declines. The Russell 2000 was the last holdout, being led by the Nasdaq Composite, S&P 500, and Dow Industrials.
By the time all four indexes had recovered at least 75% of their declines from a 52-week high to a 52-week low, it indicated strong, broad-based recoveries. This also meant that stocks had traveled far, and usually fast, so short-term returns were below average. But by the time it entered a medium- to long-term time frame, returns were good.
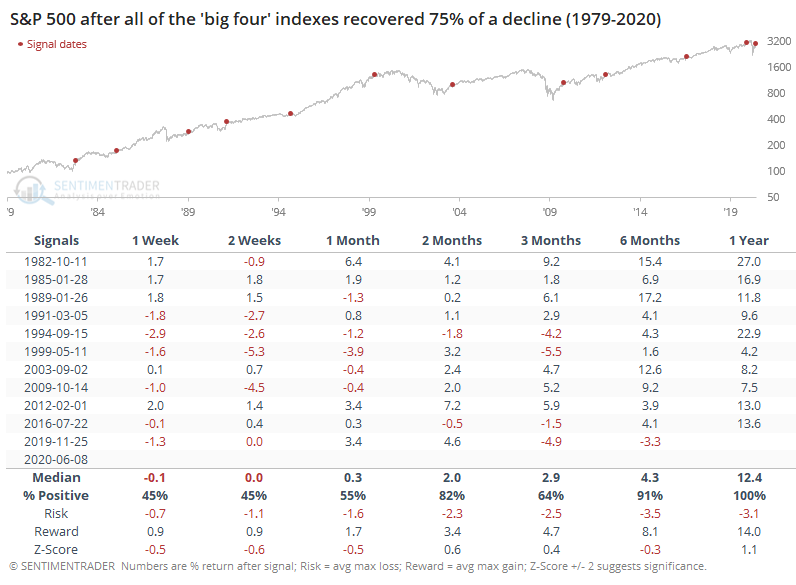
The risk/reward in the S&P 500 was mediocre over the next month, then turned significantly more positive. Six months later there was a single loss (from last November) but one-year returns were positive each time.
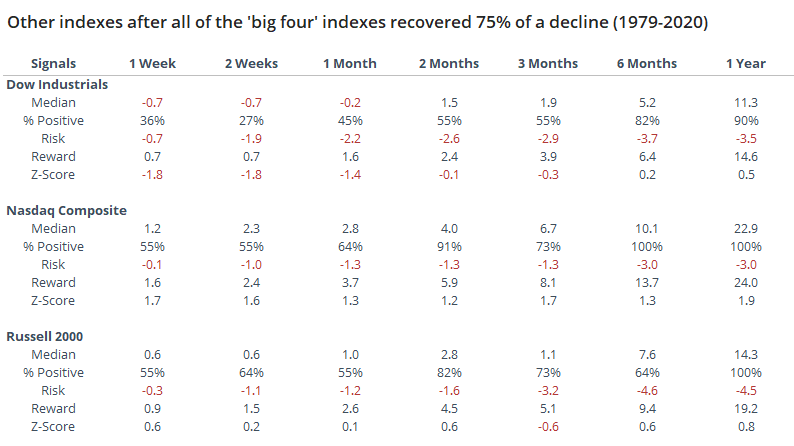
Among other indexes, the Dow struggled the most in the short-term and its overall returns across time frames were about in line with random. Out of all the indexes, the Nasdaq tended to do the best.
The other signs of thrusts and recoveries we've been harping about have had the same general conclusion - perhaps short- to medium-term digestion of recent gains, but on longer time frames, almost universally positive.
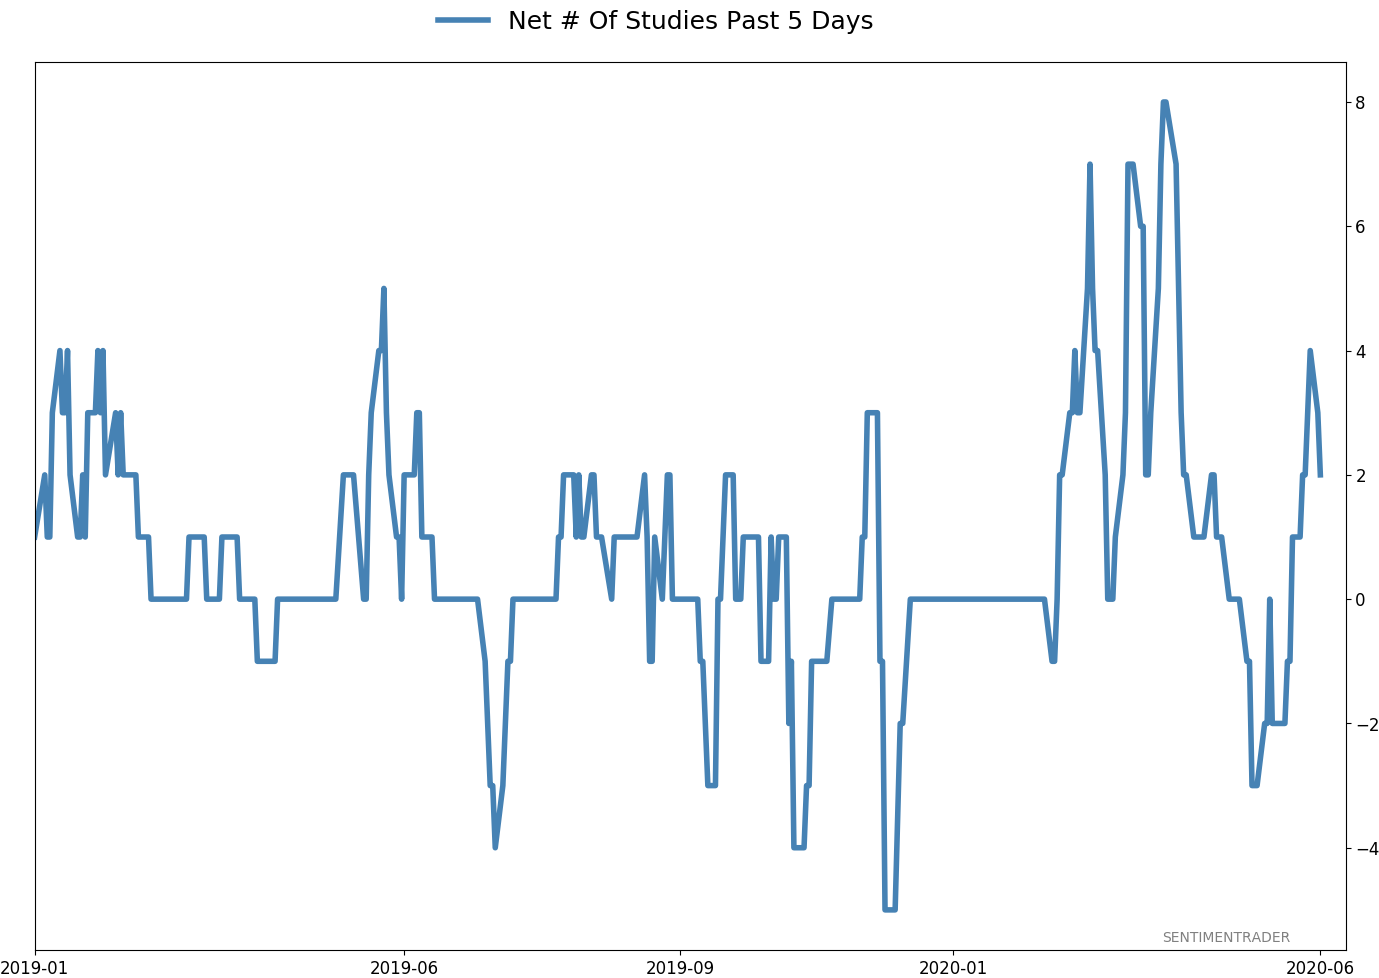
Active Studies
| Time Frame | Bullish | Bearish | | Short-Term | 0 | 1 | | Medium-Term | 8 | 5 | | Long-Term | 40 | 1 |
|
Indicators at Extremes
Portfolio
| Position | Weight % | Added / Reduced | Date | | Stocks | 38.9 | Reduced 10% | 2020-05-13 | | Bonds | 0.0 | Reduced 6.7% | 2020-02-28 | | Commodities | 5.1 | Added 2.4%
| 2020-02-28 | | Precious Metals | 0.0 | Reduced 3.6% | 2020-02-28 | | Special Situations | 0.0 | Reduced 31.9% | 2020-03-17 | | Cash | 56.0 | | |
|
Updates (Changes made today are underlined)
In the first months of the year, we saw manic trading activity. From big jumps in specific stocks to historic highs in retail trading activity to record highs in household confidence to almost unbelievable confidence among options traders. All of that came amid a market where the average stock couldn't keep up with their indexes. There were signs of waning momentum in stocks underlying the major averages, which started triggering technical warning signs in late January. The kinds of extremes we saw in December and January typically take months to wear away, but the type of selling in March went a long way toward getting there. When we place the kind of moves we saw into March 23 into the context of coming off an all-time high, there has been a high probability of a multi-month rebound. After stocks bottomed on the 23rd, they enjoyed a historic buying thrust and retraced a larger amount of the decline than "just a bear market rally" tends to. Those thrusts are the most encouraging sign we've seen in years. Even through early June, we're still seeing thrusts that have led to recoveries in longer-term breadth metrics. By early May, we were seeing some troubling signs of shorter-term speculation, and buyers have run right over those. This is what bull markets do. In bear markets, they don't get a chance, as sellers tend to come in as soon as sentiment moves to neutral or slightly optimistic. That didn't happen this time, and the rally has gone way further, and way longer, than "just a bear market rally" does. I am the world's worst momentum trader, and this is one of the most anguishing kinds of markets for me. I detest chasing prices higher, especially in the face of readings like high Dumb Money Confidence and small trader call buying. I recognize the overwhelming positives of the recoveries noted above, and it's impossible to ignore the medium- to long-term positive implications. I'm holding out on adding exposure for now, based on the negatives that have been generated (and so far failed), at the risk of falling further behind a new roaring bull market.
RETURN YTD: -4.5% 2019: 12.6%, 2018: 0.6%, 2017: 3.8%, 2016: 17.1%, 2015: 9.2%, 2014: 14.5%, 2013: 2.2%, 2012: 10.8%, 2011: 16.5%, 2010: 15.3%, 2009: 23.9%, 2008: 16.2%, 2007: 7.8%
|
|
Phase Table
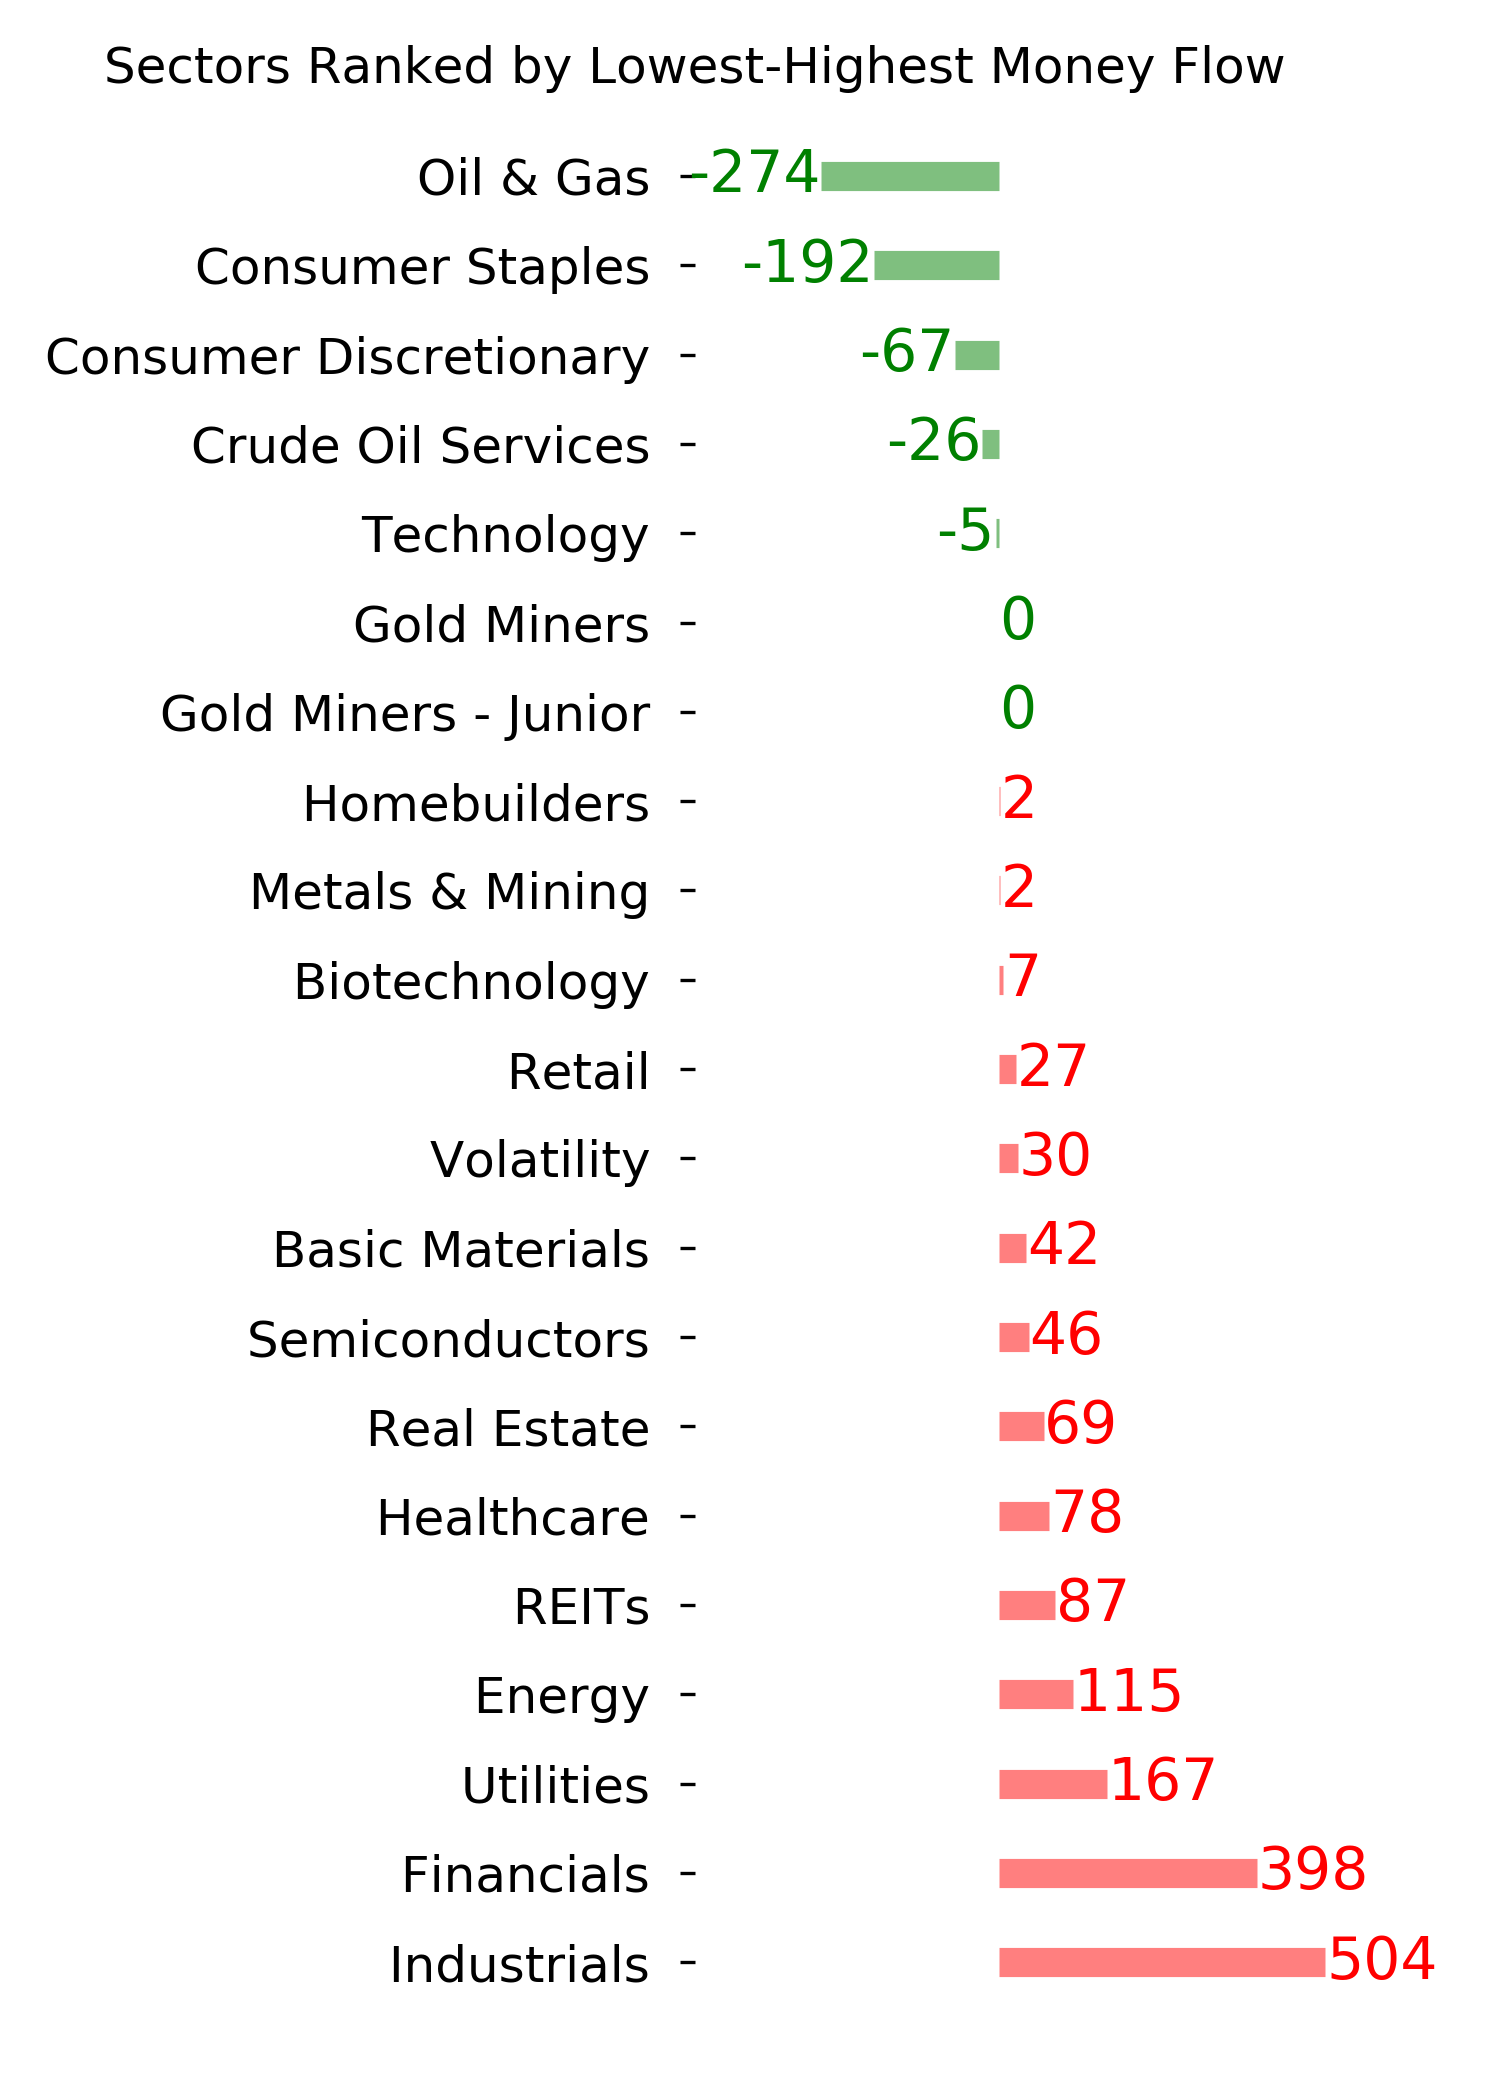
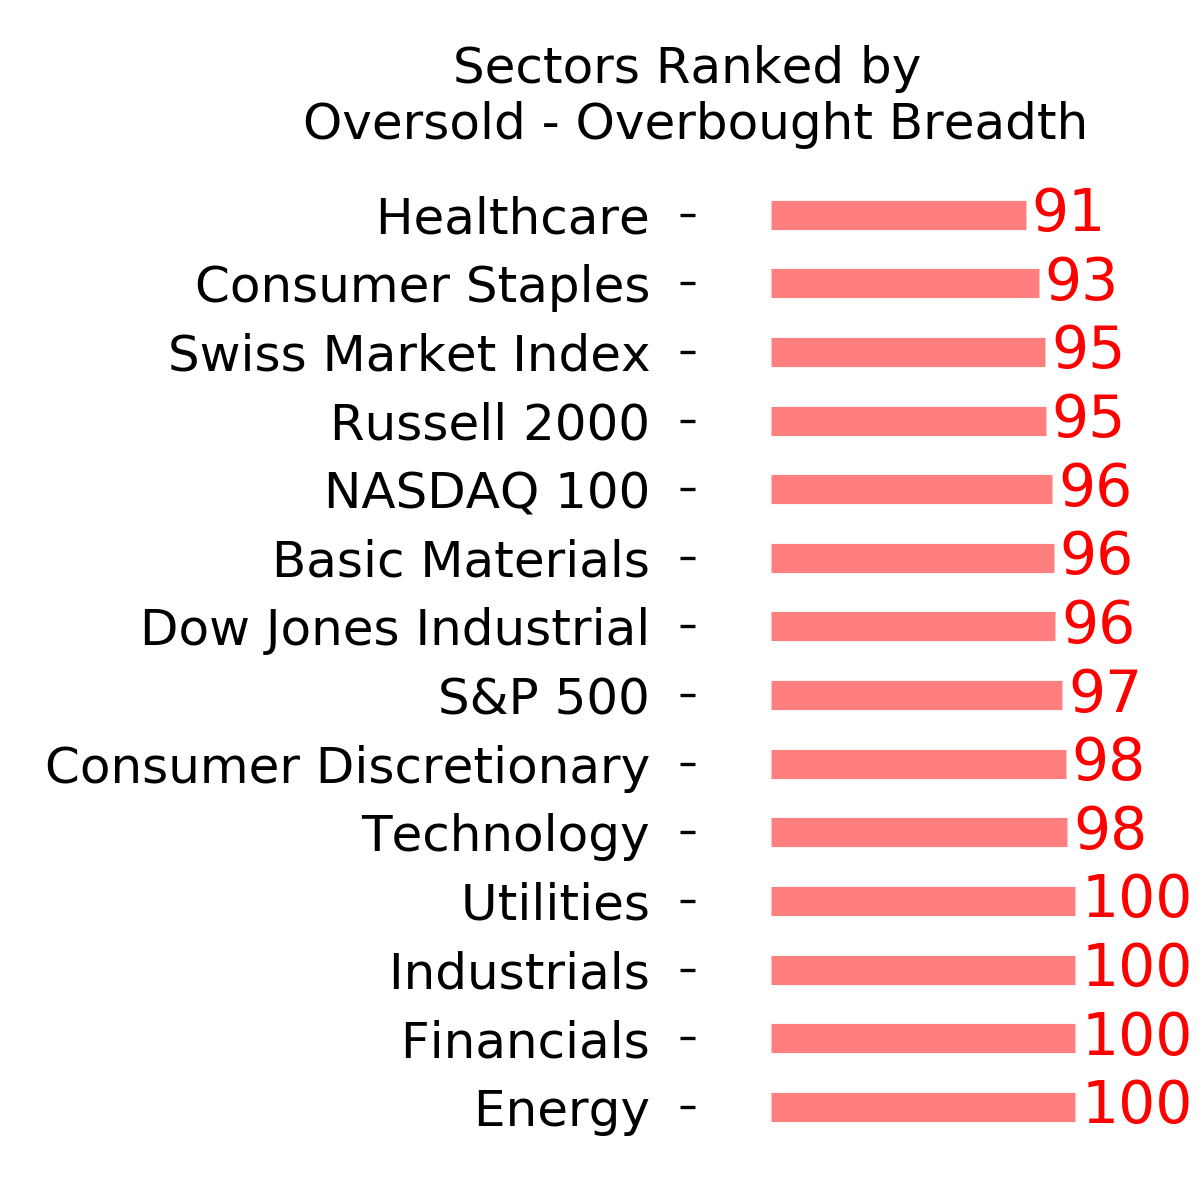
Ranks
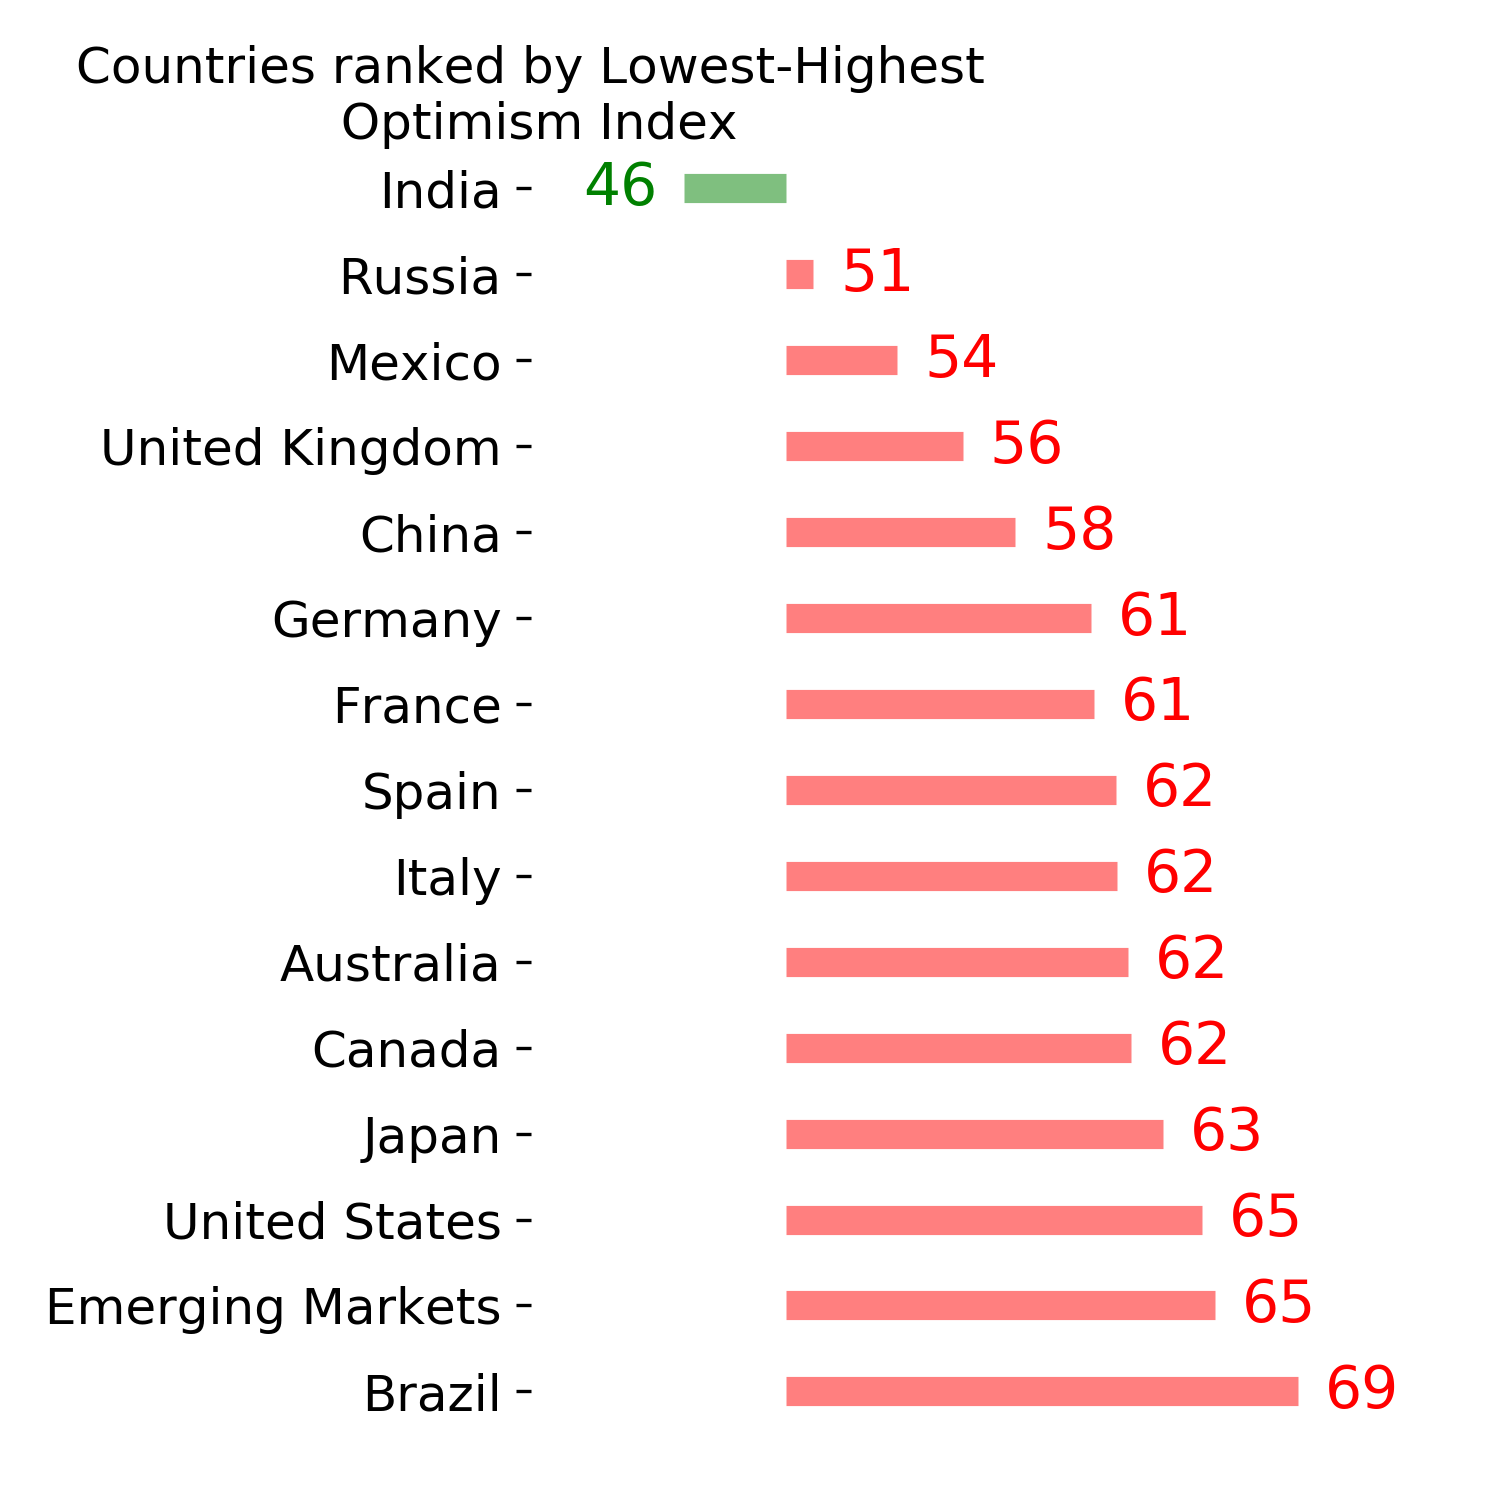
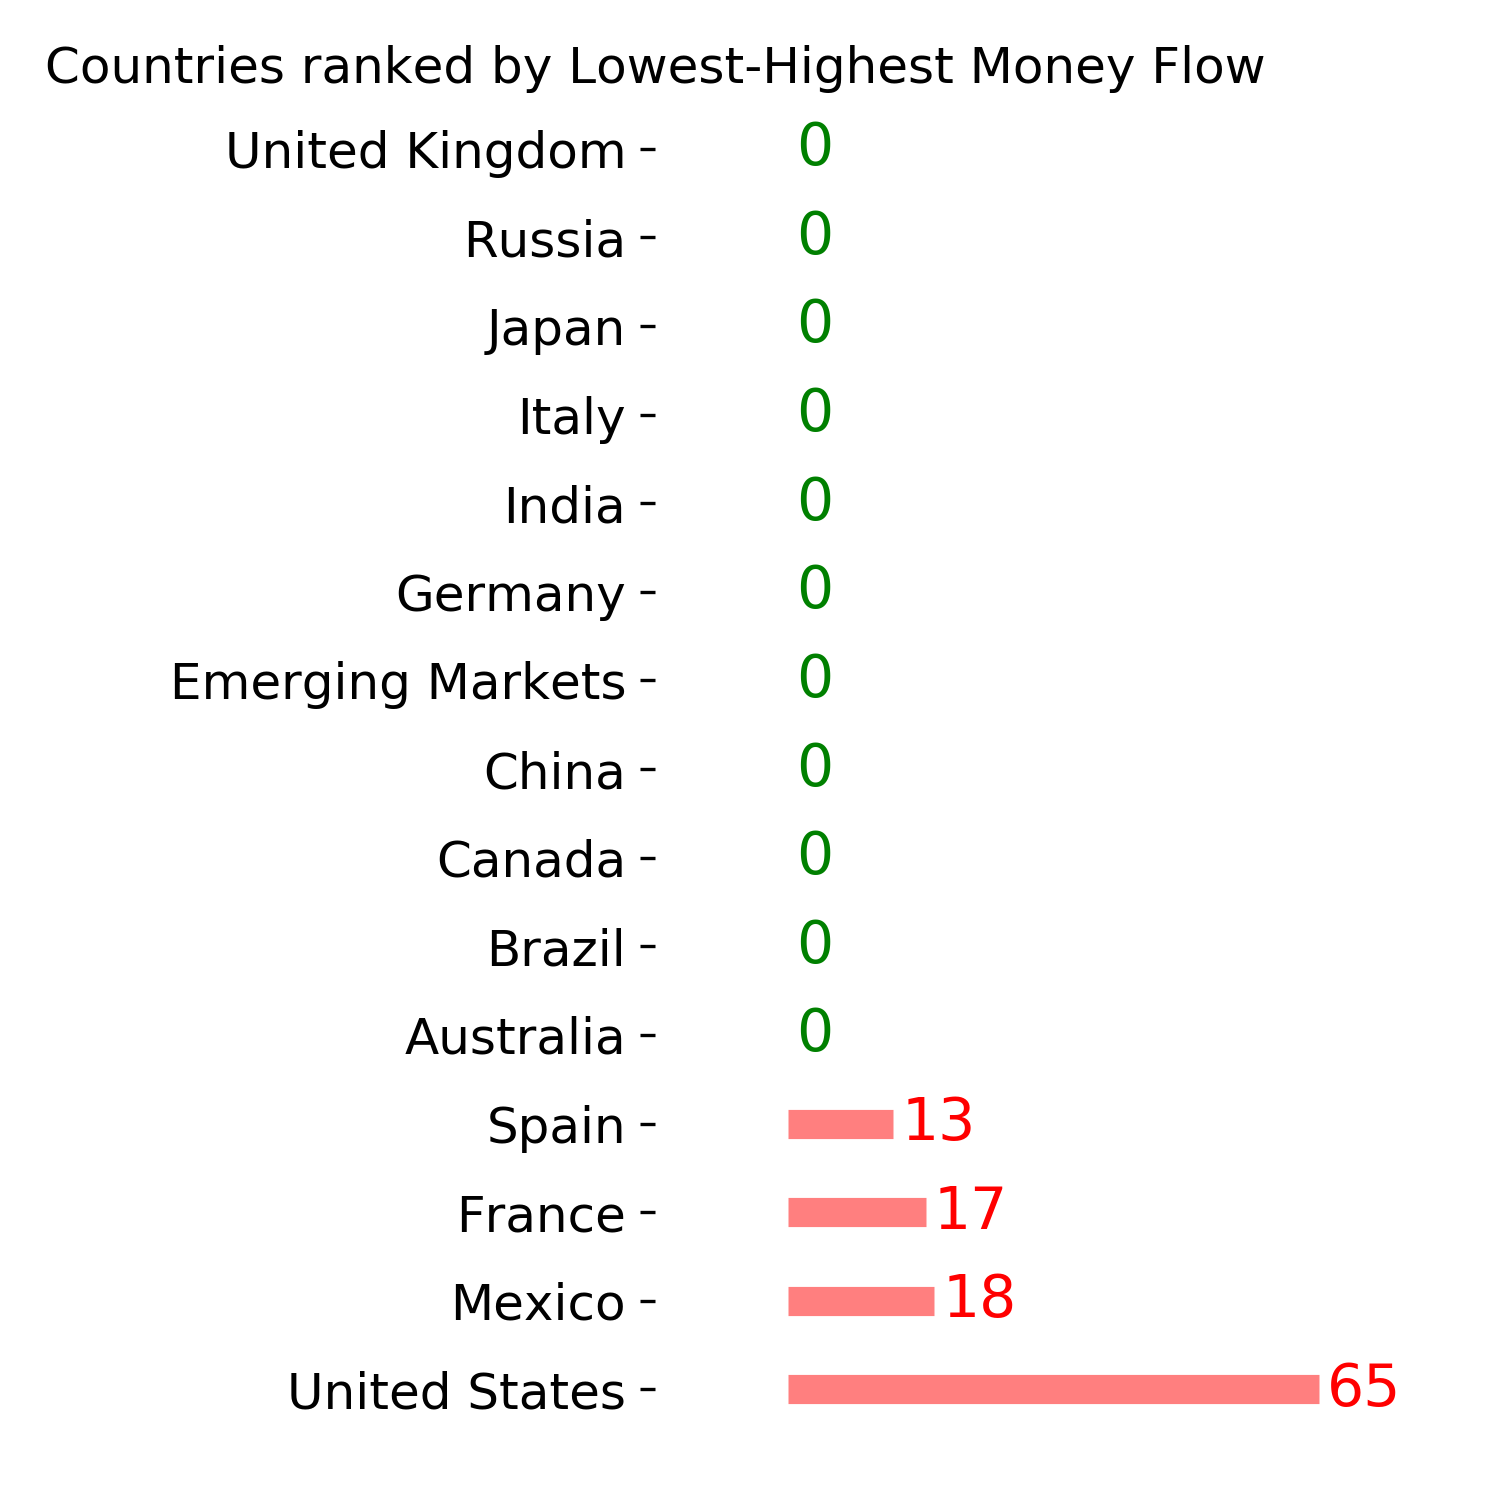
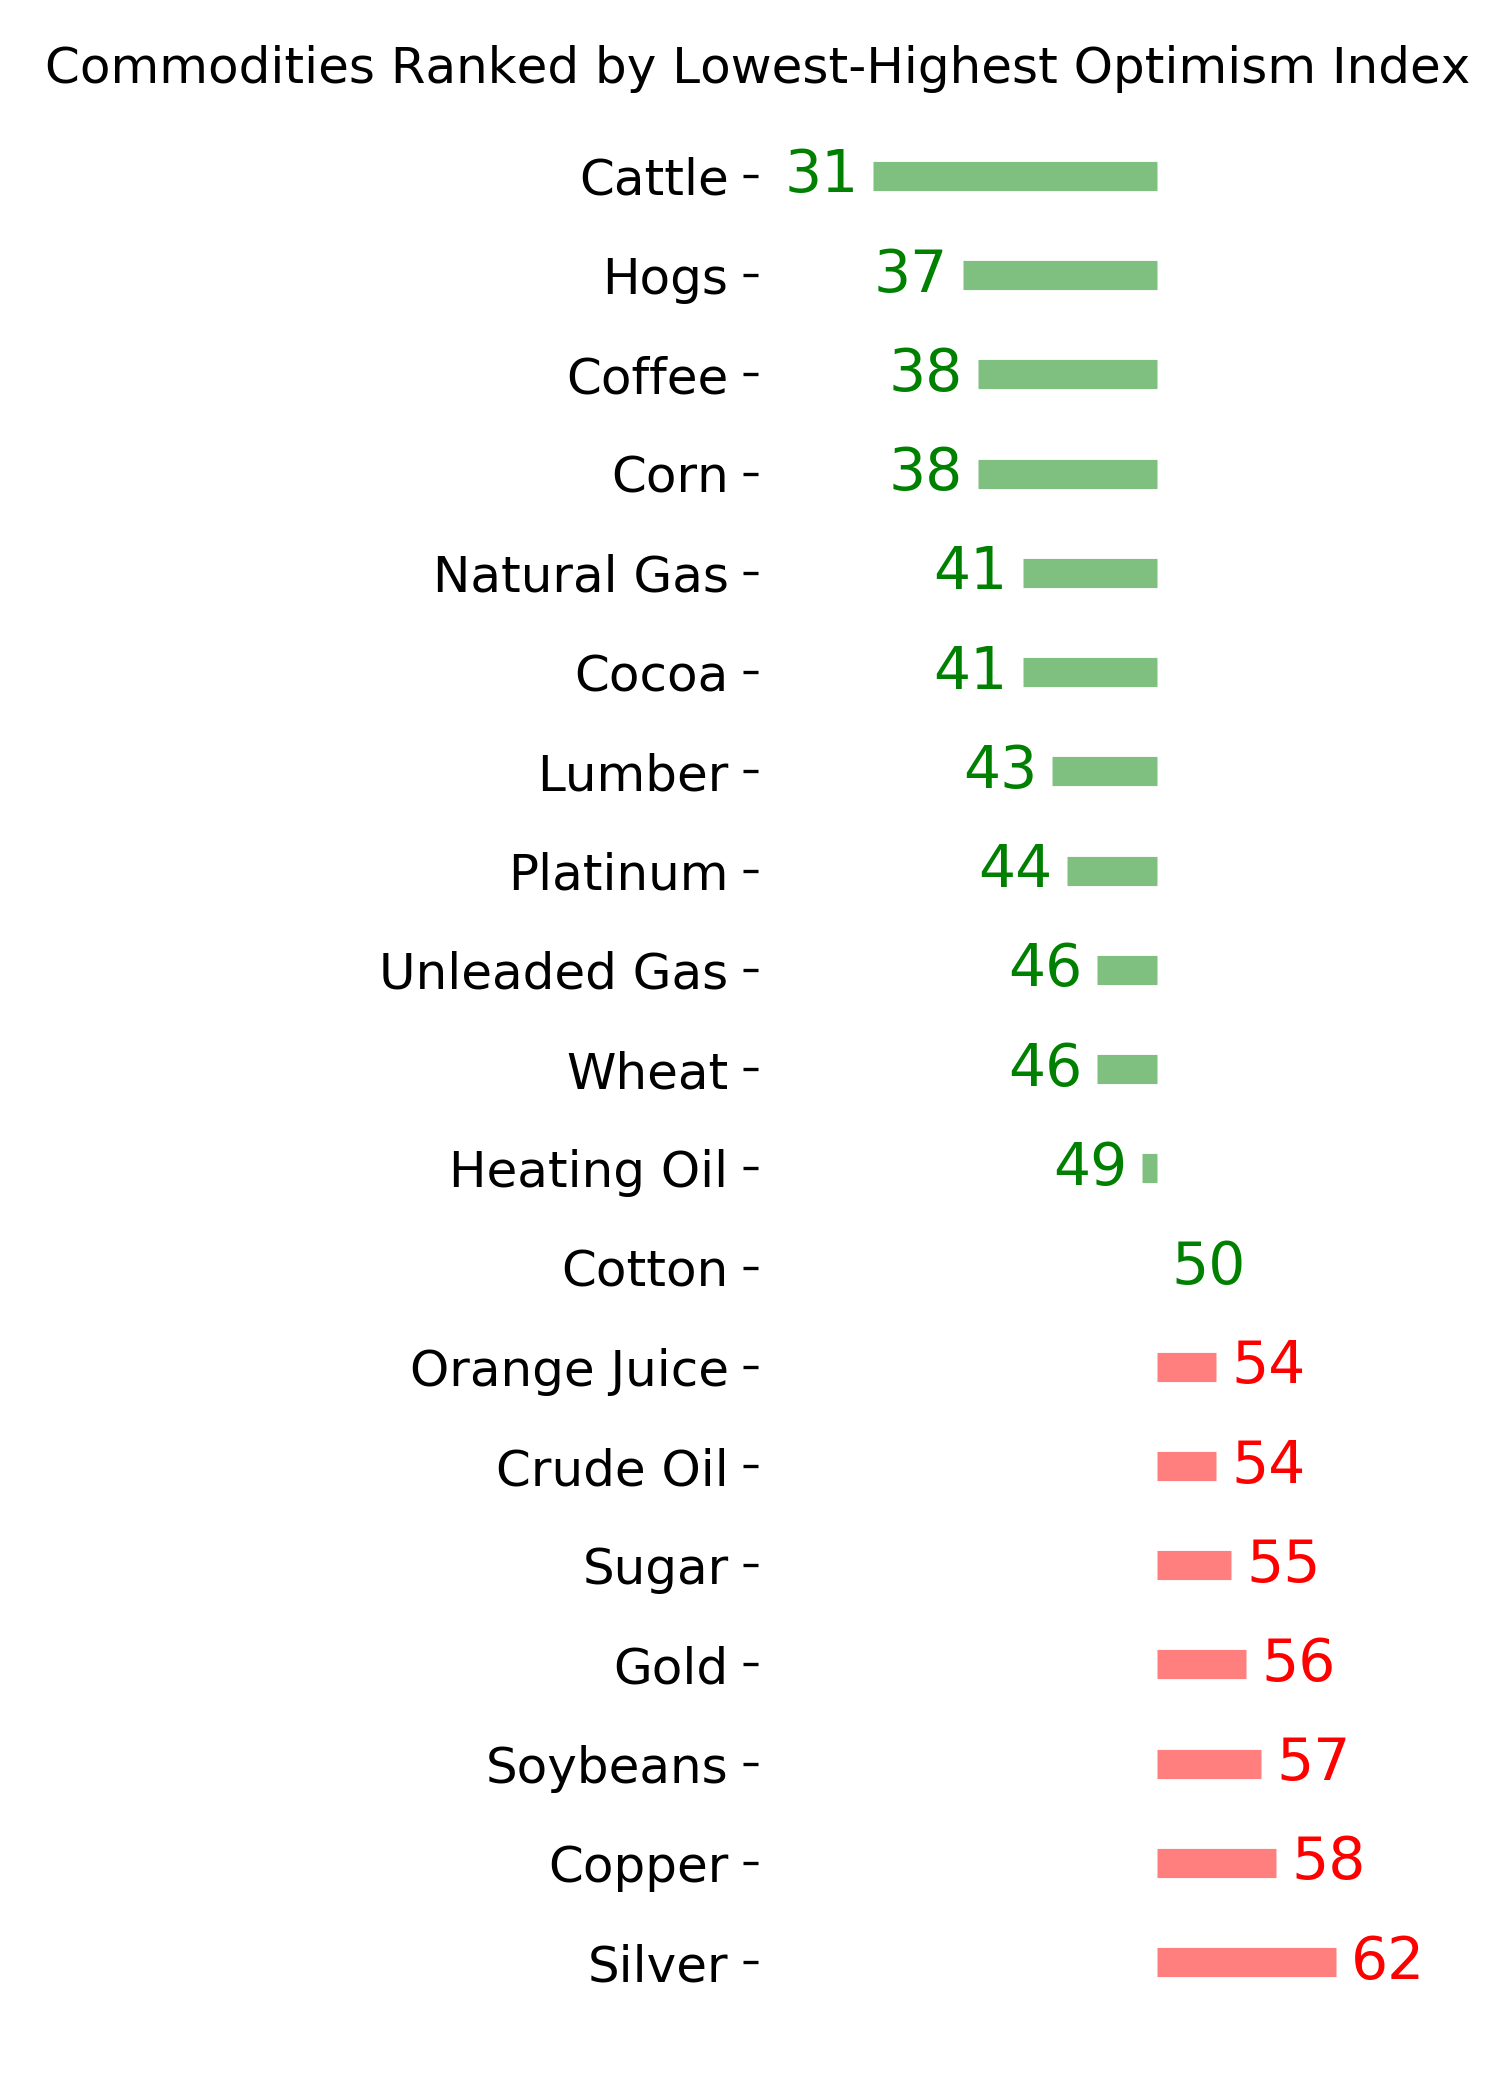
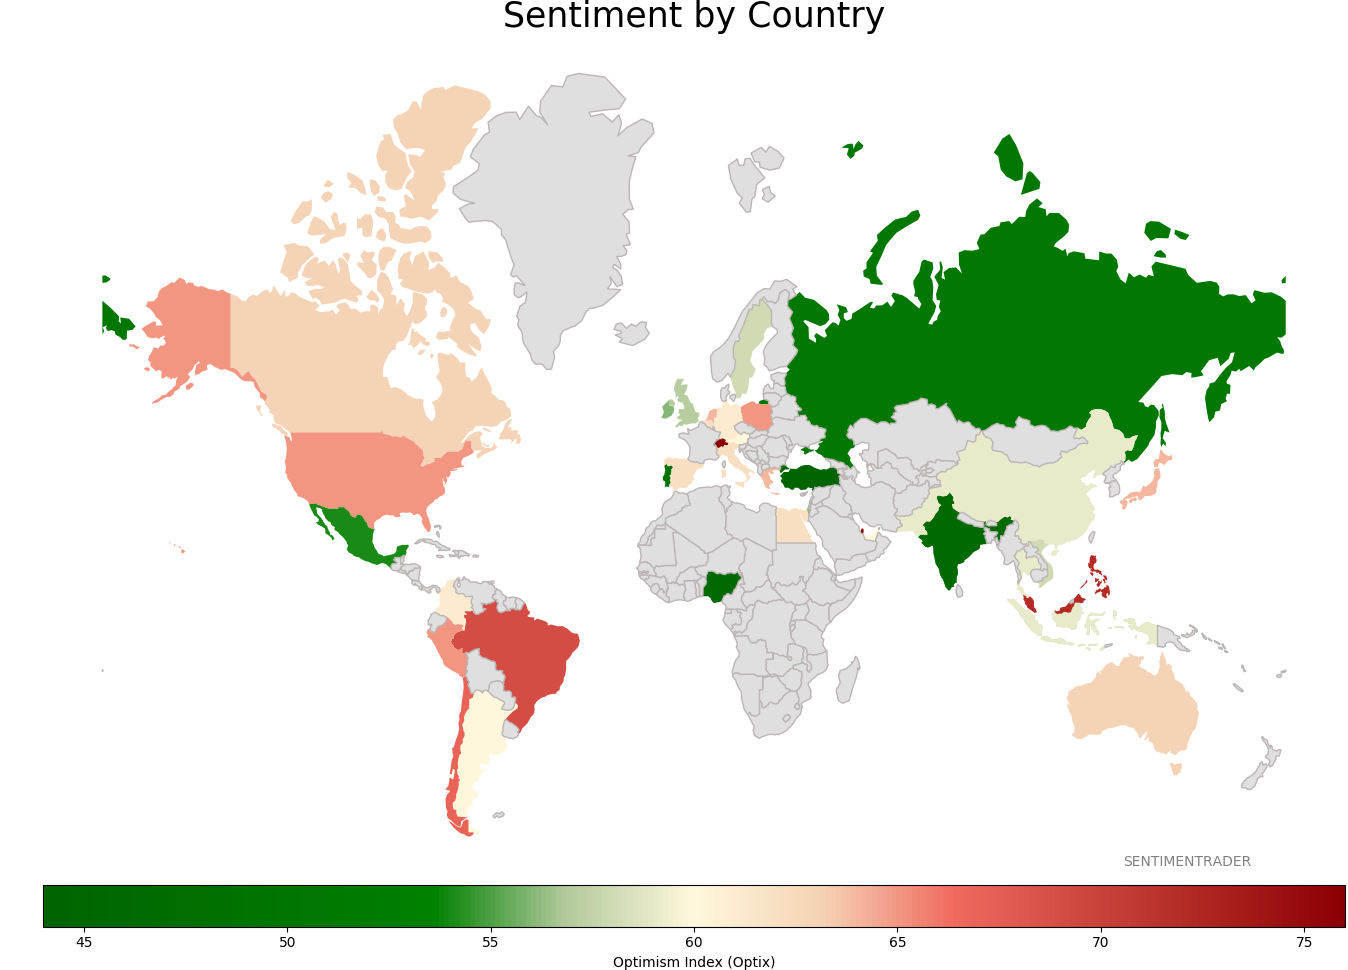
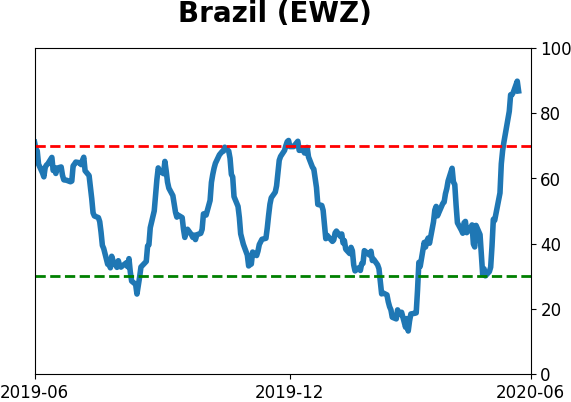
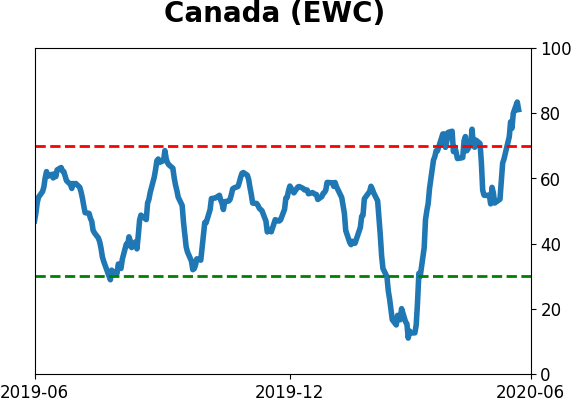
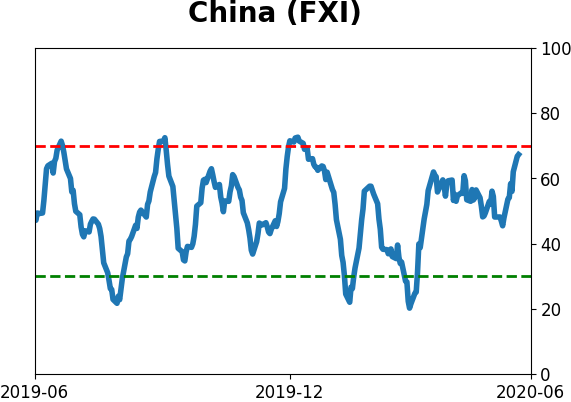
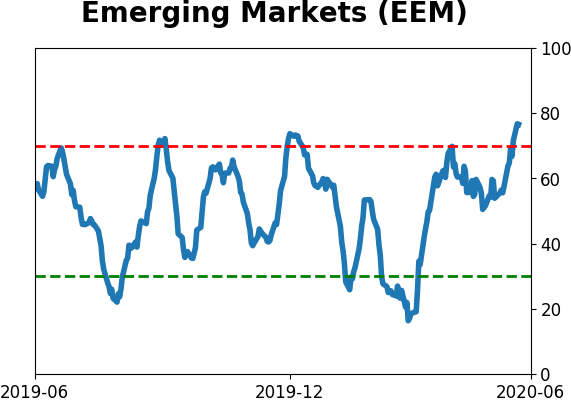
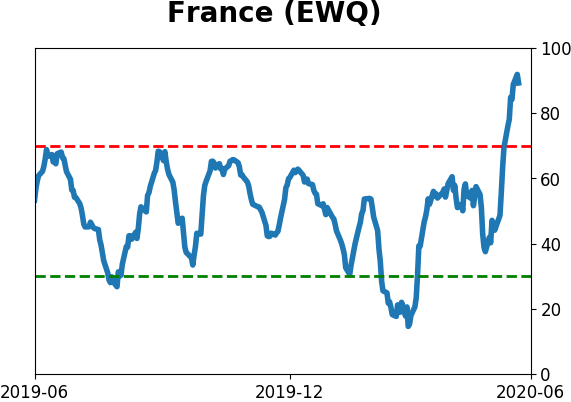
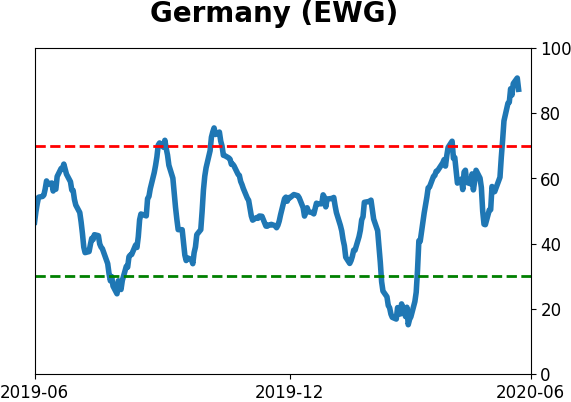
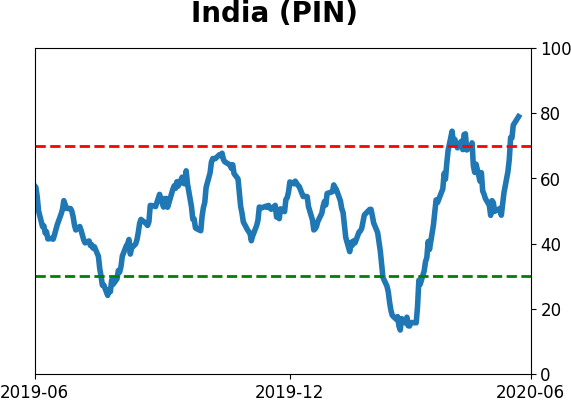
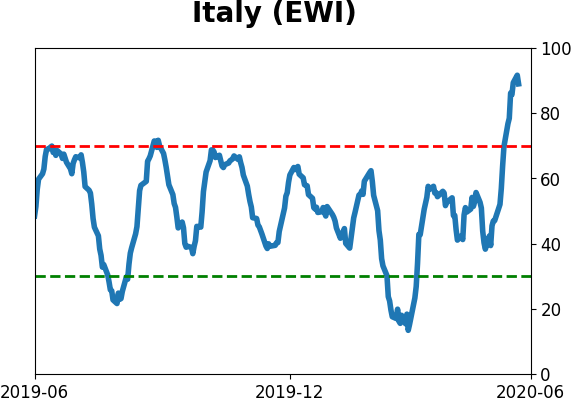
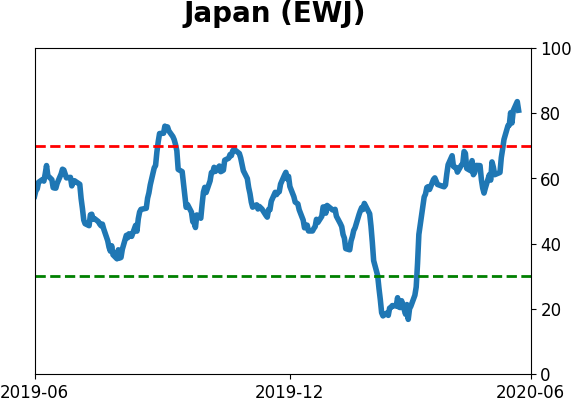
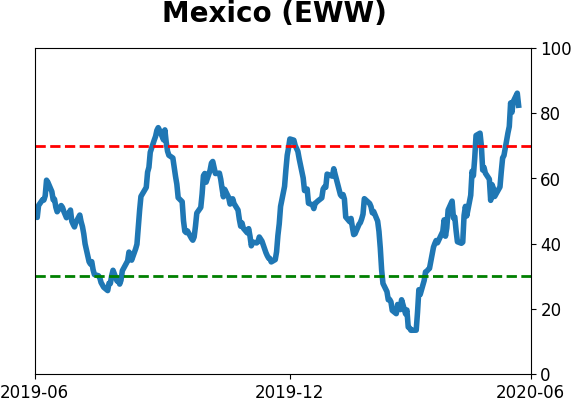
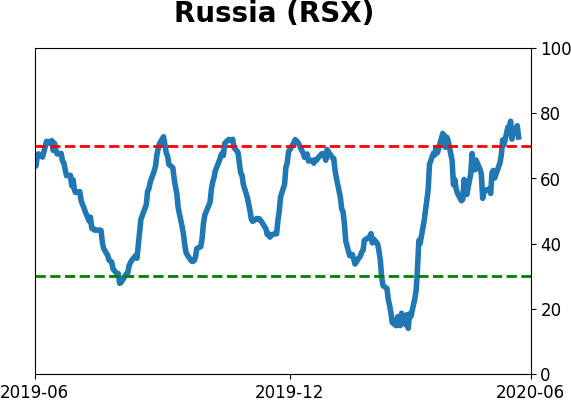
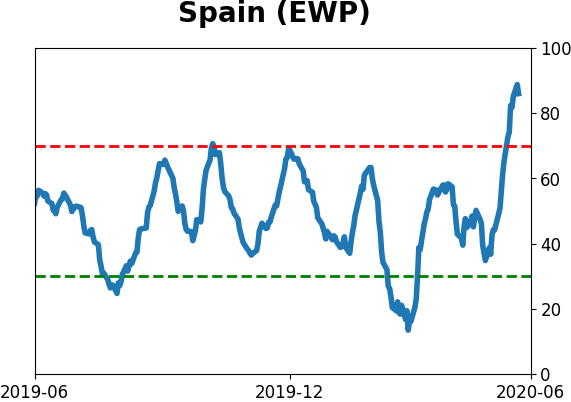
Sentiment Around The World
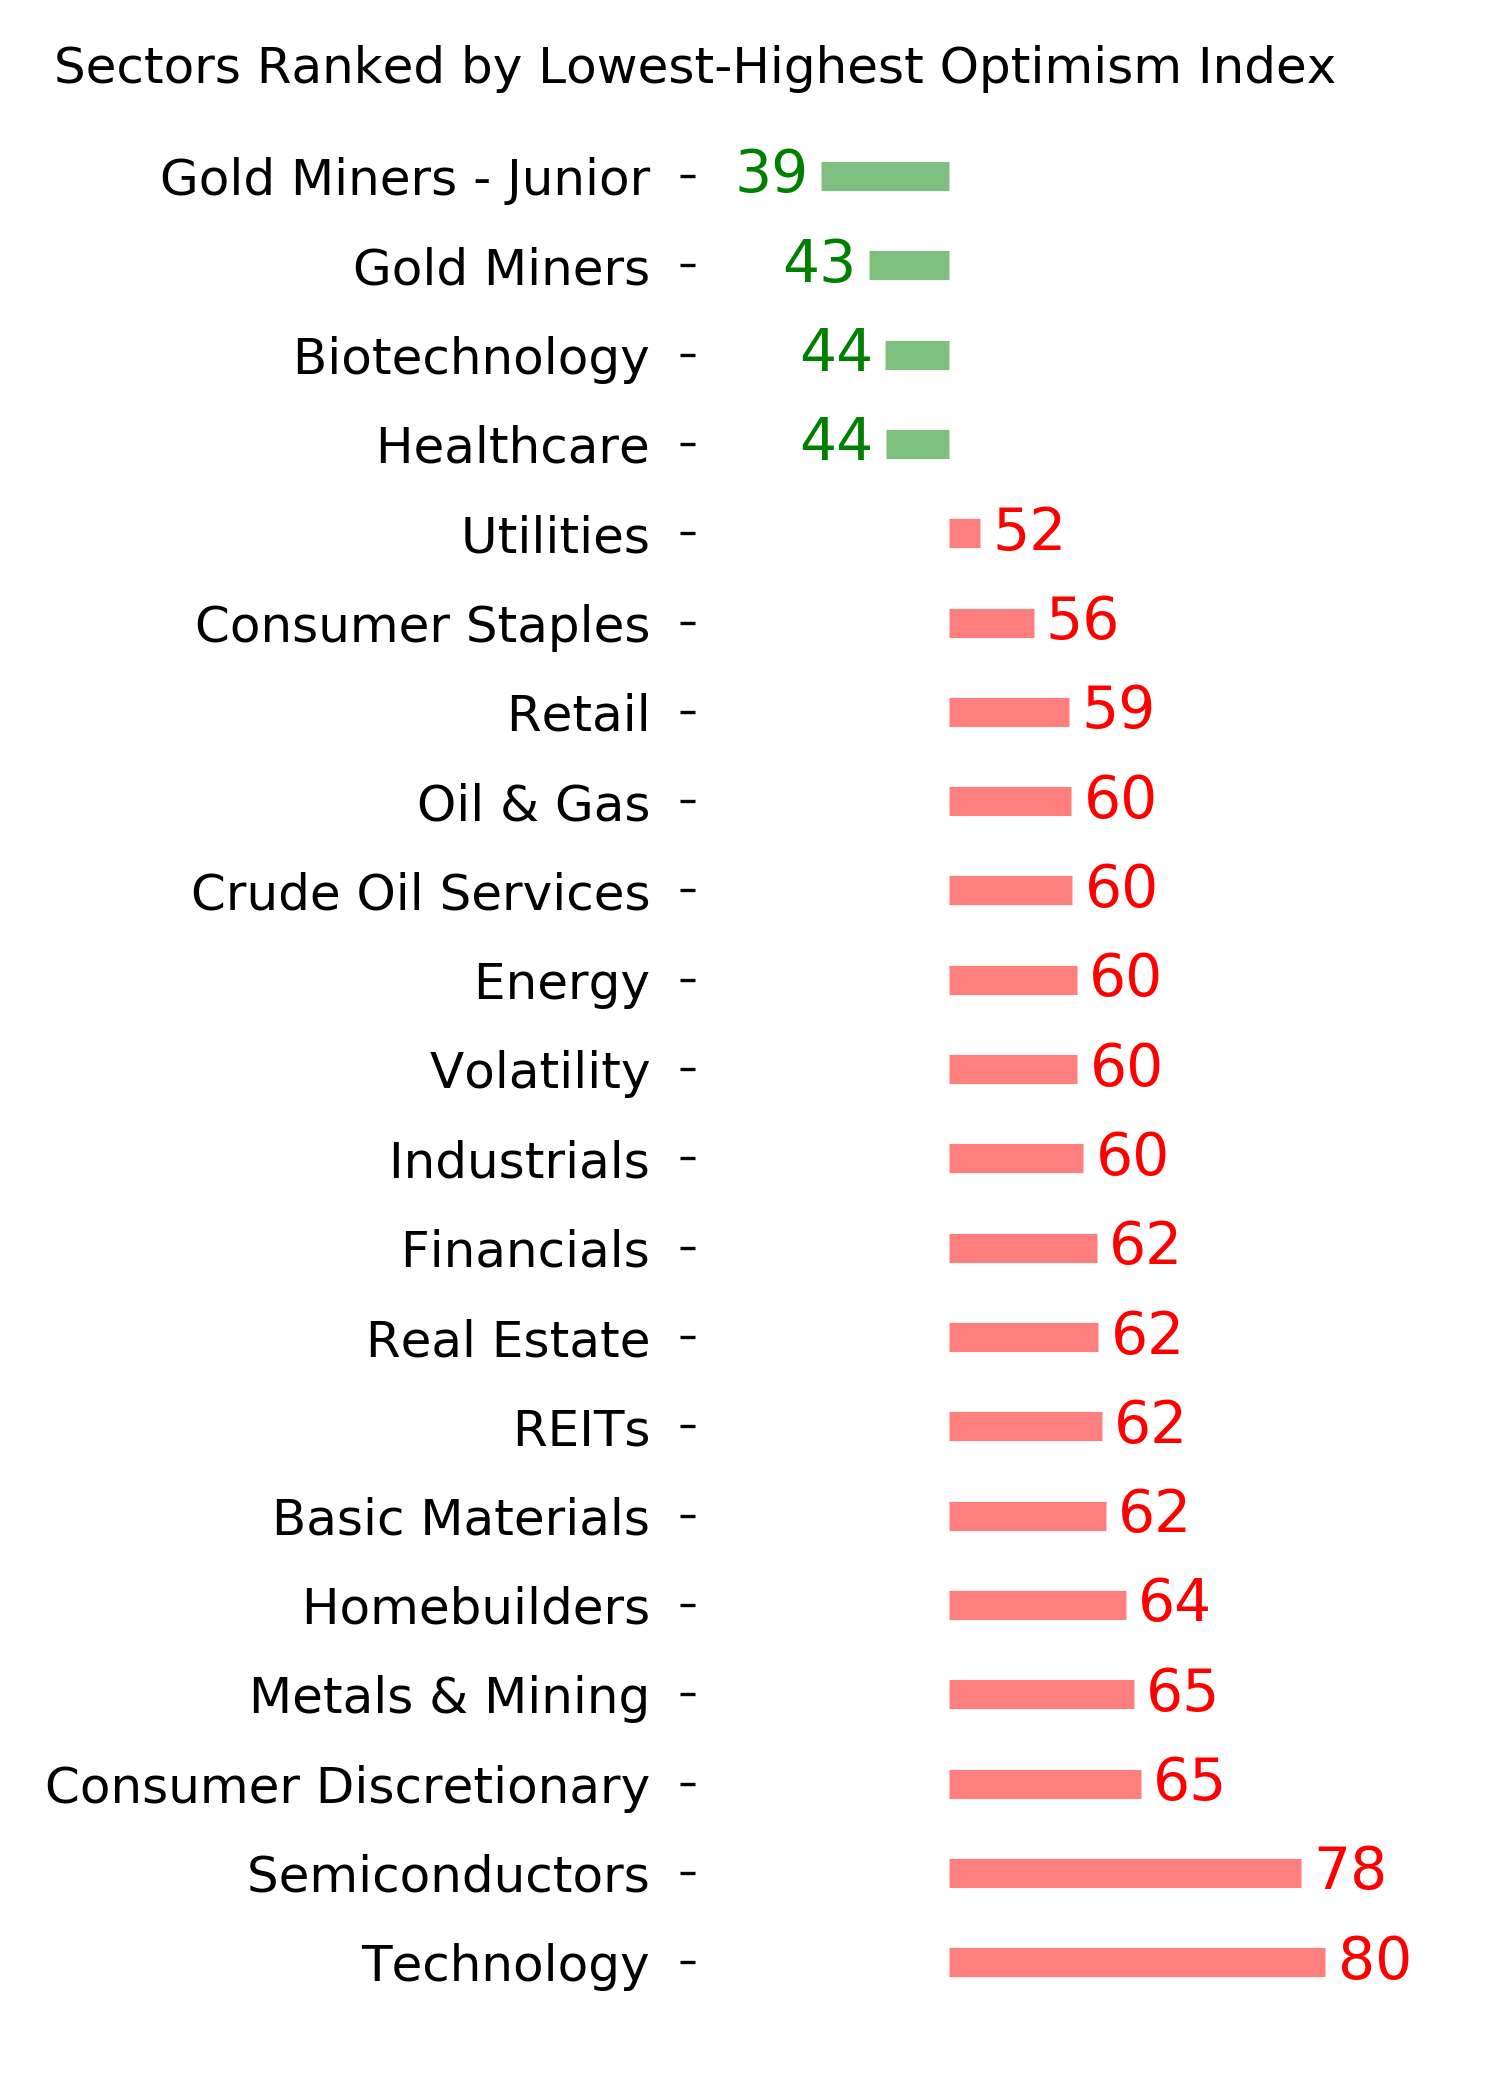
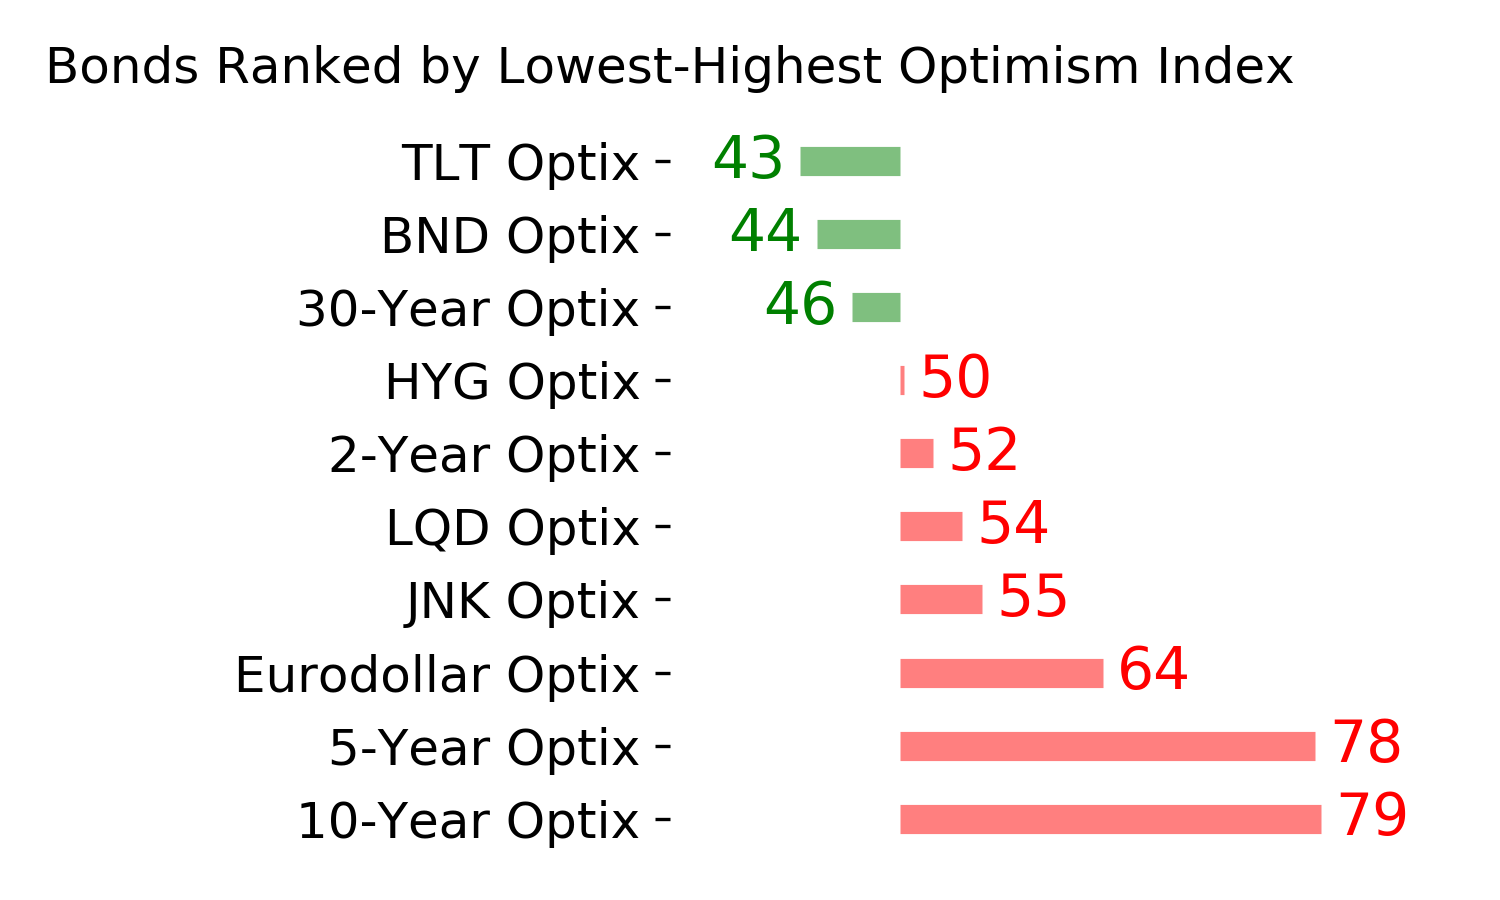
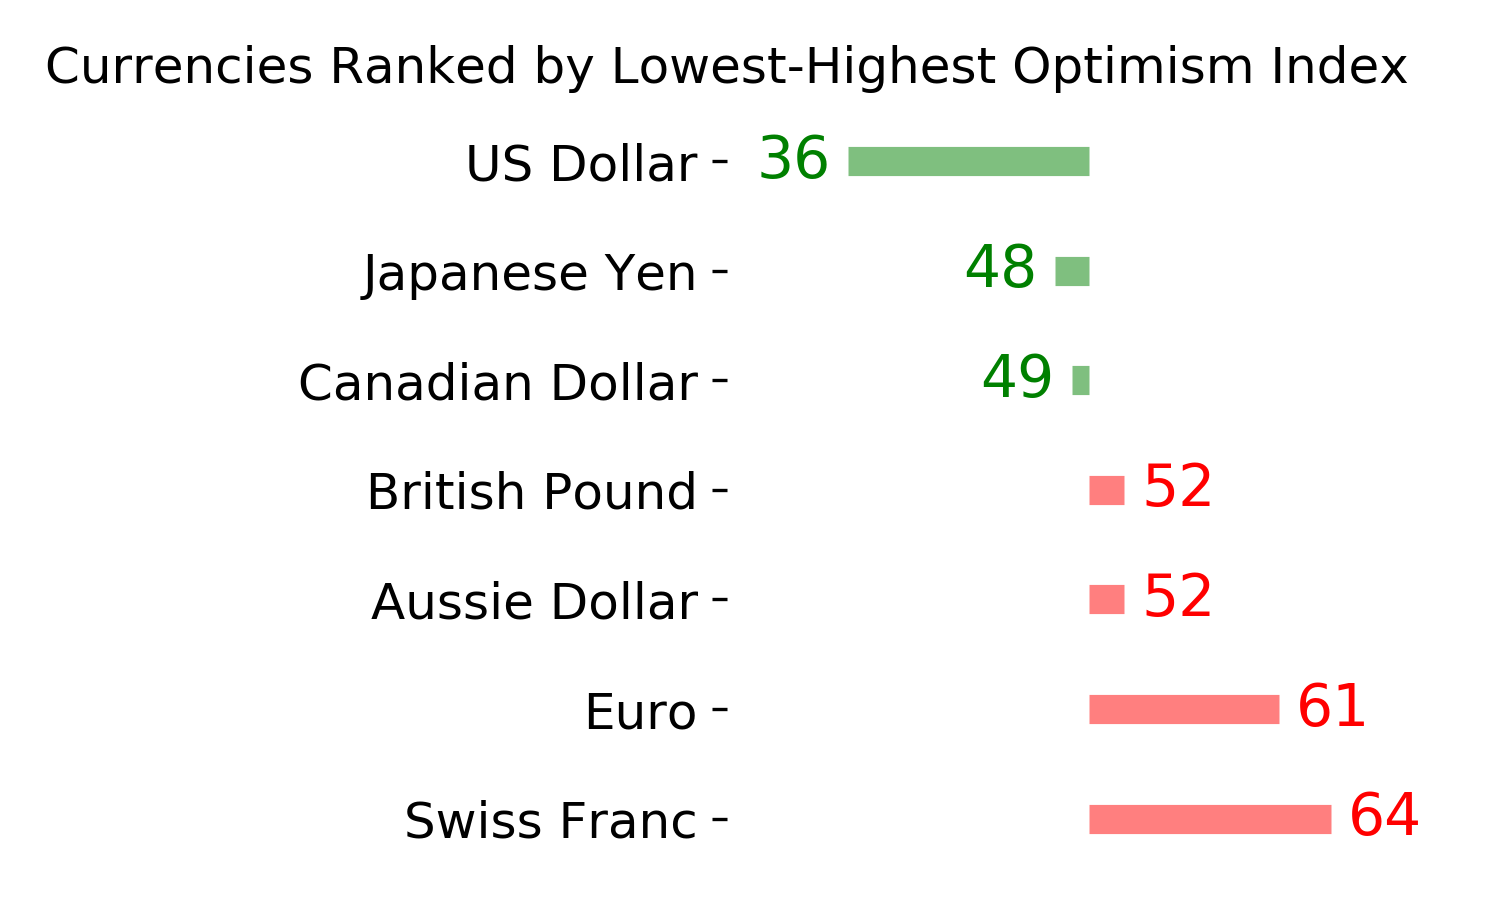
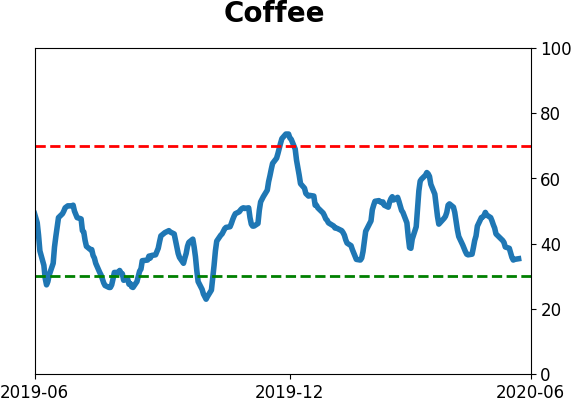
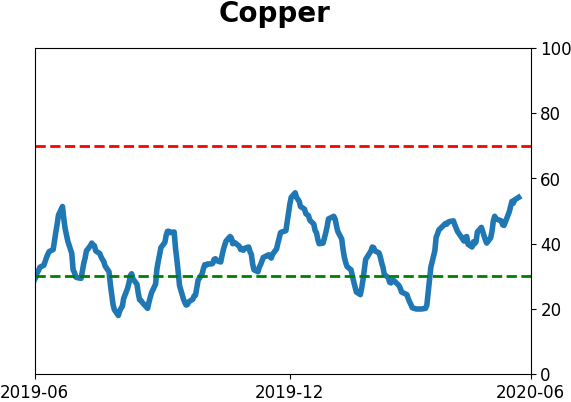
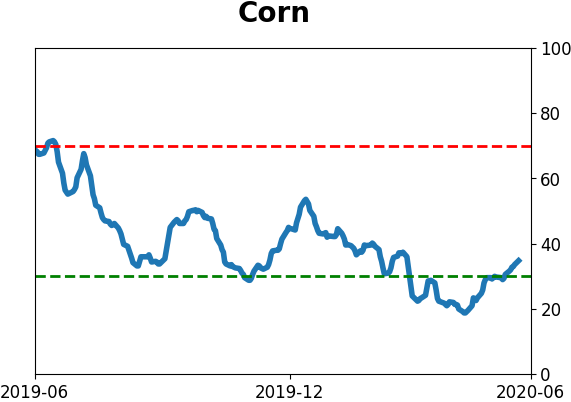
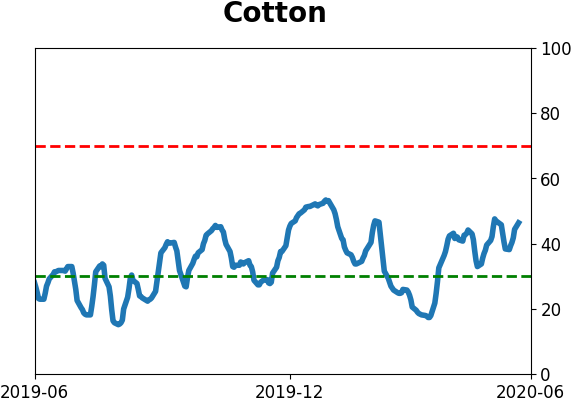
Optimism Index Thumbnails
|
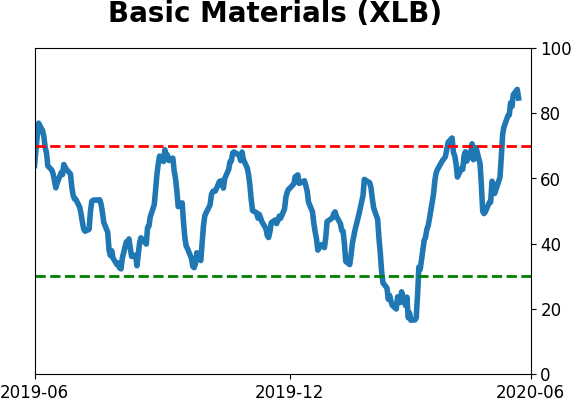
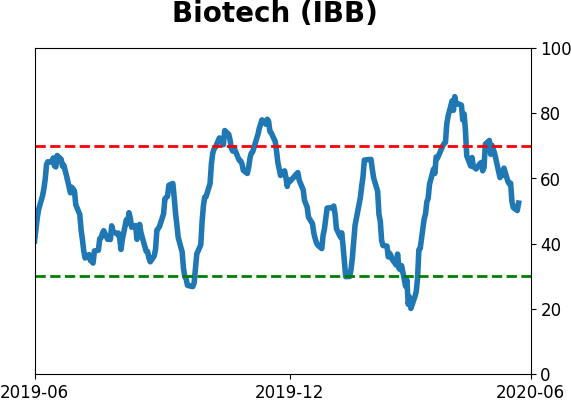
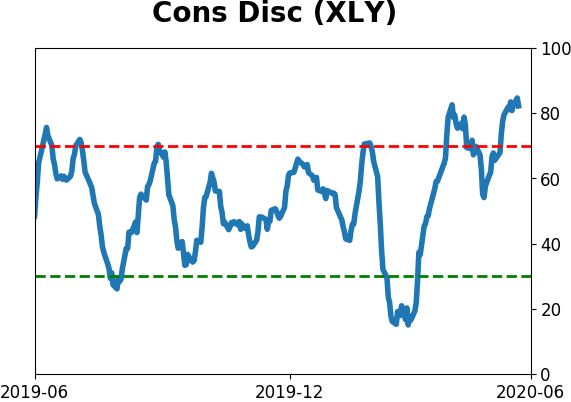
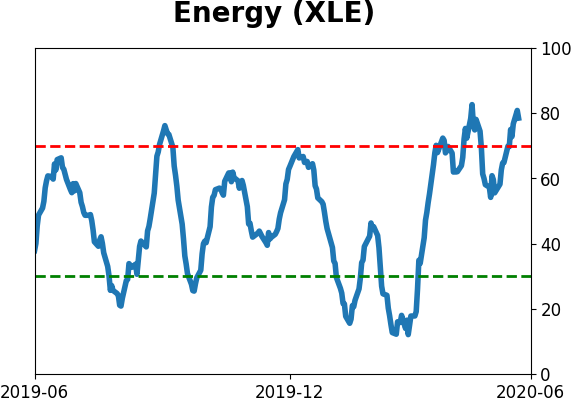
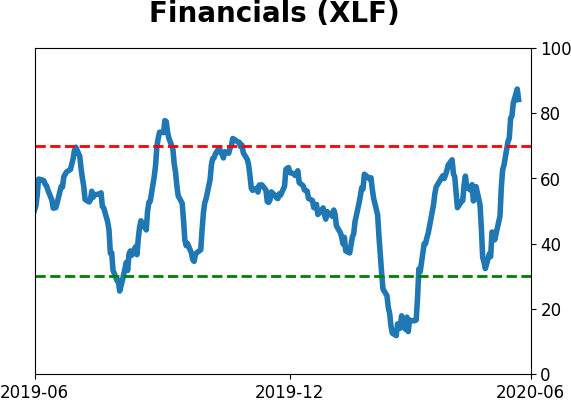
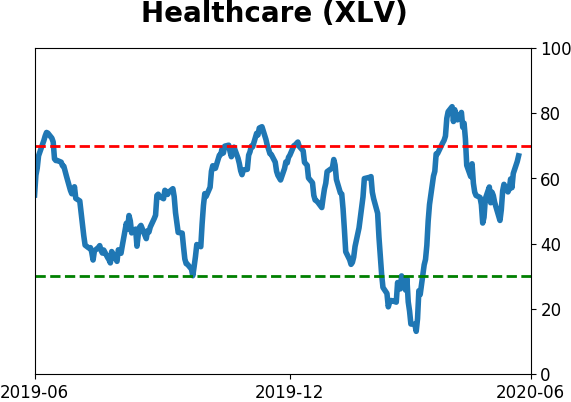
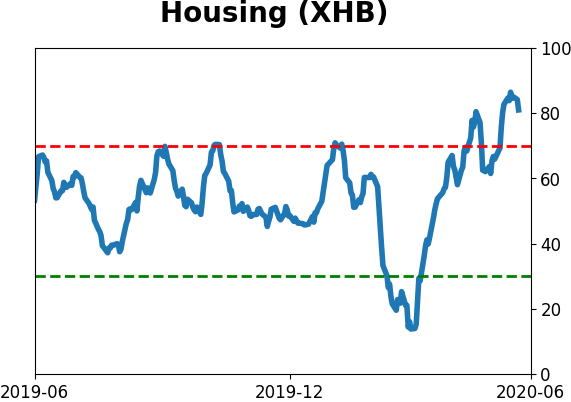
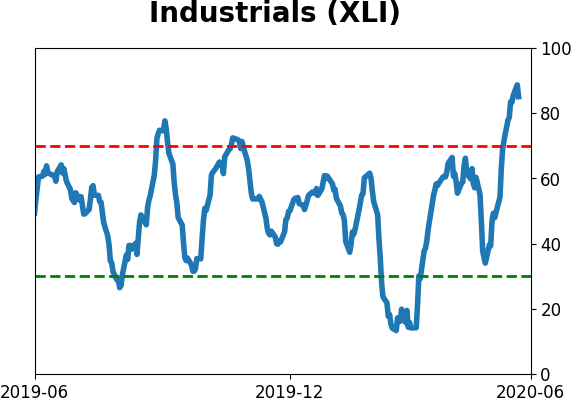
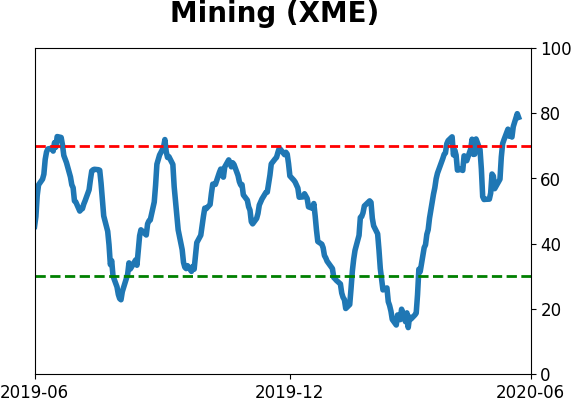
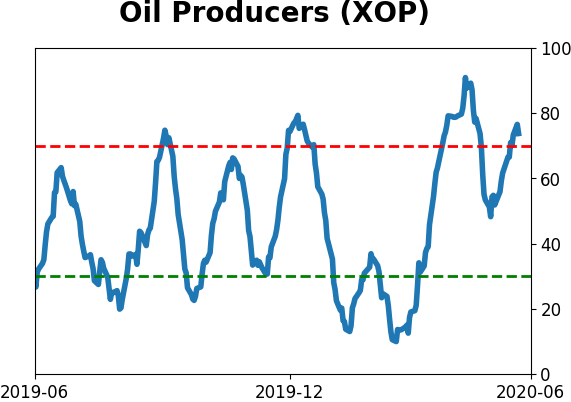
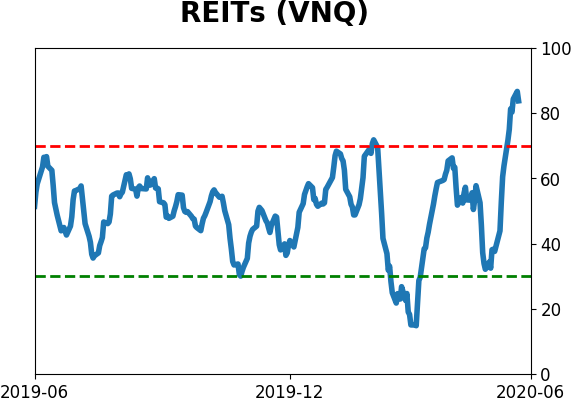
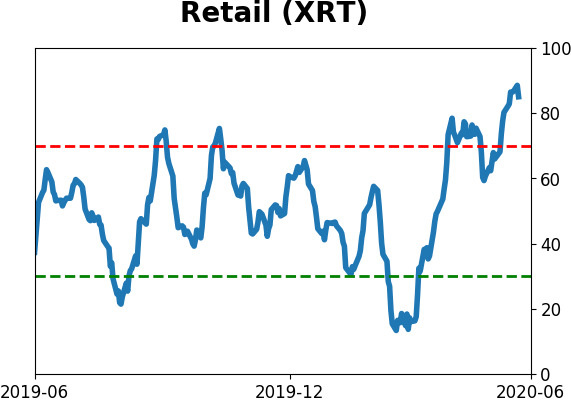
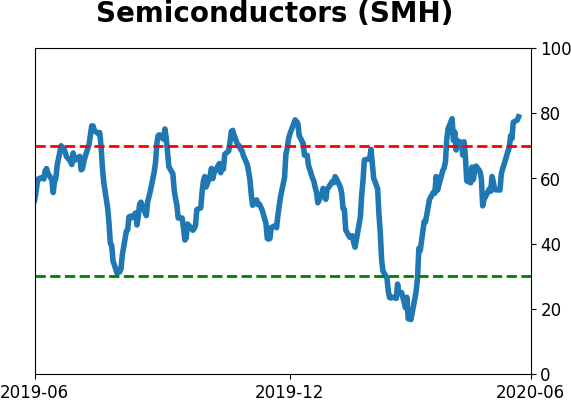
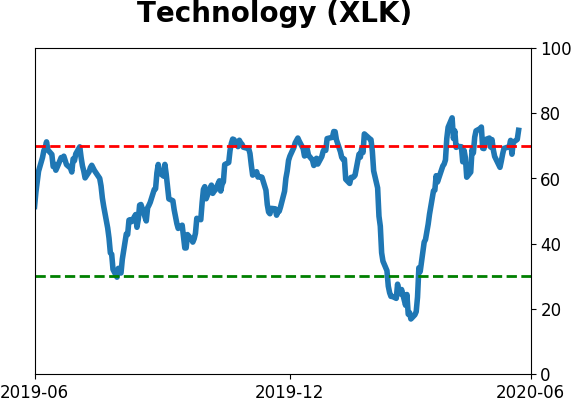
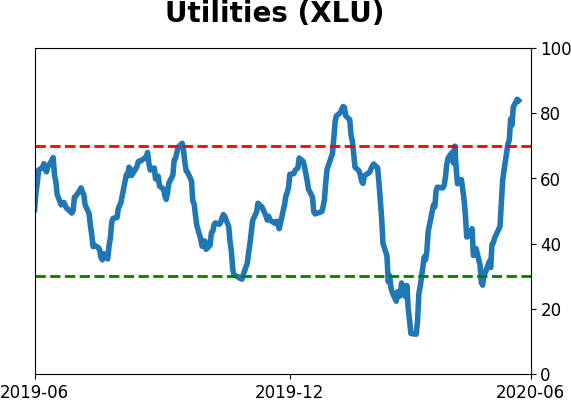
Sector ETF's - 10-Day Moving Average
|
|
|
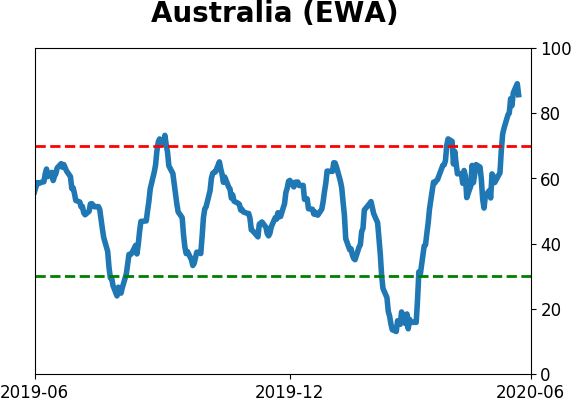
Country ETF's - 10-Day Moving Average
|
|
|
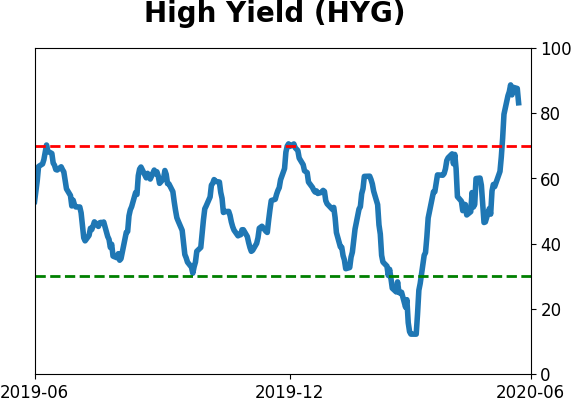
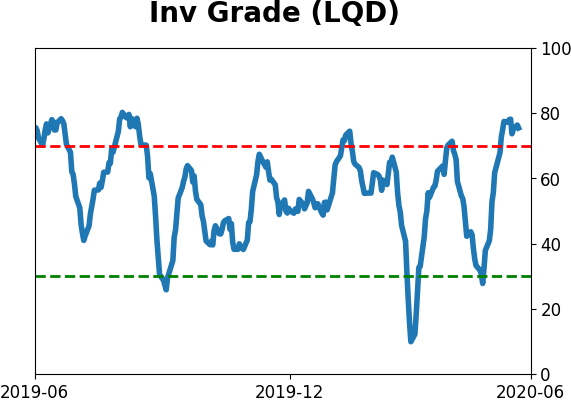
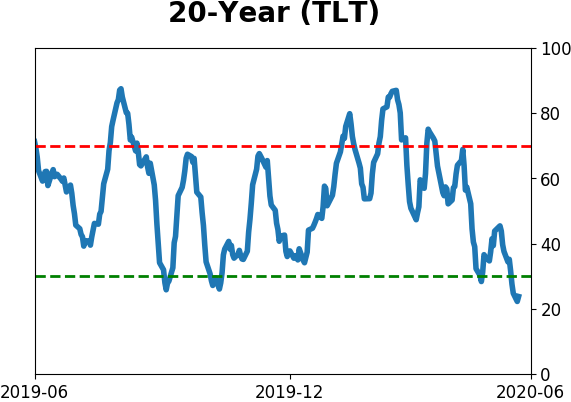
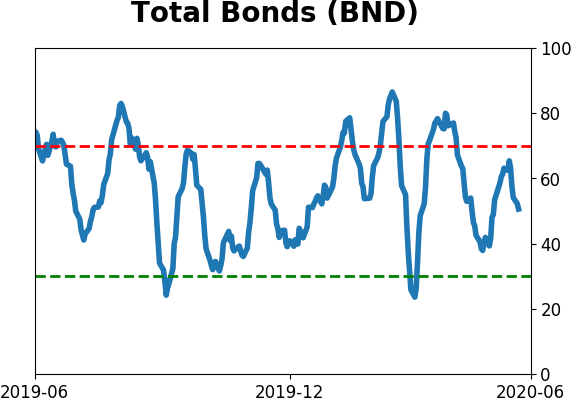
Bond ETF's - 10-Day Moving Average
|
|
|
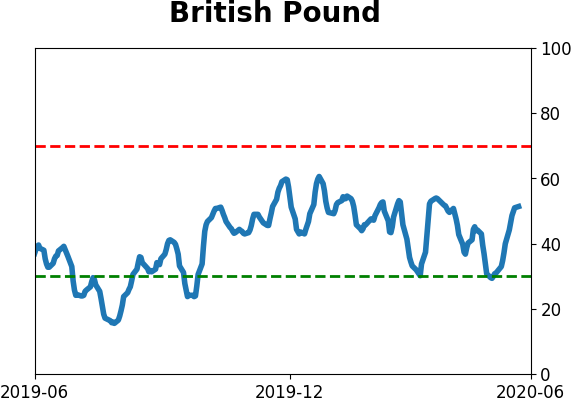
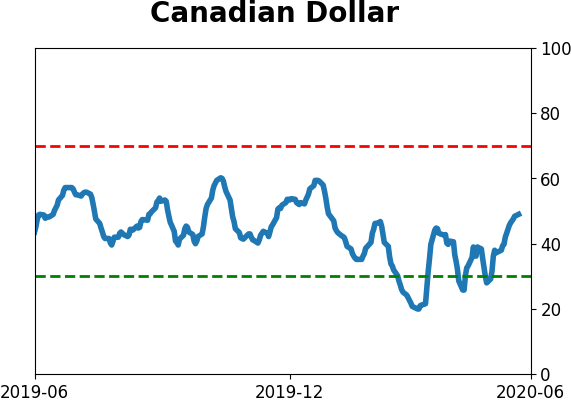
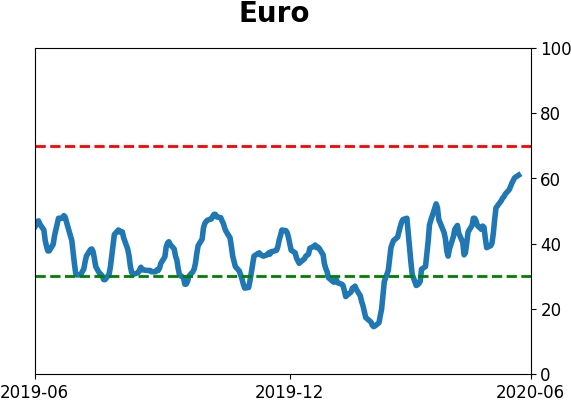
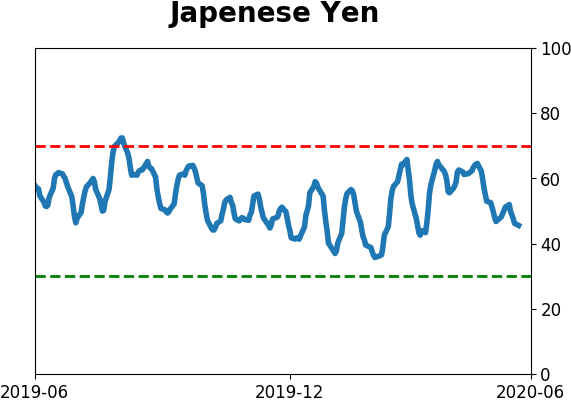
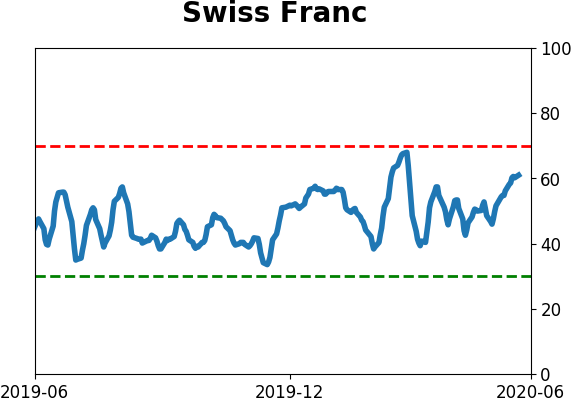
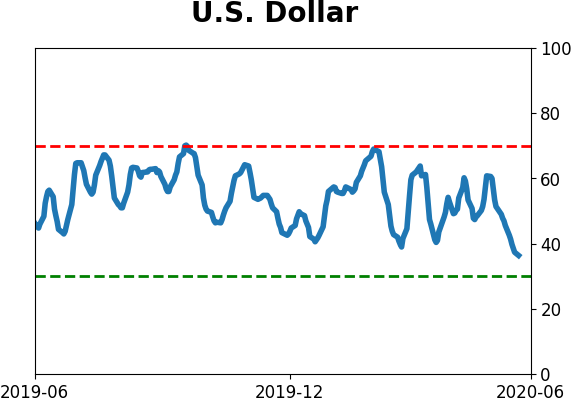
Currency ETF's - 5-Day Moving Average
|
|
|
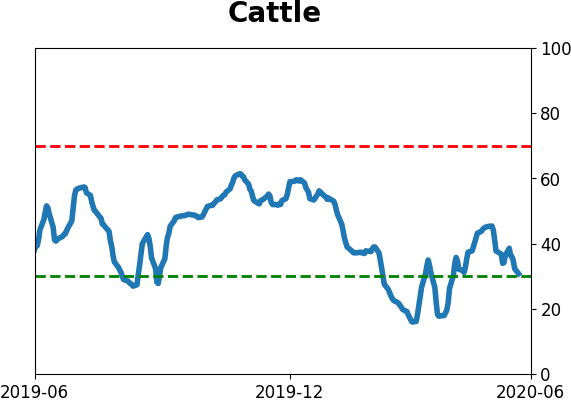
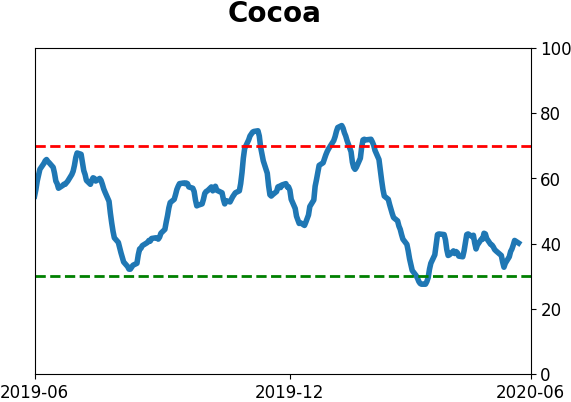
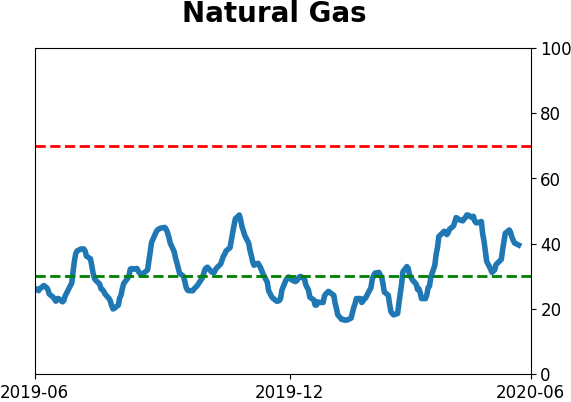
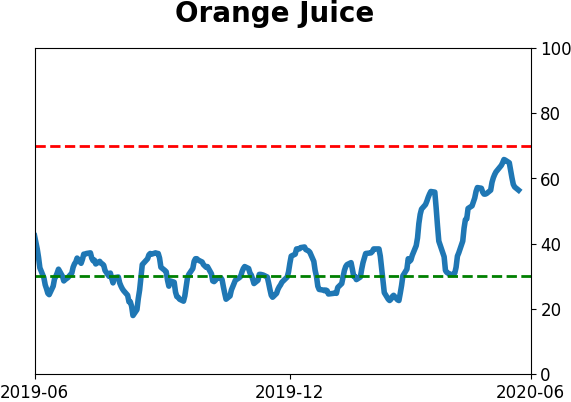
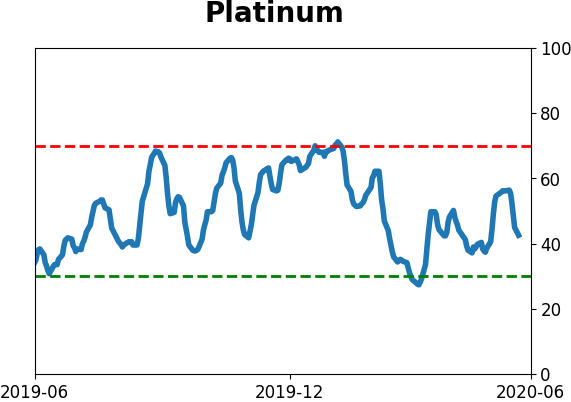
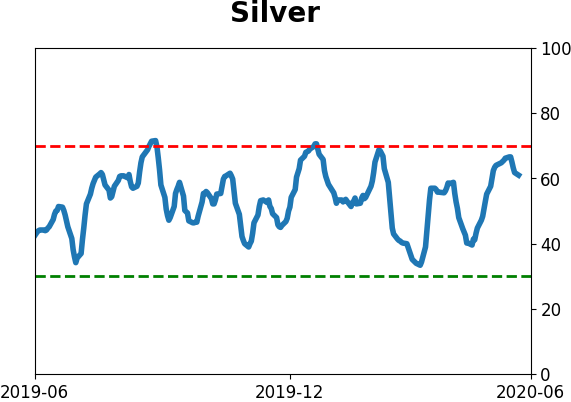
Commodity ETF's - 5-Day Moving Average
|
|