Headlines
|
|
Breadth has broken out:
The cumulative advance/decline line has made a new all-time high. This suggests that liquidity is plentiful and investors are interested in a broad cross-section of securities. It has been a generally good sign for stock indexes over the longer-term, especially over the past 30 years.
Options traders make stunning bets on rising prices:
Last week, options traders established record speculative positions in stocks and ETFs. It was especially egregious among the smallest of traders, who blew past any previous record of speculative activity. They bought a massive number of call options while buying relatively few puts.
The economy has officially peaked: The U.S. is "officially" in recession. According to the National Bureau of Economic Research (NBER), the business cycle peaked in February. No big surprise there. This is a conservative group, and by the time they declare a peak in the cycle, there has to be a lot of evidence that it has actually peaked. By the time they've declared a peak in the business cycle over the past 40 years, much of the decline in stocks has already been priced in. We'll have a more detailed look at factor and sector returns on Tuesday; for the S&P 500, it was higher a year after these declarations 4 out of 5 times by an average of 18.3%.
|
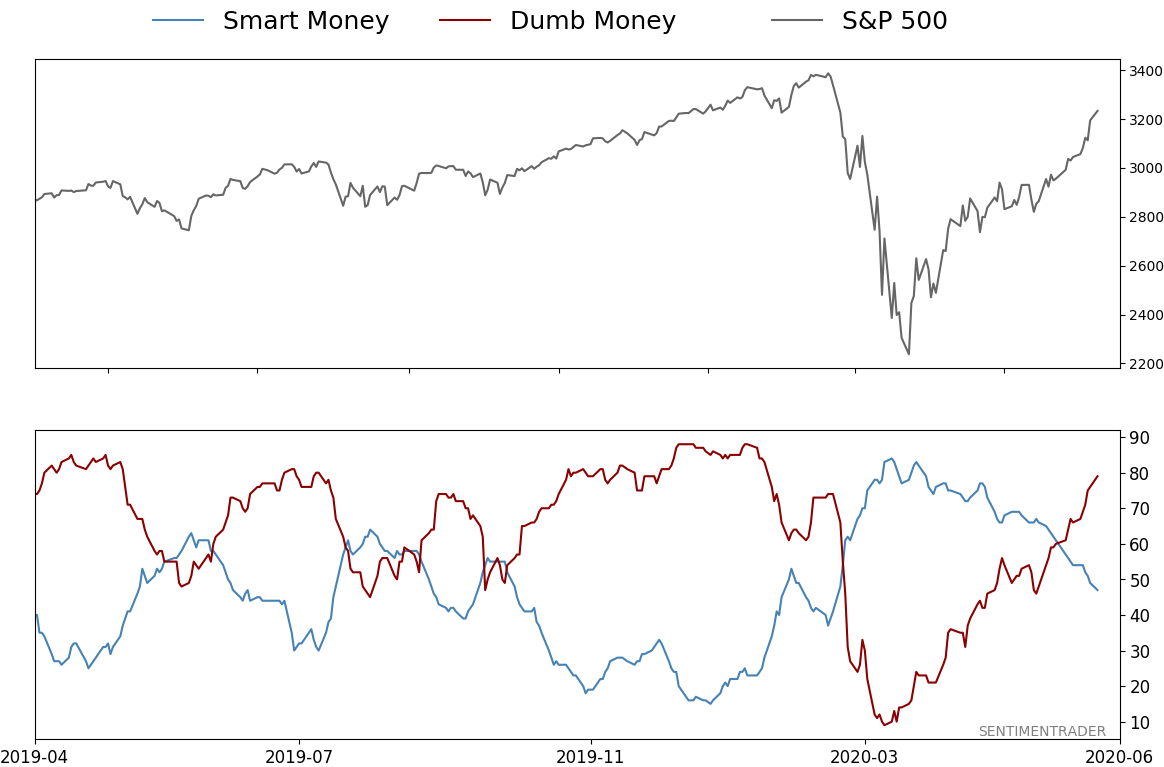
Smart / Dumb Money Confidence
|
Smart Money Confidence: 47%
Dumb Money Confidence: 79%
|
|
Risk Levels
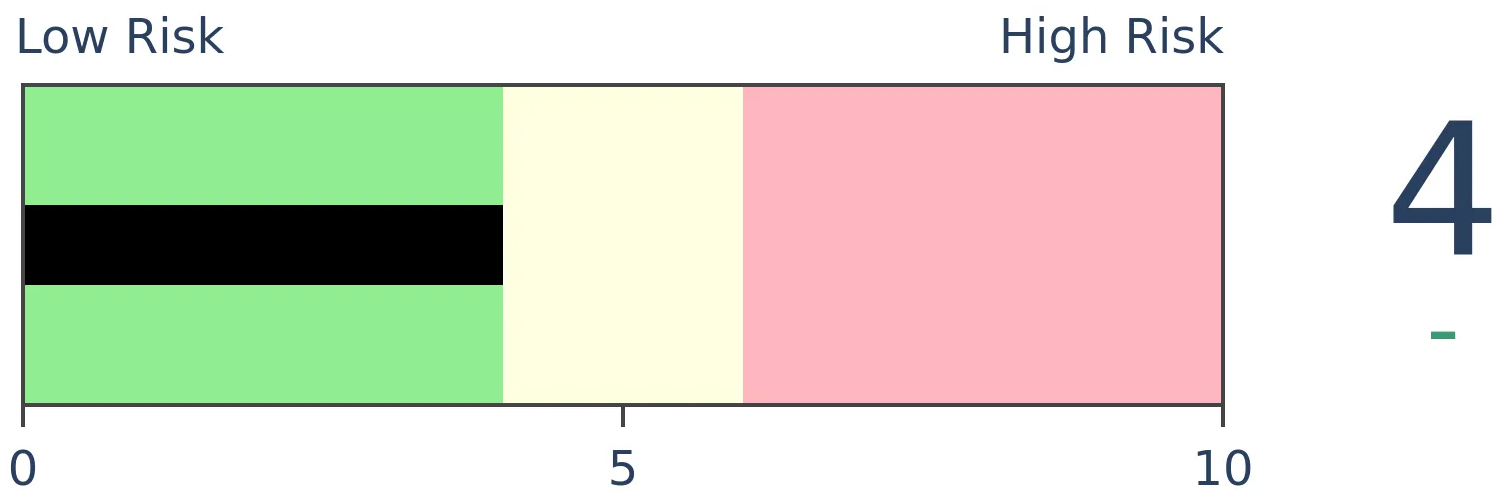
Stocks Short-Term
|
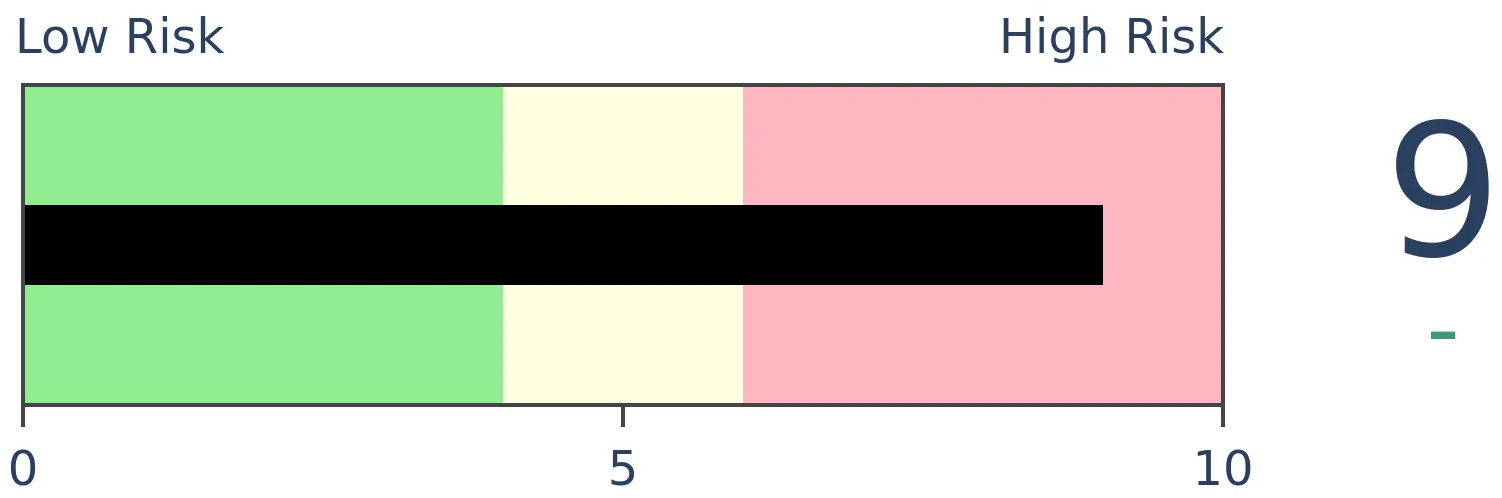
Stocks Medium-Term
|
|
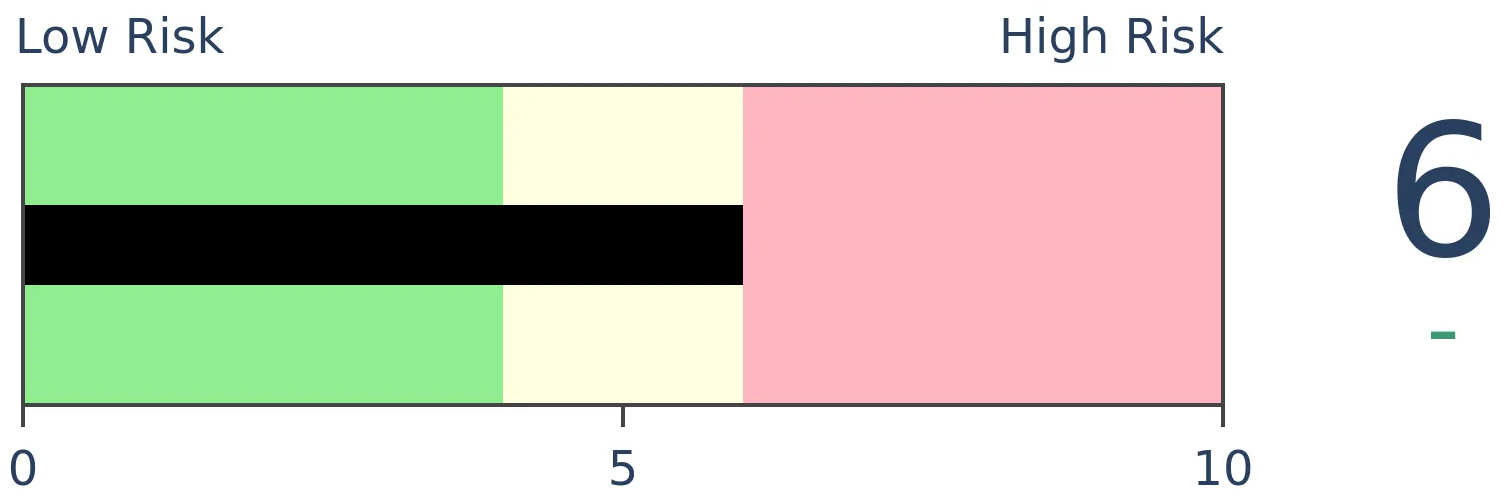
Bonds
|
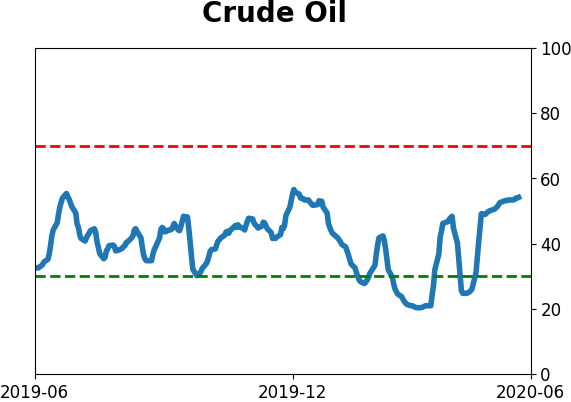
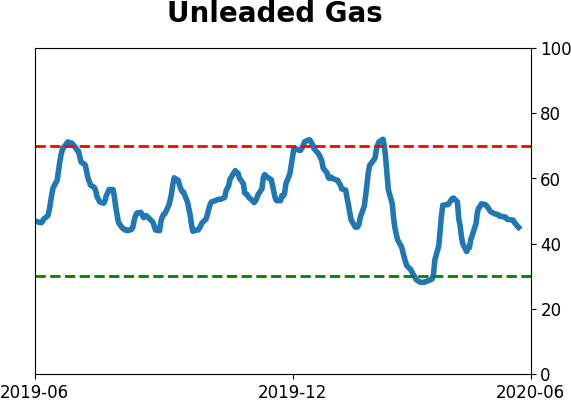
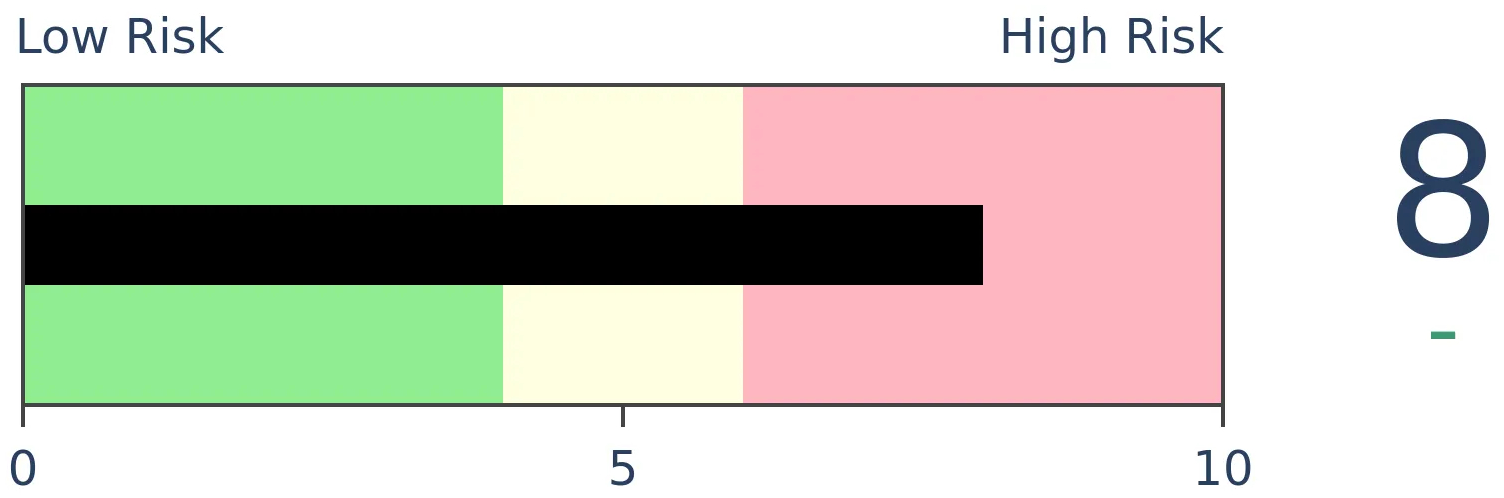
Crude Oil
|
|
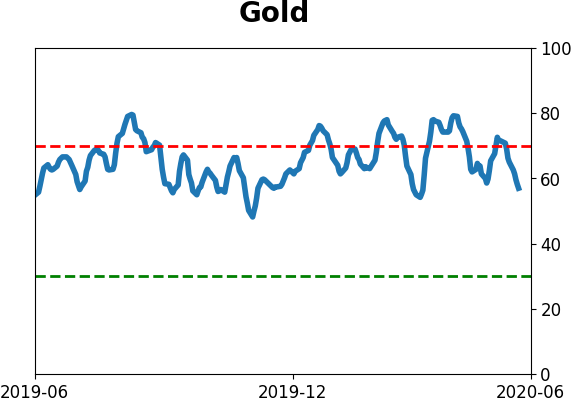
Gold

|
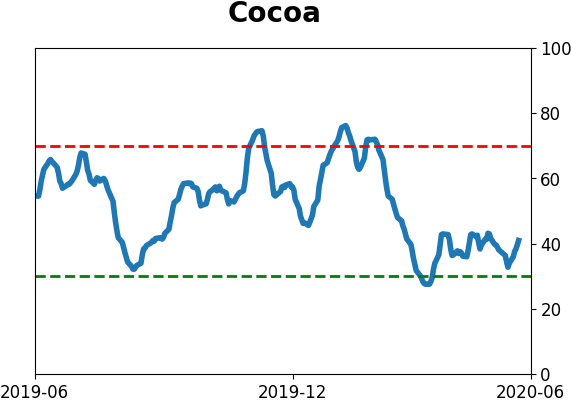
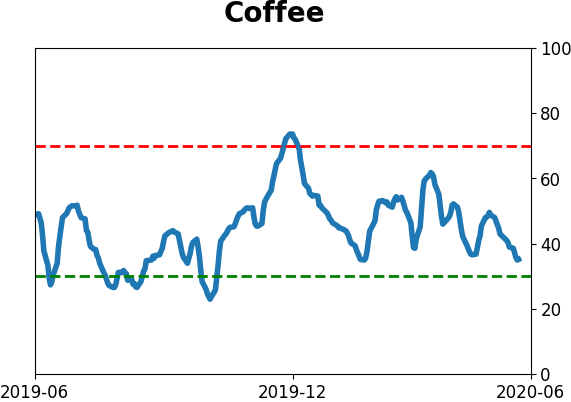
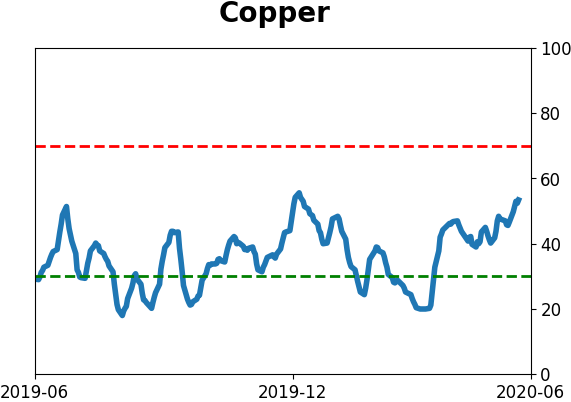
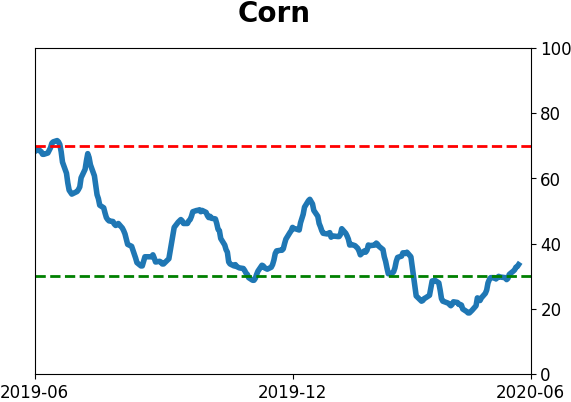
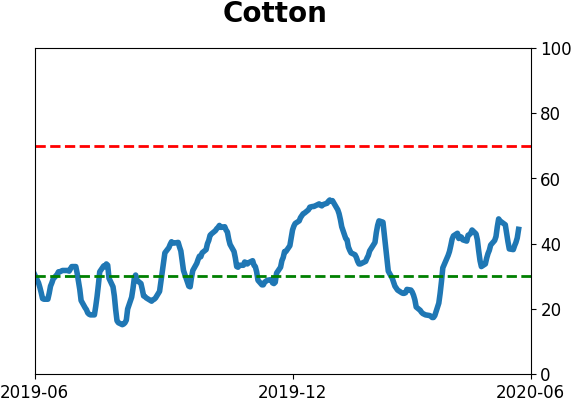
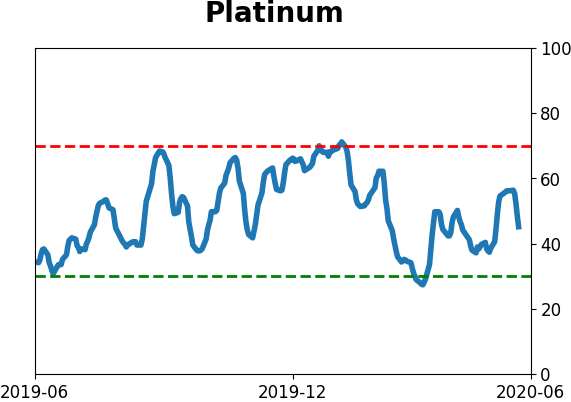
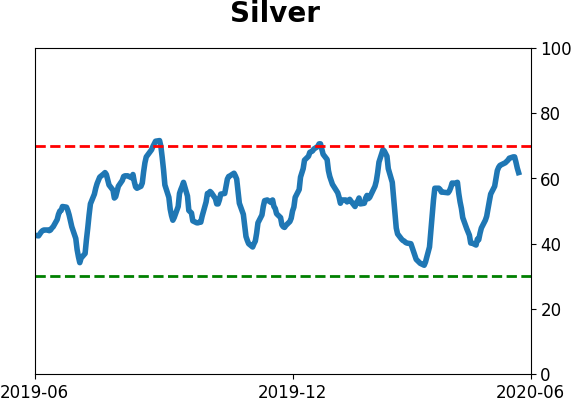
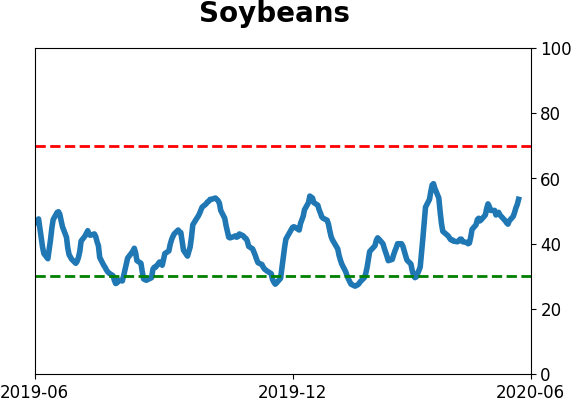
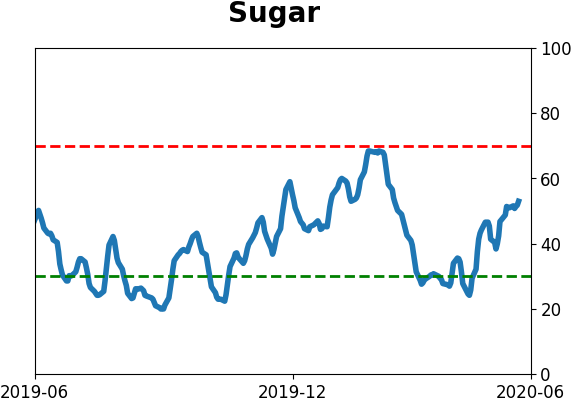
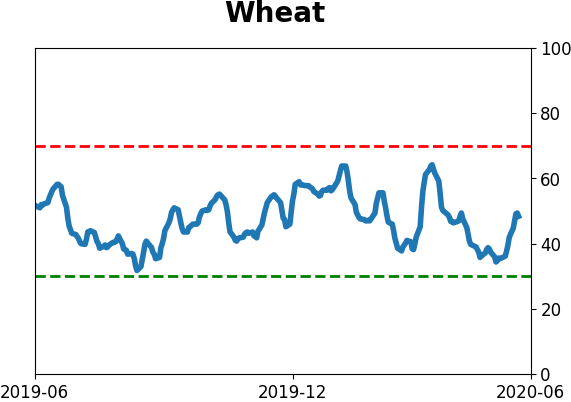
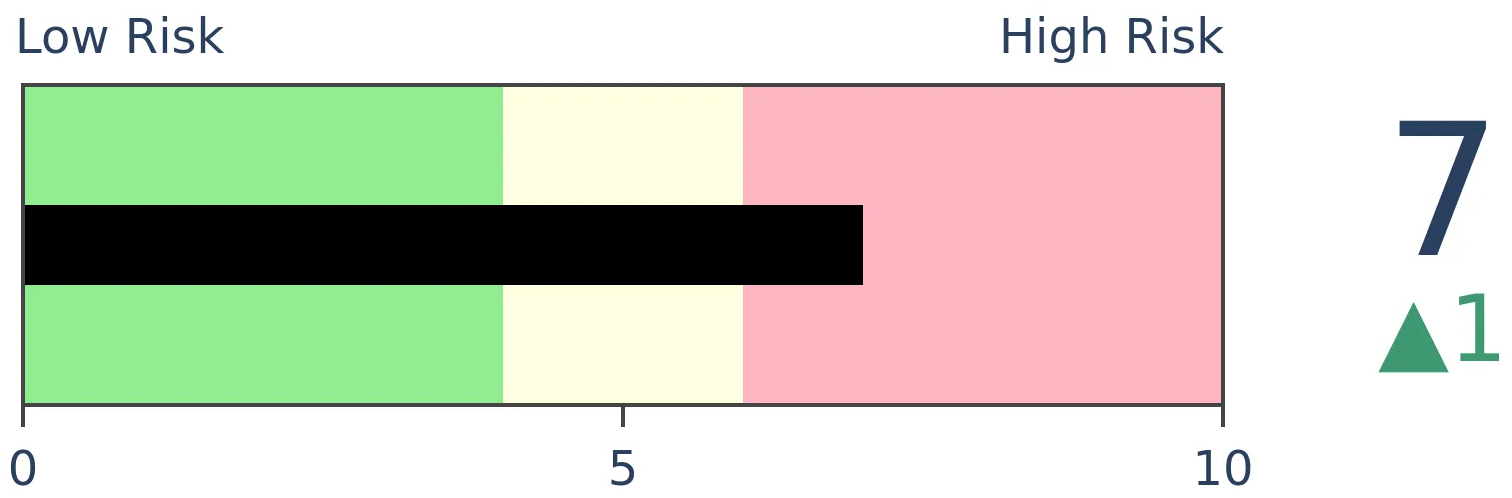
Agriculture
|
|
Research
BOTTOM LINE
The cumulative advance/decline line has made a new all-time high. This suggests that liquidity is plentiful and investors are interested in a broad cross-section of securities. It has been a generally good sign for stock indexes over the longer-term, especially over the past 30 years.
FORECAST / TIMEFRAME
None
|
The Cumulative Advance/Decline Line has made a new high.
Reflecting the breadth thrusts and recoveries we've been looking at in recent weeks, enough securities on the NYSE have advanced relative to those that declined that this commonly-cited version of the health of the market has never been higher.
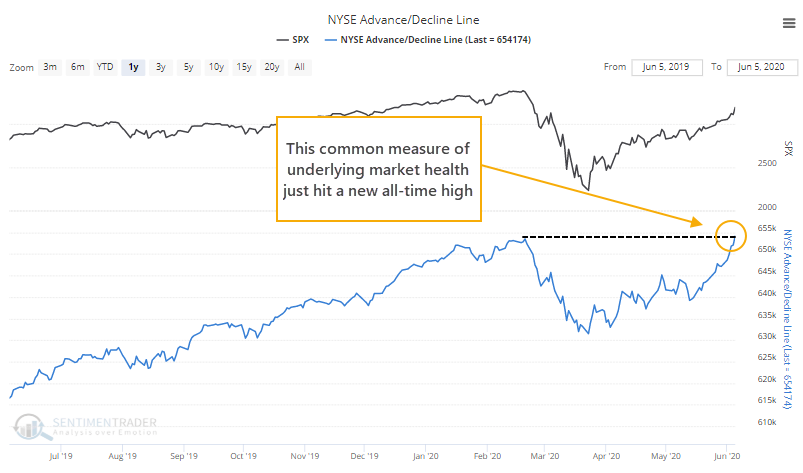
The advance/decline line is often considered to be a measure of liquidity, confidence, and sentiment. While some prefer a version that only monitors common stocks, we've always gravitated toward the one that includes everything that trades on the NYSE. It can be shaken if there are big moves in smaller stocks or those sensitive to interest rates, but that's more like a feature rather than a bug. Aberrant behavior in those sensitive stocks often gives a good heads-up to risks (or rewards) in the broader universe of common stocks.
When the A/D Line has made a new high for the first time in months, following at least a moderate drawdown, it has been mostly a good sign.
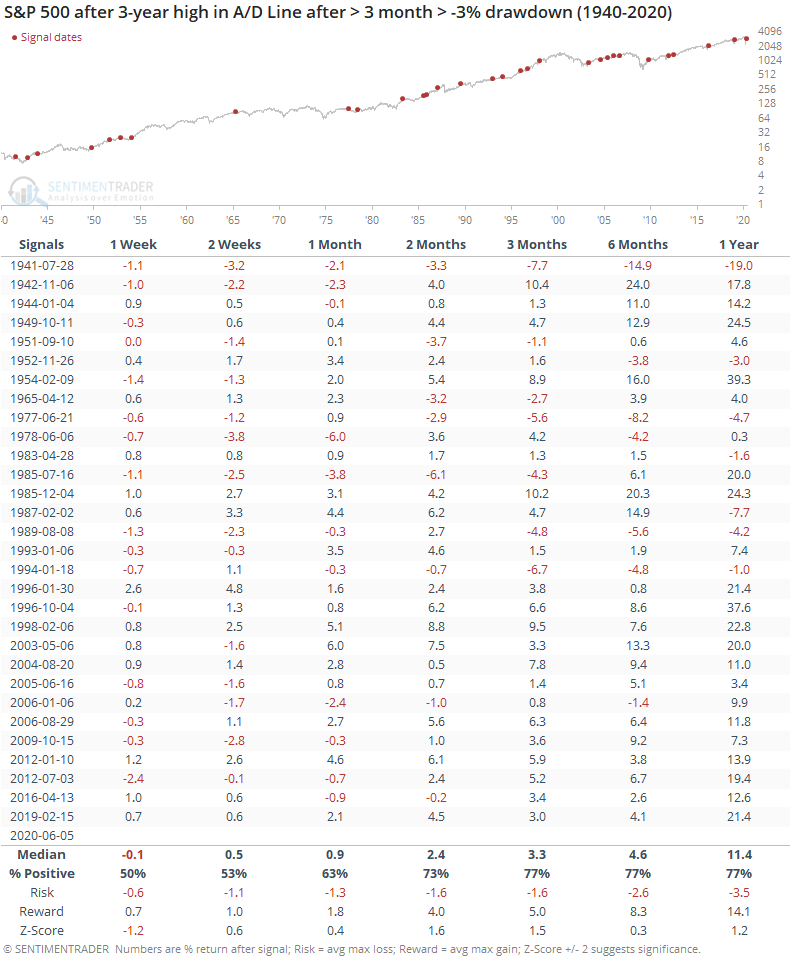
Most of the negative returns triggered in earlier decades. It has been a much better sign over the past 30 years.
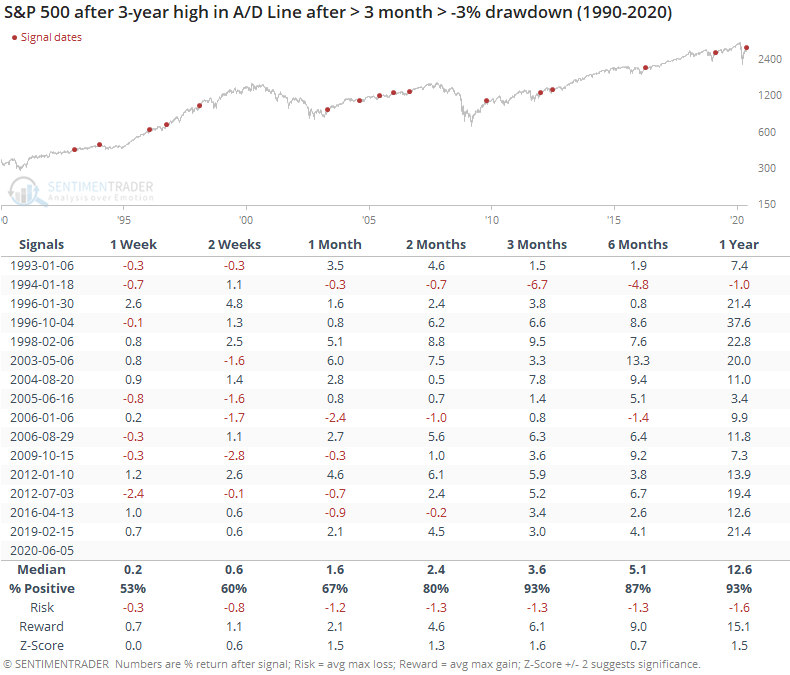
Since 1990, there have been only isolated losses, and even those were relatively small. The risk/reward skew during the next 2-12 months was impressively positive.
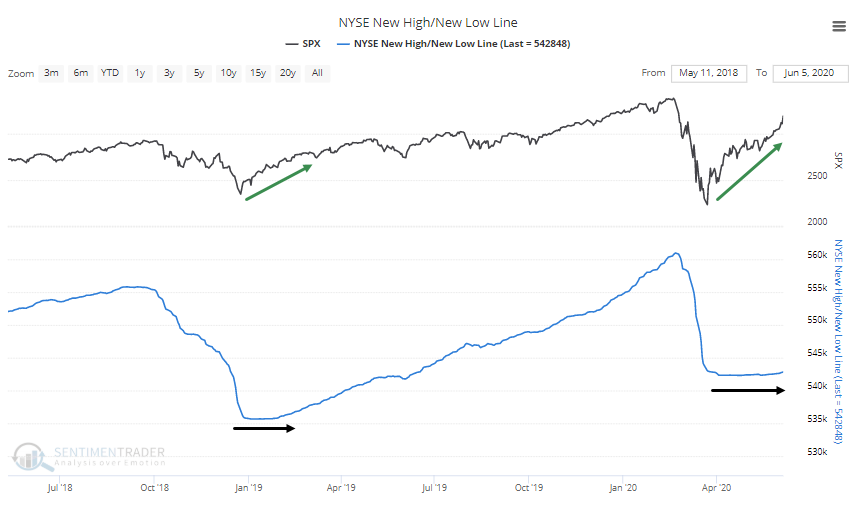
The cumulative line we calculate that uses the net number of 52-week highs and lows on the NYSE has barely budged. This seems like an issue, but because new lows were so overwhelming during the decline, it's going to take some time before that curls up in any meaningful way. The same thing happened in 2019, and 2009 before that.
Among sector and index ETFs, most of the Cumulative Advance/Decline Lines are at or near new highs, further supporting the view that it's been a broad rally.
Like the other breadth signs we've discussed, really since late March, there is little here to support any kind of bearish argument. A rising tide like this is very difficult to fight, and while signs of speculative excess on shorter time frames is a definite worry, these signs of broad-based recovery continue to be major longer-term support.
BOTTOM LINE
Last week, options traders established record speculative positions in stocks and ETFs. It was especially egregious among the smallest of traders, who blew past any previous record of speculative activity. They bought a massive number of call options while buying relatively few puts.
FORECAST / TIMEFRAME
SPY -- Down, Medium-Term
|
Small traders are pushing their luck in a major way.
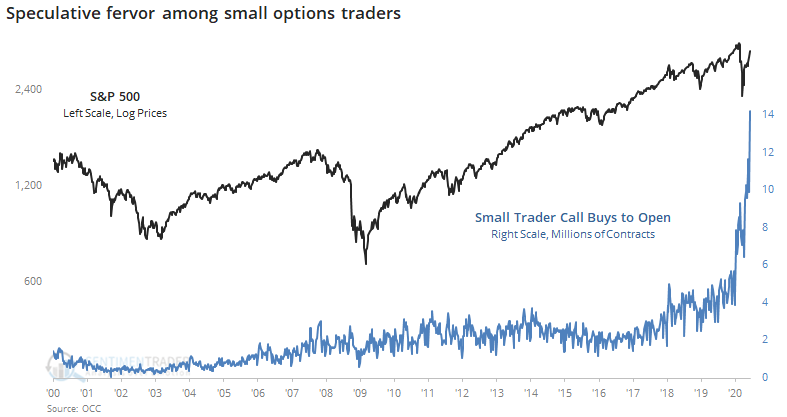
Several times in recent weeks, we've looked at the behavior of the smallest of options traders, and how they were establishing positions that rivaled some of their most speculative in at least 20 years. The steady rally has only boldened their views, and they're pushing their positions even more.
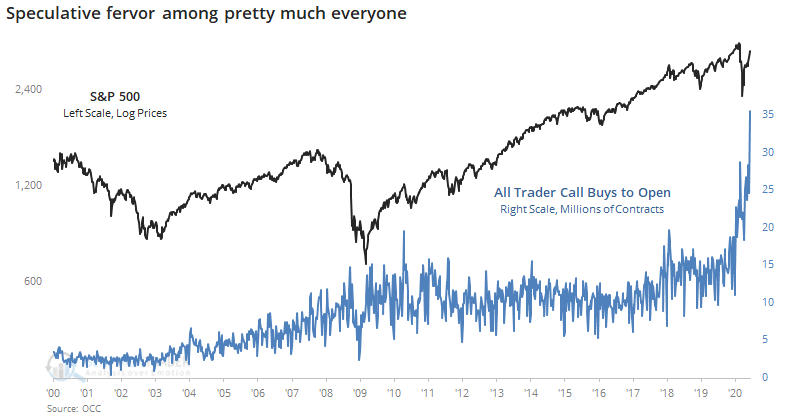
At the peak of speculative fervor in February, the smallest of traders, with volume of 10 contracts or less, bought to open 7.5 million call options on equities. This past week, they blew past that by buying a stunning 12.1 million contracts. If we include ETFs in the figures, then it's about the same scale, jumping from 9.3 million call buys in February to 14.2 million contracts last week.
It's not just small traders. Pretty much everyone wants in on the party. Including all sizes of traders, speculative call buying jumped to 35.6 million contracts last week from a peak of 28.7 million in February.
A completely fair question to ask is, "What about puts?" If traders are buying a lot of speculative calls, but also buying a lot of protective puts as a hedge, then maybe their overall position isn't that optimistic. That's not the case, in fact it becomes even more egregious.
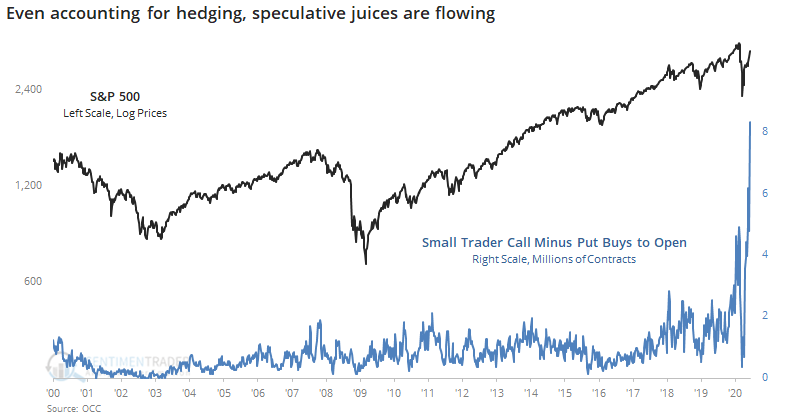
Last week, they bought 14.2 million calls and 5.9 million puts for a net 8.3 million contracts. We can see how much more speculative this is than other times in the past 20 years.
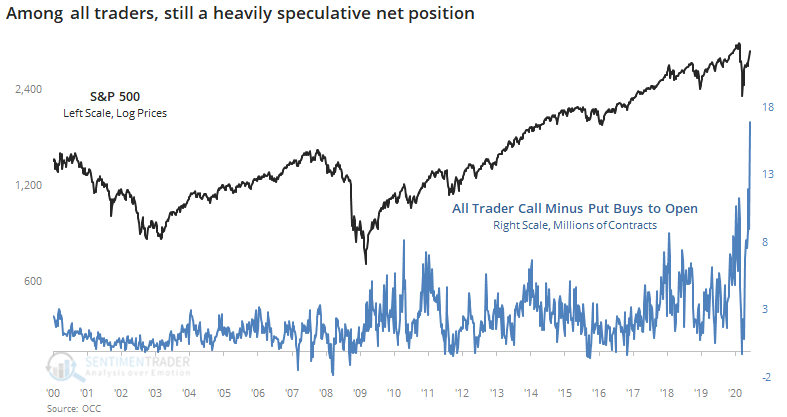
Among all traders, we can still see a dramatic shift toward speculation last week.
If we look at percentages instead of the absolute number of contracts traded, then we can see that small trader call buying made up more than 50% of their total volume. That's only been exceeded by a few weeks in the year 2000. The Backtest Engine shows that even when it's 45% or higher, forward returns were very poor.
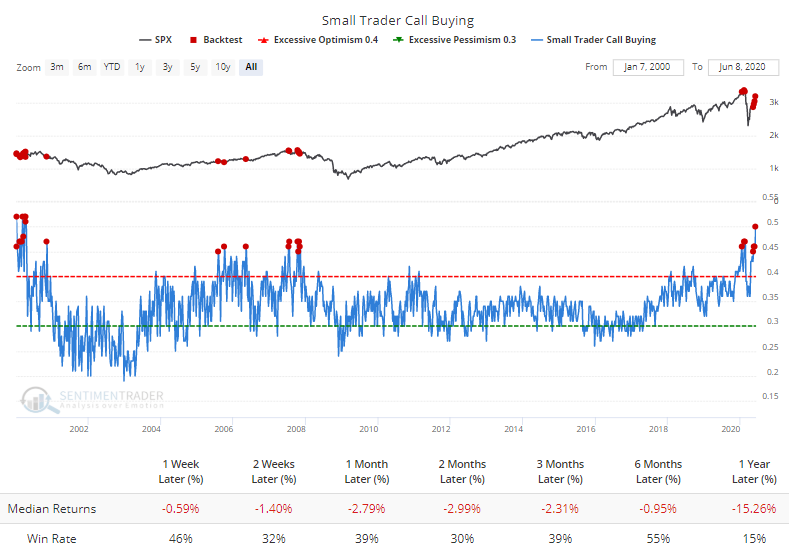
Overall options activity shows that traders spent 47% more volume on speculative strategies than hedging strategies, among the most ever. Again, forward returns were poor with few precedents.
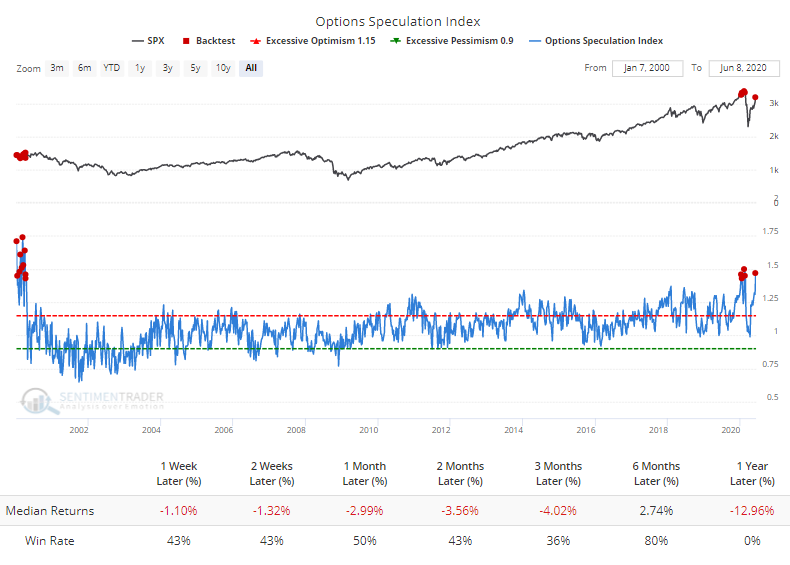
This kind of activity has a strong tendency to lead to negative returns in the S&P 500 and other indexes over a multi-week to multi-month time frame. That was the case even a couple of weeks ago, and yet here we are, so there has been no impact yet.
And there are other factors, like the recovery and thrusts among most stocks. That can't be ignored, especially on a longer time frame. On a shorter time frame, though, it seems increasingly risky to try to chase this rally along with traders who have traditionally been extremely reliable contrary indicators.
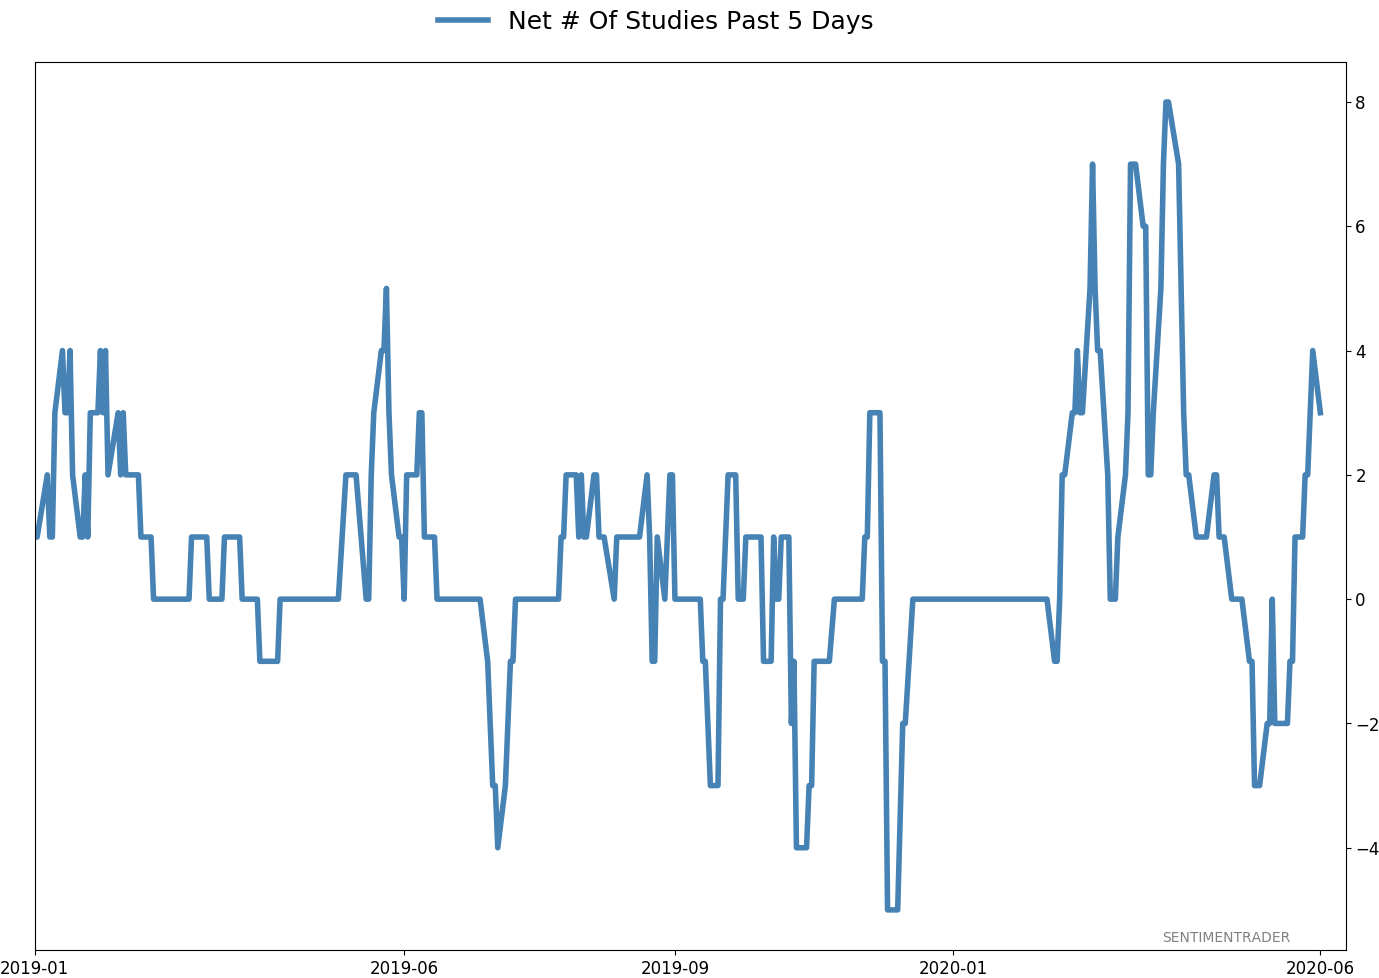
Active Studies
| Time Frame | Bullish | Bearish | | Short-Term | 0 | 1 | | Medium-Term | 8 | 5 | | Long-Term | 39 | 1 |
|
Indicators at Extremes
Portfolio
| Position | Weight % | Added / Reduced | Date | | Stocks | 38.9 | Reduced 10% | 2020-05-13 | | Bonds | 0.0 | Reduced 6.7% | 2020-02-28 | | Commodities | 5.1 | Added 2.4%
| 2020-02-28 | | Precious Metals | 0.0 | Reduced 3.6% | 2020-02-28 | | Special Situations | 0.0 | Reduced 31.9% | 2020-03-17 | | Cash | 56.0 | | |
|
Updates (Changes made today are underlined)
In the first months of the year, we saw manic trading activity. From big jumps in specific stocks to historic highs in retail trading activity to record highs in household confidence to almost unbelievable confidence among options traders. All of that came amid a market where the average stock couldn't keep up with their indexes. There were signs of waning momentum in stocks underlying the major averages, which started triggering technical warning signs in late January. The kinds of extremes we saw in December and January typically take months to wear away, but the type of selling in March went a long way toward getting there. When we place the kind of moves we saw into March 23 into the context of coming off an all-time high, there has been a high probability of a multi-month rebound. After stocks bottomed on the 23rd, they enjoyed a historic buying thrust and retraced a larger amount of the decline than "just a bear market rally" tends to. Those thrusts are the most encouraging sign we've seen in years. Even through early June, we're still seeing thrusts that have led to recoveries in longer-term breadth metrics. By early May, we were seeing some troubling signs of shorter-term speculation, and buyers have run right over those. This is what bull markets do. In bear markets, they don't get a chance, as sellers tend to come in as soon as sentiment moves to neutral or slightly optimistic. That didn't happen this time, and the rally has gone way further, and way longer, than "just a bear market rally" does. I am the world's worst momentum trader, and this is one of the most anguishing kinds of markets for me. I detest chasing prices higher, especially in the face of readings like high Dumb Money Confidence and small trader call buying. I recognize the overwhelming positives of the recoveries noted above, and it's impossible to ignore the medium- to long-term positive implications. I'm holding out on adding exposure for now, based on the negatives that have been generated (and so far failed), at the risk of falling further behind a new roaring bull market.
RETURN YTD: -4.3% 2019: 12.6%, 2018: 0.6%, 2017: 3.8%, 2016: 17.1%, 2015: 9.2%, 2014: 14.5%, 2013: 2.2%, 2012: 10.8%, 2011: 16.5%, 2010: 15.3%, 2009: 23.9%, 2008: 16.2%, 2007: 7.8%
|
|
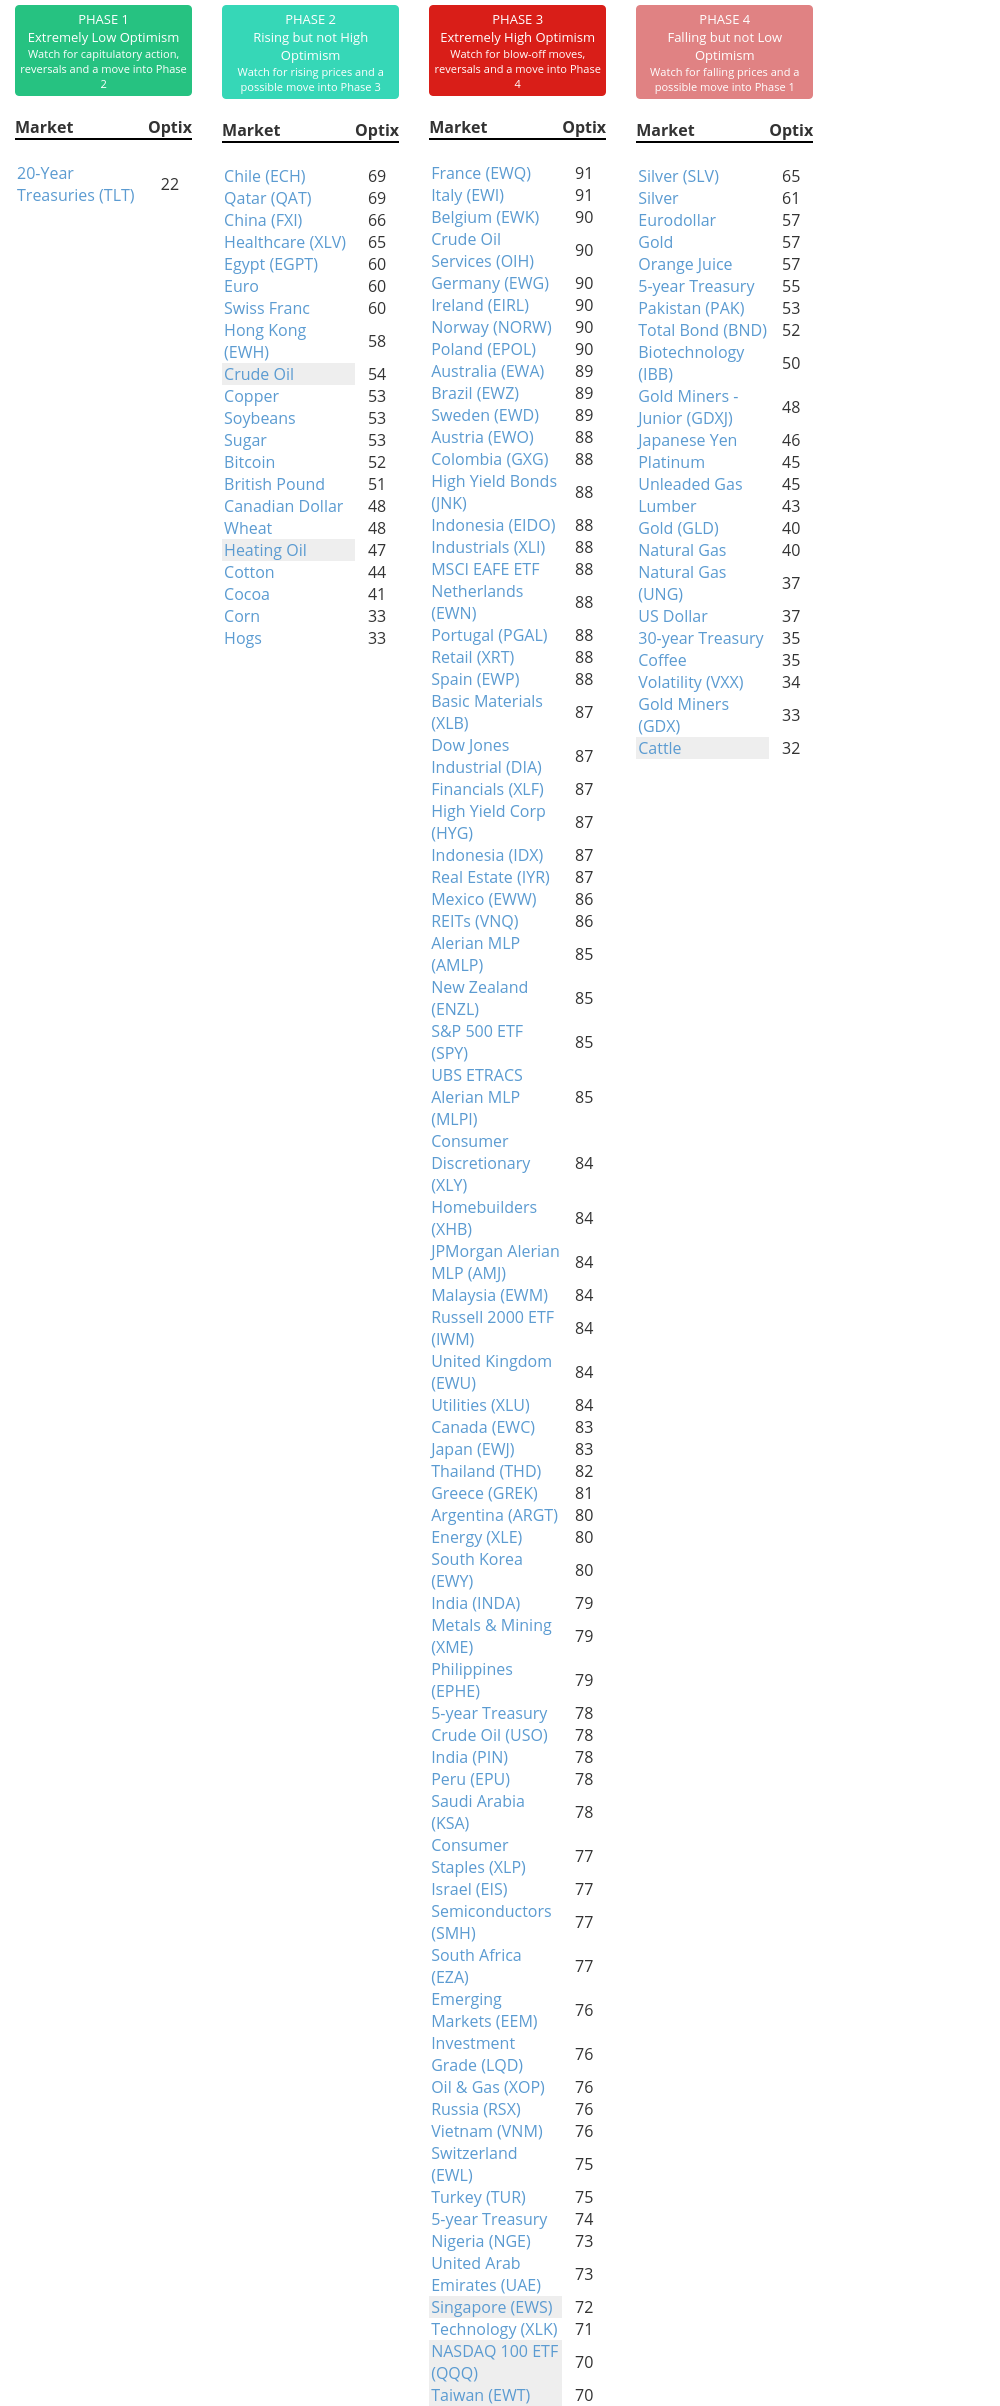
Phase Table
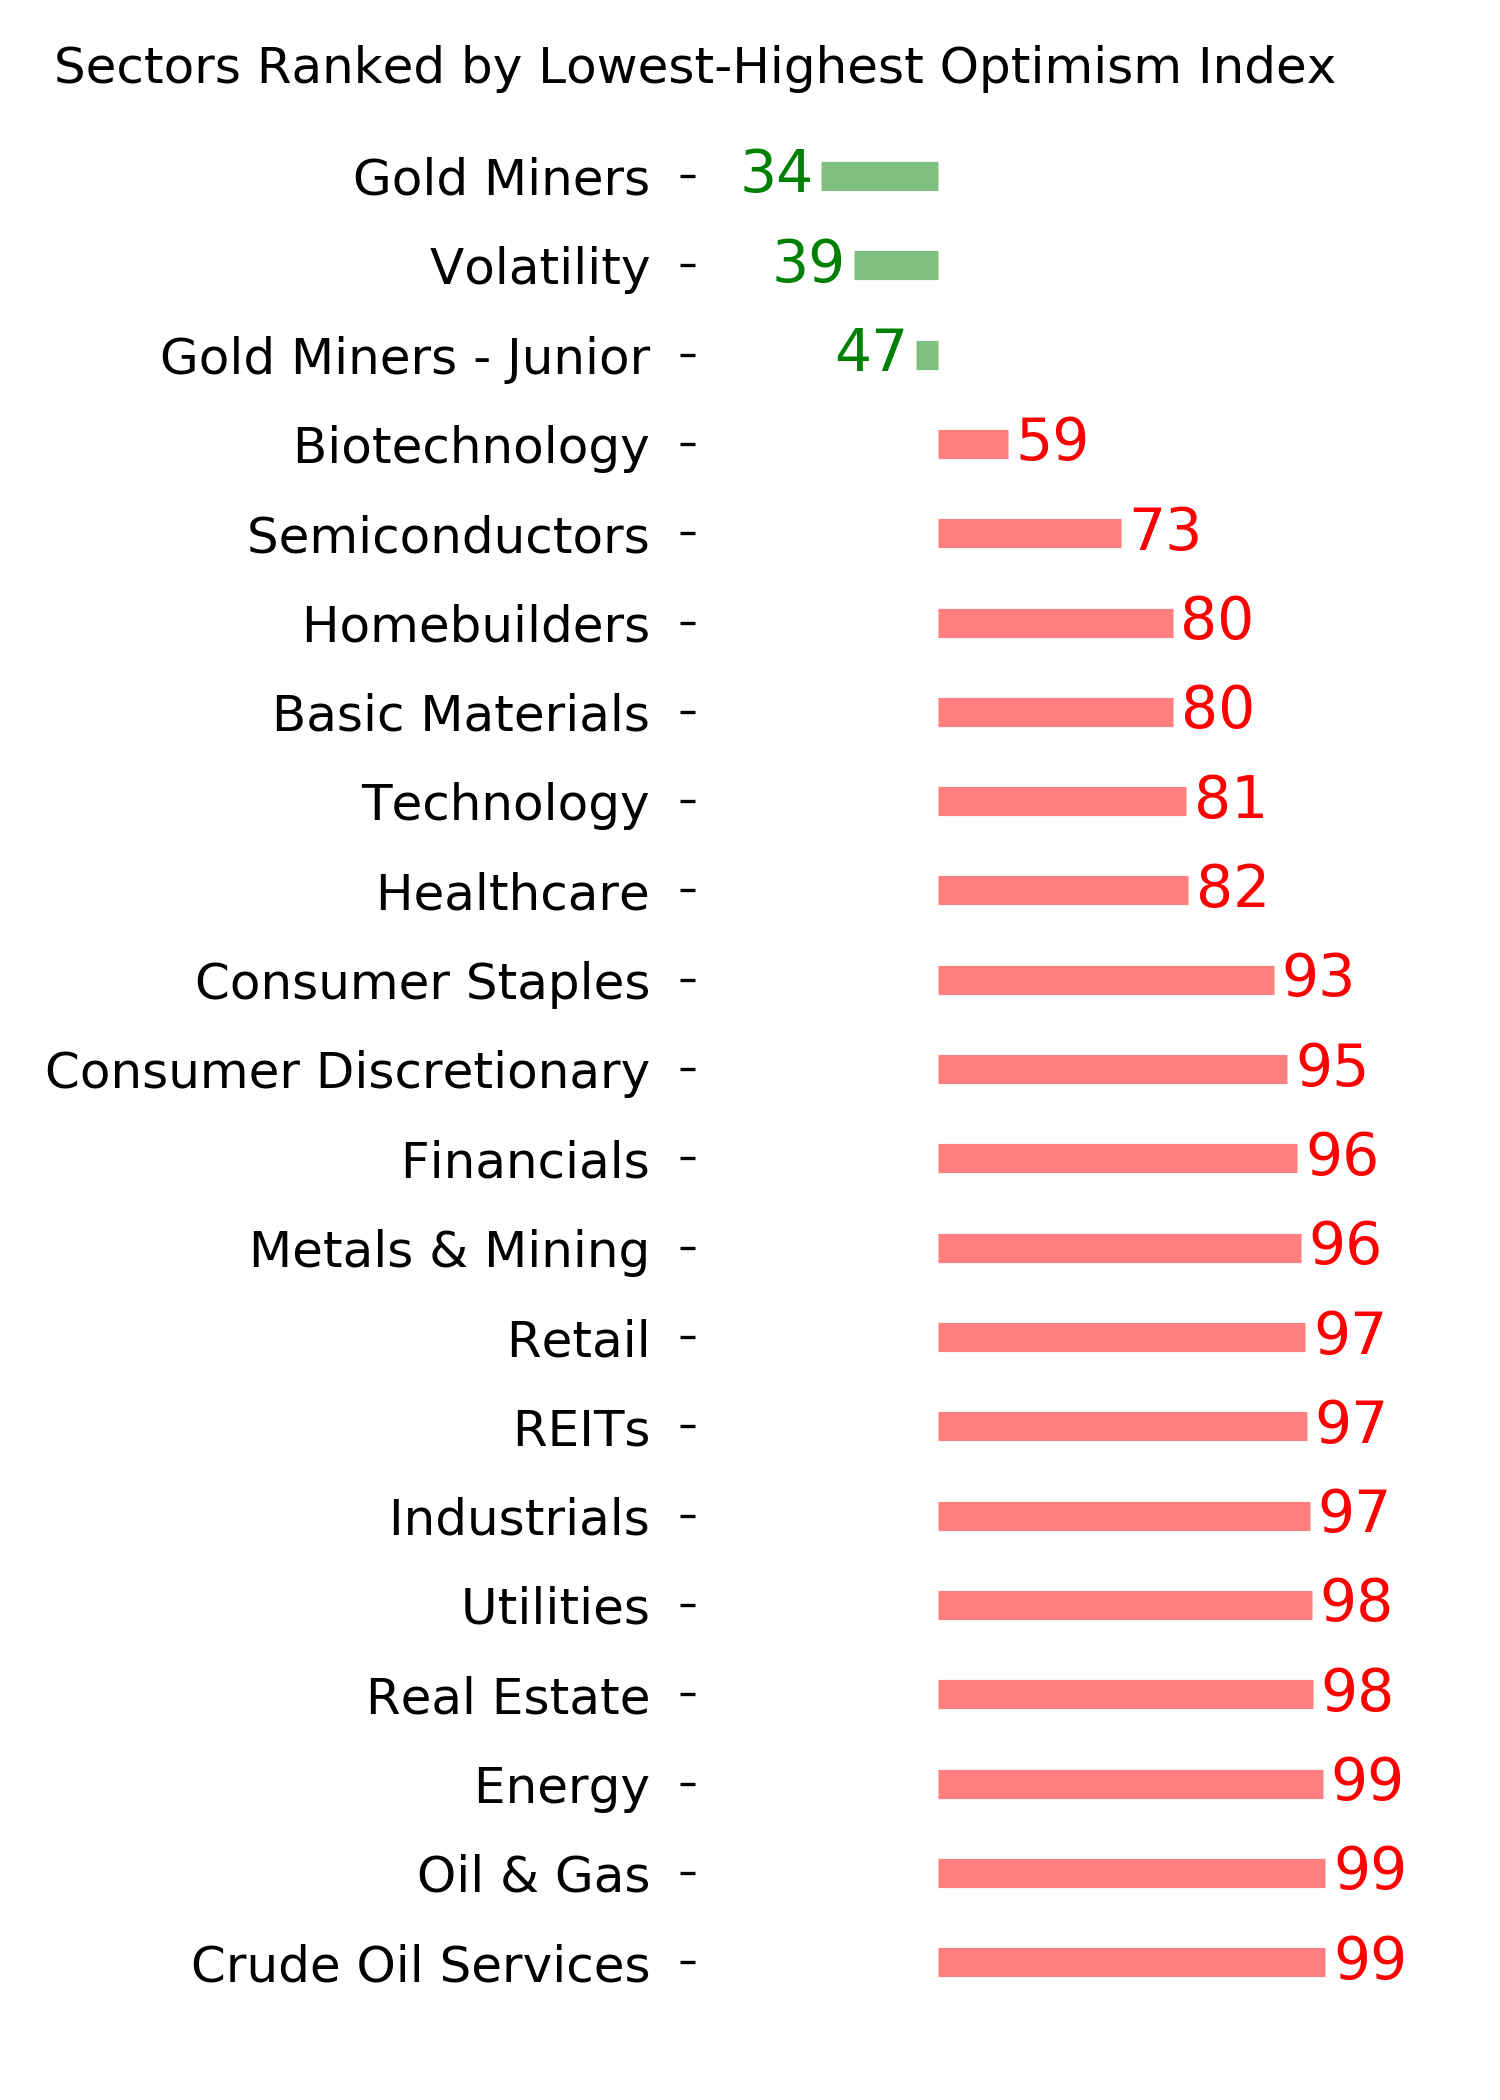
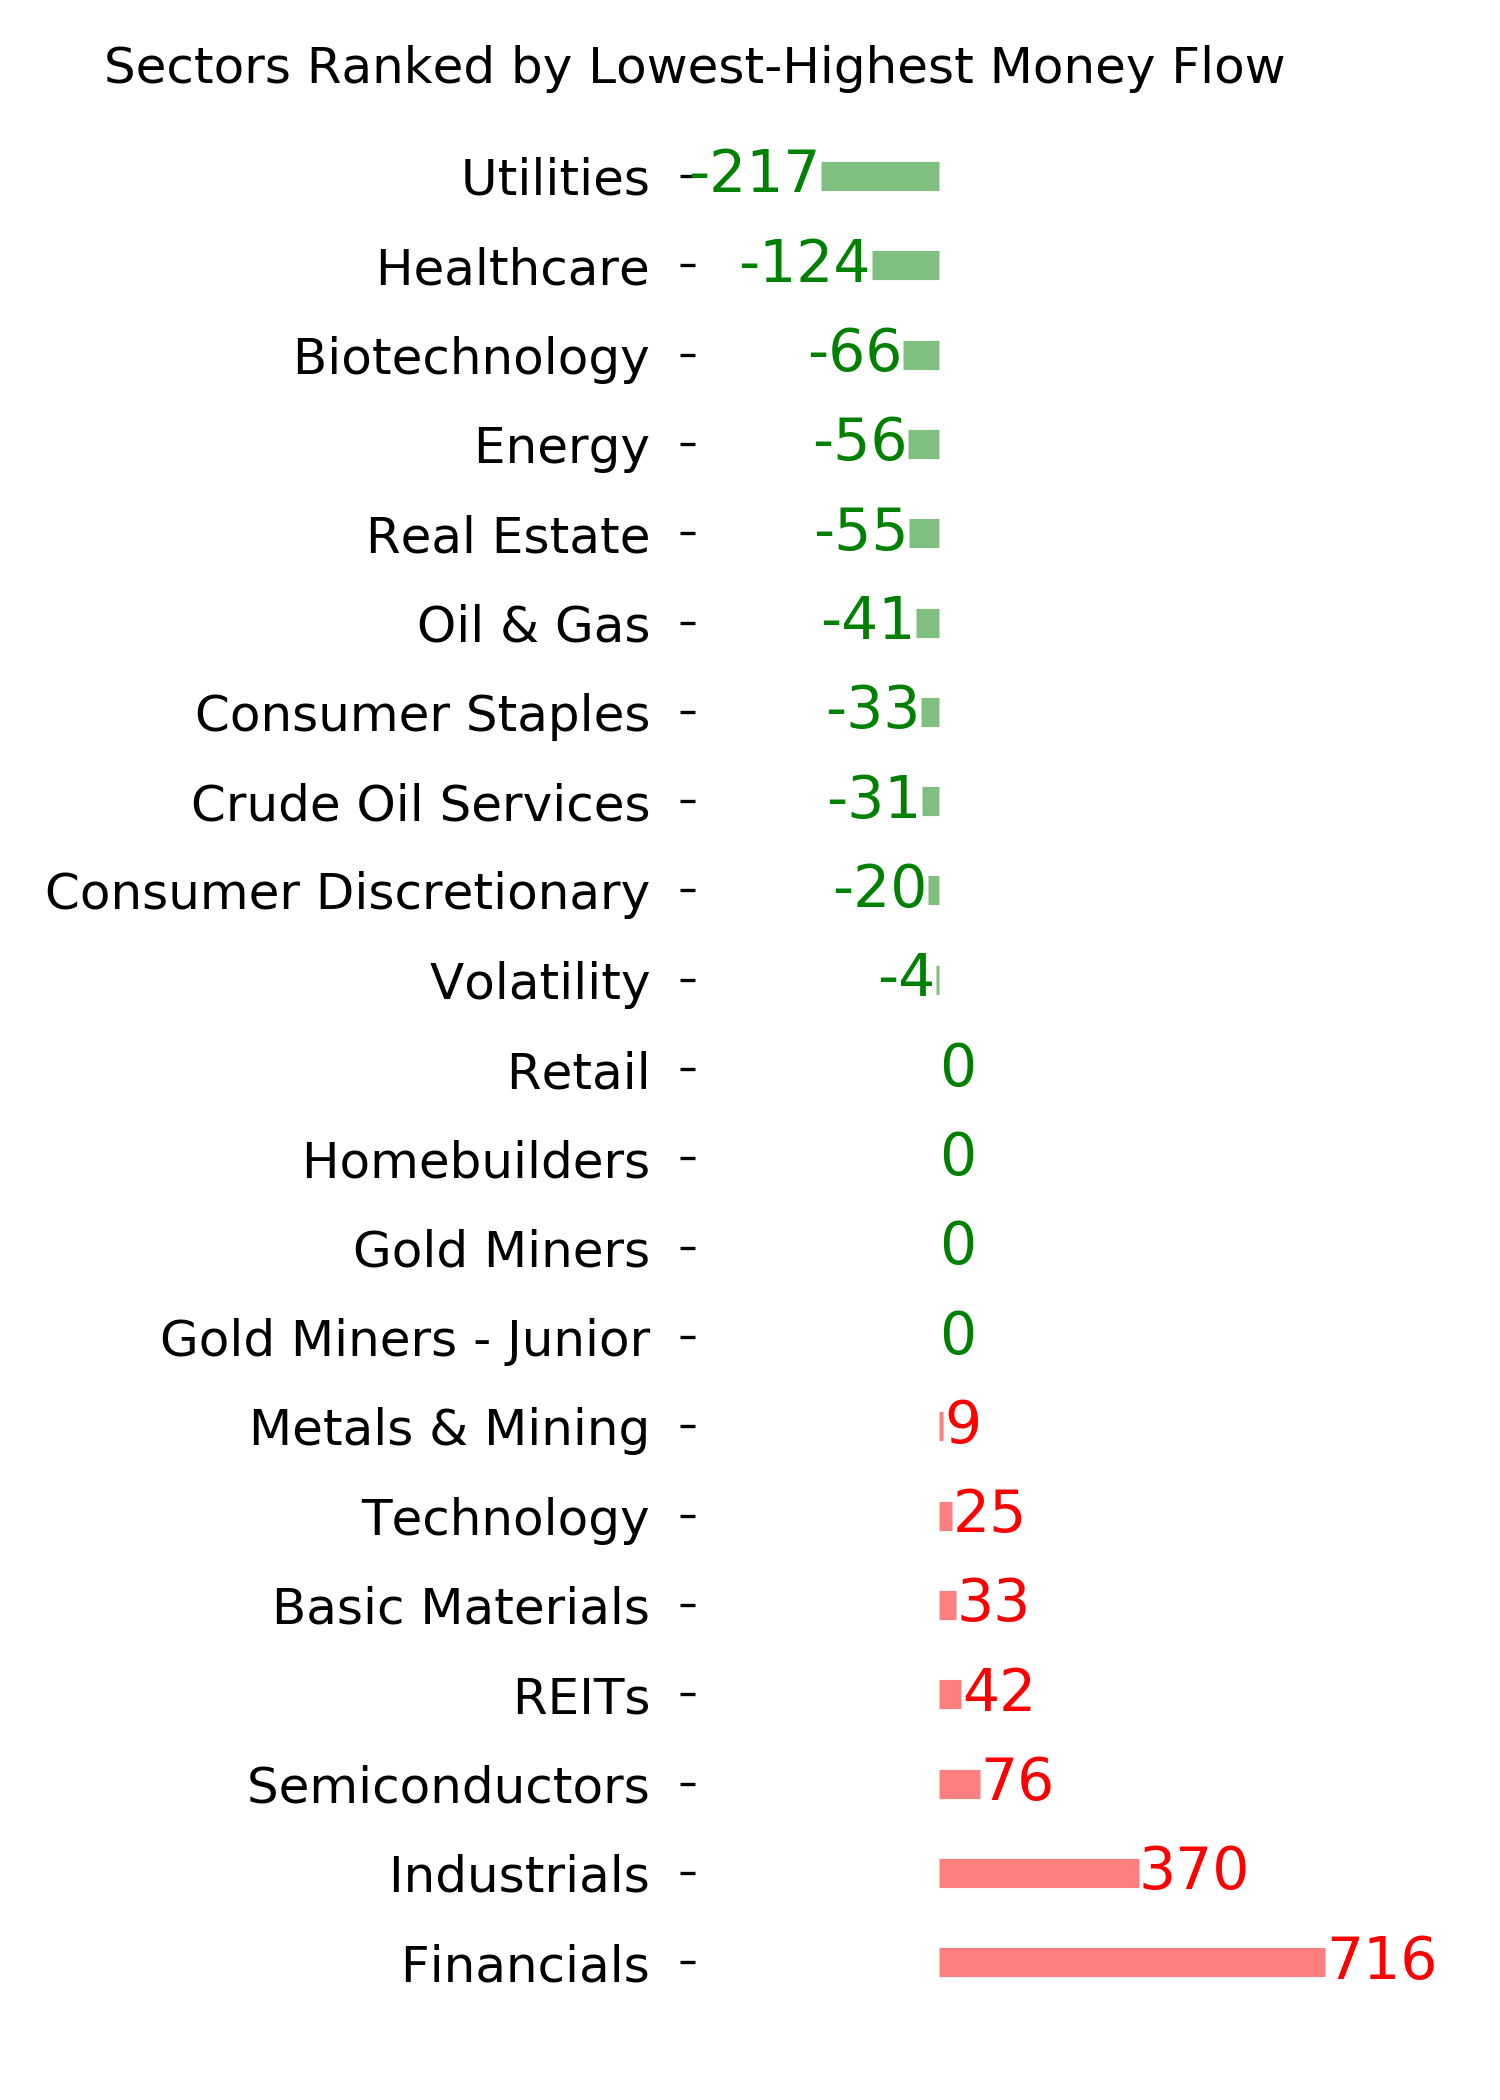
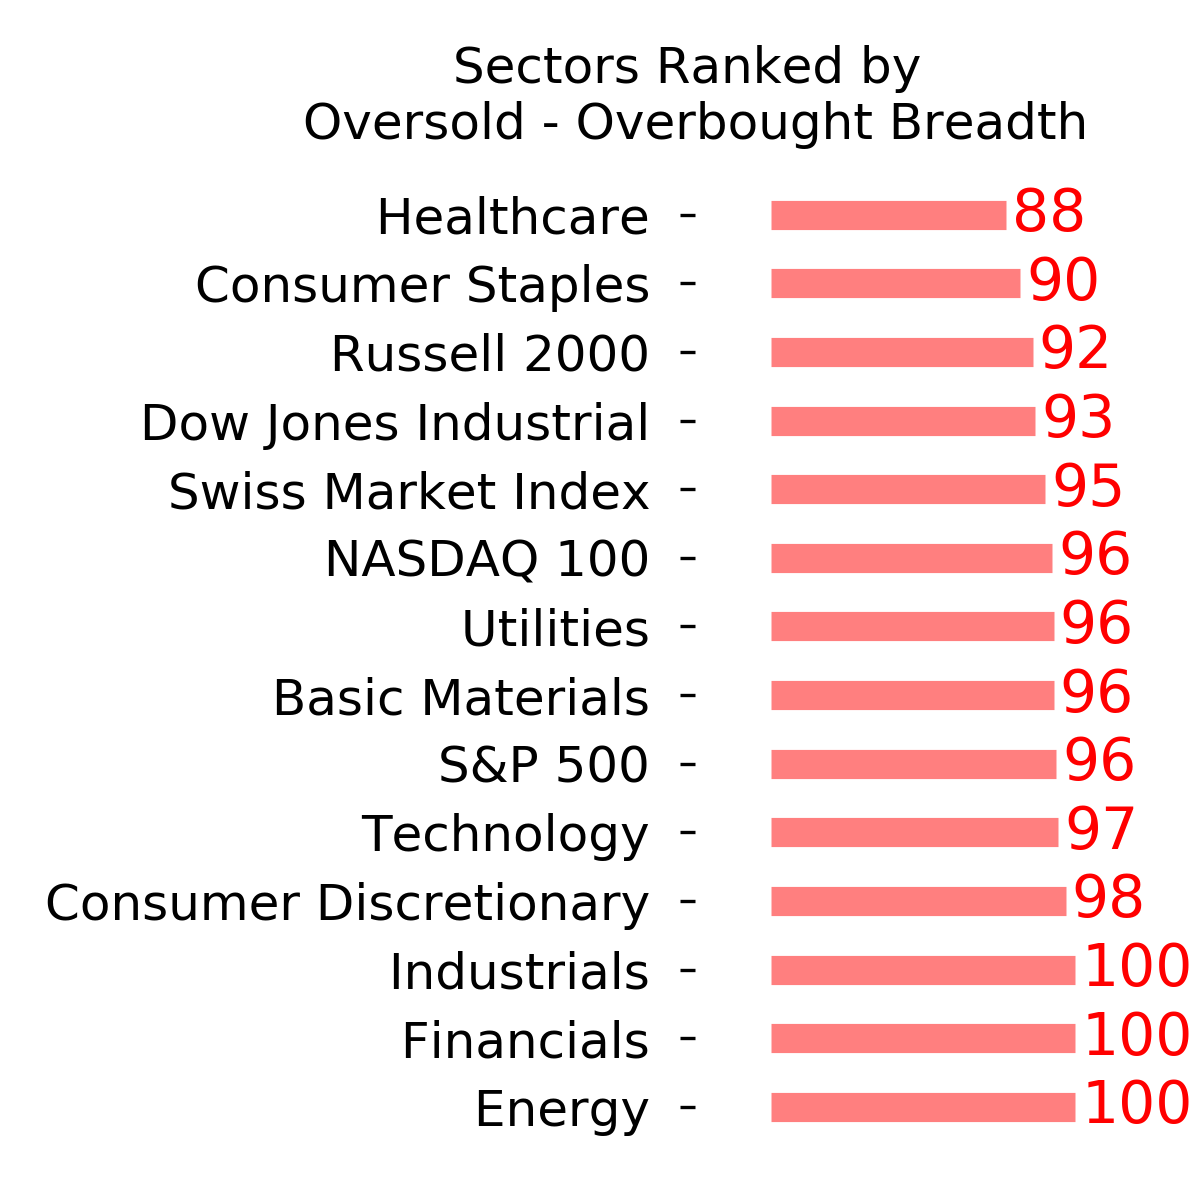
Ranks
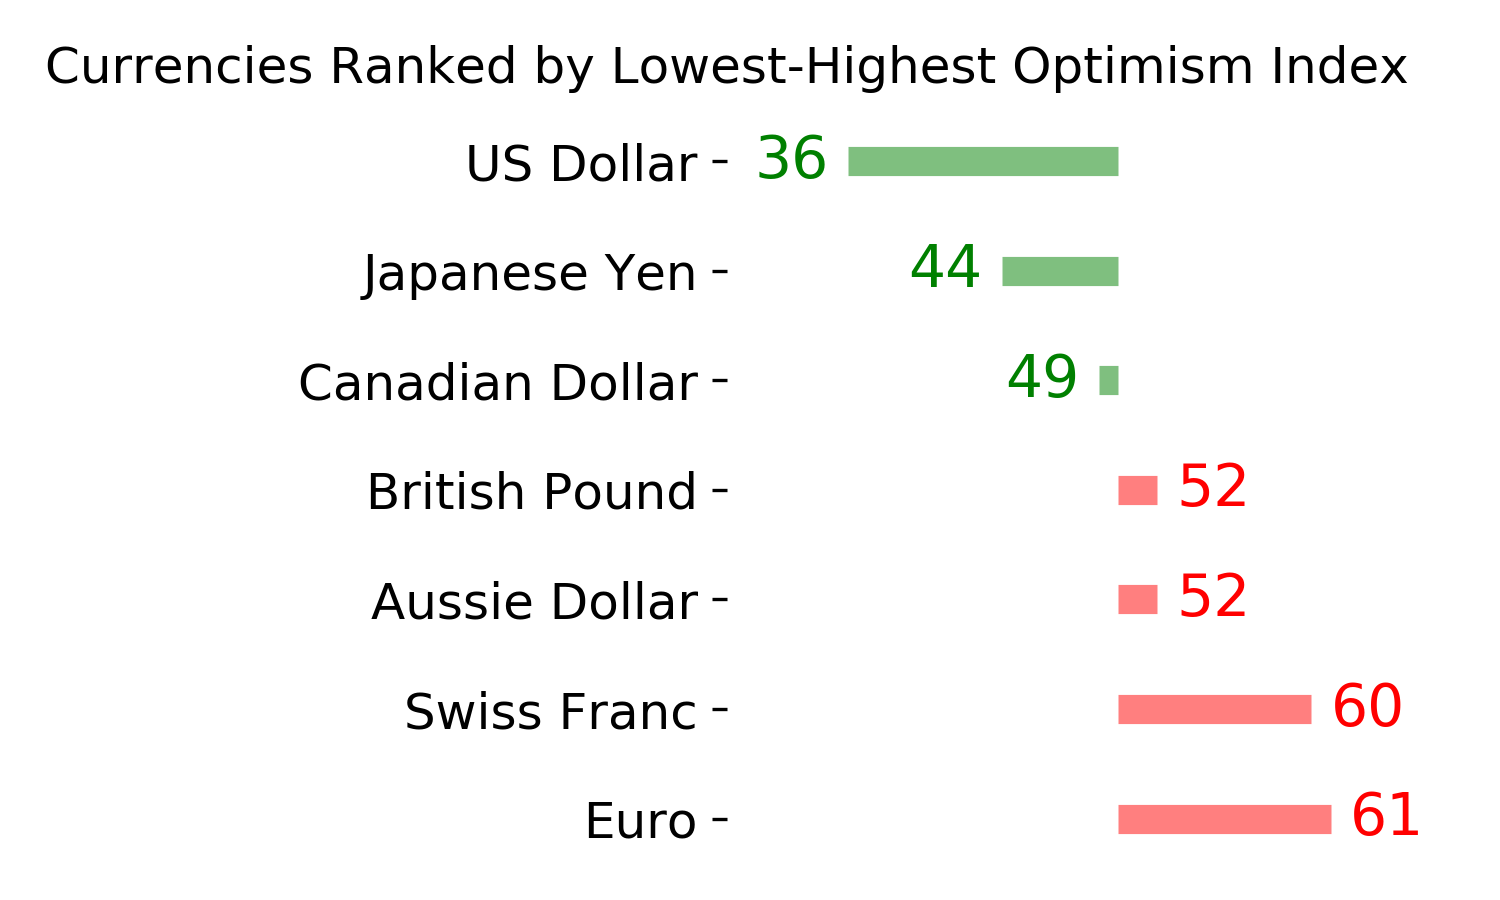
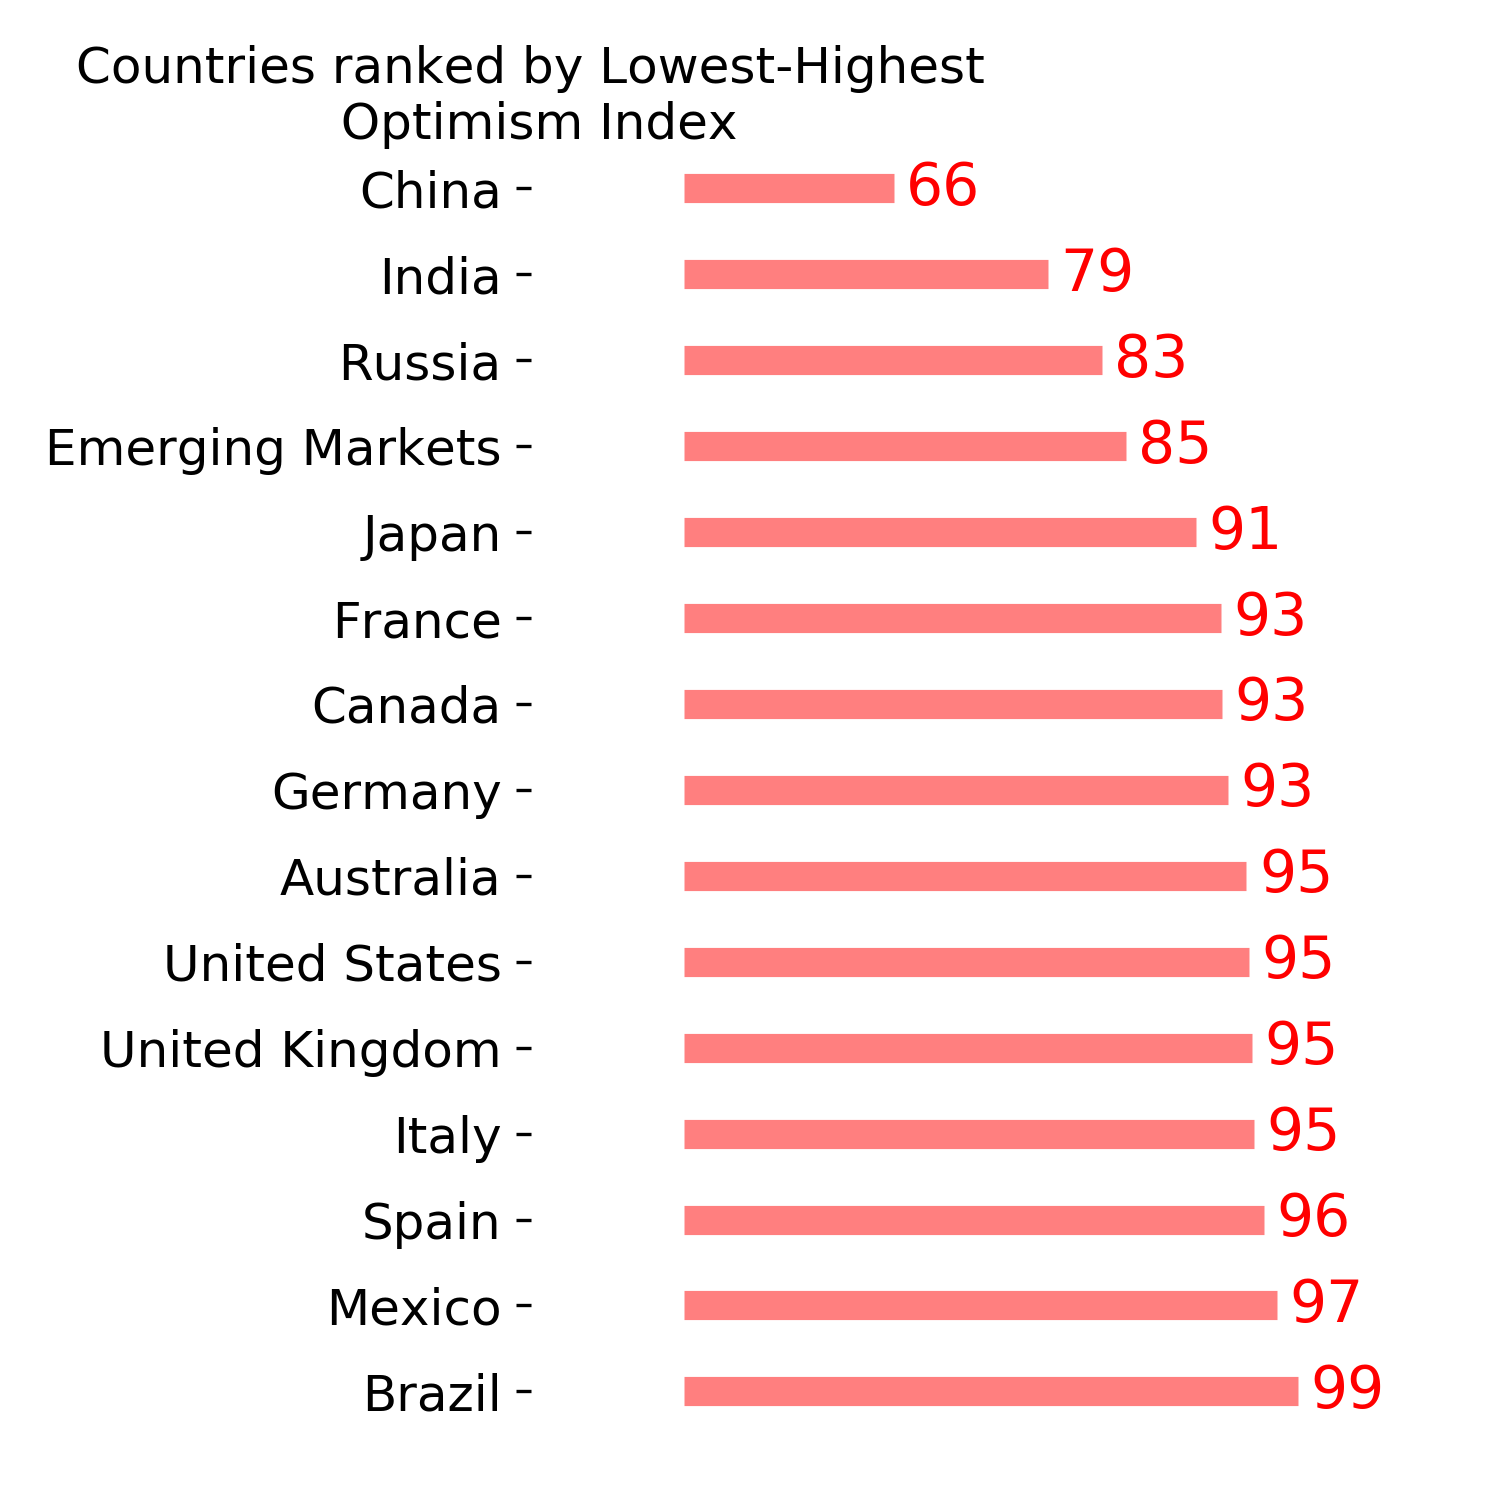
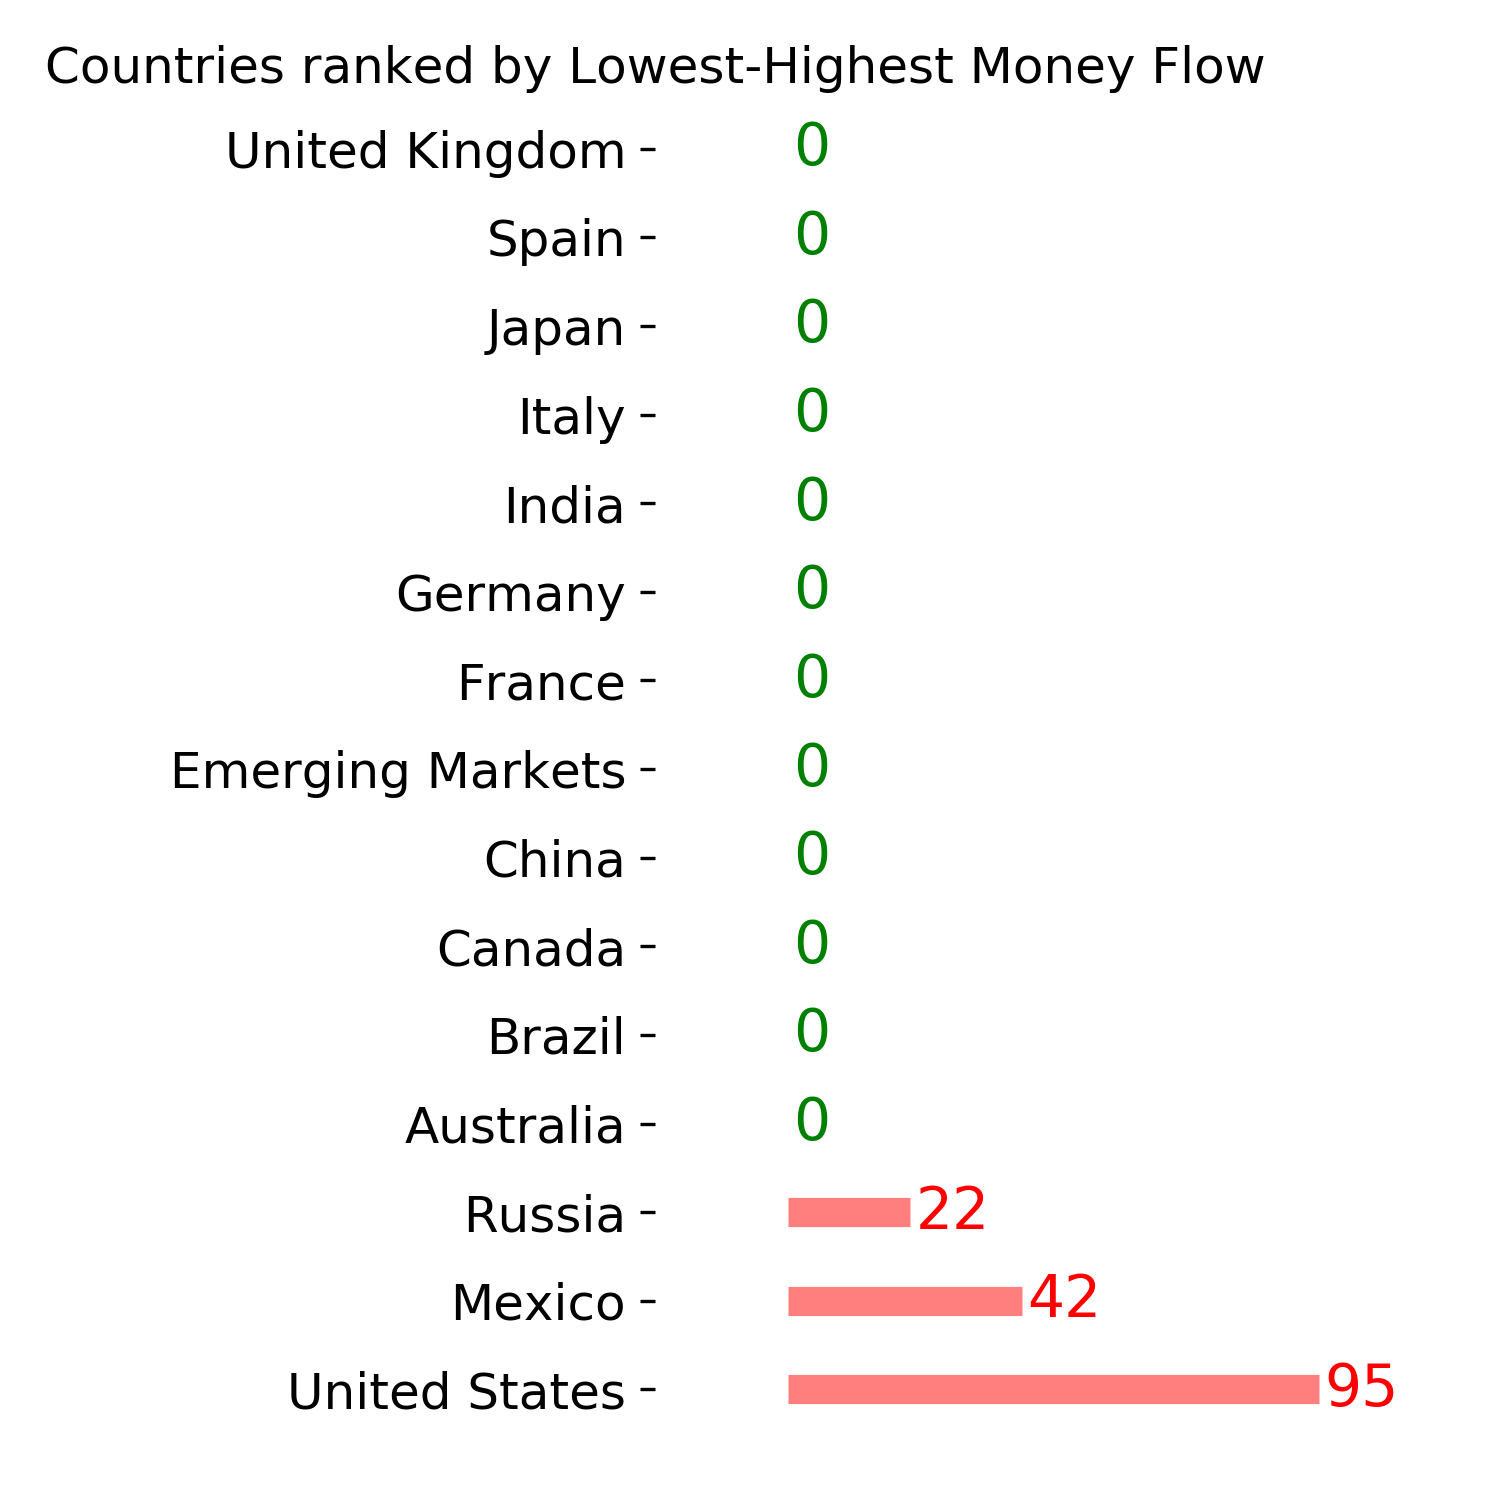
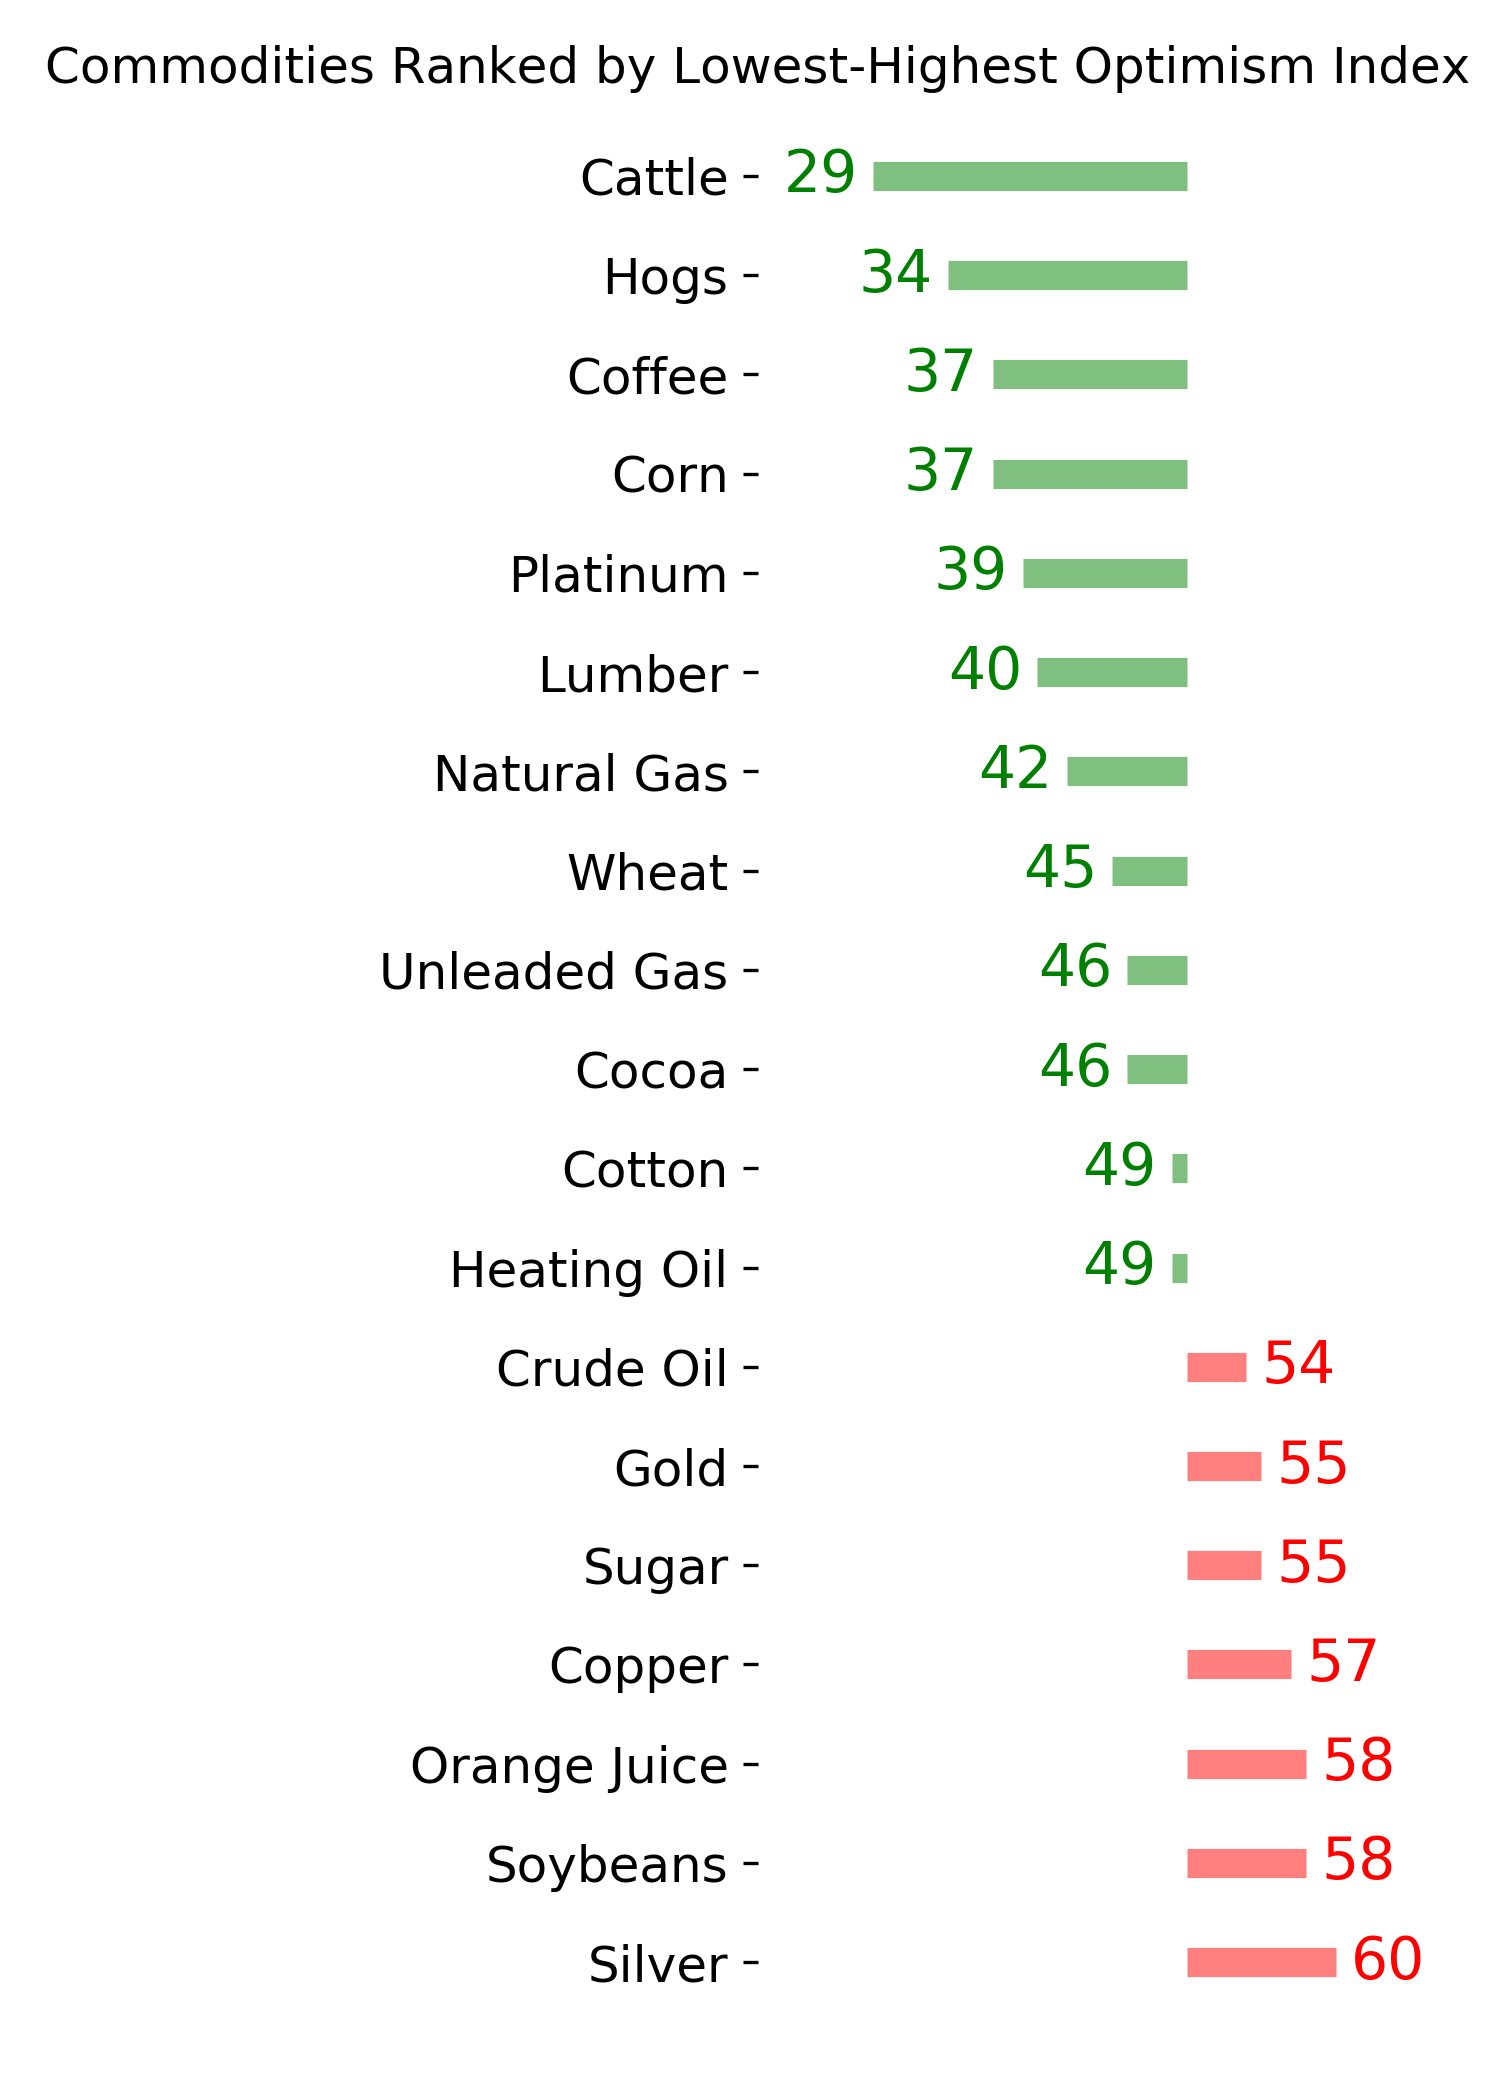
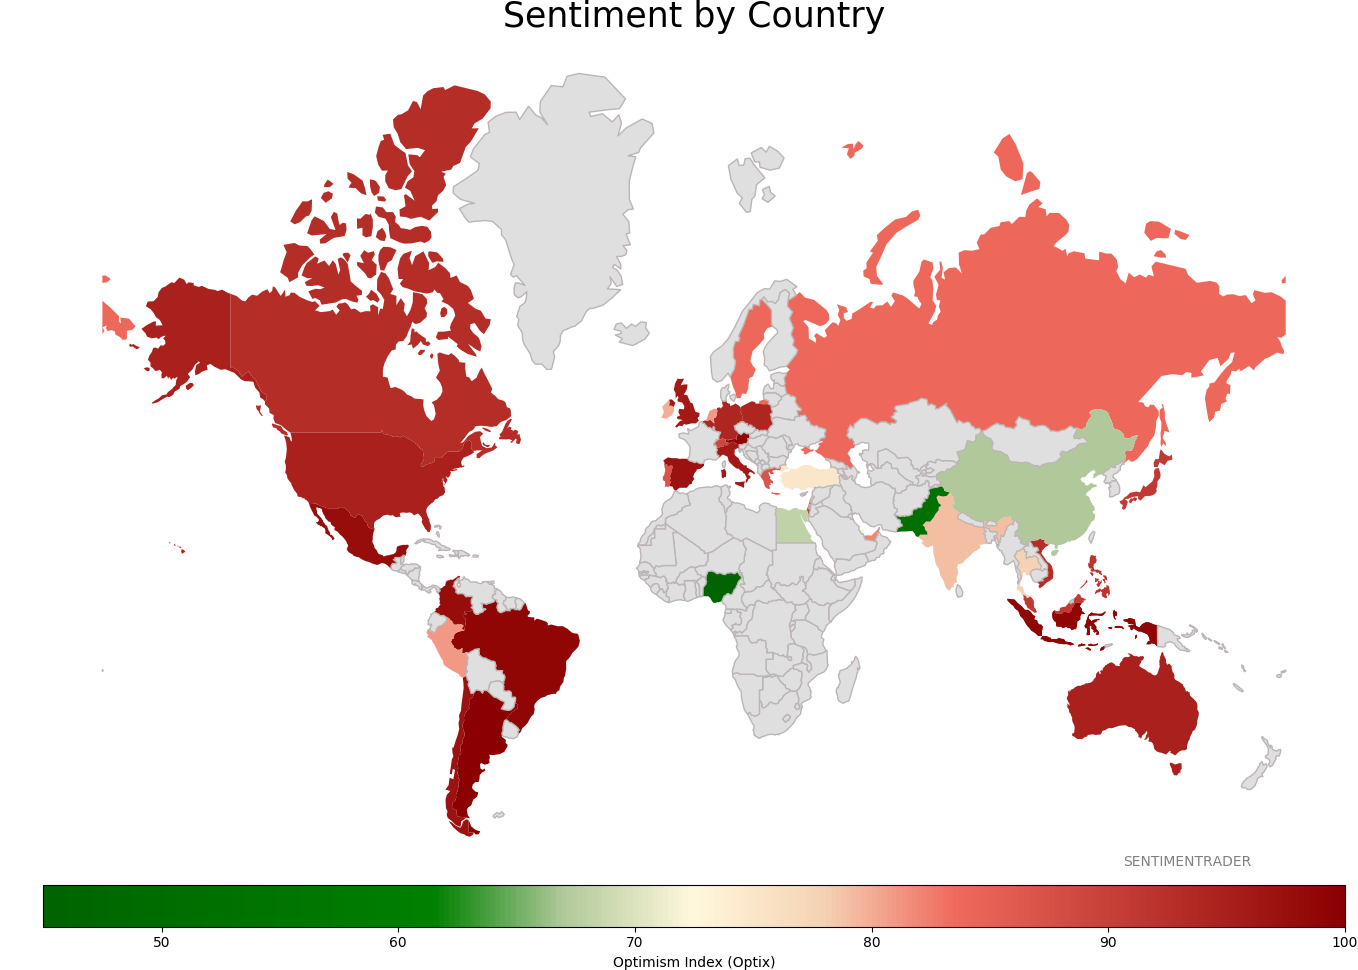
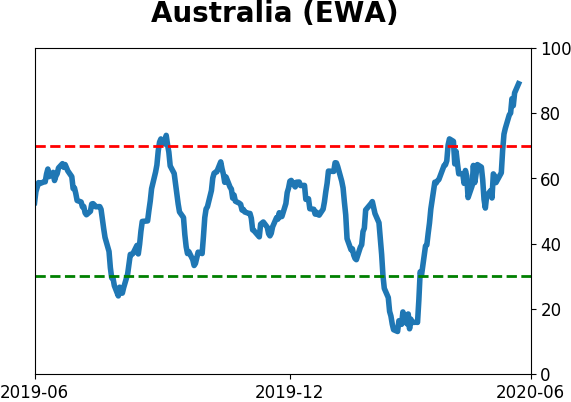
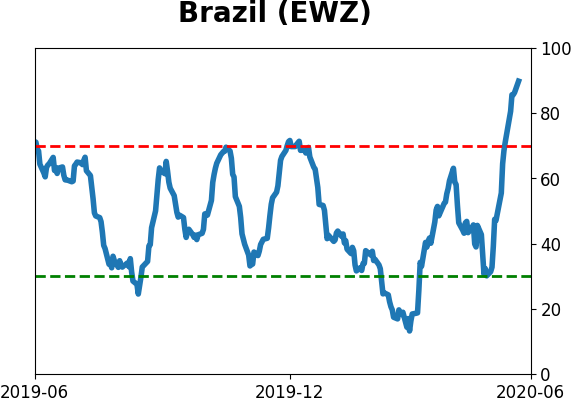
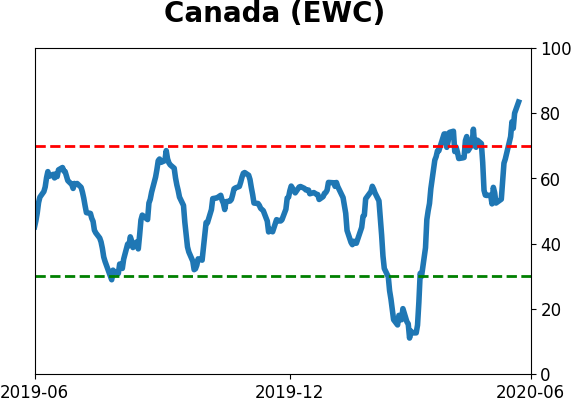
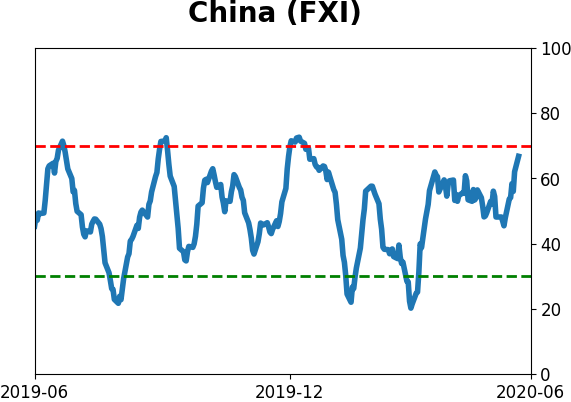
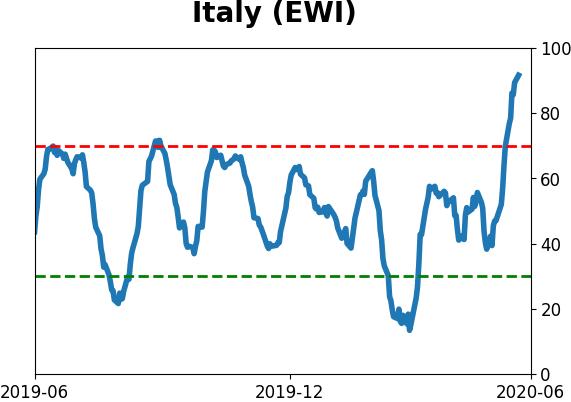
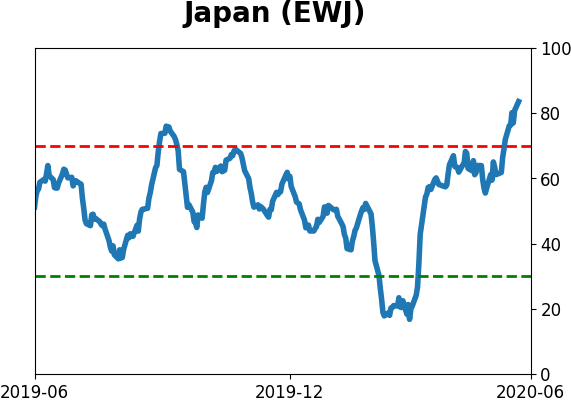
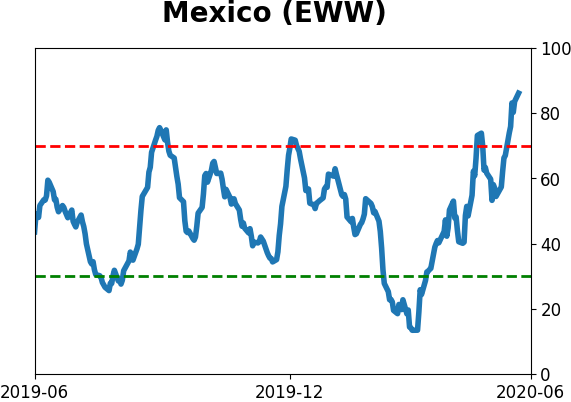
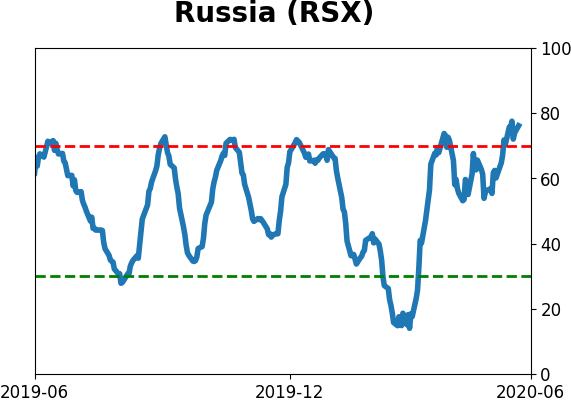
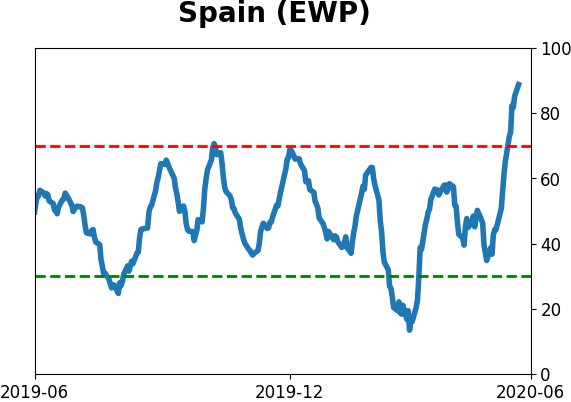
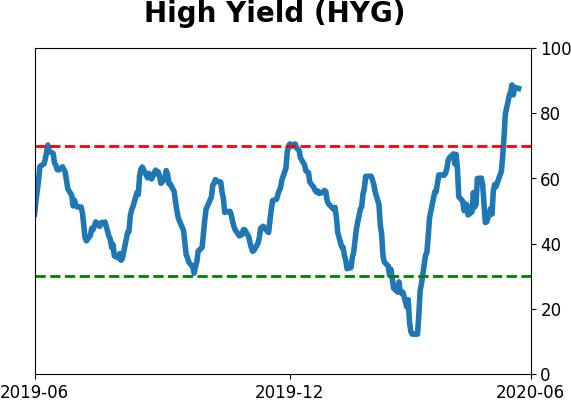
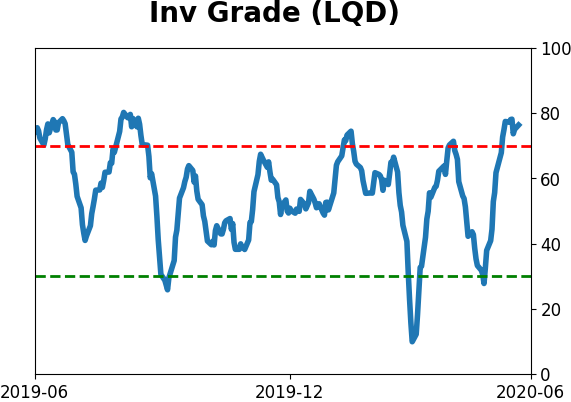
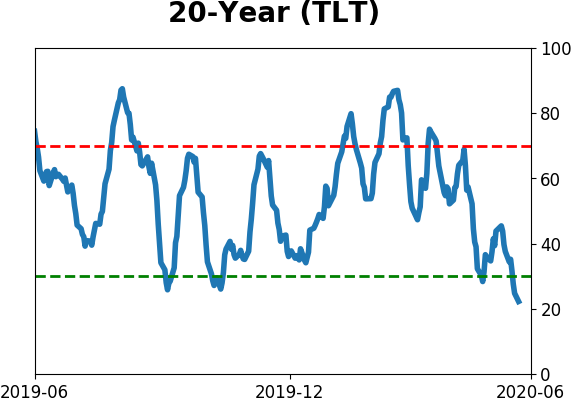
Sentiment Around The World
Optimism Index Thumbnails
|
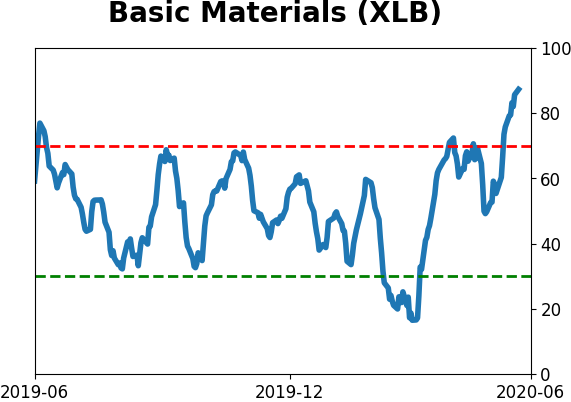
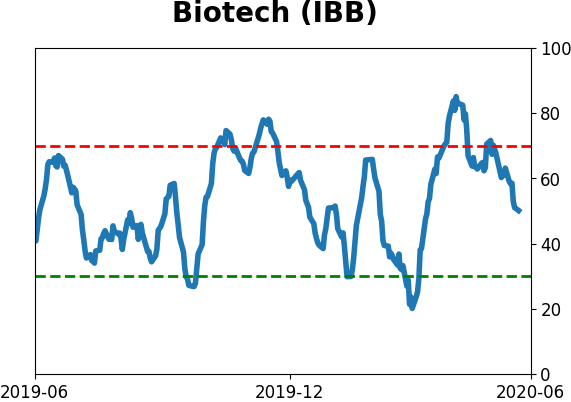
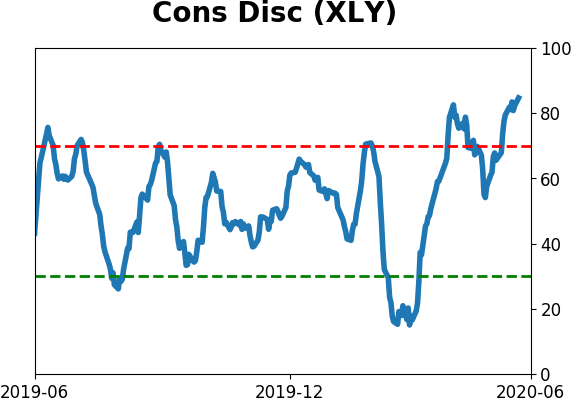
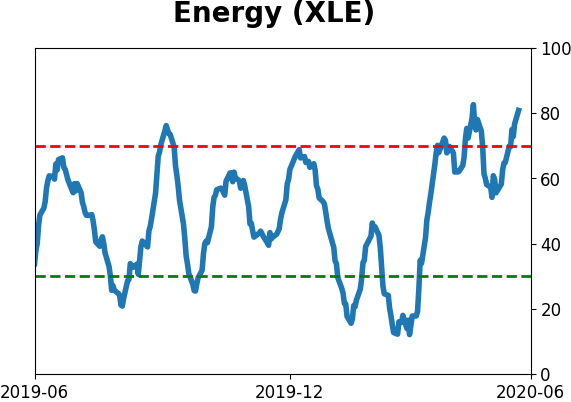
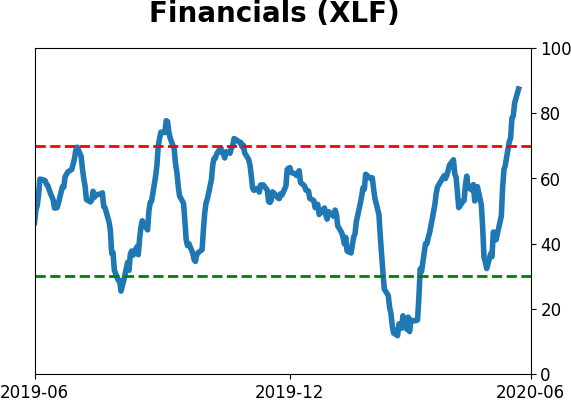
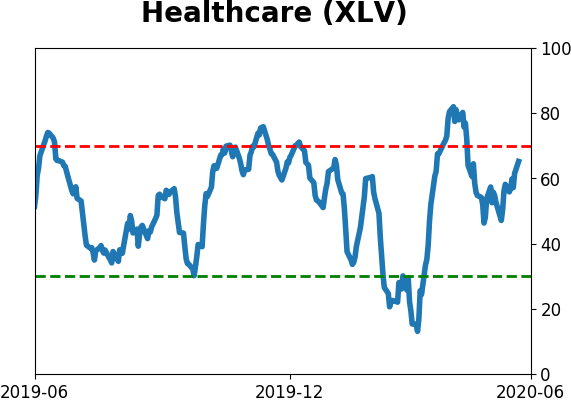
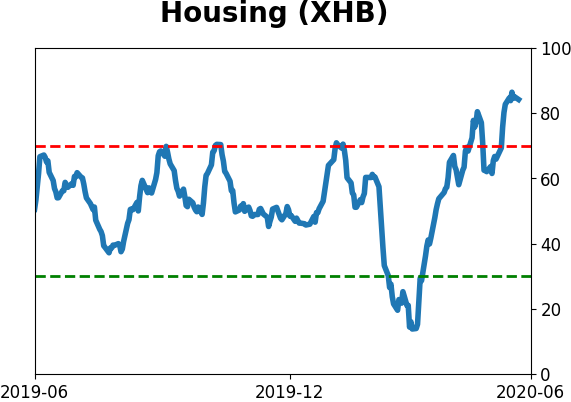
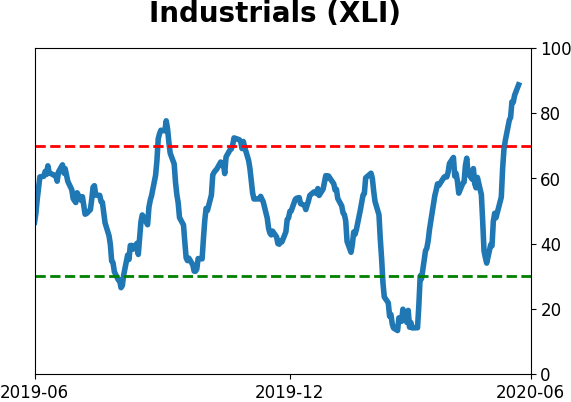
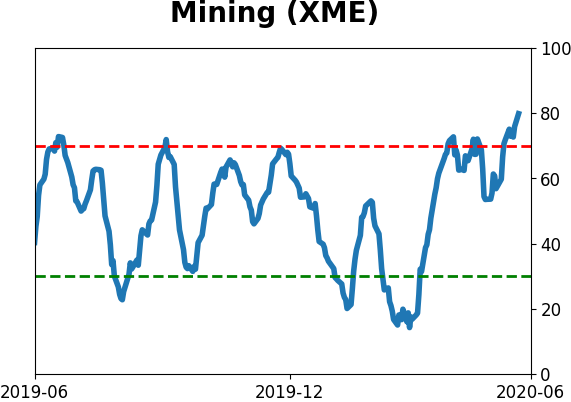
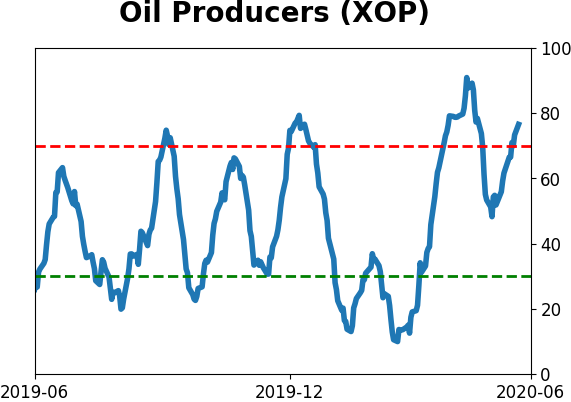
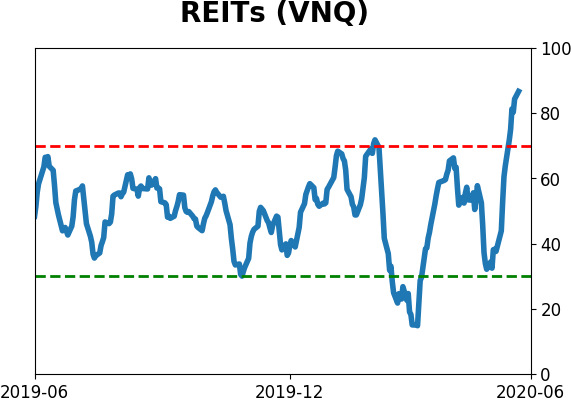
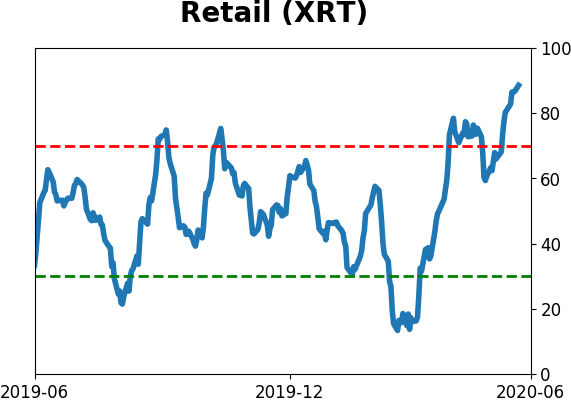
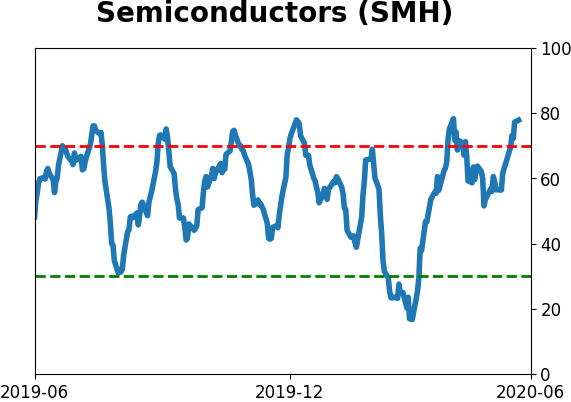
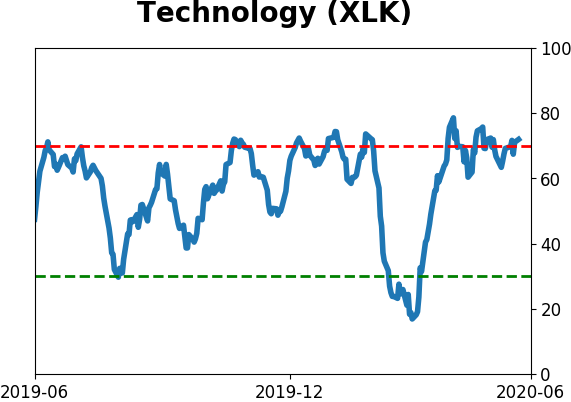
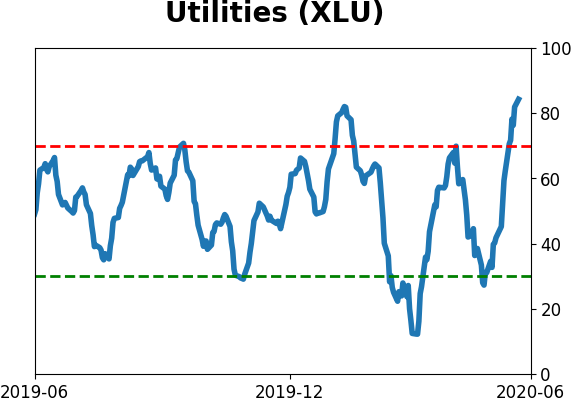
Sector ETF's - 10-Day Moving Average
|
|
|
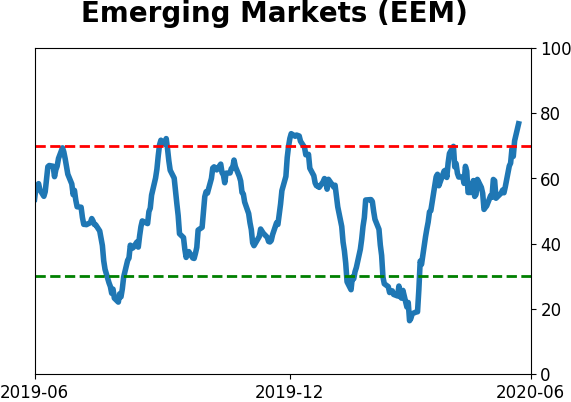
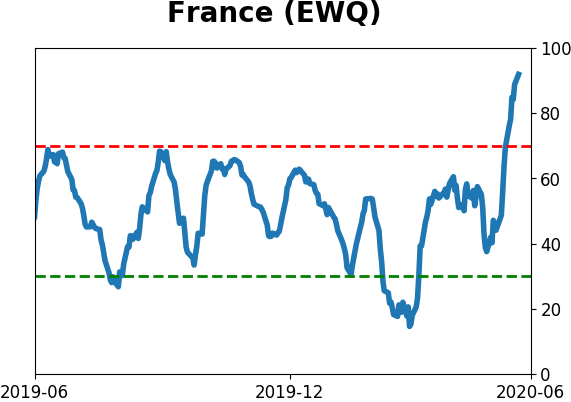
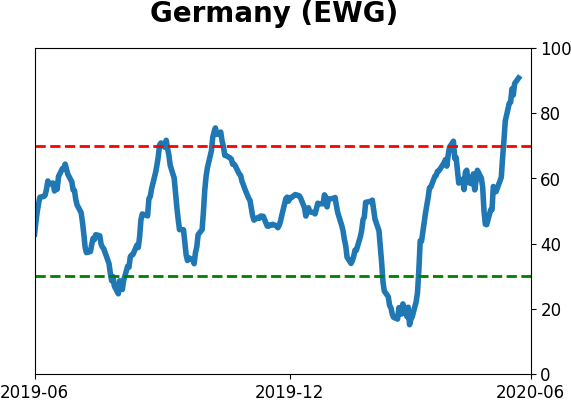
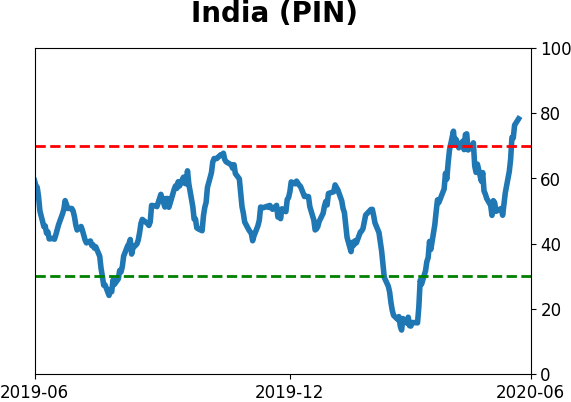
Country ETF's - 10-Day Moving Average
|
|
|
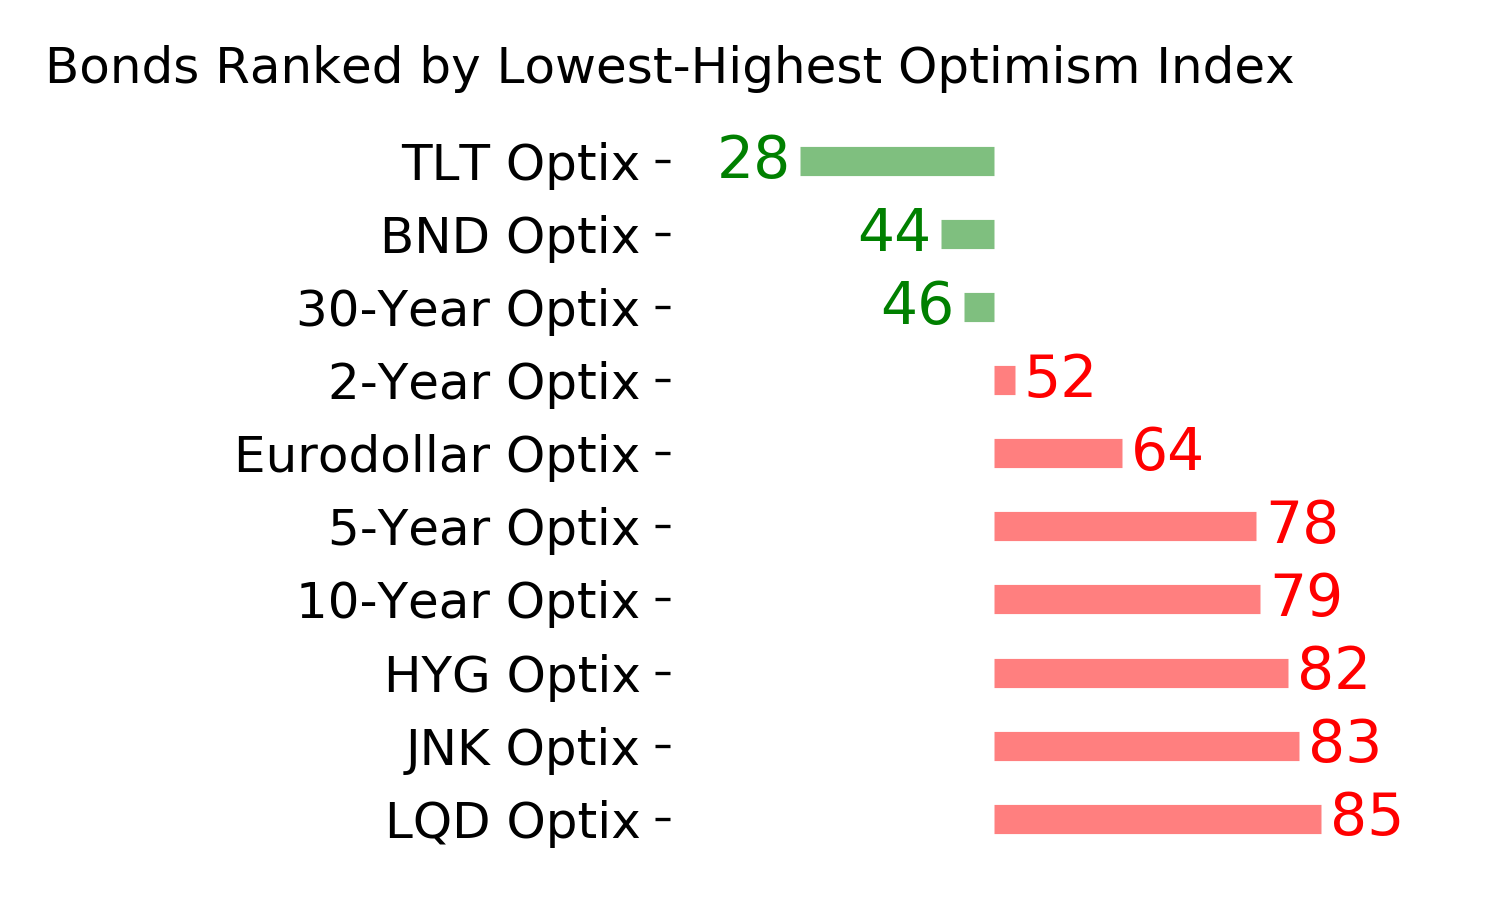
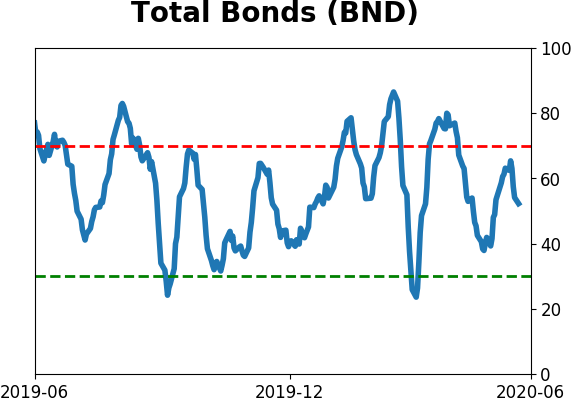
Bond ETF's - 10-Day Moving Average
|
|
|
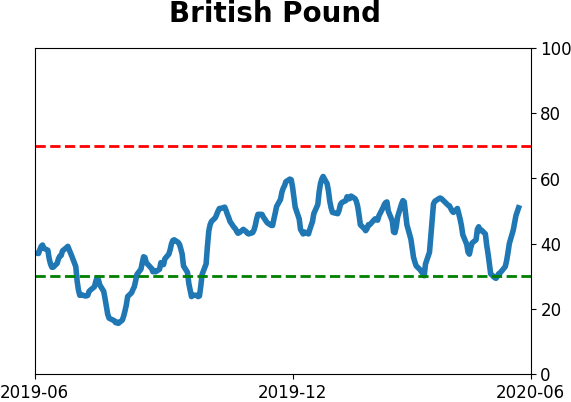
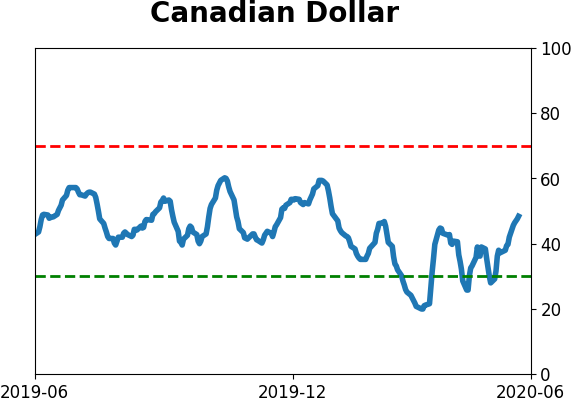
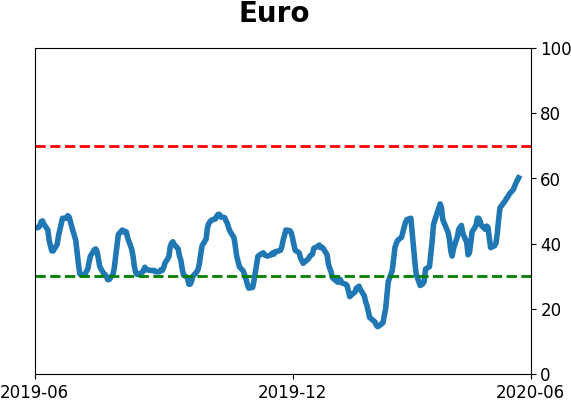
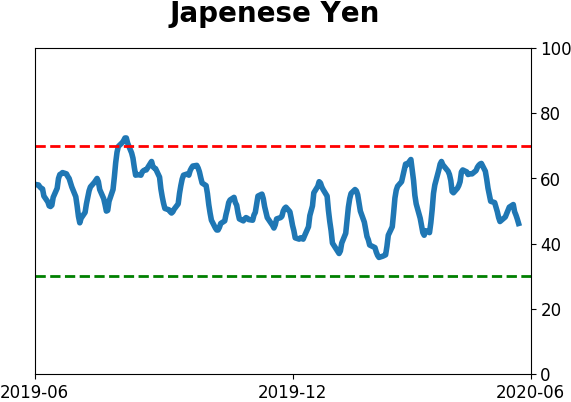
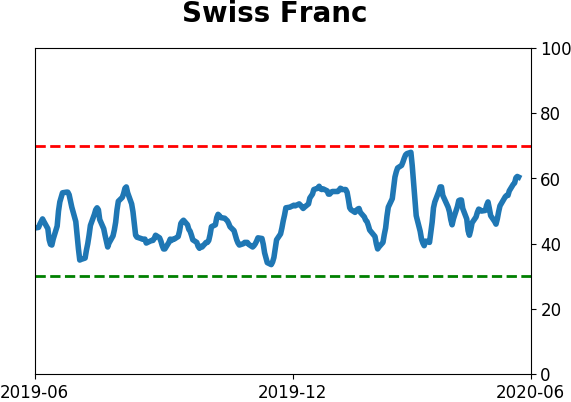
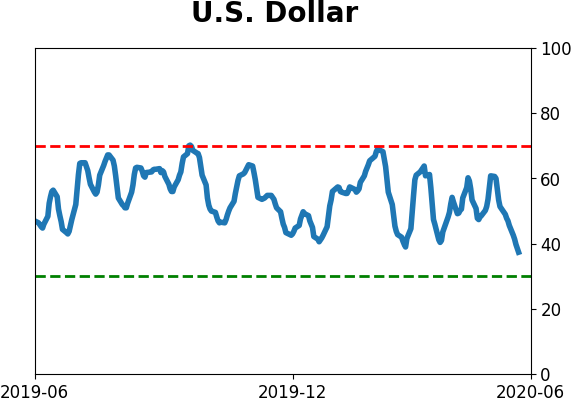
Currency ETF's - 5-Day Moving Average
|
|
|
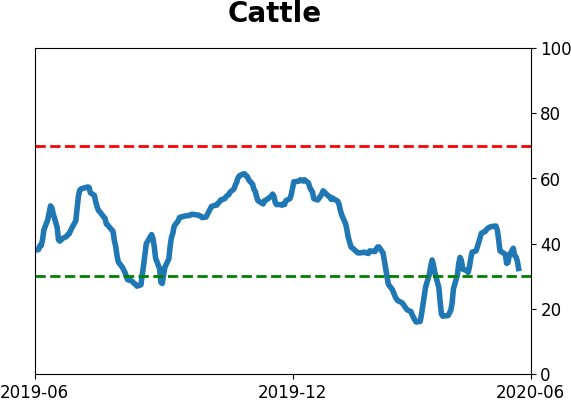
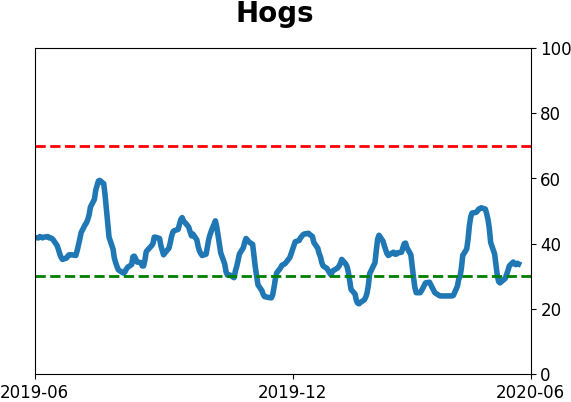
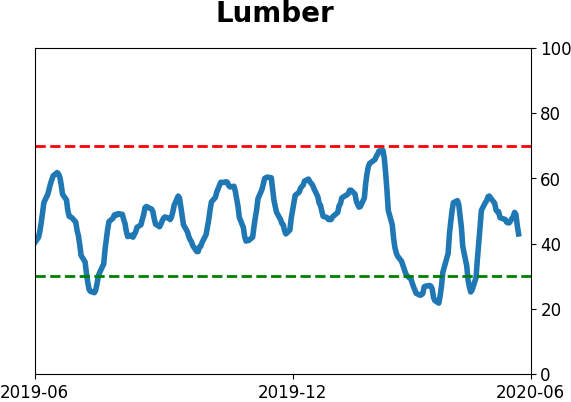
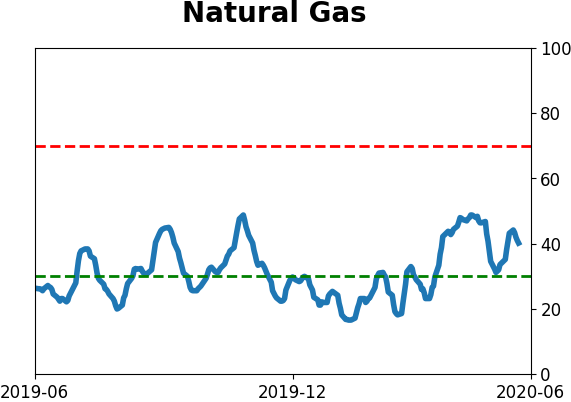
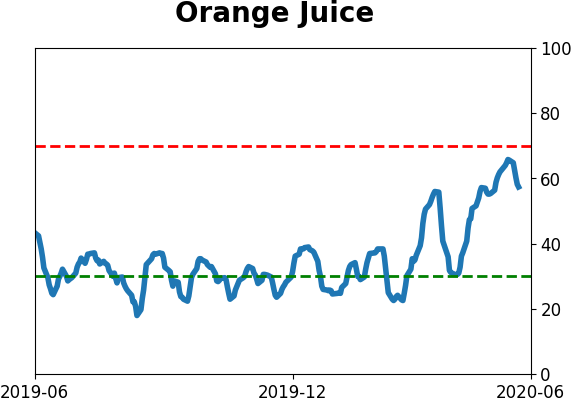
Commodity ETF's - 5-Day Moving Average
|
|