Headlines
|
|
Worldwide markets, sectors, and industries all recover from bear markets:
Across the globe, major indexes are recovering. Every major world market we follow fell into a bear market in March, now fewer than 15% of them are. We're seeing similar recoveries among major U.S. sectors and even industries. The only comparisons there were the ends of the last two bear markets.
Economists have become too negative:
Thanks to improvements in labor market indicators, economic surprises in the U.S. have turned positive. This happens when economists extrapolate recent bad news into the future and become too negative on the prospects for a recovery. The positive turn in surprises has reversed record low readings.
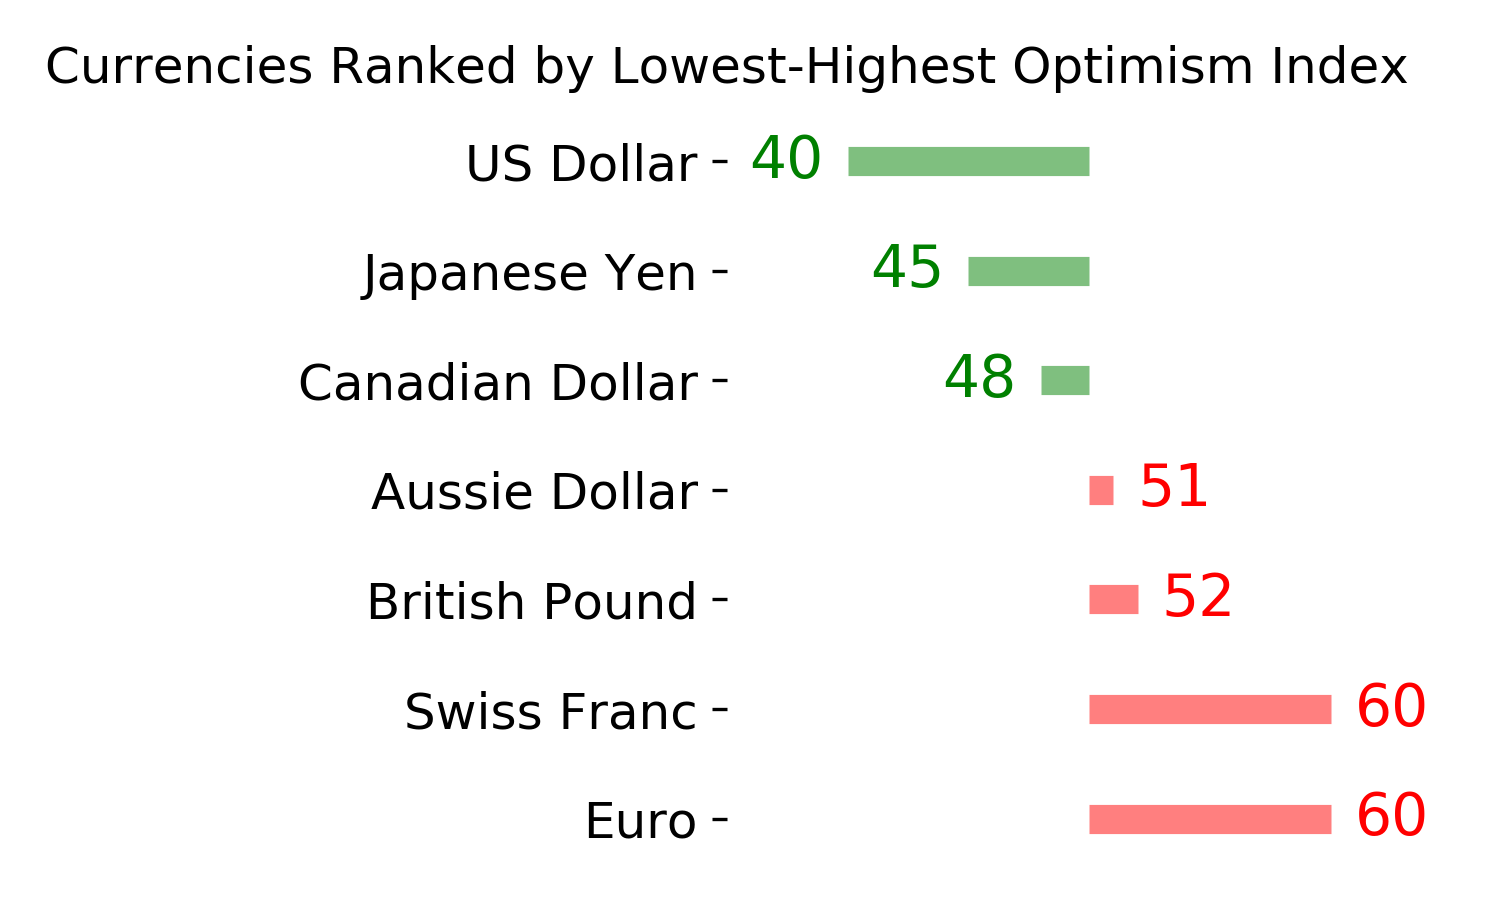
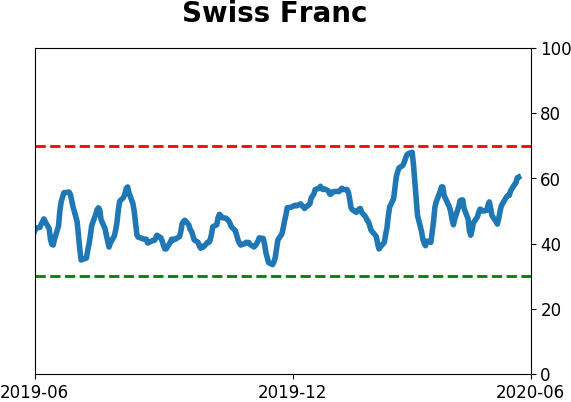
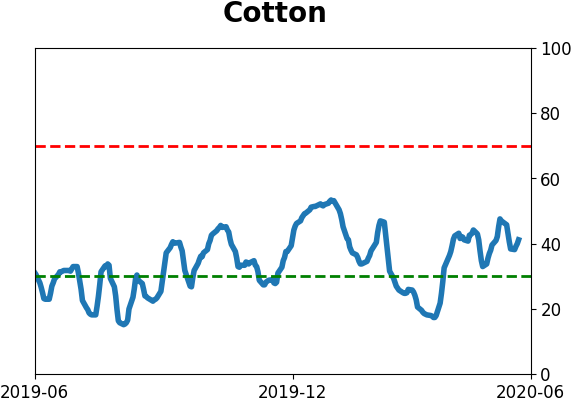
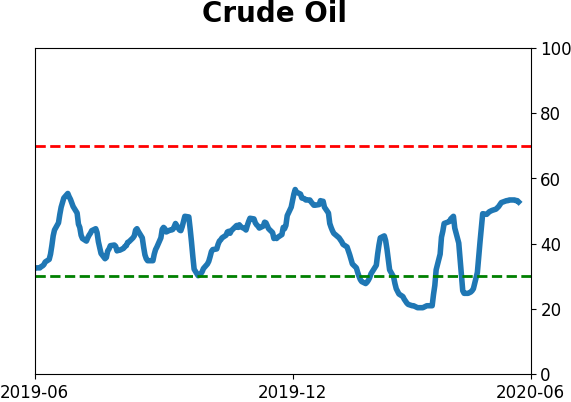
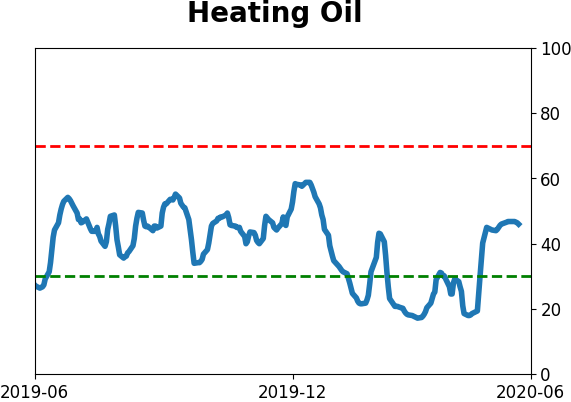
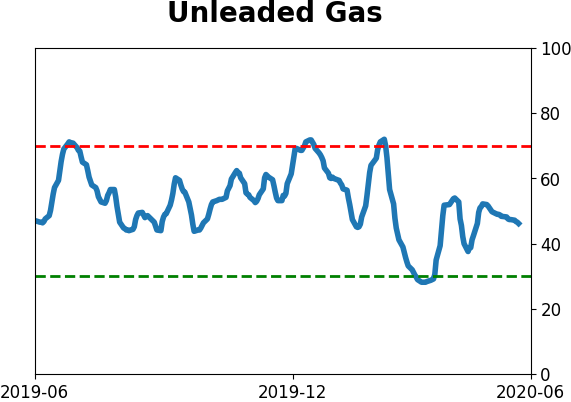
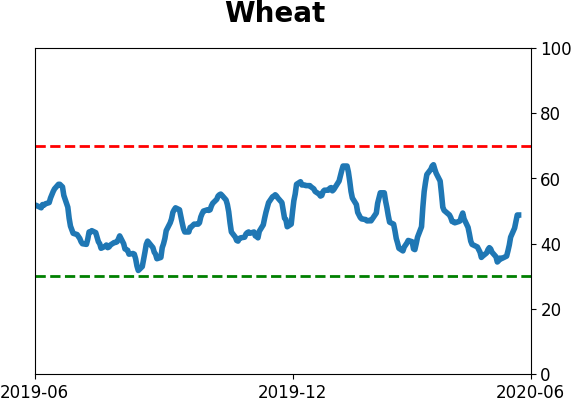
The latest Commitments of Traders report was released, covering positions through Tuesday: The 3-Year Min/Max Screen shows that "smart money" hedgers established a new multi-year short position in the Swiss franc. In the past 5-10 years, this has been relatively effective at preceding limited upside for the franc. They finally reduced their record net long position in major equity index futures but are still long more than $42 billion worth of contracts. Hedgers picked up their buying a bit in agriculture contracts, with the most exposure continuing to be in corn. They sold oil futures yet again, and now hold nearly 30% of open interest net short, behind only June 2014 and February-April 2018.
|
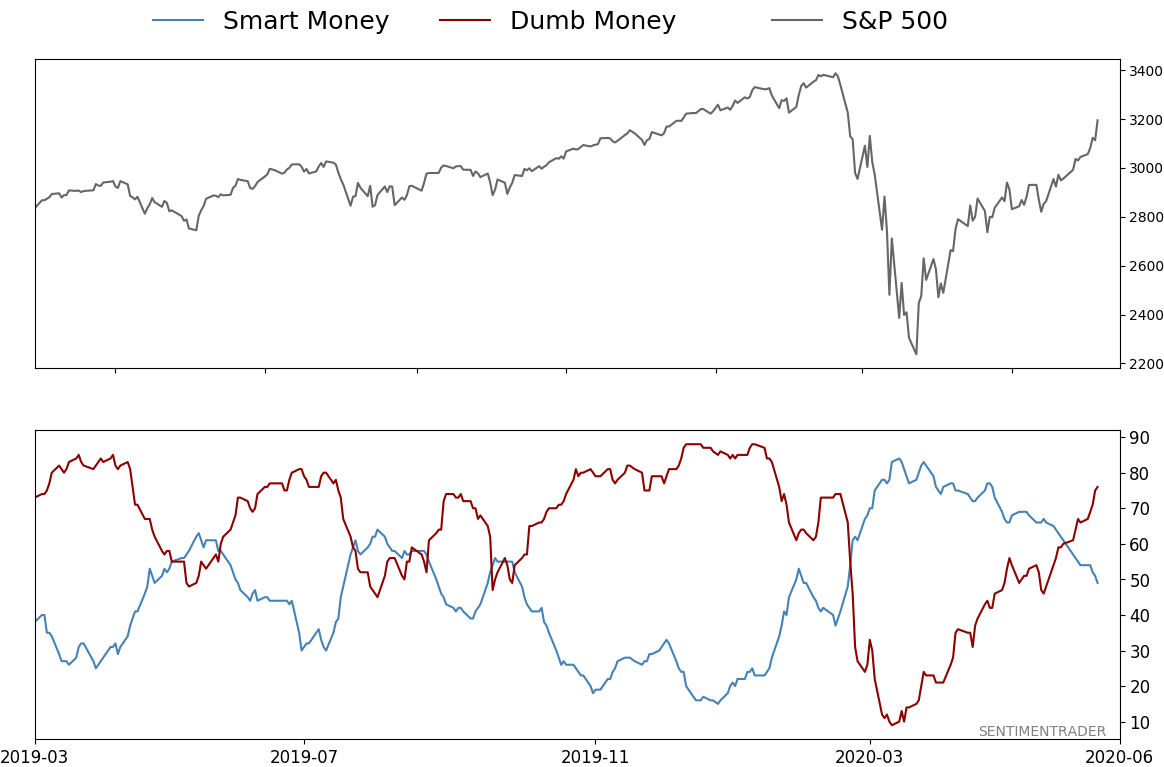
Smart / Dumb Money Confidence
|
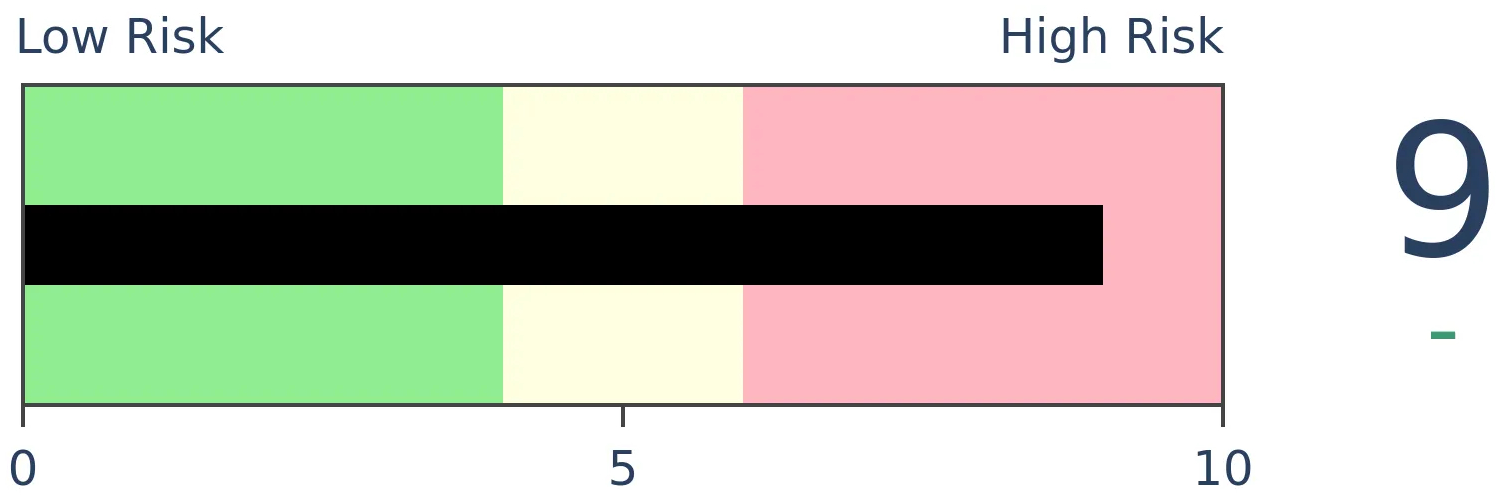
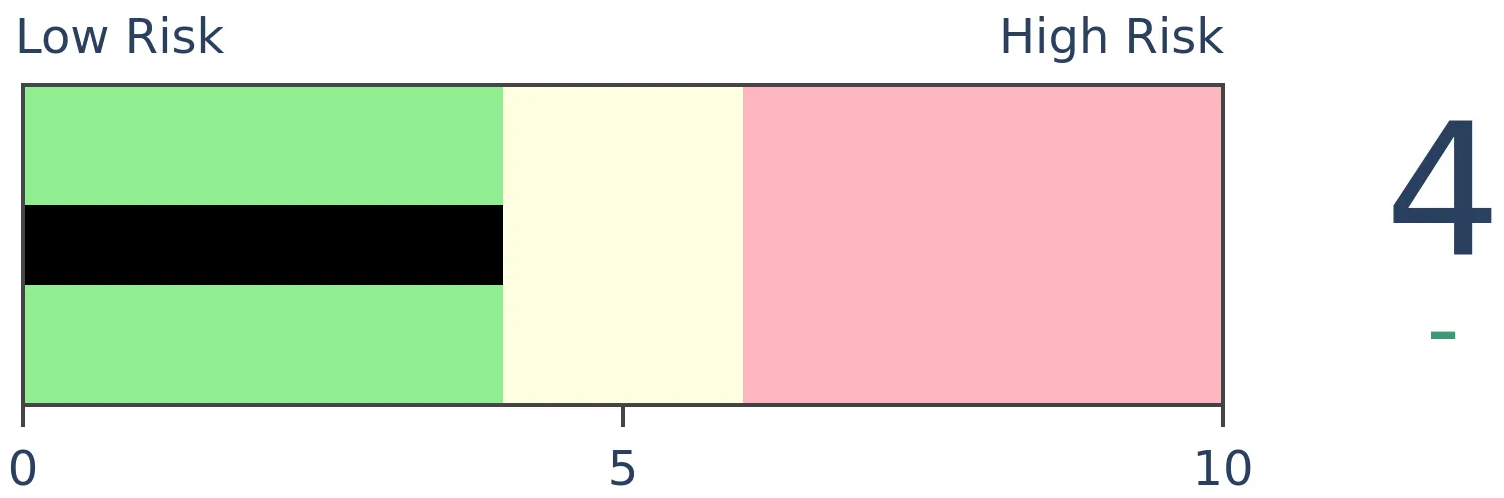
Smart Money Confidence: 49%
Dumb Money Confidence: 76%
|
|
Risk Levels
Stocks Short-Term
|
Stocks Medium-Term
|
|
Bonds

|
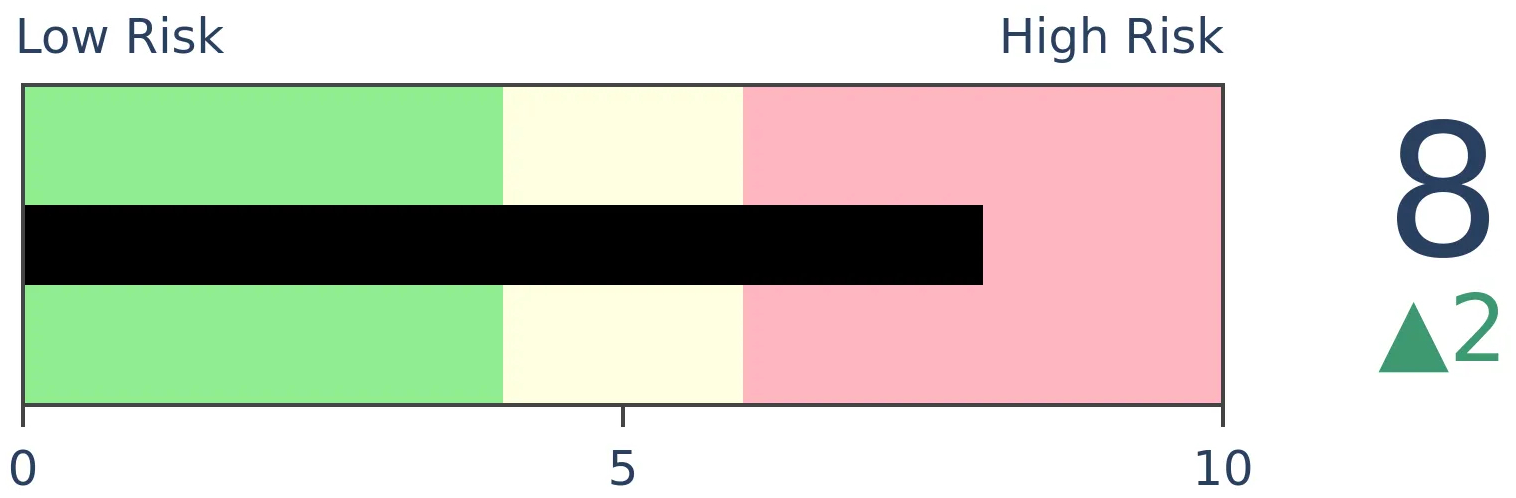
Crude Oil
|
|
Gold
|
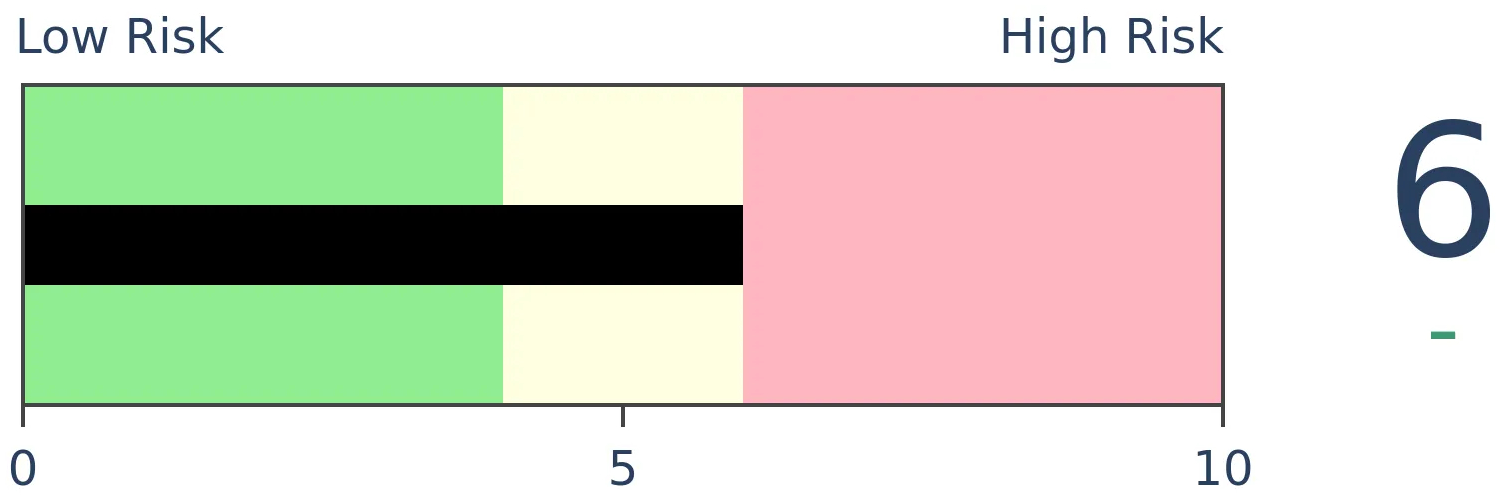
Agriculture

|
|
Research
BOTTOM LINE
Across the globe, major indexes are recovering. Every major world market we follow fell into a bear market in March, now fewer than 15% of them are. We're seeing similar recoveries among major U.S. sectors and even industries. The only comparisons there were the ends of the last two bear markets.
FORECAST / TIMEFRAME
SPY -- Up, Long-Term
|
Over the past few weeks, we've looked multiple times at the thrusts and recoveries not only in stocks and major indexes in the U.S., but also worldwide. It keeps going.
We've added a multitude of indicators in recent weeks to help monitor the health of industries, sectors, and worldwide markets, and they're starting to show meaningful changes in tone.
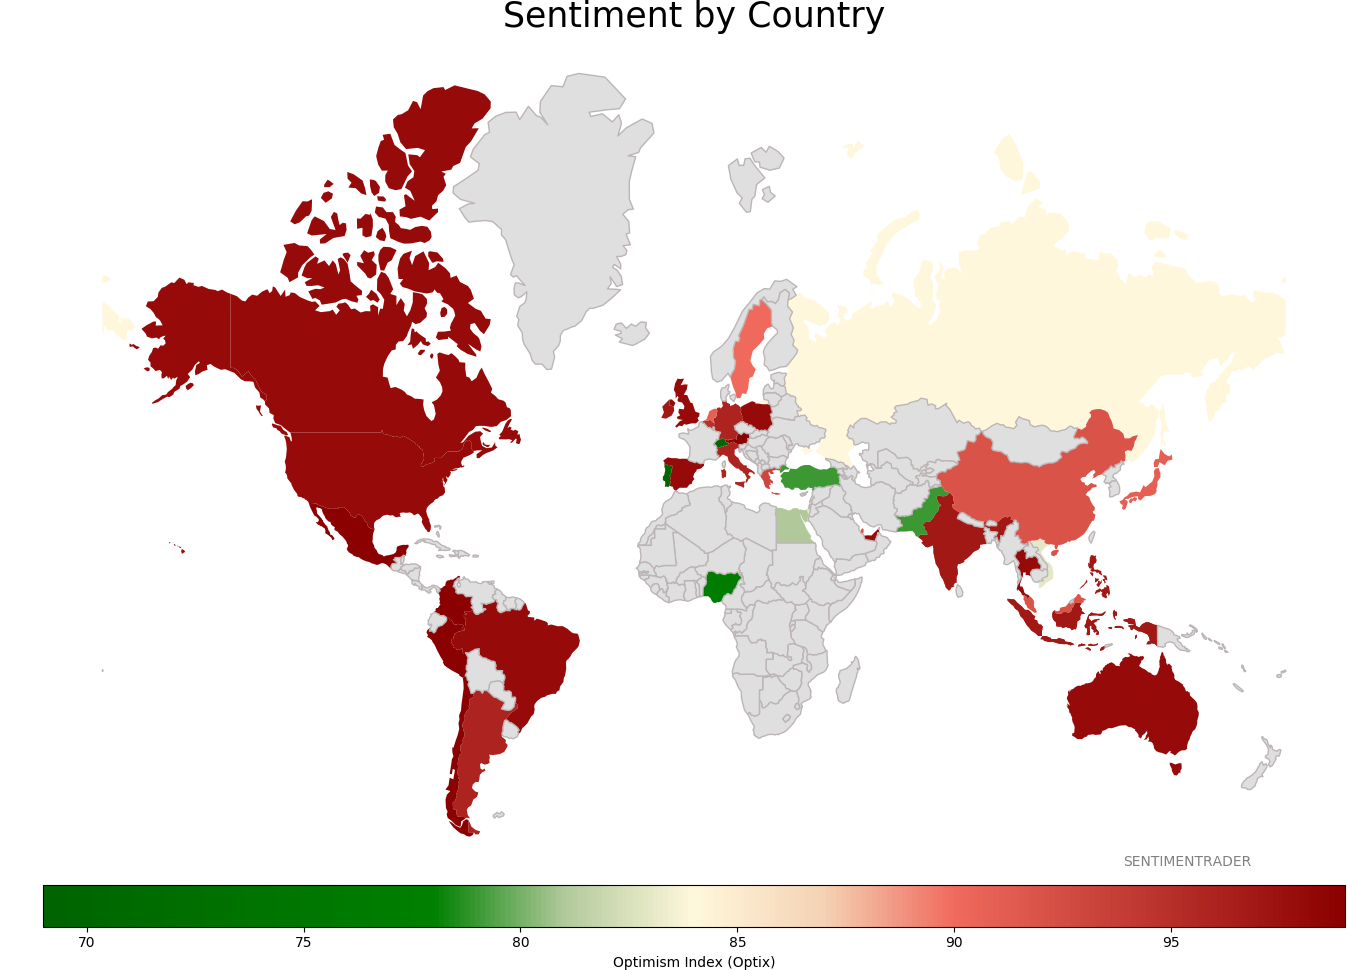
In March, every major world index we follow was in a bear market, and now fewer than 15% of them are. In recent decades, that only happened in 1988 and 2009.
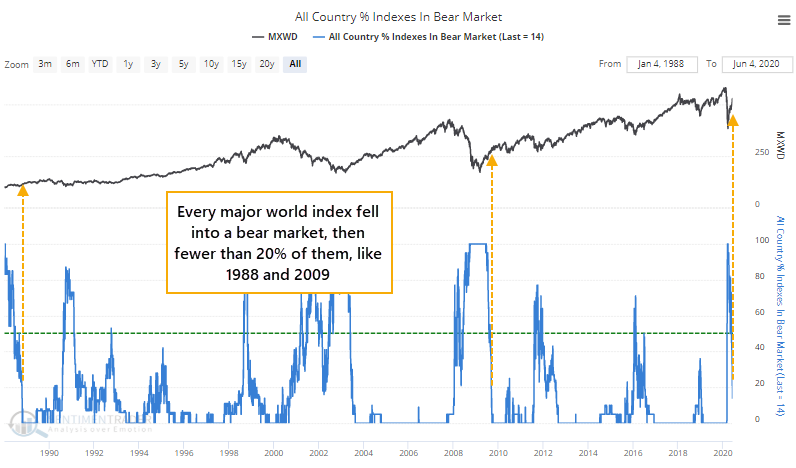
Overall, similar but less extreme recoveries preceded some choppy conditions for the MSCI World Index over the next couple of months, but they resolved higher over the next 6-12 months. All of them could be considered major recoveries.
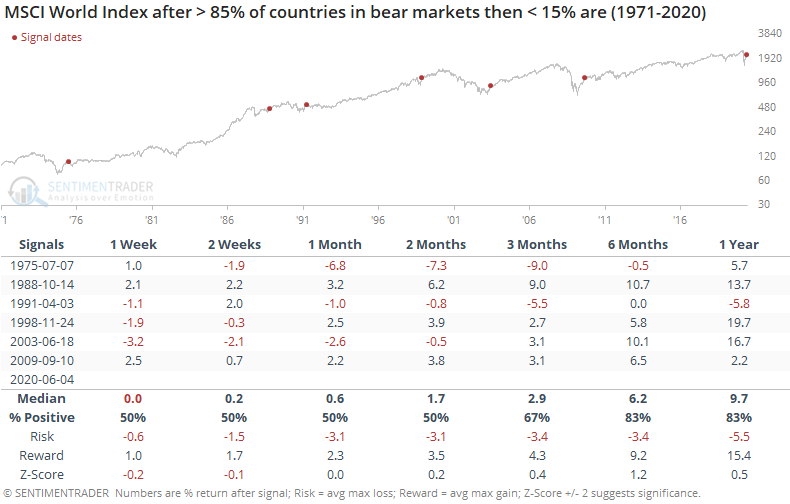
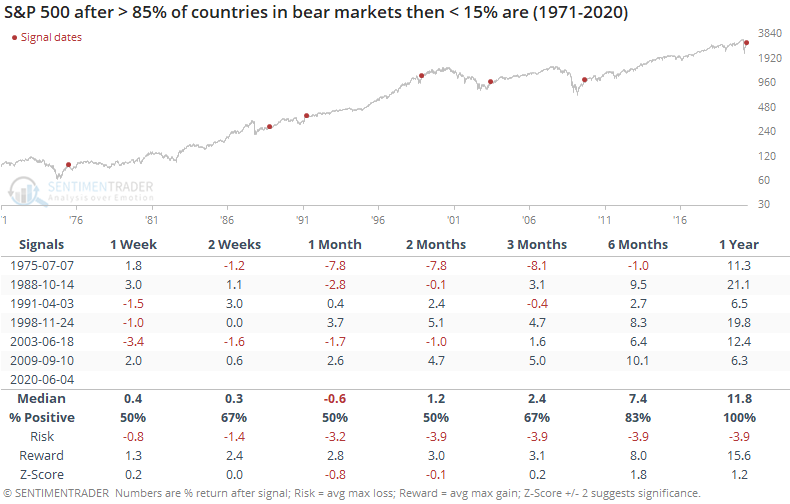
It was a good sign for domestic stocks, too. The S&P 500 was higher a year later every time.
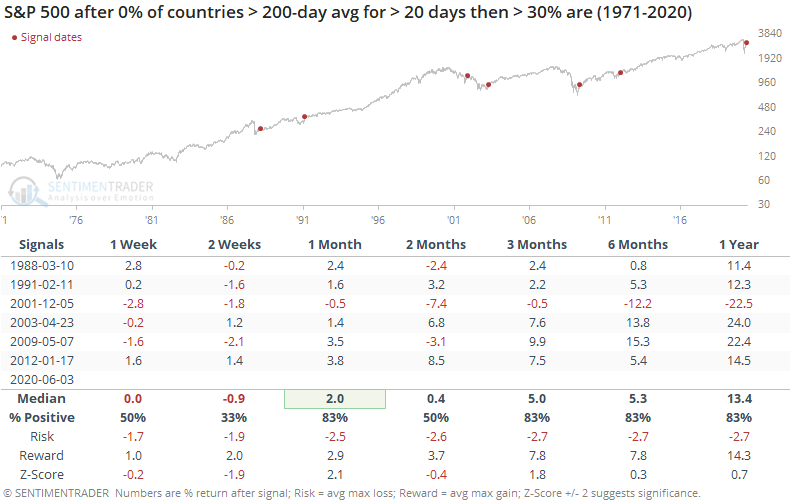
Related but different, for more than 50 days, not a single major world index we follow managed to close above its 200-day average, and now more than 30% of them have. Again, mostly a good sign worldwide.
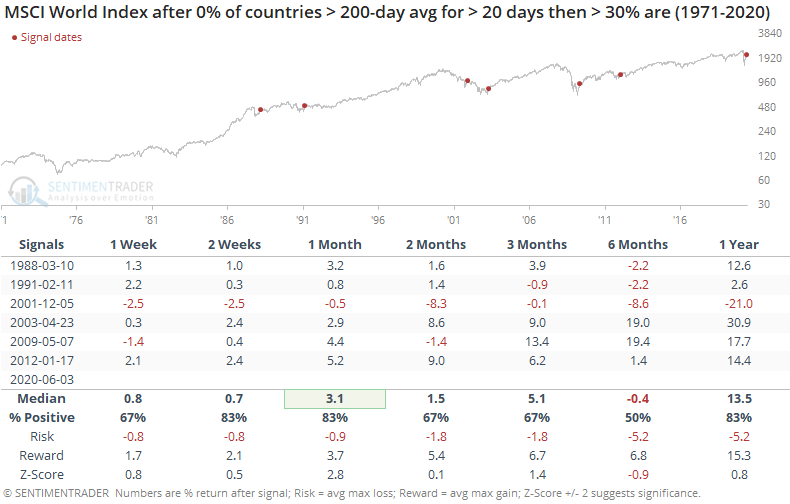
And domestically.
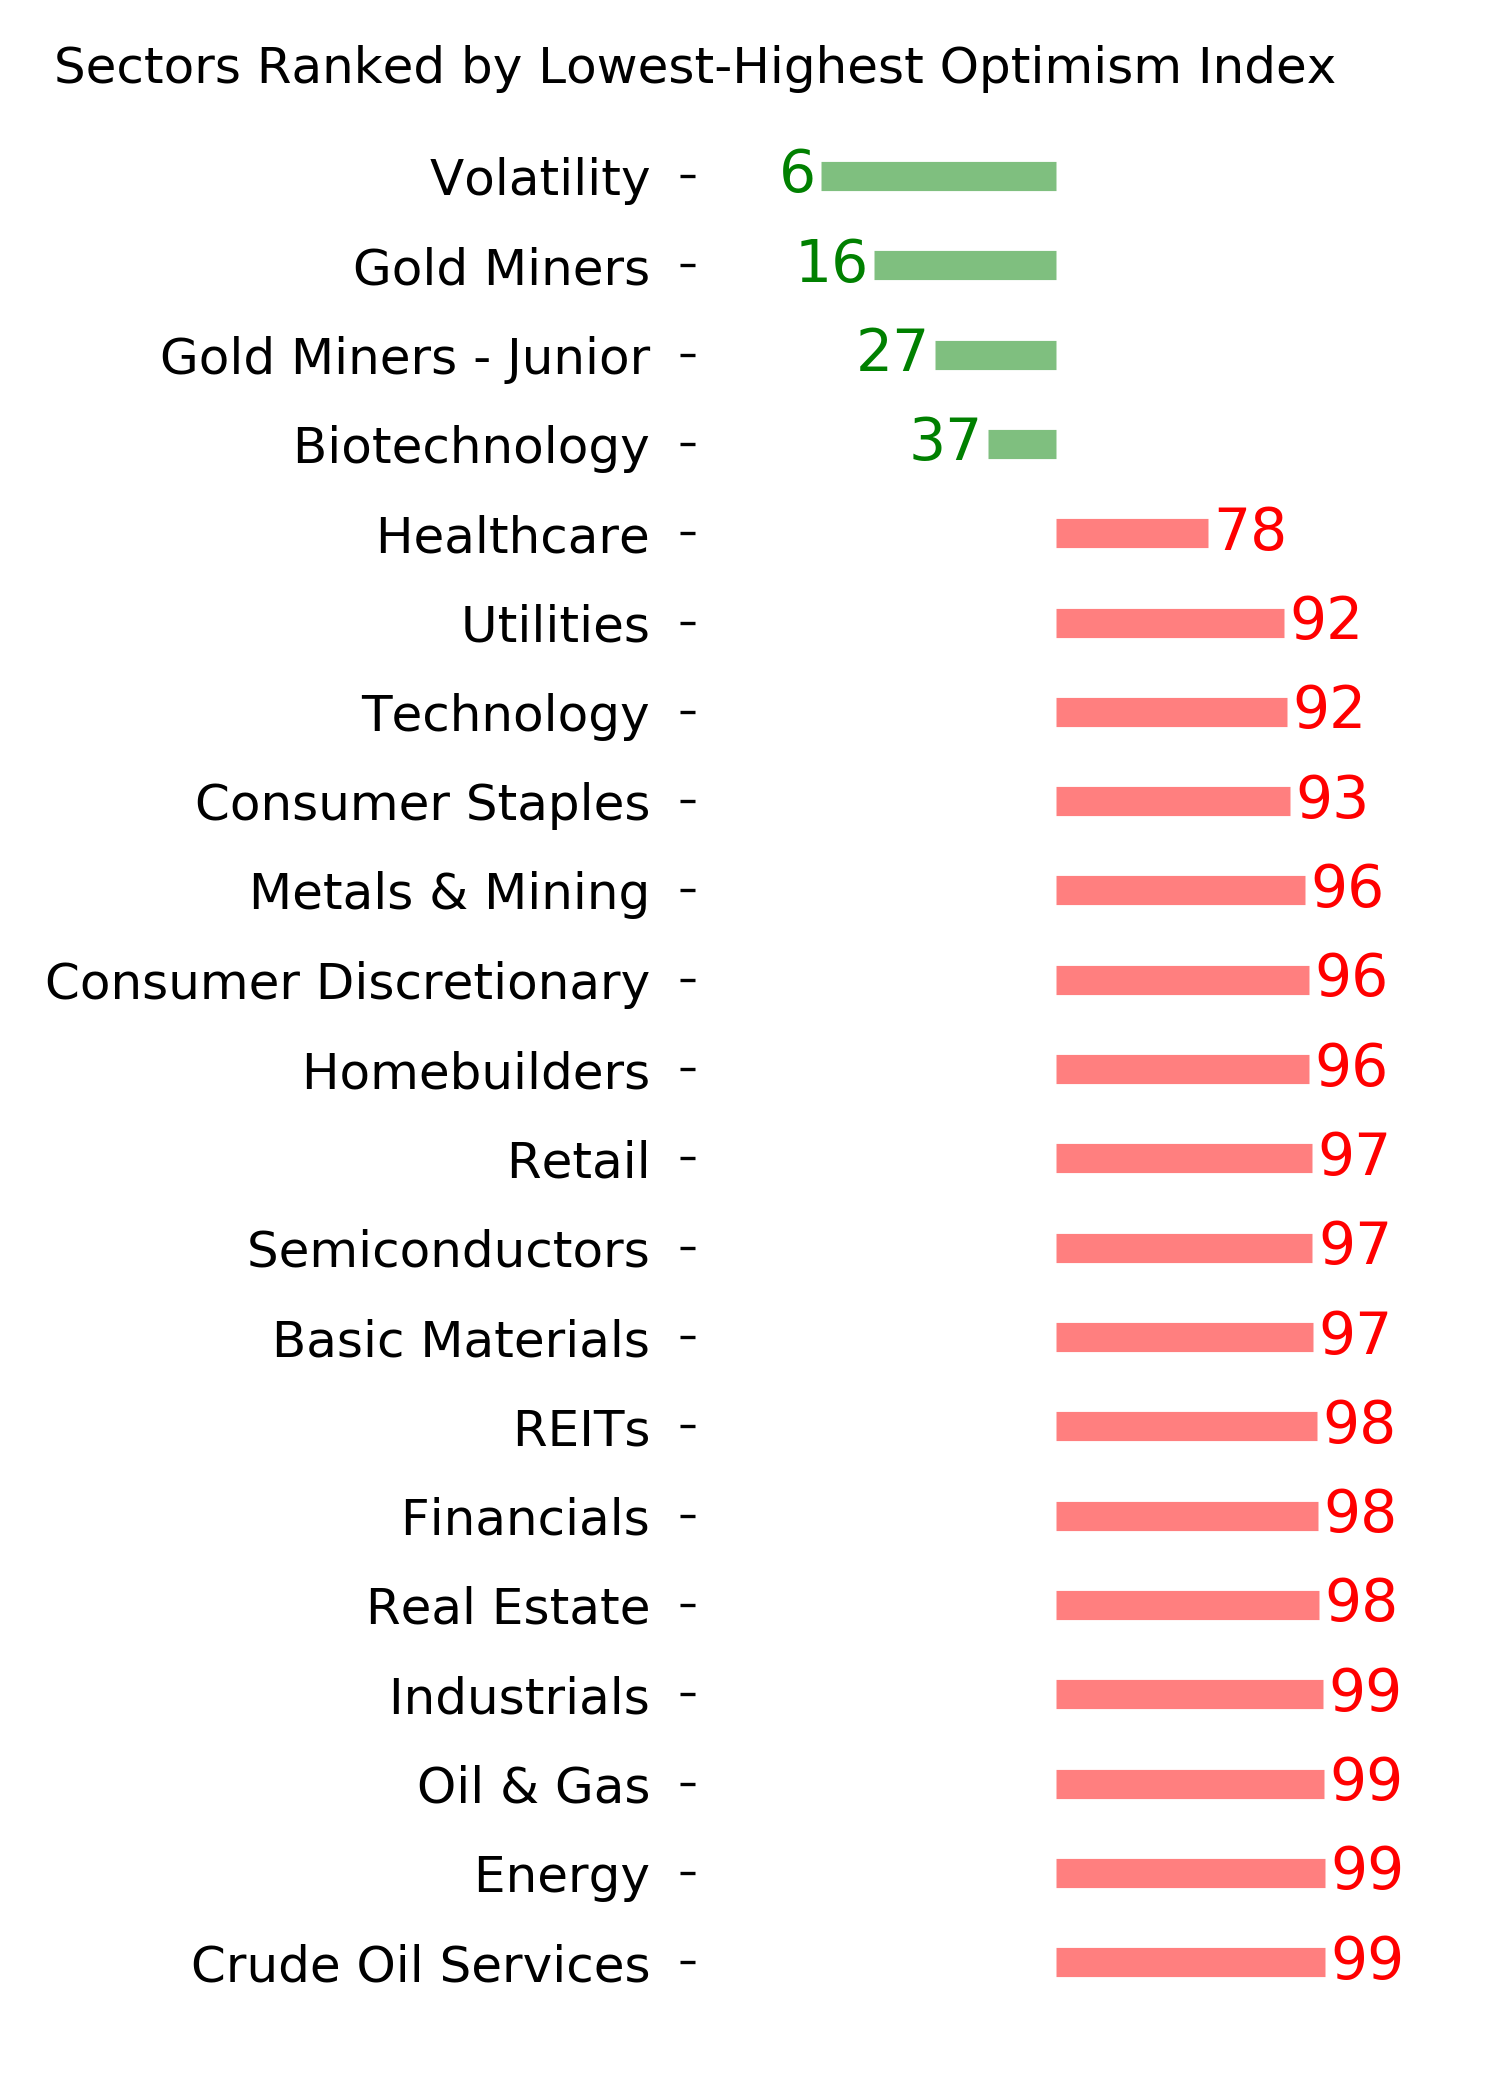
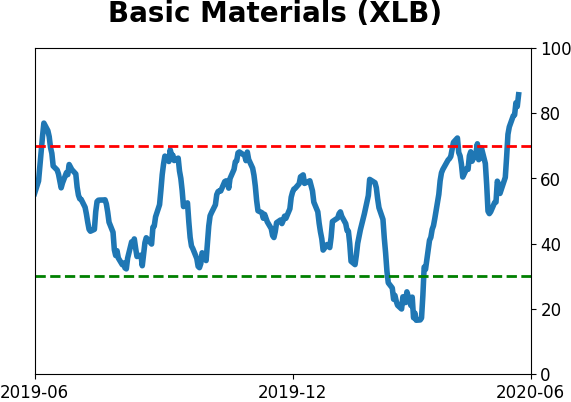
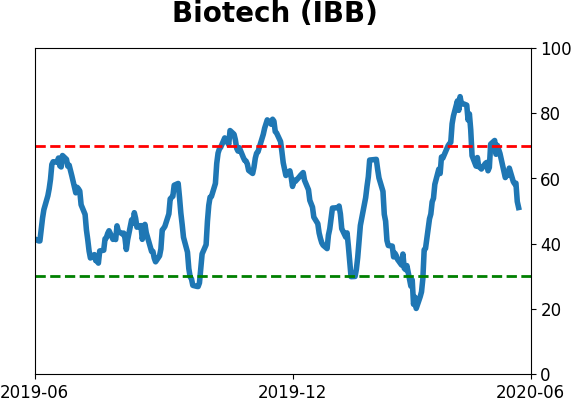
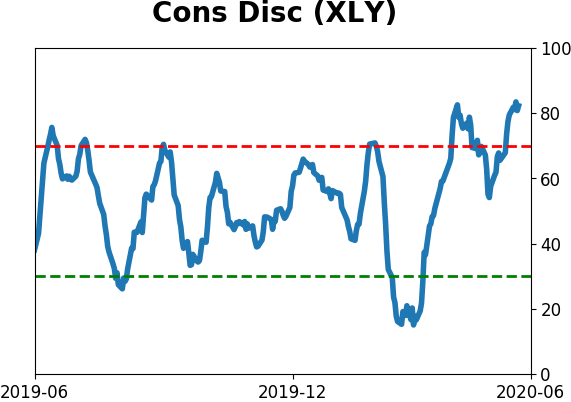
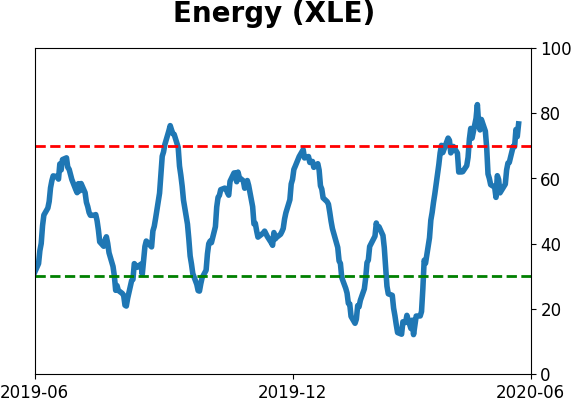
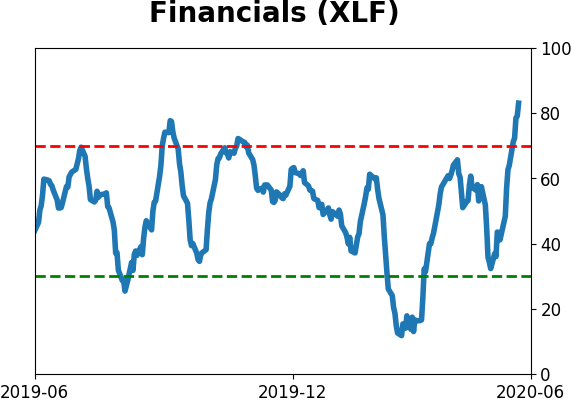
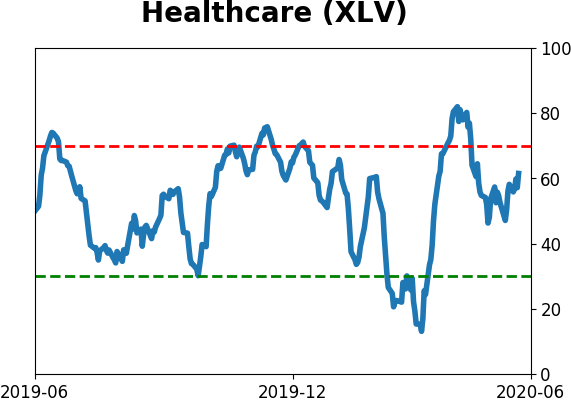
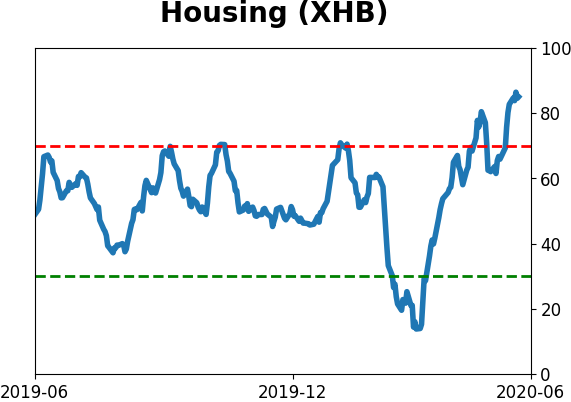
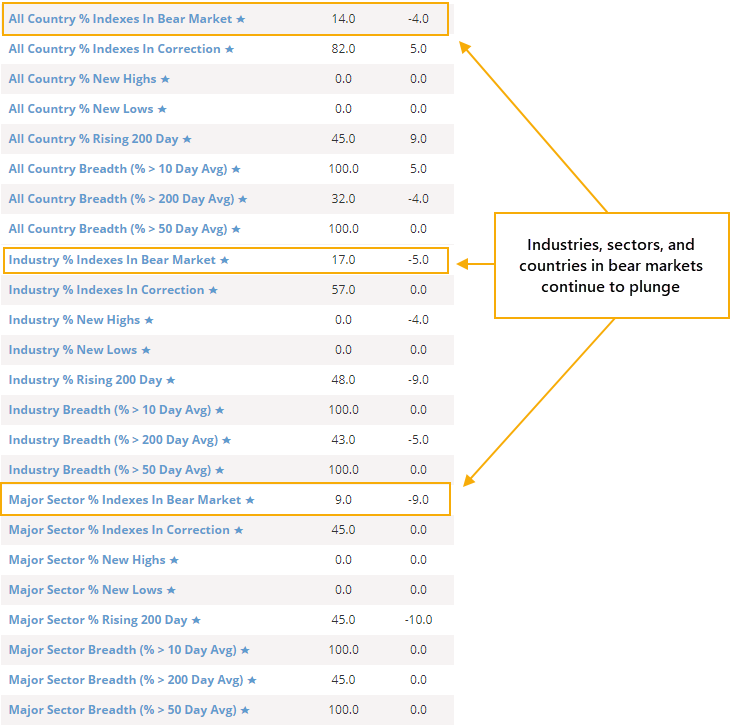
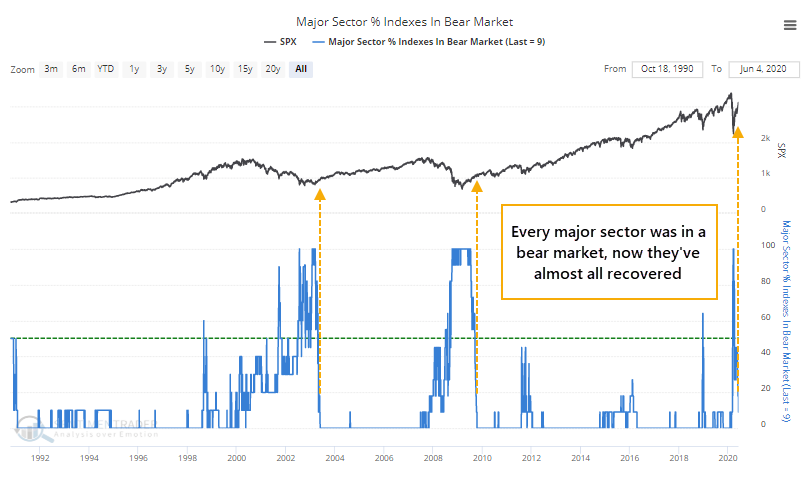
Among the 11 major U.S. sectors, all of them were in bear markets in March. Now, only one of them is. In the past 30 years, we've seen this kind of broad sector movement only at the ends of the last two protracted bear markets.
Drilling down to the U.S. industry level, almost every one of the 23 industries was in a bear market in March, now fewer than 20% of them are. This is quite a bit broader than the sector data, but with the same two precedents.
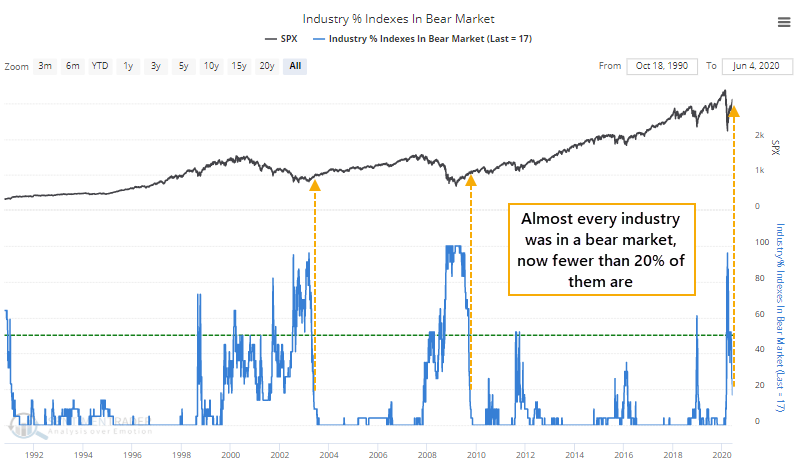
It's hard to compare what was basically a one-month bear market to the lasting devastation in 2001 and 2008, but the types of breadth readings witnessed each time is comparable. Maybe on a more compacted time frame, but similar severity. Like we saw with the thrusts and recoveries earlier this week, it's hard to ignore the positive long-term implications.
BOTTOM LINE
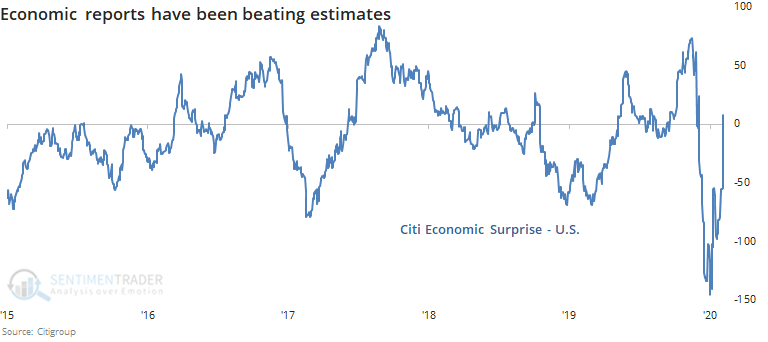
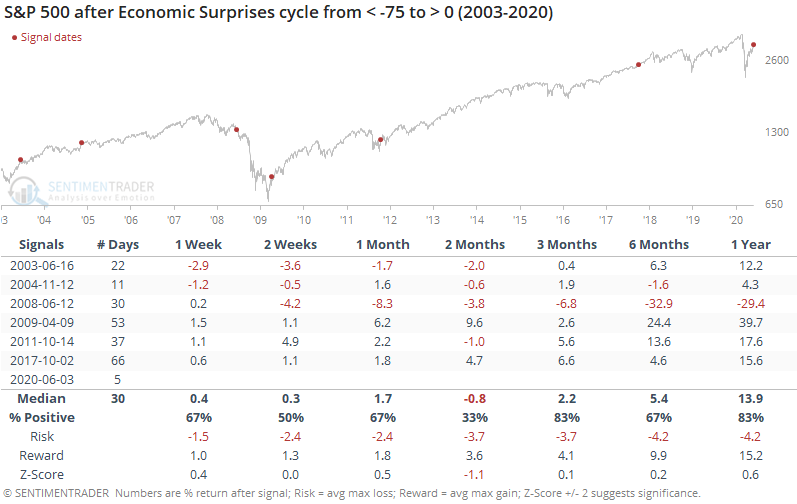
Thanks to improvements in labor market indicators, economic surprises in the U.S. have turned positive. This happens when economists extrapolate recent bad news into the future and become too negative on the prospects for a recovery. The positive turn in surprises has reversed record low readings.
FORECAST / TIMEFRAME
None
|
Despite the gloomy headlines, economic reports have been better than expected. Thanks in large part to reports that were much better than economists' guesses on the labor market (which continued on Friday in a massive way), the overall tone of economic surprises have turned positive after the worst reading in history just a few weeks ago.
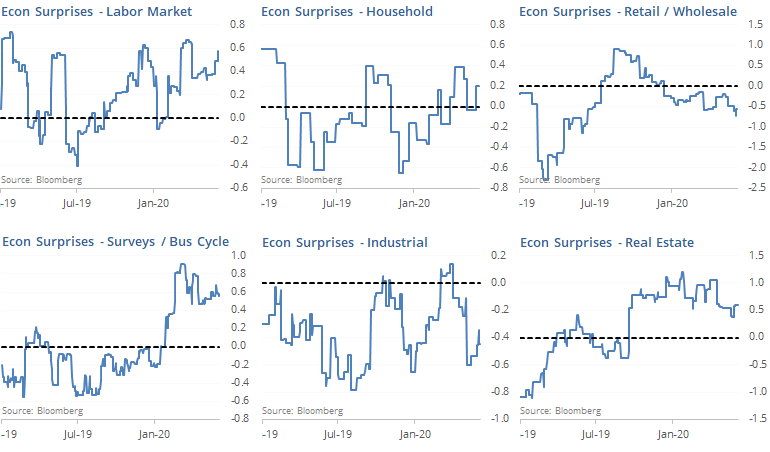
Bloomberg's version of economic surprises generally tracks well with Citigroup's, and we can see that among individual components, labor market surprises have helped push up the overall indicator.
There is a strong tendency to link economics and markets, which is usually a mistake. While it sounds good in theory that improving economics, relative to expectations, should drive stocks higher, it was inconsistent as a driver of forward returns for the S&P 500.
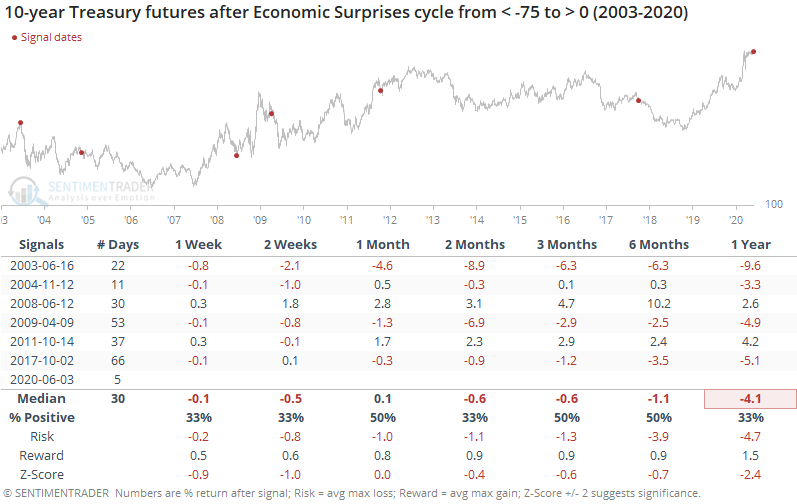
It was not so great for bonds. 10-year Treasury futures often got slammed after these reversals.
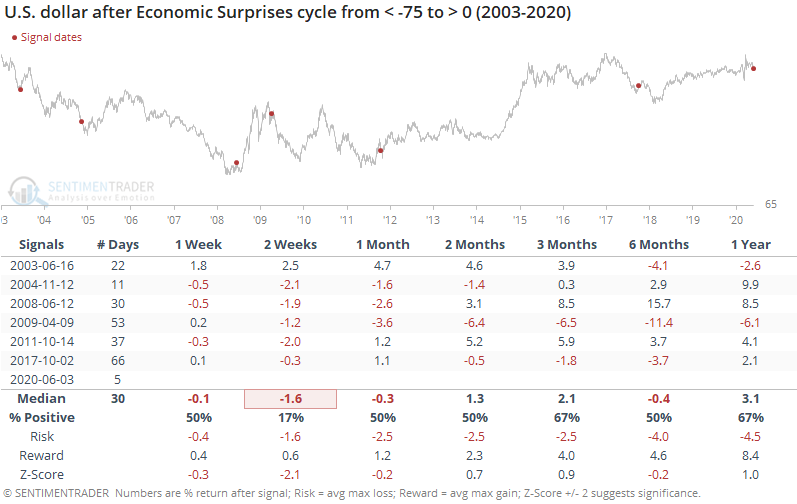
The dollar tended to sink right away, then was mixed.
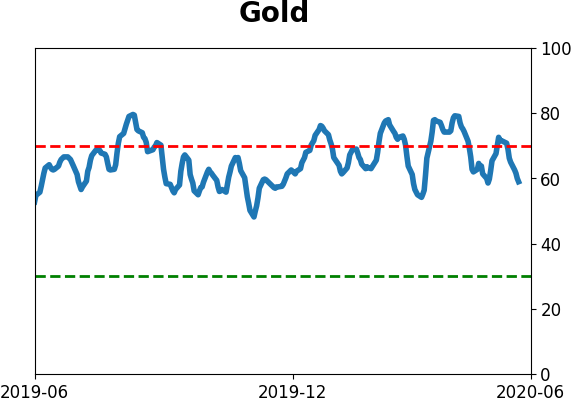
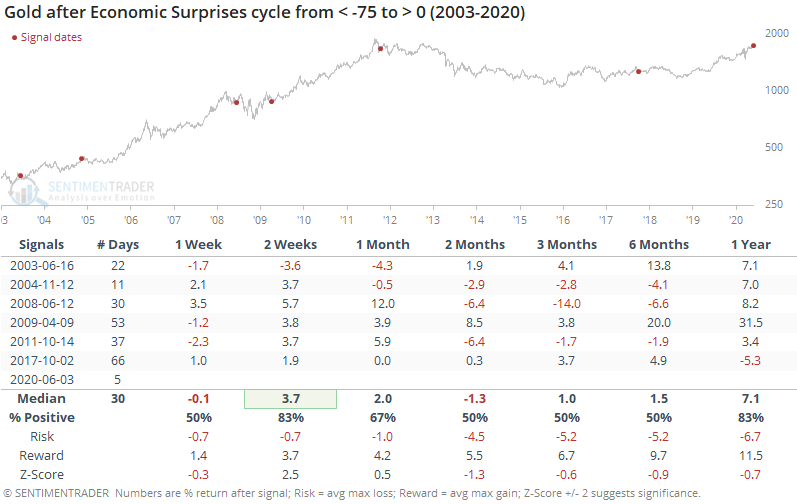
Because the dollar tended to sink shorter-term, it benefited gold, but after that, there was no clear pattern.
With continued improvement in the labor indicators, we'll likely see the various economic surprise indicators jump in the days ahead. They will be shared far and wide, and assumed to be continued good news for stocks. For the most part, it is a positive, but a minor one only.
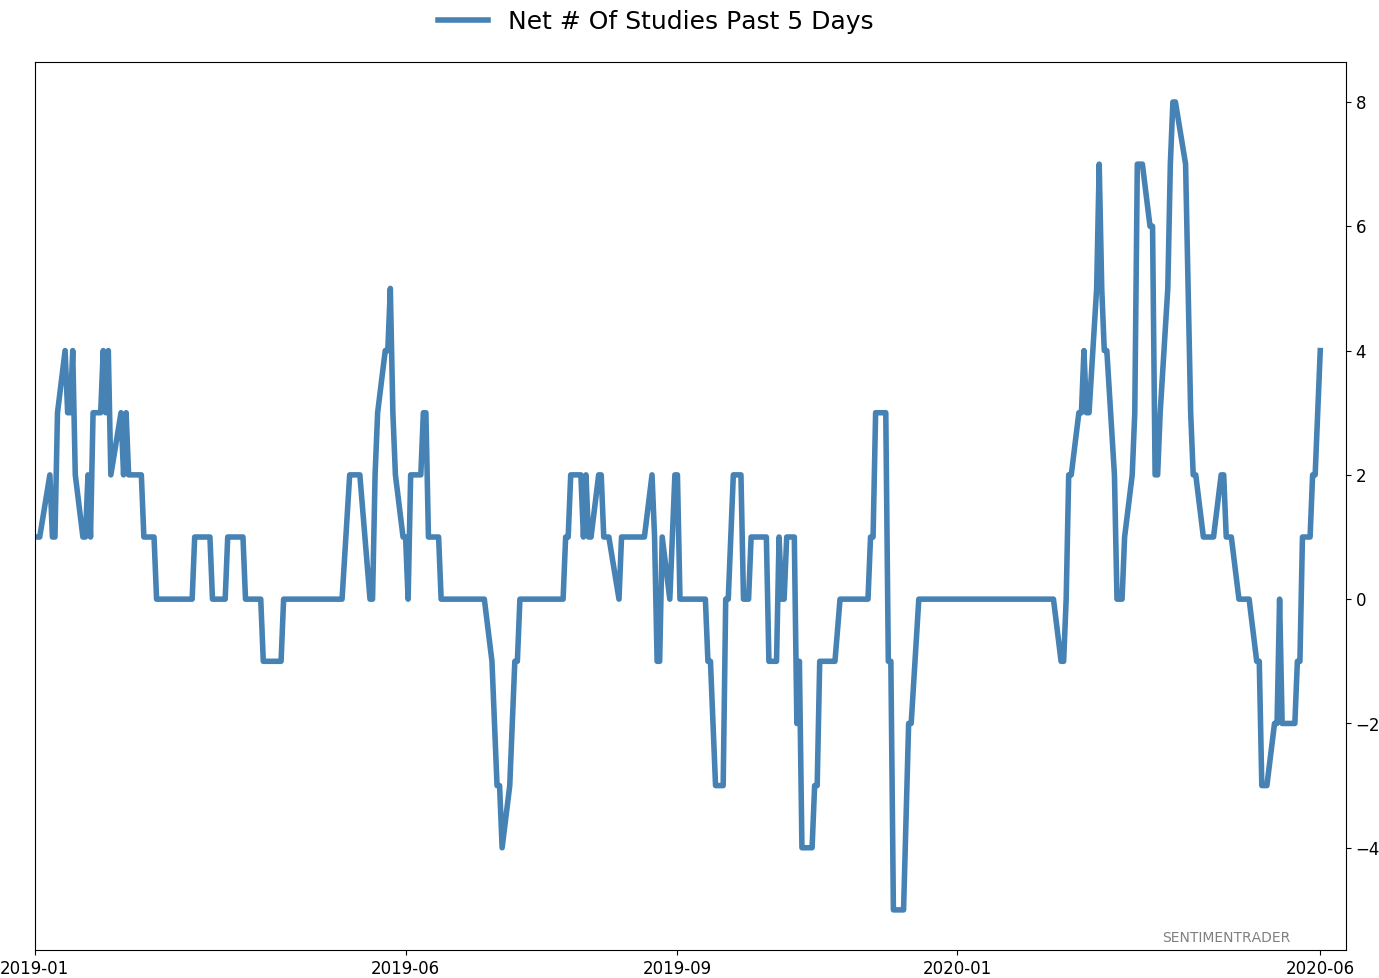
Active Studies
| Time Frame | Bullish | Bearish | | Short-Term | 0 | 1 | | Medium-Term | 8 | 4 | | Long-Term | 39 | 1 |
|
Indicators at Extremes
Portfolio
| Position | Weight % | Added / Reduced | Date | | Stocks | 38.9 | Reduced 10% | 2020-05-13 | | Bonds | 0.0 | Reduced 6.7% | 2020-02-28 | | Commodities | 5.1 | Added 2.4%
| 2020-02-28 | | Precious Metals | 0.0 | Reduced 3.6% | 2020-02-28 | | Special Situations | 0.0 | Reduced 31.9% | 2020-03-17 | | Cash | 56.0 | | |
|
Updates (Changes made today are underlined)
In the first months of the year, we saw manic trading activity. From big jumps in specific stocks to historic highs in retail trading activity to record highs in household confidence to almost unbelievable confidence among options traders. All of that came amid a market where the average stock couldn't keep up with their indexes. There were signs of waning momentum in stocks underlying the major averages, which started triggering technical warning signs in late January. The kinds of extremes we saw in December and January typically take months to wear away, but the type of selling in March went a long way toward getting there. When we place the kind of moves we saw into March 23 into the context of coming off an all-time high, there has been a high probability of a multi-month rebound. After stocks bottomed on the 23rd, they enjoyed a historic buying thrust and retraced a larger amount of the decline than "just a bear market rally" tends to. Those thrusts are the most encouraging sign we've seen in years. Even through early June, we're still seeing thrusts that have led to recoveries in longer-term breadth metrics. By early May, we were seeing some troubling signs of shorter-term speculation, and buyers have run right over those. This is what bull markets do. In bear markets, they don't get a chance, as sellers tend to come in as soon as sentiment moves to neutral or slightly optimistic. That didn't happen this time, and the rally has gone way further, and way longer, than "just a bear market rally" does. I am the world's worst momentum trader, and this is one of the most anguishing kinds of markets for me. I detest chasing prices higher, especially in the face of readings like high Dumb Money Confidence and small trader call buying. I recognize the overwhelming positives of the recoveries noted above, and it's impossible to ignore the medium- to long-term positive implications. I'm holding out on adding exposure for now, based on the negatives that have been generated (and so far failed), at the risk of falling further behind a new roaring bull market.
RETURN YTD: -4.8% 2019: 12.6%, 2018: 0.6%, 2017: 3.8%, 2016: 17.1%, 2015: 9.2%, 2014: 14.5%, 2013: 2.2%, 2012: 10.8%, 2011: 16.5%, 2010: 15.3%, 2009: 23.9%, 2008: 16.2%, 2007: 7.8%
|
|
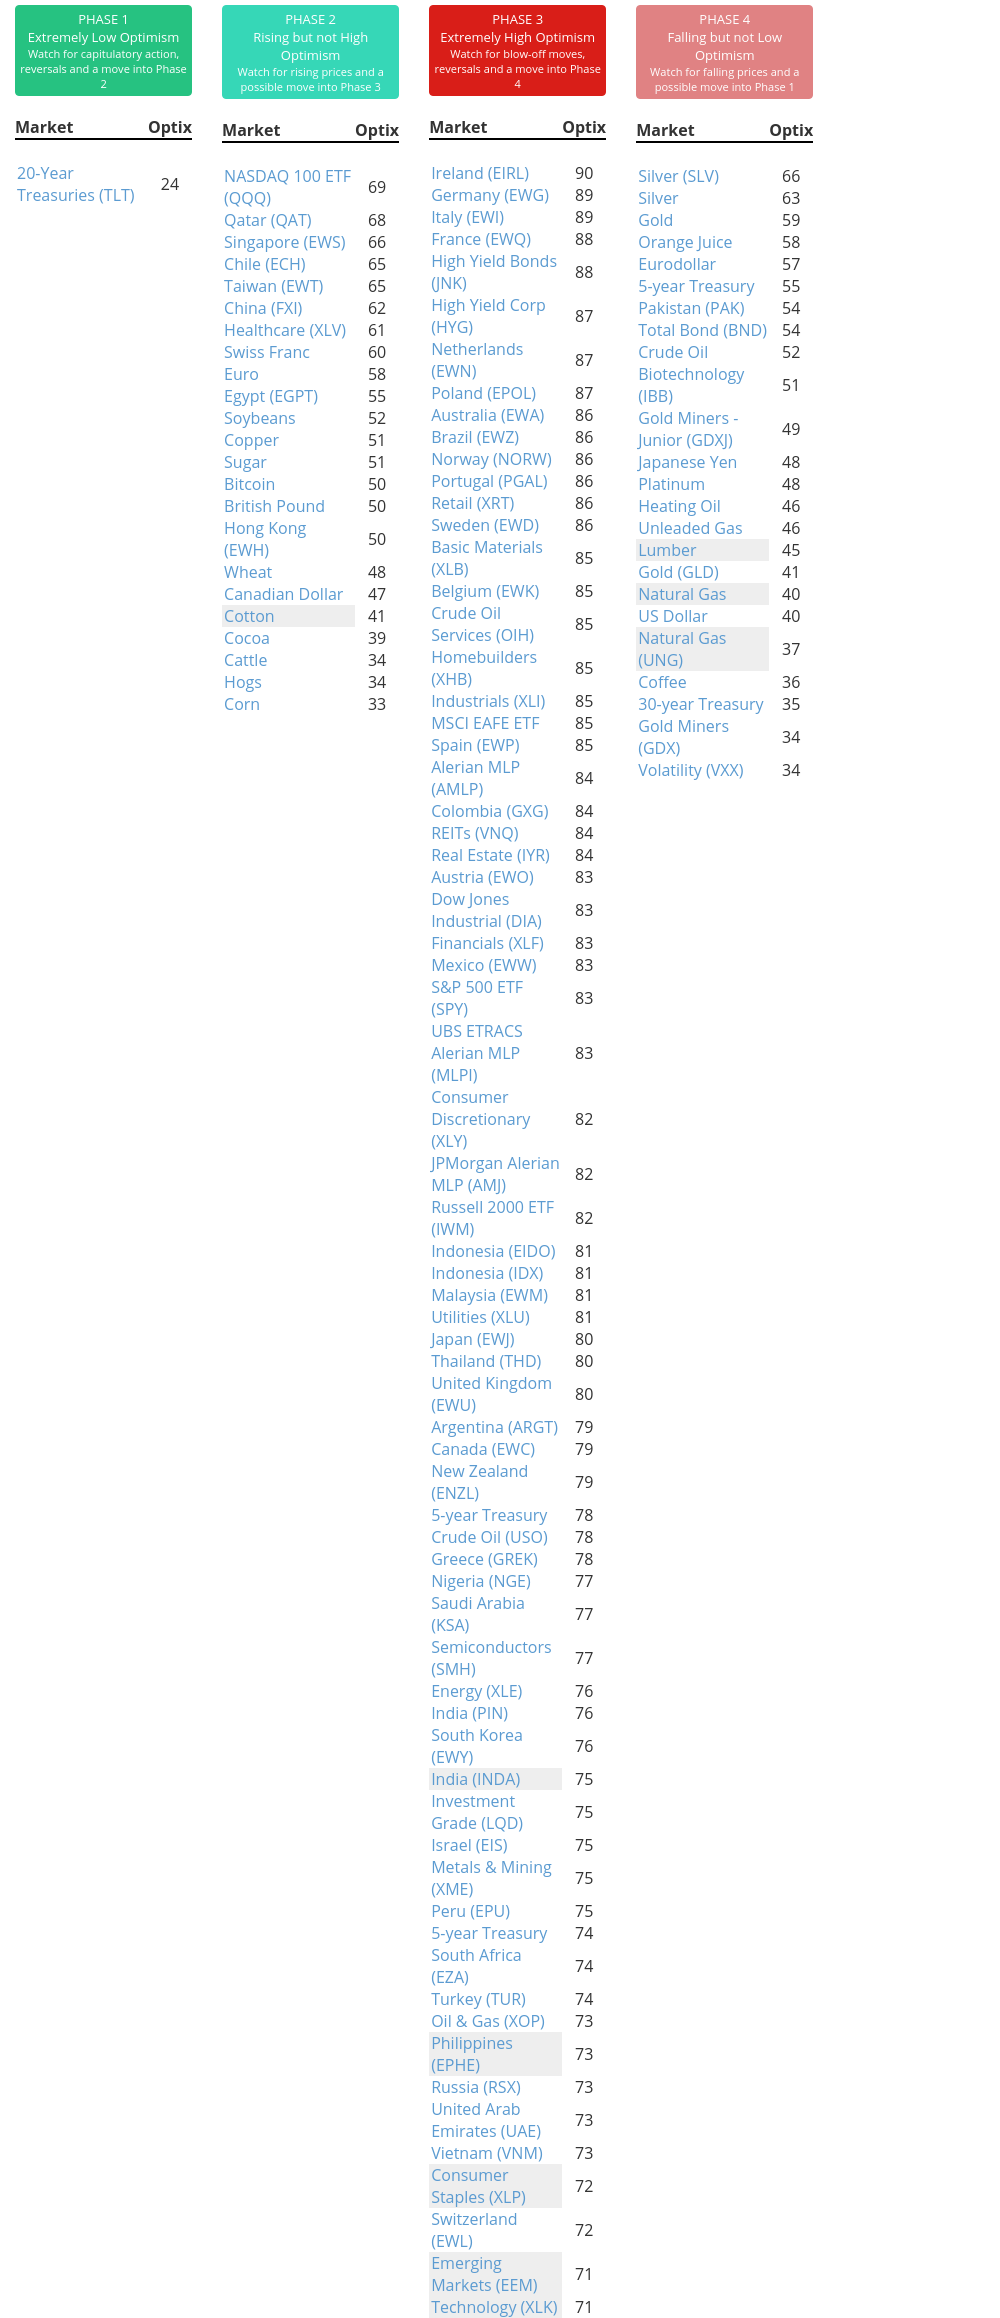
Phase Table
Ranks
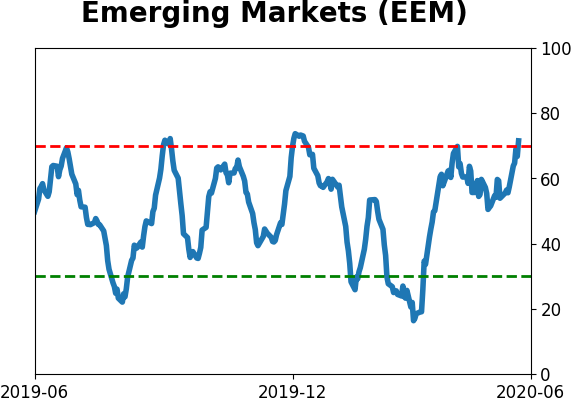
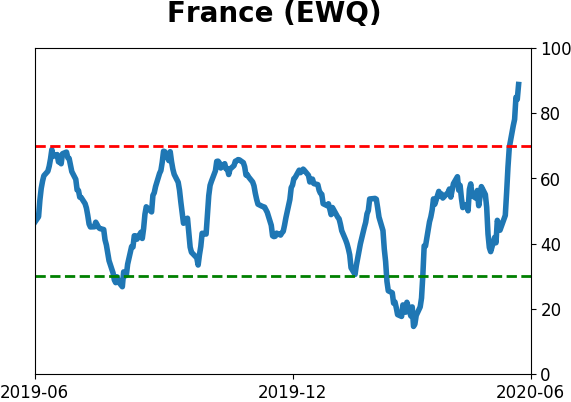
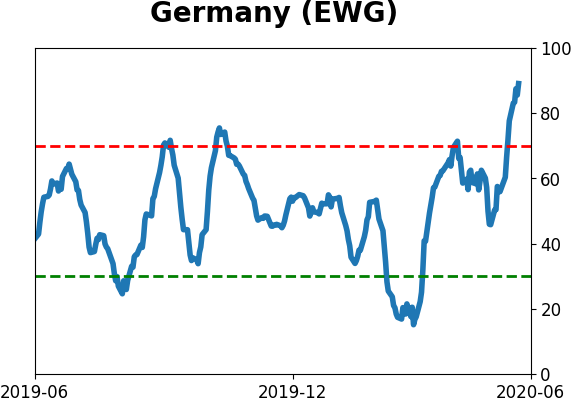
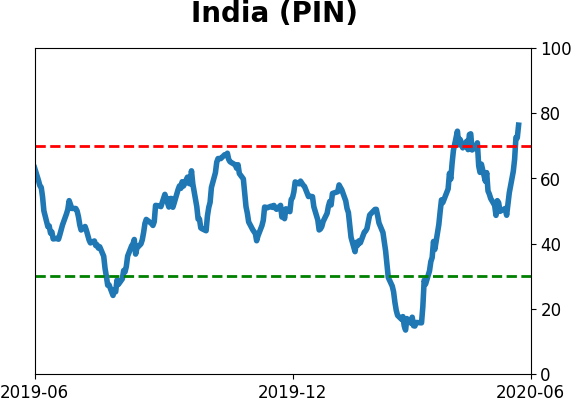
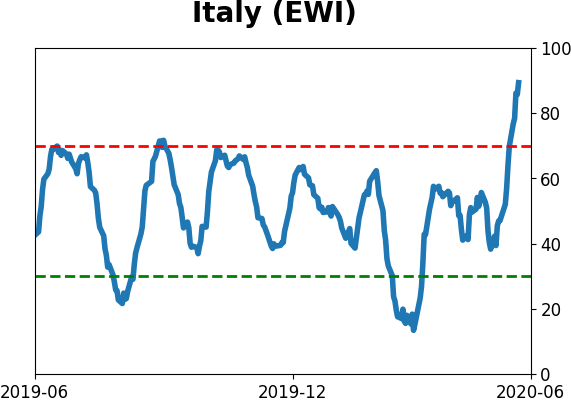
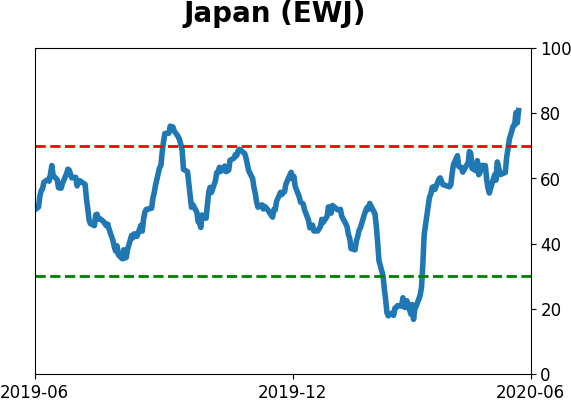
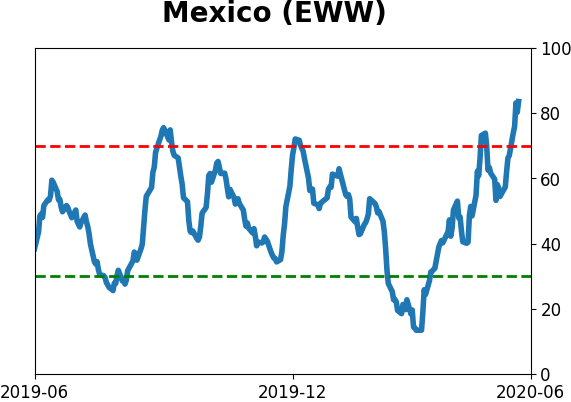
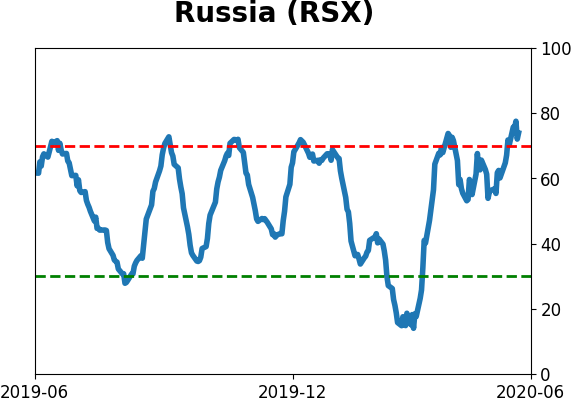
Sentiment Around The World
Optimism Index Thumbnails
|
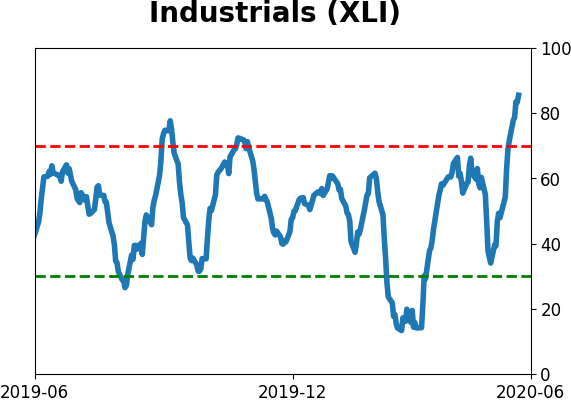
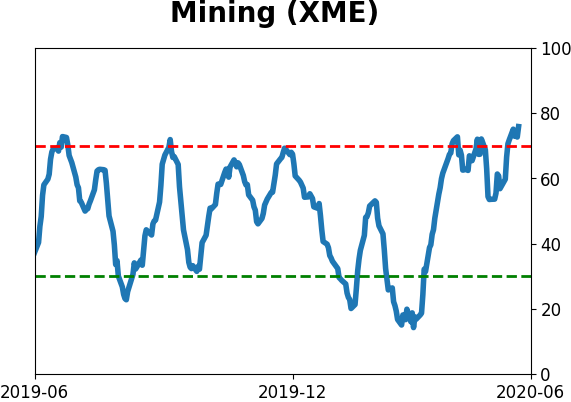
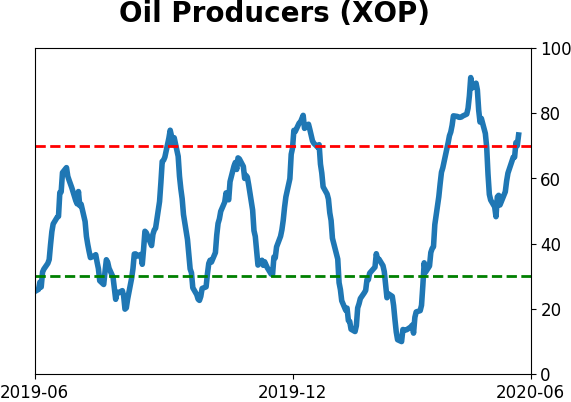
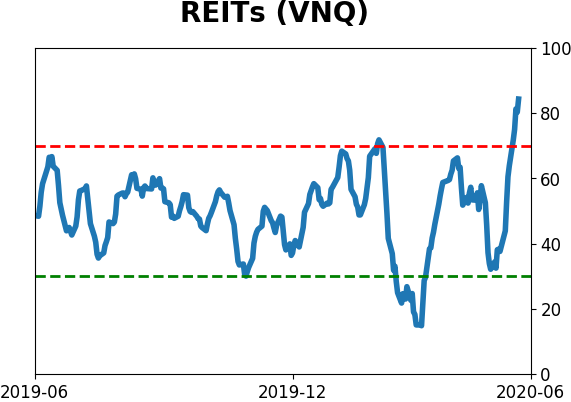
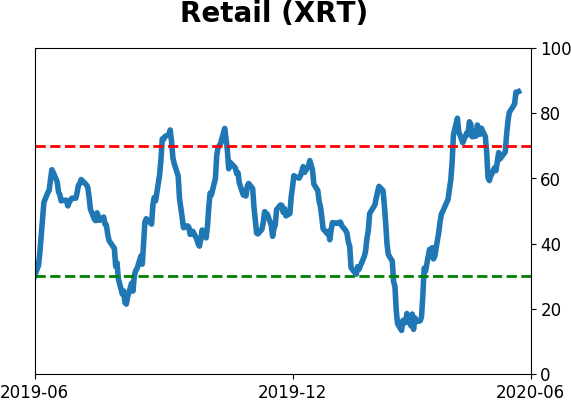
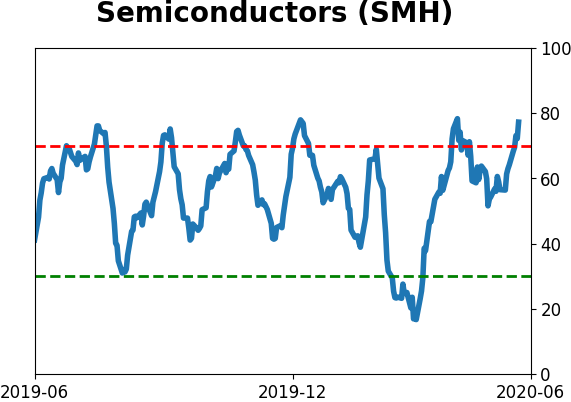
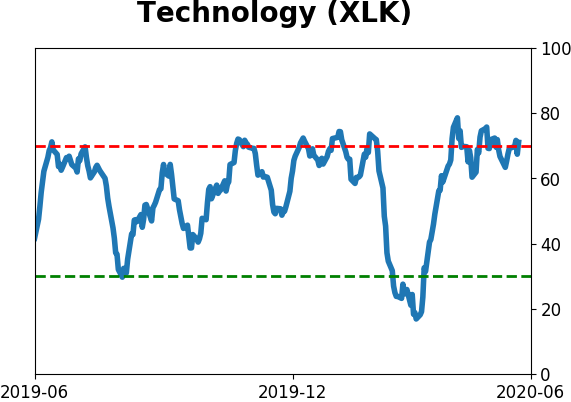
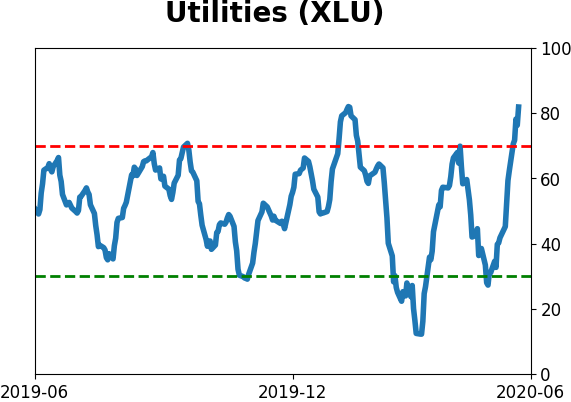
Sector ETF's - 10-Day Moving Average
|
|
|
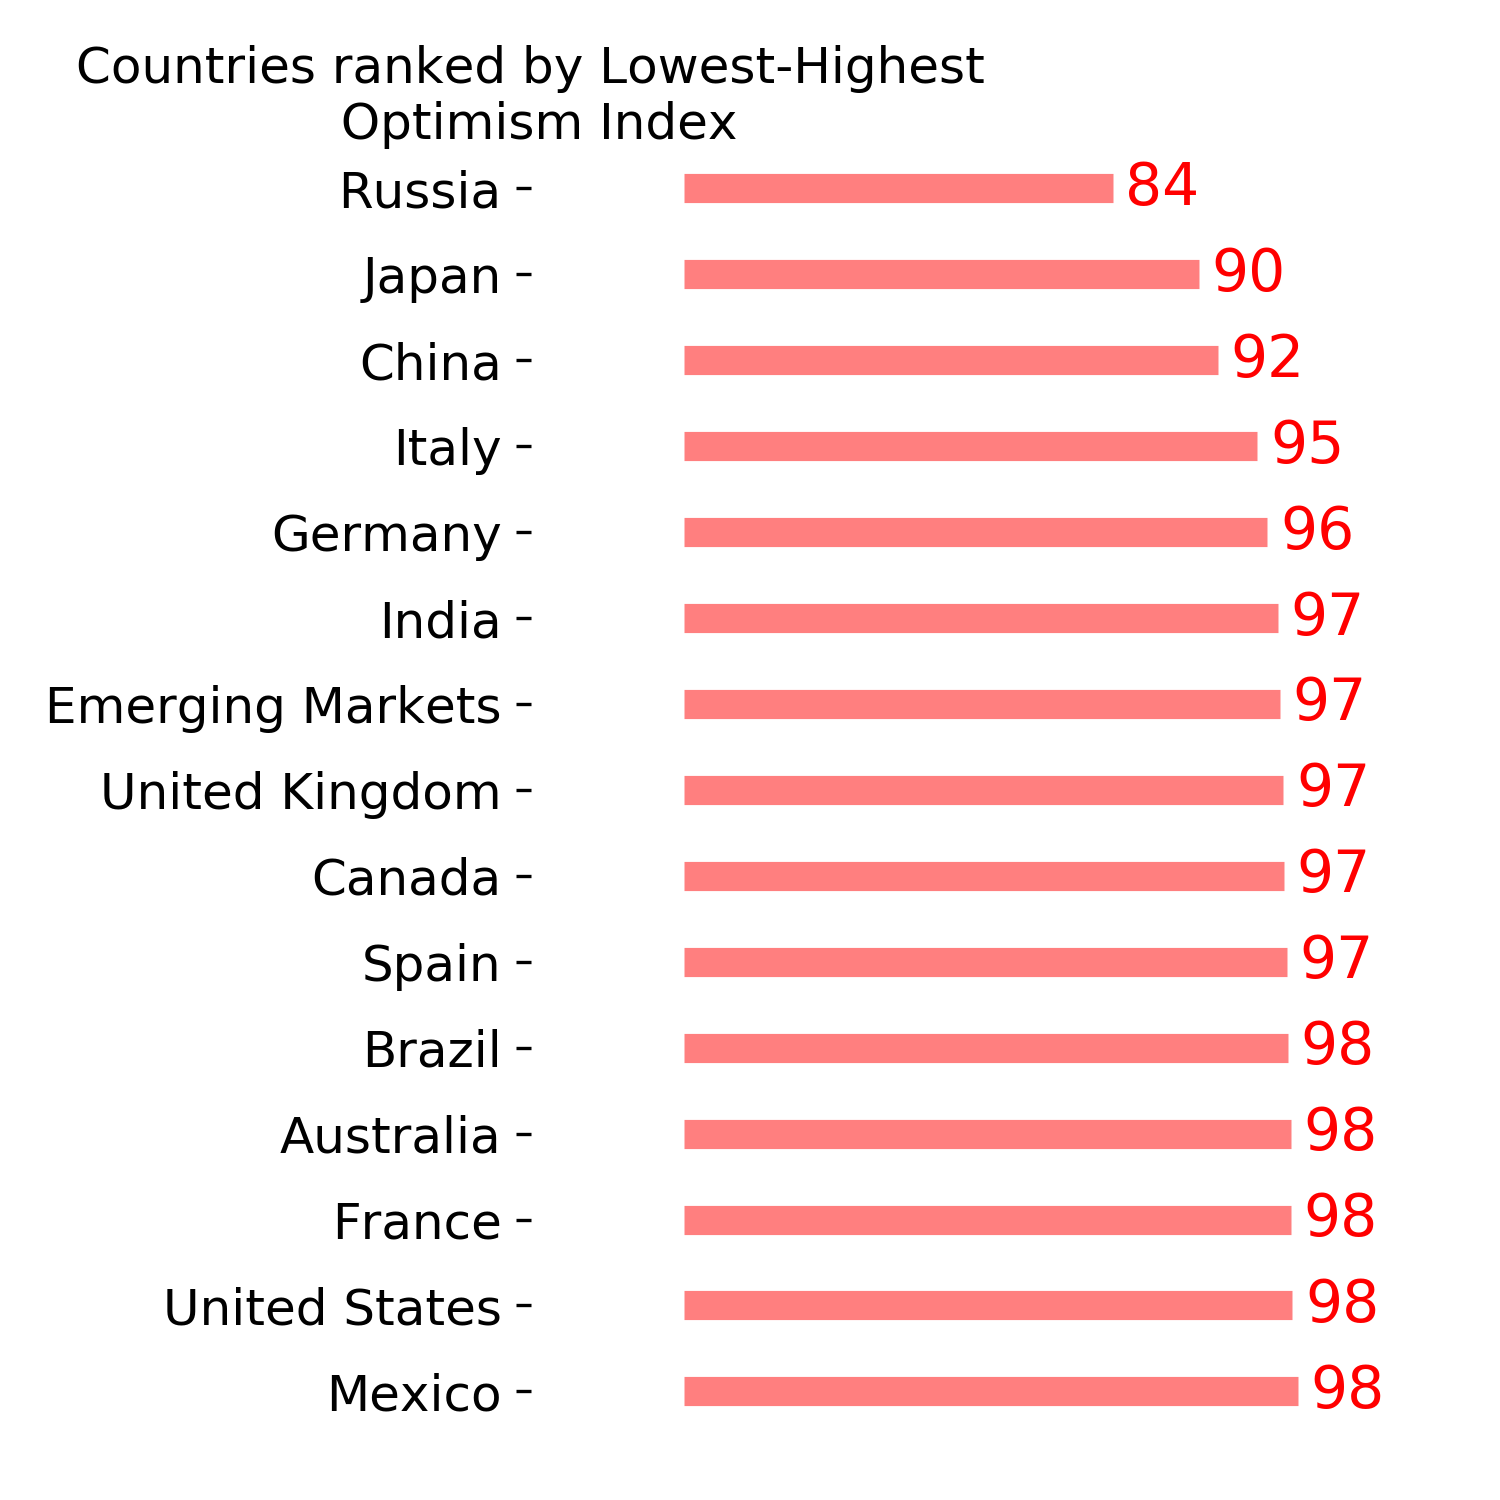
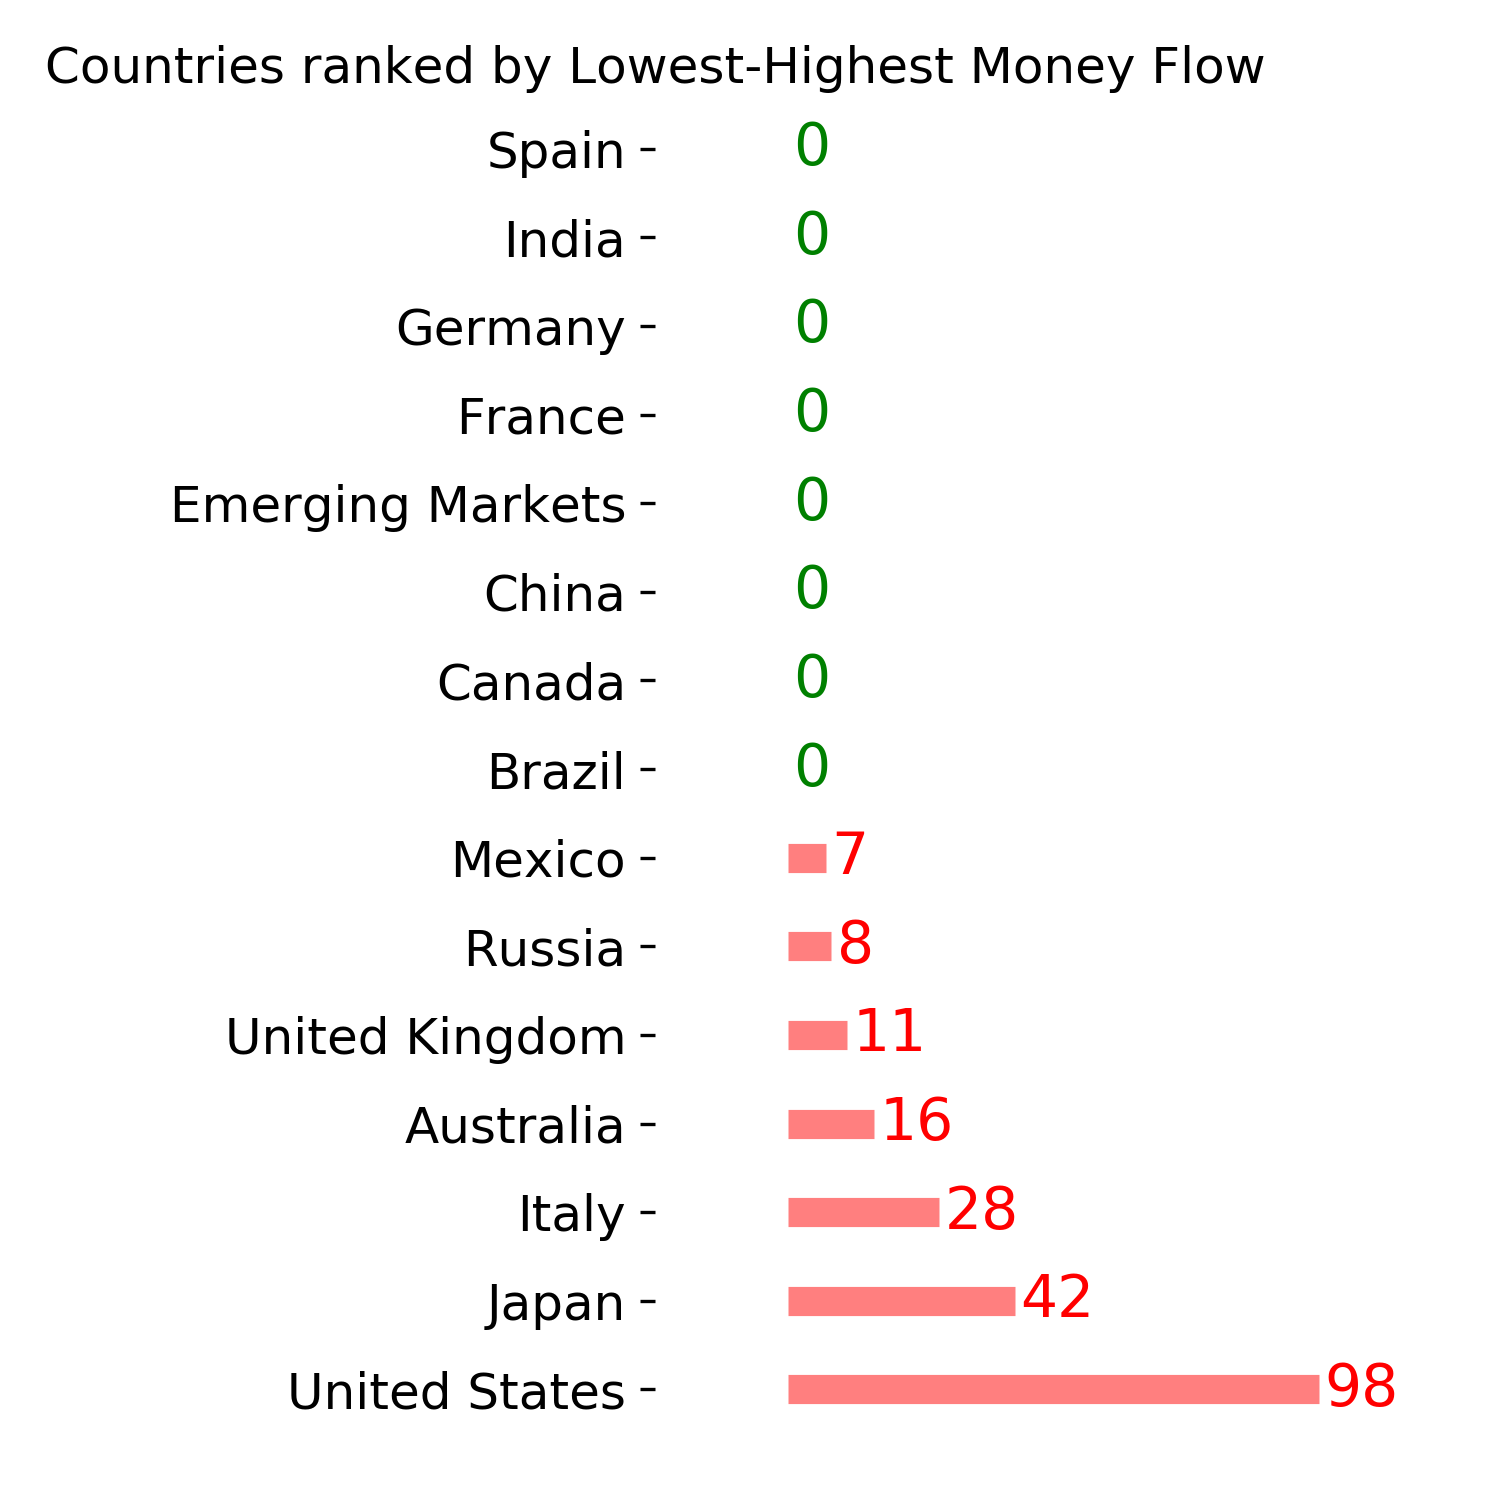
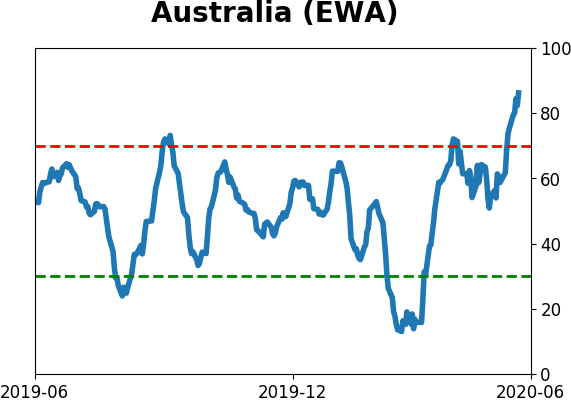
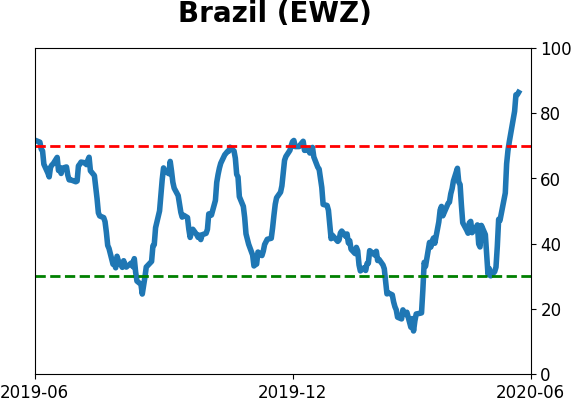
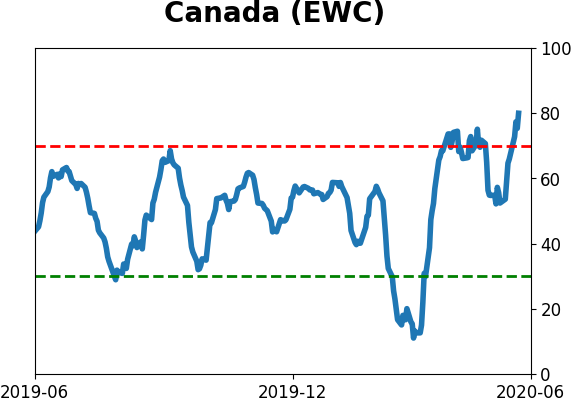
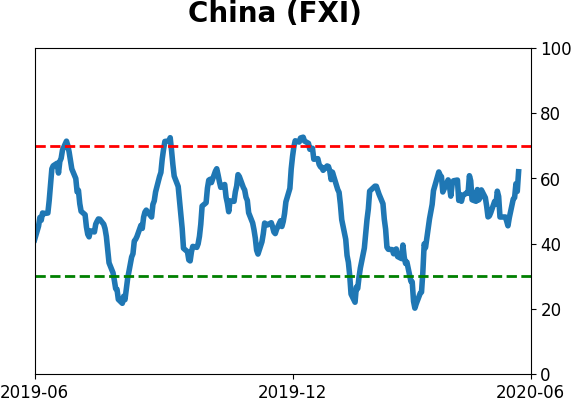
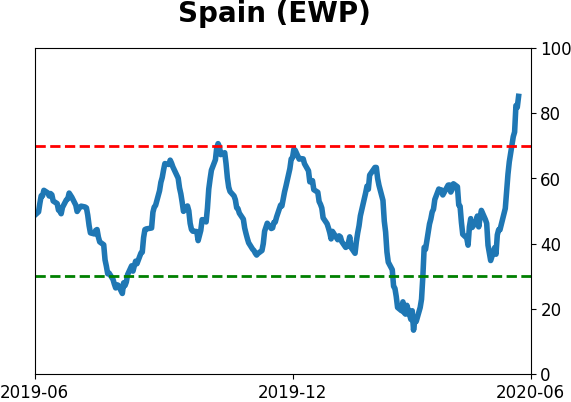
Country ETF's - 10-Day Moving Average
|
|
|
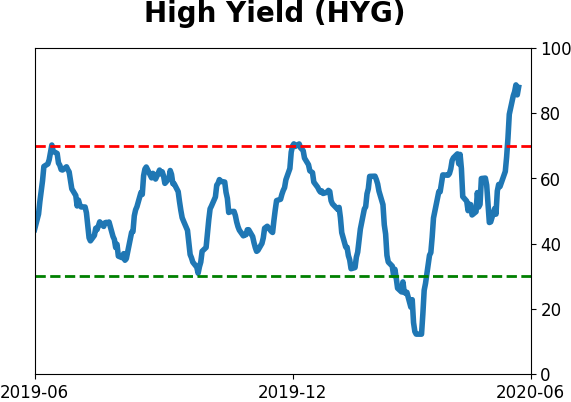
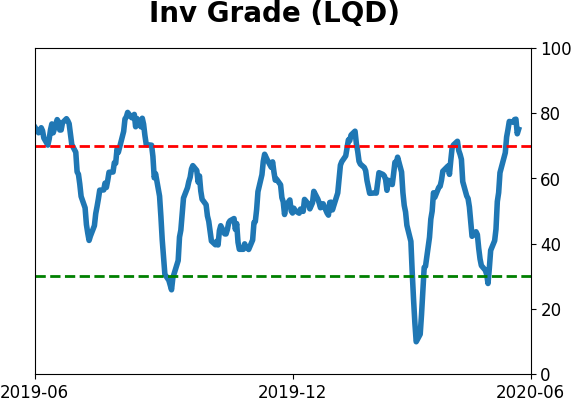
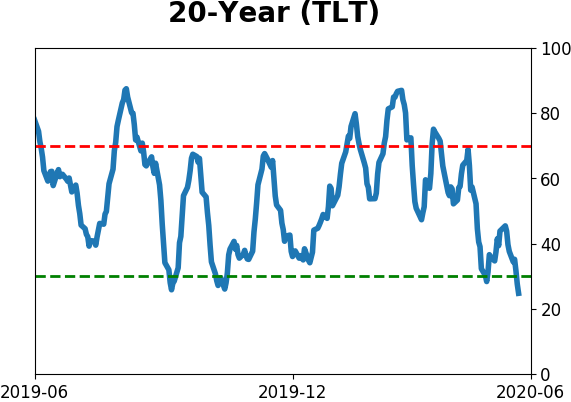
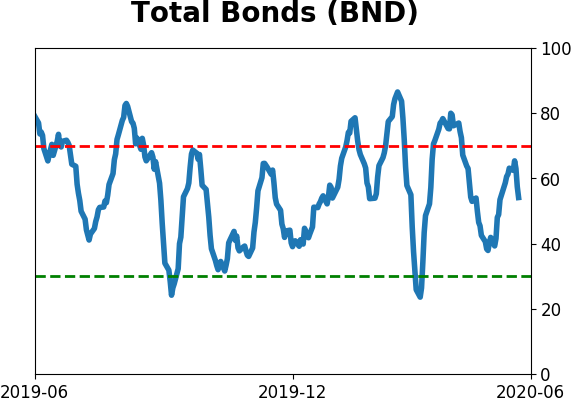
Bond ETF's - 10-Day Moving Average
|
|
|
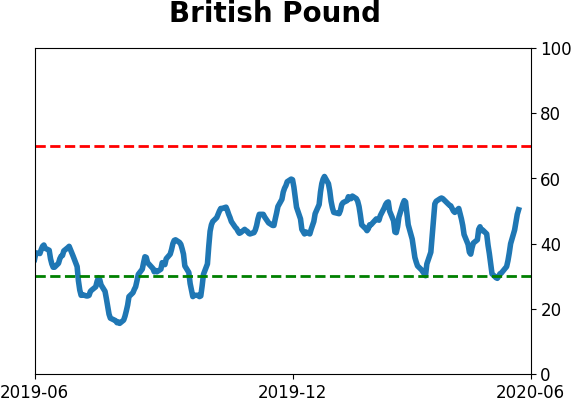
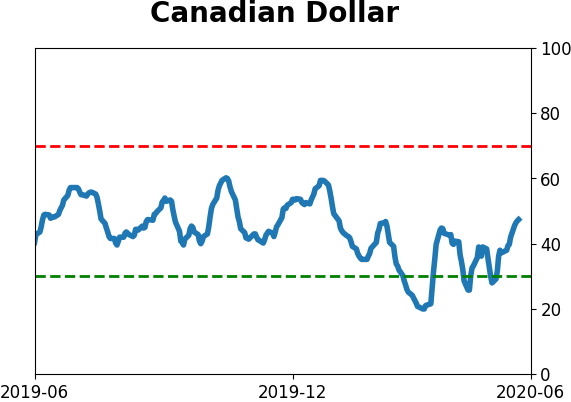
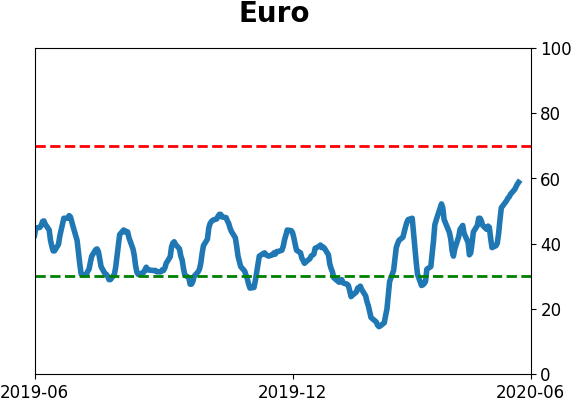
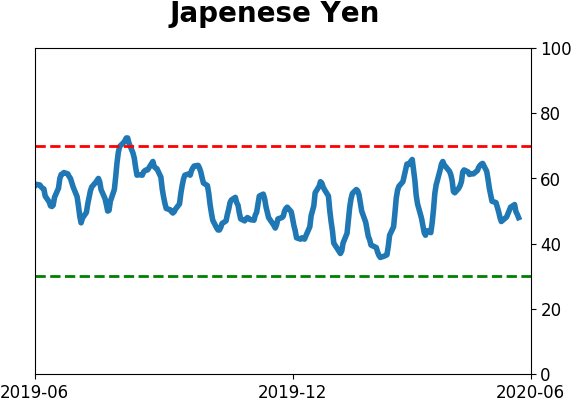
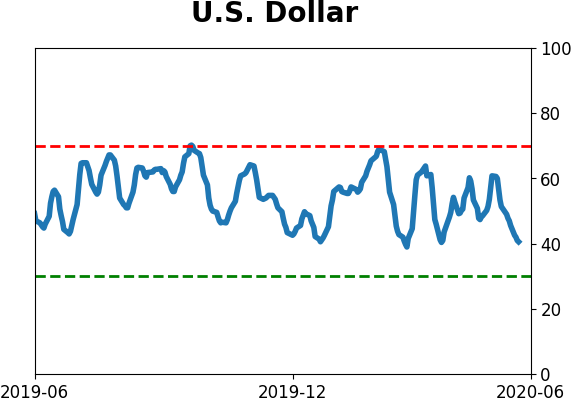
Currency ETF's - 5-Day Moving Average
|
|
|
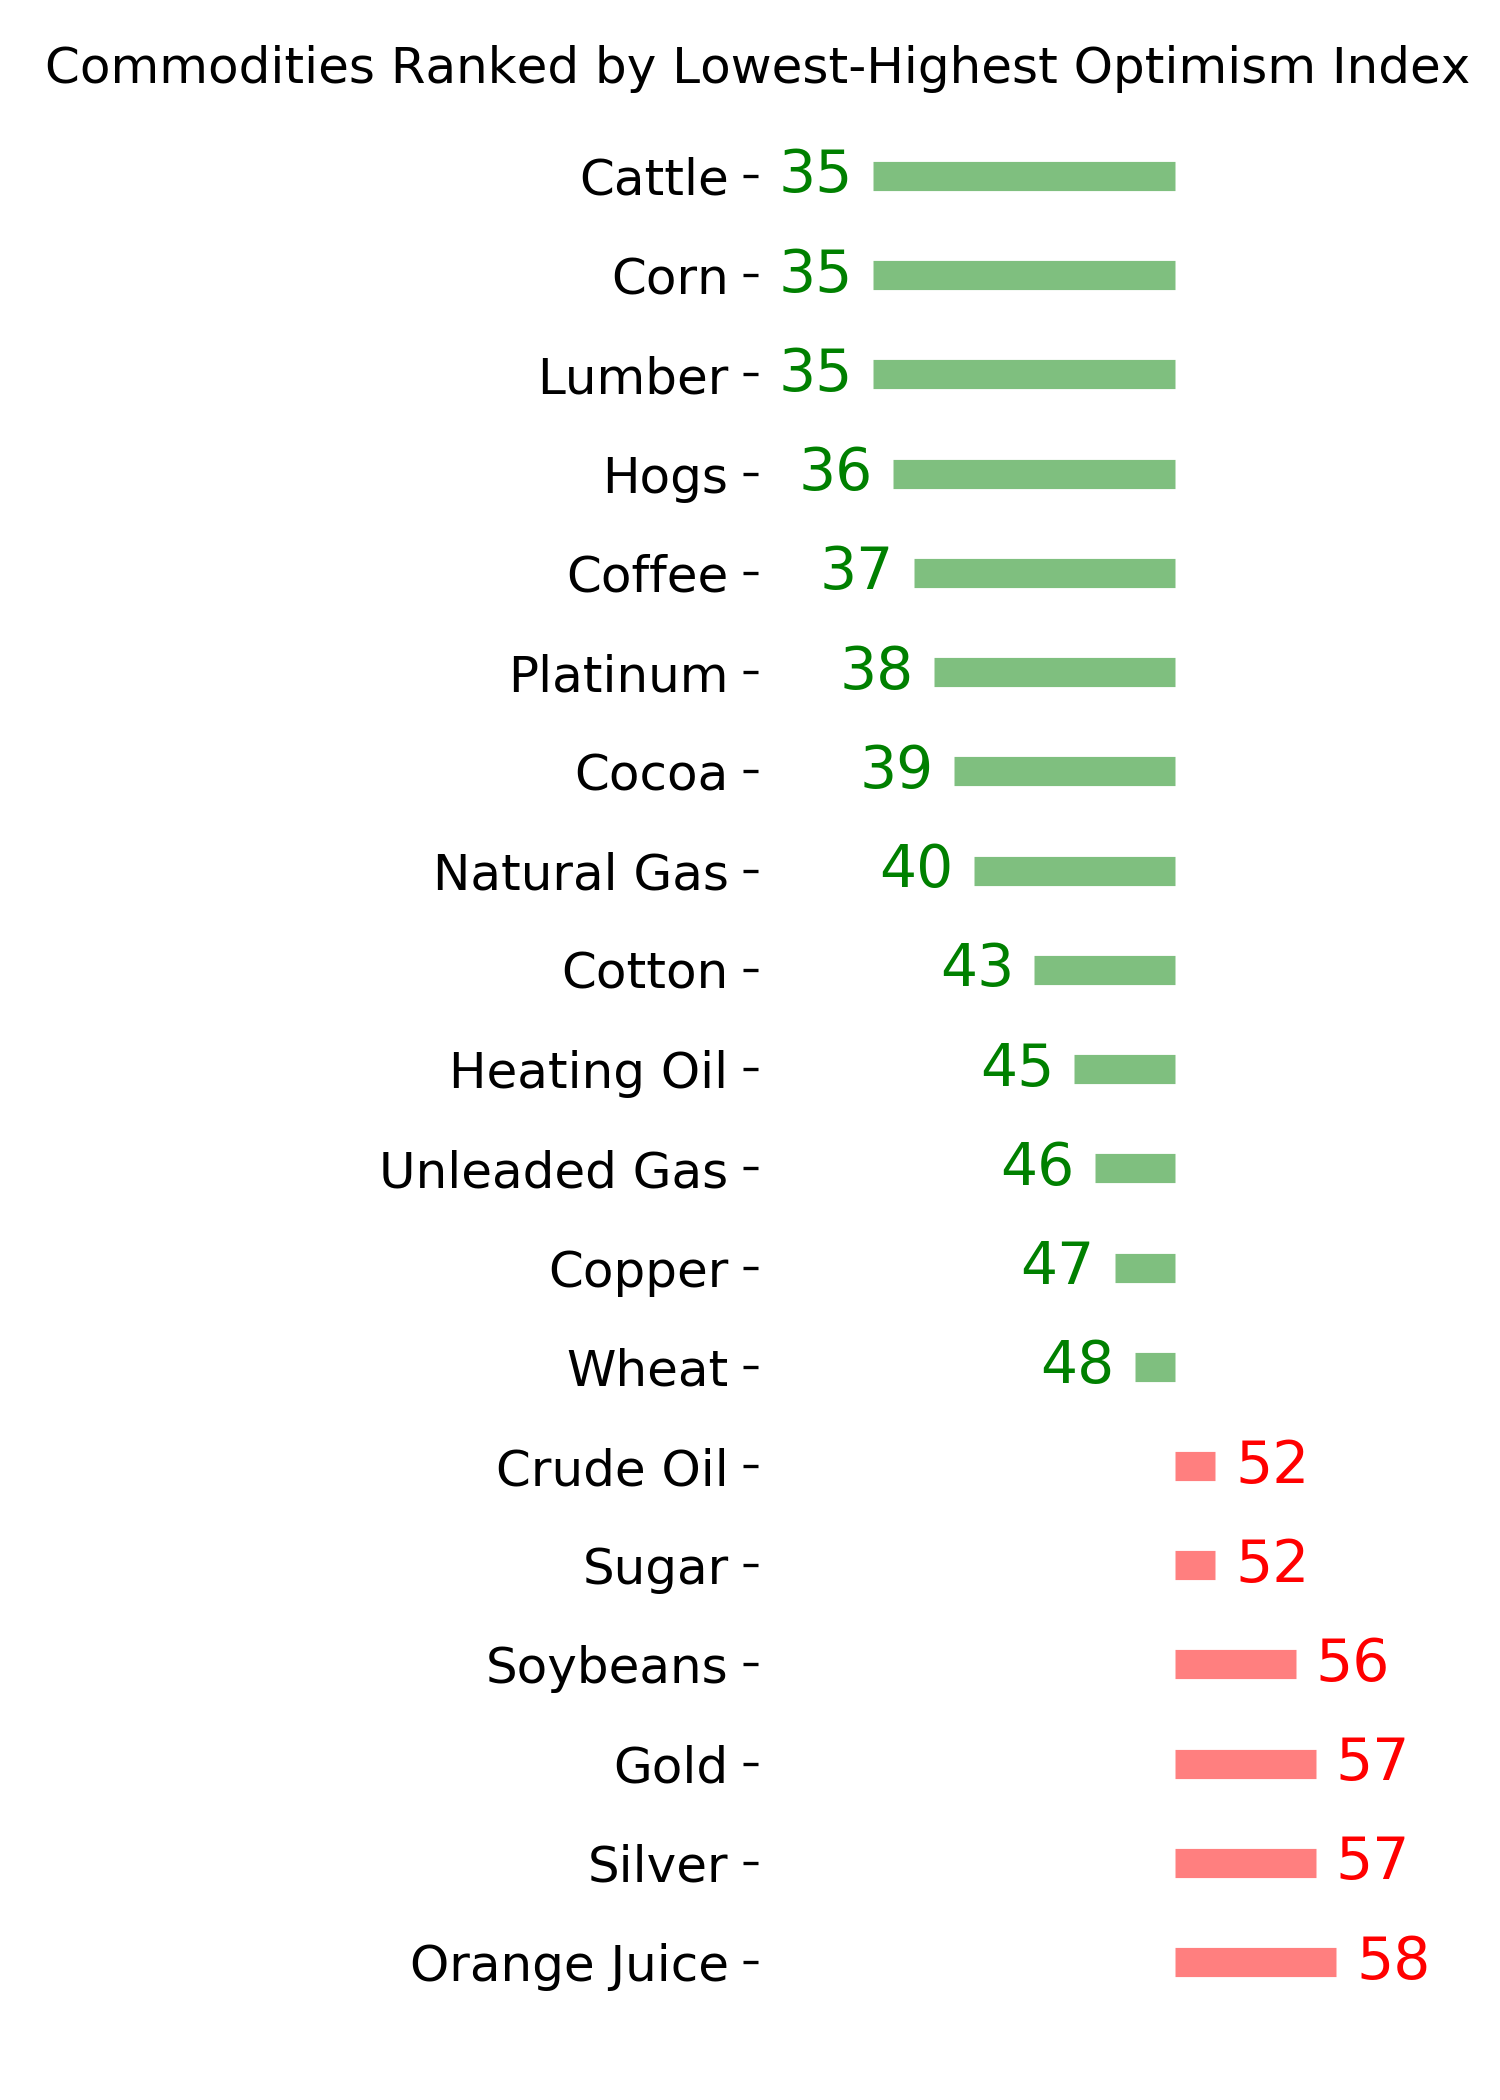
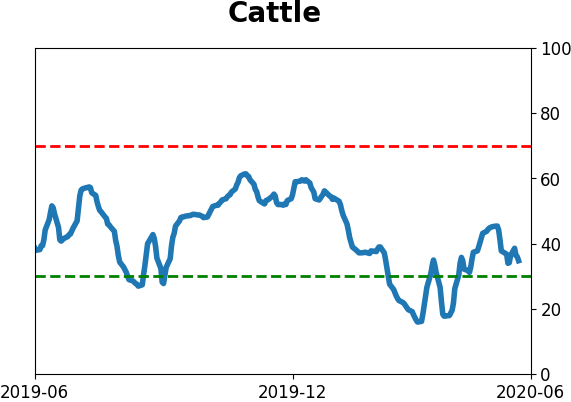
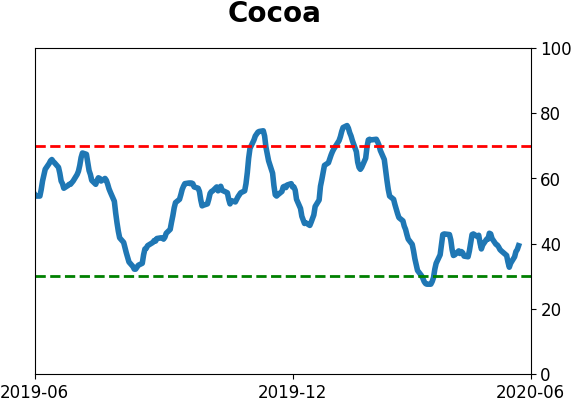
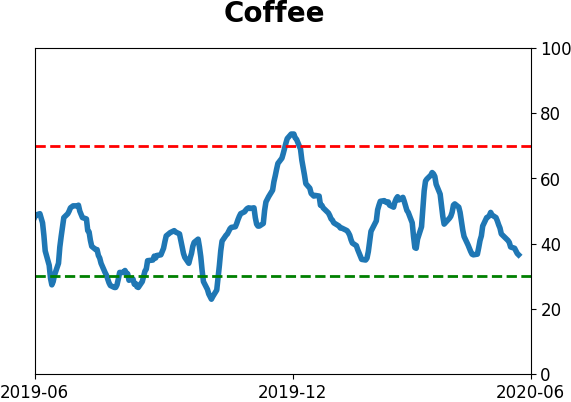
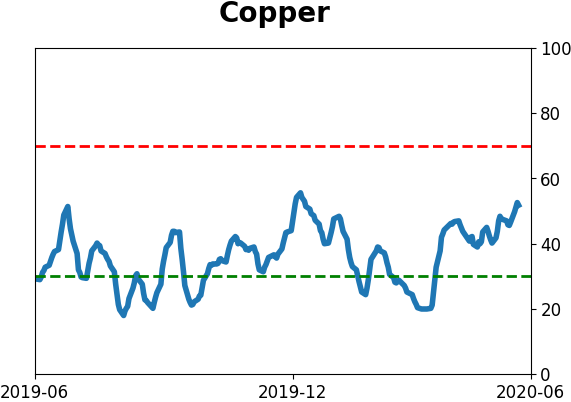
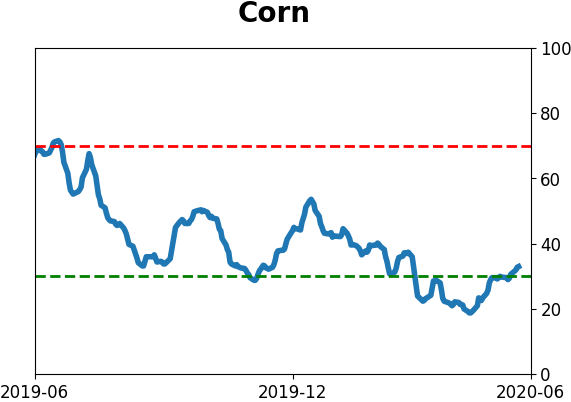
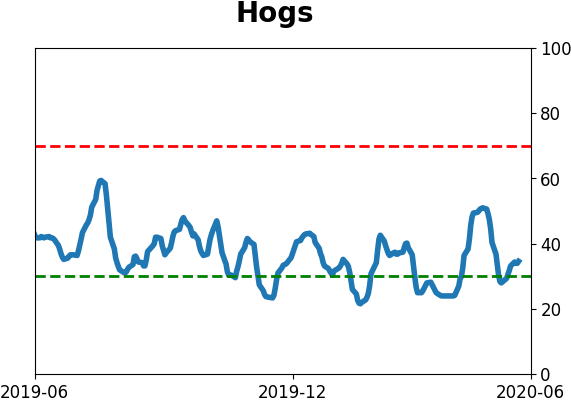
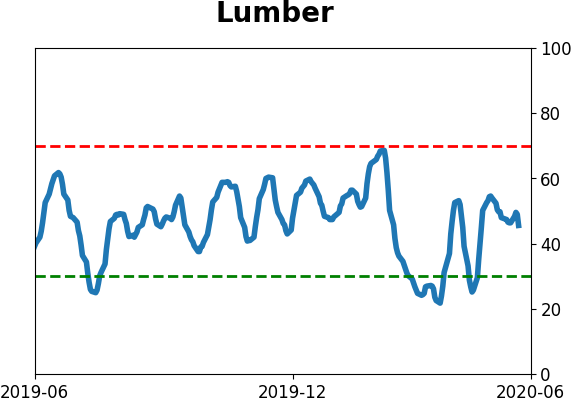
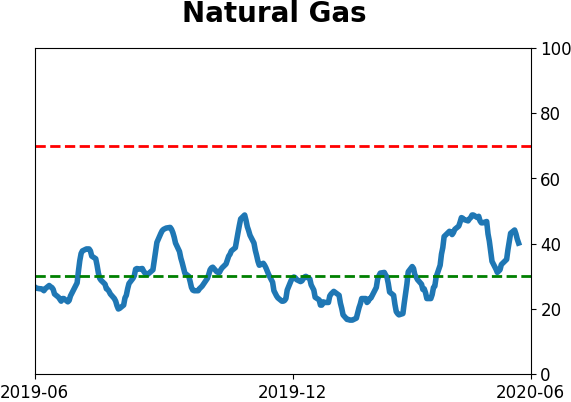
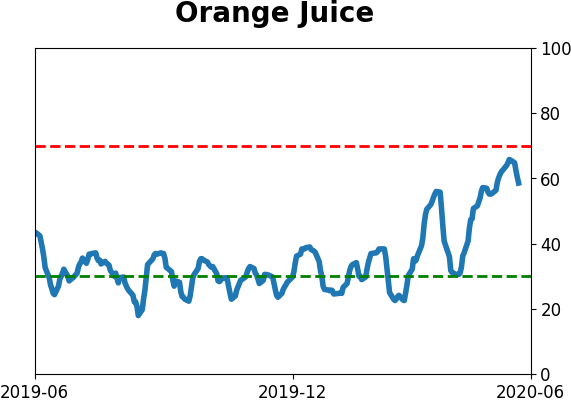
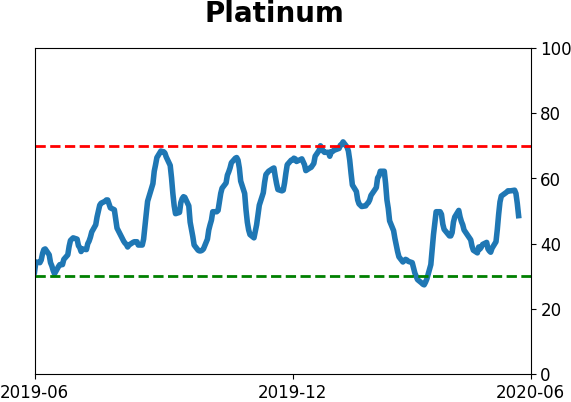
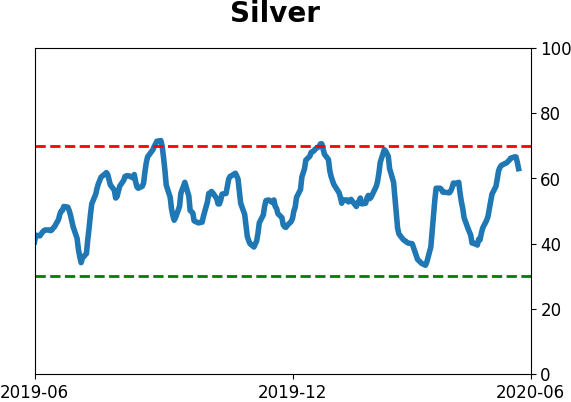
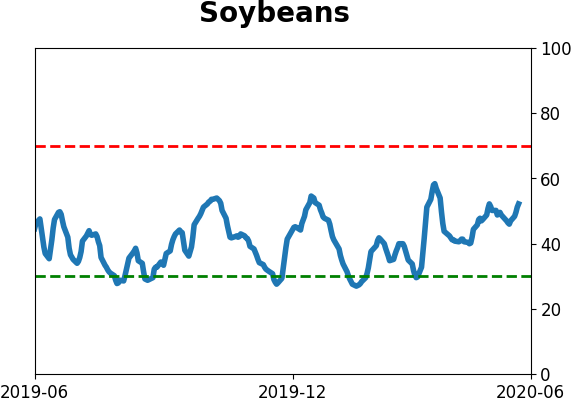
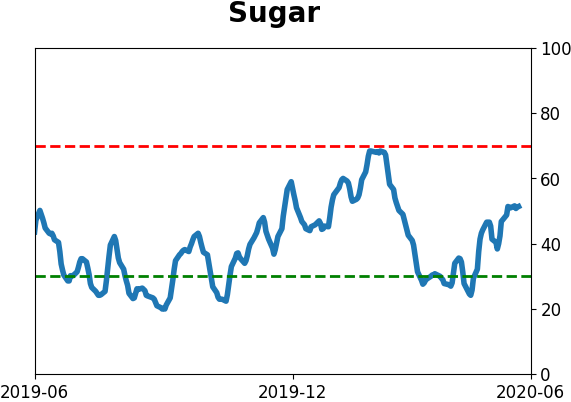
Commodity ETF's - 5-Day Moving Average
|
|