Headlines
|
|
Excess Liquidity is Being Wrung Out:
Excess Liquidity provided a big tailwind to stocks over the past year. Now there is evidence that it's draining out. Other times we've seen a spike-then-plunge in Excess Liquidity, the S&P 500 fared okay, and Energy stocks did very well, but Technology suffered.
Bottom Line:
See the Outlook & Allocations page for more details on these summaries STOCKS: Hold
The speculative frenzy in February is wrung out. Internal dynamics have mostly held up, with some exceptions. Many of our studies still show a mixed to poor short-term view, with medium- and long-term ones turning more positive. BONDS: Hold
Various parts of the market got hit in March, with the lowest Bond Optimism Index we usually see during healthy environments. After a shaky couple of weeks, the broad bond market has modestly recovered. Not a big edge here either way. GOLD: Hold
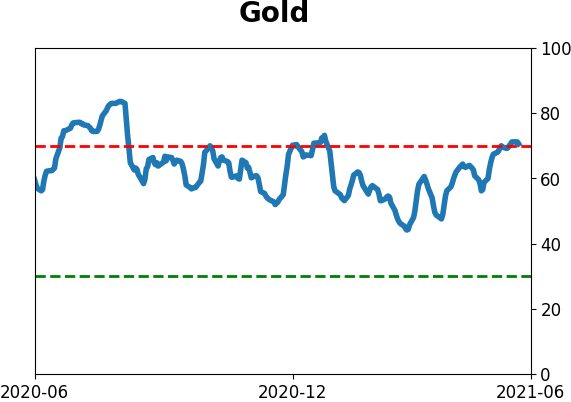
Gold and miners have done very well, recovering above long-term trend lines. The issue is that both have tended to perform poorly after similar situations - will have to wait and see how it plays out.
|
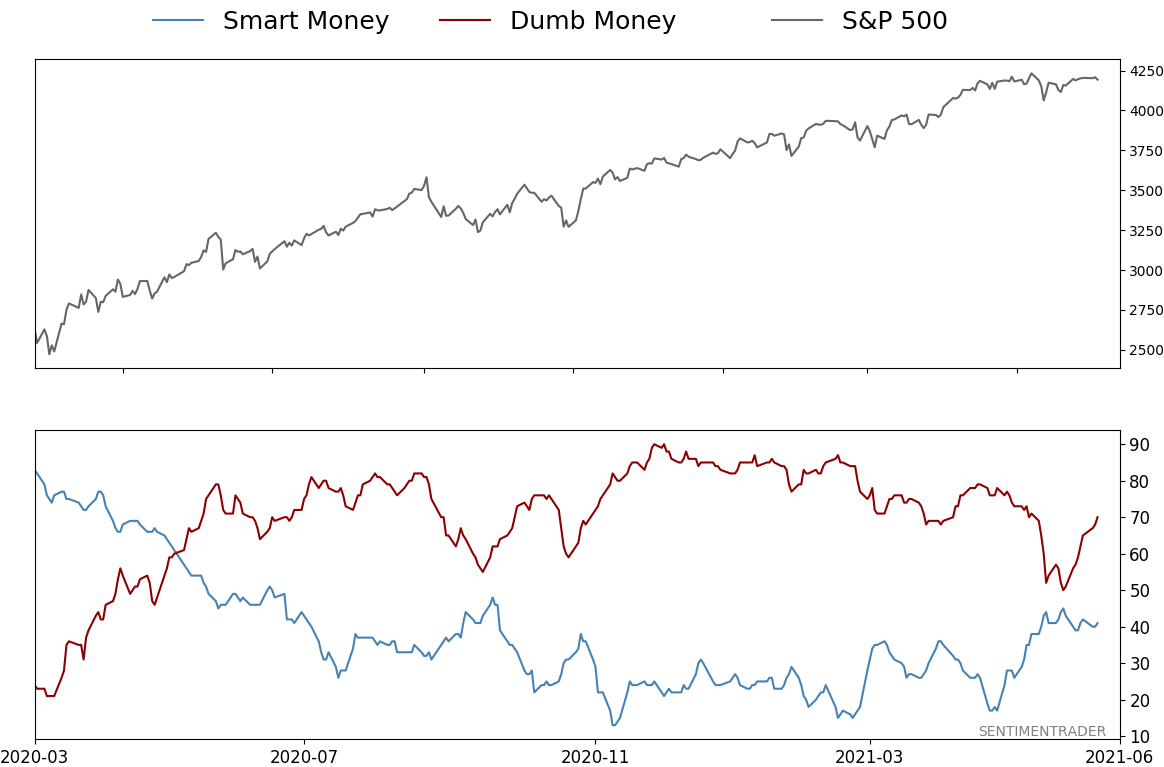
Smart / Dumb Money Confidence
|
Smart Money Confidence: 41%
Dumb Money Confidence: 70%
|
|
Risk Levels
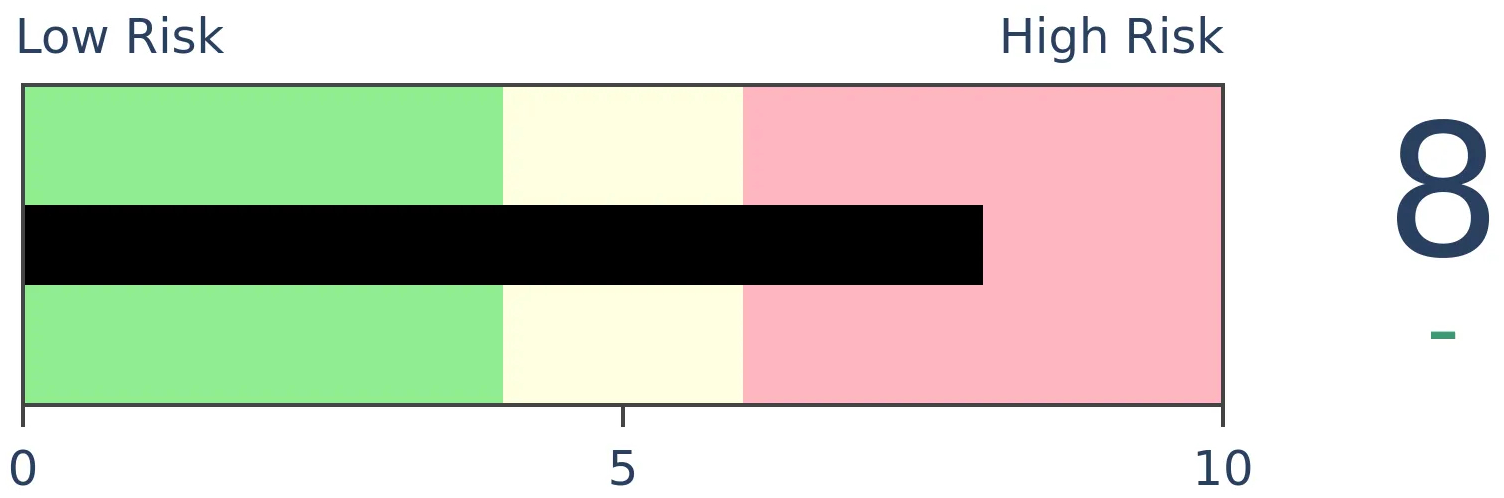
Stocks Short-Term
|
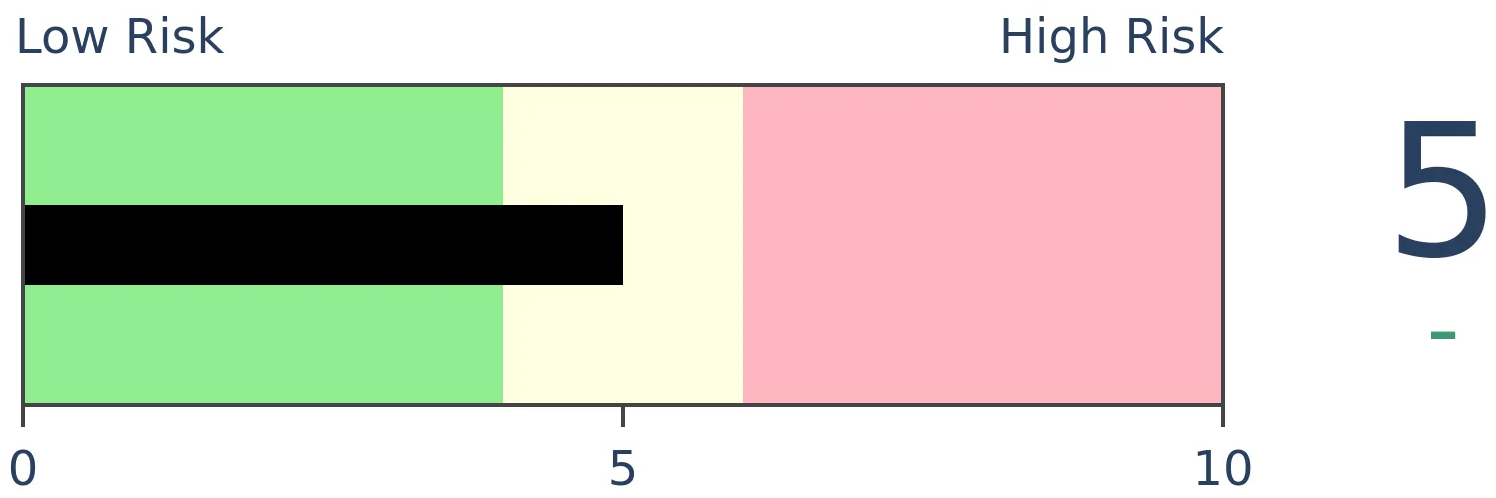
Stocks Medium-Term
|
|
Bonds

|
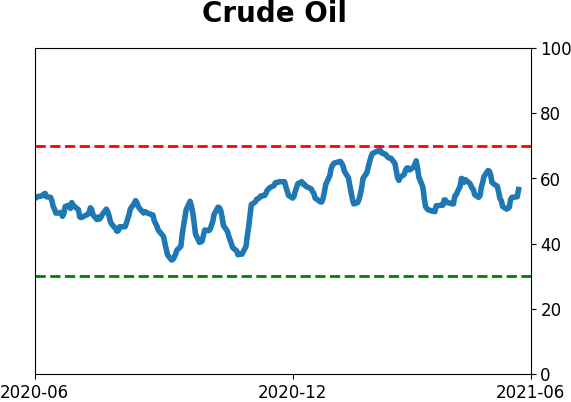
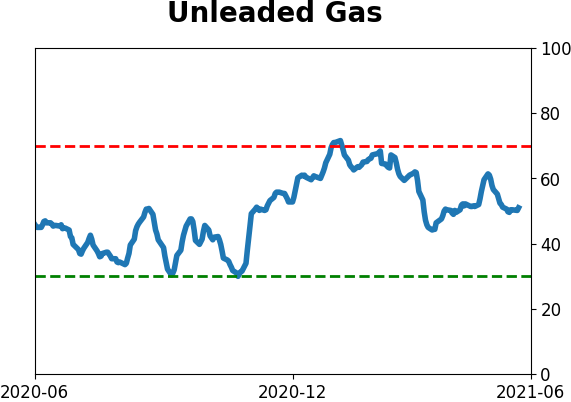
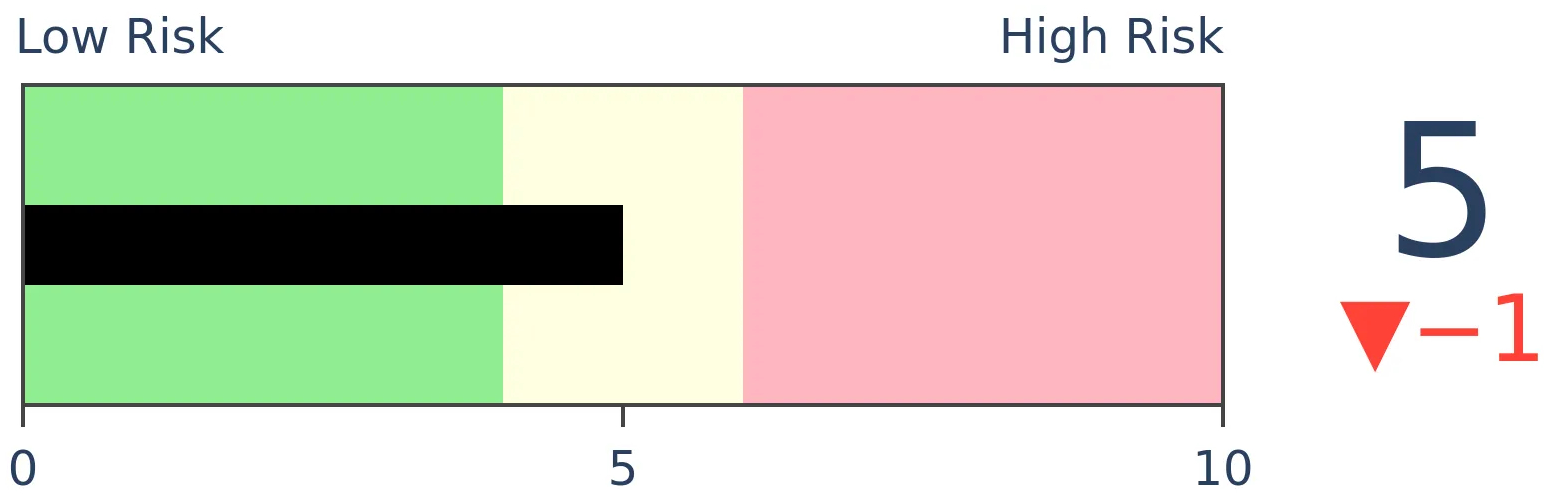
Crude Oil
|
|
Gold

|
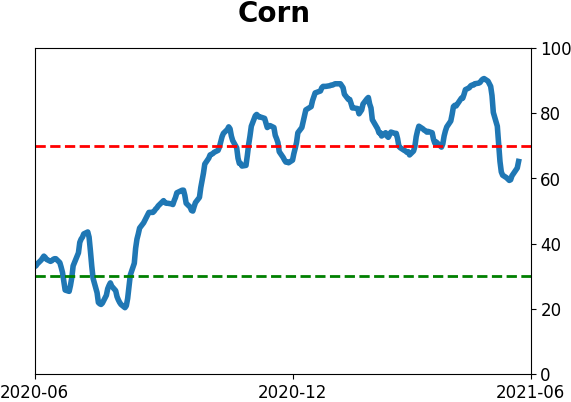
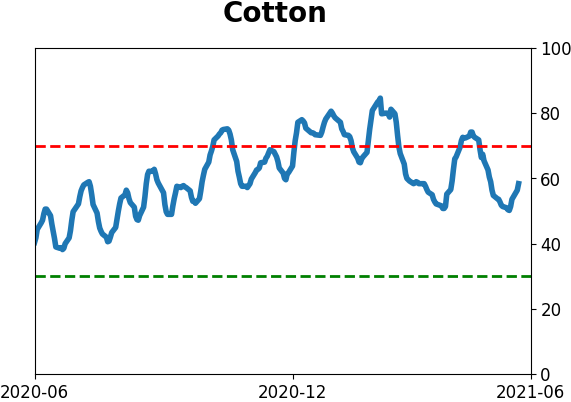
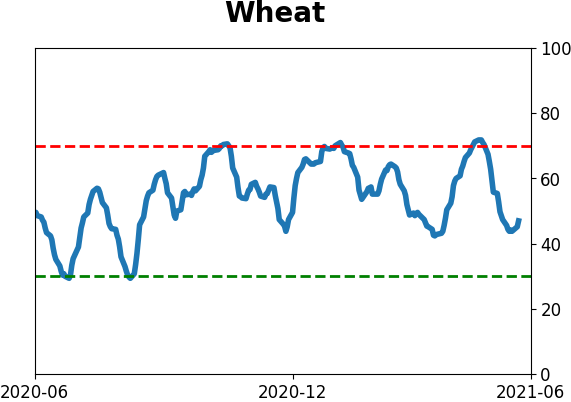
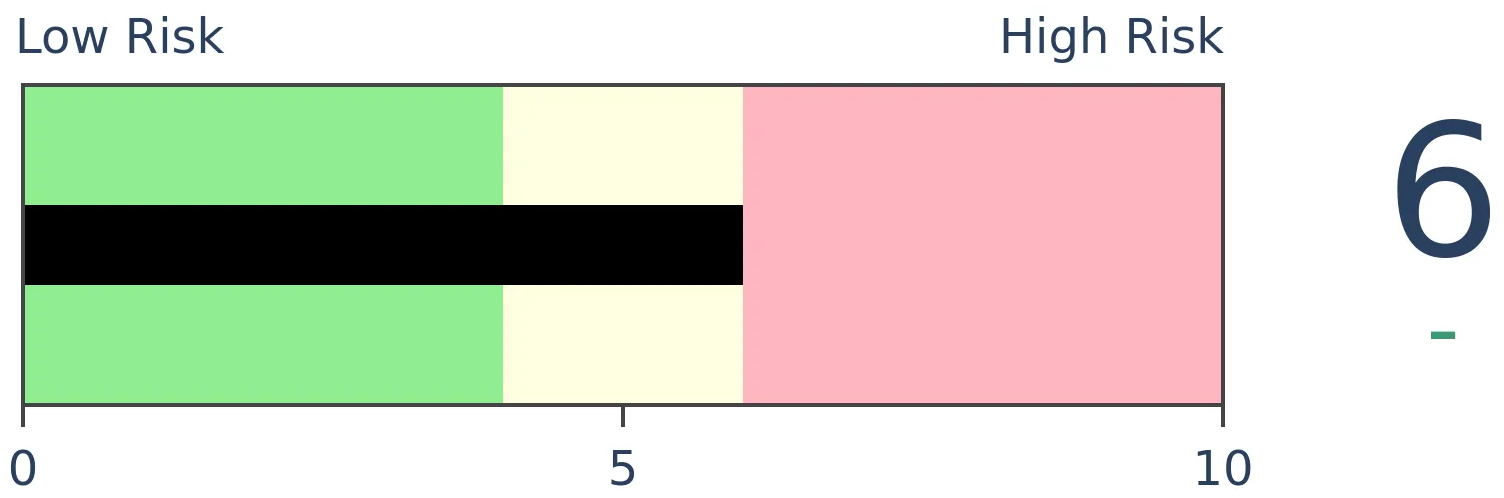
Agriculture
|
|
Research
BOTTOM LINE
Excess Liquidity provided a big tailwind to stocks over the past year. Now there is evidence that it's draining out. Other times we've seen a spike-then-plunge in Excess Liquidity, the S&P 500 fared okay, and Energy stocks did very well, but Technology suffered.
FORECAST / TIMEFRAME
None
|
The flood of money that found its way into financial markets is leaving and pooling into economic production. This behavior suggests that Excess Liquidity is plunging.
WHAT THE PLUNGE IS, AND WHAT IT MEANS
On the site, we define Excess Liquidity as:
This shows the growth in growth in M2, a broad measure of the money supply that includes deposits and money market funds, and the growth in the economy. In the long term, they tend to grow together. However, when the supply of money grows faster than the economy (represented by the growth in Industrial Production), the excess money is not invested in "things" but rather tends to find its way into financial assets. Therefore, high levels of excess liquidity tend to be positive for stock prices. Low levels of excess liquidity are negative for stocks but are not as strong as the opposite condition.
We can see just how much this figure spiked and then plunged with the latest economic releases.
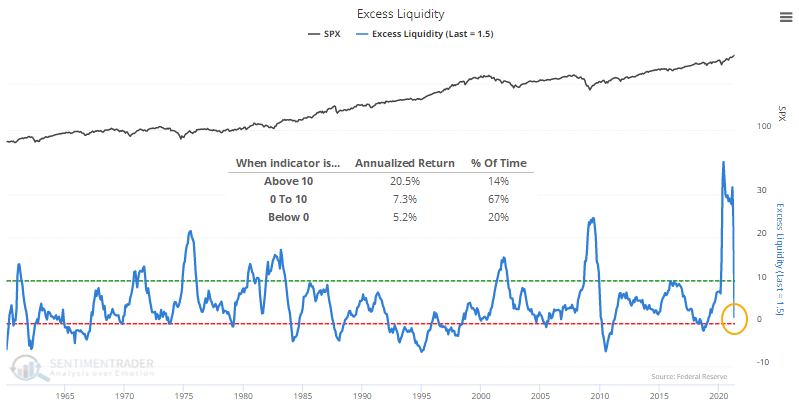
The S&P 500 has returned an annualized +20.5% when Excess Liquidity is above 10%, where it had been since last March. Its returns are more in line with random as that figure drops below 10% and heads toward zero.
My pal Tony Dwyer of Cannacord Genuity notes that:
"Remember, sustainable periods of negative economic and market activity take place when there is a need for money with limited or no access to it, and the opposite has been true since the initial onset of the pandemic.
As the U.S. economy continues to reaccelerate, the most recent data shows that excess liquidity is finally starting to come down from peak, Money Supply (M2) growth is slowing, the financial markets have stalled, and investment goes into economic production as the economy accelerates. This suggests money that was invested in the financial markets while waiting for the economy to turn may be increasingly used to fund the increased activity."
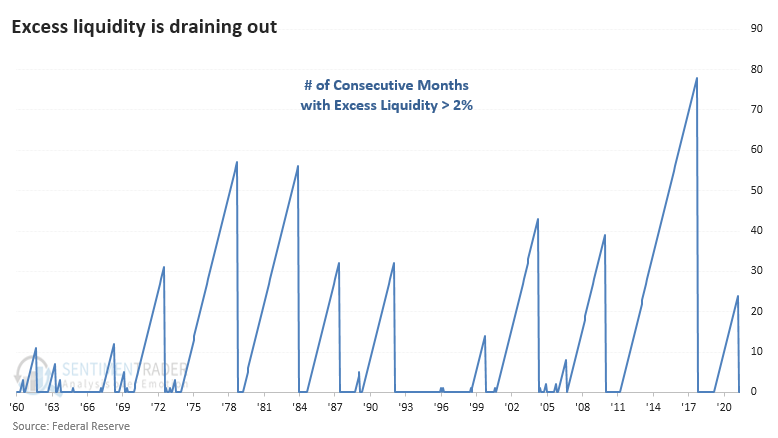
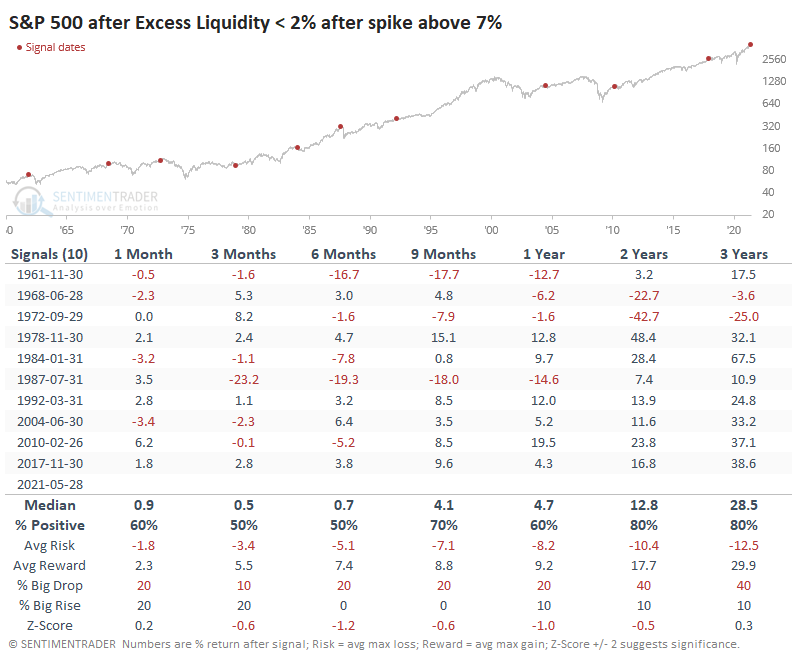
Based on how we show this figure on the site, Excess Liquidity has dropped below +2% for the first time in well over a year. This ends one of the longest streaks of at least a relatively high figure since 1960.
SIMILAR BEHAVIOR LED TO MIXED STOCKS - GOOD ENERGY, BAD TECH
After other streaks ended, the S&P did okay. It fell into a correction, or worse, four times during the next 1-2 years. That means that six times, stocks held up fine even with liquidity draining from financial assets. To account for data lags, the dates in the table are advanced one month.
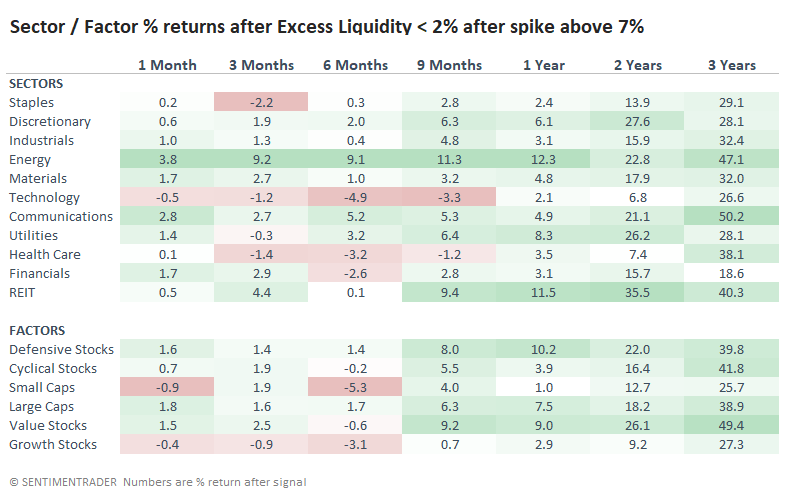
For sectors and factors, Energy stocks fared the best, with impressive returns across every time frame. Technology stocks, no stranger to the losing end of many studies we've published over the past month, once again brought up the rear. There was quite a spread between the two sectors, with Energy averaging +9.1% over the next six months and Tech averaging -4.9%.
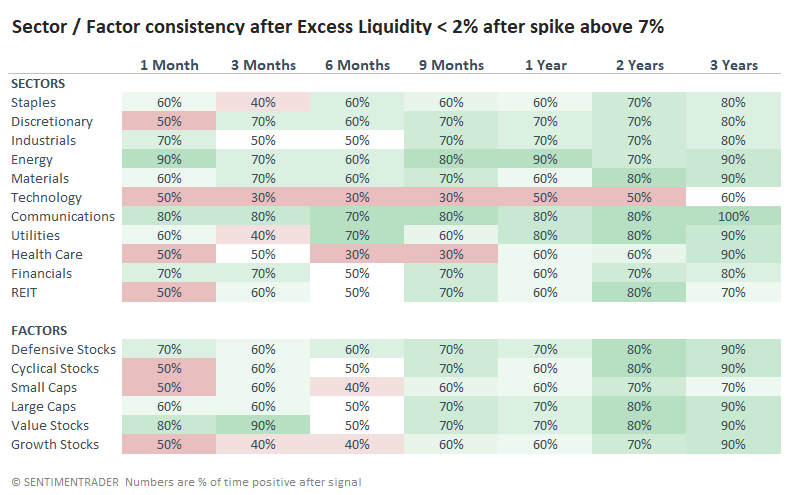
The consistency of gains in sectors and factors mostly confirmed the average returns from the table above.
MOMENTUM KILLER?
Part of the reason why investors, in general, are still confident is that many speculative stocks haven't yet completely crashed. Those canaries are mostly still singing, evidenced by their poster child, AMC.
As the Wall Street Journal notes:
"For veteran investors and analysts, the meme stock moves mark the continuing impact of the Fed's decision to inject tremendous liquidity into markets last year, along with a brazen new investor class that has taken root since brokerages rolled out trading apps, slashed commissions to zero and introduced fractional trading.
"These types of moves are here to stay until you see some of this liquidity dry up," said Michael Arone, chief investment strategist for State Street Global Advisors."
If we can use Excess Liquidity as a proxy for "liquidity," then the suggestion that it's been drying up runs counter to the fact that many of the meme stocks are flying higher again.
This isn't unusual, however. If we look at a rough approximation for momentum stocks, using data from Fama French in prior decades and the Dow Jones Thematic Market Neutral Momentum Index more recently, then their returns have held up well after Excess Liquidity comes down from a spike.
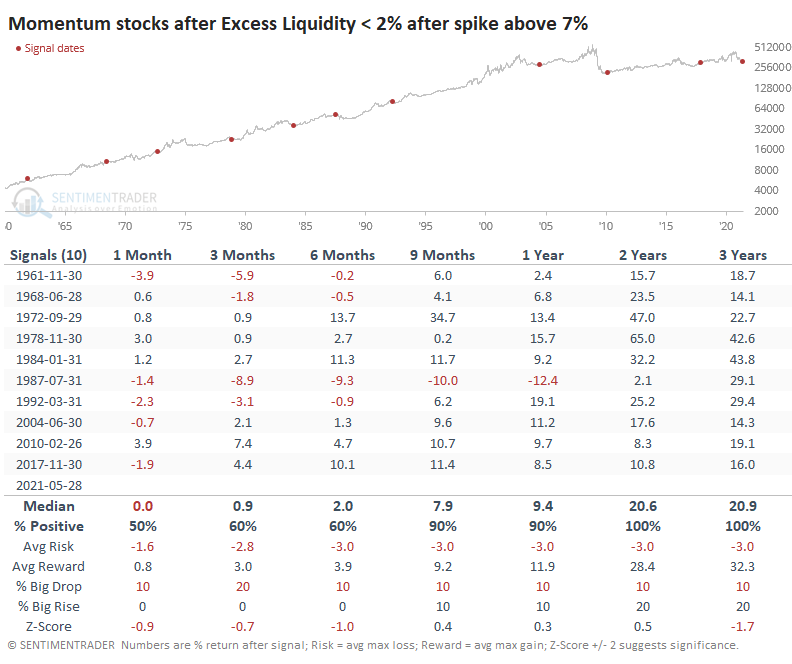
Most of the time, momentum stocks had already had the air bled from them by the time Excess Liquidity fell as much as it has. So, their forward returns were in line with random or even above. We wouldn't use this as an excuse to mortgage the house and buy AMC (or buy AMC at all), but it's a check against automatically assuming that what seems logical in markets is what actually tends to happen.
The overall takeaway from the plunge in Excess Liquidity shouldn't be that it's necessary bearish. More than anything, for the broader market, it's simply "not bullish." Stocks tend to perform better when the figure is high. When it drains out, the S&P has mostly held up okay, but Technology stocks tended to suffer, while Energy stocks benefitted from the return of capital to productive assets.
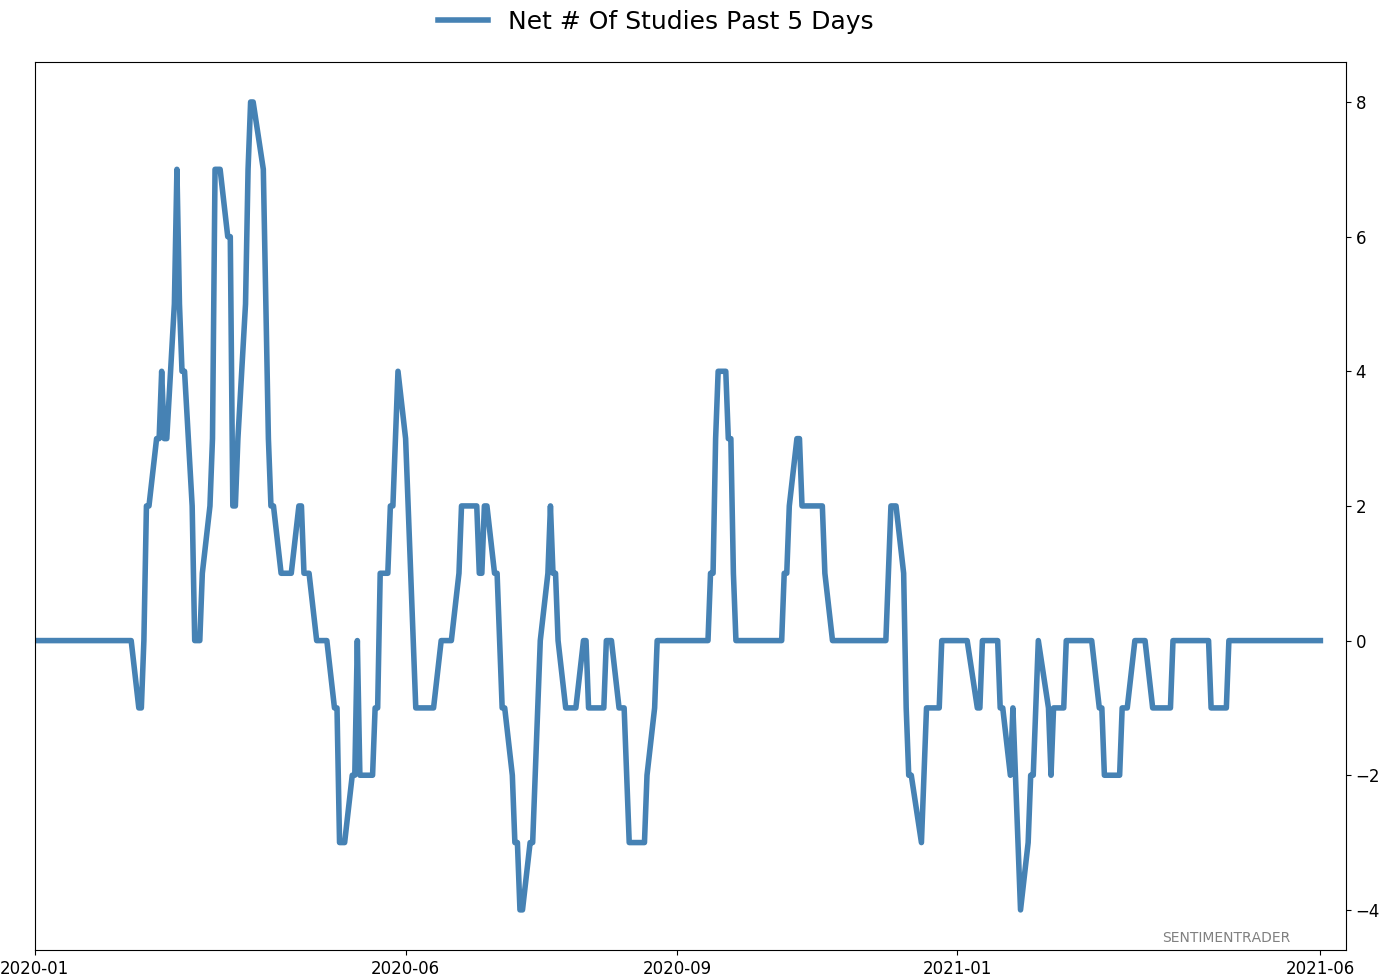
Active Studies
| Time Frame | Bullish | Bearish | | Short-Term | 0 | 0 | | Medium-Term | 1 | 11 | | Long-Term | 11 | 5 |
|
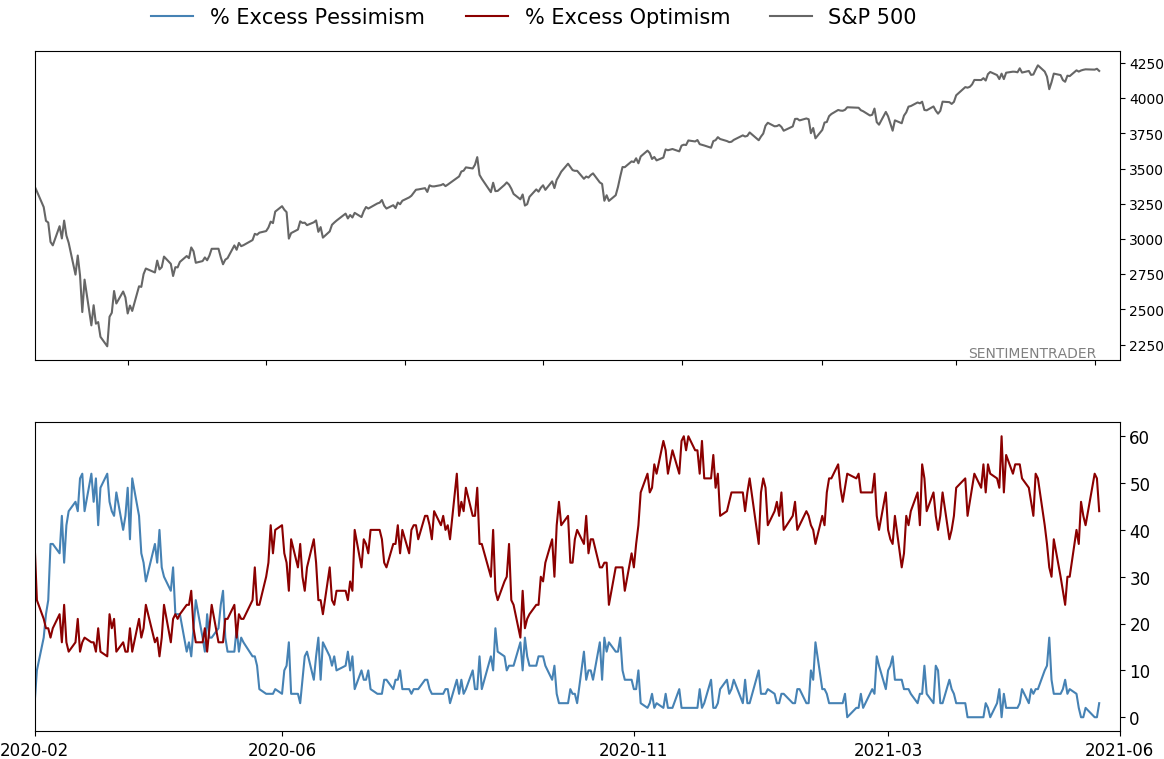
Indicators at Extremes
|
% Showing Pessimism: 3%
Bullish for Stocks
|
|
Portfolio
| Position | Description | Weight % | Added / Reduced | Date | | Stocks | RSP | 4.1 | Added 4.1% | 2021-05-19 | | Bonds | 23.9% BND, 6.9% SCHP | 30.7 | Reduced 7.1% | 2021-05-19 | | Commodities | GCC | 2.6 | Reduced 2.1%
| 2020-09-04 | | Precious Metals | GDX | 5.6 | Reduced 4.2% | 2021-05-19 | | Special Situations | 4.3% XLE, 2.2% PSCE | 7.6 | Reduced 5.6% | 2021-04-22 | | Cash | | 49.4 | | |
|
Updates (Changes made today are underlined)
Much of our momentum and trend work has remained positive for several months, with some scattered exceptions. Almost all sentiment-related work has shown a poor risk/reward ratio for stocks, especially as speculation drove to record highs in exuberance in February. Much of that has worn off, and most of our models are back toward neutral levels. There isn't much to be excited about here. The same goes for bonds and even gold. Gold has been performing well lately and is back above long-term trend lines. The issue is that it has a poor record of holding onto gains when attempting a long-term trend change like this, so we'll take a wait-and-see approach. RETURN YTD: 9.8% 2020: 8.1%, 2019: 12.6%, 2018: 0.6%, 2017: 3.8%, 2016: 17.1%, 2015: 9.2%, 2014: 14.5%, 2013: 2.2%, 2012: 10.8%, 2011: 16.5%, 2010: 15.3%, 2009: 23.9%, 2008: 16.2%, 2007: 7.8%
|
|
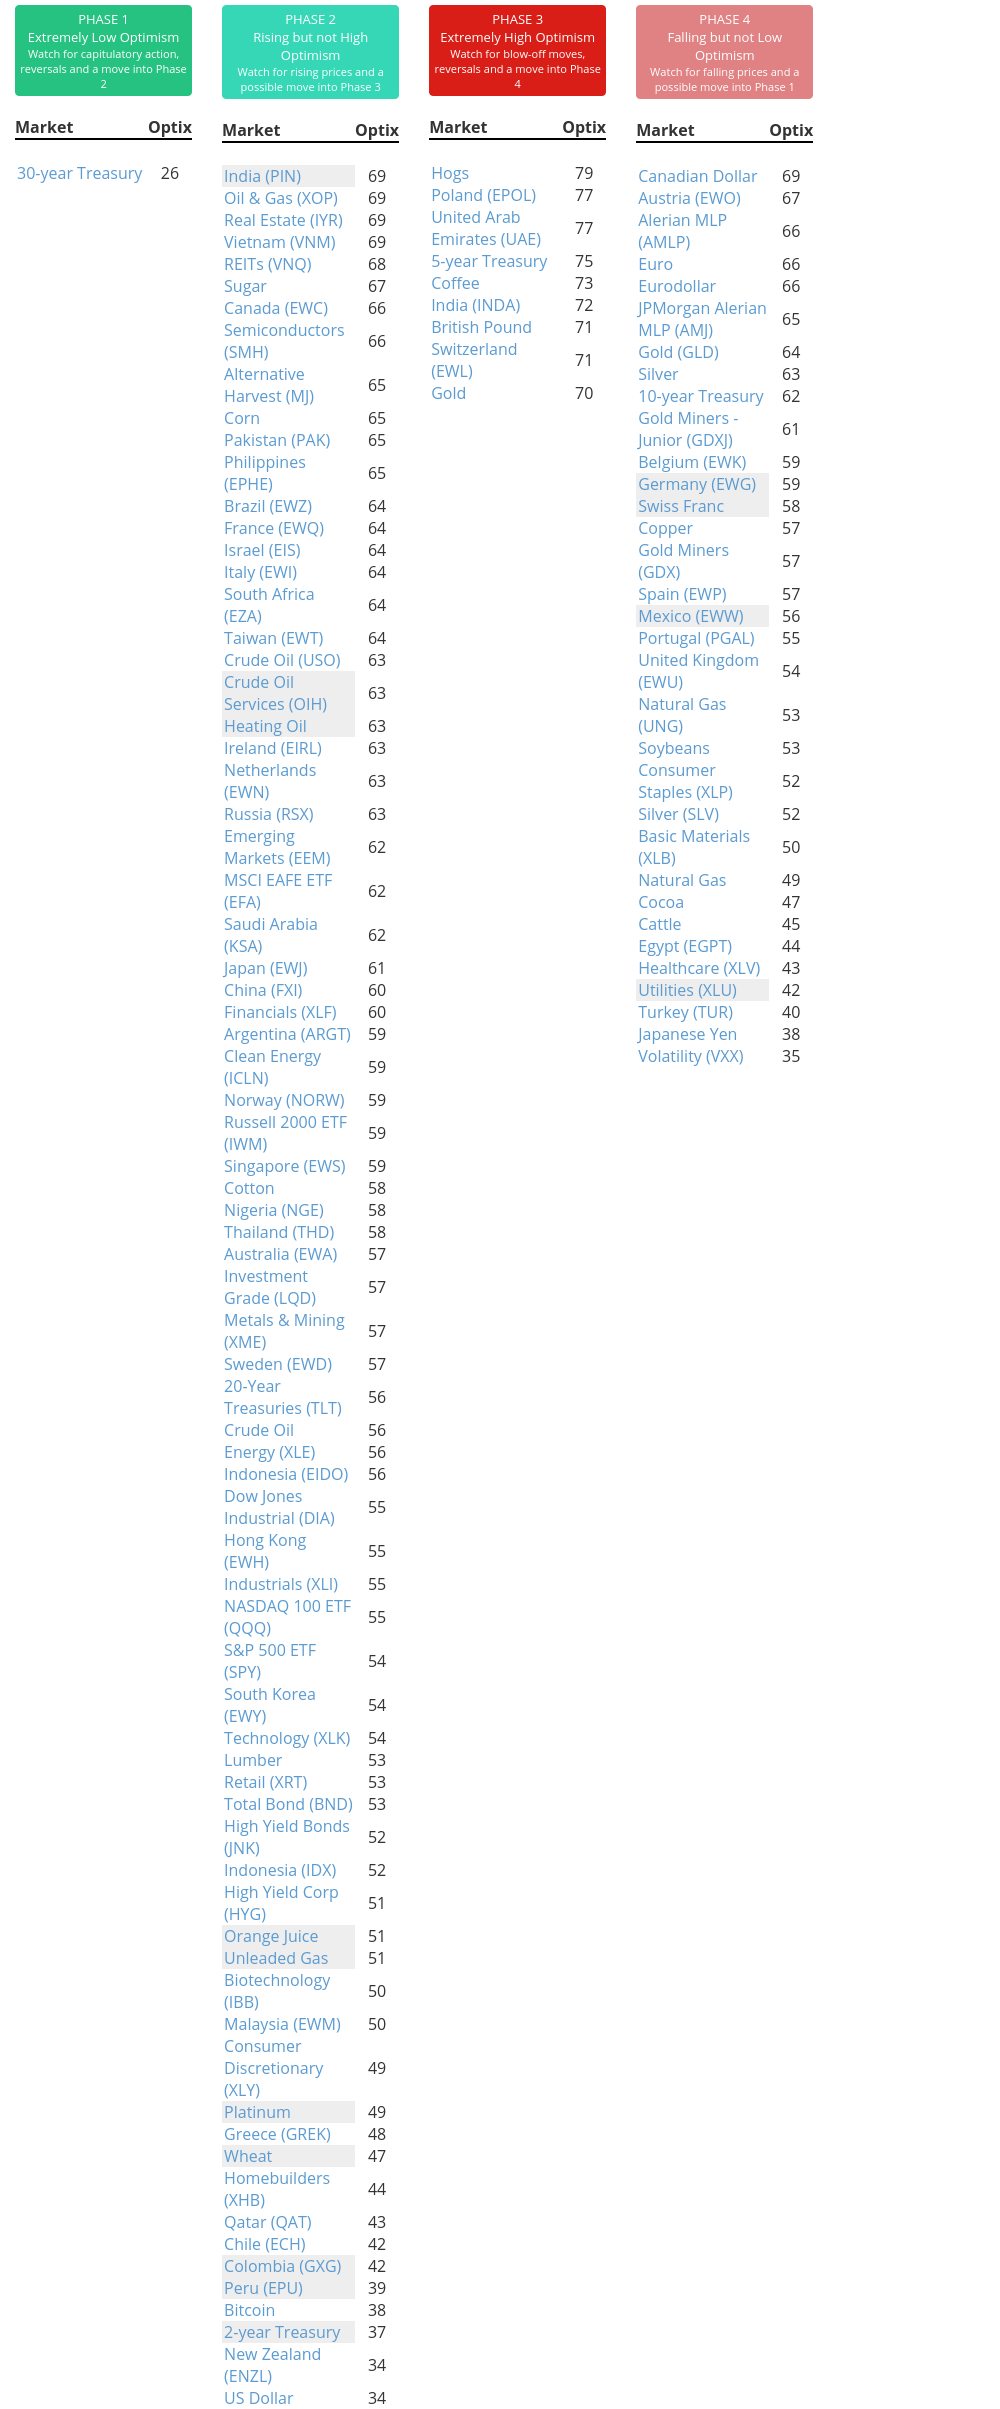
Phase Table
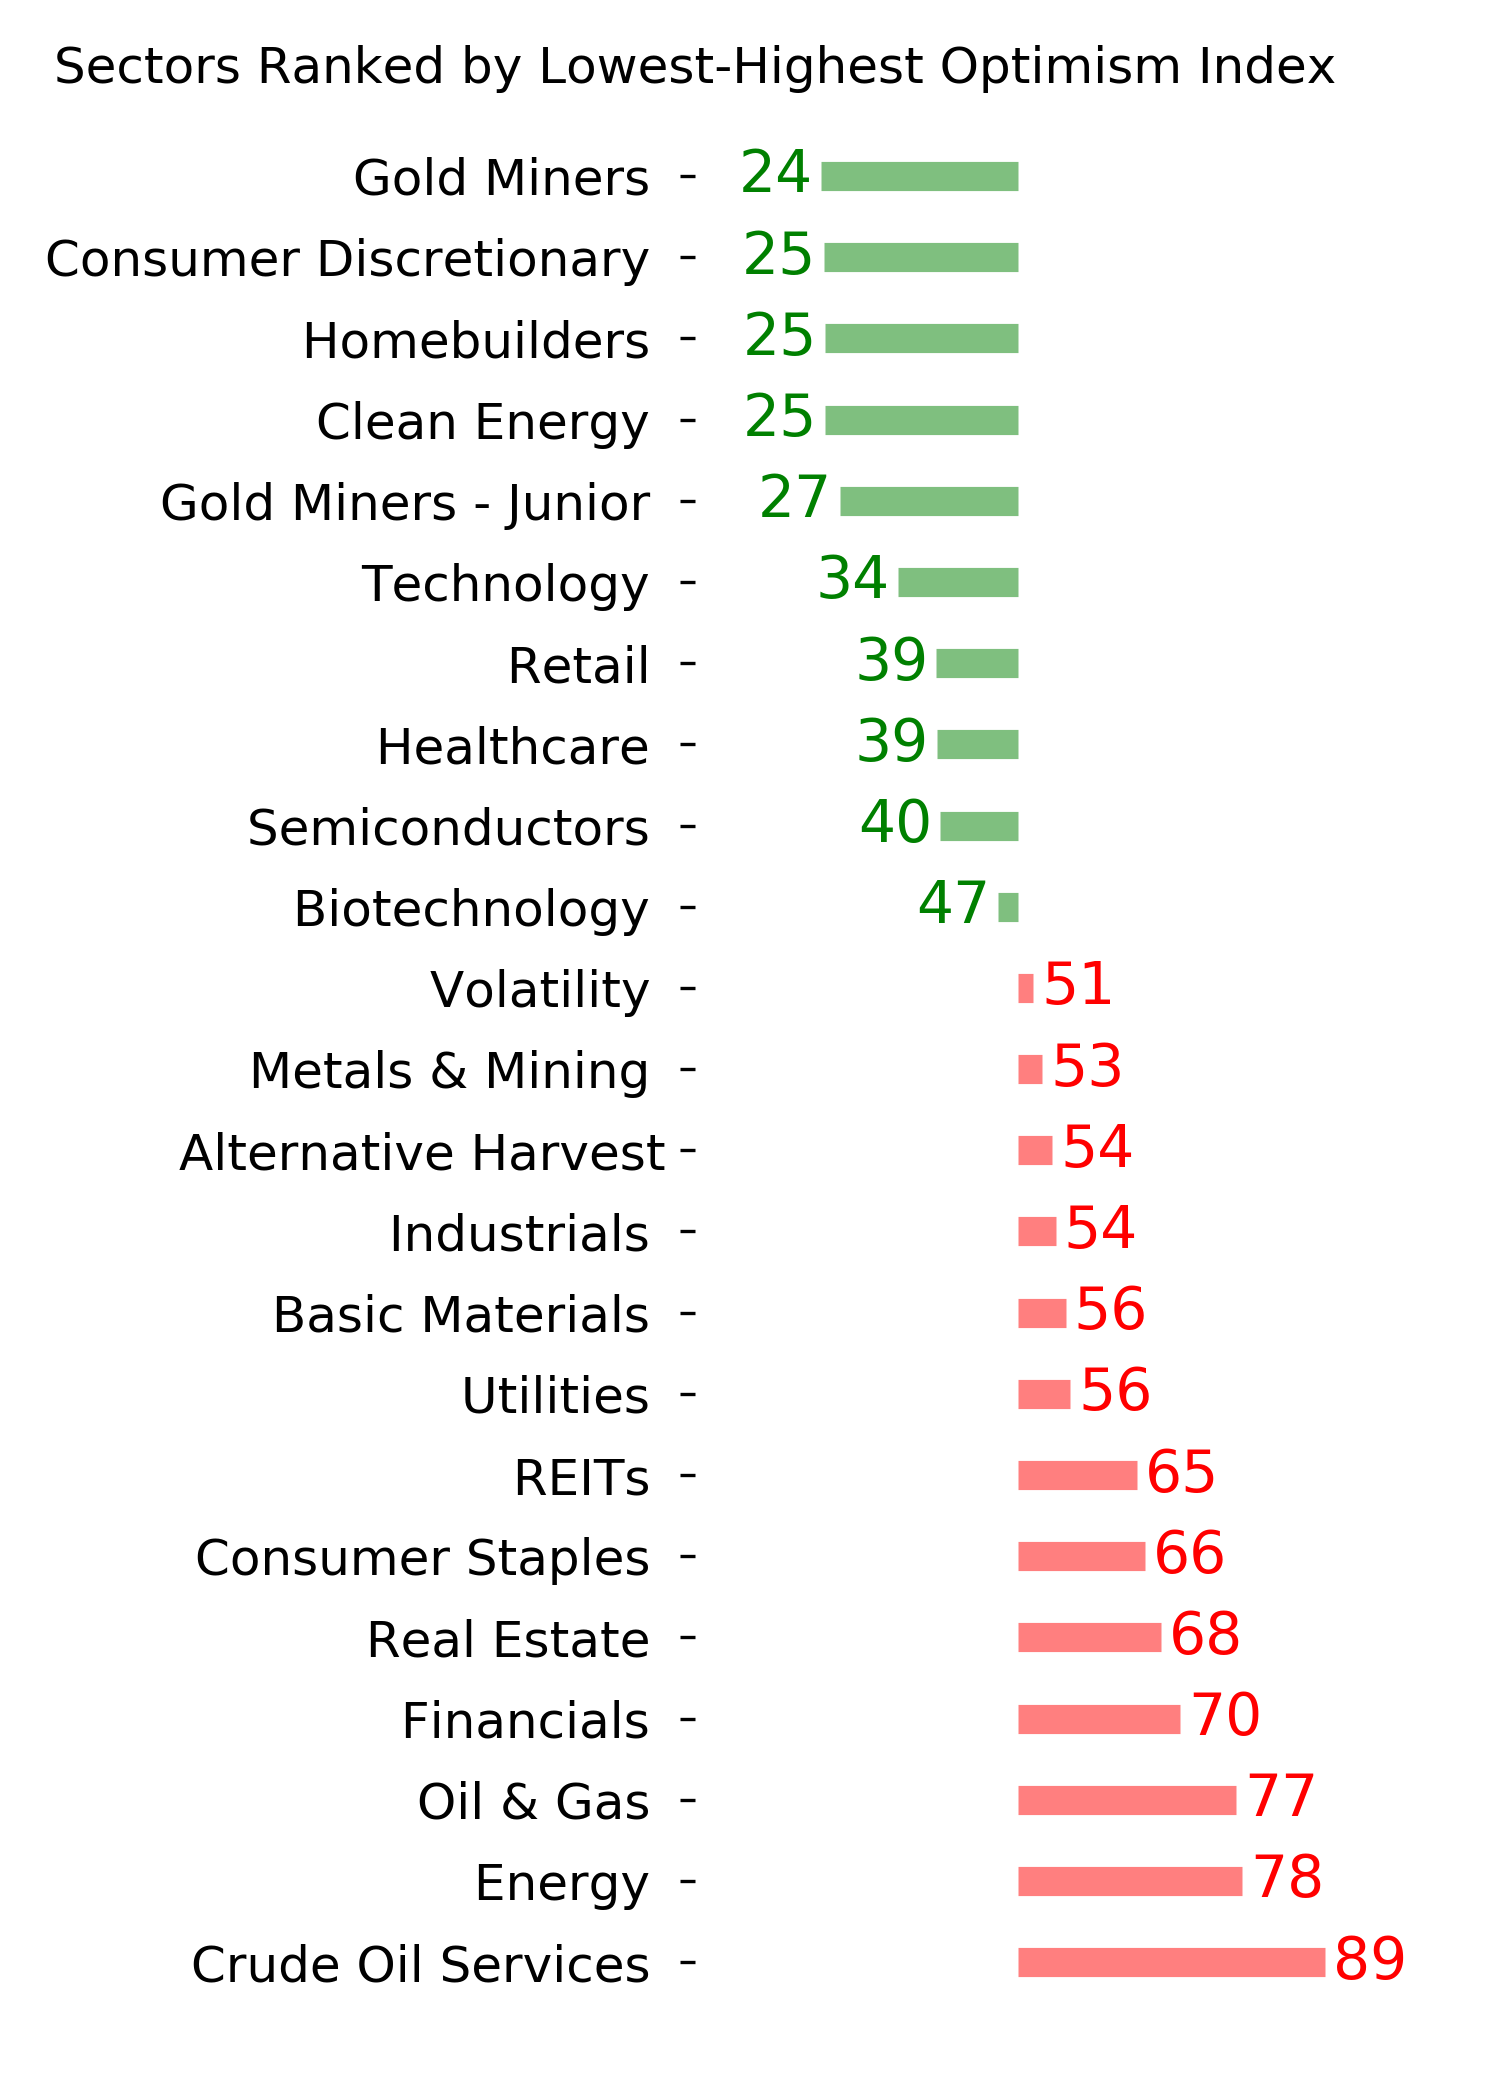
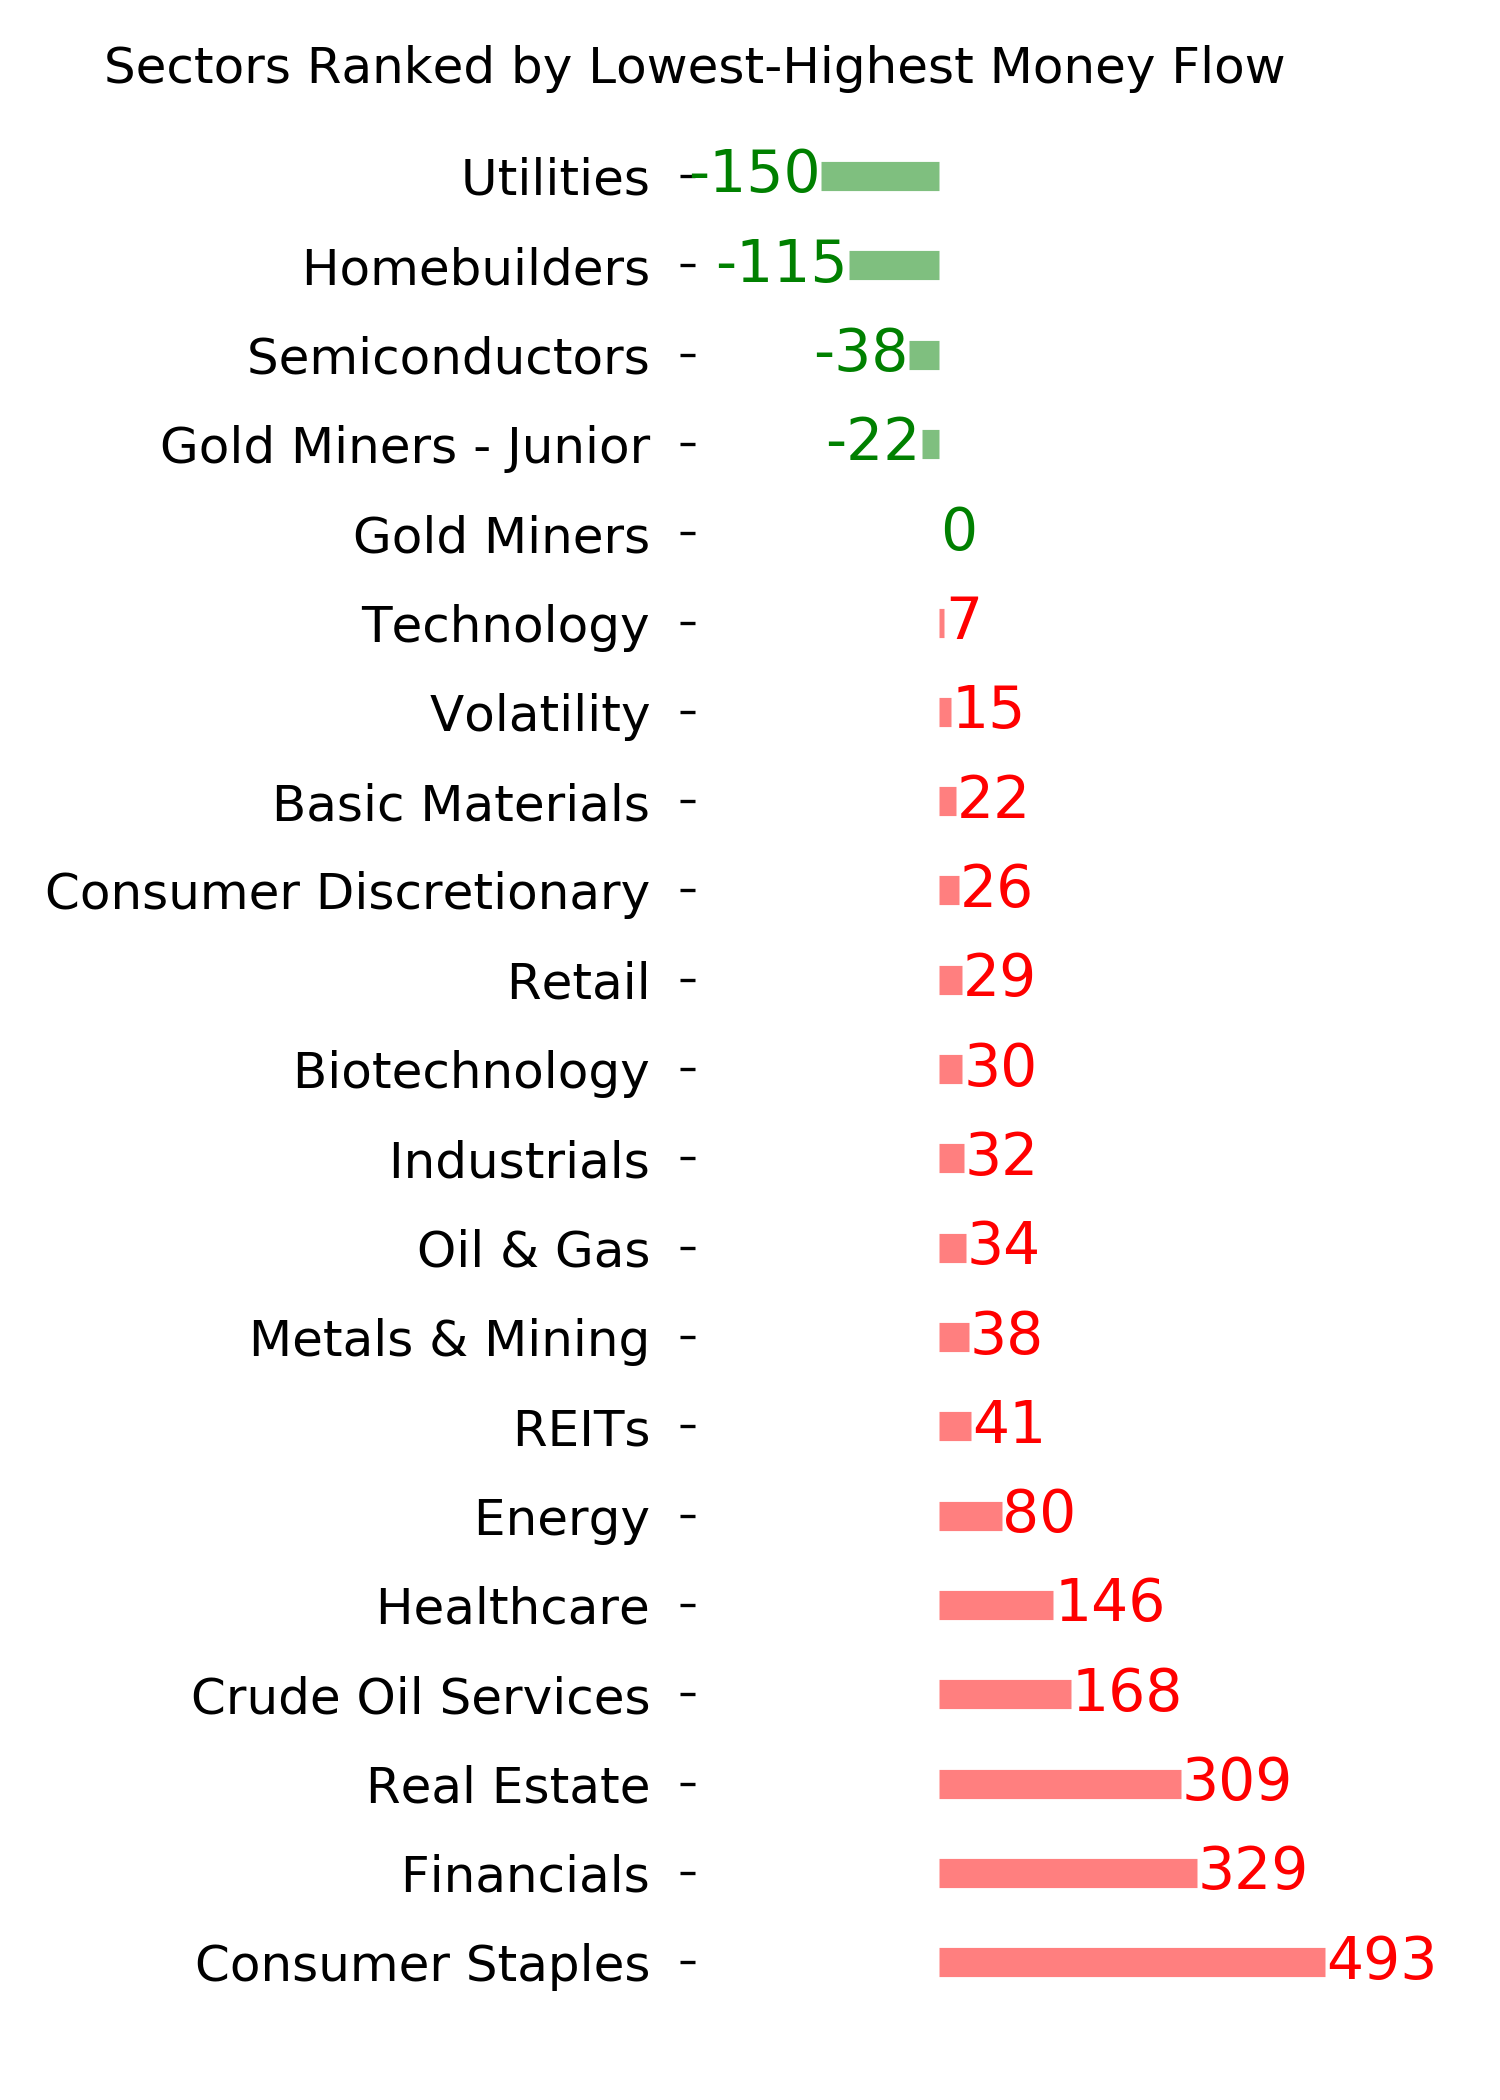
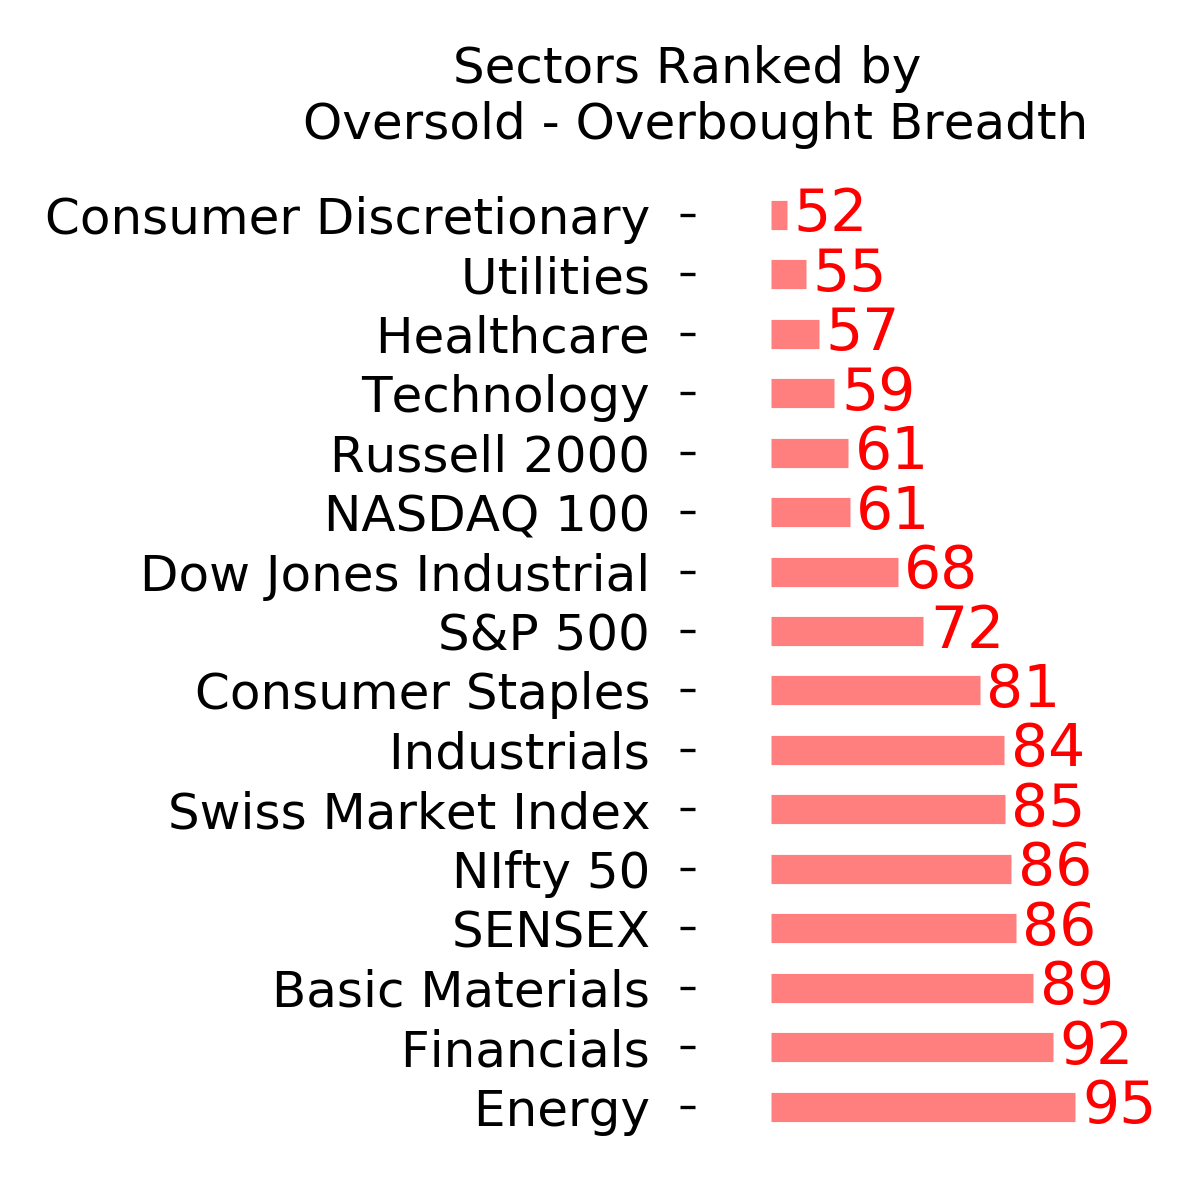
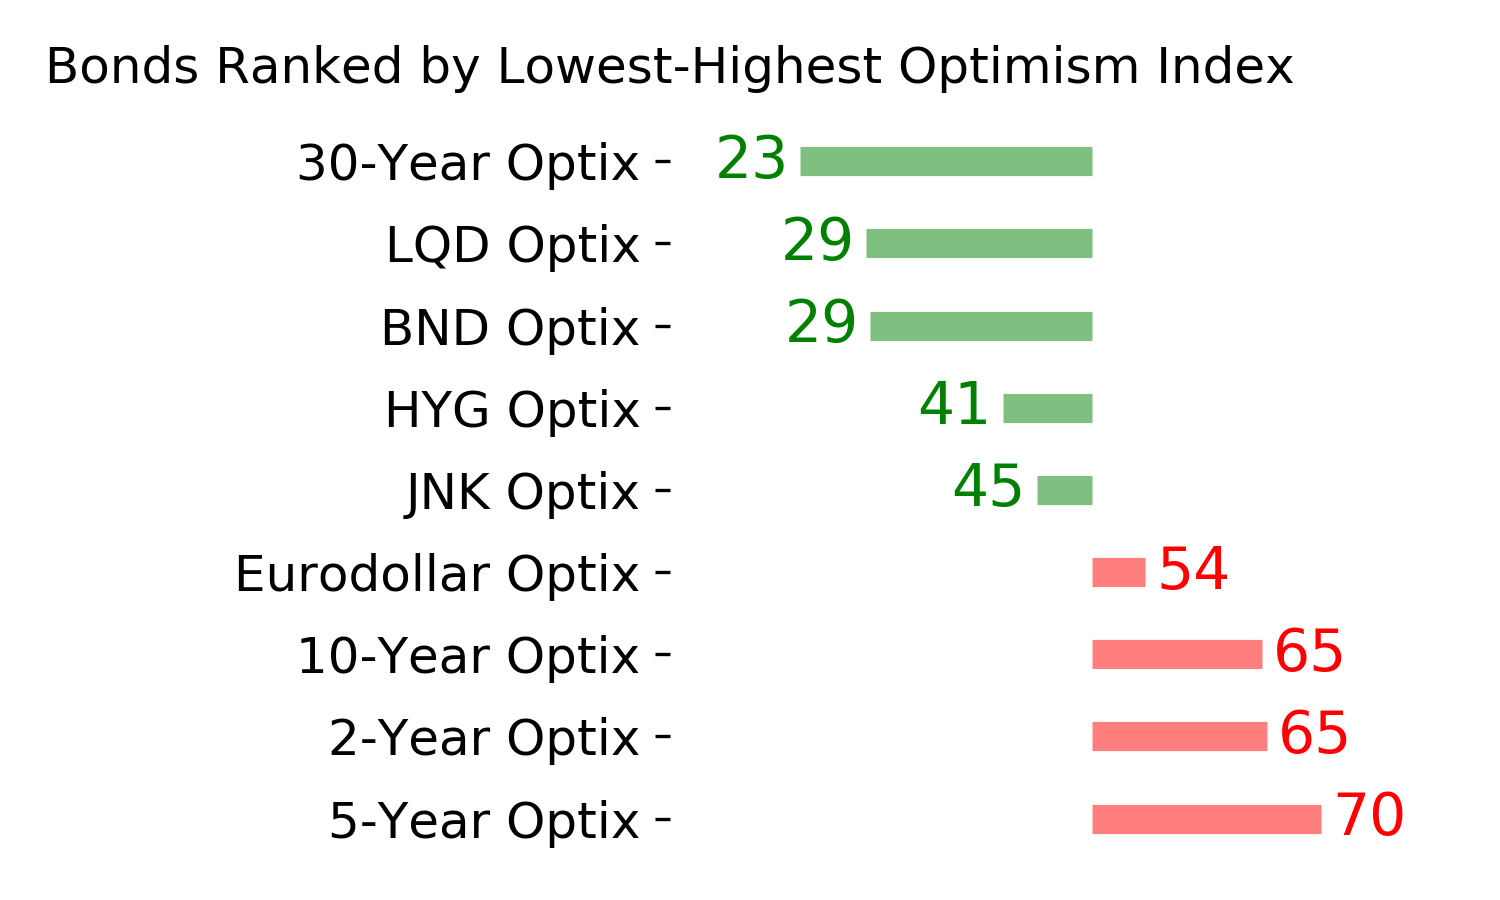
Ranks
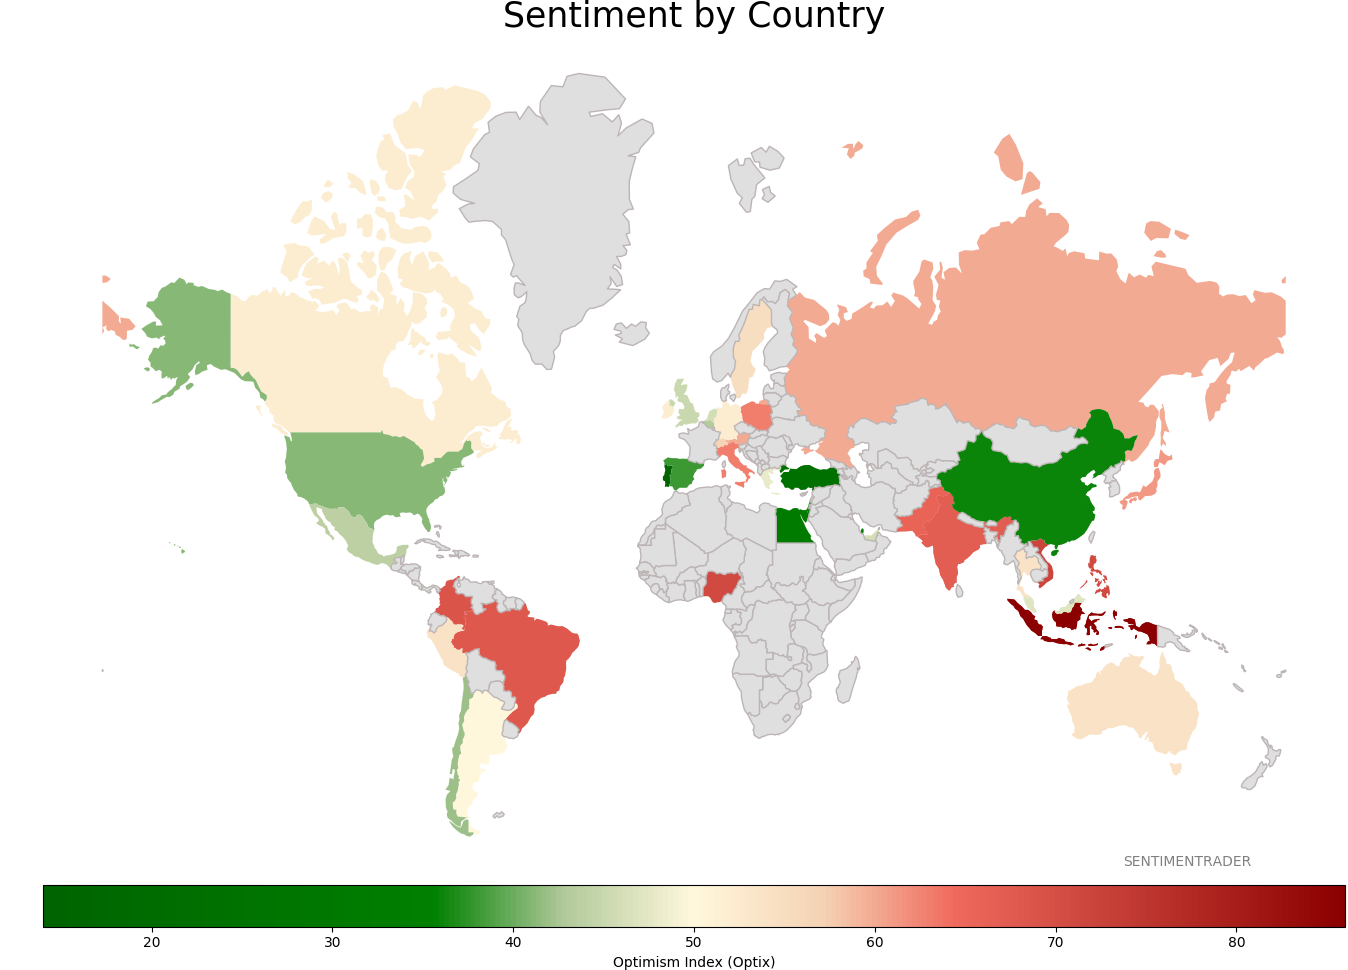
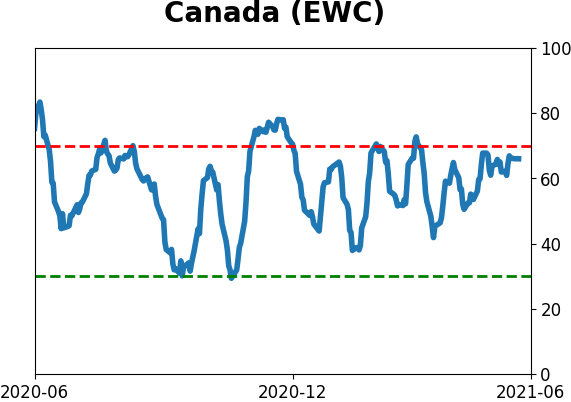
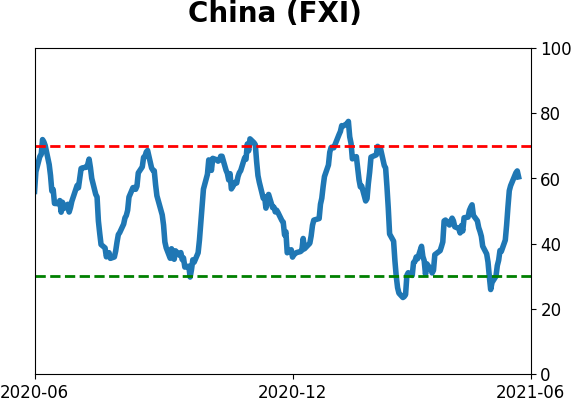
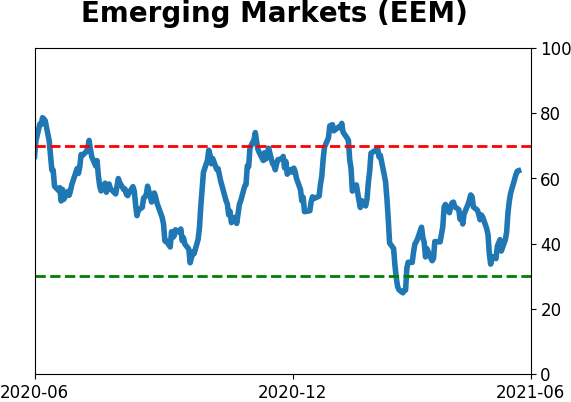
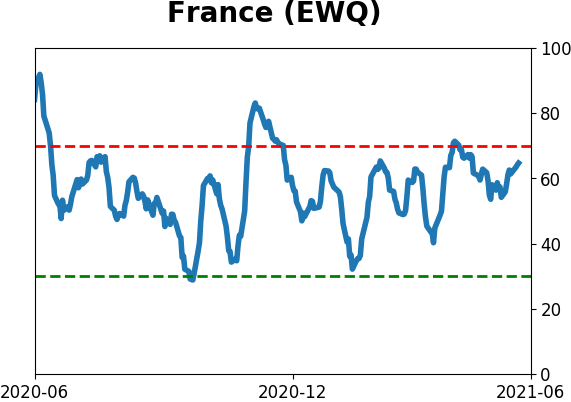
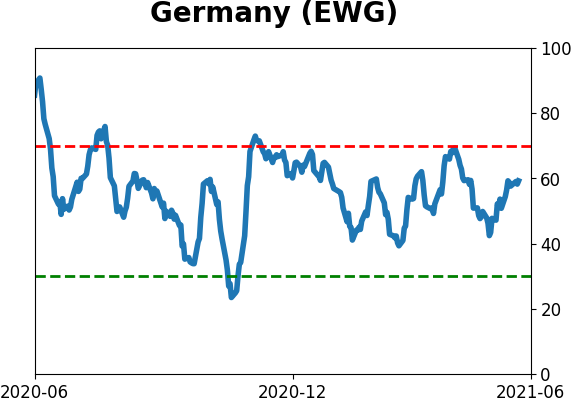
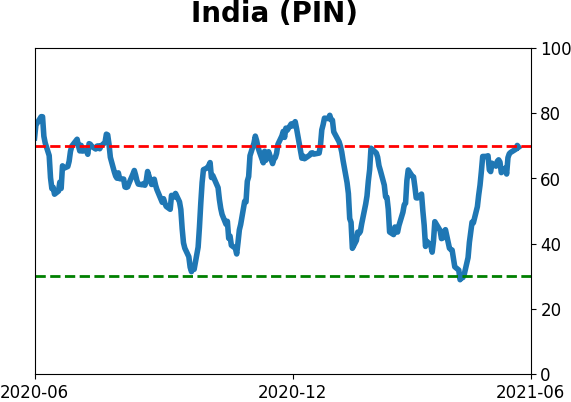
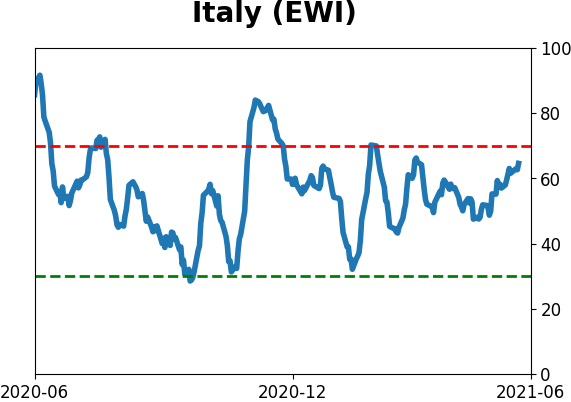
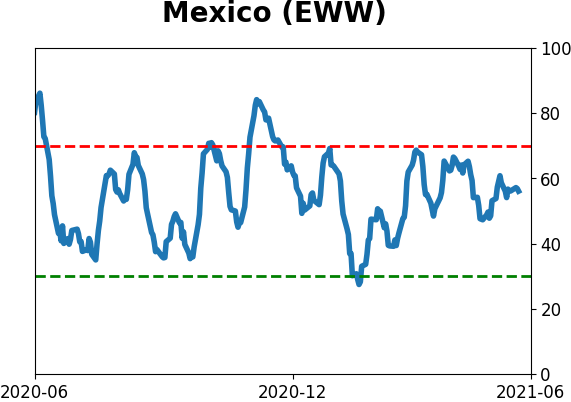
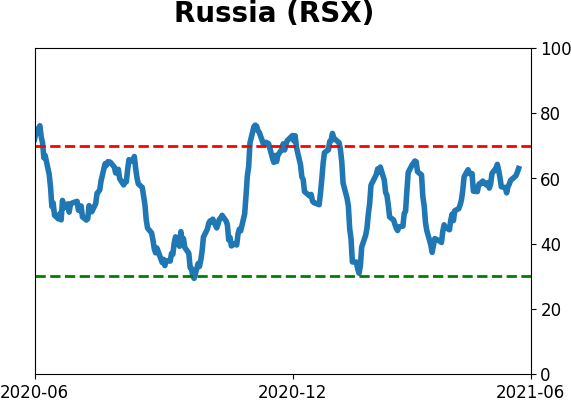
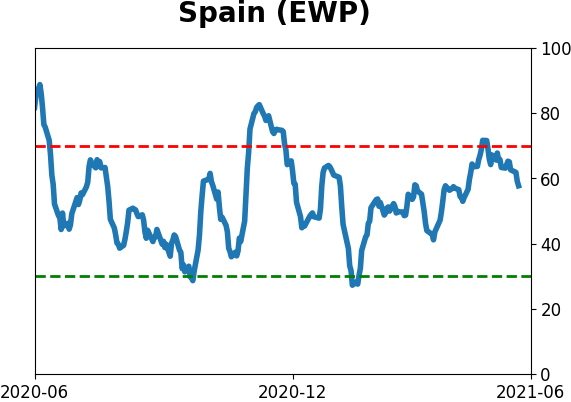
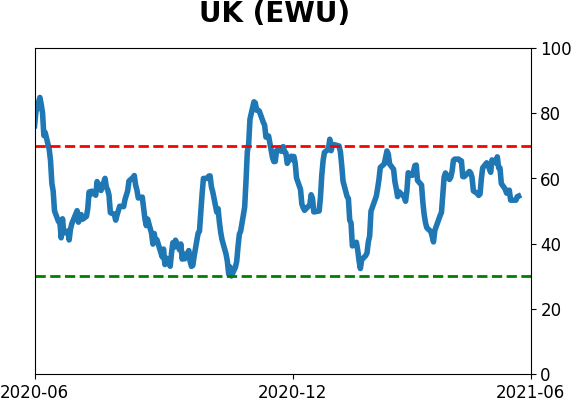
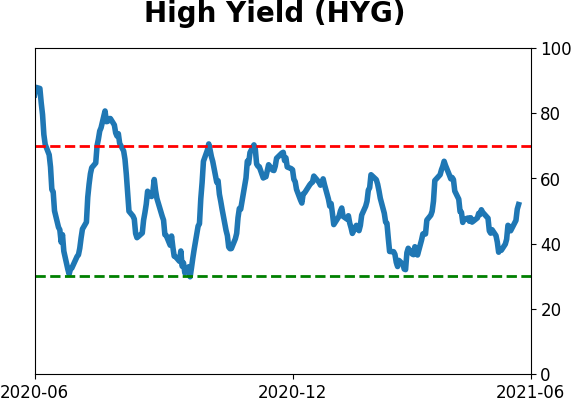
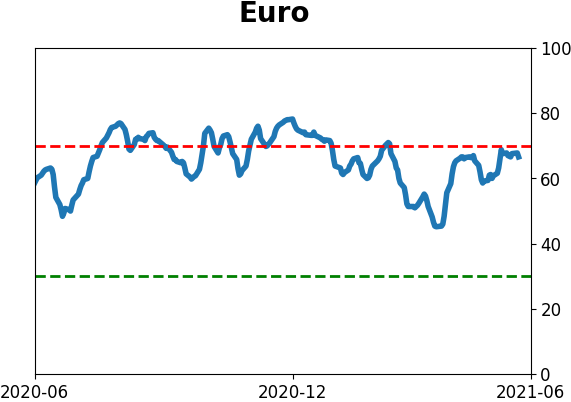
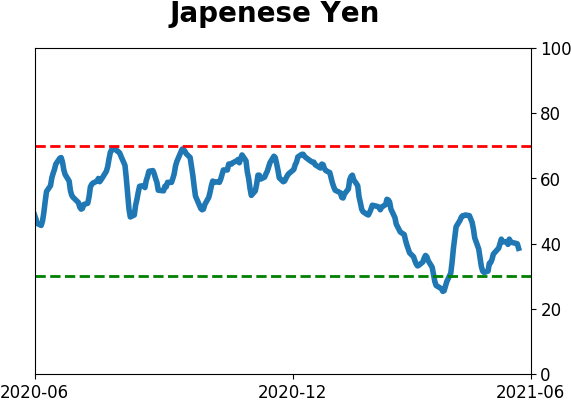
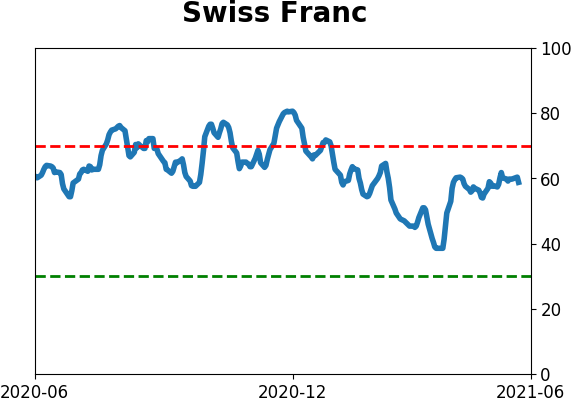
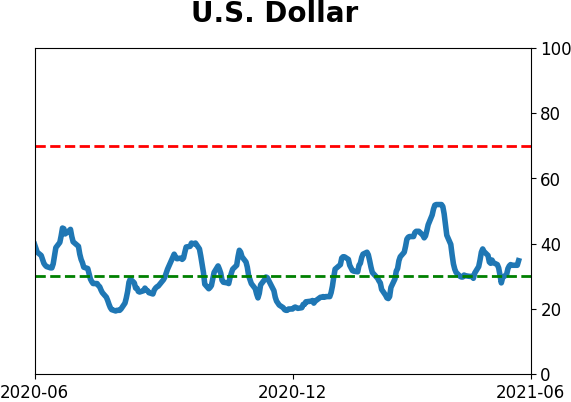
Sentiment Around The World
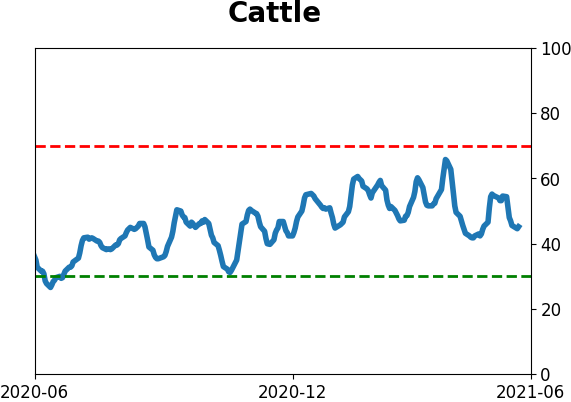
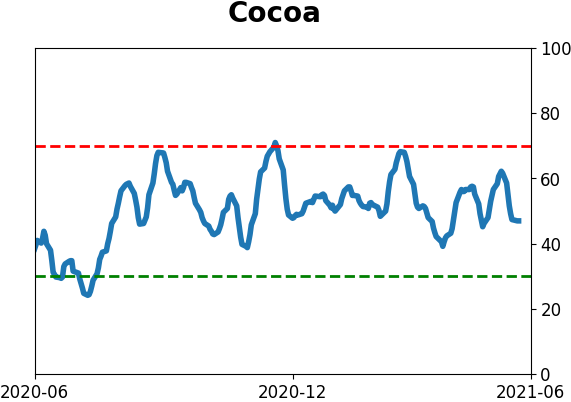
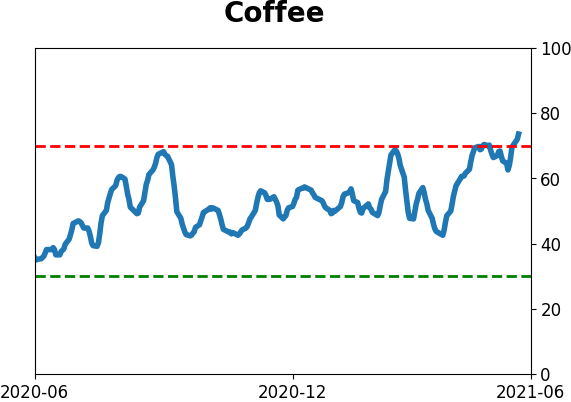
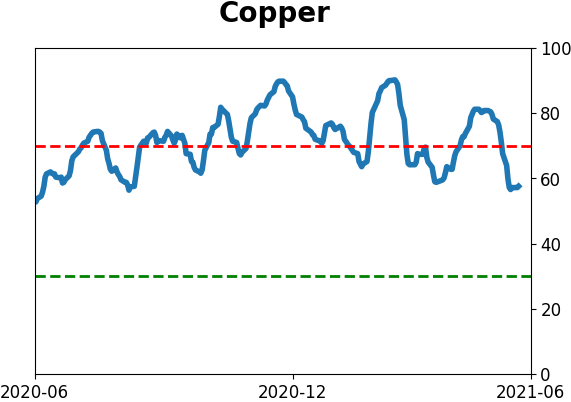
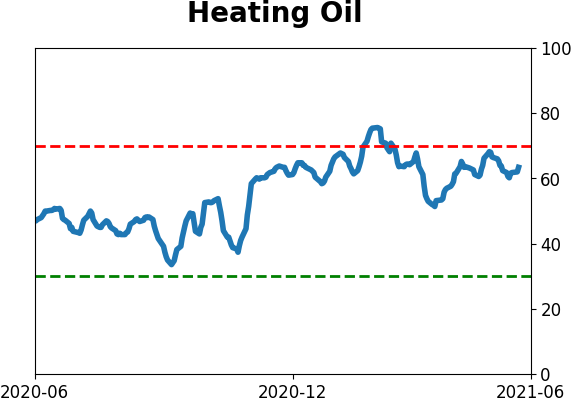
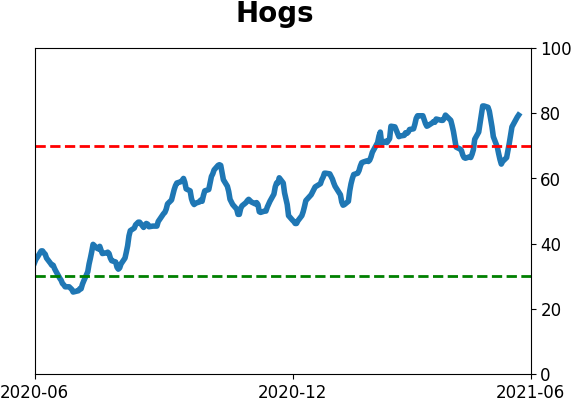
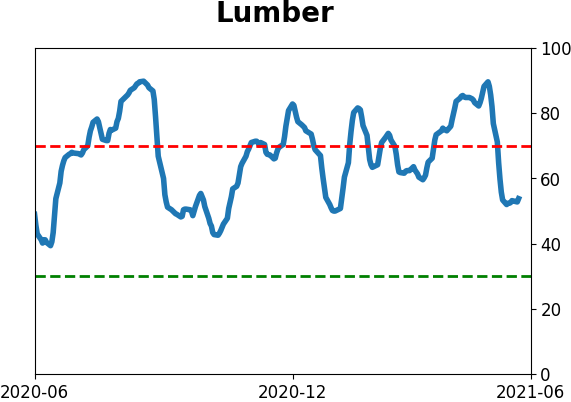
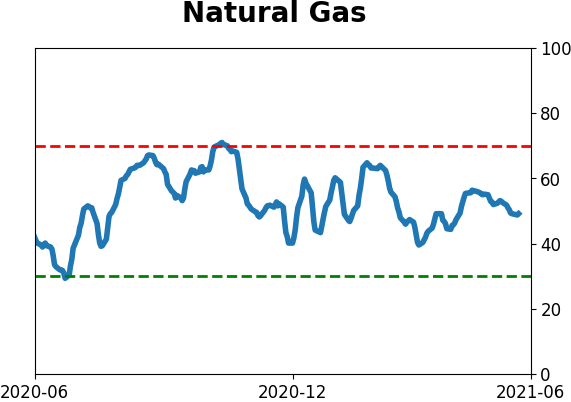
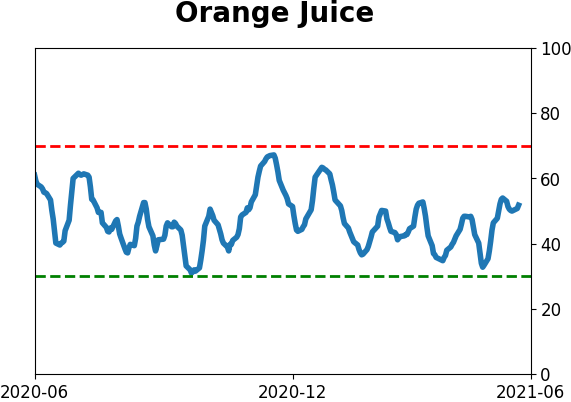
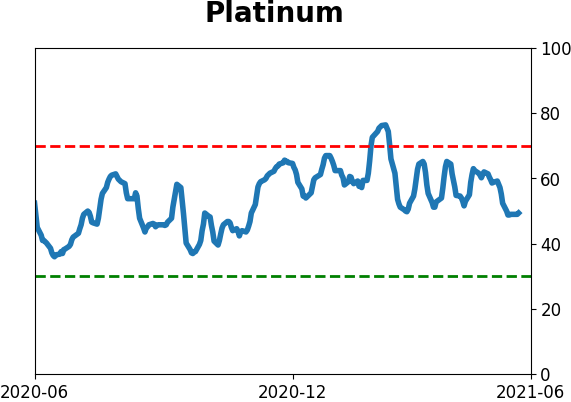
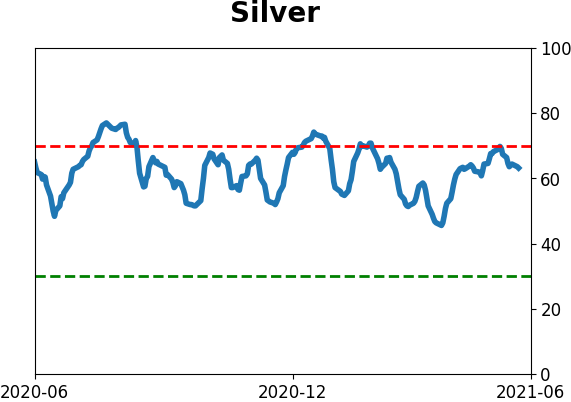
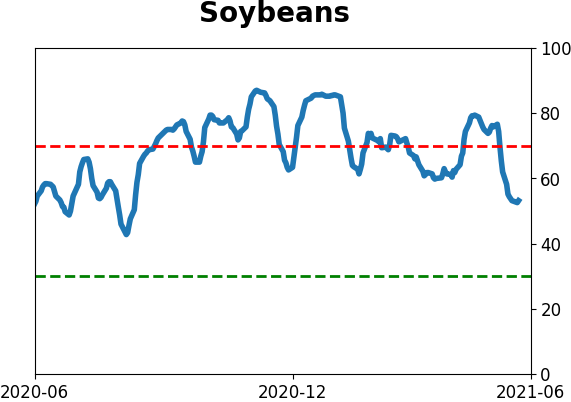
Optimism Index Thumbnails
|
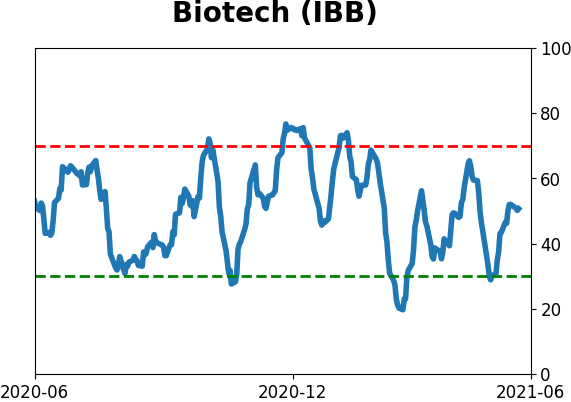
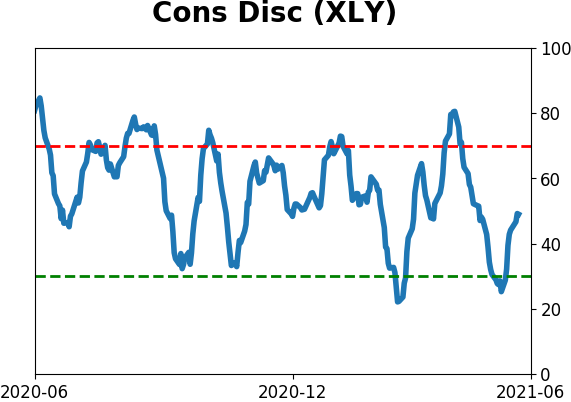
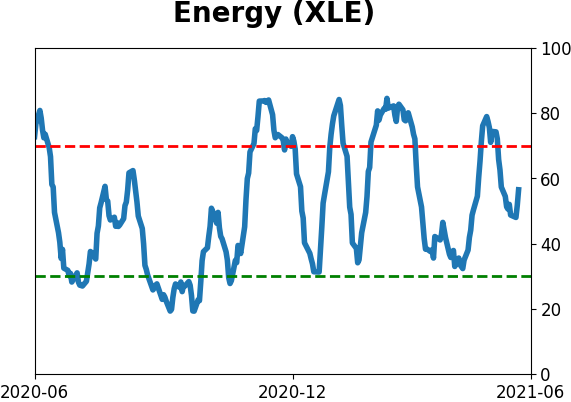
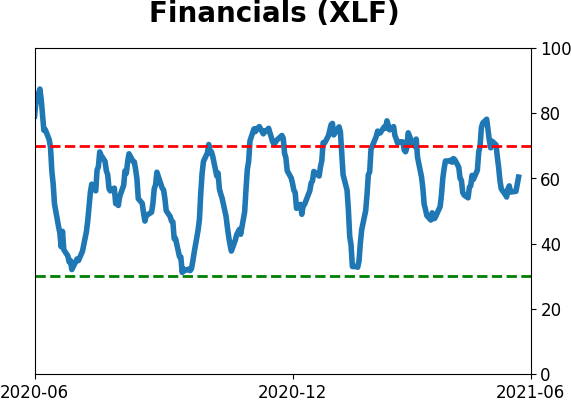
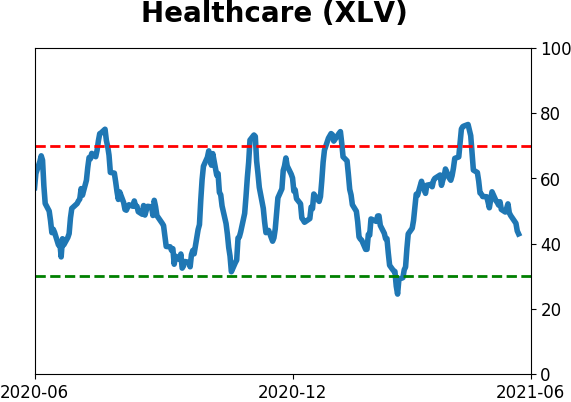
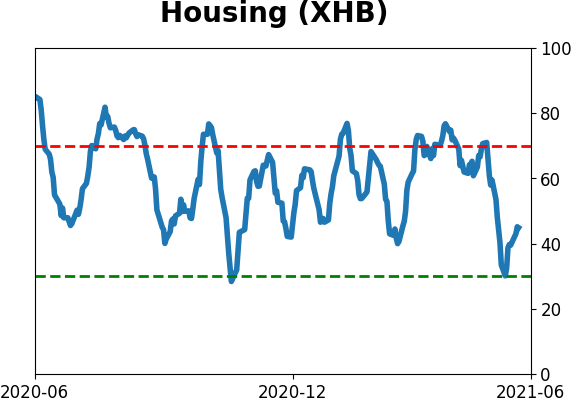
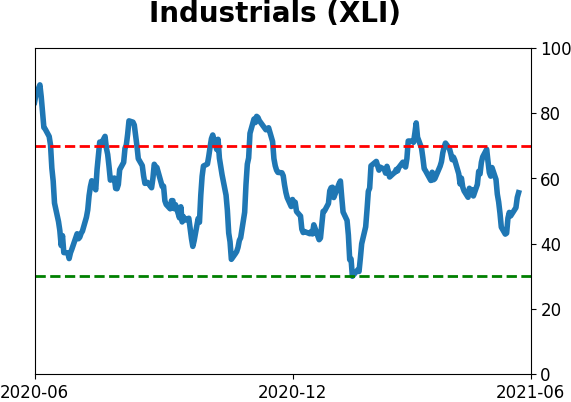
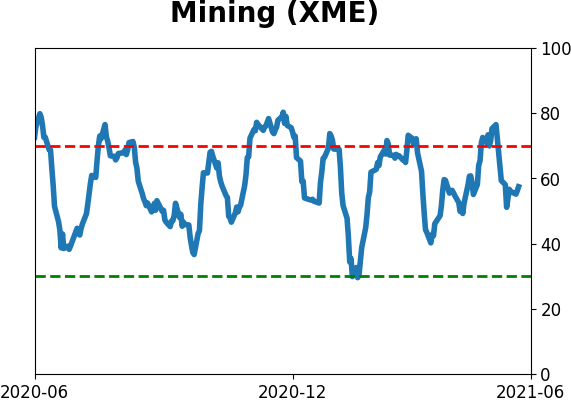
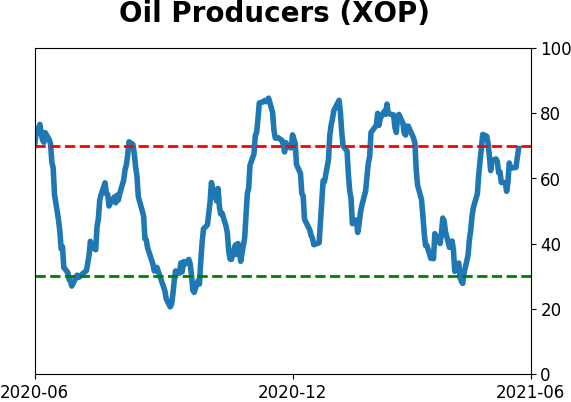
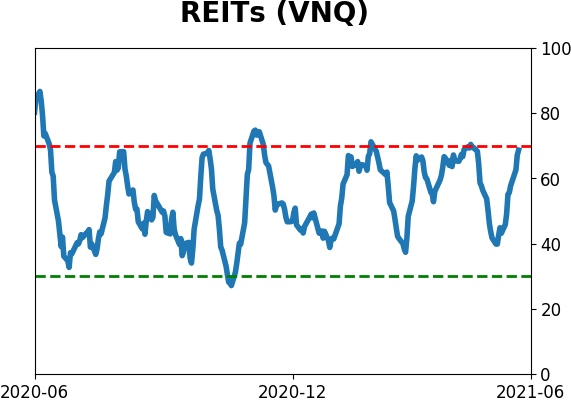
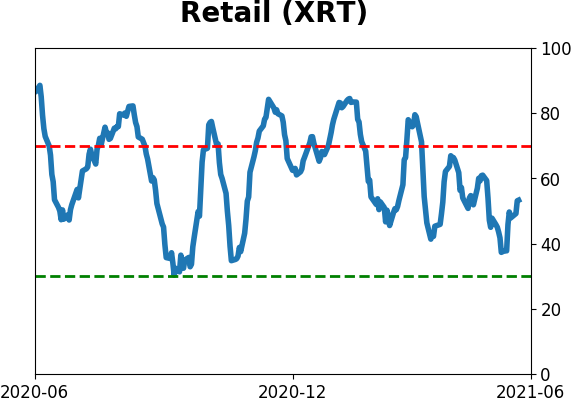
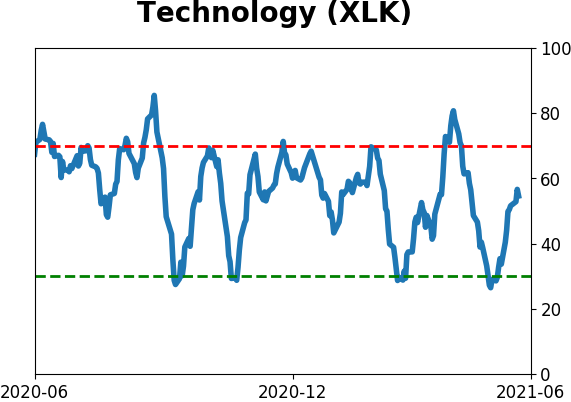
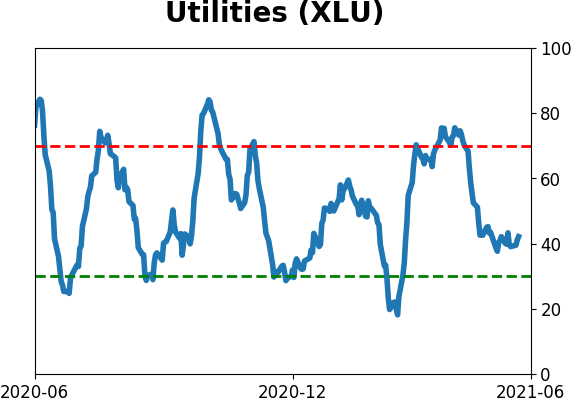
Sector ETF's - 10-Day Moving Average
|
|
|
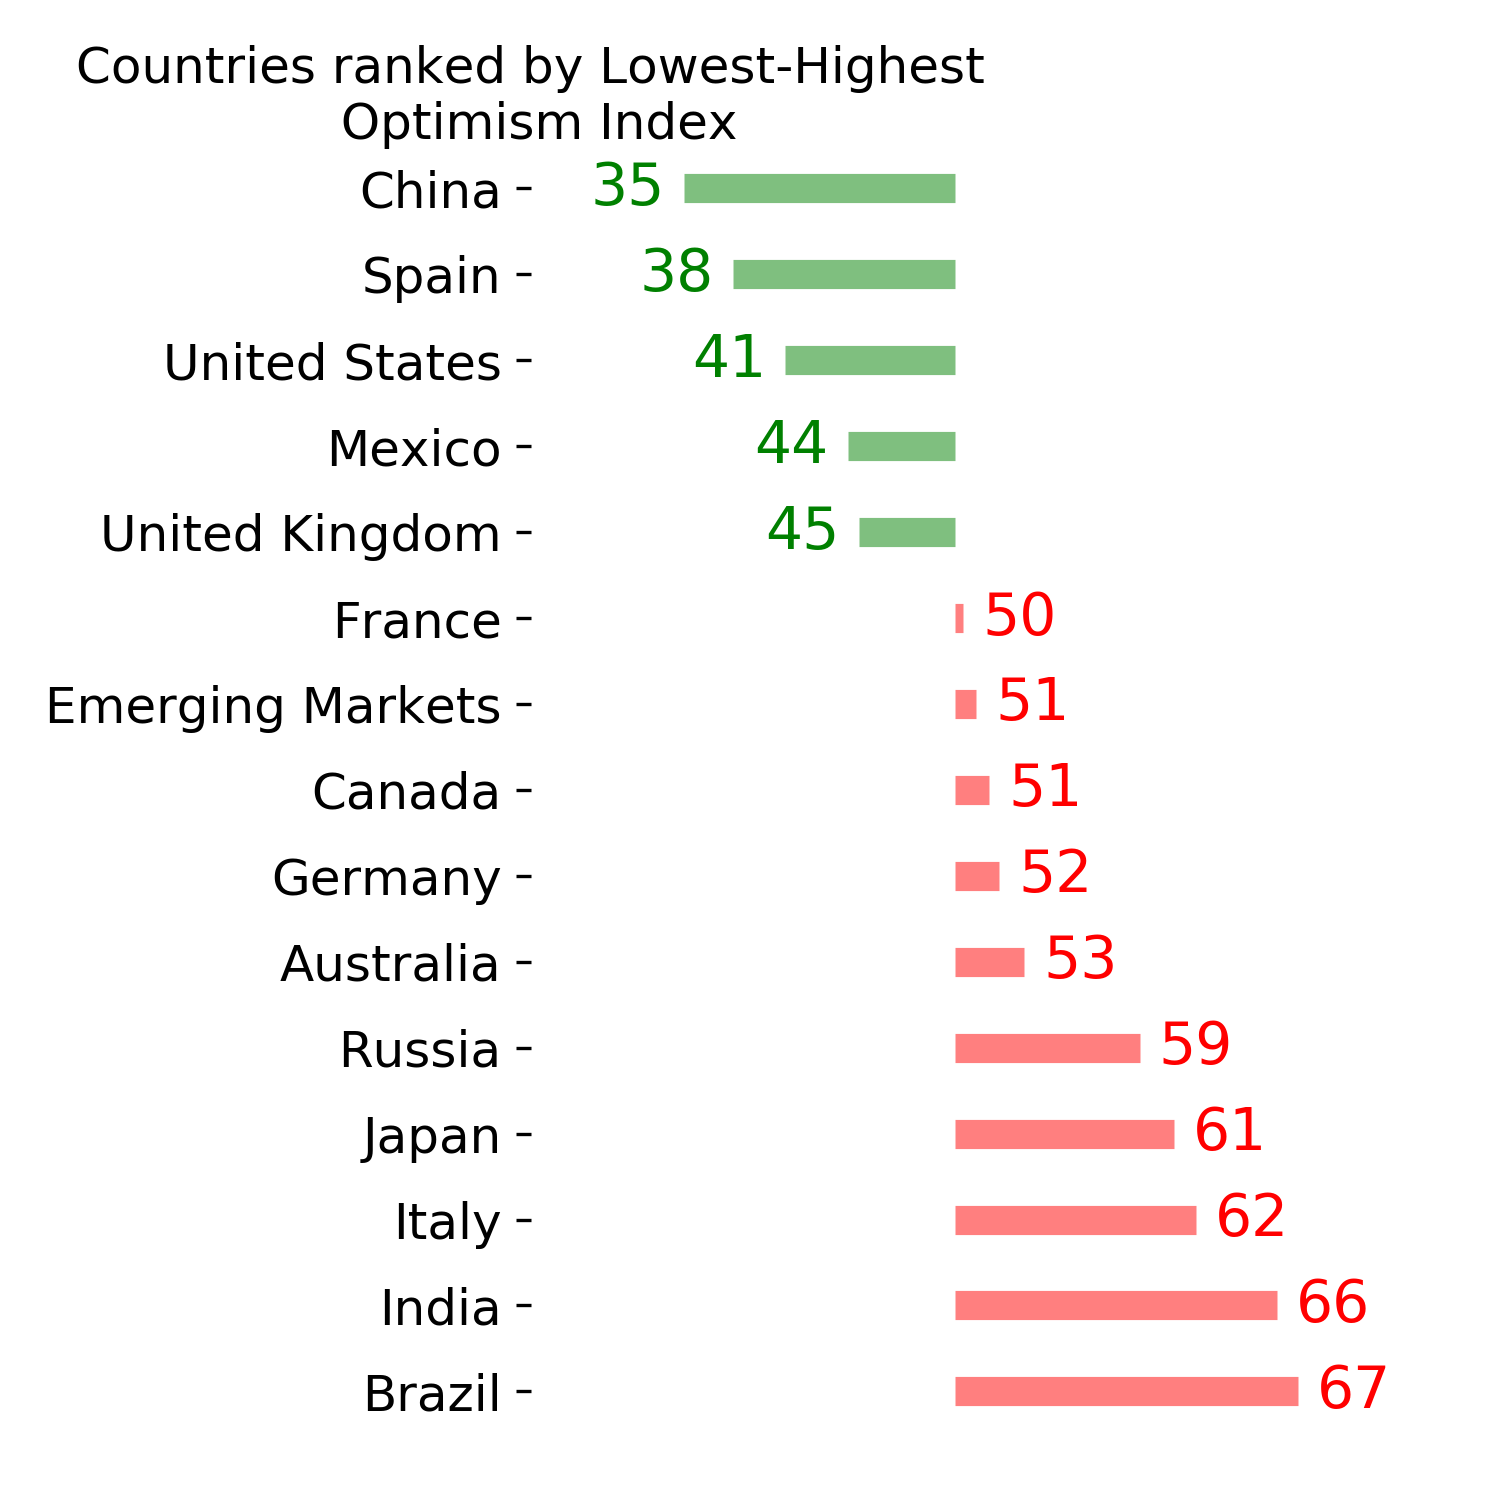
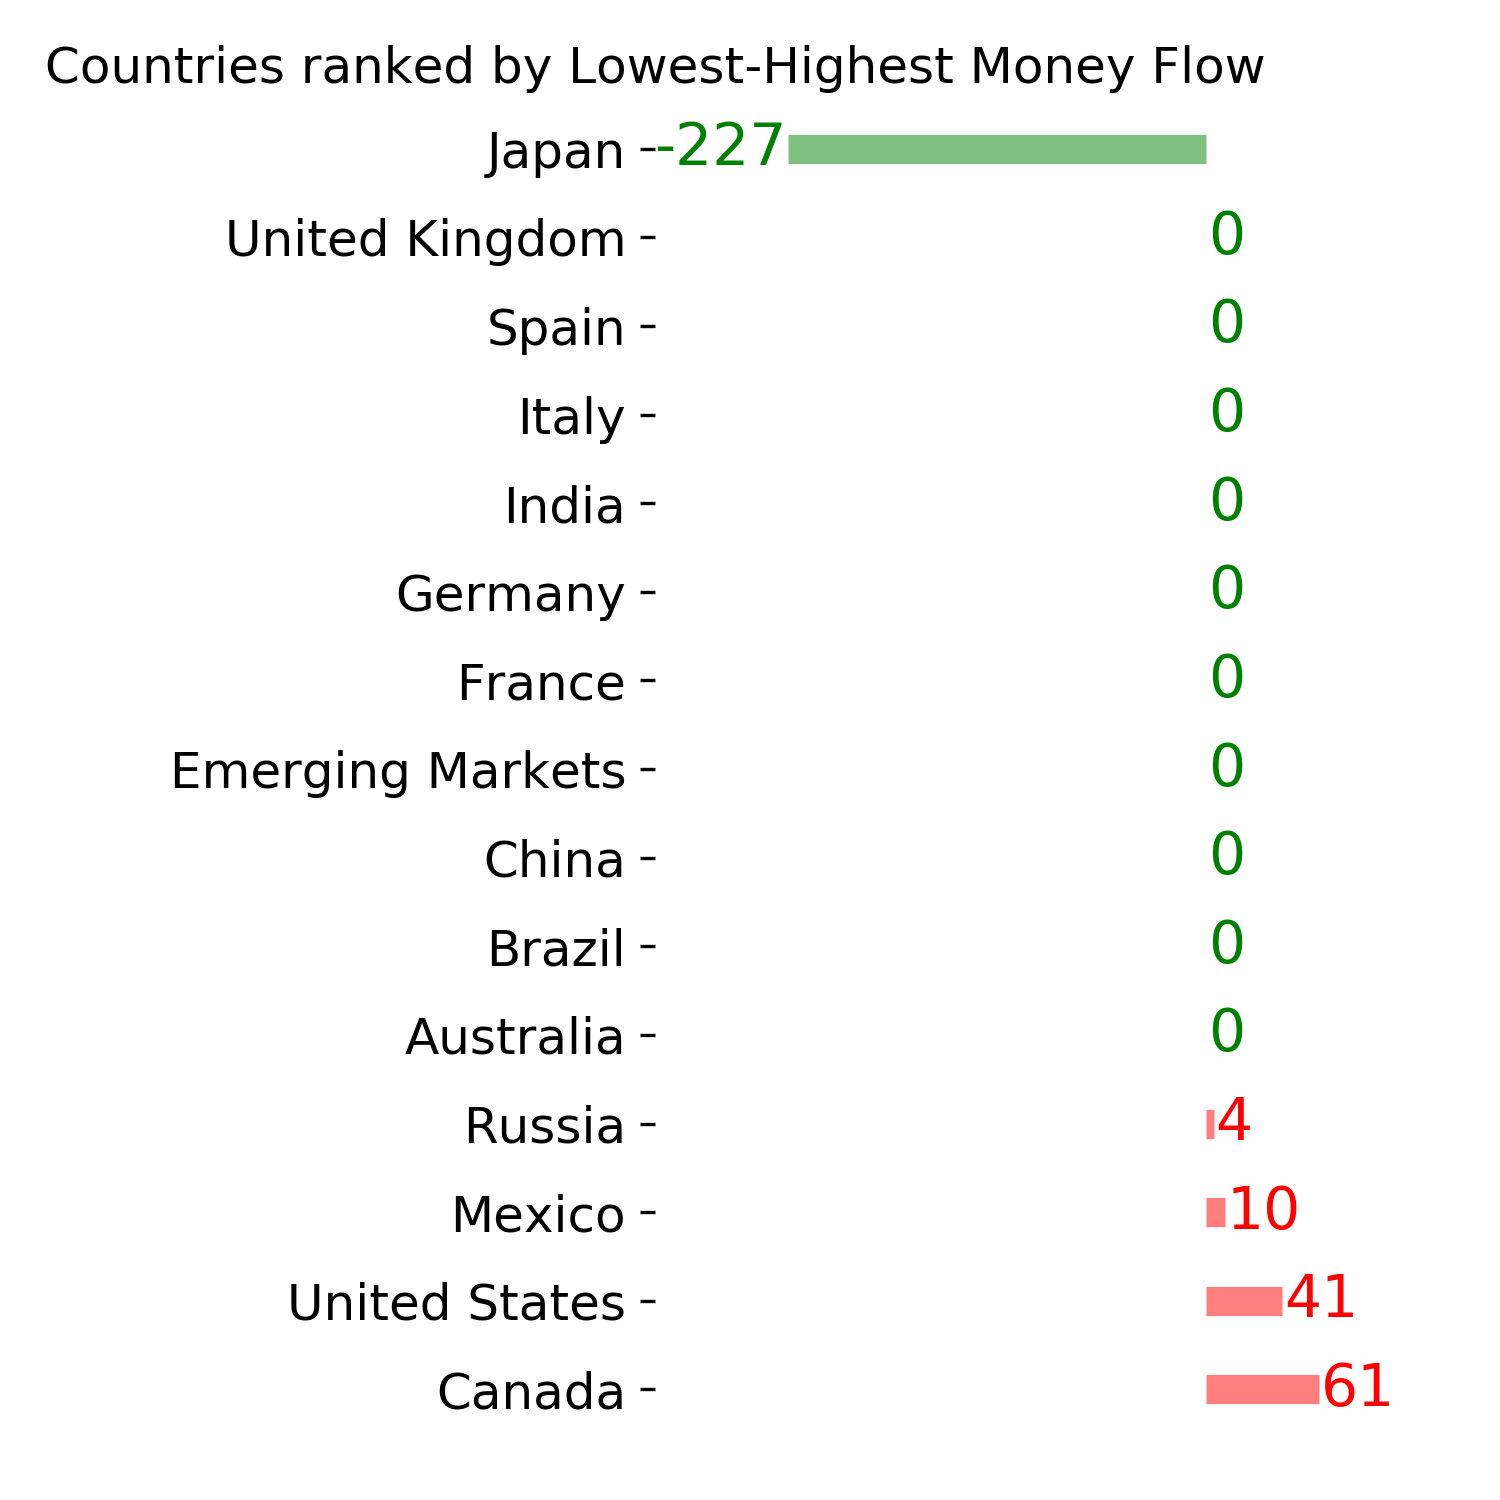
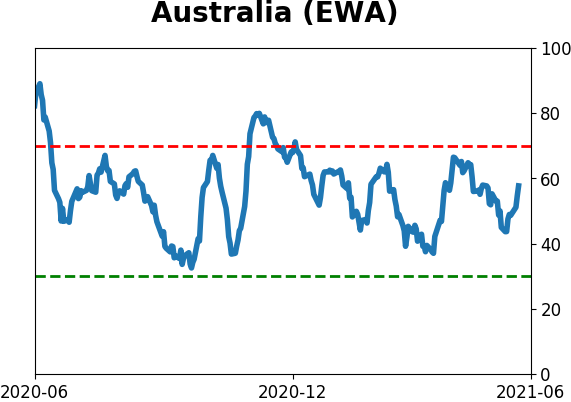
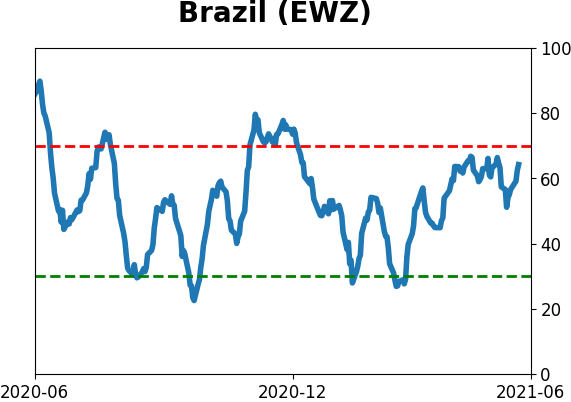
Country ETF's - 10-Day Moving Average
|
|
|
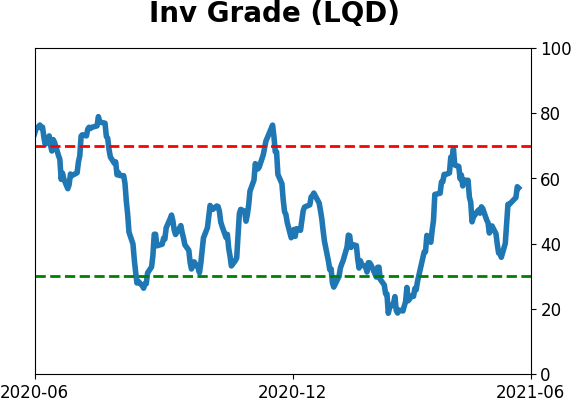
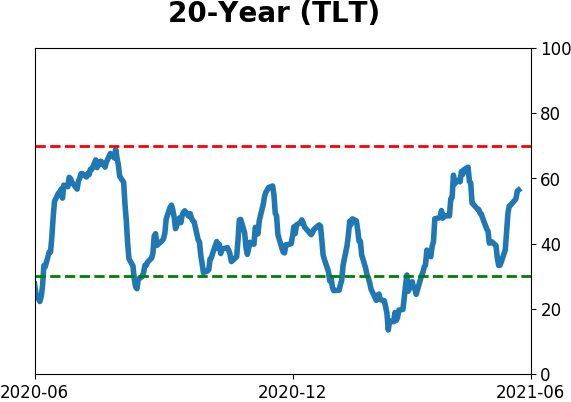
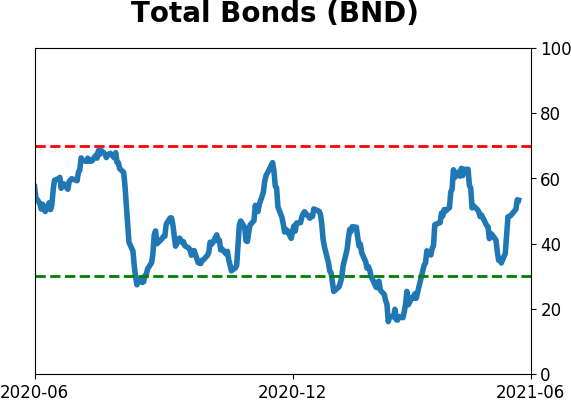
Bond ETF's - 10-Day Moving Average
|
|
|
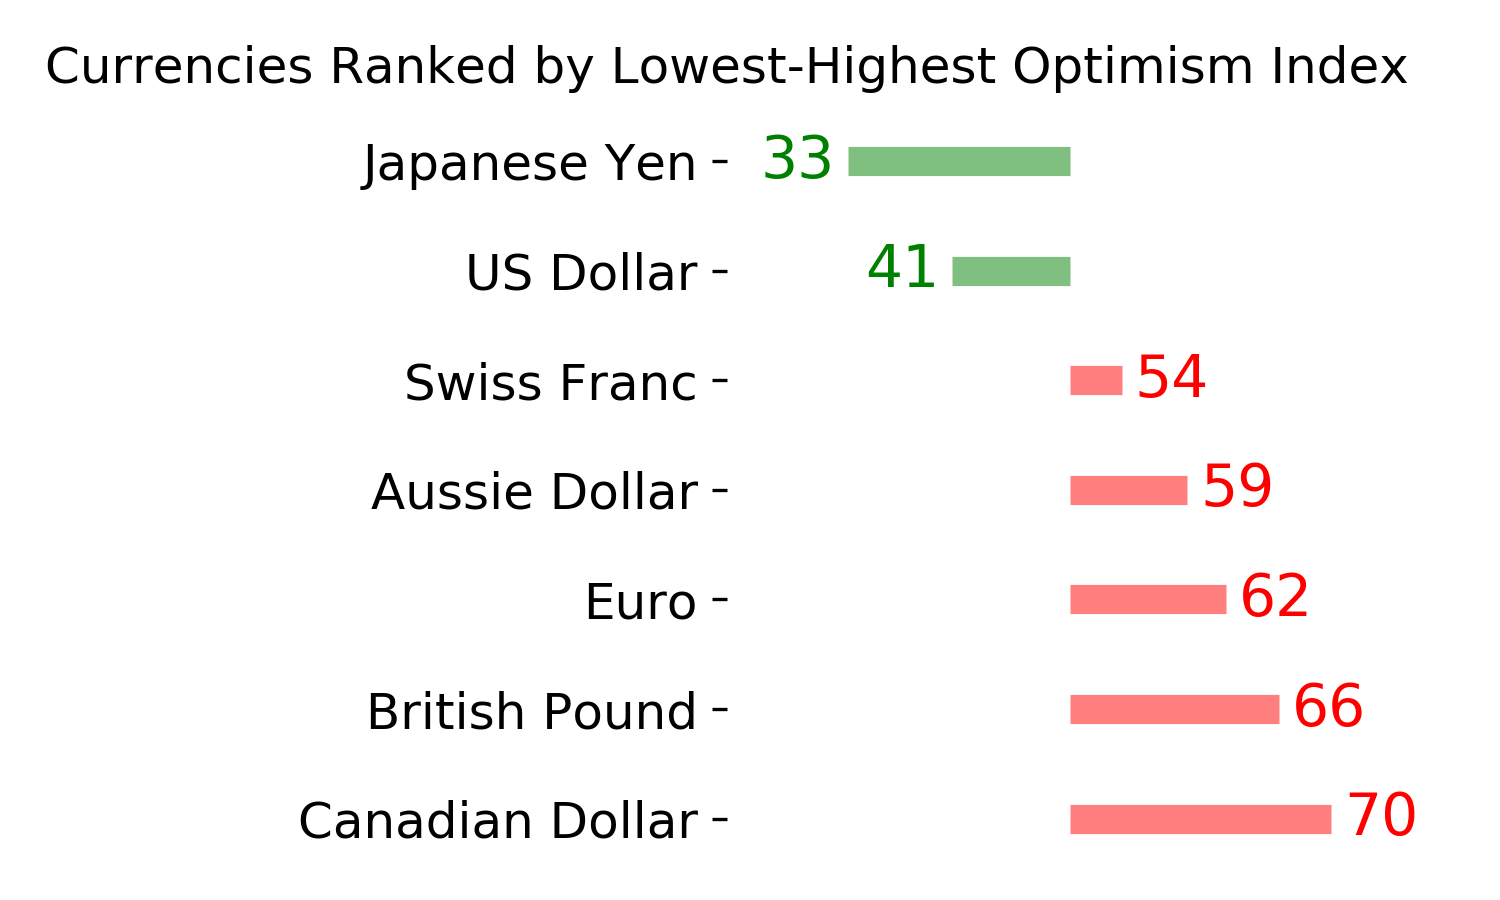
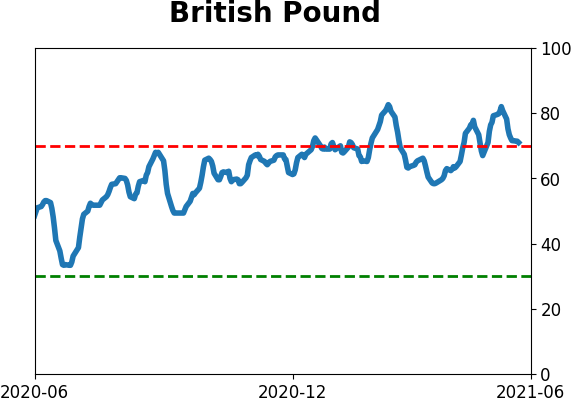
Currency ETF's - 5-Day Moving Average
|
|
|
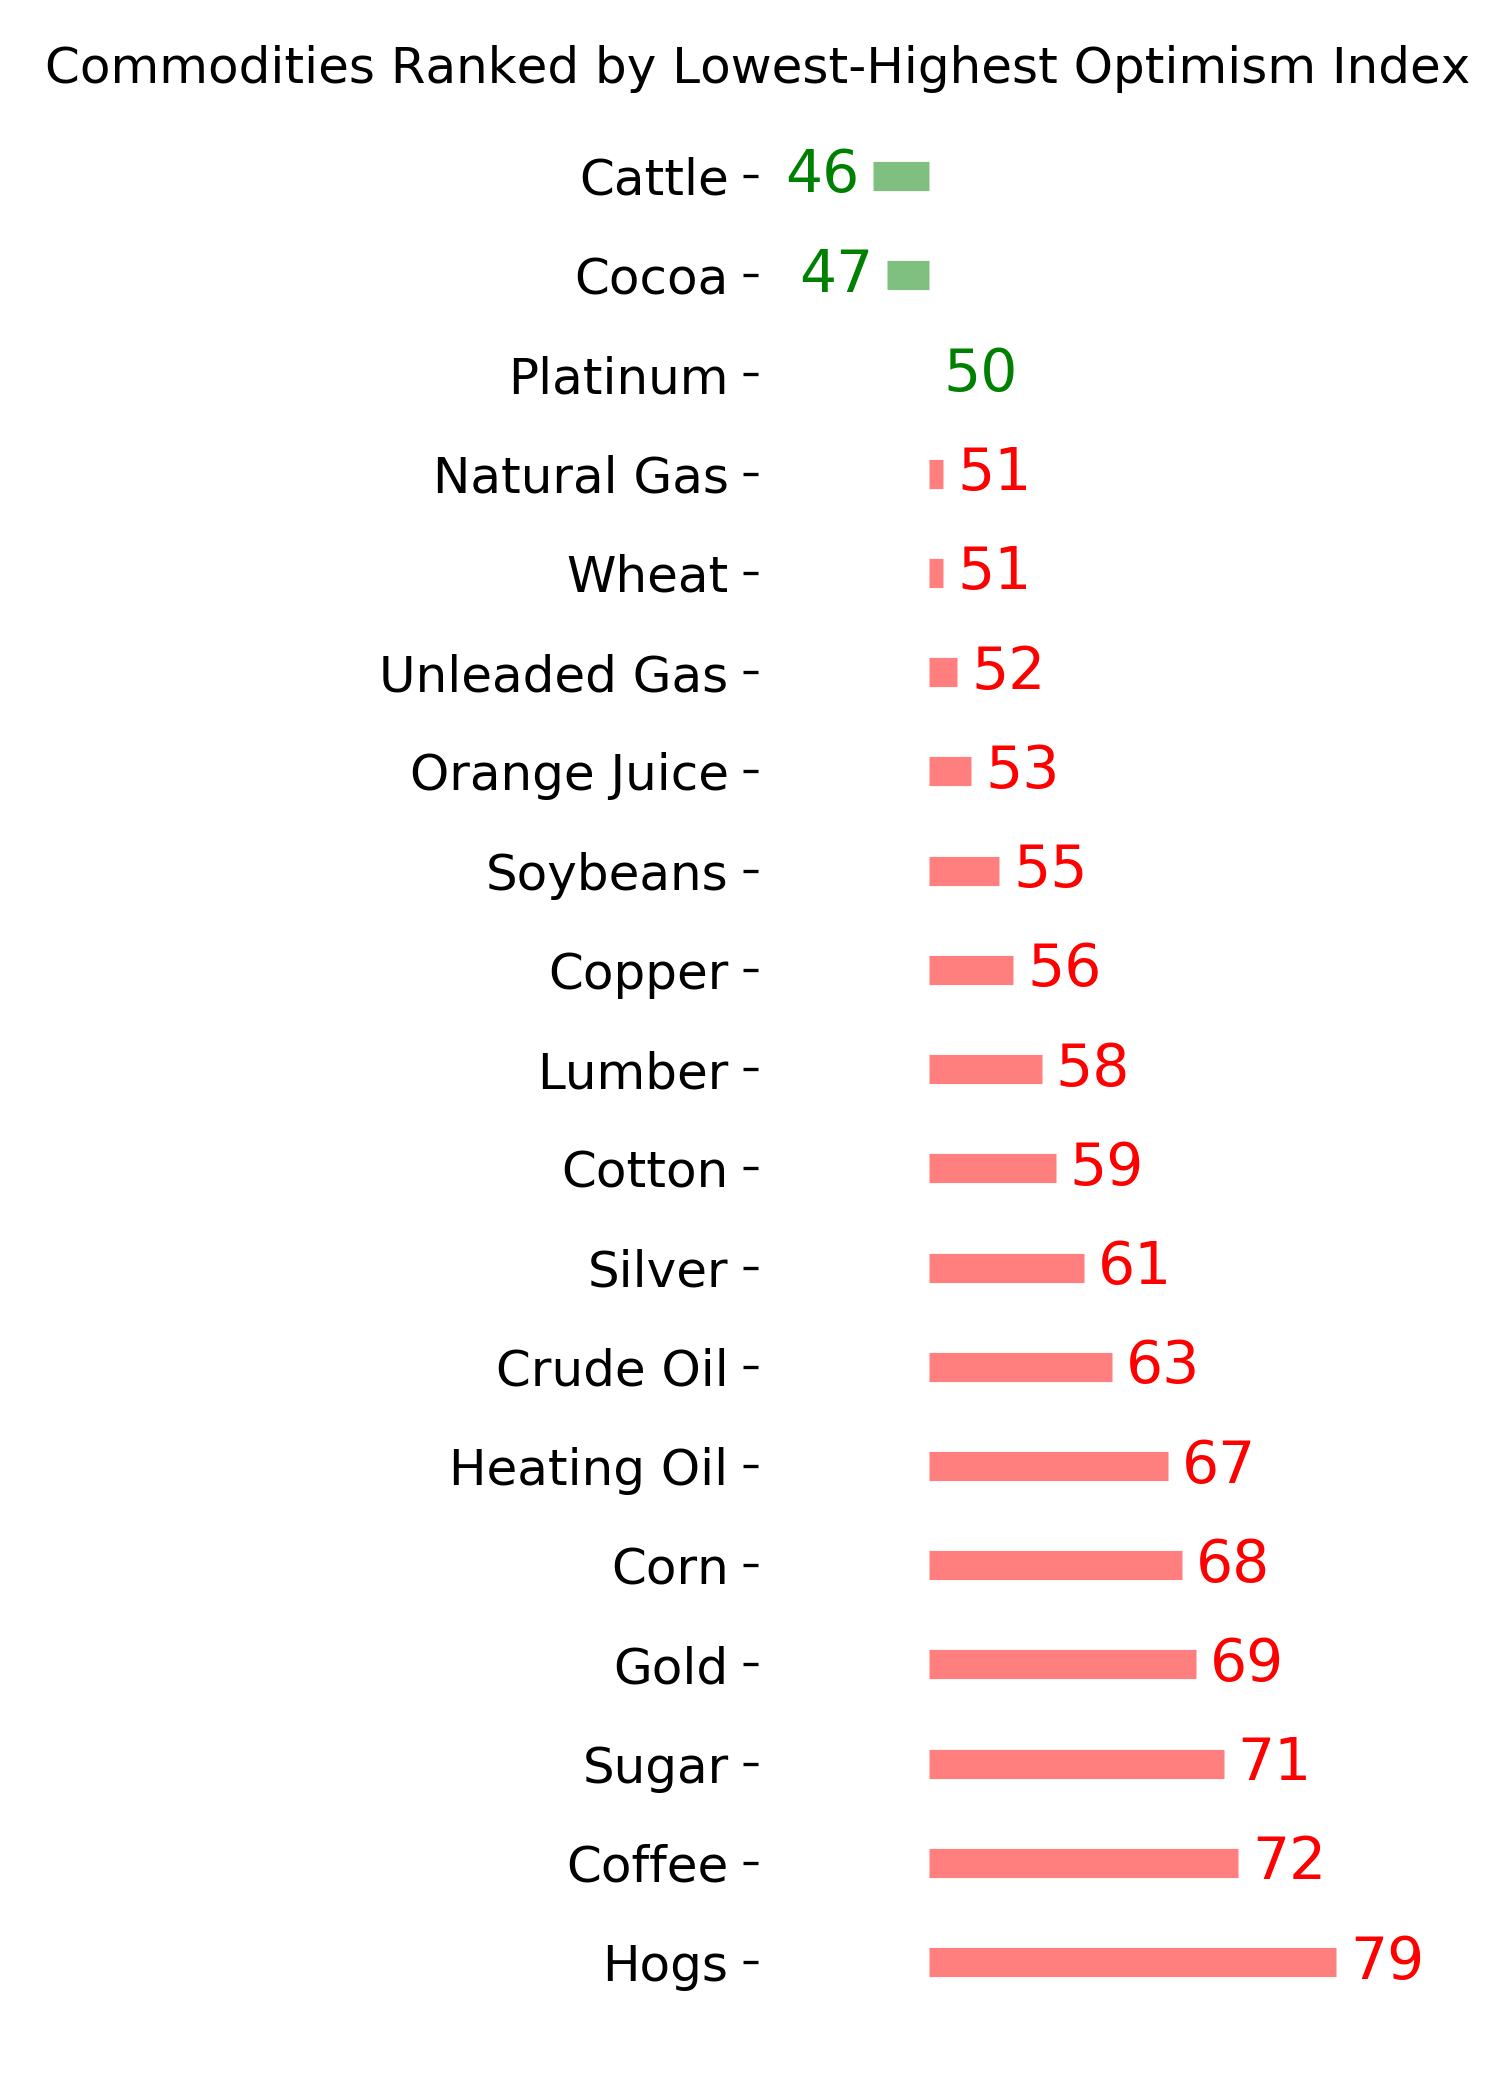
Commodity ETF's - 5-Day Moving Average
|
|