Headlines
|
|
Summation Indexes show complete recovery from devastation:
The rally has been sustained and broad enough that the McClellan Summation Index has moved above +500 after hitting -1000 during the panic. When it cycles like this within two months, forward returns were excellent. There have also been recoveries in high-yield bonds and overseas indexes like the DAX, and even emerging markets.
Fund managers find eurozone unattractive:
The May survey from Bank of America of large money managers shows that they've become increasingly apathetic about stocks in the eurozone relative to other areas. They are almost at a record underweight relative to their position on U.S. stocks and even bonds.
Almost back: The Nasdaq Composite has almost erased its entire decline. After plunging 30% from its 52-week high, the index is back to within 1.5% of it. The four other times it climbed so close, it never failed to deliver, reaching a new closing high within 13 days all four times. It continued higher in the months ahead each time as well. We'll take a closer look at this on Thursday, but for those curious, the dates were1975-05-14, 1989-01-19, 2003-05-30, and 2009-09-28.
|
Smart / Dumb Money Confidence
|
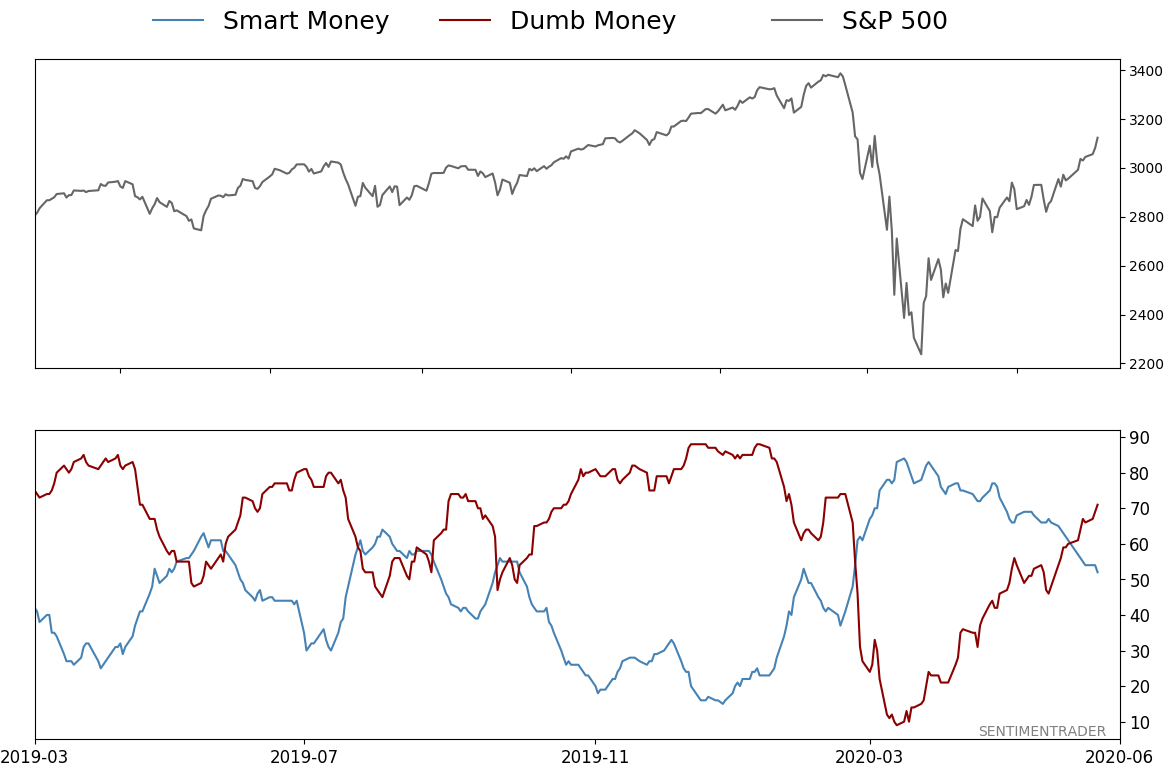
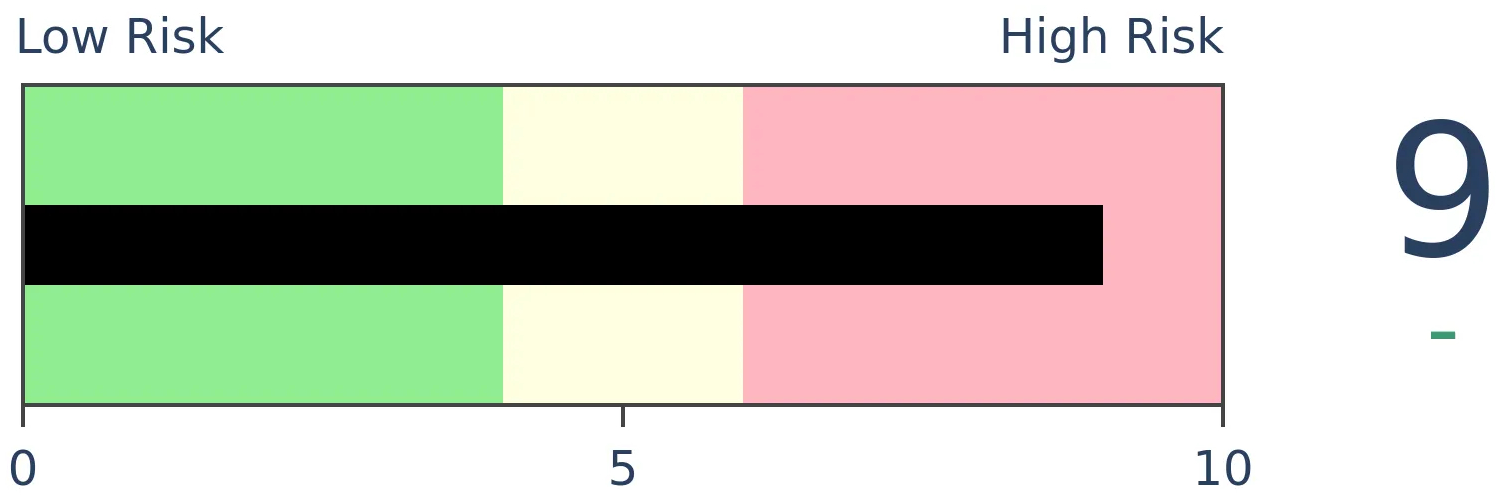
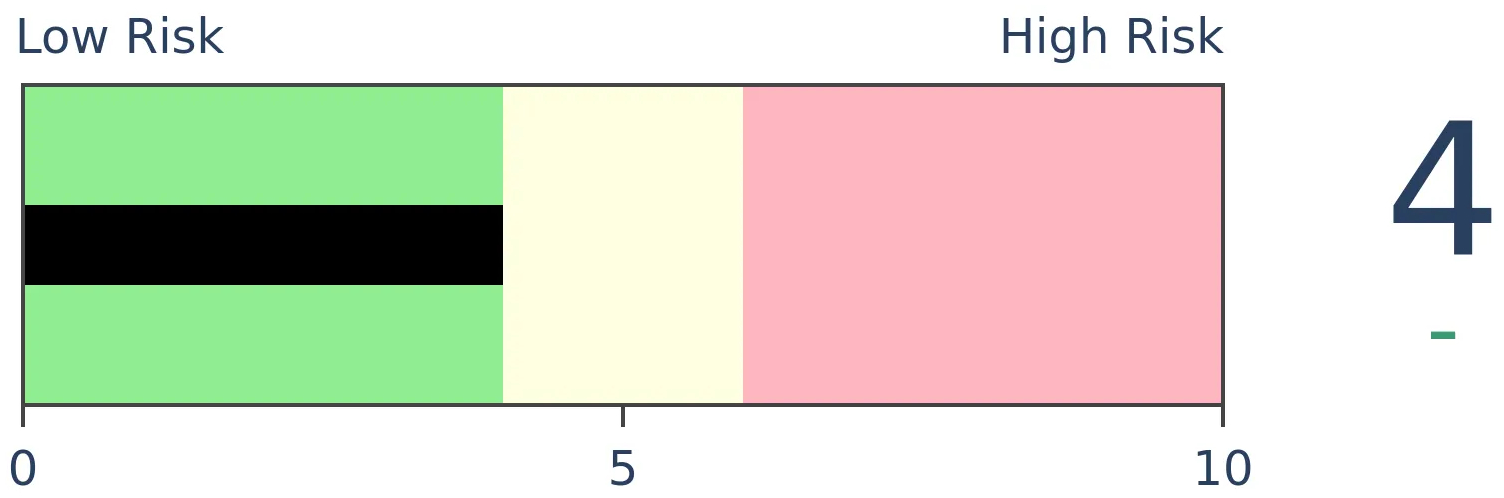
Smart Money Confidence: 52%
Dumb Money Confidence: 71%
|
|
Risk Levels
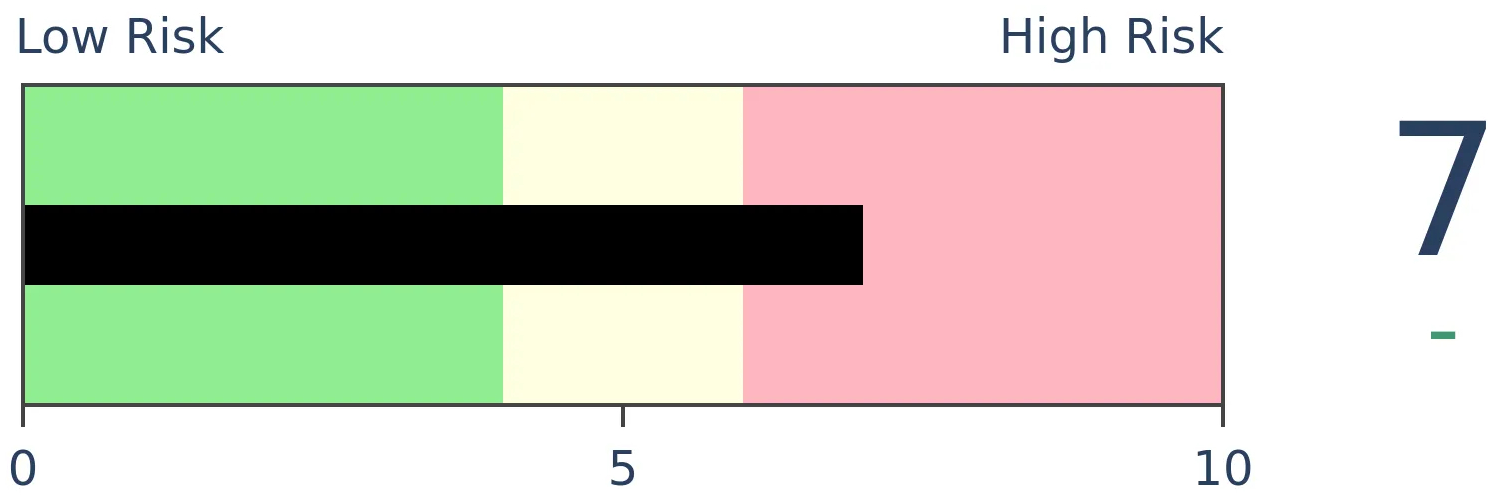
Stocks Short-Term
|
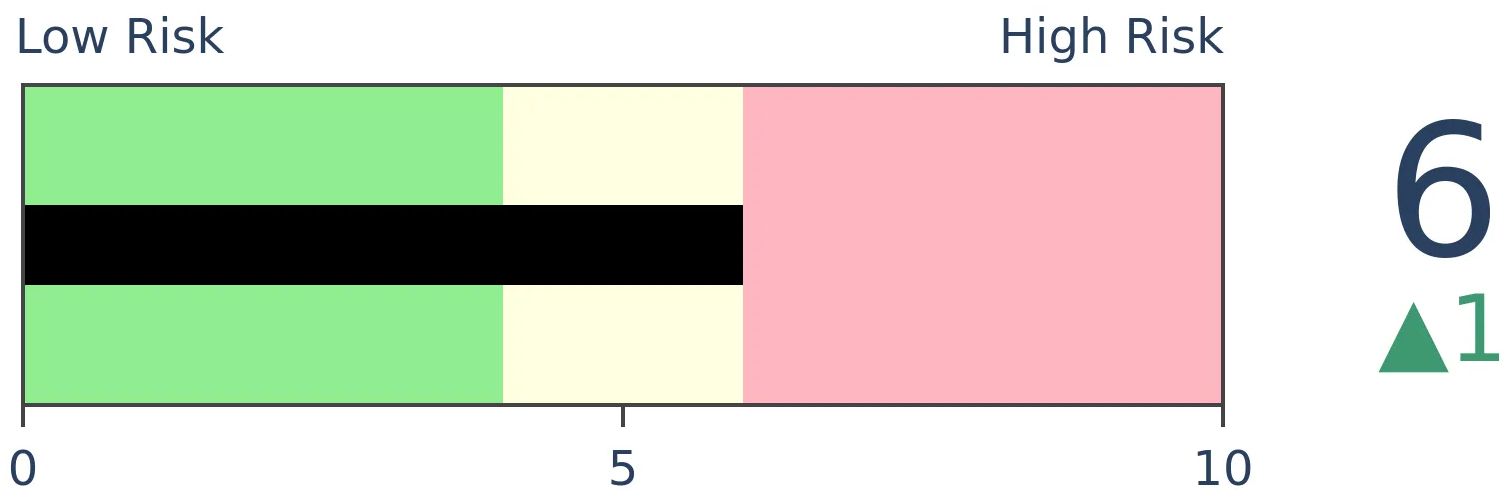
Stocks Medium-Term
|
|
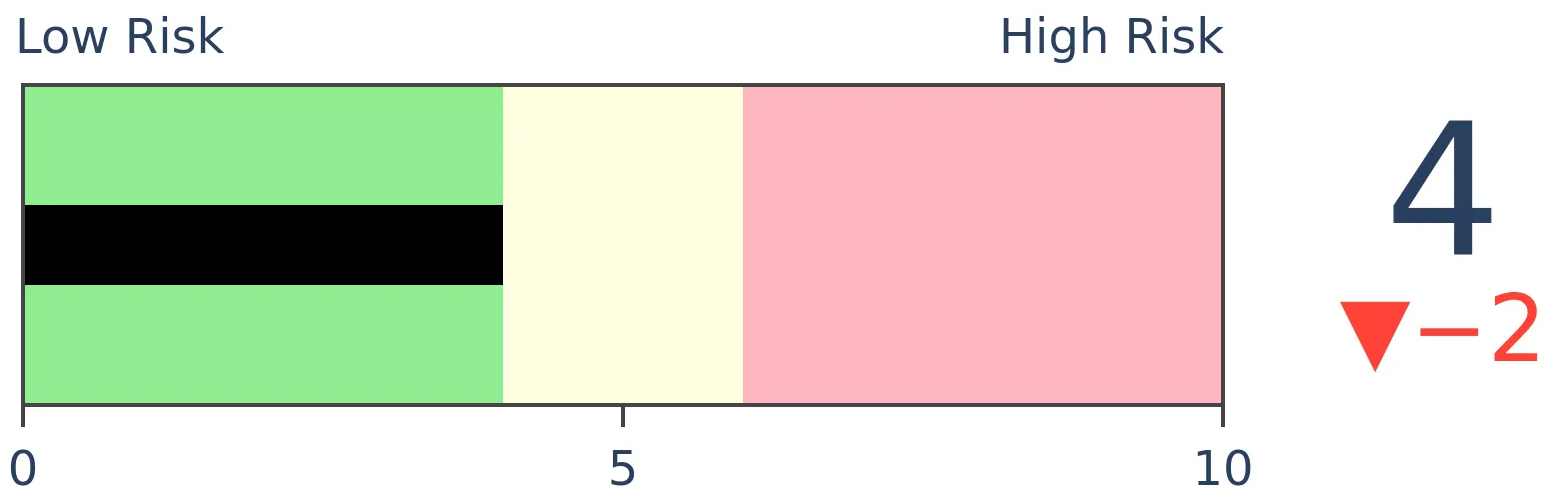
Bonds
|
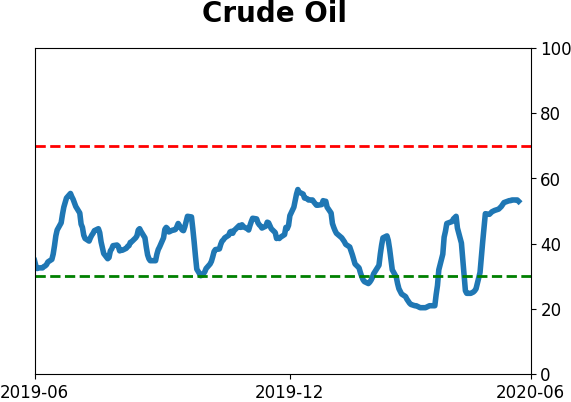
Crude Oil
|
|
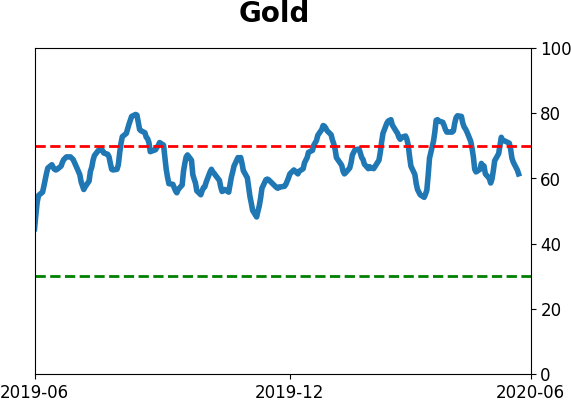
Gold
|
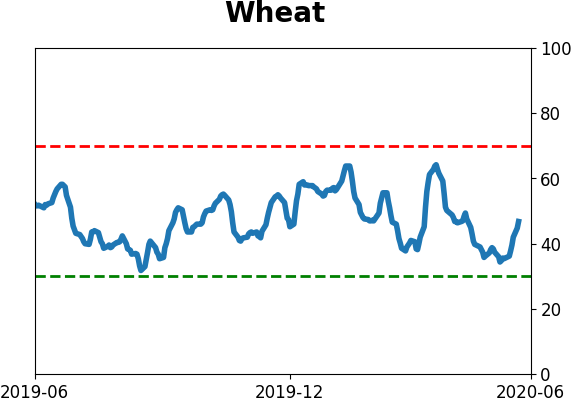
Agriculture
|
|
Research
BOTTOM LINE
The rally has been sustained and broad enough that the McClellan Summation Index has moved above +500 after hitting -1000 during the panic. When it cycles like this within two months, forward returns were excellent. There have also been recoveries in high-yield bonds and overseas indexes like the DAX, and even emerging markets.
FORECAST / TIMEFRAME
SPY -- Up, Long-Term
|
The rally has lasted long enough, and has been widespread enough, that longer-term breadth measures are recovering from their March devastation.
According to the Sector Breadth page, almost all major indexes, domestic and overseas, now have a positive McClellan Summation Index.
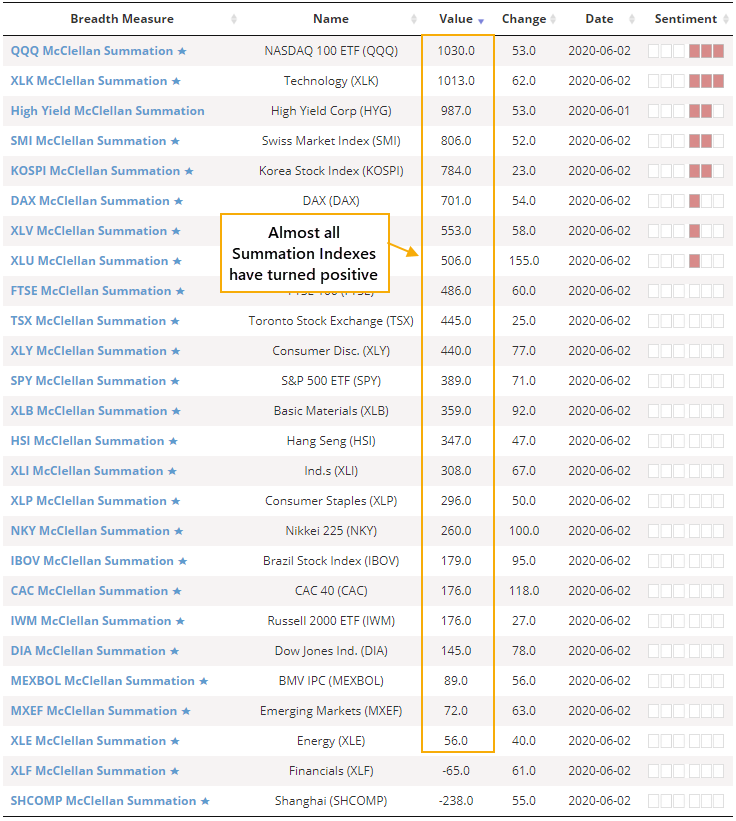
The Summation Index is based on work pioneered by Sherman and Marian McClellan. It is a longer-term look at the momentum of the underlying breadth of an index, adding each day's McClellan Oscillator reading to the day before. When it is above zero, momentum is positive; below zero, it is negative.
On the NYSE, the Oscillator has been gyrating but has recorded some very high readings over the past two months. That has pushed the longer-term Summation Index above +500 for the first time in months, following its plunge below -1000.
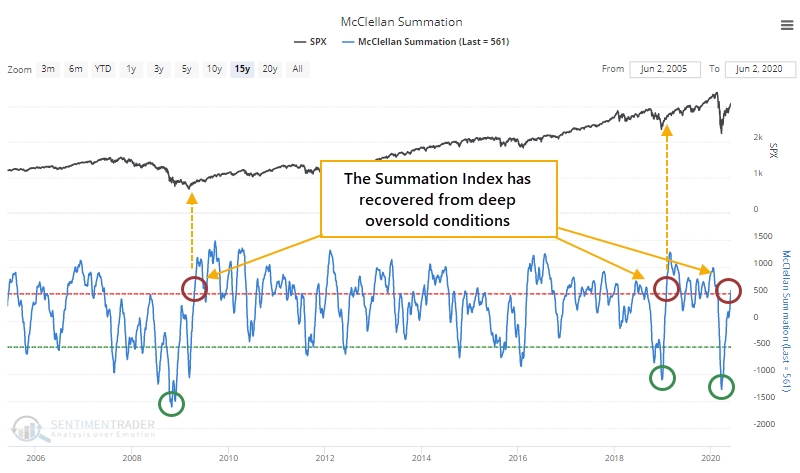
When the Summation Index has recovered from below -1000 to above +500, it has typically preceded sustained recoveries in the S&P 500.
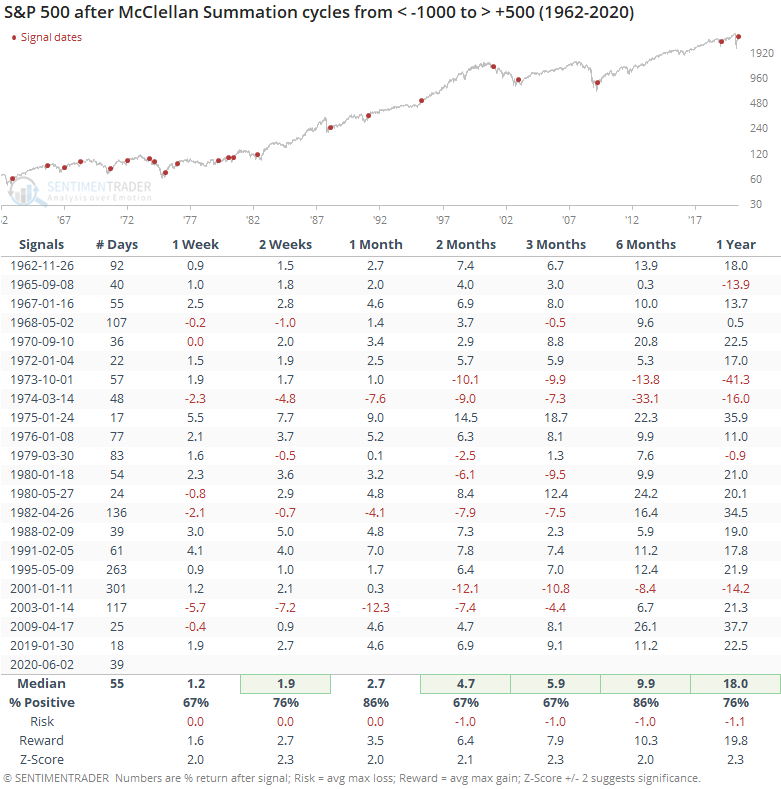
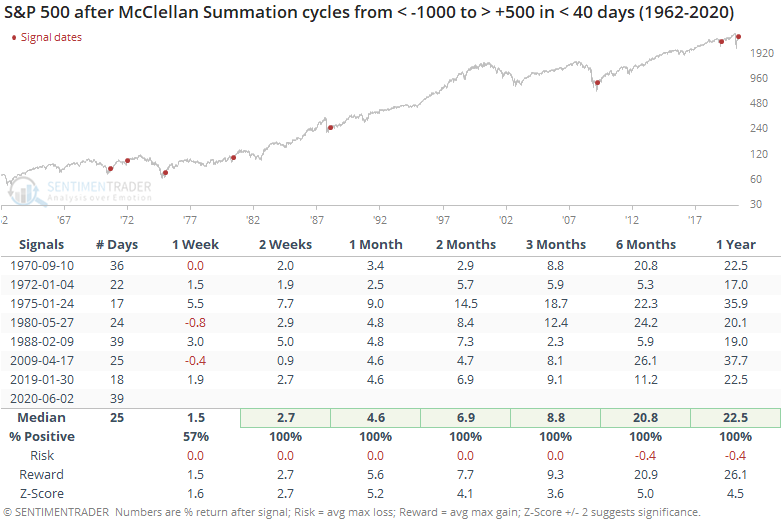
One of the keys here, though, is how quick the recovery has been. The Summation Index completed its cycle in only 39 trading days, among the fastest since 1962. If we filter the table to only include those cycles that completed within two months, then forward returns were even more impressive. We should always beware of anything that claims perfection, but these results were...perfect.
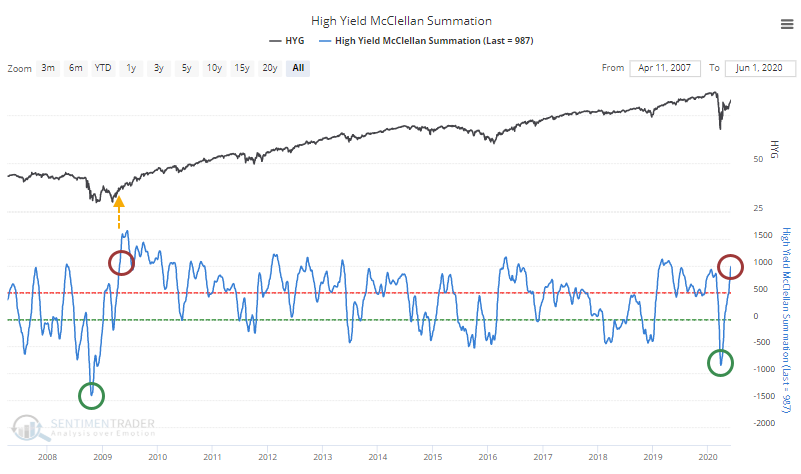
What makes this recovery more impressive is how broad it is. Not just within the S&P 500 or even the NYSE, but across markets and across regions. The Summation Index for high-yield bonds has fully cycled as well, with 2009 being the only precedent.
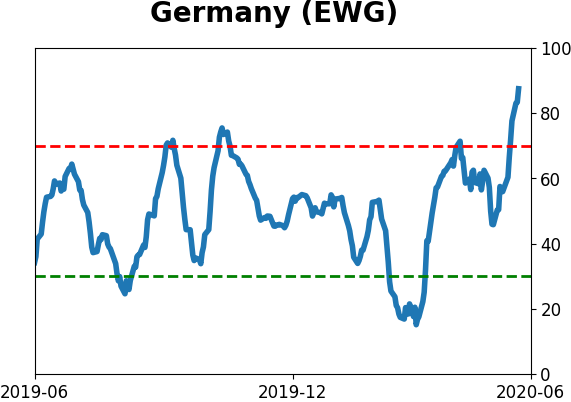
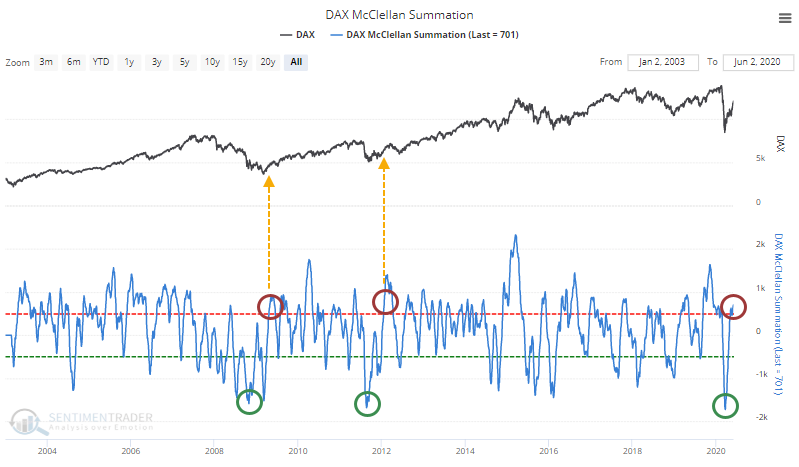
We've seen signs that investors have soured on overseas markets, pulling massive amounts from funds, with even large money managers avoiding them.
Yet markets like the German DAX are seeing a long-term breadth recovery. The only other times the Summation Index for the DAX cycled like this were April 2009 and January 2012, both leading to large, sustained gains.
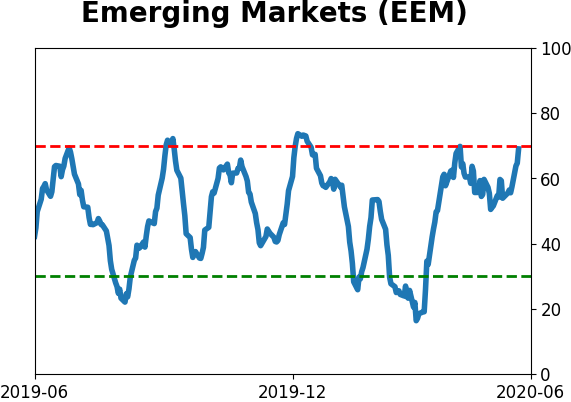
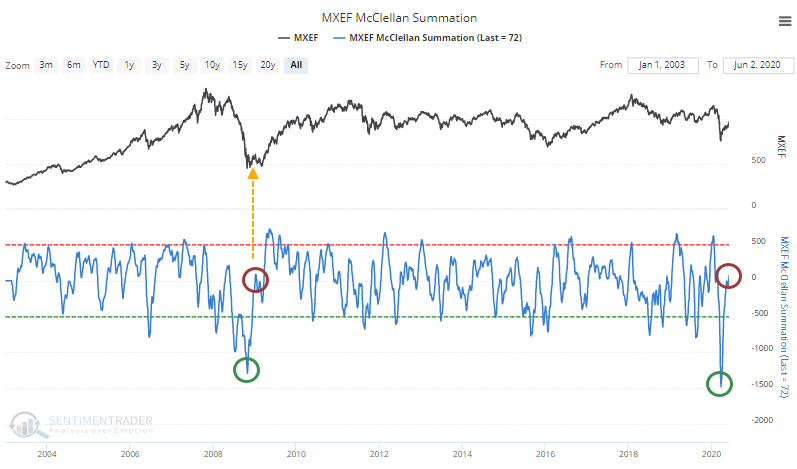
The Summation Index for emerging markets is even recovering, rising above zero after recording a record low reading.
Most other markets are showing similar gains, with similar repercussions.
Like the other signs of breadth recovery and historic thrusts that we've looked at, it's hard to ignore this. Investors always face the same struggle - okay, this looks great, but now I have to buy into a rising market. Outside of pure momentum traders, this is a difficult ask. Ideally, we'd see some kind of medium-term digestion to work off signs of shorter-term speculation and overbought conditions, but markets aren't obliged to accommodate our ideals.
BOTTOM LINE
The May survey from Bank of America of large money managers shows that they've become increasingly apathetic about stocks in the eurozone relative to other areas. They are almost at a record underweight relative to their position on U.S. stocks and even bonds.
FORECAST / TIMEFRAME
None
|
The exodus from non-U.S. mutual funds and ETFs has become the most severe in a decade, and some surveys are showing depression-like pessimism overseas.
Money managers are not immune. The latest survey of large money managers from Bank of America Merrill Lynch shows another month of them preferring shares in the U.S. versus anywhere else, especially the eurozone.
Through mid-May, the survey showed that managers were 24% overweight the U.S. versus 17% underweight eurozone stocks. That's more than a 40% spread between them, the widest in 8 years.
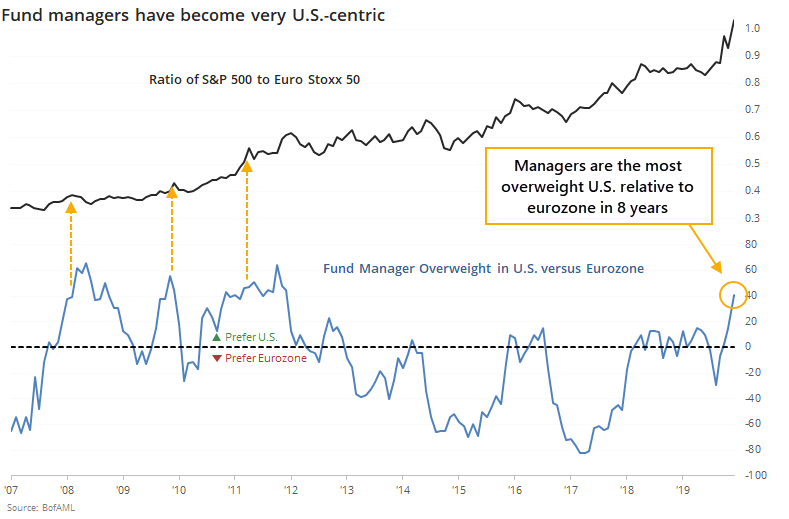
This has a decent contrary record. When the spread was very negative (fund managers preferred euro zone shares to U.S. shares), the ratio of the S&P 500 to Euro Stoxx 50 tended to bottom and head higher for months afterward.
At the opposite extreme, where we are now, it was less pervasive simply because the U.S. has been on a relative hot streak for over a decade. But when it reached this wide of a spread, the ratio between them did flatten out or decline in the months ahead.
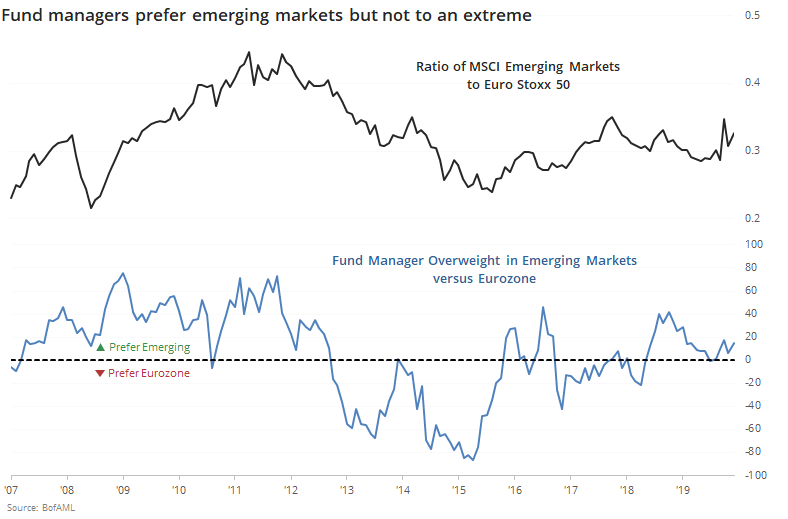
When it comes to emerging markets, fund managers also prefer those countries' shares to the eurozone but it's not quite to an extreme.
Perhaps most damning of all, fund managers even prefer U.S. bonds over eurozone stocks. It's very rare to see a bond market take preference over a stock market among a survey of primarily stock fund managers.
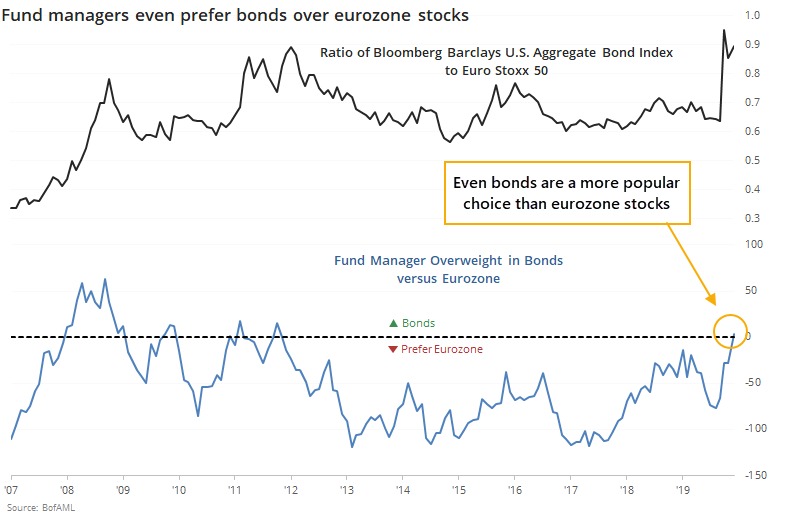
This wasn't necessarily a great contrary indicator since bonds have steadily risen over the past decade, but still. It's a pretty stark display of just how much apathy has built up overseas.
Active Studies
| Time Frame | Bullish | Bearish | | Short-Term | 0 | 1 | | Medium-Term | 8 | 4 | | Long-Term | 37 | 1 |
|
Indicators at Extremes
Portfolio
| Position | Weight % | Added / Reduced | Date | | Stocks | 38.9 | Reduced 10% | 2020-05-13 | | Bonds | 0.0 | Reduced 6.7% | 2020-02-28 | | Commodities | 5.1 | Added 2.4%
| 2020-02-28 | | Precious Metals | 0.0 | Reduced 3.6% | 2020-02-28 | | Special Situations | 0.0 | Reduced 31.9% | 2020-03-17 | | Cash | 56.0 | | |
|
Updates (Changes made today are underlined)
In the first months of the year, we saw manic trading activity. From big jumps in specific stocks to historic highs in retail trading activity to record highs in household confidence to almost unbelievable confidence among options traders. All of that came amid a market where the average stock couldn't keep up with their indexes. There were signs of waning momentum in stocks underlying the major averages, which started triggering technical warning signs in late January. The kinds of extremes we saw in December and January typically take months to wear away, but the type of selling in March went a long way toward getting there. When we place the kind of moves we saw into March 23 into the context of coming off an all-time high, there has been a high probability of a multi-month rebound. After stocks bottomed on the 23rd, they enjoyed a historic buying thrust and retraced a larger amount of the decline than "just a bear market rally" tends to. Those thrusts are the most encouraging sign we've seen in years. Even through early June, we're still seeing thrusts that have led to recoveries in longer-term breadth metrics. By early May, we were seeing some troubling signs of shorter-term speculation, and buyers have run right over those. This is what bull markets do. In bear markets, they don't get a chance, as sellers tend to come in as soon as sentiment moves to neutral or slightly optimistic. That didn't happen this time, and the rally has gone way further, and way longer, than "just a bear market rally" does. I am the world's worst momentum trader, and this is one of the most anguishing kinds of markets for me. I detest chasing prices higher, especially in the face of readings like high Dumb Money Confidence and small trader call buying. I recognize the overwhelming positives of the recoveries noted above, and it's impossible to ignore the medium- to long-term positive implications. I'm holding out on adding exposure for now, based on the negatives that have been generated (and so far failed), at the risk of falling further behind a new roaring bull market.
RETURN YTD: -5.7% 2019: 12.6%, 2018: 0.6%, 2017: 3.8%, 2016: 17.1%, 2015: 9.2%, 2014: 14.5%, 2013: 2.2%, 2012: 10.8%, 2011: 16.5%, 2010: 15.3%, 2009: 23.9%, 2008: 16.2%, 2007: 7.8%
|
|
Phase Table
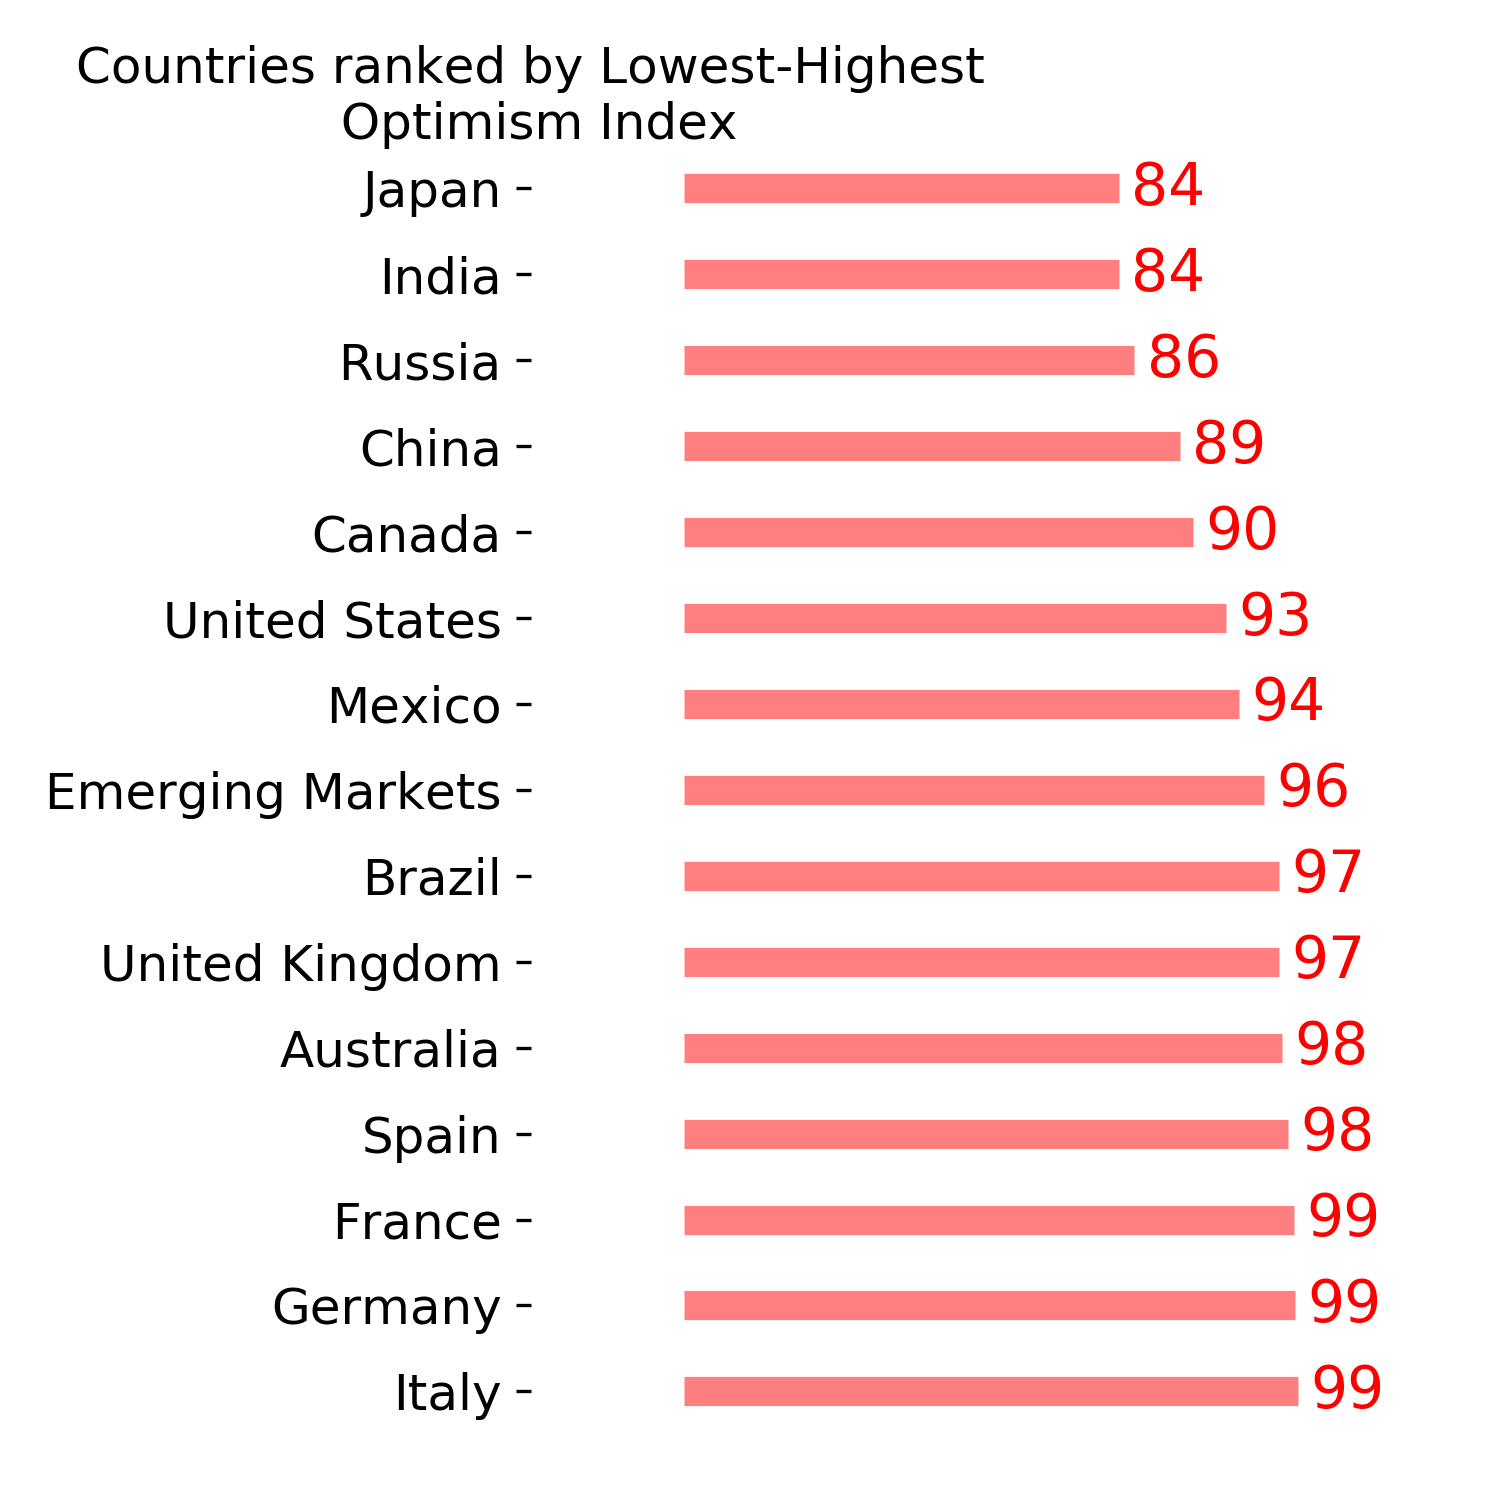
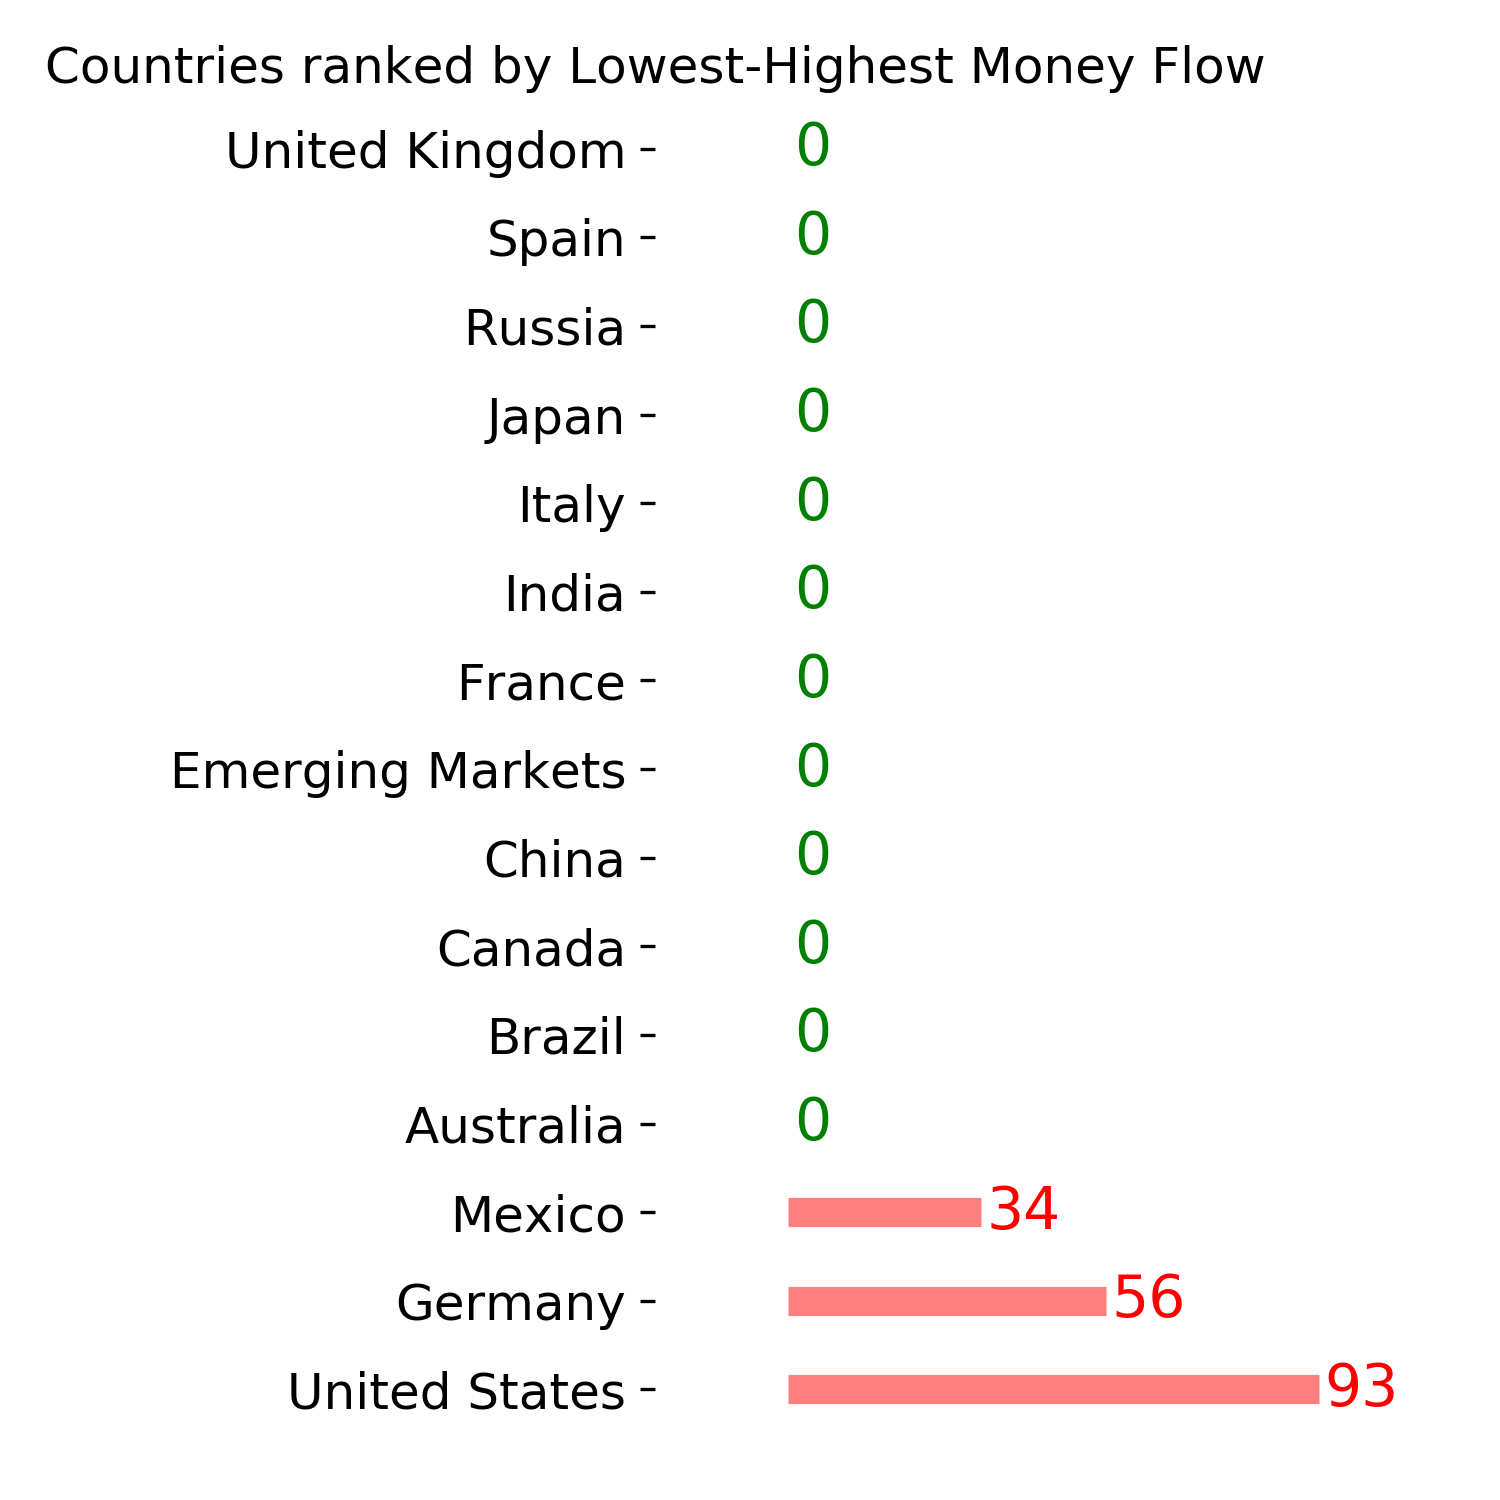
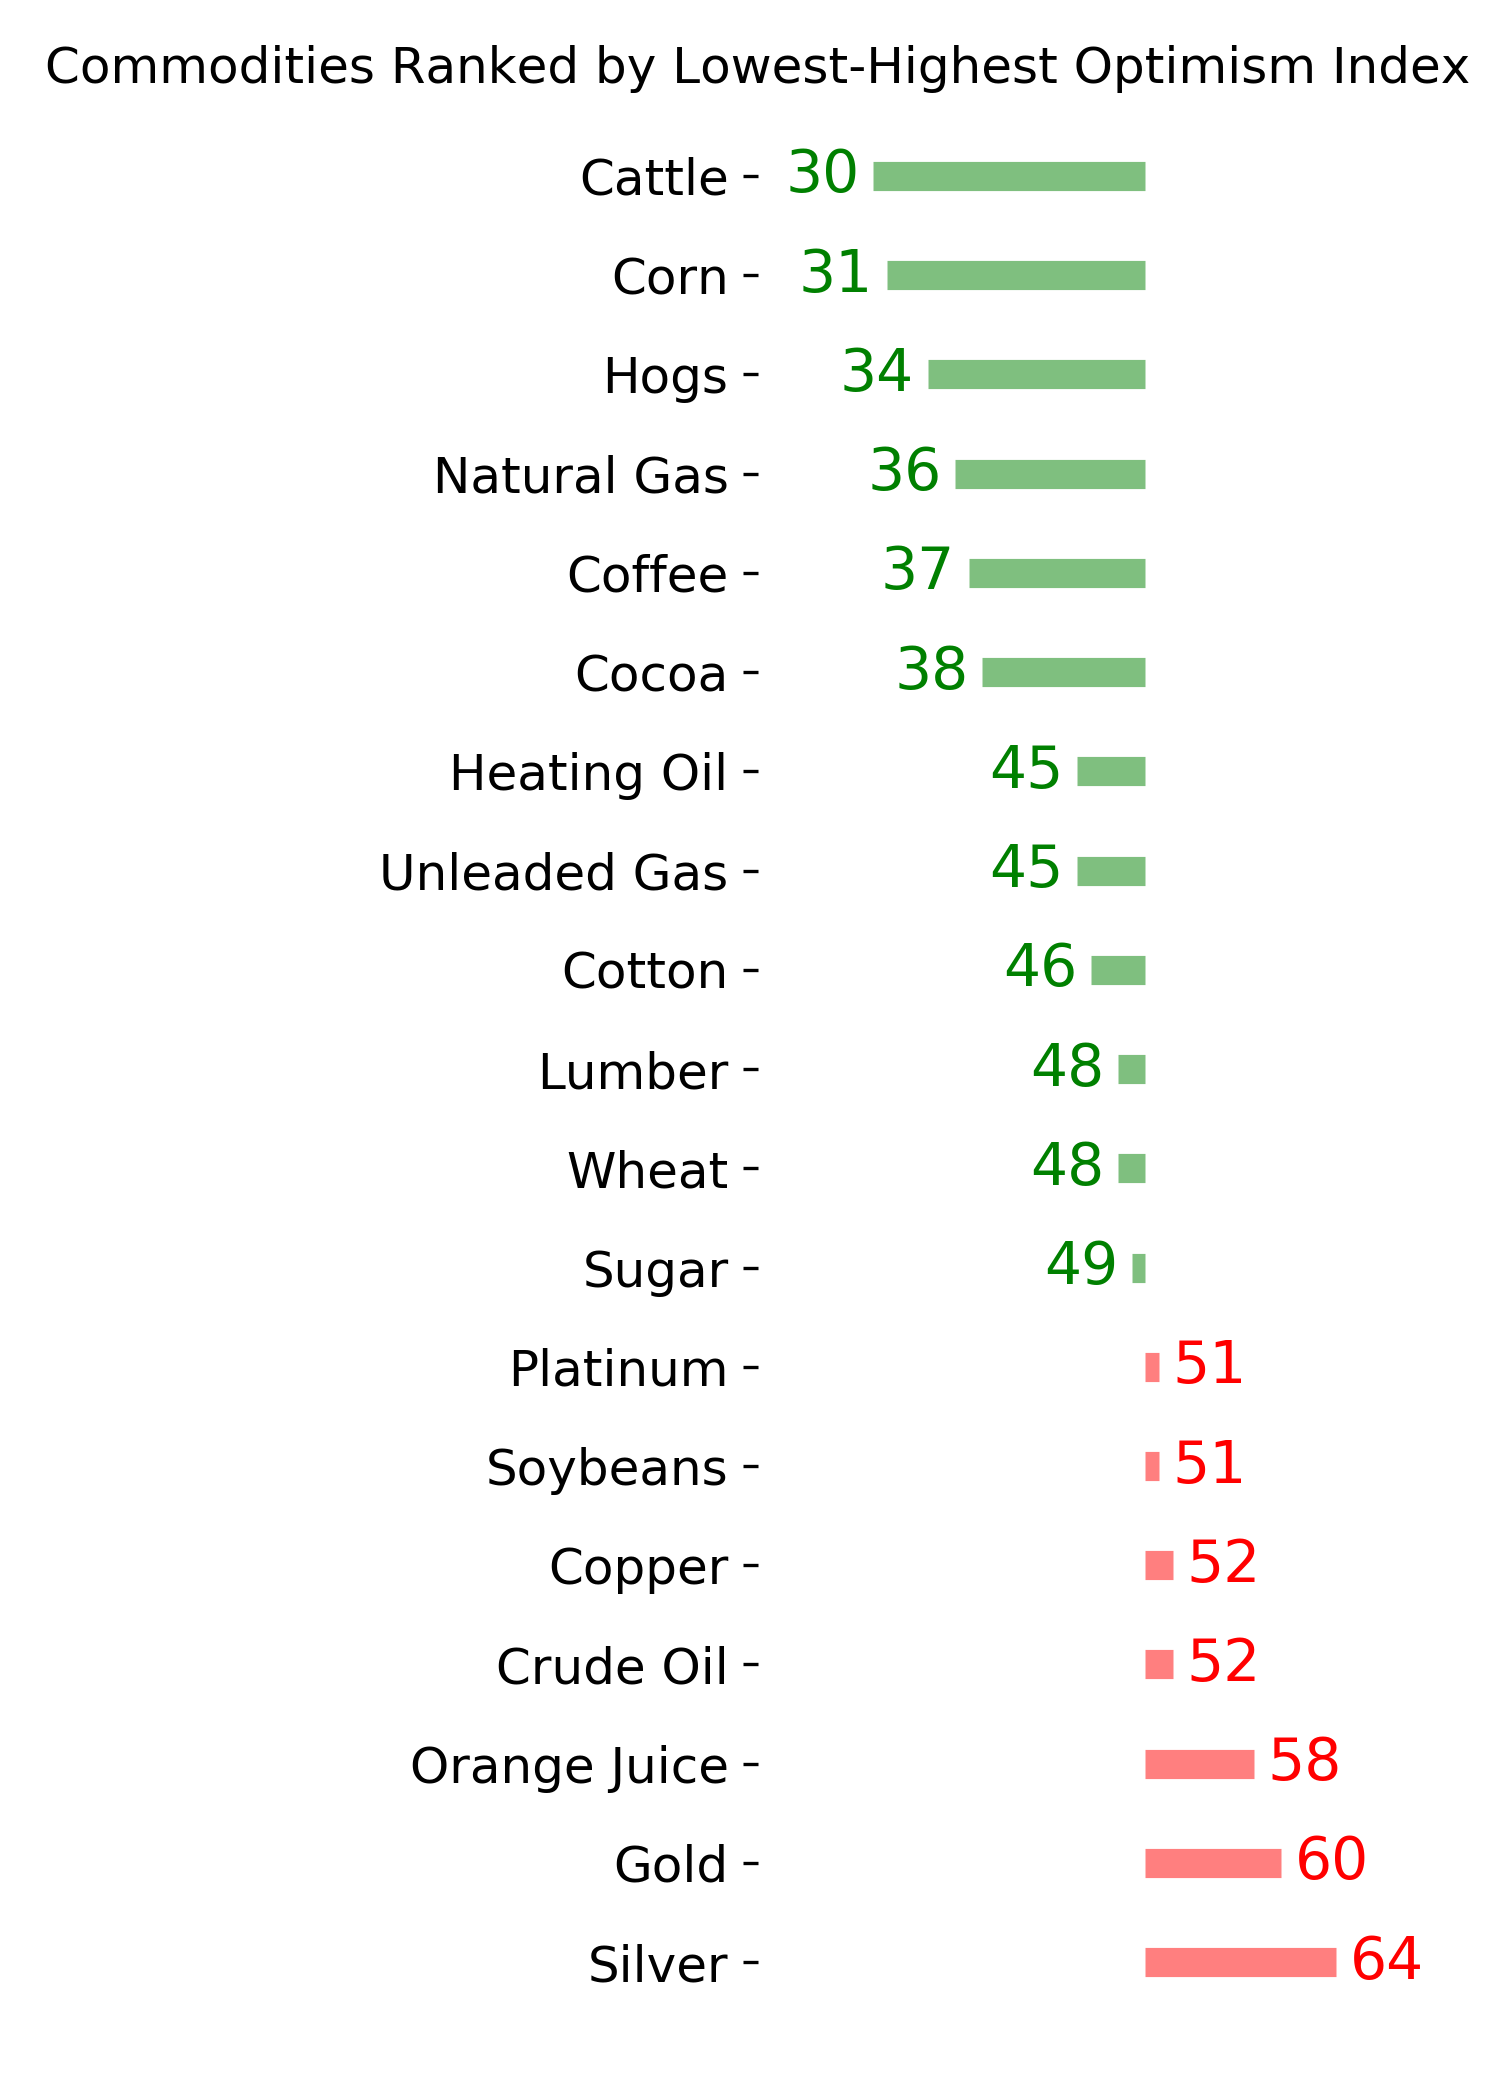
Ranks
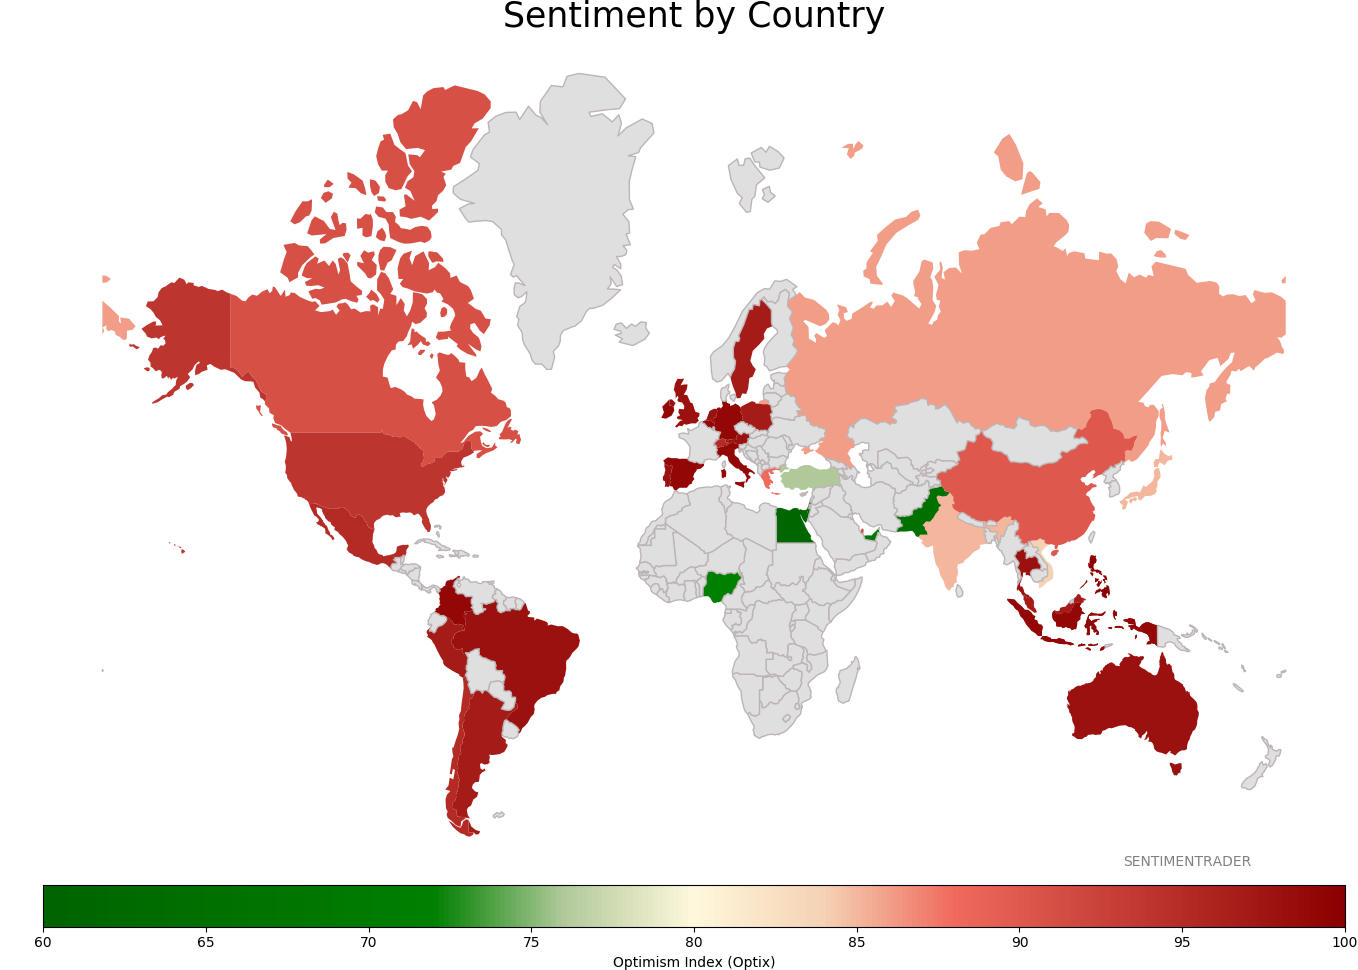
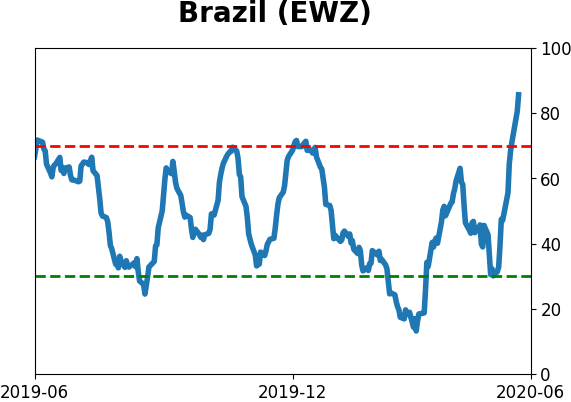
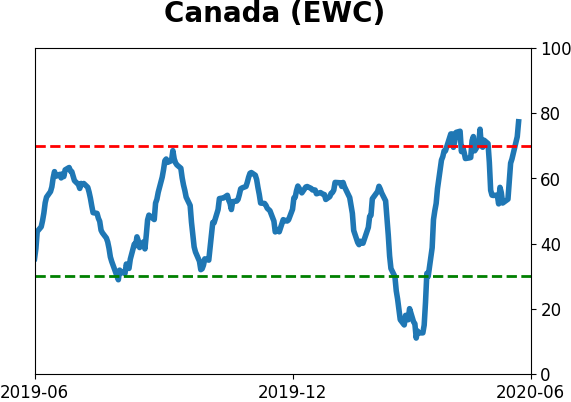
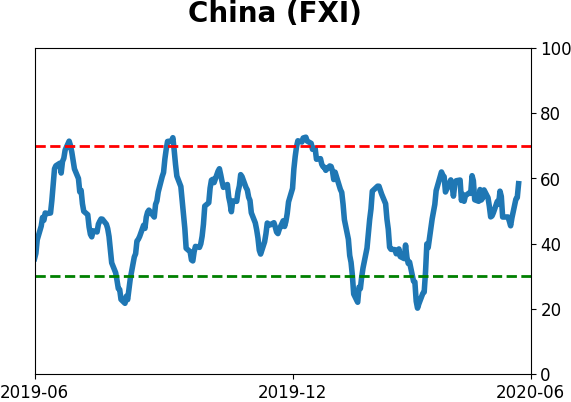
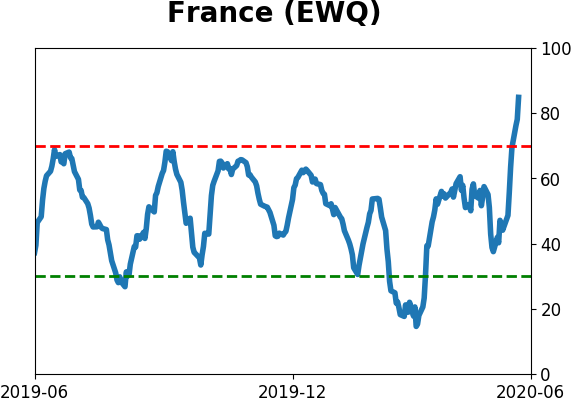
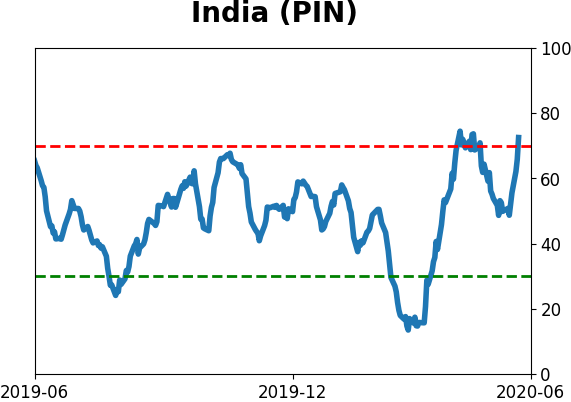
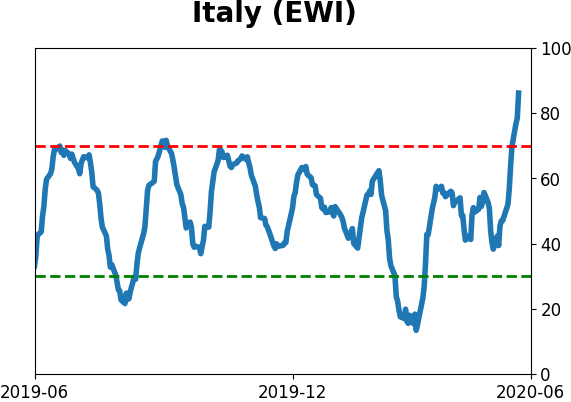
Sentiment Around The World
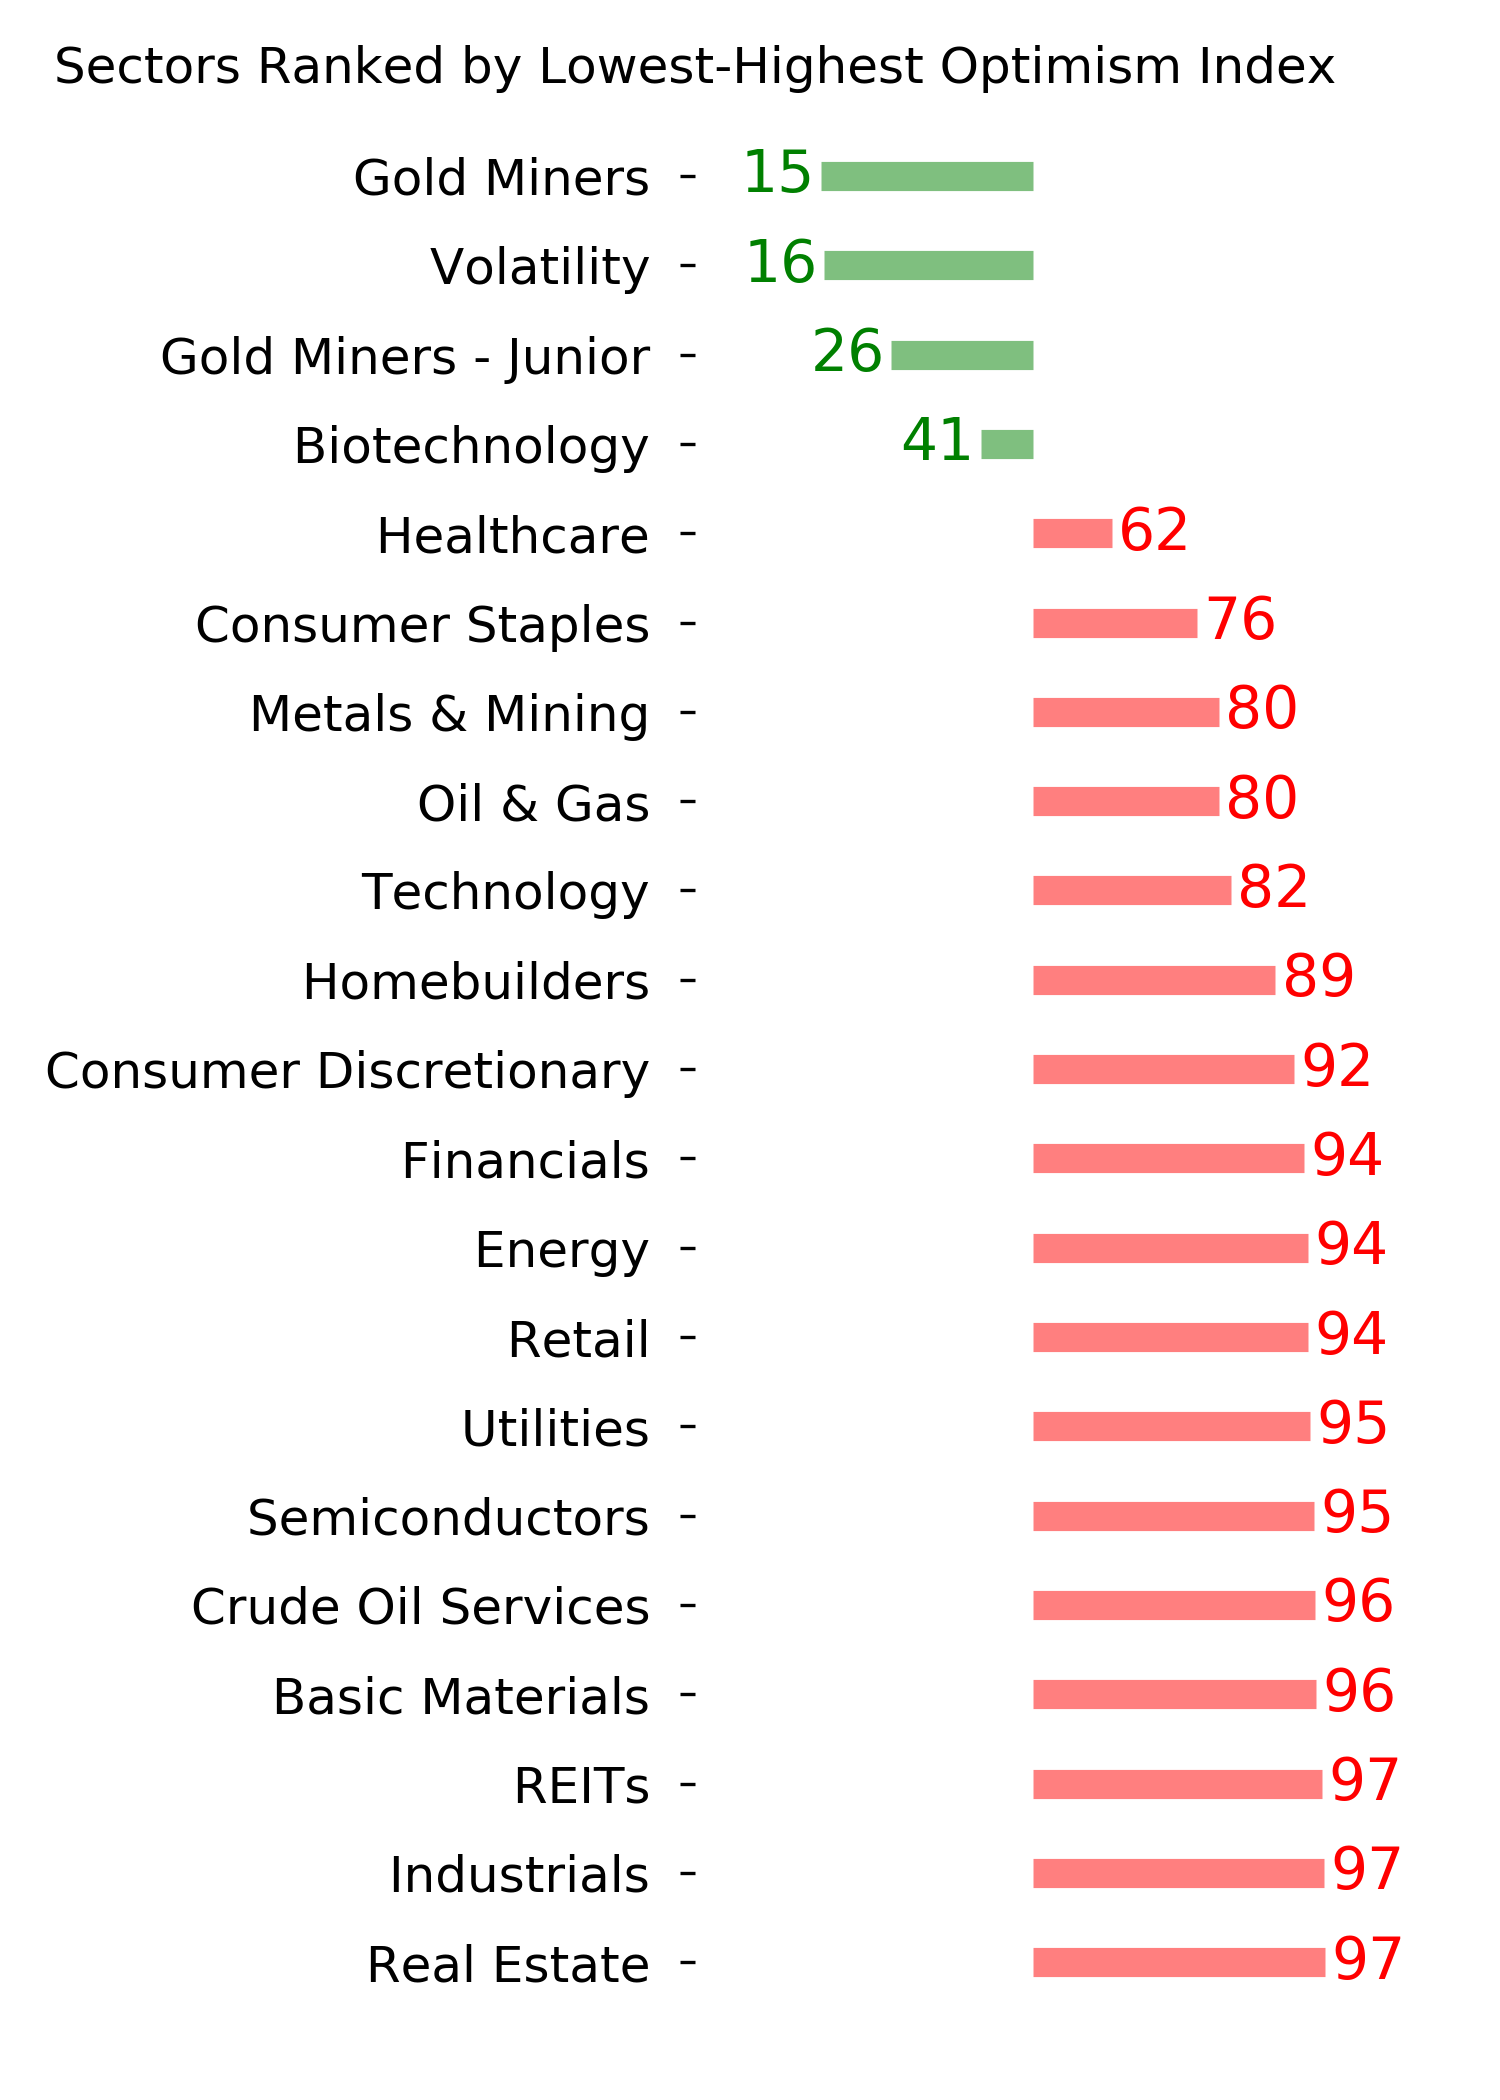
Optimism Index Thumbnails
|
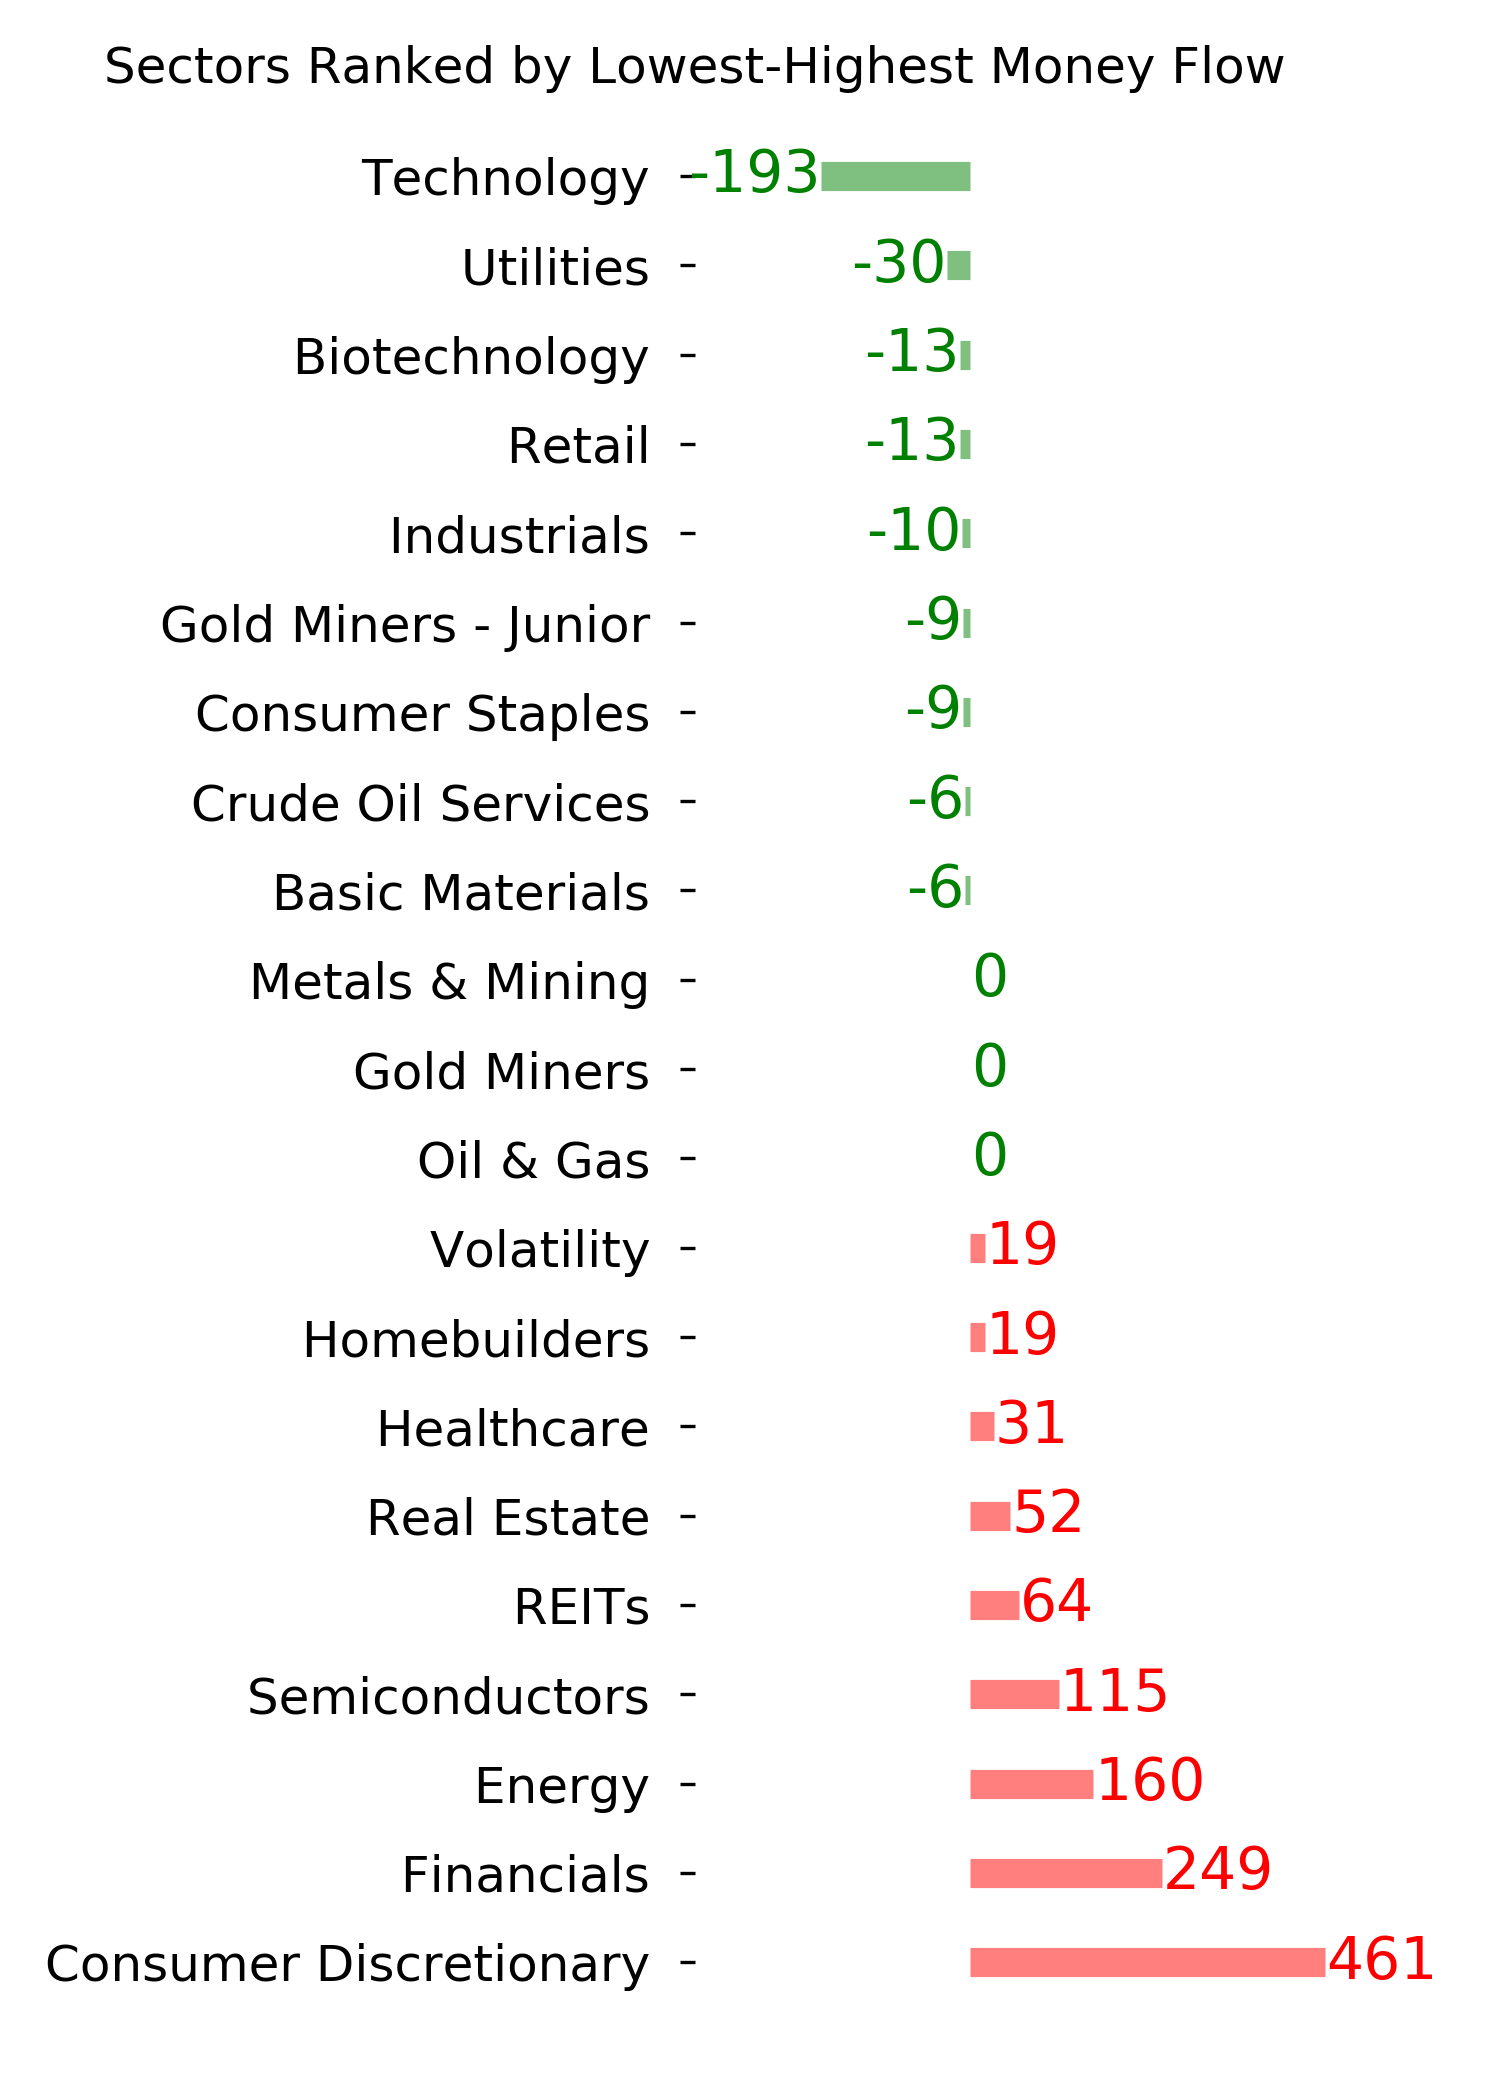
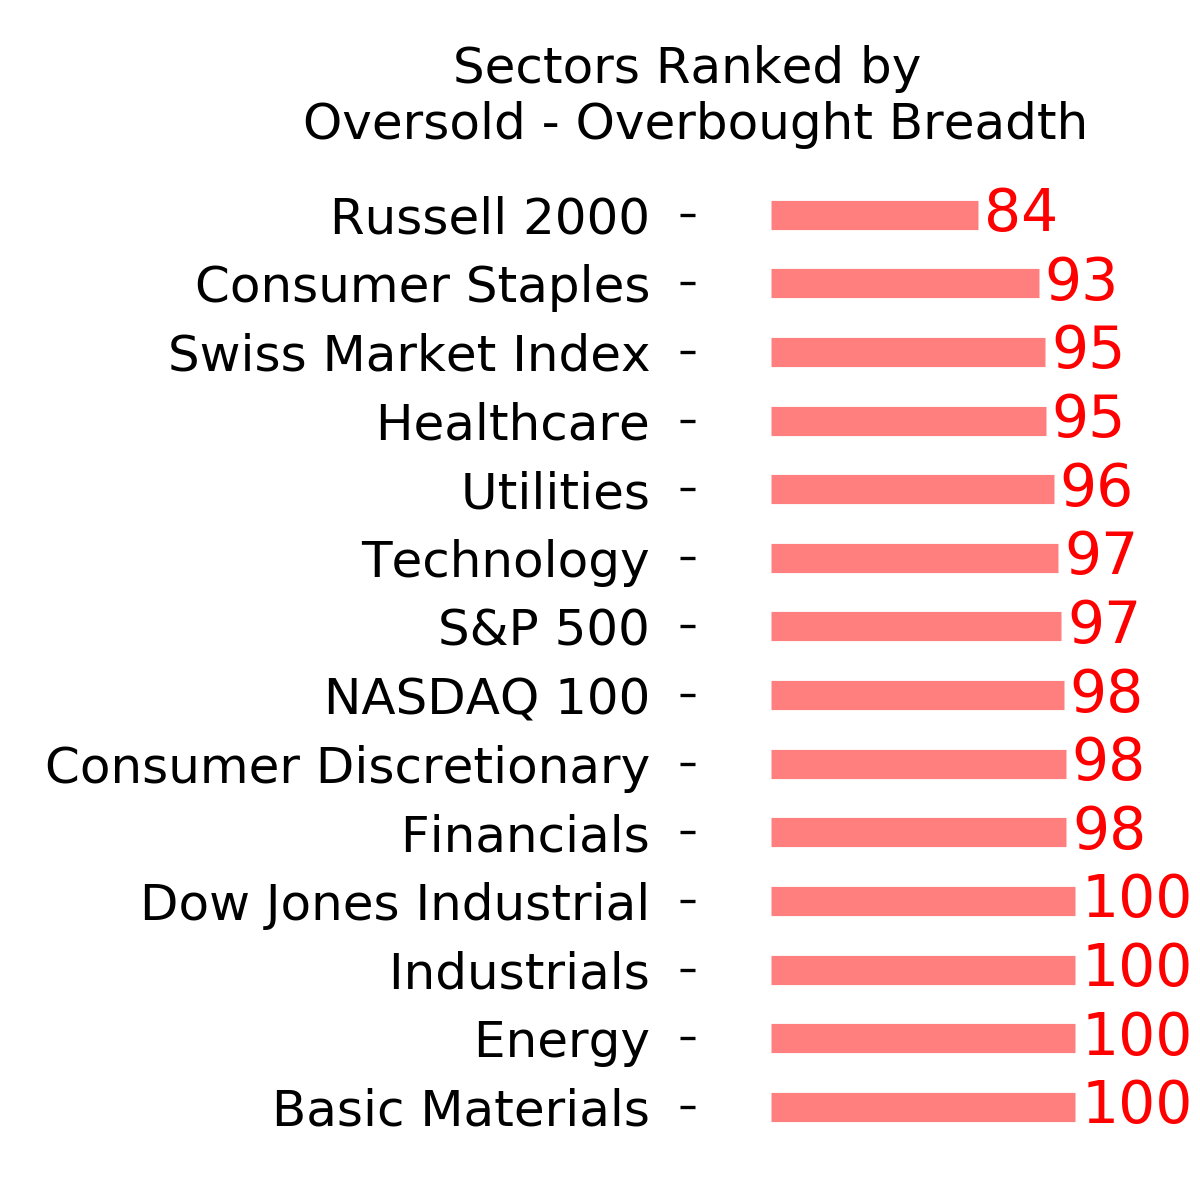
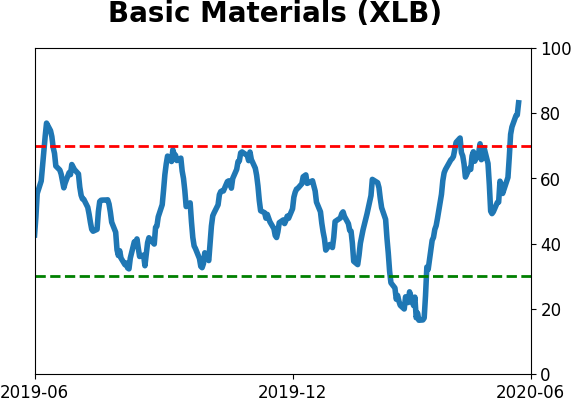
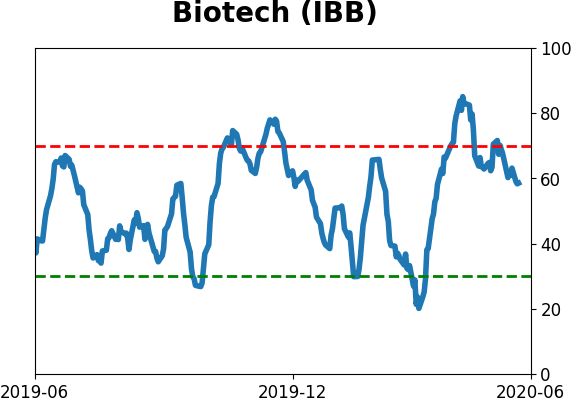
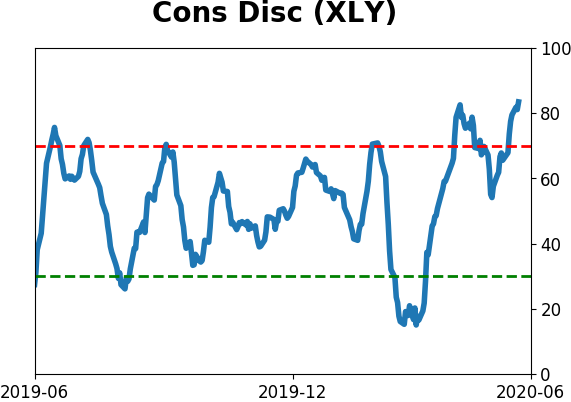
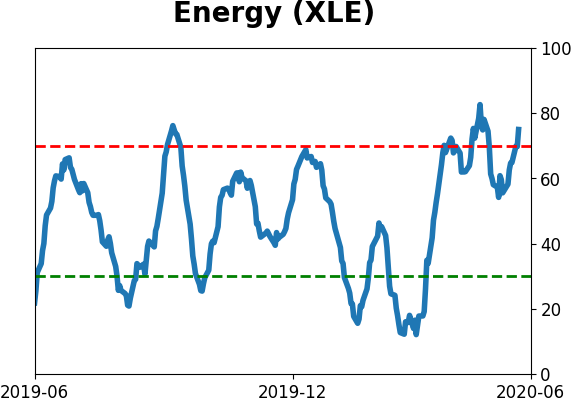
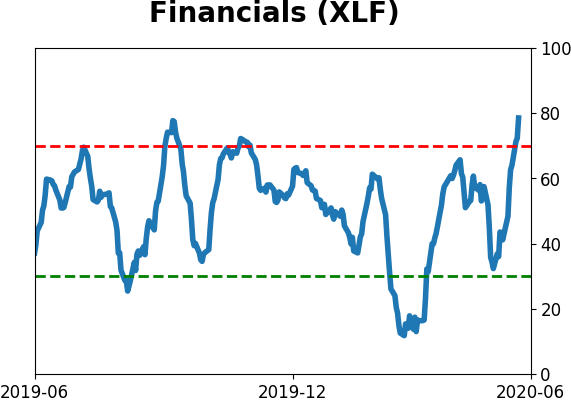
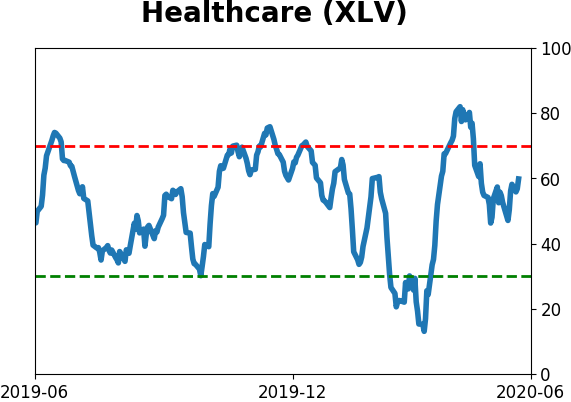
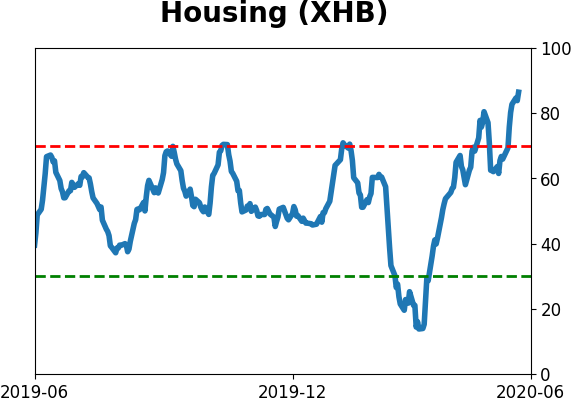
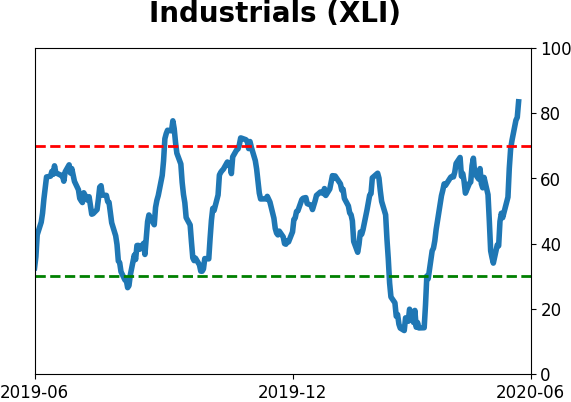
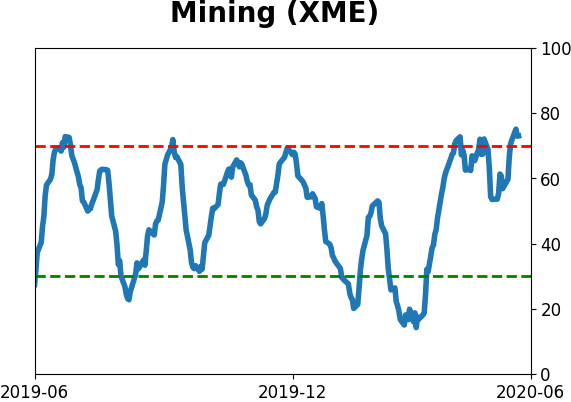
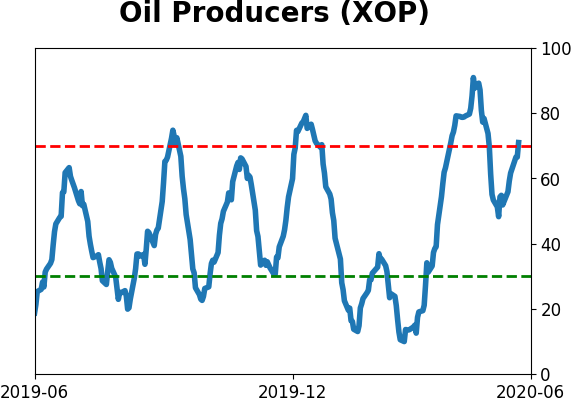
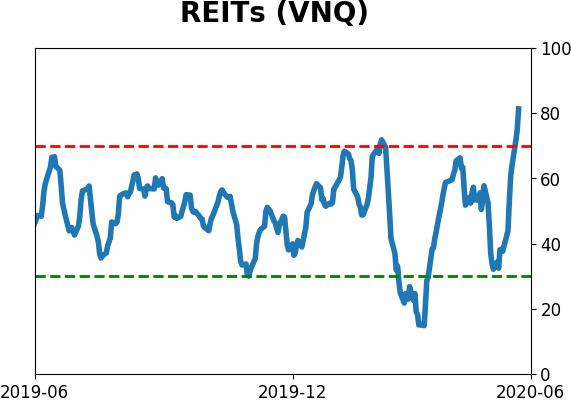
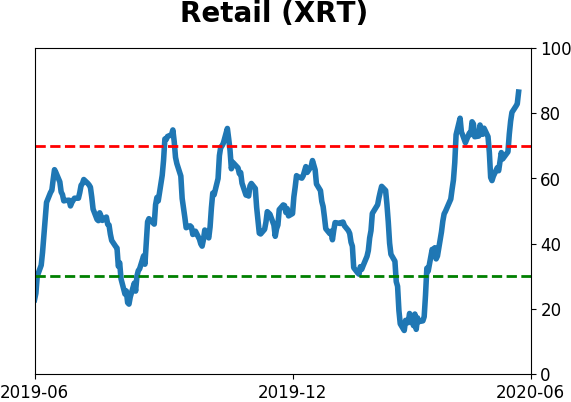
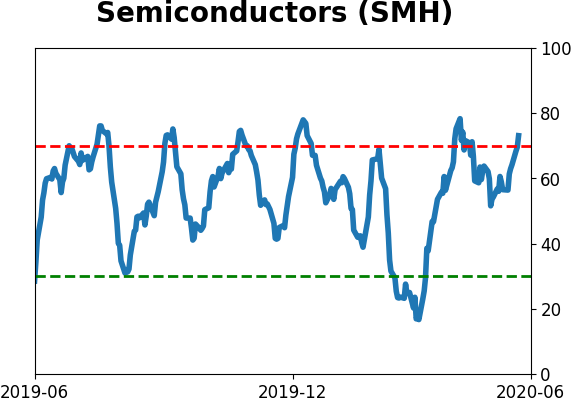
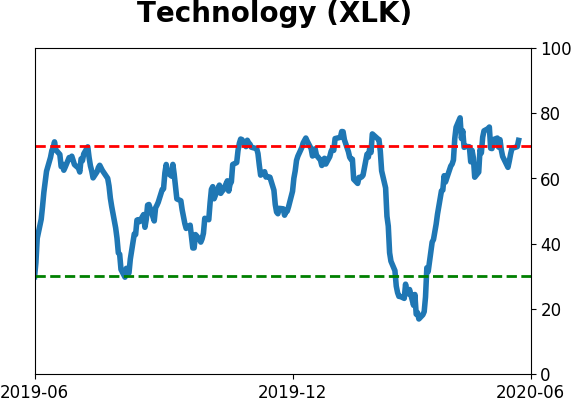
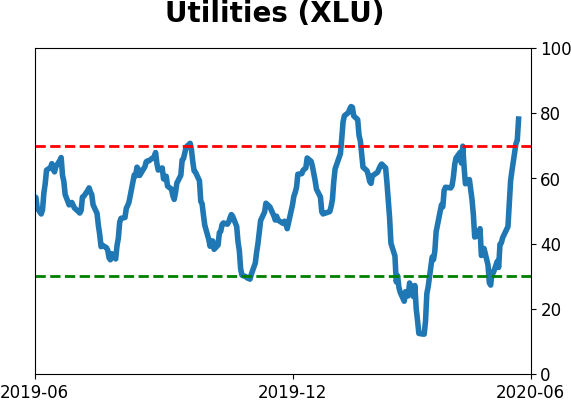
Sector ETF's - 10-Day Moving Average
|
|
|
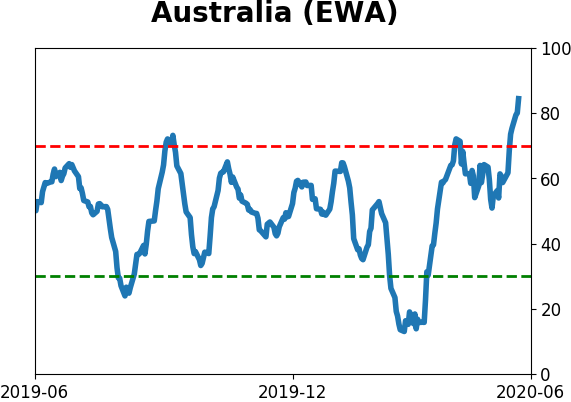
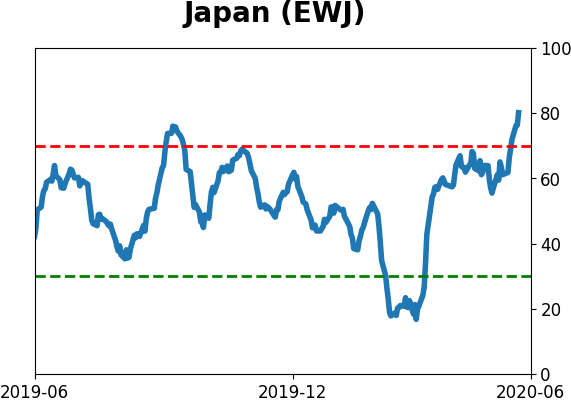
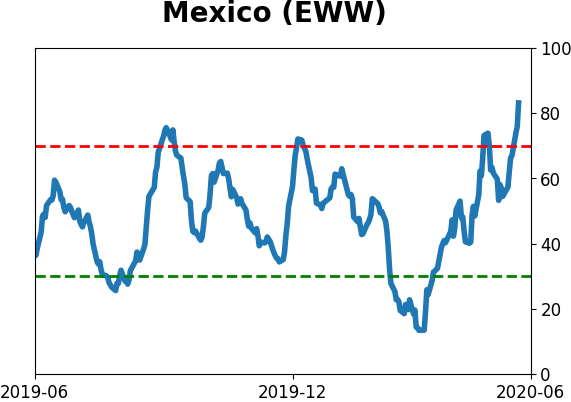
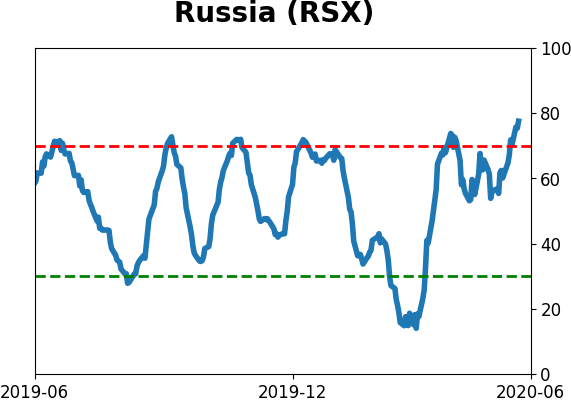
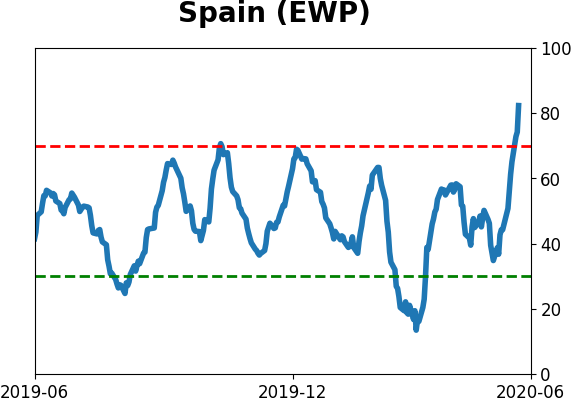
Country ETF's - 10-Day Moving Average
|
|
|
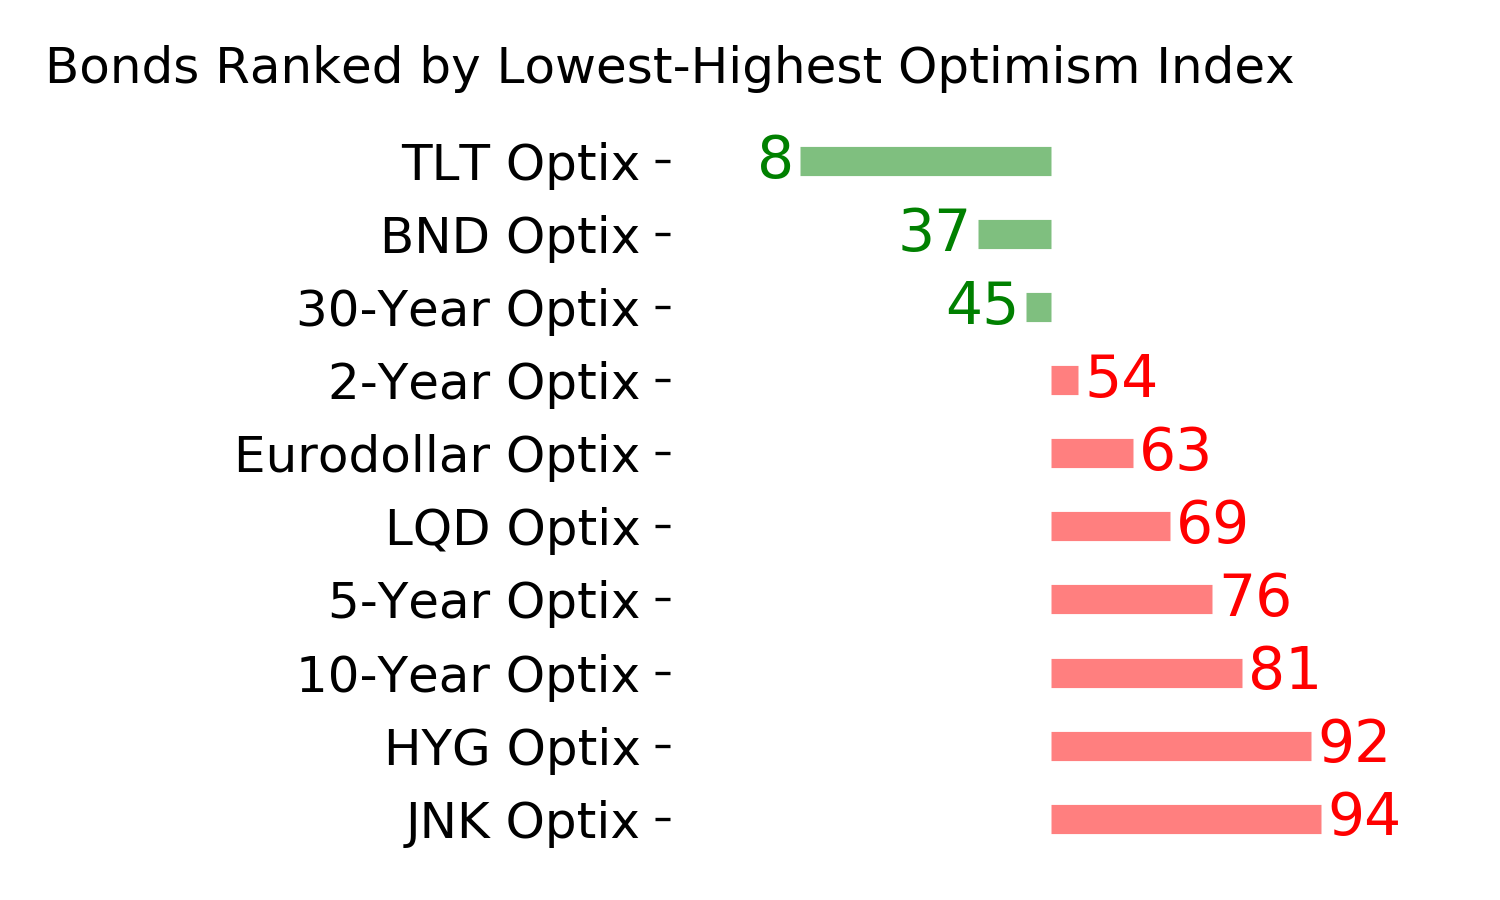
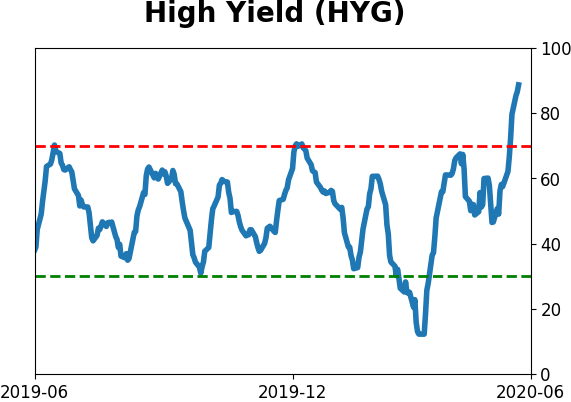
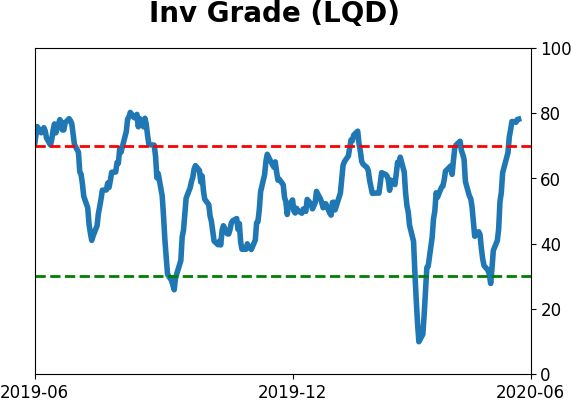
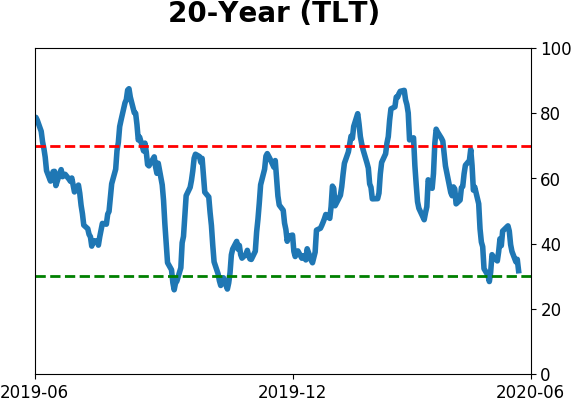
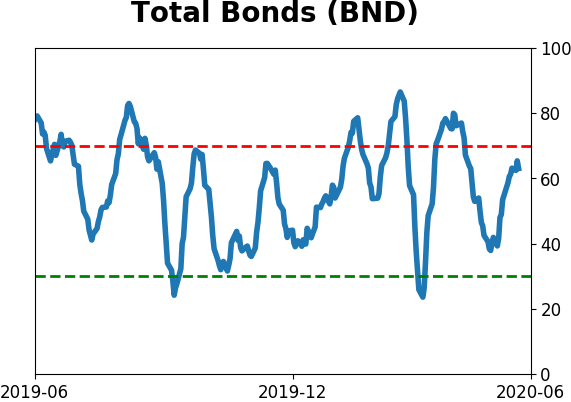
Bond ETF's - 10-Day Moving Average
|
|
|
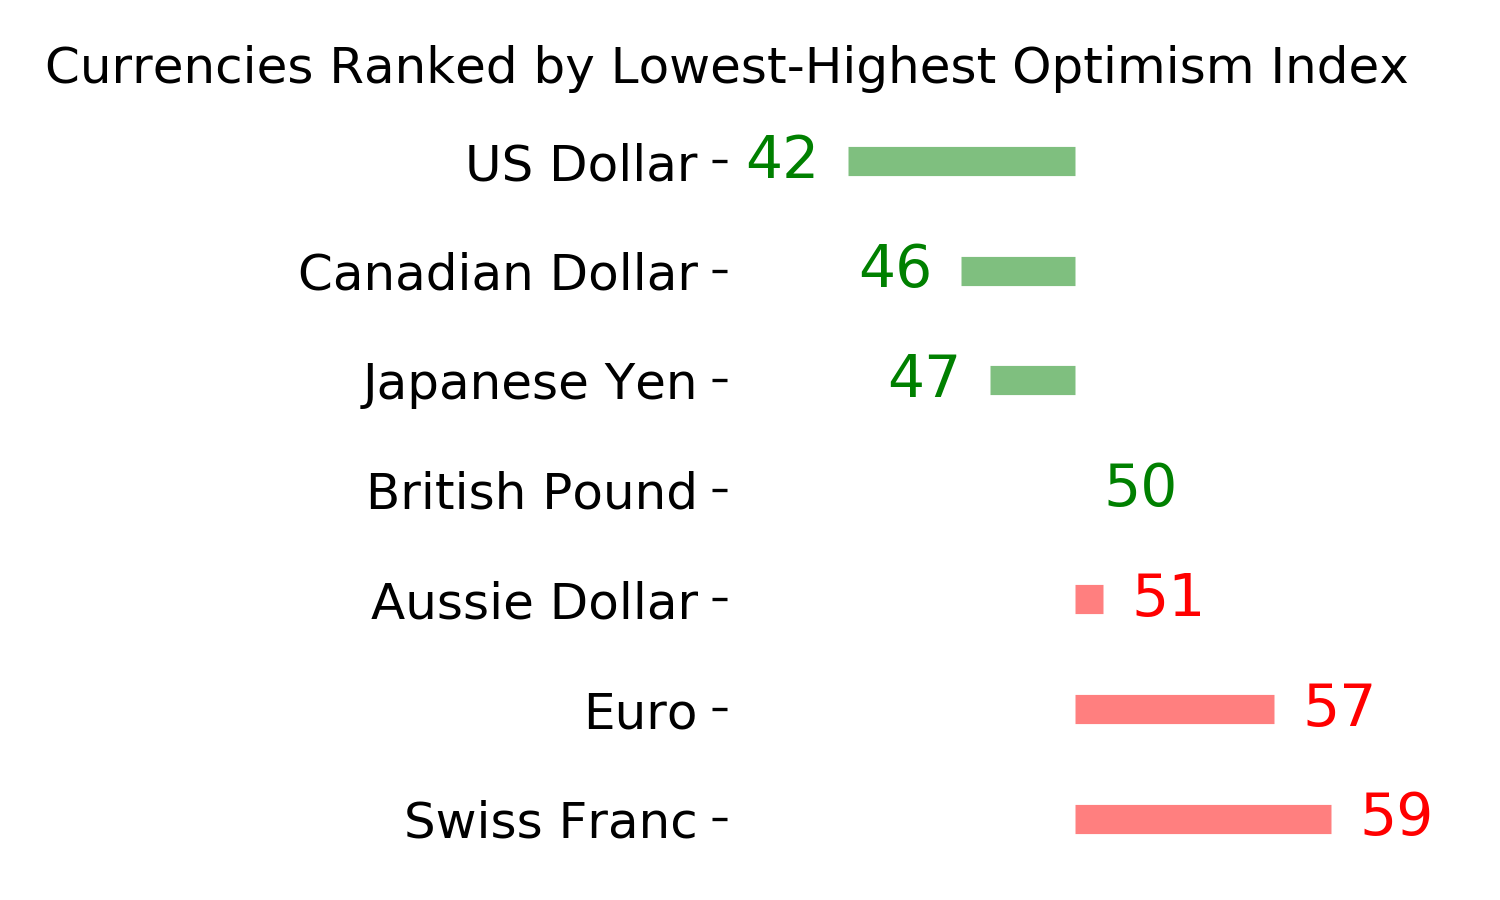
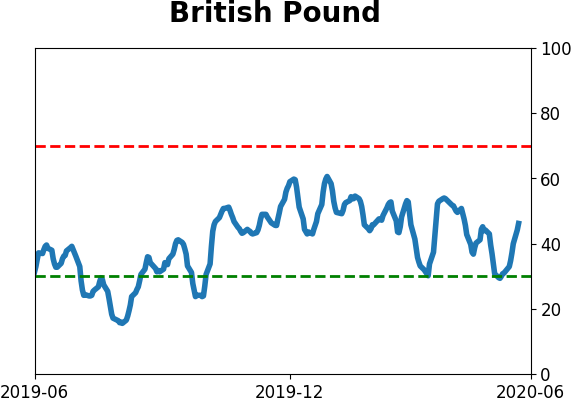
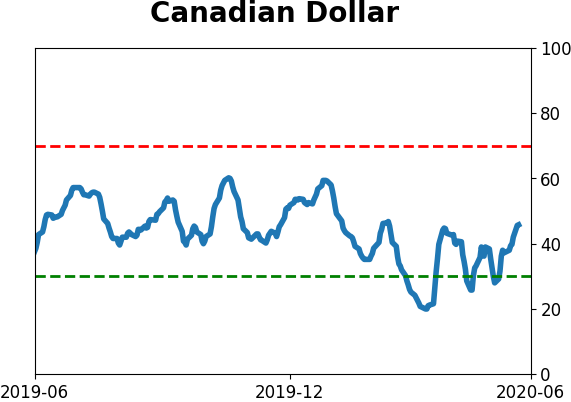
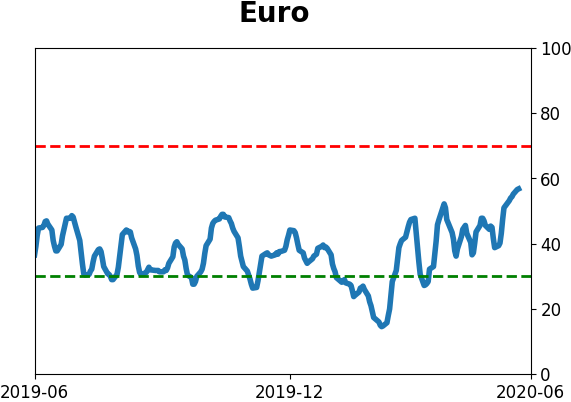
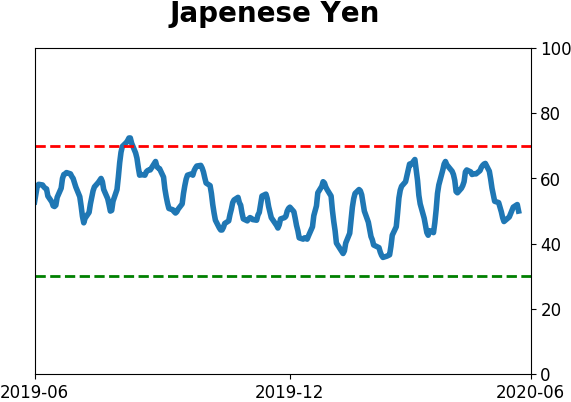
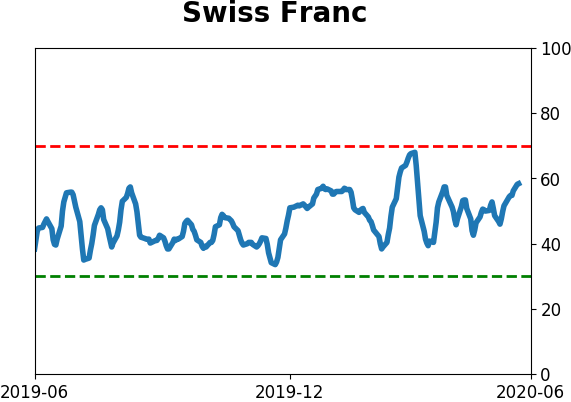
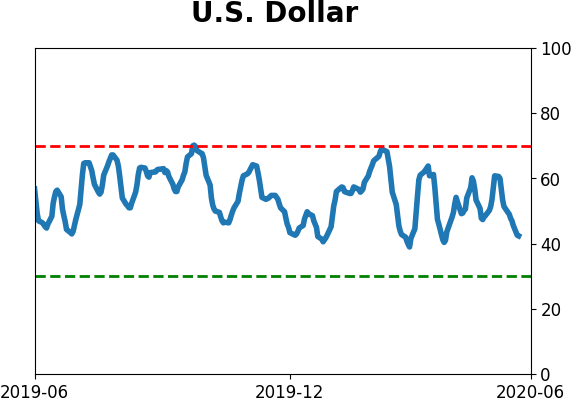
Currency ETF's - 5-Day Moving Average
|
|
|
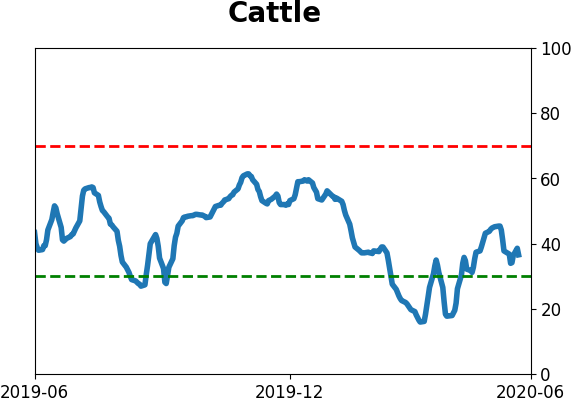
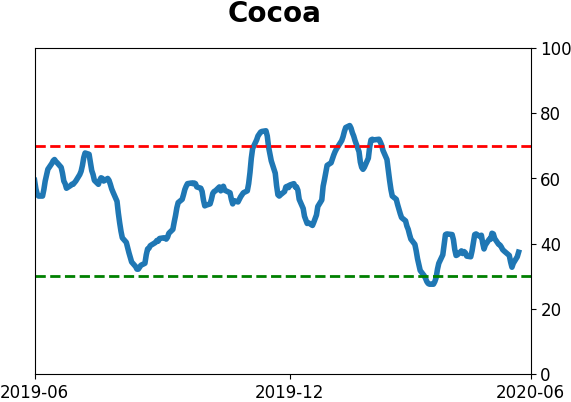
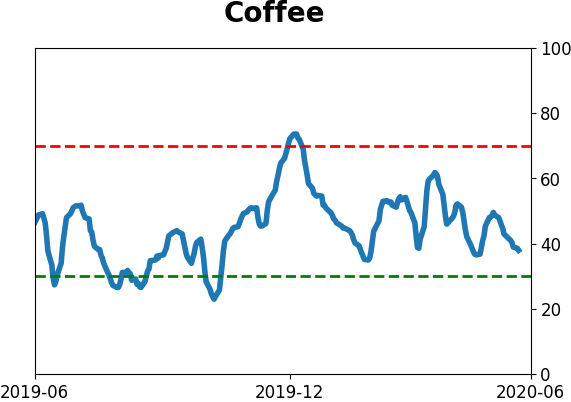
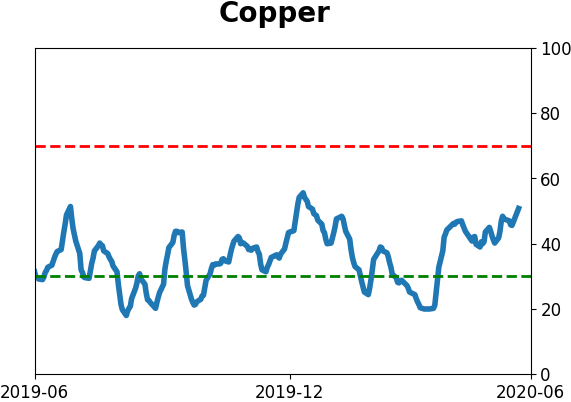
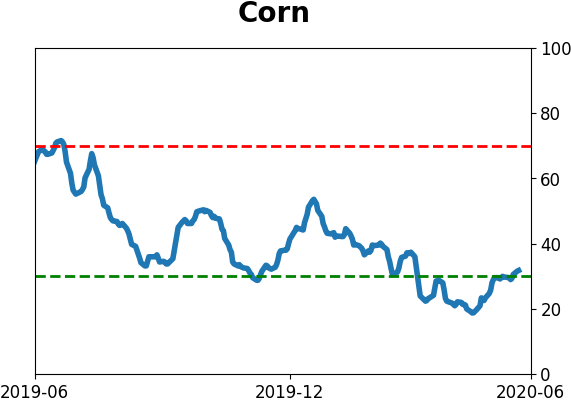
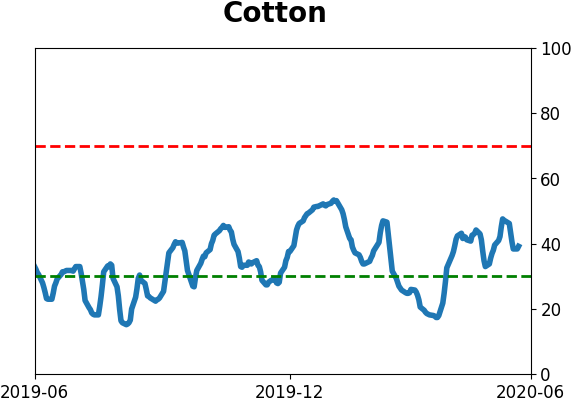
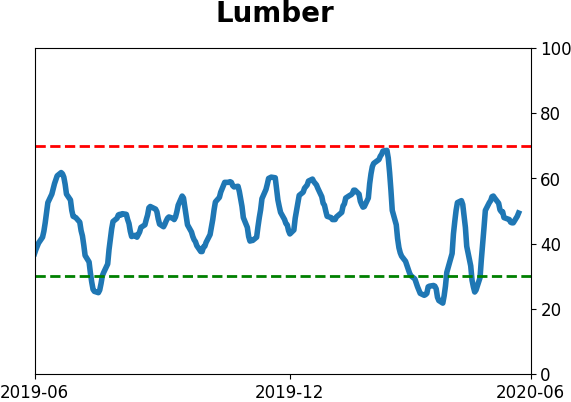
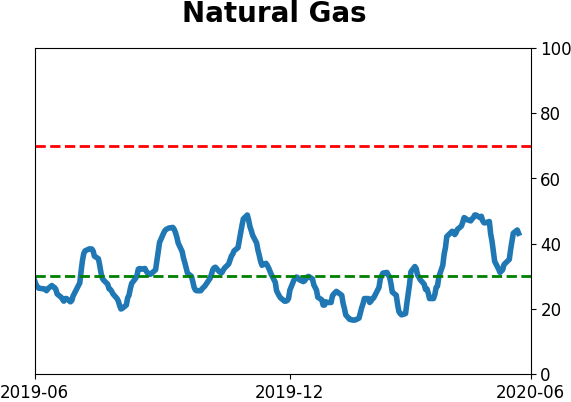
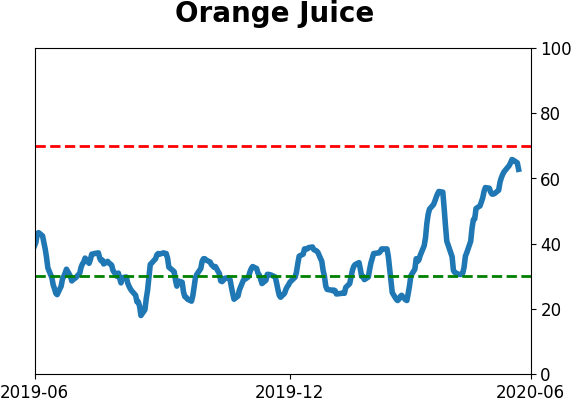
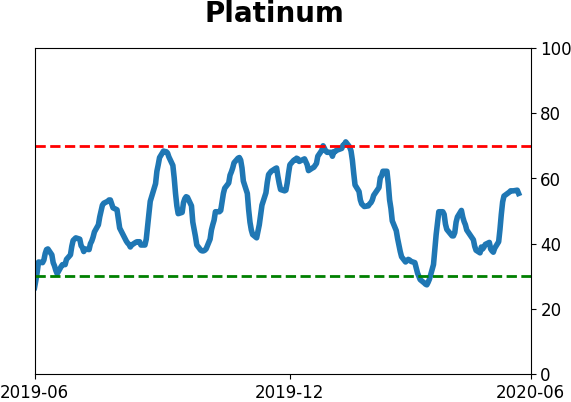
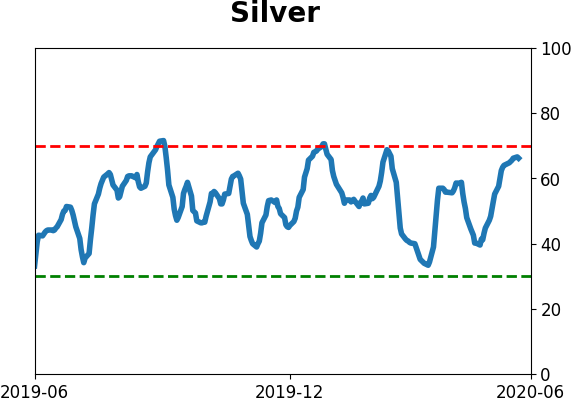
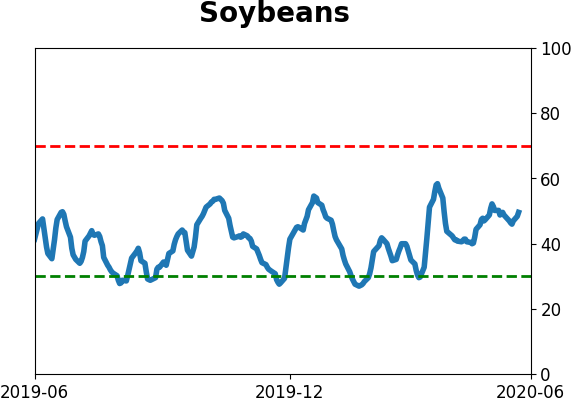
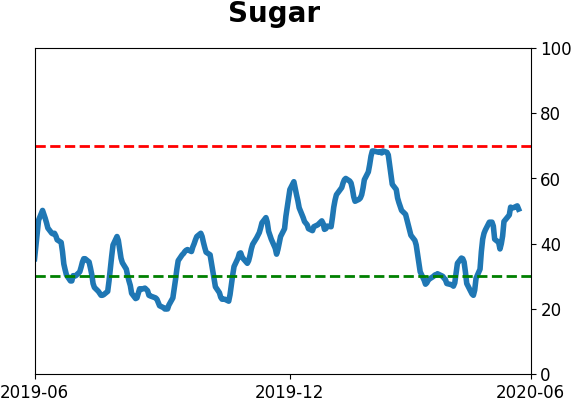
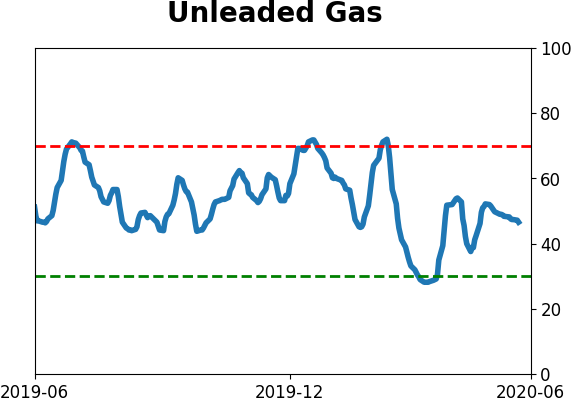
Commodity ETF's - 5-Day Moving Average
|
|