Headlines
|
|
Sentiment Cycle Shows High Confidence for The Past 6 Months:
Based on correlations to a Typical Sentiment Cycle, investors are currently showing Enthusiasm, and have been for more than 6 months. That's one of the longer streaks of confidence in history.
Bottom Line:
See the Outlook & Allocations page for more details on these summaries STOCKS: Hold
The speculative frenzy in February is wrung out. Internal dynamics have mostly held up, with some exceptions. Many of our studies still show a mixed to poor short-term view, with medium- and long-term ones turning more positive. BONDS: Hold
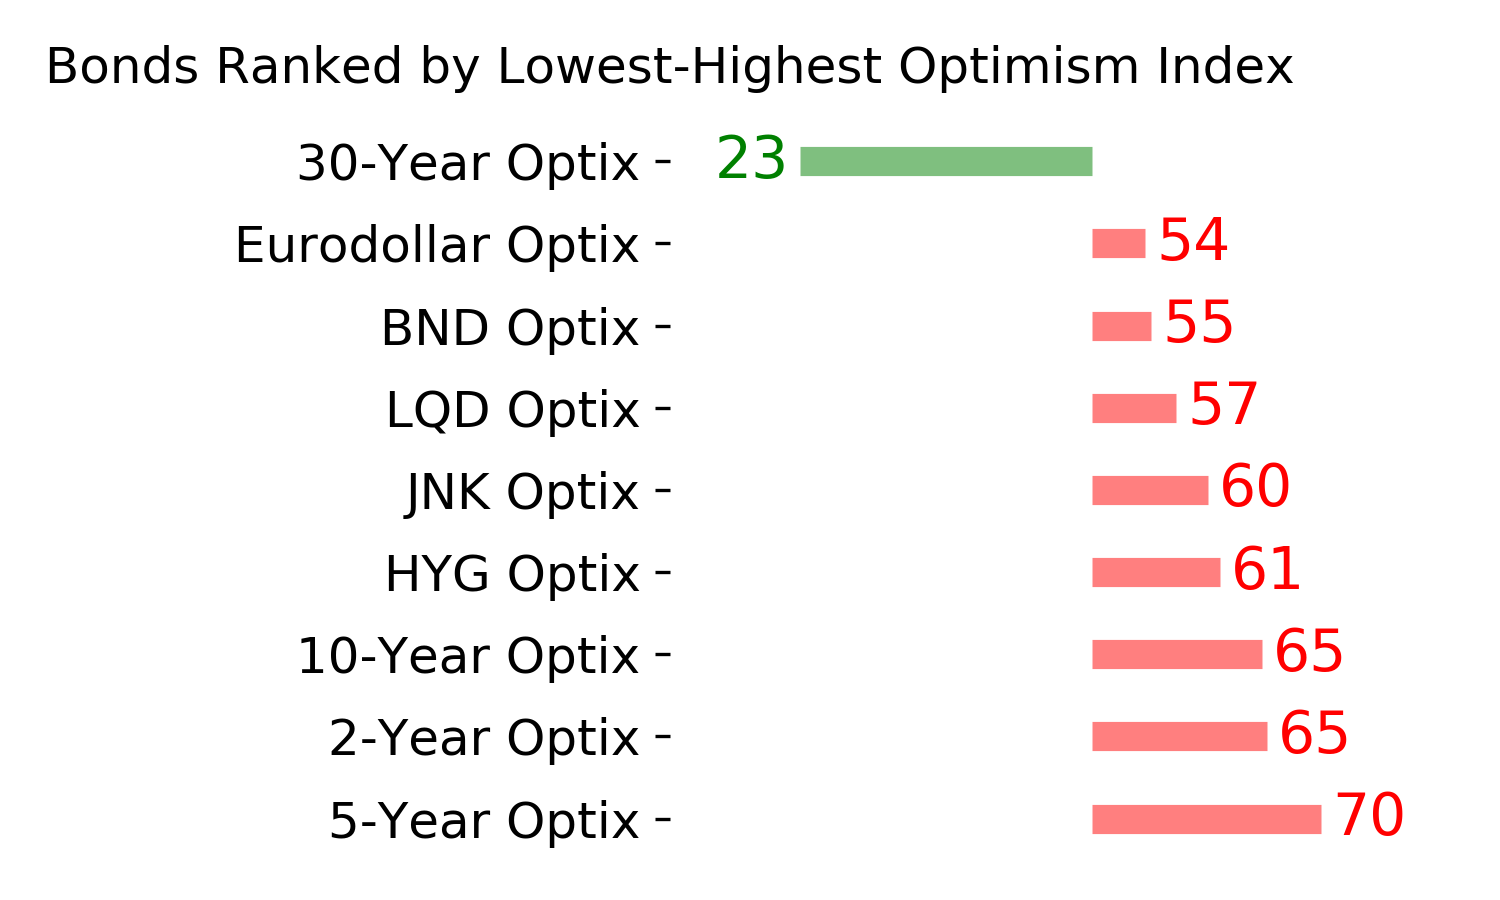
Various parts of the market got hit in March, with the lowest Bond Optimism Index we usually see during healthy environments. After a shaky couple of weeks, the broad bond market has modestly recovered. Not a big edge here either way. GOLD: Hold
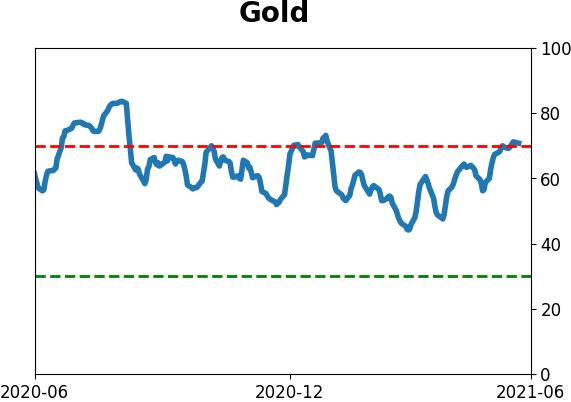
Gold and miners have done very well, recovering above long-term trend lines. The issue is that both have tended to perform poorly after similar situations - will have to wait and see how it plays out.
|
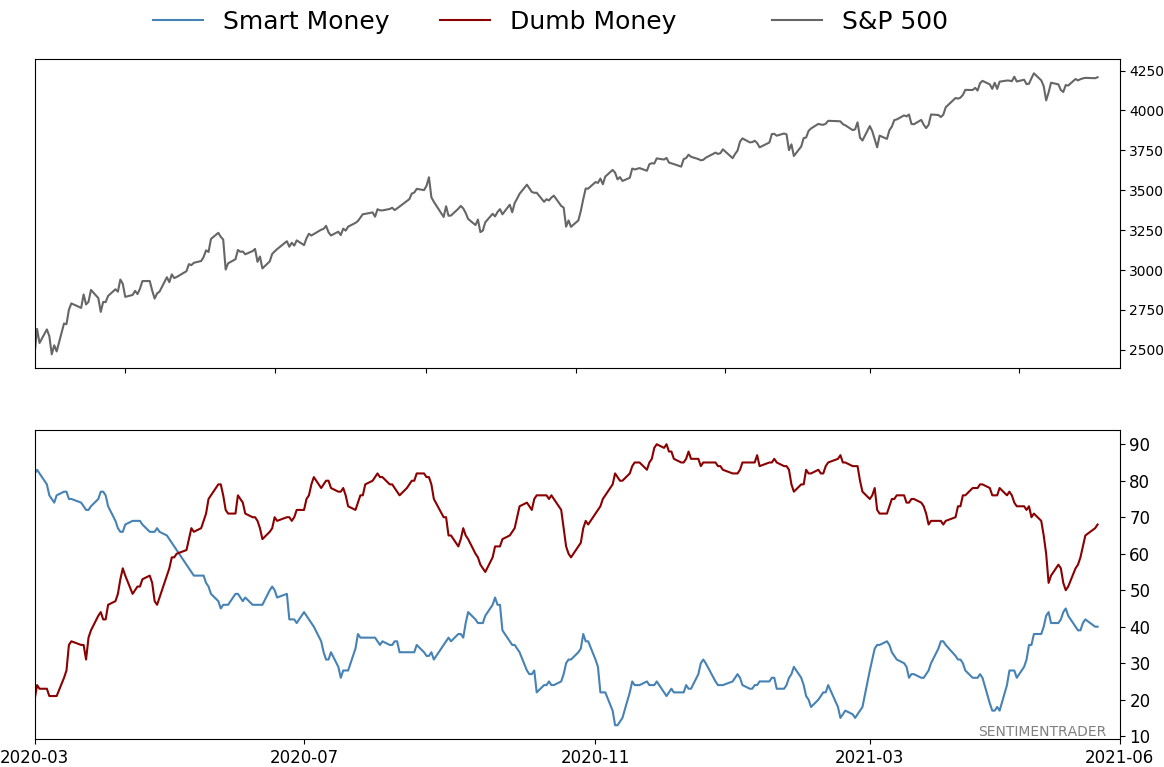
Smart / Dumb Money Confidence
|
Smart Money Confidence: 40%
Dumb Money Confidence: 68%
|
|
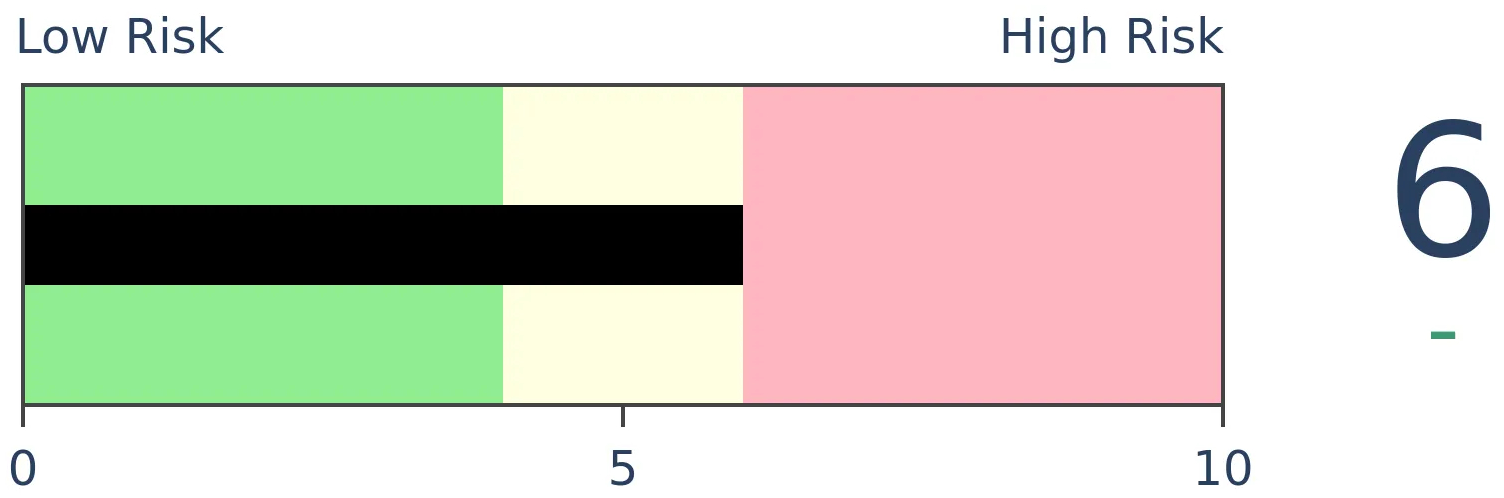
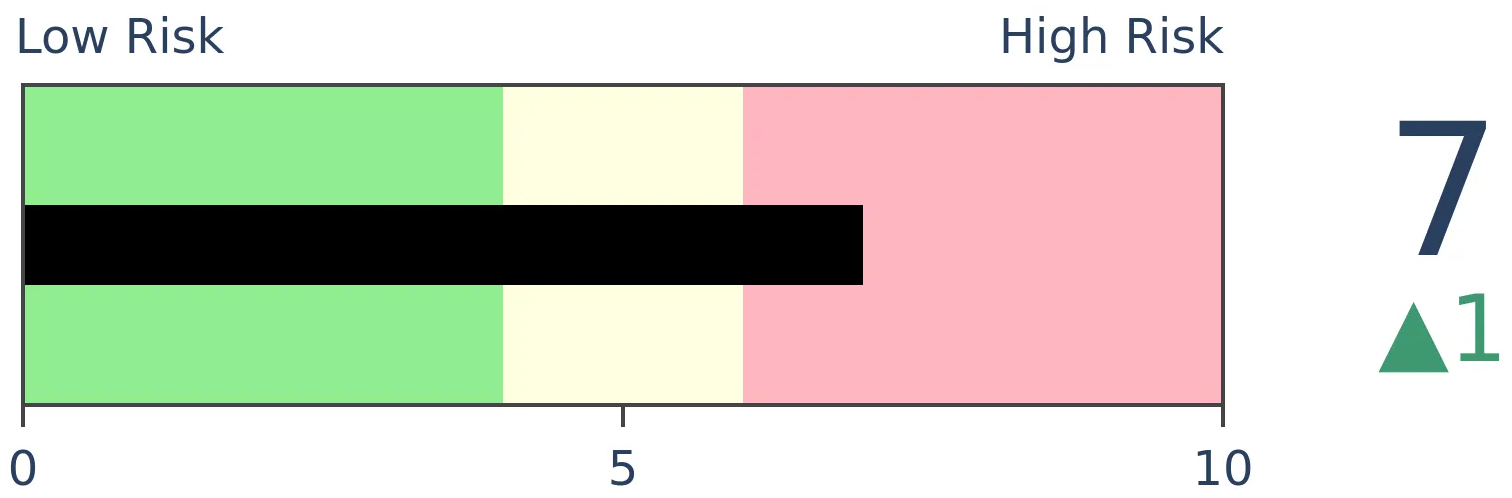
Risk Levels
Stocks Short-Term
|
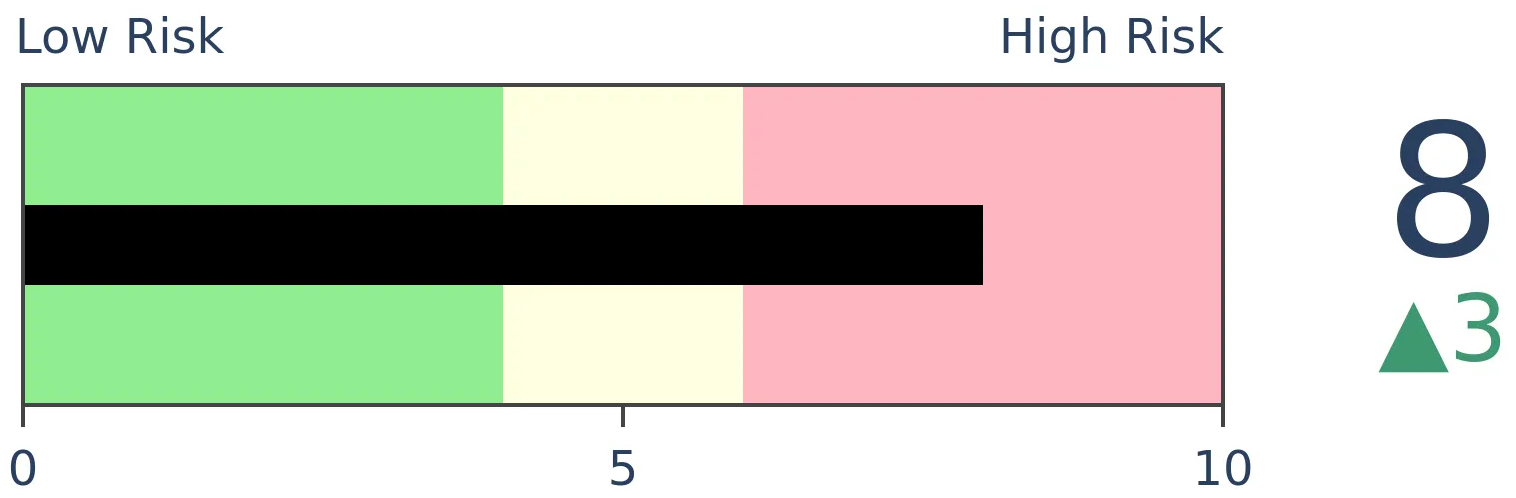
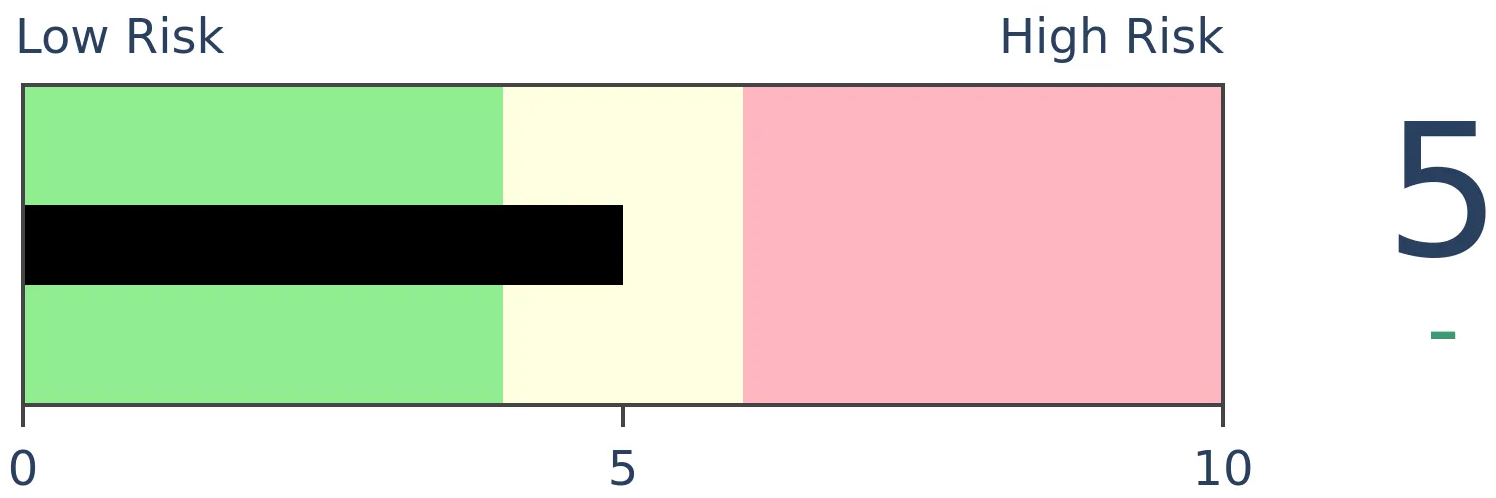
Stocks Medium-Term

|
|
Bonds

|
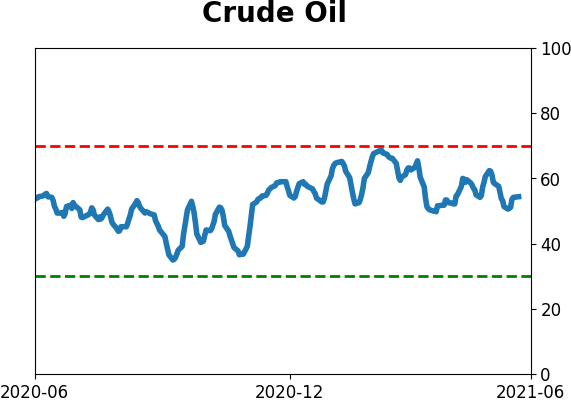
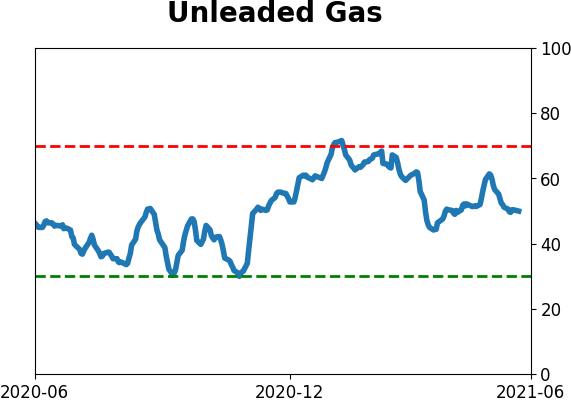
Crude Oil
|
|
Gold
|
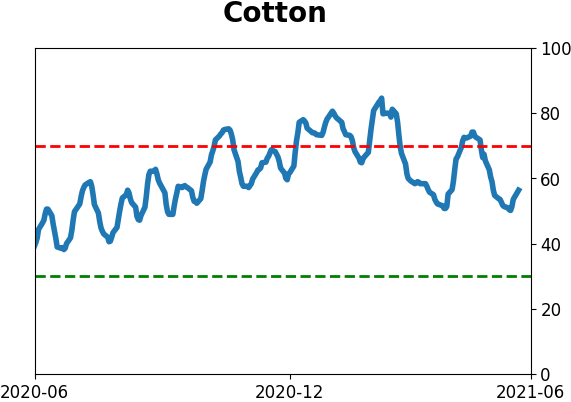
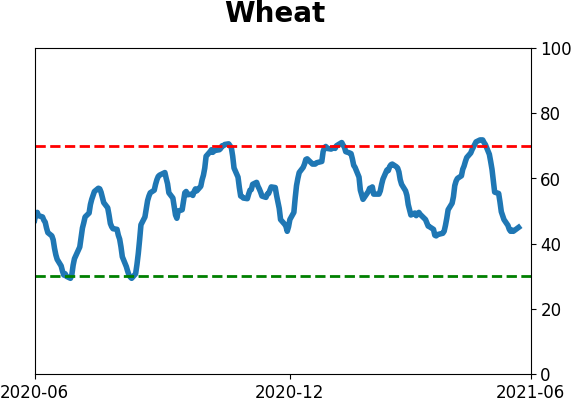
Agriculture
|
|
Research
BOTTOM LINE
Based on correlations to a Typical Sentiment Cycle, investors are currently showing Enthusiasm, and have been for more than 6 months. That's one of the longer streaks of confidence in history.
FORECAST / TIMEFRAME
None
|
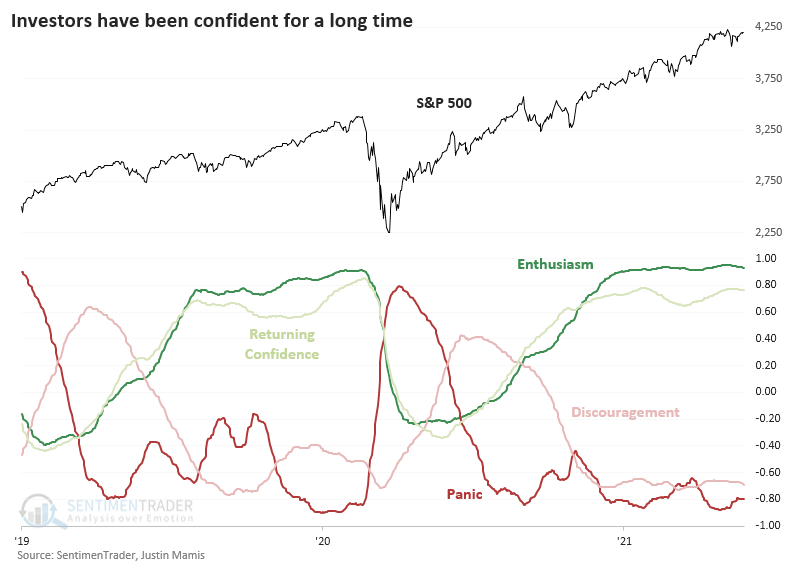
For more than six months, investors have had shown at least Returning Confidence and even Enthusiasm. That's according to the latest correlations to a Typical Sentiment Cycle.
The idea of a repeatable pattern of investor behavior is questionable because the environment and inputs are always different. Human behavior is relatively constant, though, so many use some version of the Cycle popularized by Justin Mamis in his 1999 book, The Nature of Risk.
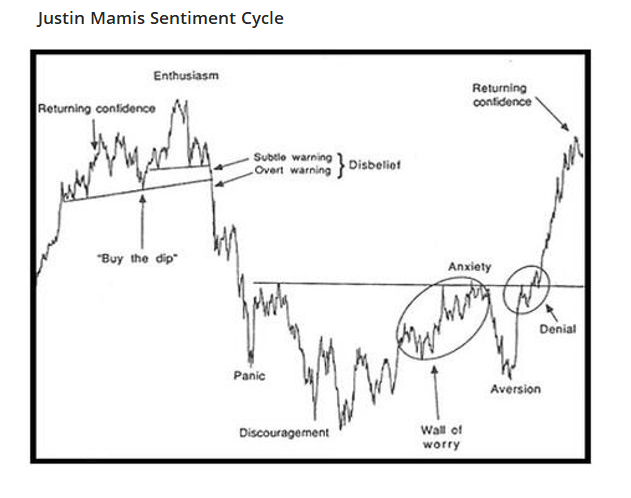
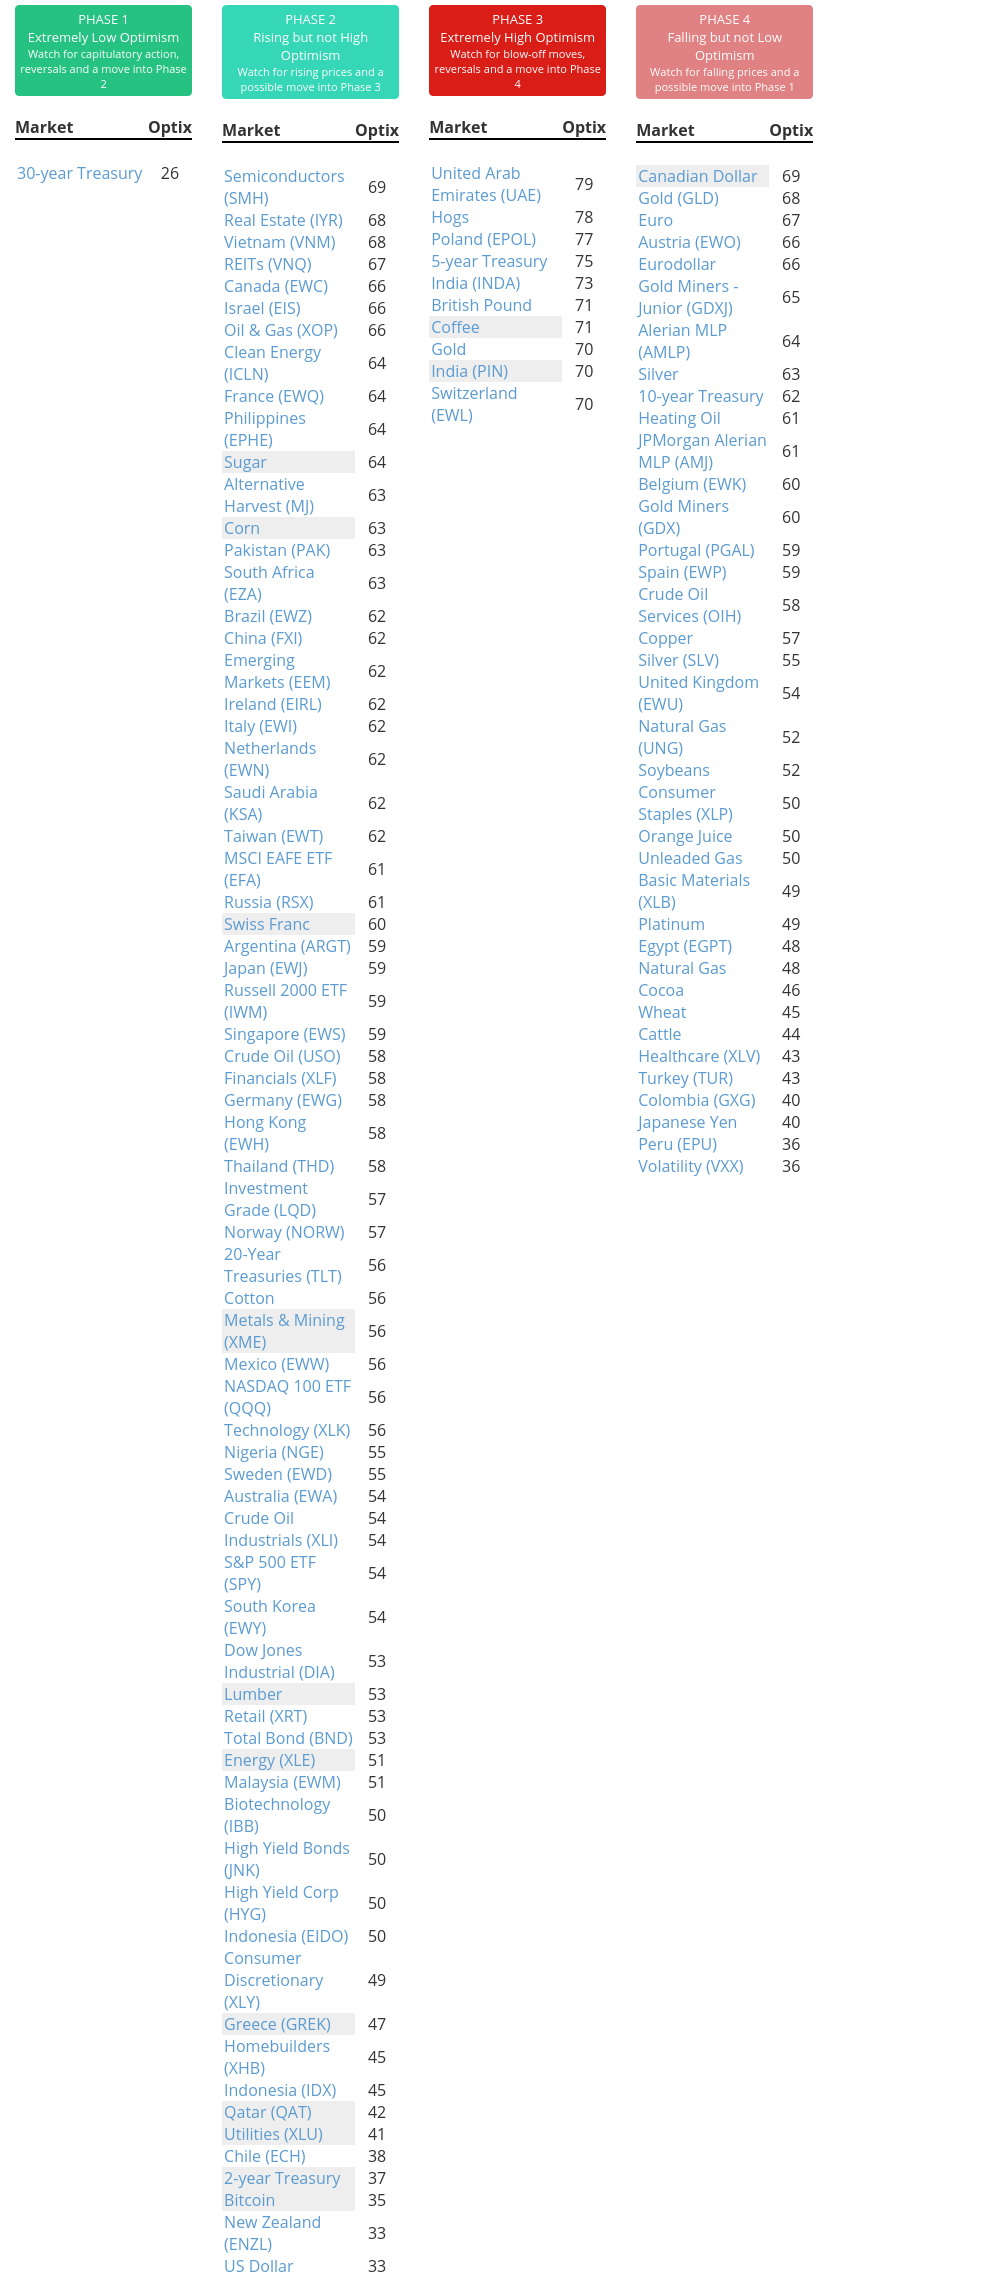
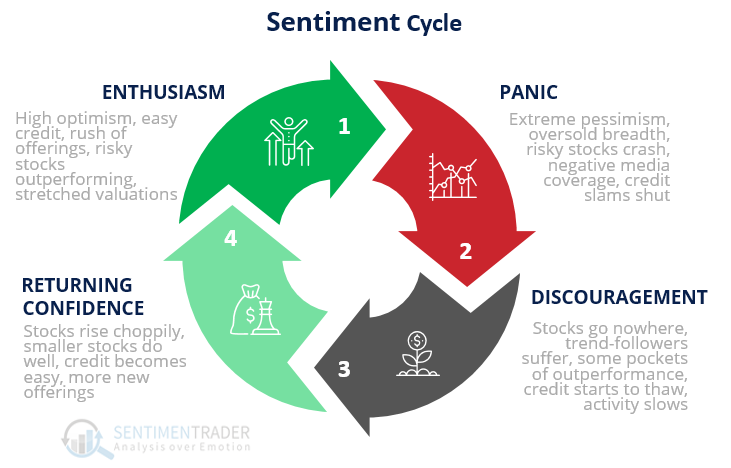
There are essentially 4 major parts to the cycle:
WHERE WE ARE NOW
If we go back to 1928 and compare all periods to that 1990-1991 period, we can see the correlation we have to each part of the Cycle. When we do that, we get the following estimates for where we are in the Cycle:
- Enthusiasm: +0.93
- Returning Confidence: +0.77
- Discouragement: -0.69
- Panic: -0.80
The correlations range from -1.0 (perfect opposite) to +1.0 (perfect symmetry). Based on that, there is a strong probability that we're in the Enthusiasm phase. Last September, the correlations suggested we were moving into the Returning Confidence phase, a good sign. It stayed there for a while, then moved into Enthusiasm near the end of last year.
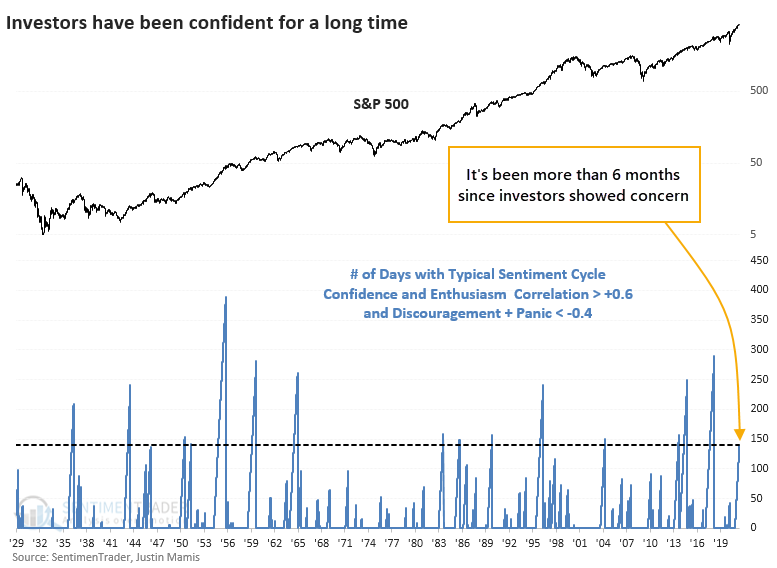
So, it has been more than six months, 140 days to be exact, that the price pattern of the S&P 500 has had at least a +0.60 correlation to both Returning Confidence and Enthusiasm, while also showing at least a -0.40 correlation to Discouragement and Panic.
That has moved us into the top 15 stretches of time with this kind of confidence among investors.
LONG BOUTS OF ENTHUSIASM HAVE BEEN OKAY
We wouldn't put a lot of weight on short-term returns following similar stretches, but those short-term returns were poor after the precedents for what it's worth.
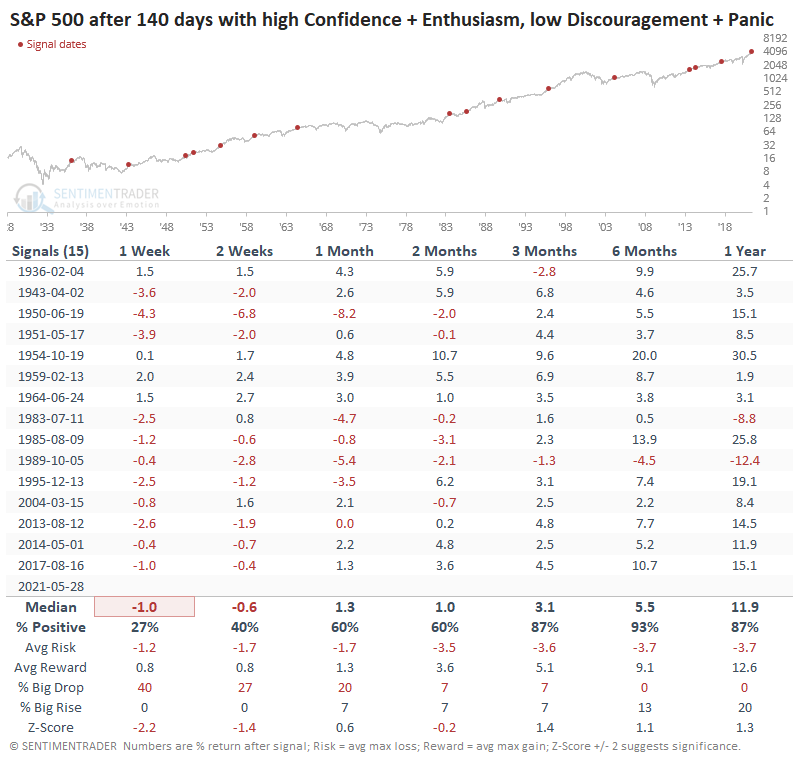
Longer-term, the S&P showed more resilience. Over the next 3-12 months, there were few losses, and the risk/reward was quite positive.
The biggest risk is that some trouble spots like valuation and inflation take hold, and investors' confidence starts to ebb. That could help trigger a very rocky short- to medium-term environment. The biggest positive we can see right now is that momentum has been so strong that it tends to persist, and so far, we're still not seeing many internal warning signs of deterioration.
Active Studies
| Time Frame | Bullish | Bearish | | Short-Term | 0 | 0 | | Medium-Term | 1 | 11 | | Long-Term | 11 | 5 |
|
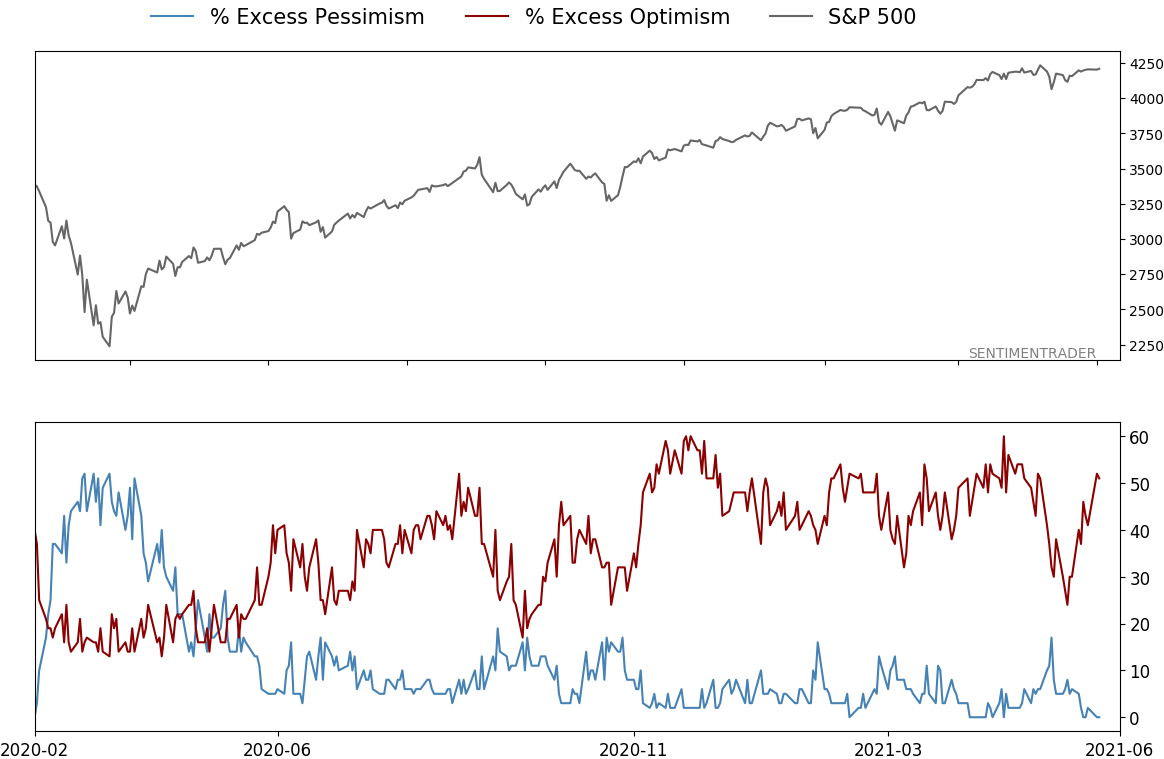
Indicators at Extremes
|
% Showing Pessimism: 0%
Bullish for Stocks
|
|
Portfolio
| Position | Description | Weight % | Added / Reduced | Date | | Stocks | RSP | 4.1 | Added 4.1% | 2021-05-19 | | Bonds | 23.9% BND, 6.9% SCHP | 30.7 | Reduced 7.1% | 2021-05-19 | | Commodities | GCC | 2.6 | Reduced 2.1%
| 2020-09-04 | | Precious Metals | GDX | 5.6 | Reduced 4.2% | 2021-05-19 | | Special Situations | 4.3% XLE, 2.2% PSCE | 7.6 | Reduced 5.6% | 2021-04-22 | | Cash | | 49.4 | | |
|
Updates (Changes made today are underlined)
Much of our momentum and trend work has remained positive for several months, with some scattered exceptions. Almost all sentiment-related work has shown a poor risk/reward ratio for stocks, especially as speculation drove to record highs in exuberance in February. Much of that has worn off, and most of our models are back toward neutral levels. There isn't much to be excited about here. The same goes for bonds and even gold. Gold has been performing well lately and is back above long-term trend lines. The issue is that it has a poor record of holding onto gains when attempting a long-term trend change like this, so we'll take a wait-and-see approach. RETURN YTD: 10.1% 2020: 8.1%, 2019: 12.6%, 2018: 0.6%, 2017: 3.8%, 2016: 17.1%, 2015: 9.2%, 2014: 14.5%, 2013: 2.2%, 2012: 10.8%, 2011: 16.5%, 2010: 15.3%, 2009: 23.9%, 2008: 16.2%, 2007: 7.8%
|
|
Phase Table
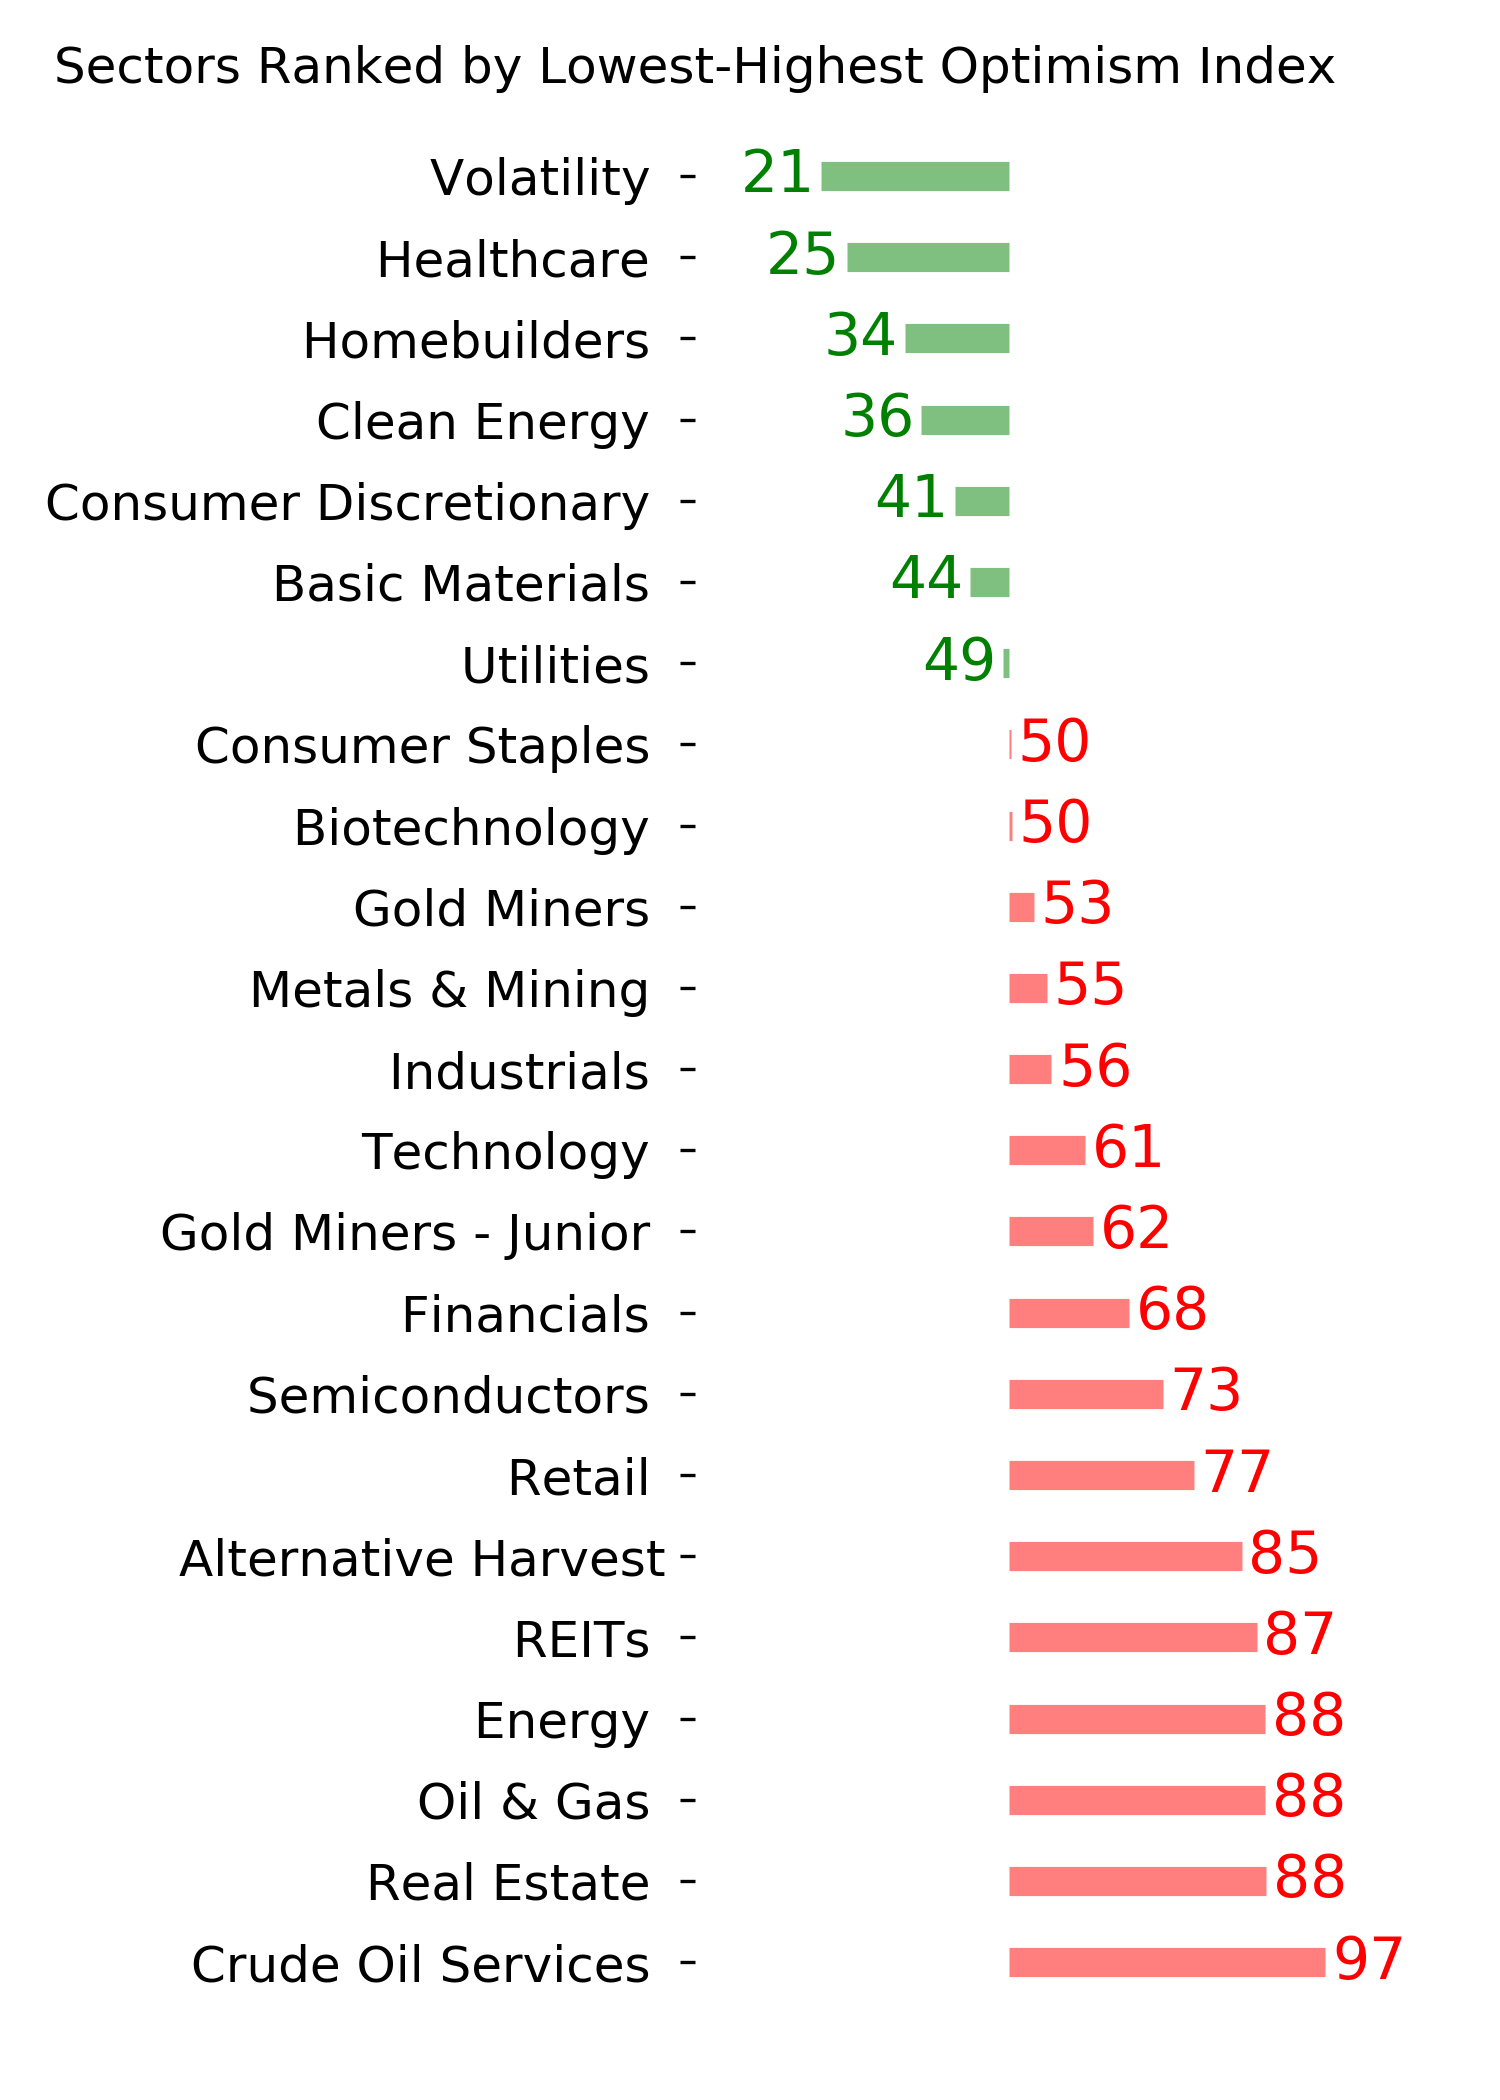
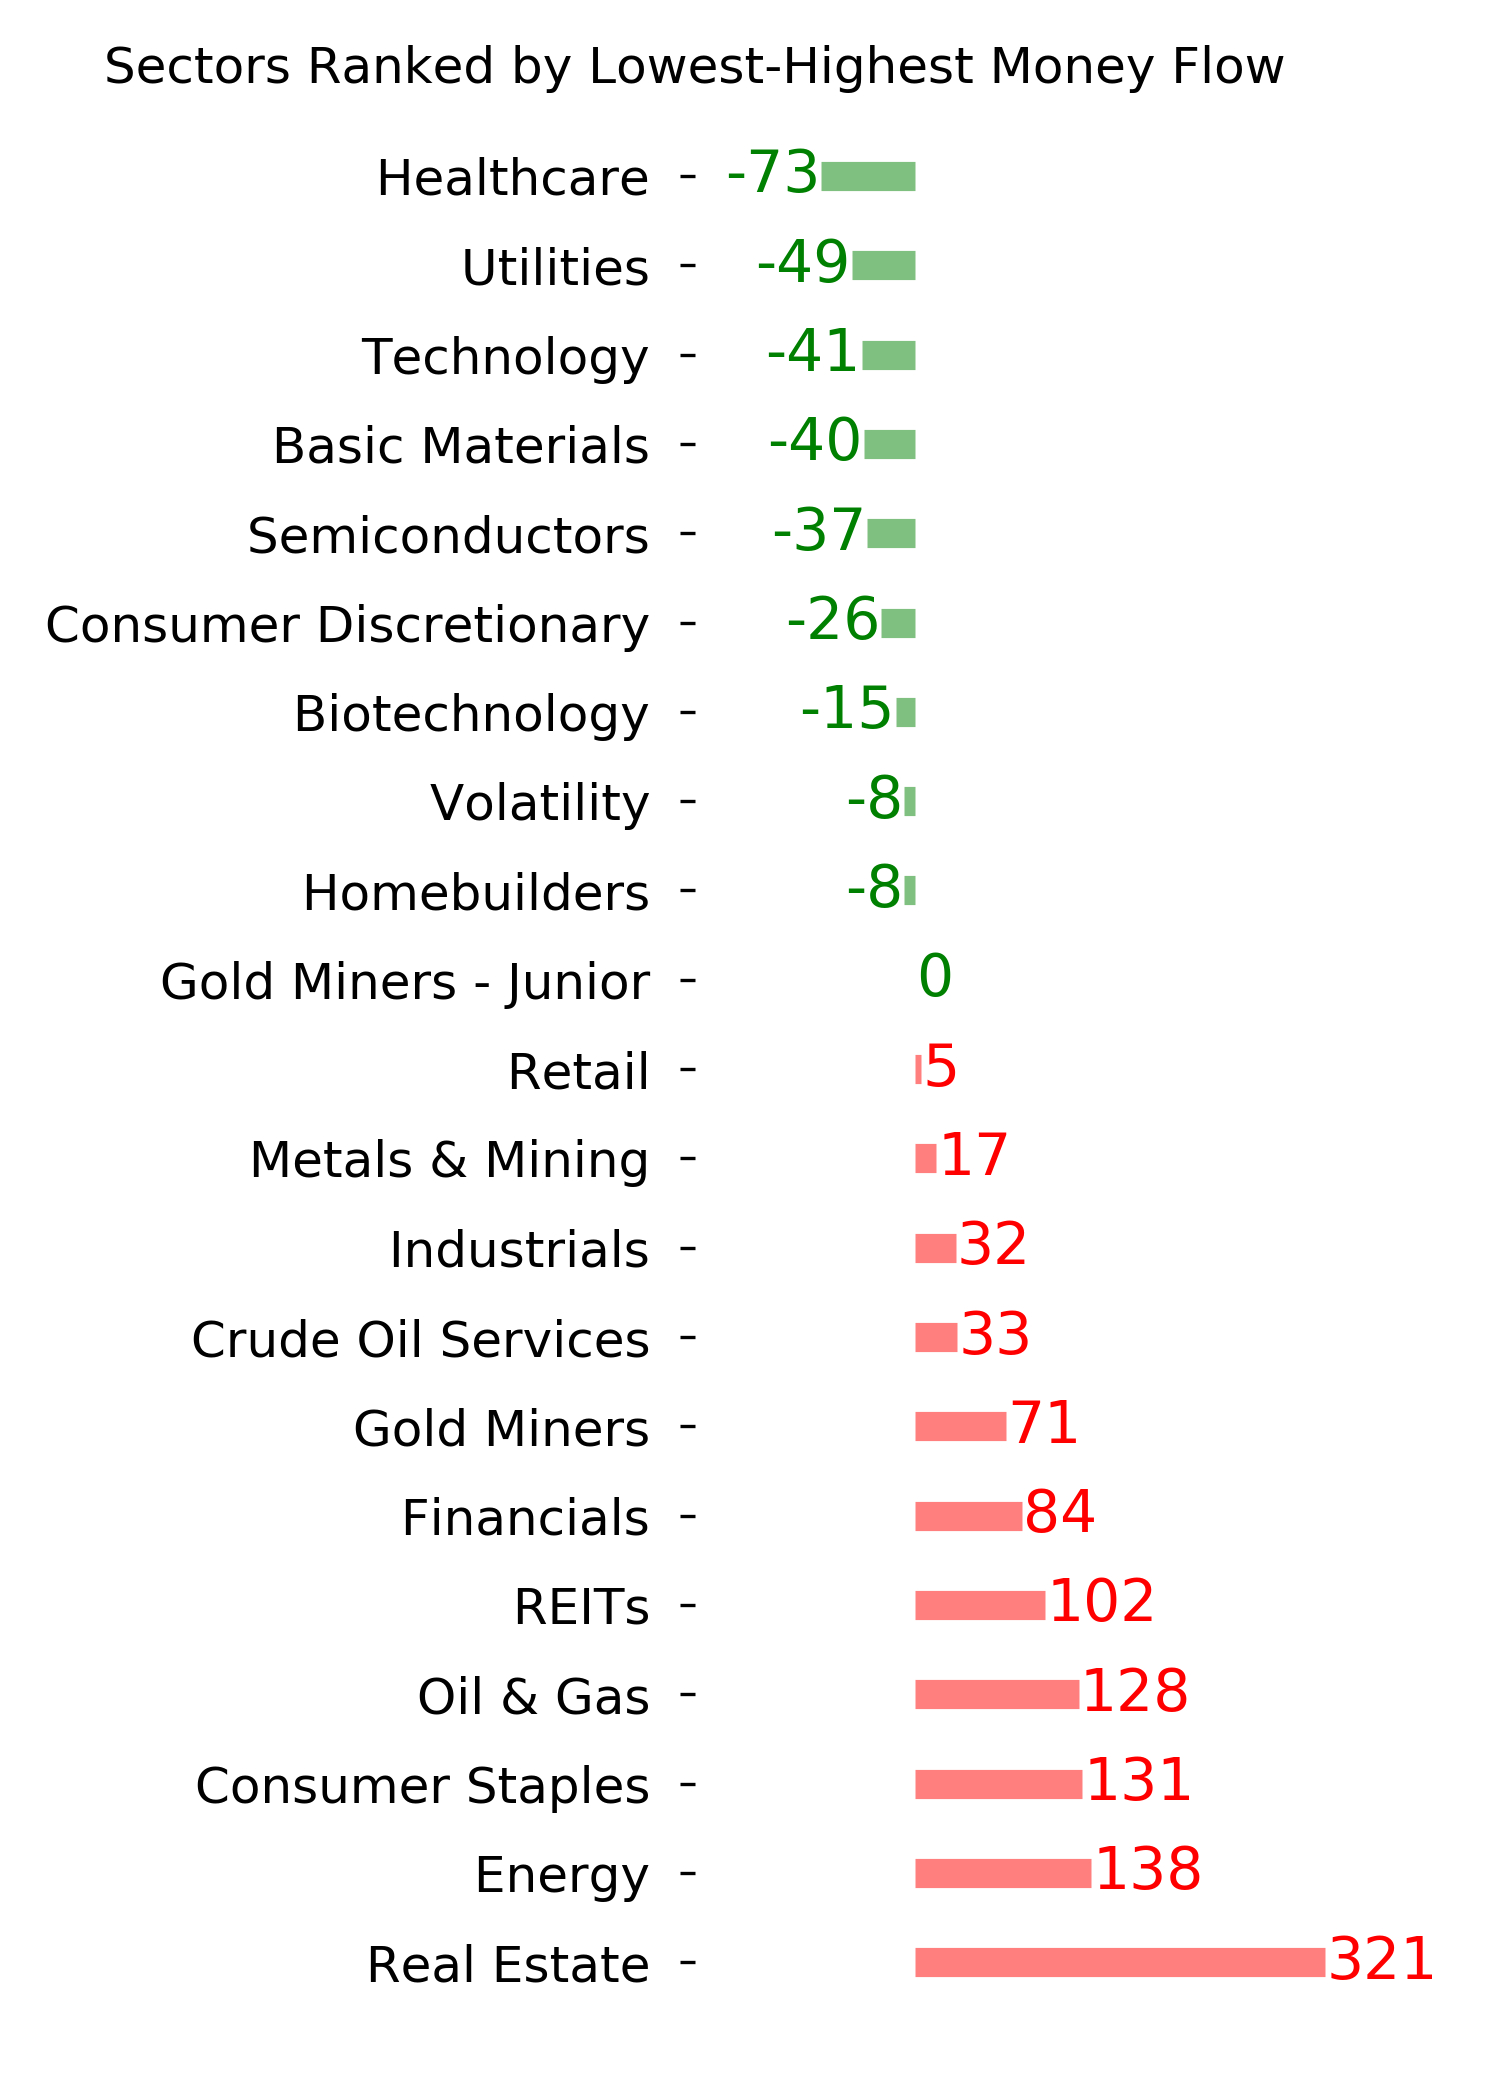
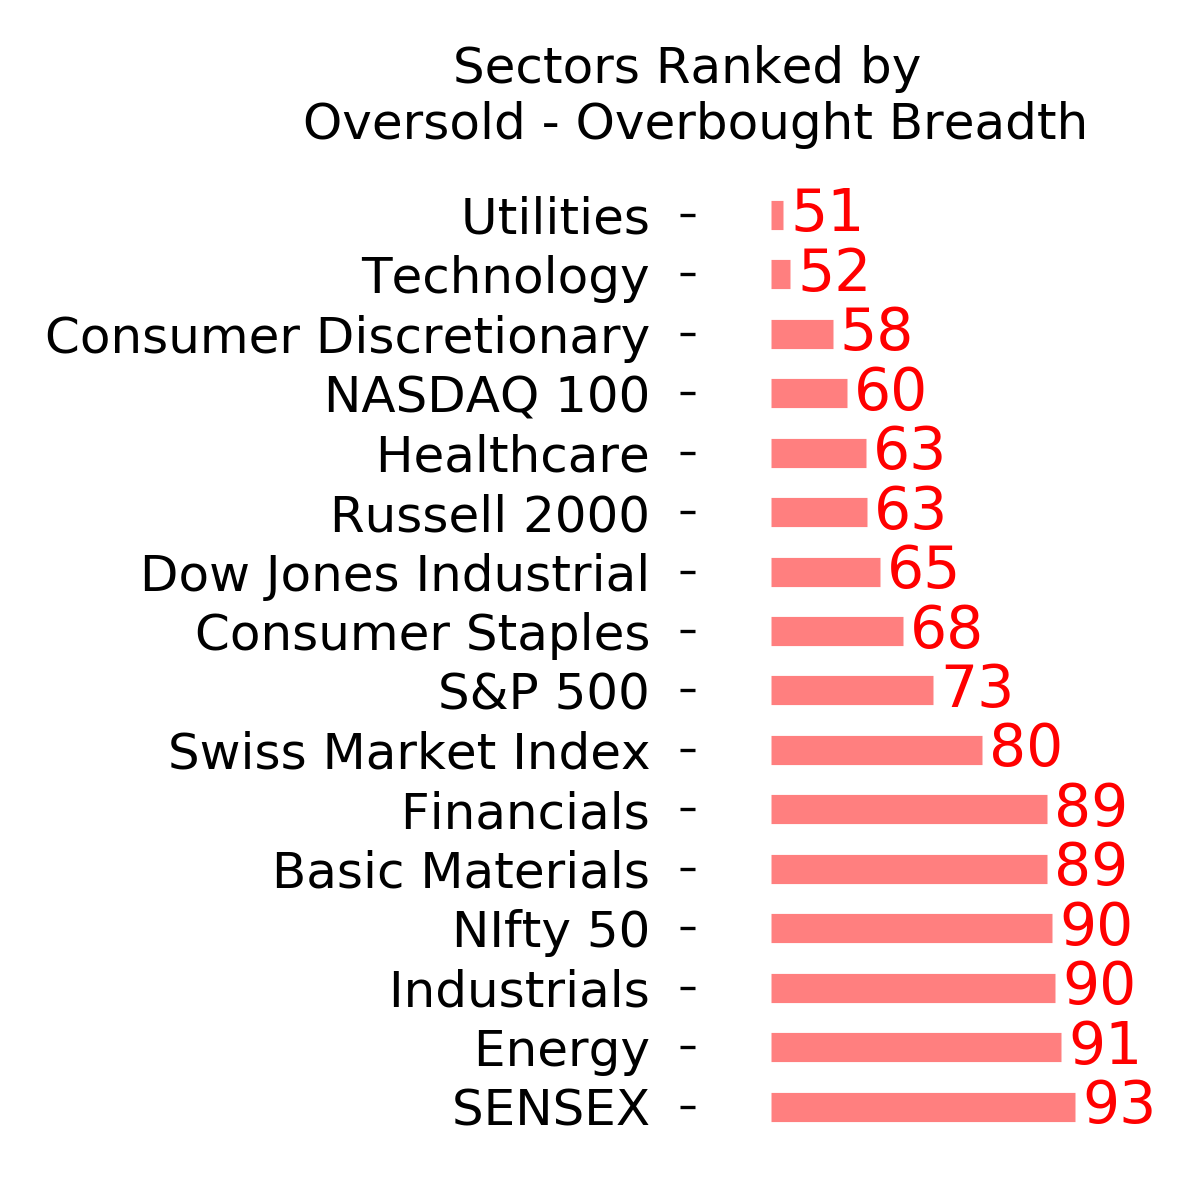
Ranks
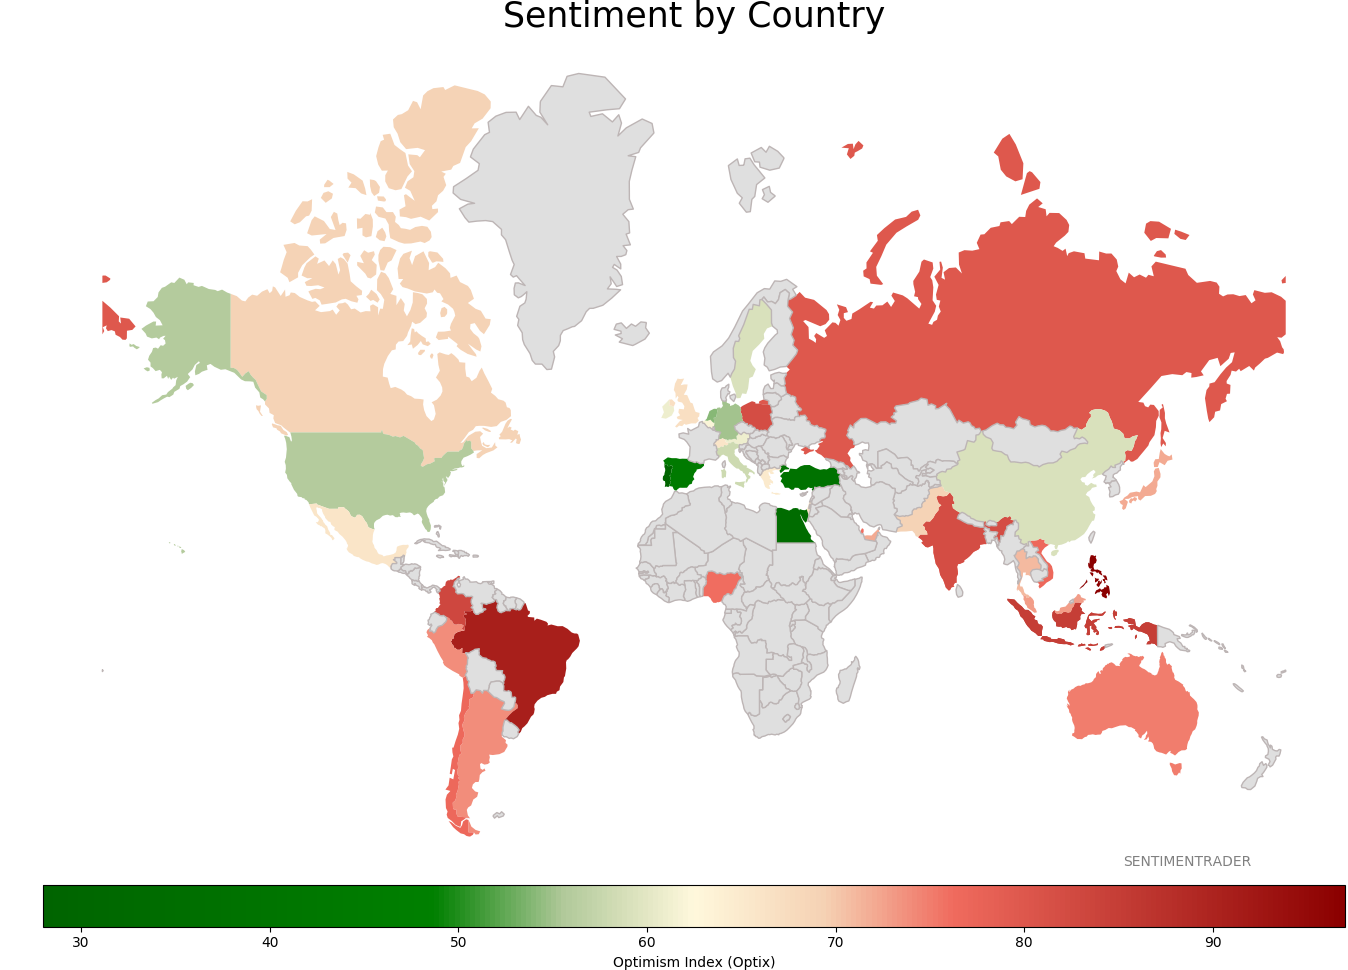
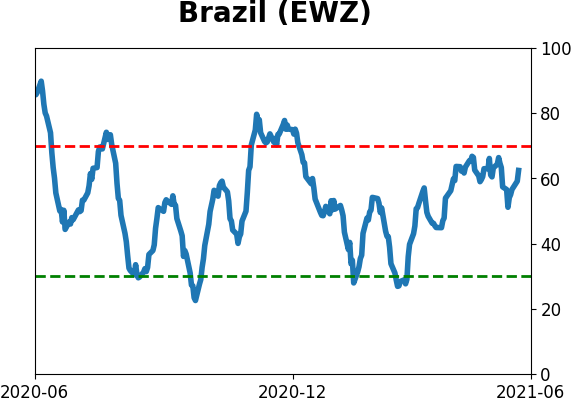
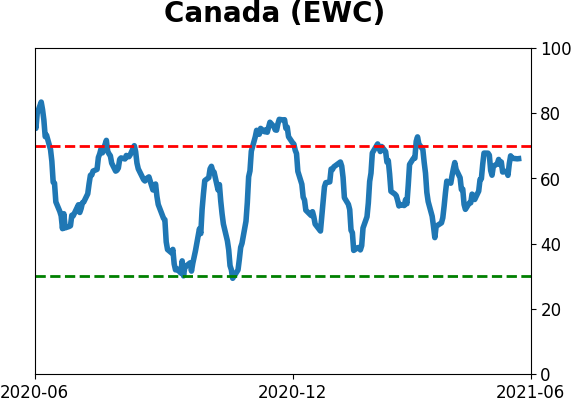
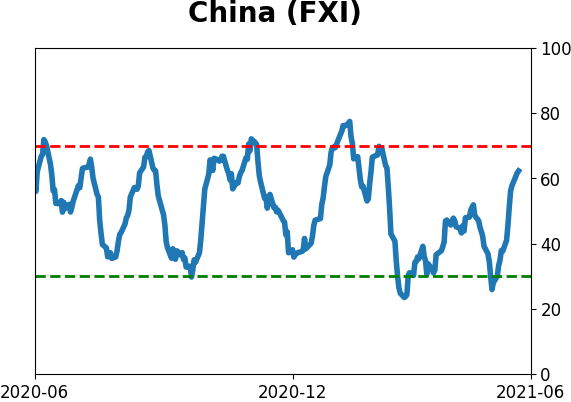
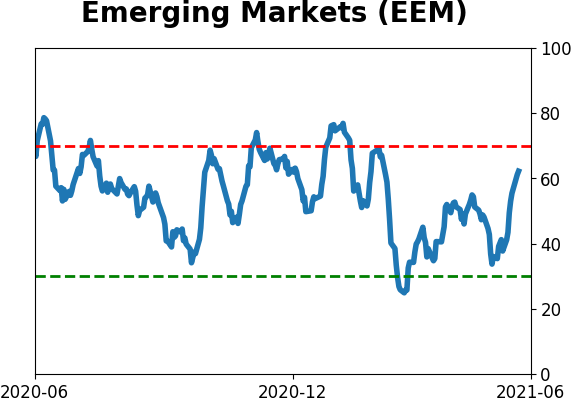
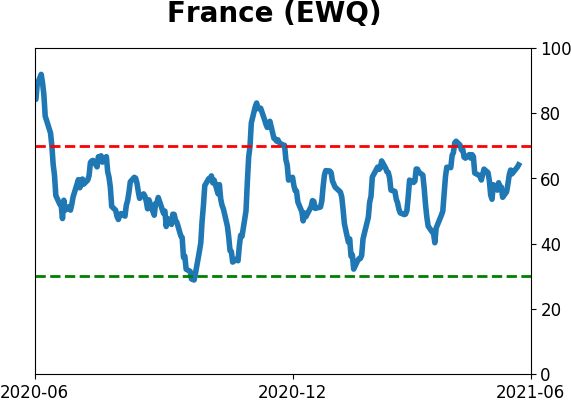
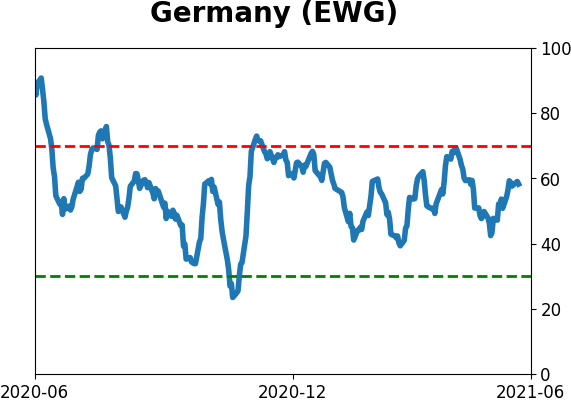
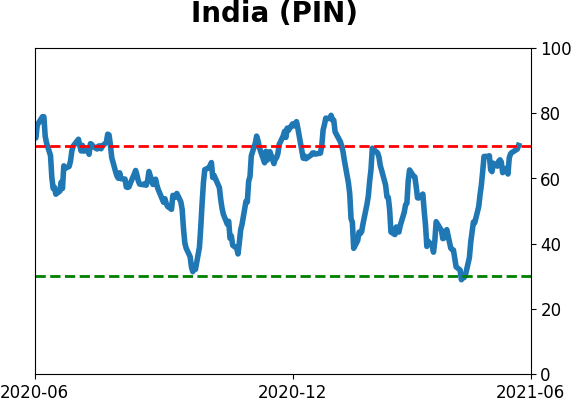
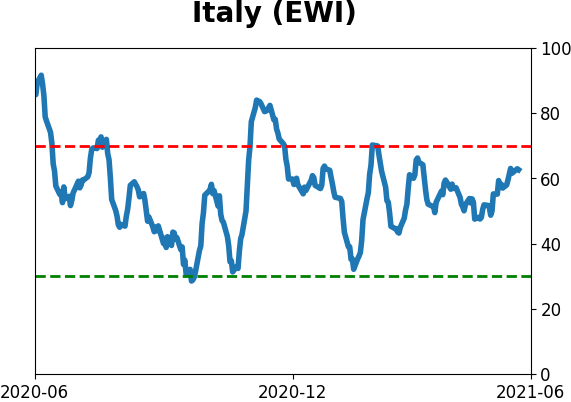
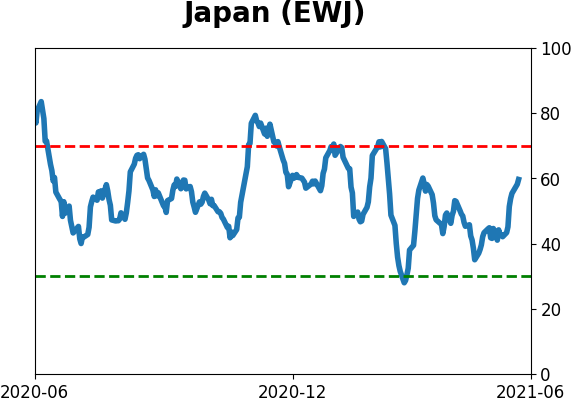
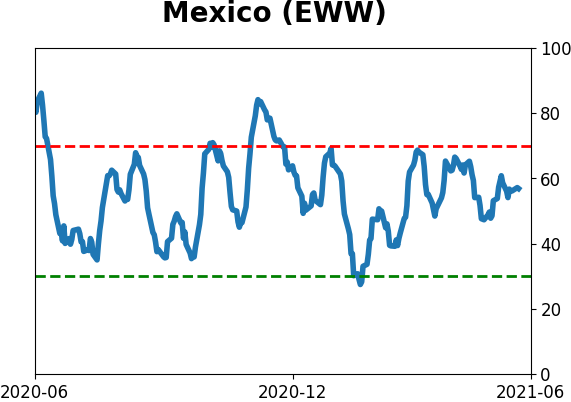
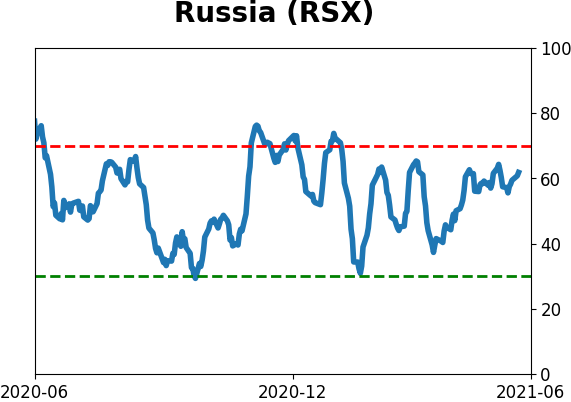
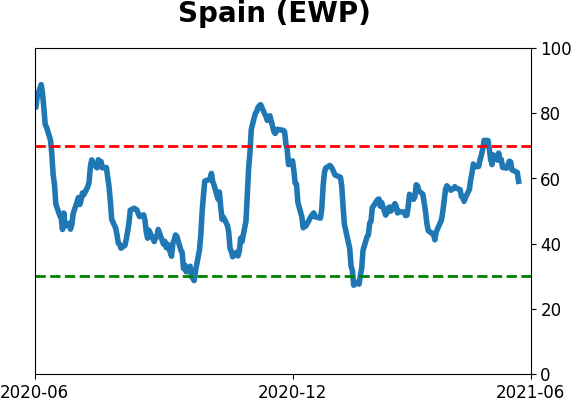
Sentiment Around The World
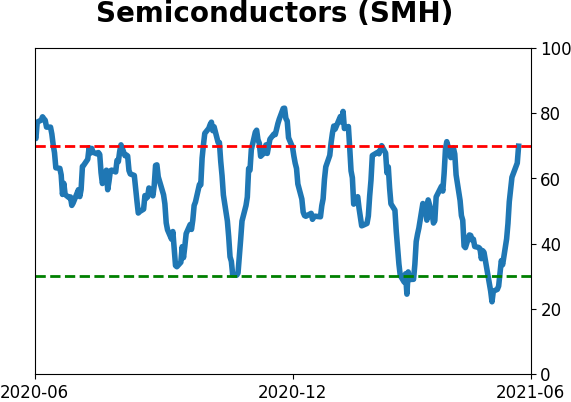
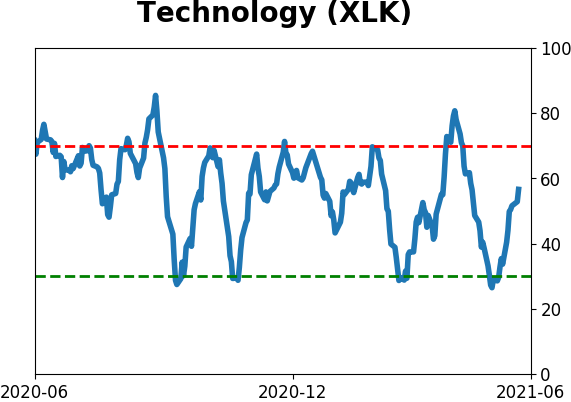
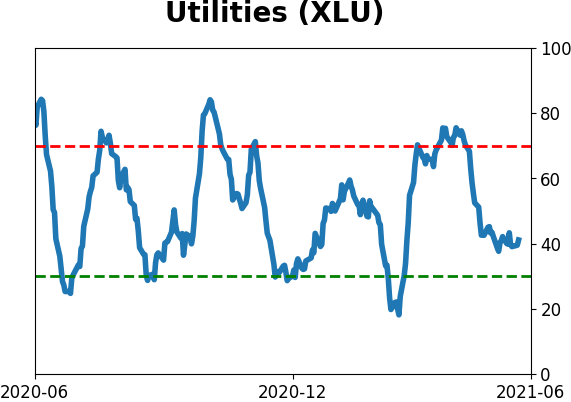
Optimism Index Thumbnails
|
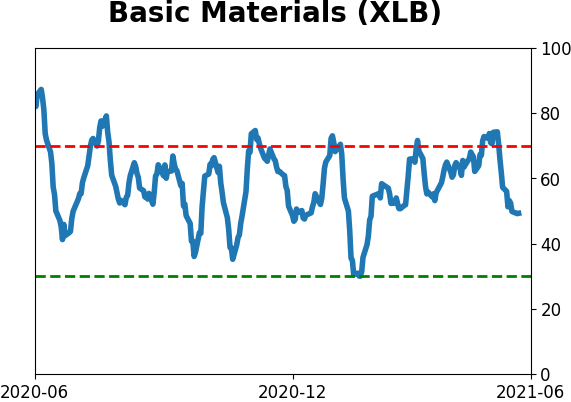
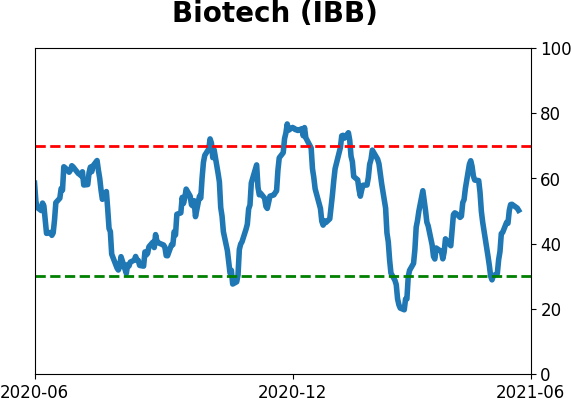
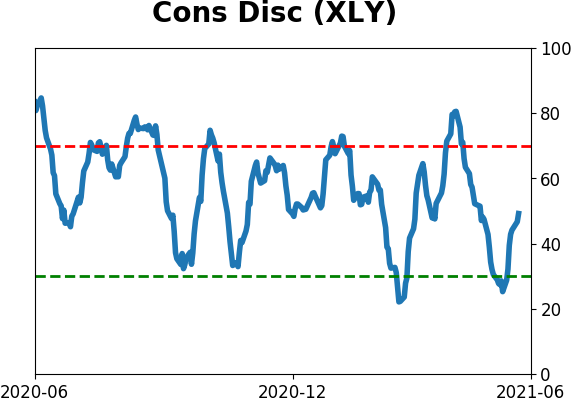
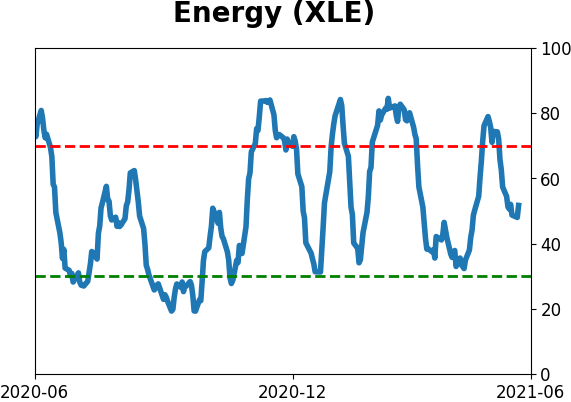
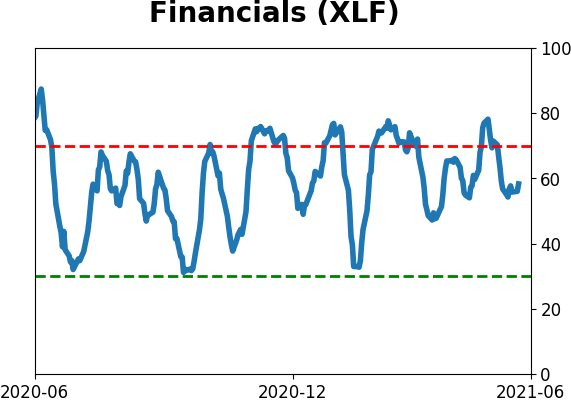
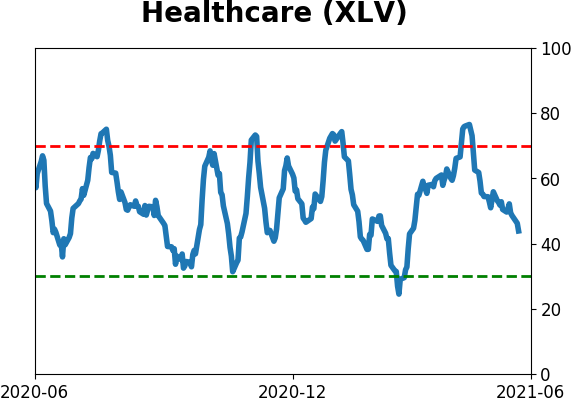
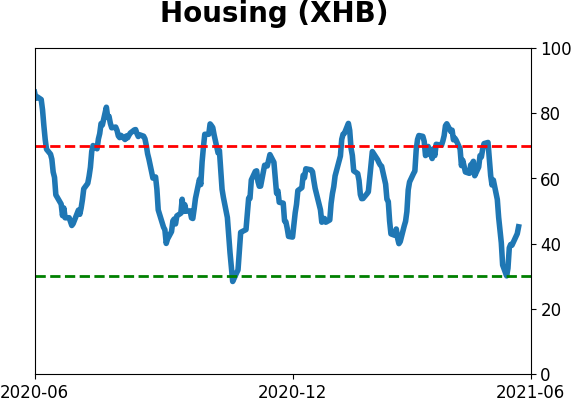
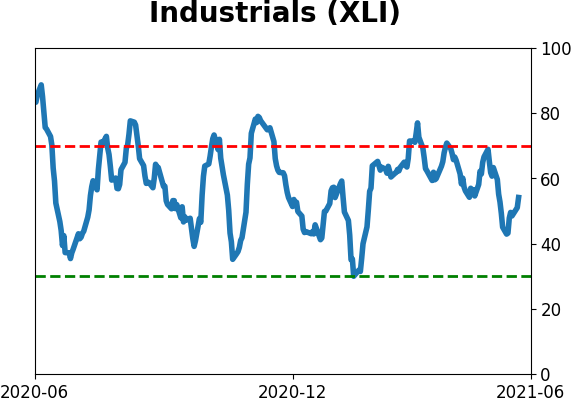
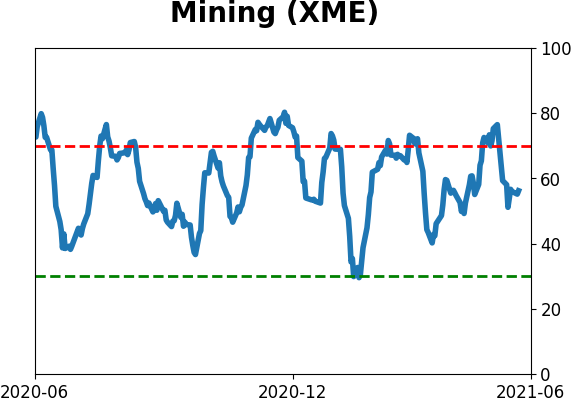
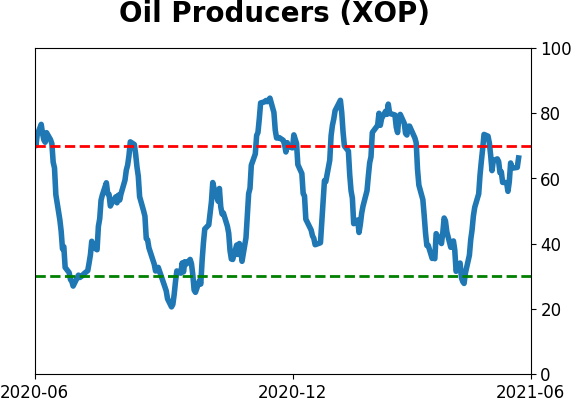
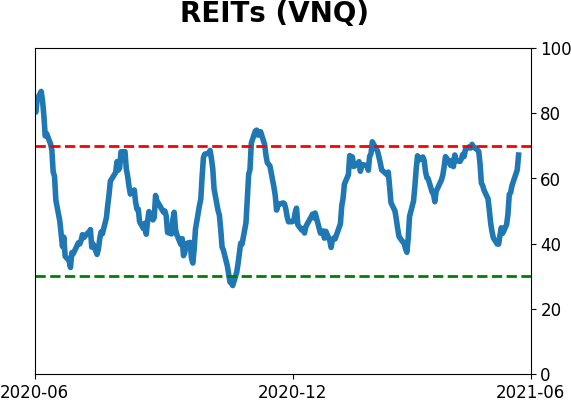
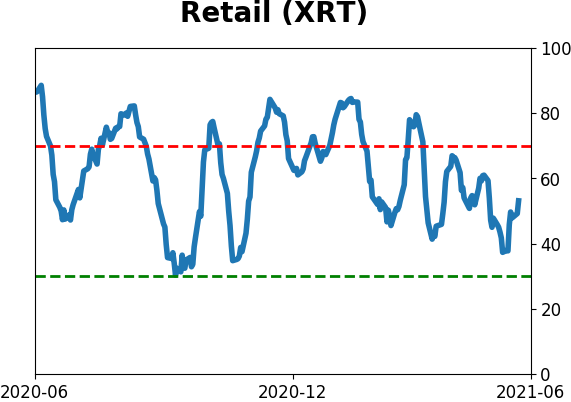
Sector ETF's - 10-Day Moving Average
|
|
|
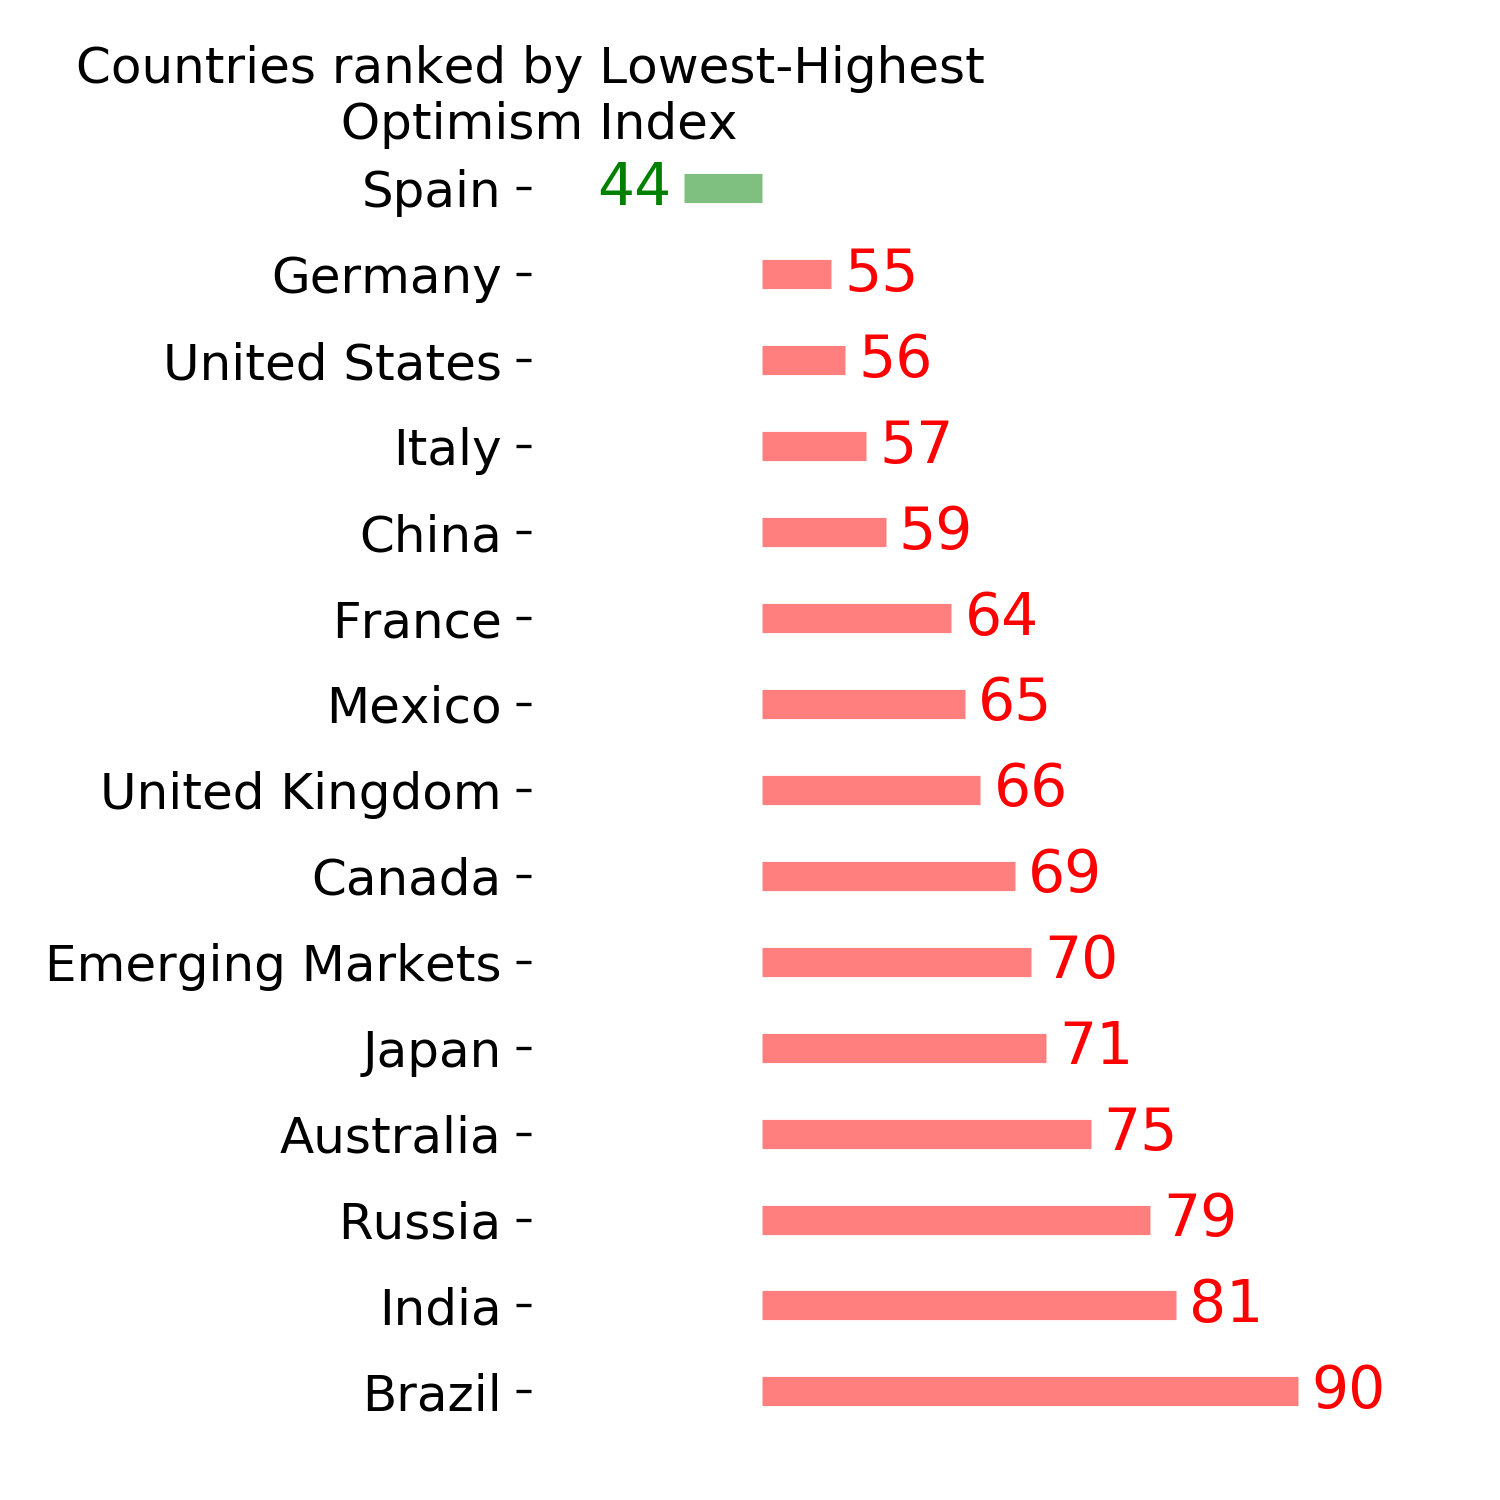
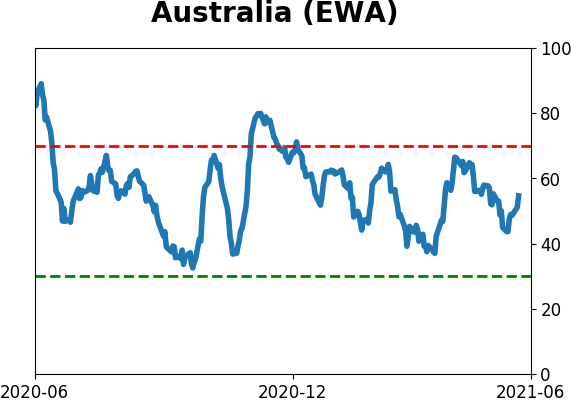
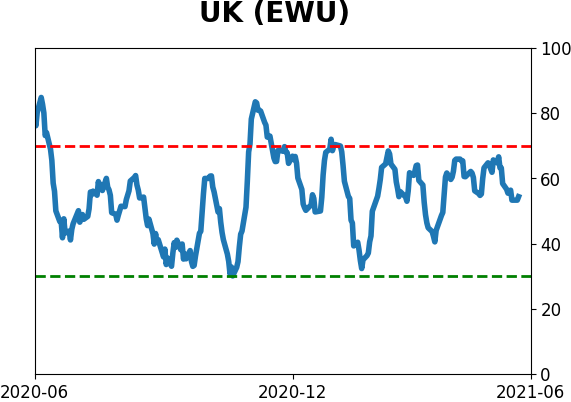
Country ETF's - 10-Day Moving Average
|
|
|
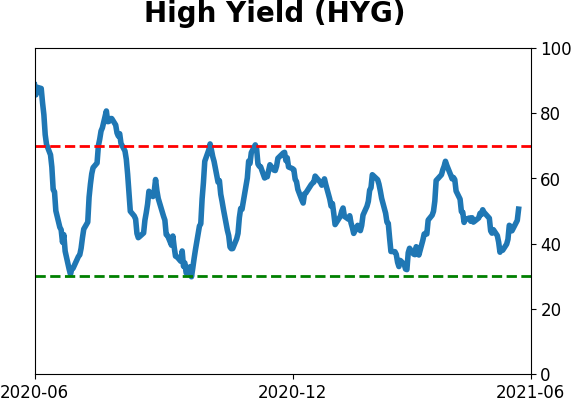
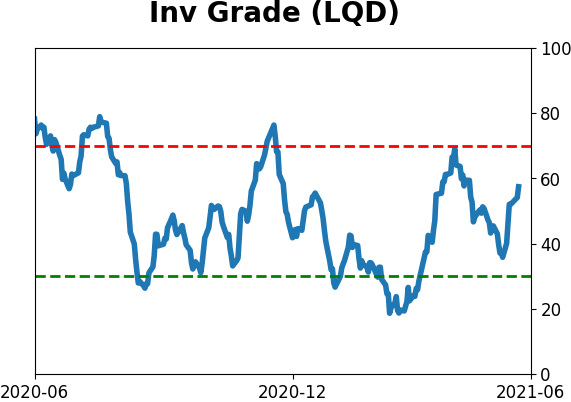
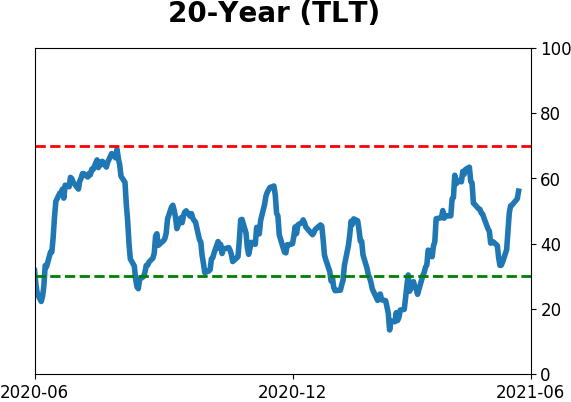
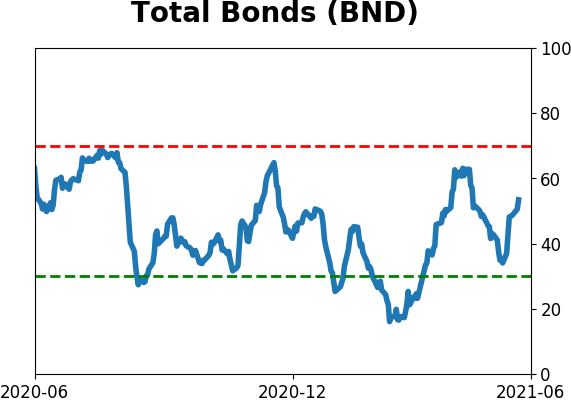
Bond ETF's - 10-Day Moving Average
|
|
|
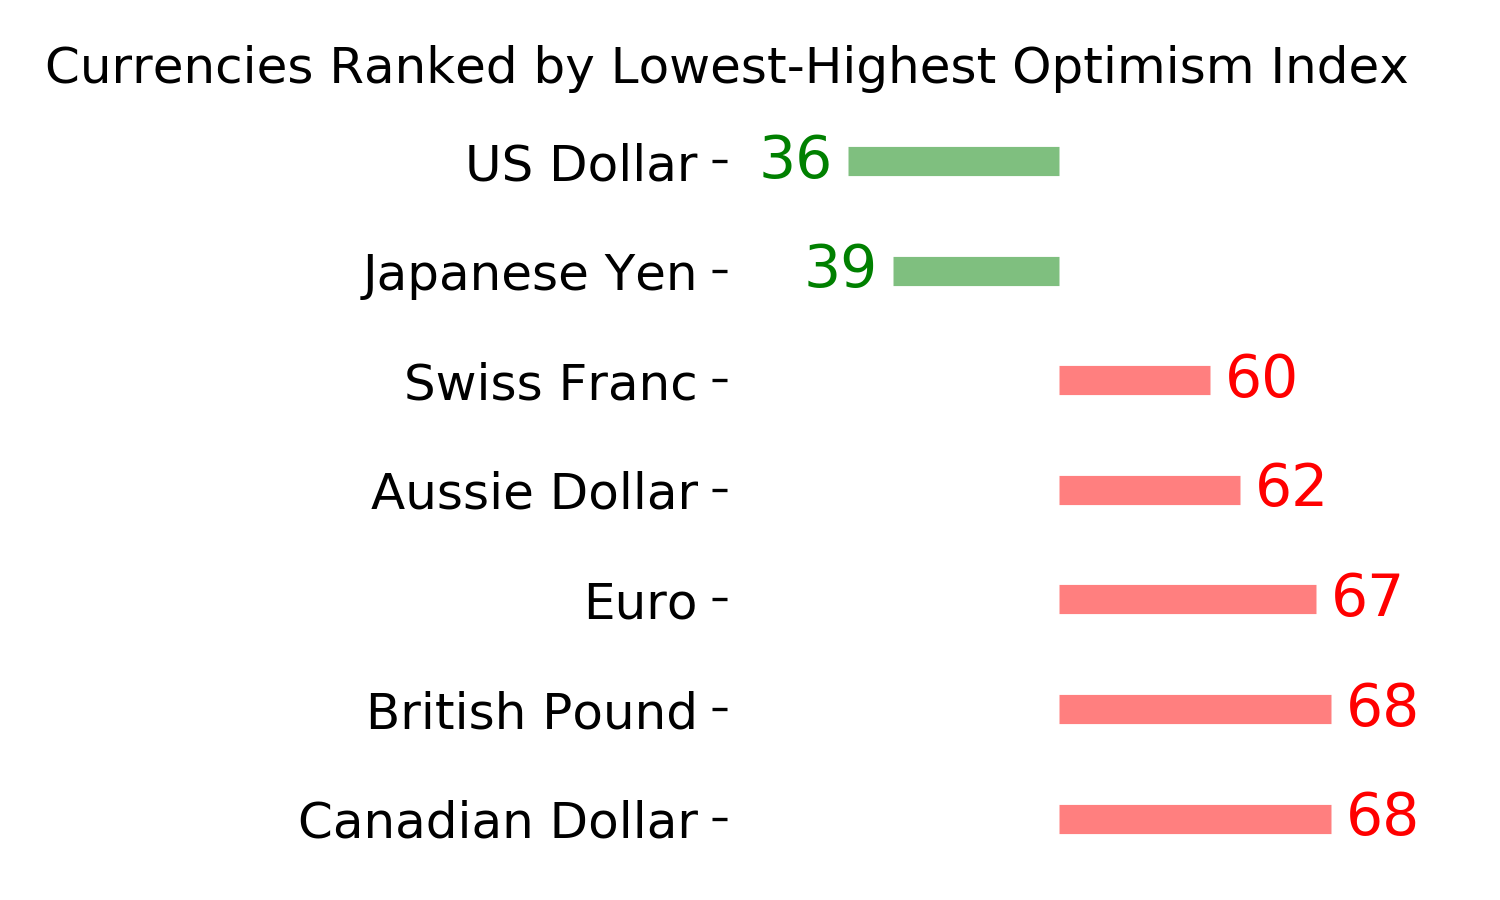
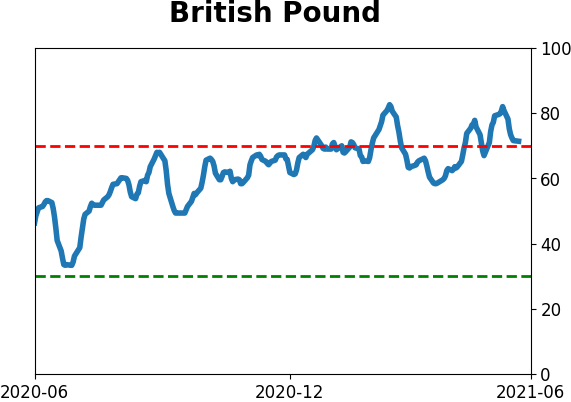
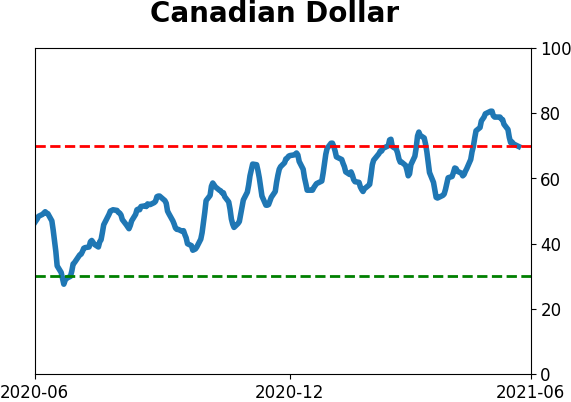
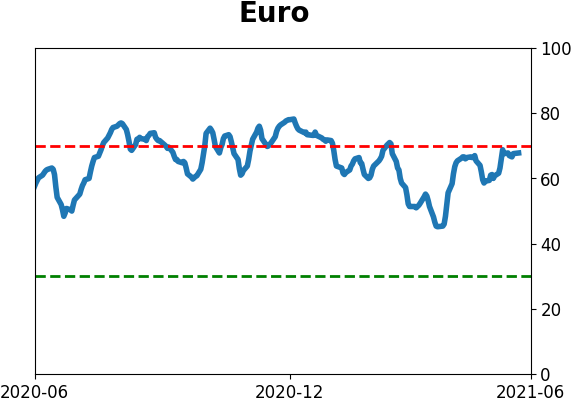
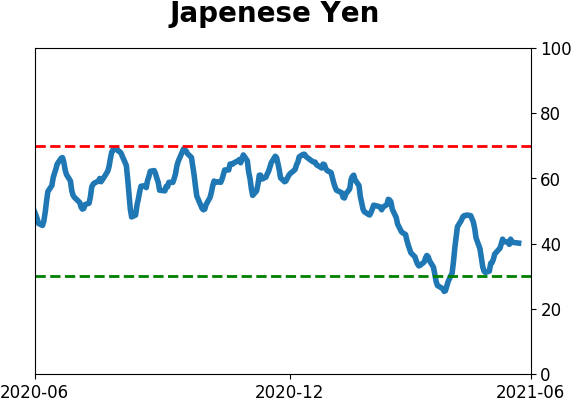
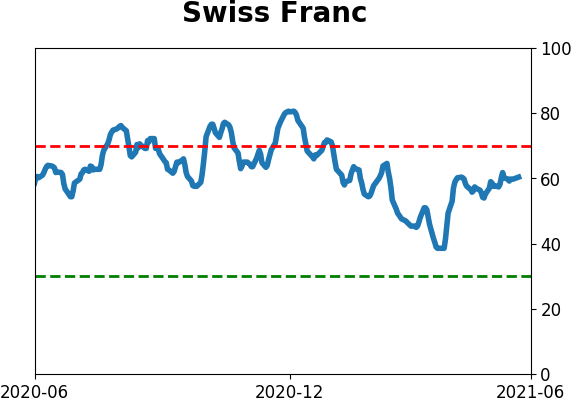
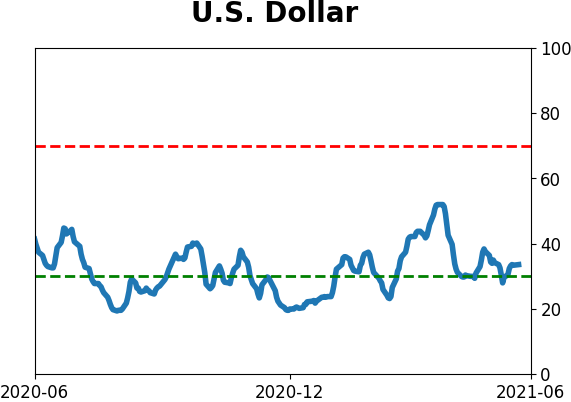
Currency ETF's - 5-Day Moving Average
|
|
|
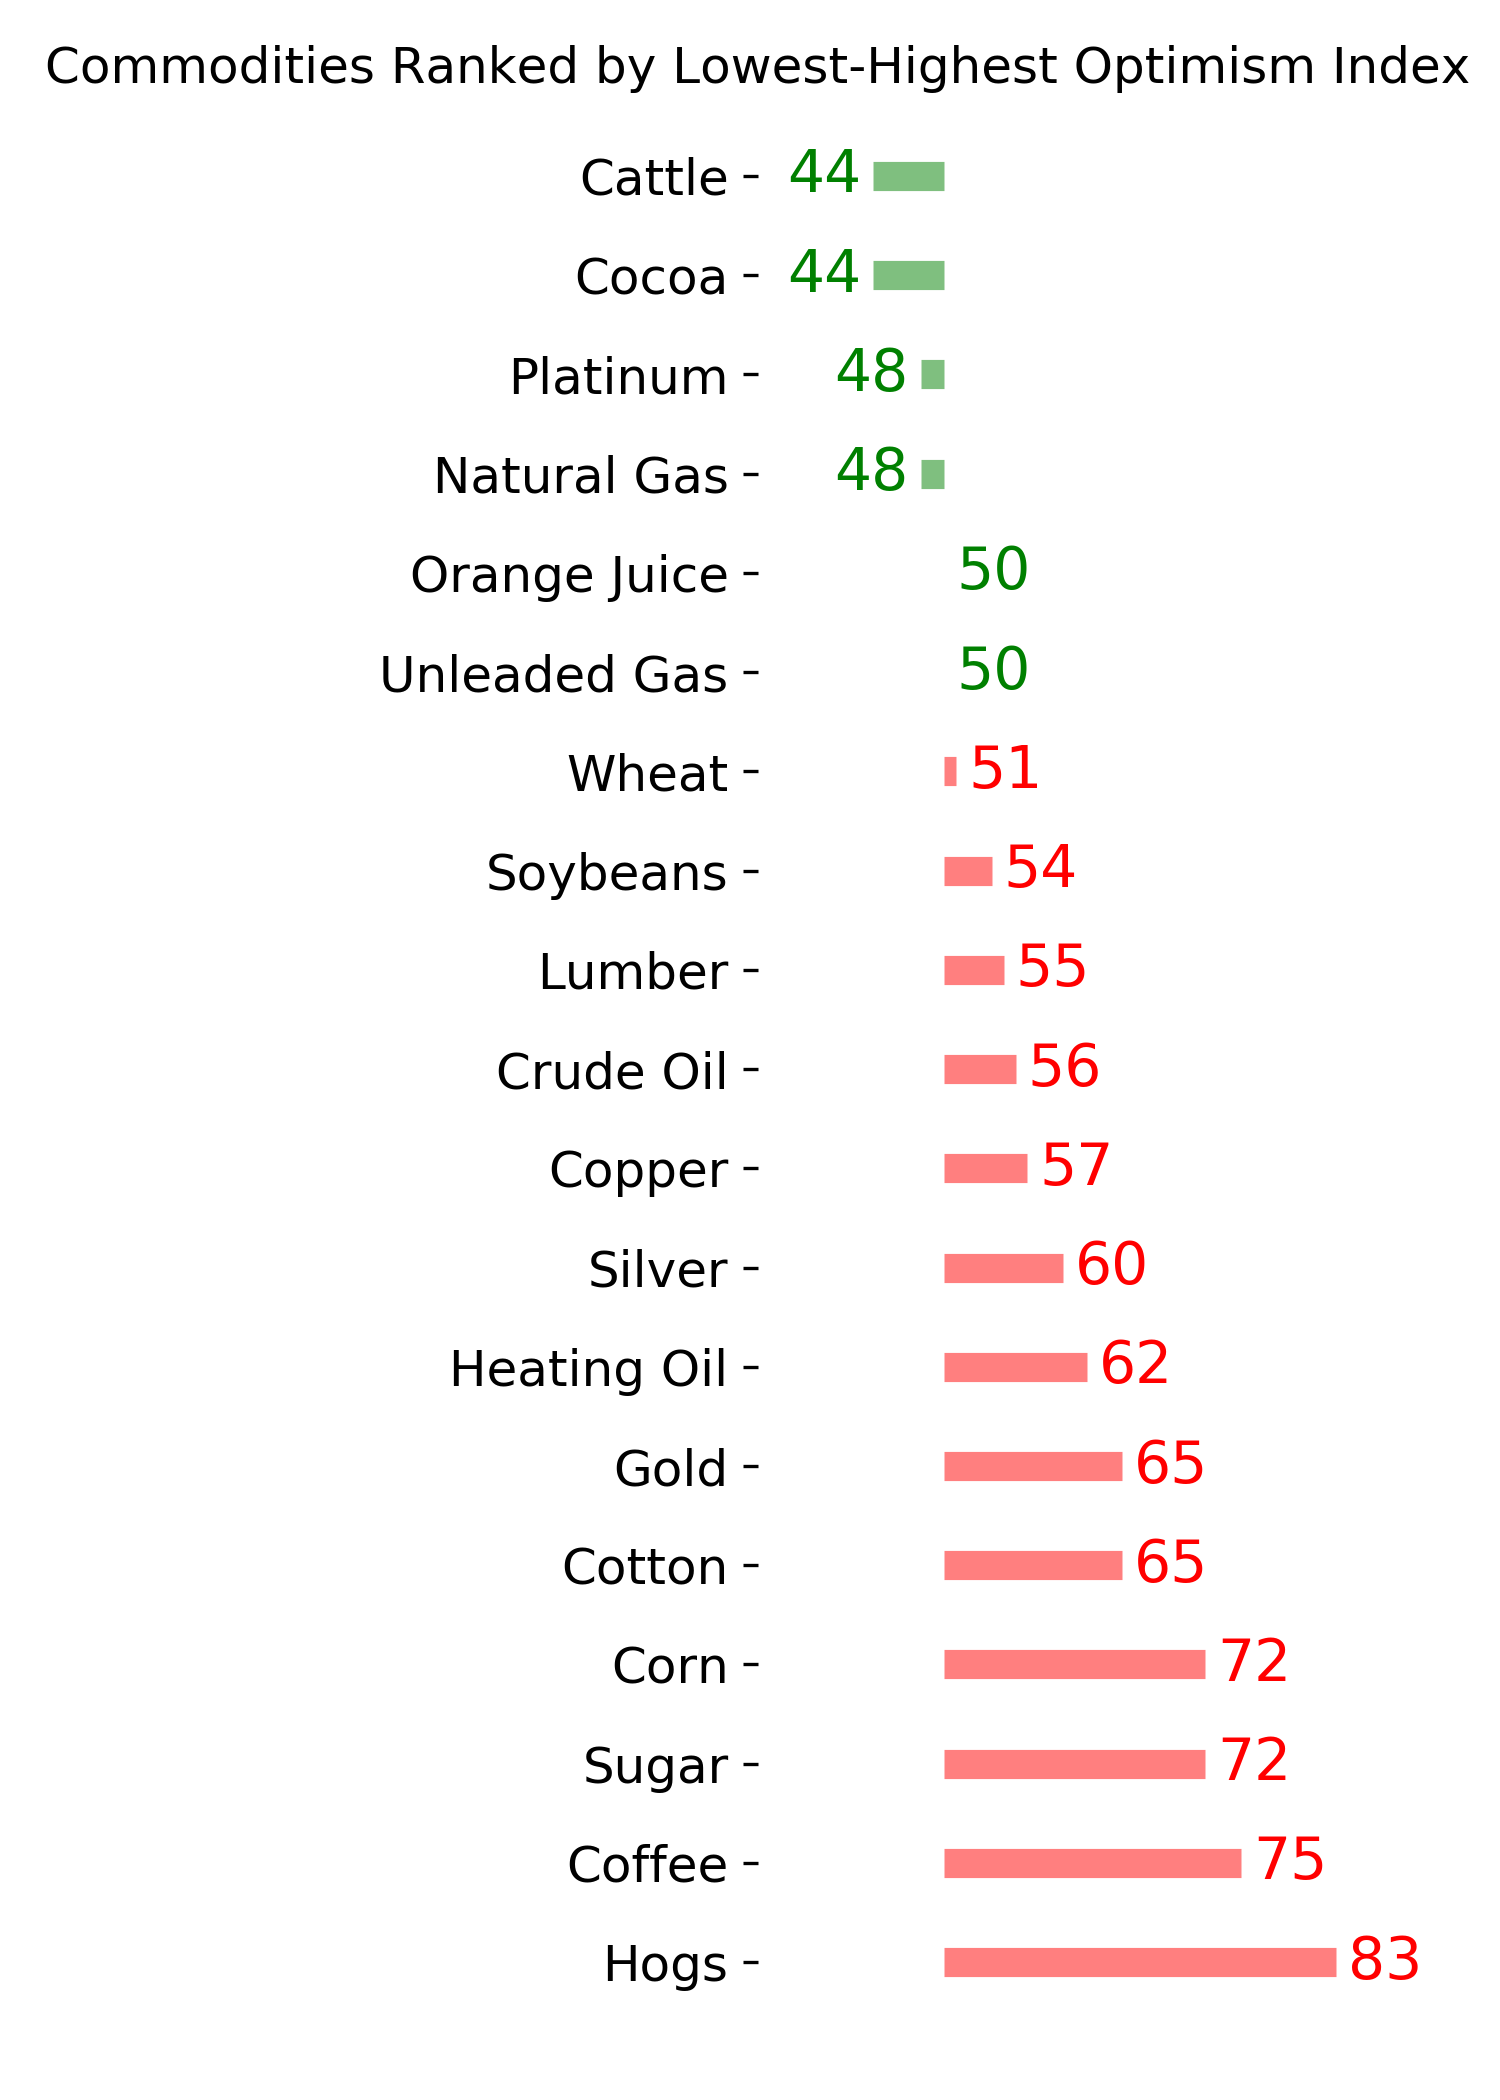
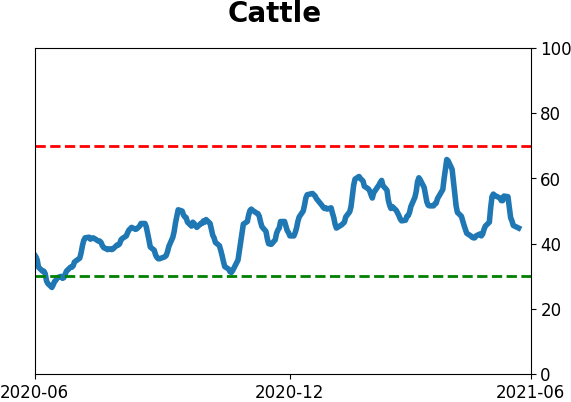
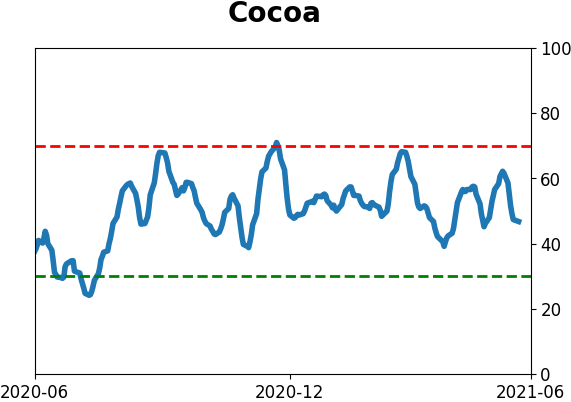
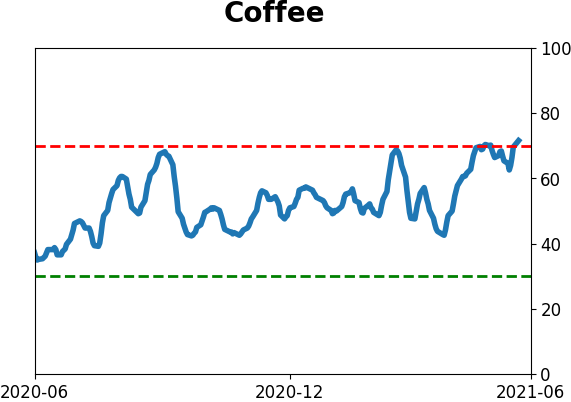
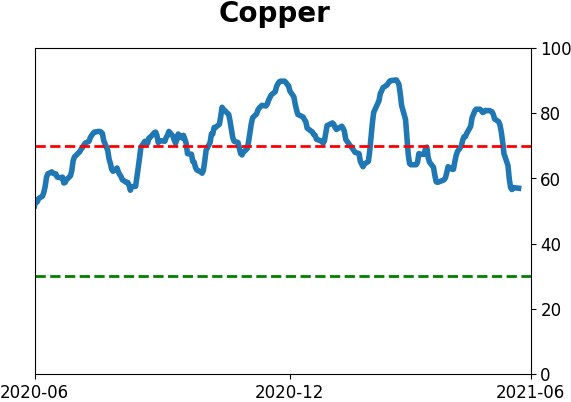
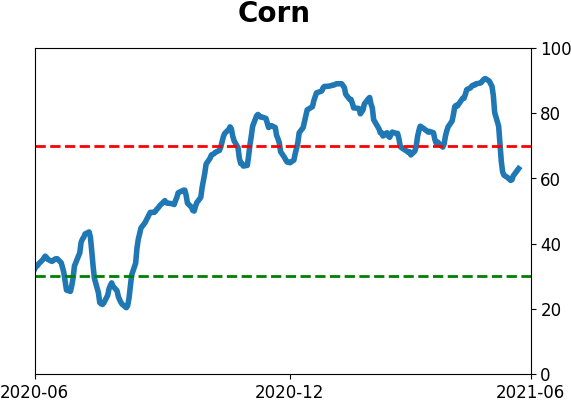
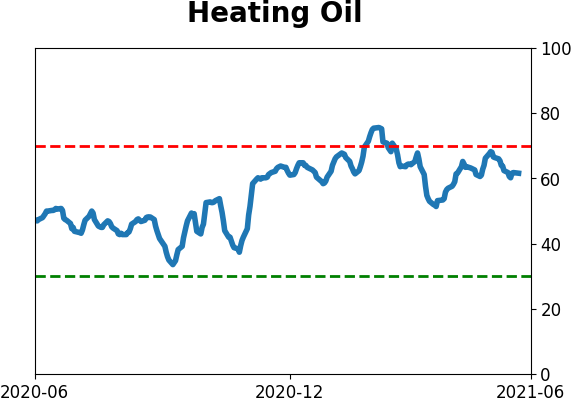
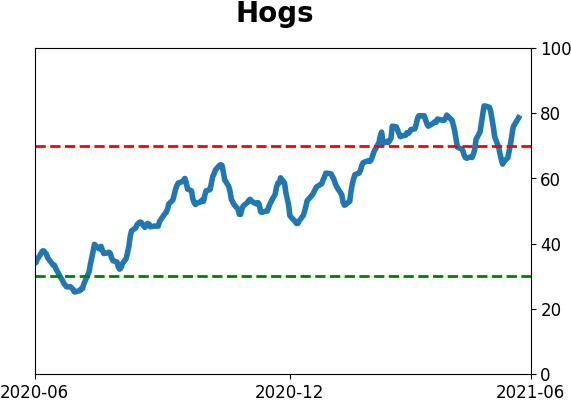
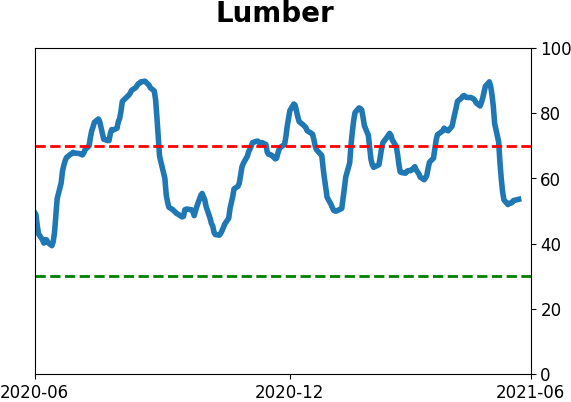
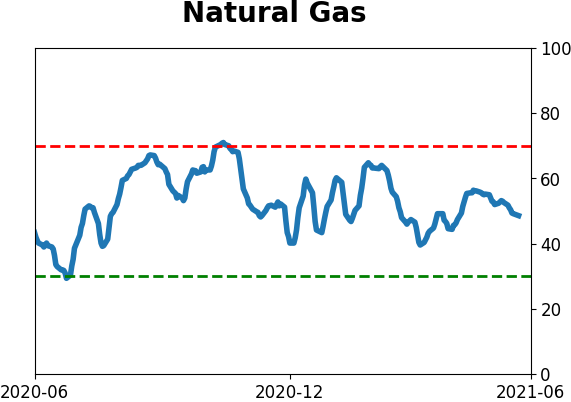
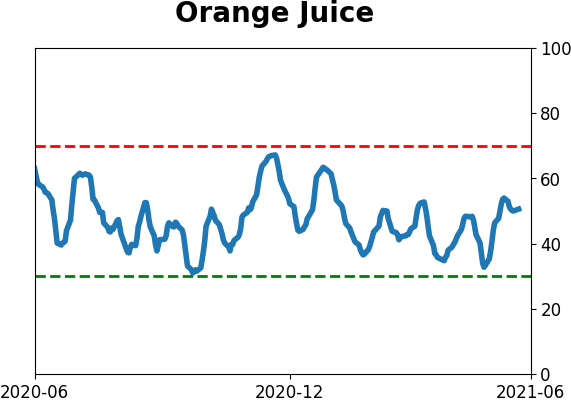
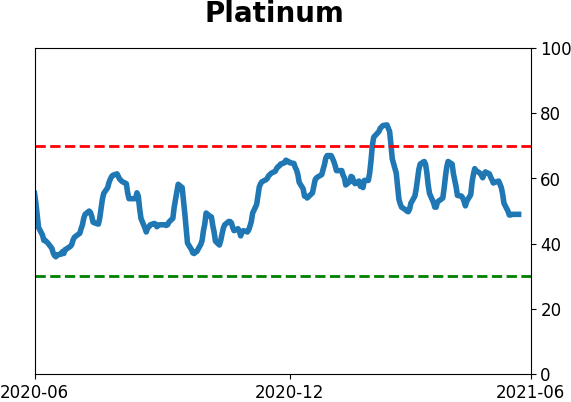
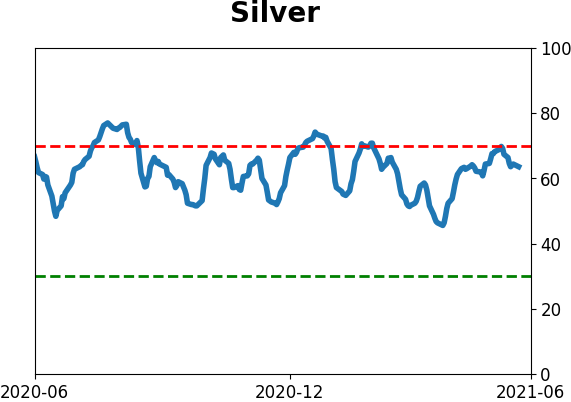
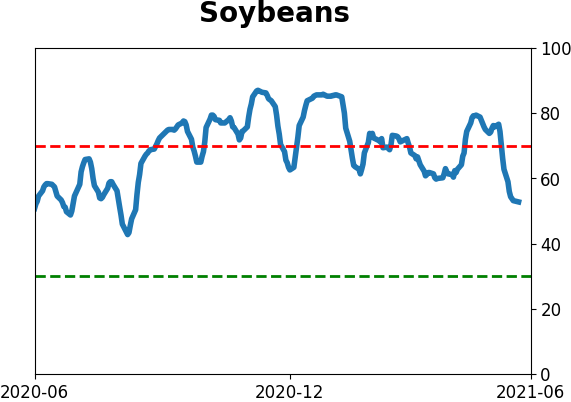
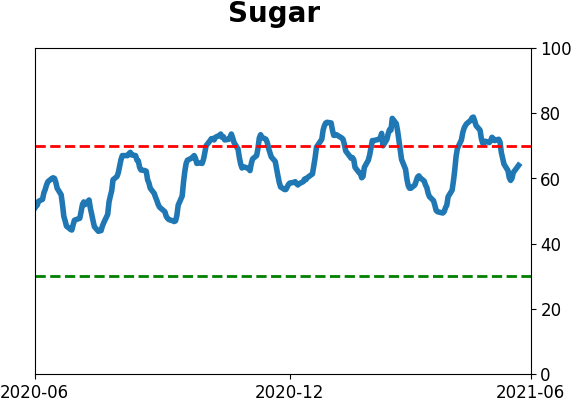
Commodity ETF's - 5-Day Moving Average
|
|