Headlines
|
|
Investors have been clamoring for the strongest stocks:
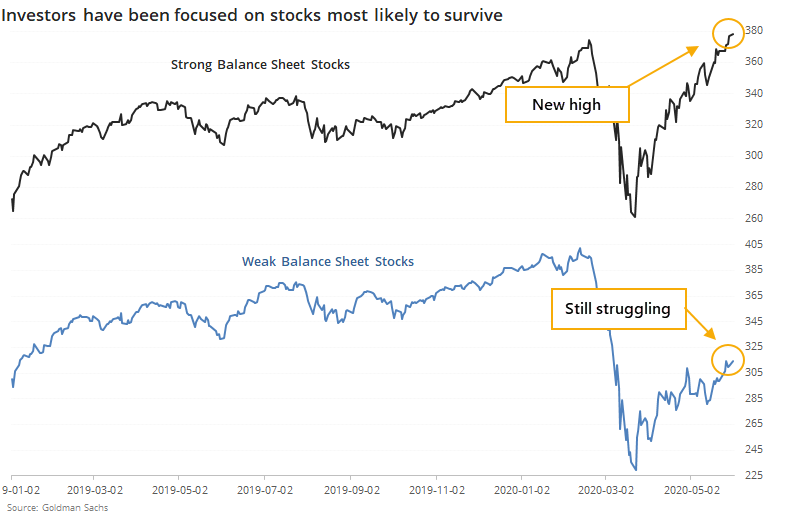
Stocks with the strongest balance sheets have greatly outperformed those with weak balance sheets over the past couple of months. They've outperformed the broader market, too. An index of these strong stocks just hit a new all-time high.
Over the past 2 weeks, another historic thrust:
Over the past two weeks, an overwhelming number of issues on the NYSE have advanced. This kind of a broad-based rally, for this prolonged period, has led to consistently positive long-term returns. When we see it occur after an oversold reading as we have, it has a perfect record.
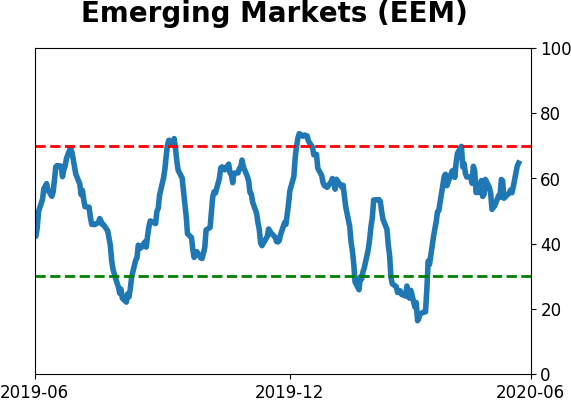
Emerging markets jump again: The EEM emerging markets fund enjoyed another great day on Tuesday, putting together its 3rd straight session with more than a 1.7% gain. Since its 2003 inception, this ties its longest streak of days with gains this large. The other 5 times it put together streaks like this, it continued to rise in the month(s) ahead each time, averaging an impressive 13.6% two months later. Six months later, it averaged +29.9%. The dates were 2005-11-01, 2009-04-02, 2009-09-08, 2016-02-17, and 2020-03-26.
|
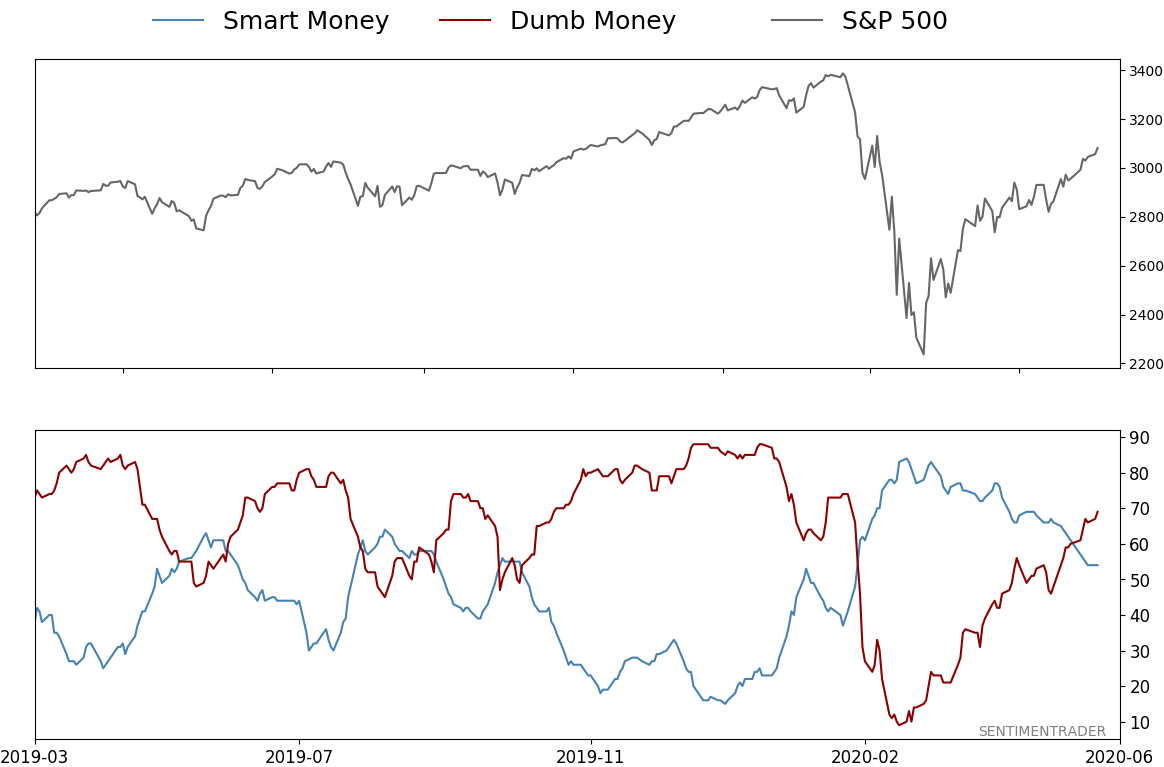
Smart / Dumb Money Confidence
|
Smart Money Confidence: 54%
Dumb Money Confidence: 69%
|
|
Risk Levels
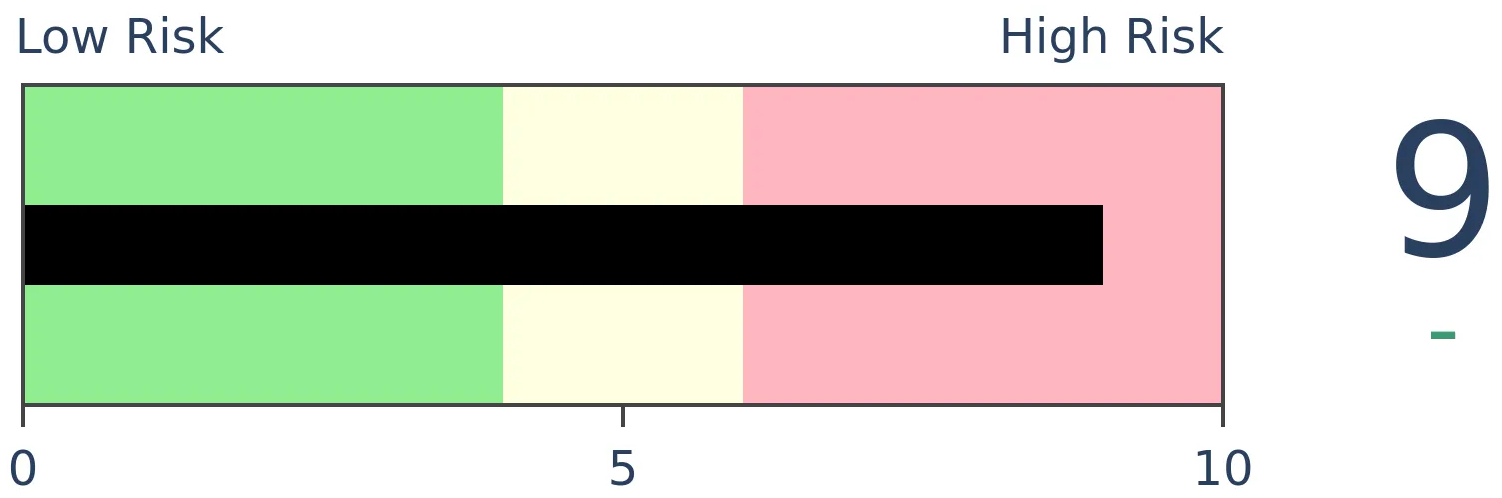
Stocks Short-Term
|
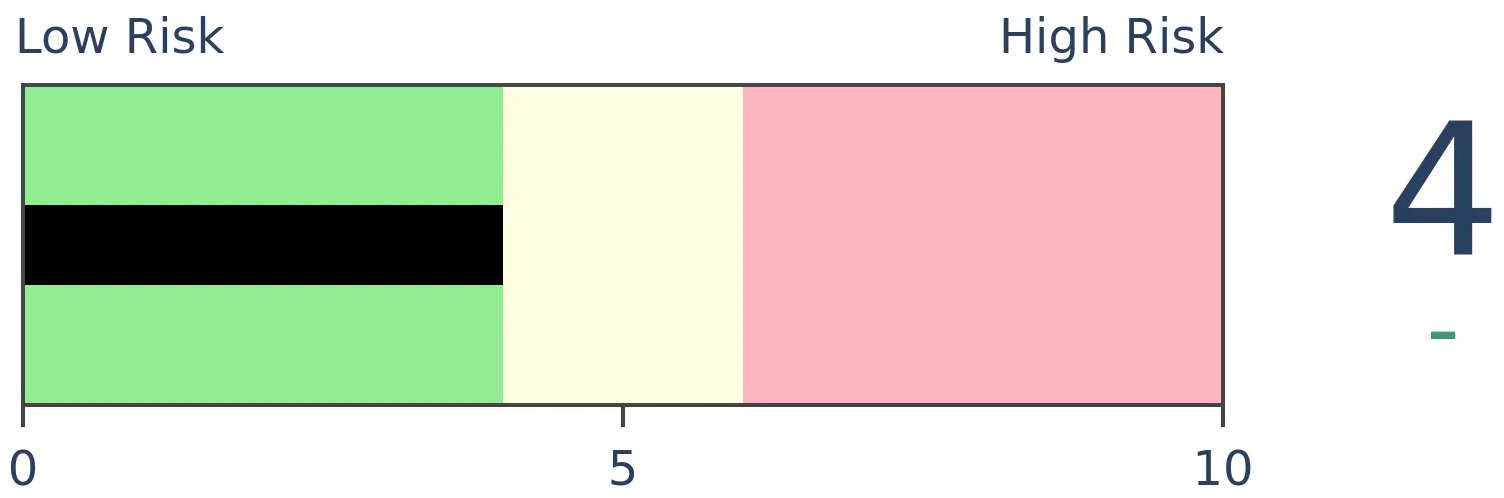
Stocks Medium-Term
|
|
Bonds

|
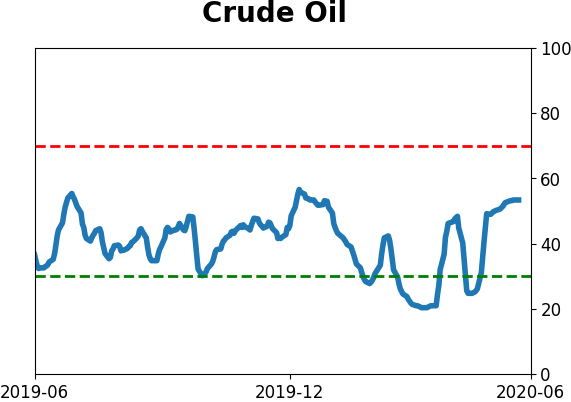
Crude Oil
|
|
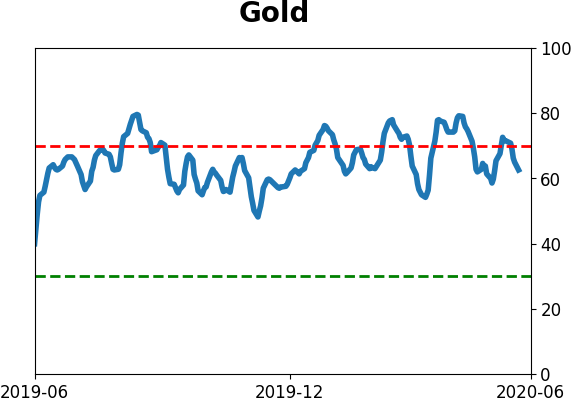
Gold
|
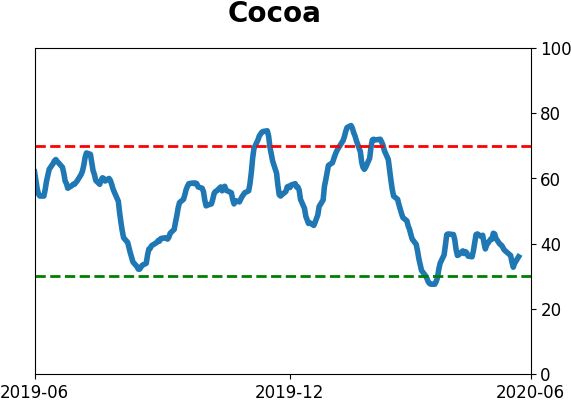
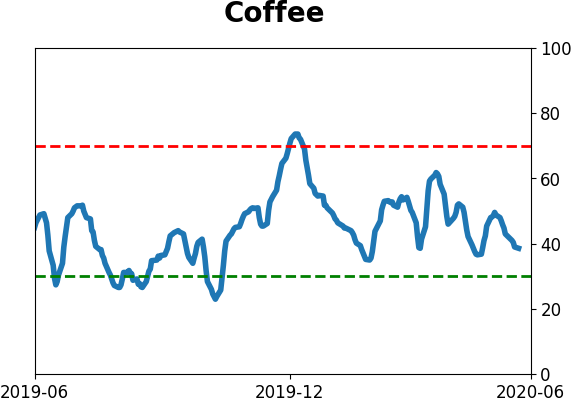
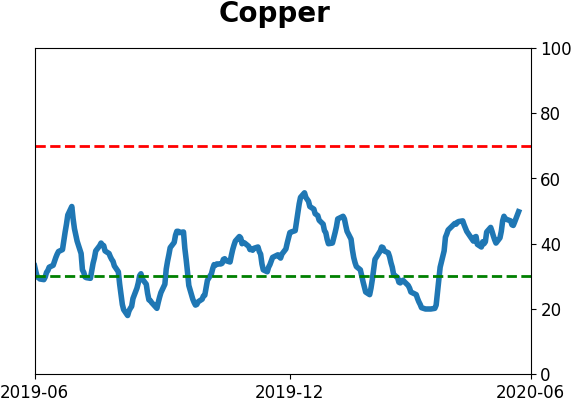
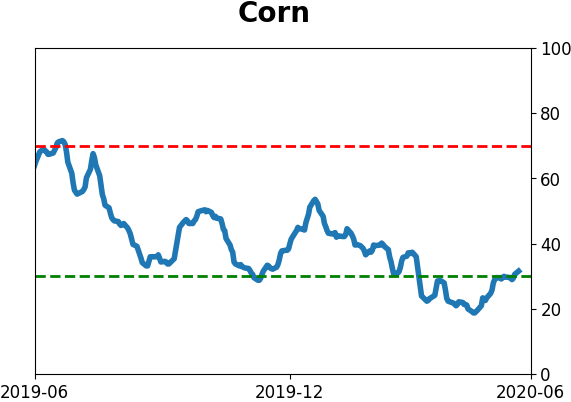
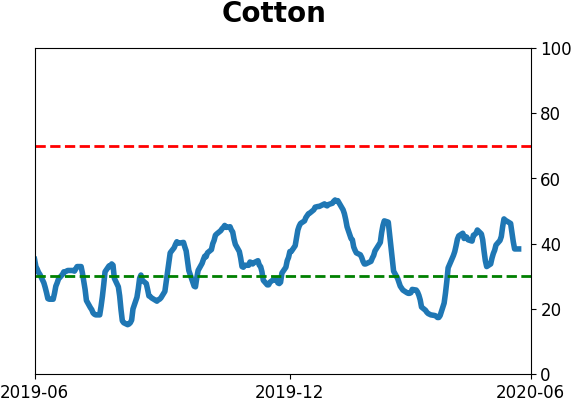
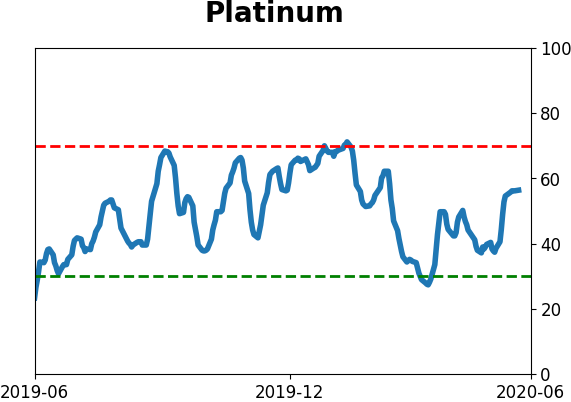
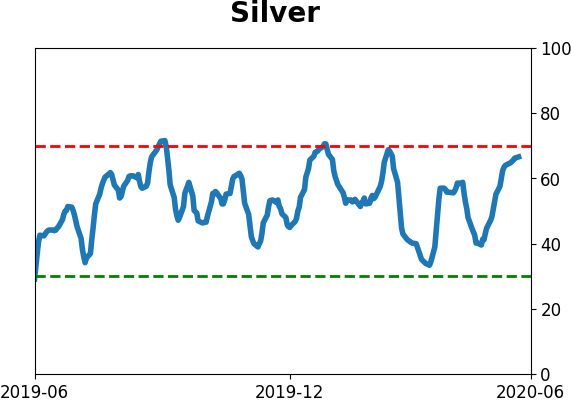
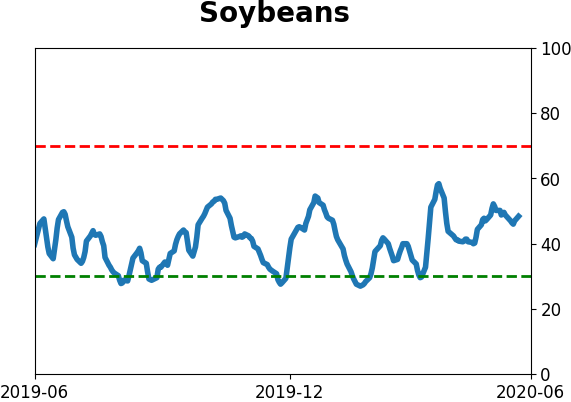
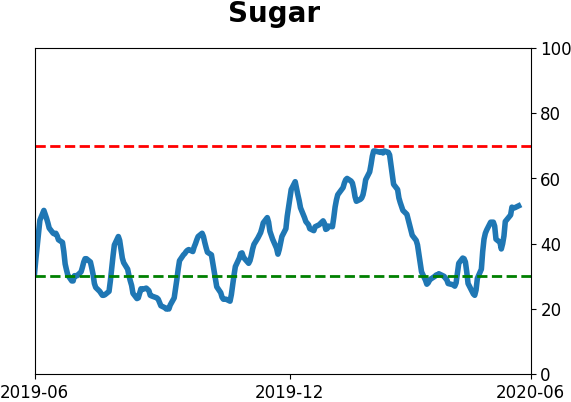
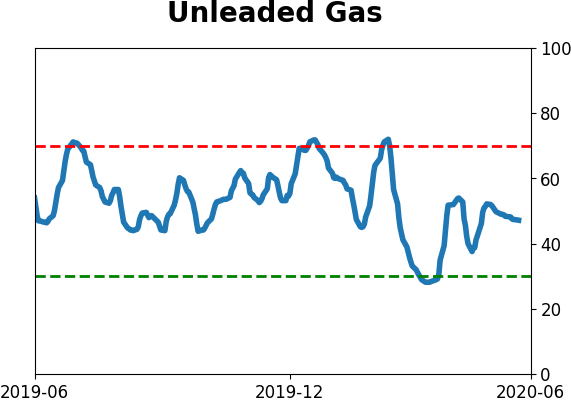
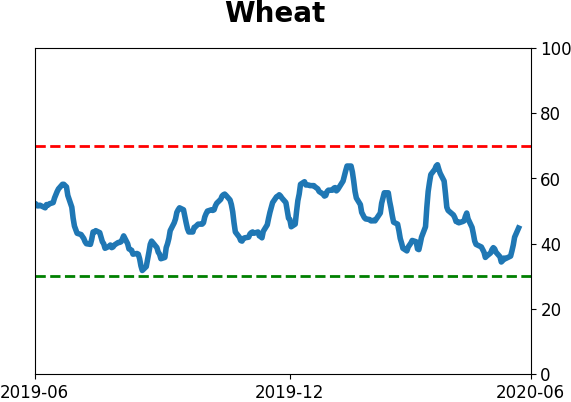
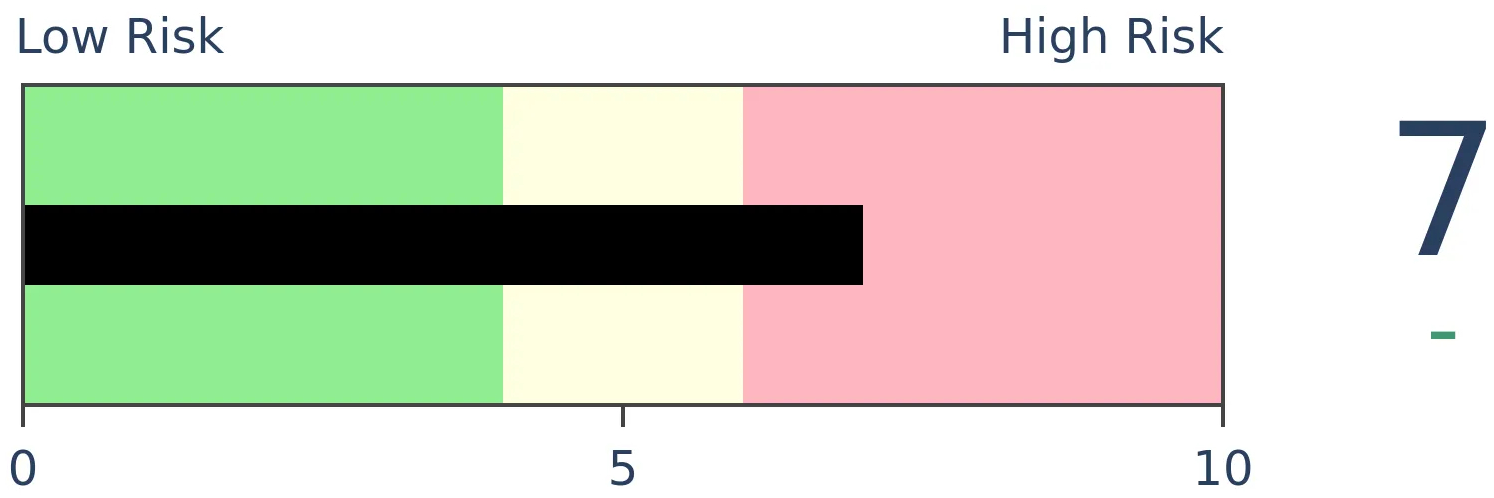
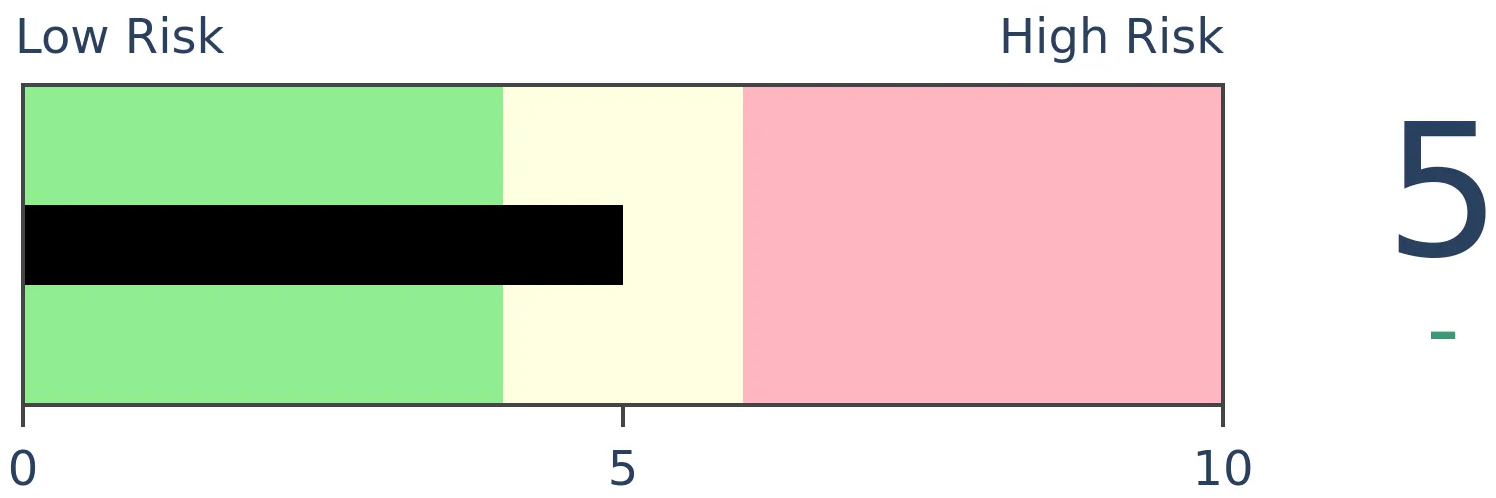
Agriculture
|
|
Research
BOTTOM LINE
Stocks with the strongest balance sheets have greatly outperformed those with weak balance sheets over the past couple of months. They've outperformed the broader market, too. An index of these strong stocks just hit a new all-time high.
FORECAST / TIMEFRAME
None
|
Investors have been piling into stocks, at least judging by the major indexes hitting continual new highs for this recovery.
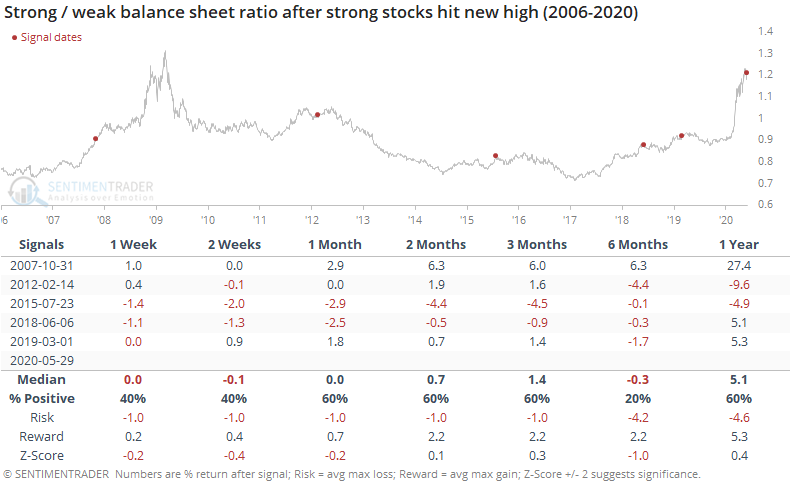
Not all stocks are created equal, and investors have seemingly been focused on those stocks most likely to survive the shakeout currently in progress. An index of stocks with strong balance sheets just hit a new high, fully recovering from the pandemic decline. Those with weak balance sheets are still struggling.
Per Goldman Sachs:
"Our Strong Balance Sheet basket identifies 50 S&P 500 companies across eight sectors with strong balance sheets. We use the Altman Z-score to measure balance sheet strength. The Z-score is a weighted sum of five financial ratios and was originally developed to forecast bankruptcies.
Our Weak Balance Sheet basket identifies 50 S&P 500 companies across eight sectors with weak balance sheets ... As the credit environment tightens, these firms will be less likely to have access to funds needed to invest in growth."
We can see the huge disparity between them below.
The data for these only go back to 2006, so history is limited. In those 14 years, there has never been a time when strong balance sheet stocks reached a 52-week high while weak ones were more than 10% below their own high. There was never a time when they hit a high and the S&P 500 was more than 5% below its high, either.
If we look for times when there was a smaller divergence, when both the S&P and weak balance sheet stocks were more than 1% off their highs while strong balance sheet stocks broke out to the upside, it hasn't necessarily been a great sign.
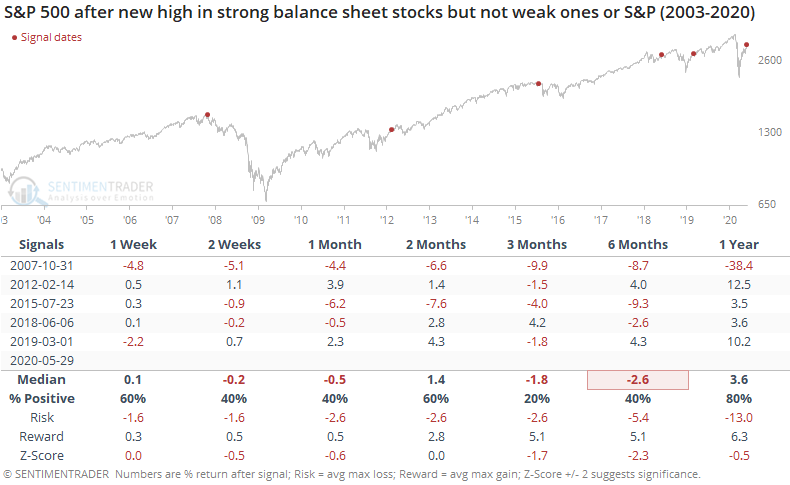
The S&P showed a negative return at some point over the next 1-3 months every time. Again, the sample size is tiny and history is limited, so we can't put too much weight on this, but it looks to be a modest short- to medium-term negative.
On a relative basis, strong balance sheet stocks had a mixed record relative to weak balance sheet stocks, but over the next 6 months, they underperformed (suggesting that investors shifted toward stocks with weaker balance sheets as stocks).
After leading as they have, strong balance sheet stocks had a mixed-to-poor record at continuing to outperform the broader market.
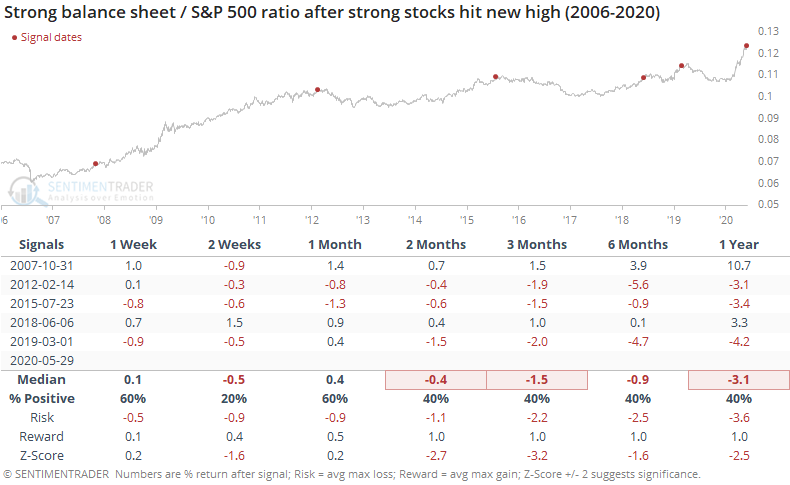
Across most time frames, strong balance sheet stocks showed only a slight outperformance at best against the S&P 500.
Overall, we're limited by a small sample and limited history, but the recent preference for stocks with strong balance sheets looks to be a minor negative for the broader market over the medium-term, but that's about it. By the time it has reached this stage, the strong balance sheet stocks have become stretched relative to their opposites, and the broader market, and had a tendency to underperform.
BOTTOM LINE
Over the past two weeks, an overwhelming number of issues on the NYSE have advanced. This kind of a broad-based rally, for this prolonged period, has led to consistently positive long-term returns. When we see it occur after an oversold reading as we have, it has a perfect record.
FORECAST / TIMEFRAME
SPY -- Up, Long-Term
|
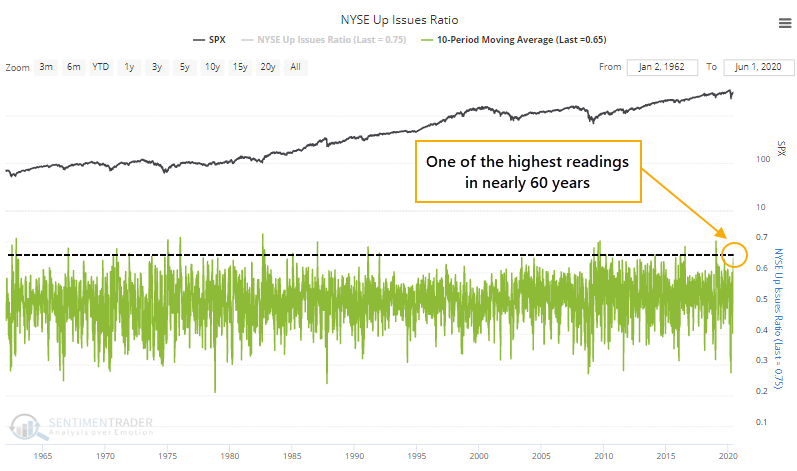
A little more than two weeks ago, the major stock indexes weren't showing much for losses, but underlying breadth was weak. The 10-day average of the NYSE Up Issues Ratio flirted with falling below the 40% threshold that suggests oversold conditions.
The rally since then has been dramatic, especially under the surface. An average day over the past two weeks has seen 65% of securities advance on the NYSE. That's a swift cycle from one extreme to the other.
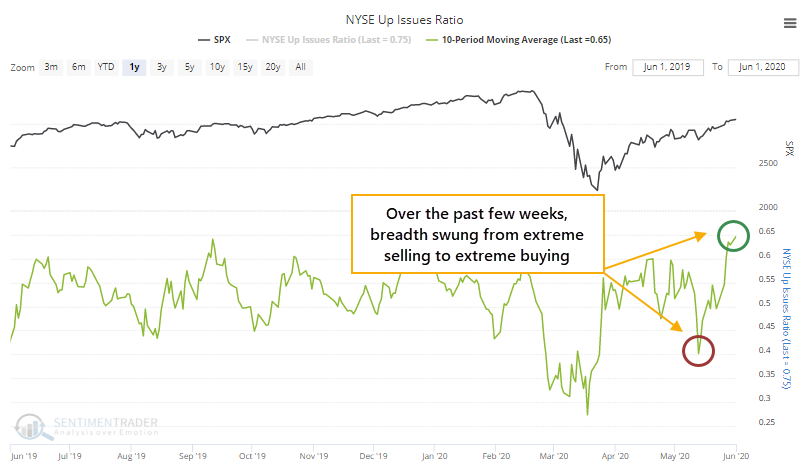
Like other breadth thrusts that we've discussed multiple times since late March, this has a very strong - perfect, in fact - tendency to lead to higher prices. It's especially pronounced over a 6-12 month time frame. The risk/reward is exceptionally positive.
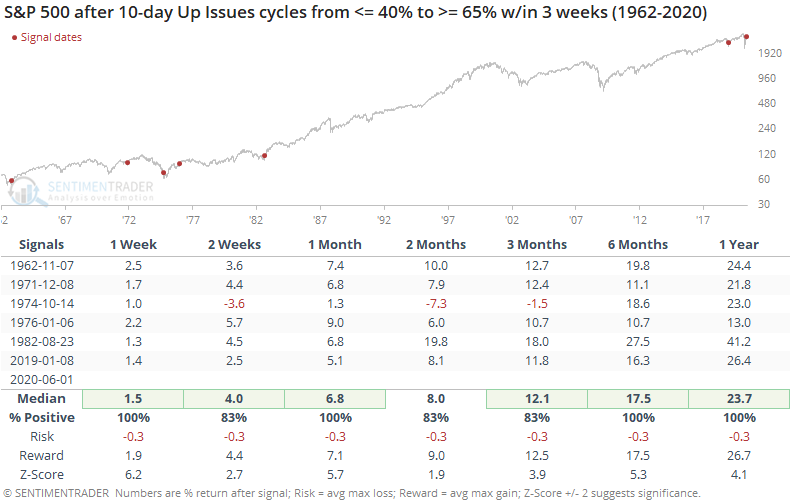
If we ignore the oversold reading from a couple of weeks ago and just look at the current level, then it's on par with some of the most extreme readings in nearly 60 years.
That simple fact has led to consistently impressive returns.
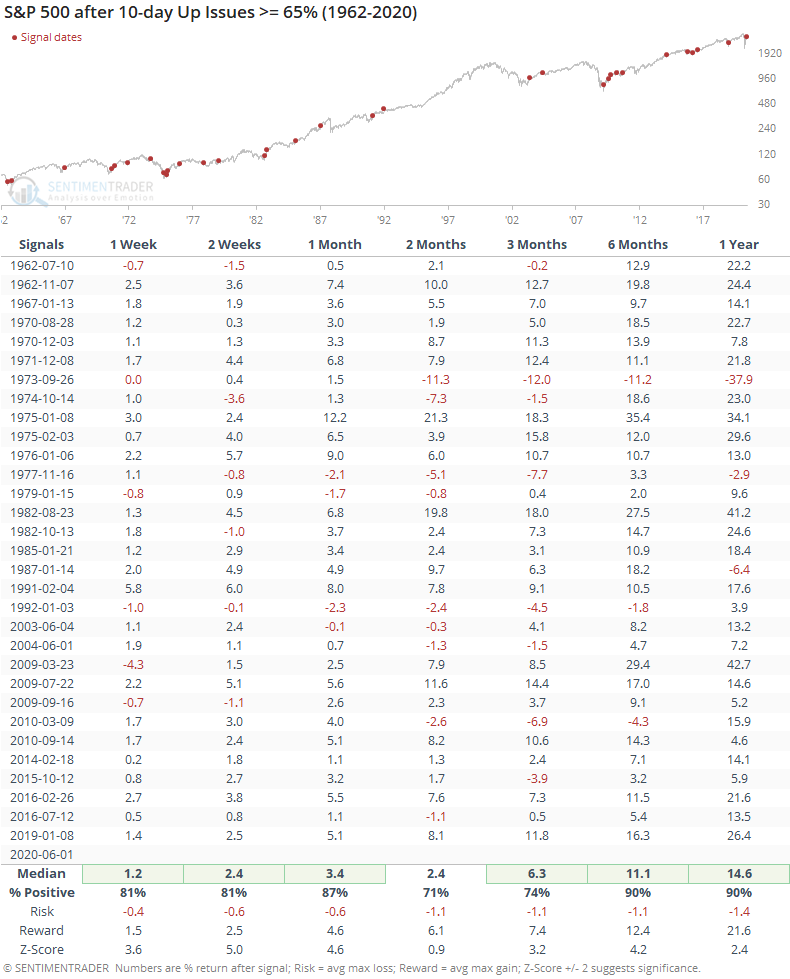
This kind of "overbought" thrust triggered in all kinds of market environments, and the context didn't really matter. When buying pressure was so great that it pushed an overwhelming number of stocks to rise over a multi-week period, it was a sign of a healthy long-term market. There were few losses over a 6-12 month time frame, and again the risk/reward was skewed heavily to the upside.
It's hard to reconcile developments like this versus some of the negatives that have popped up, especially the speculation among options traders. Those negatives are more focused on the shorter-term, while thrusts like this are more reliable on a longer-term basis. These thrusts have been the most compelling bullish argument for two months now and show no sign of slowing down.
Active Studies
| Time Frame | Bullish | Bearish | | Short-Term | 0 | 1 | | Medium-Term | 8 | 4 | | Long-Term | 36 | 1 |
|
Indicators at Extremes
Portfolio
| Position | Weight % | Added / Reduced | Date | | Stocks | 38.9 | Reduced 10% | 2020-05-13 | | Bonds | 0.0 | Reduced 6.7% | 2020-02-28 | | Commodities | 5.1 | Added 2.4%
| 2020-02-28 | | Precious Metals | 0.0 | Reduced 3.6% | 2020-02-28 | | Special Situations | 0.0 | Reduced 31.9% | 2020-03-17 | | Cash | 56.0 | | |
|
Updates (Changes made today are underlined)
In the first months of the year, we saw manic trading activity. From big jumps in specific stocks to historic highs in retail trading activity to record highs in household confidence to almost unbelievable confidence among options traders. All of that came amid a market where the average stock couldn't keep up with their indexes. There were signs of waning momentum in stocks underlying the major averages, which started triggering technical warning signs in late January. The kinds of extremes we saw in December and January typically take months to wear away, but the type of selling in March went a long way toward getting there. When we place the kind of moves we saw into March 23 into the context of coming off an all-time high, there has been a high probability of a multi-month rebound. After stocks bottomed on the 23rd, they enjoyed a historic buying thrust and retraced a larger amount of the decline than "just a bear market rally" tends to. While other signs are mixed that panic is subsiding, those thrusts are the most encouraging sign we've seen in years. Shorter-term, there have been some warning signs popping up and our studies have stopped showing as positively skewed returns. I reduced my exposure some in late April and was looking for a pattern of lower highs and lower lows to reduce it further. With weakness on May 12, our studies turned even more negative over the short- to medium-term so I reduced a bit more. Some short-term indicators are already nearing oversold so we may get a quick rebound but it is what it is. If we see a clear pattern of lower lows, I may reduce even further in the week(s) ahead. Long-term prospects look decent because of the thrusts we saw off the low, but I'm more comfortable in cash in the interim. I'd consider adding back if we see our indicators and studies start to skew to the upside again, or if price action turns clearly better, indicating my caution is wrong.
RETURN YTD: -6.2% 2019: 12.6%, 2018: 0.6%, 2017: 3.8%, 2016: 17.1%, 2015: 9.2%, 2014: 14.5%, 2013: 2.2%, 2012: 10.8%, 2011: 16.5%, 2010: 15.3%, 2009: 23.9%, 2008: 16.2%, 2007: 7.8%
|
|
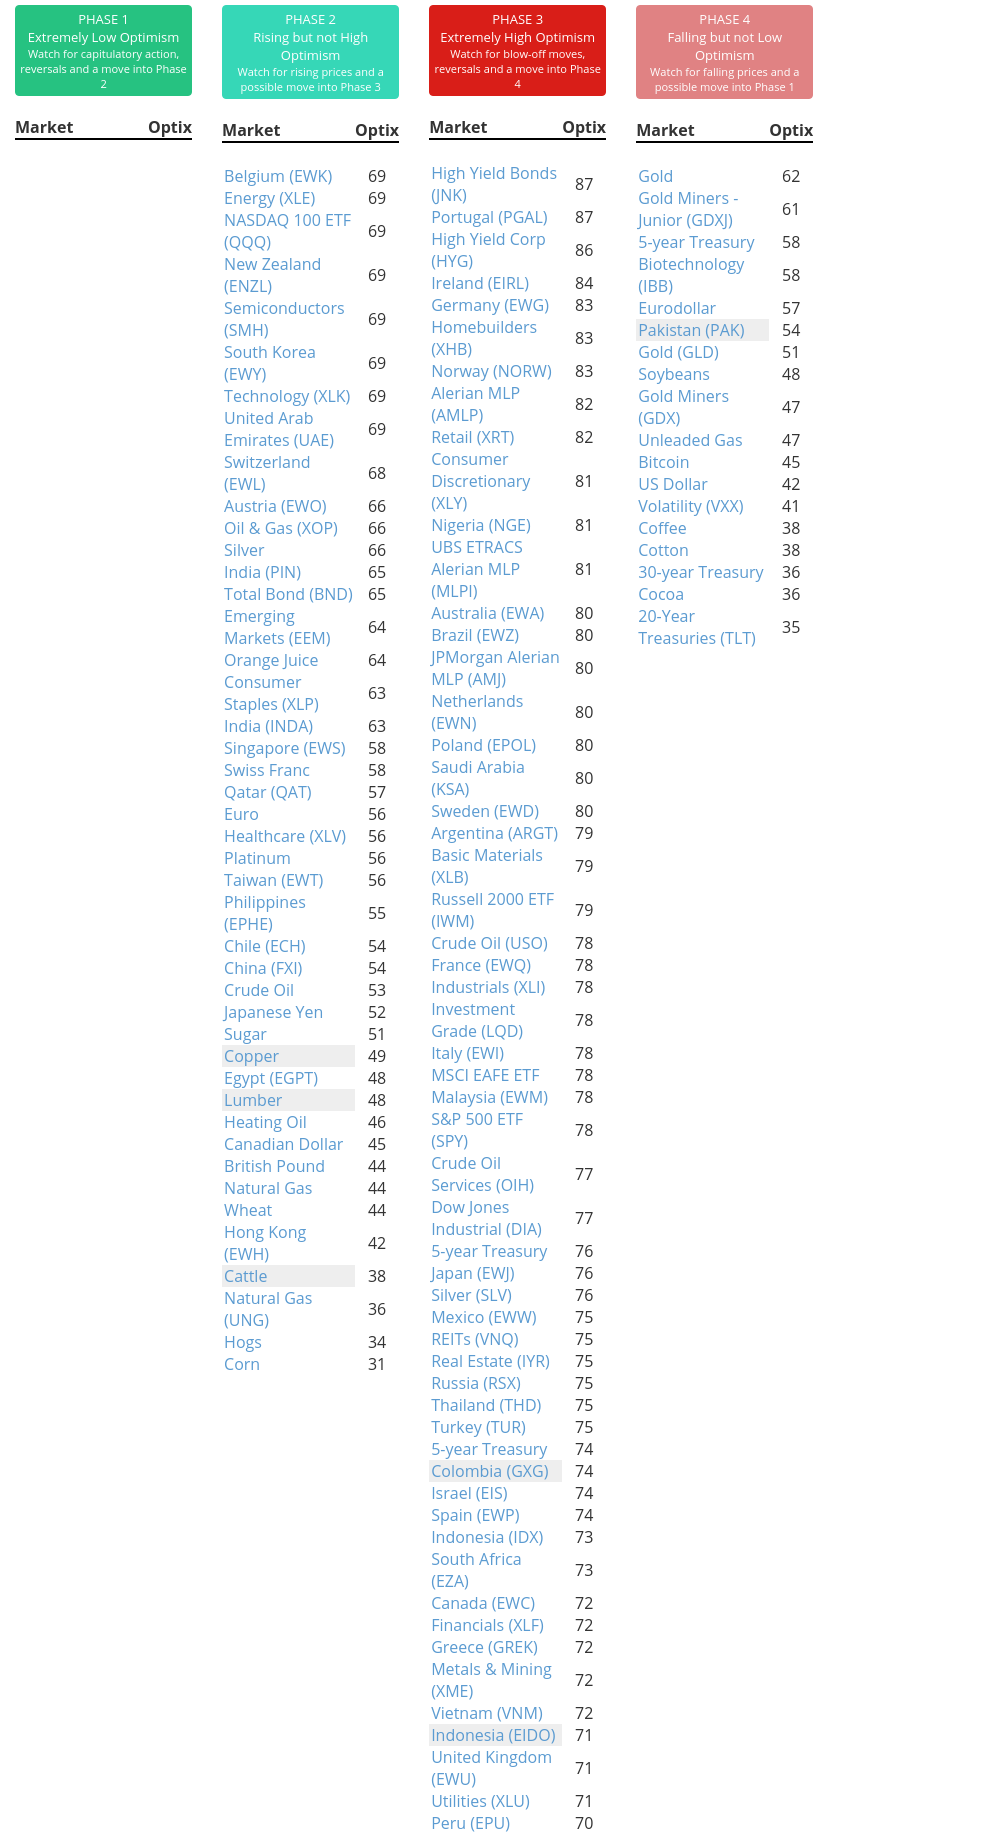
Phase Table
Ranks
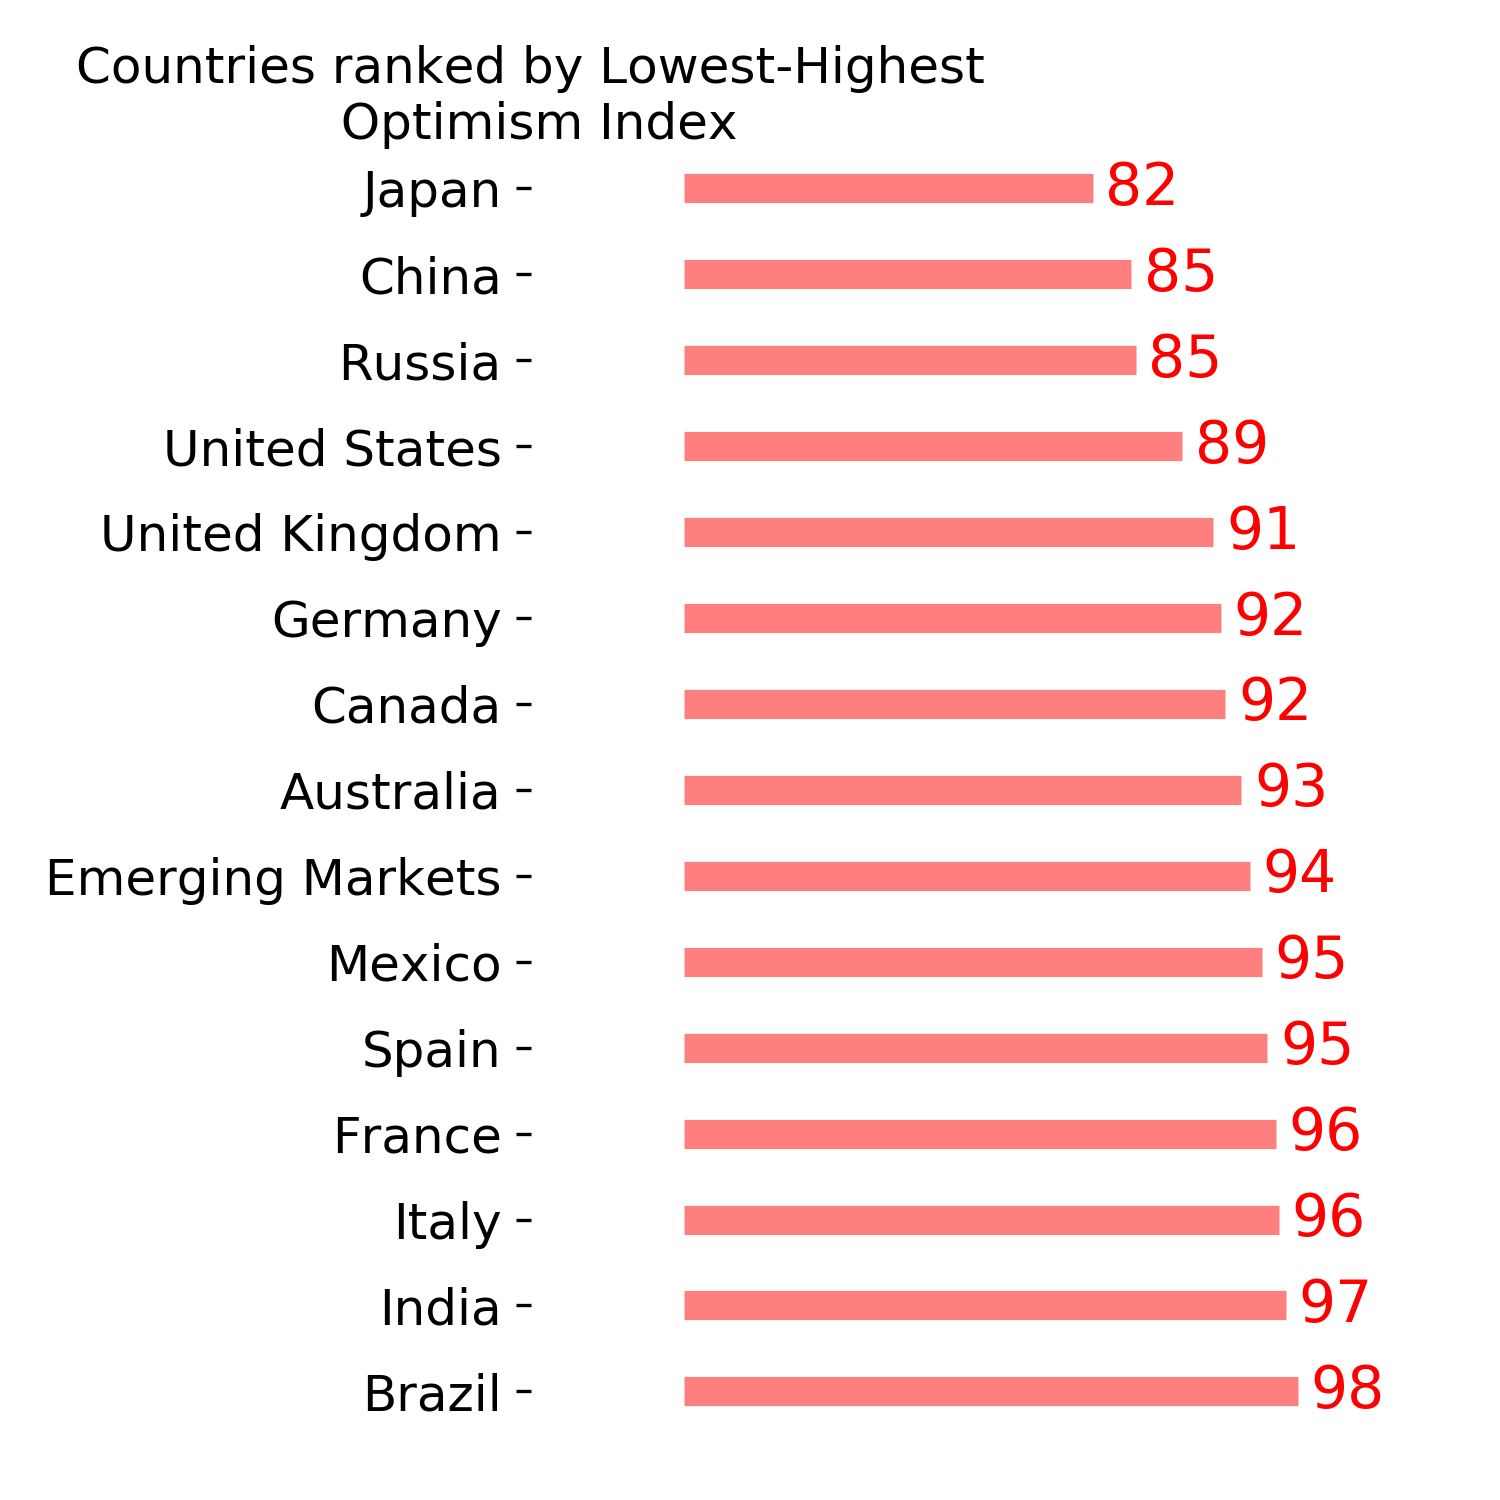
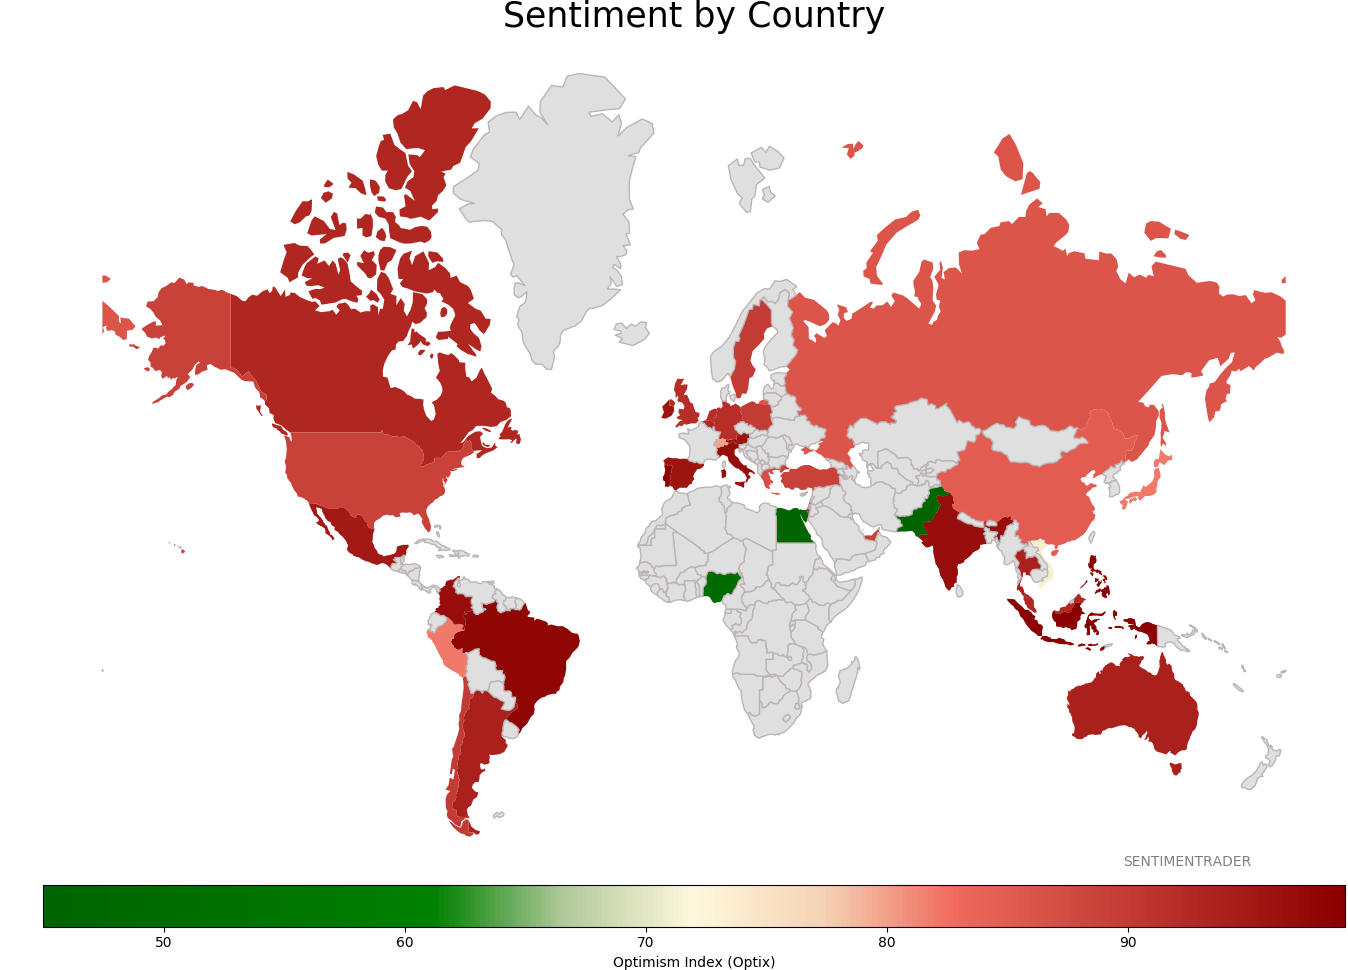
Sentiment Around The World
Optimism Index Thumbnails
|
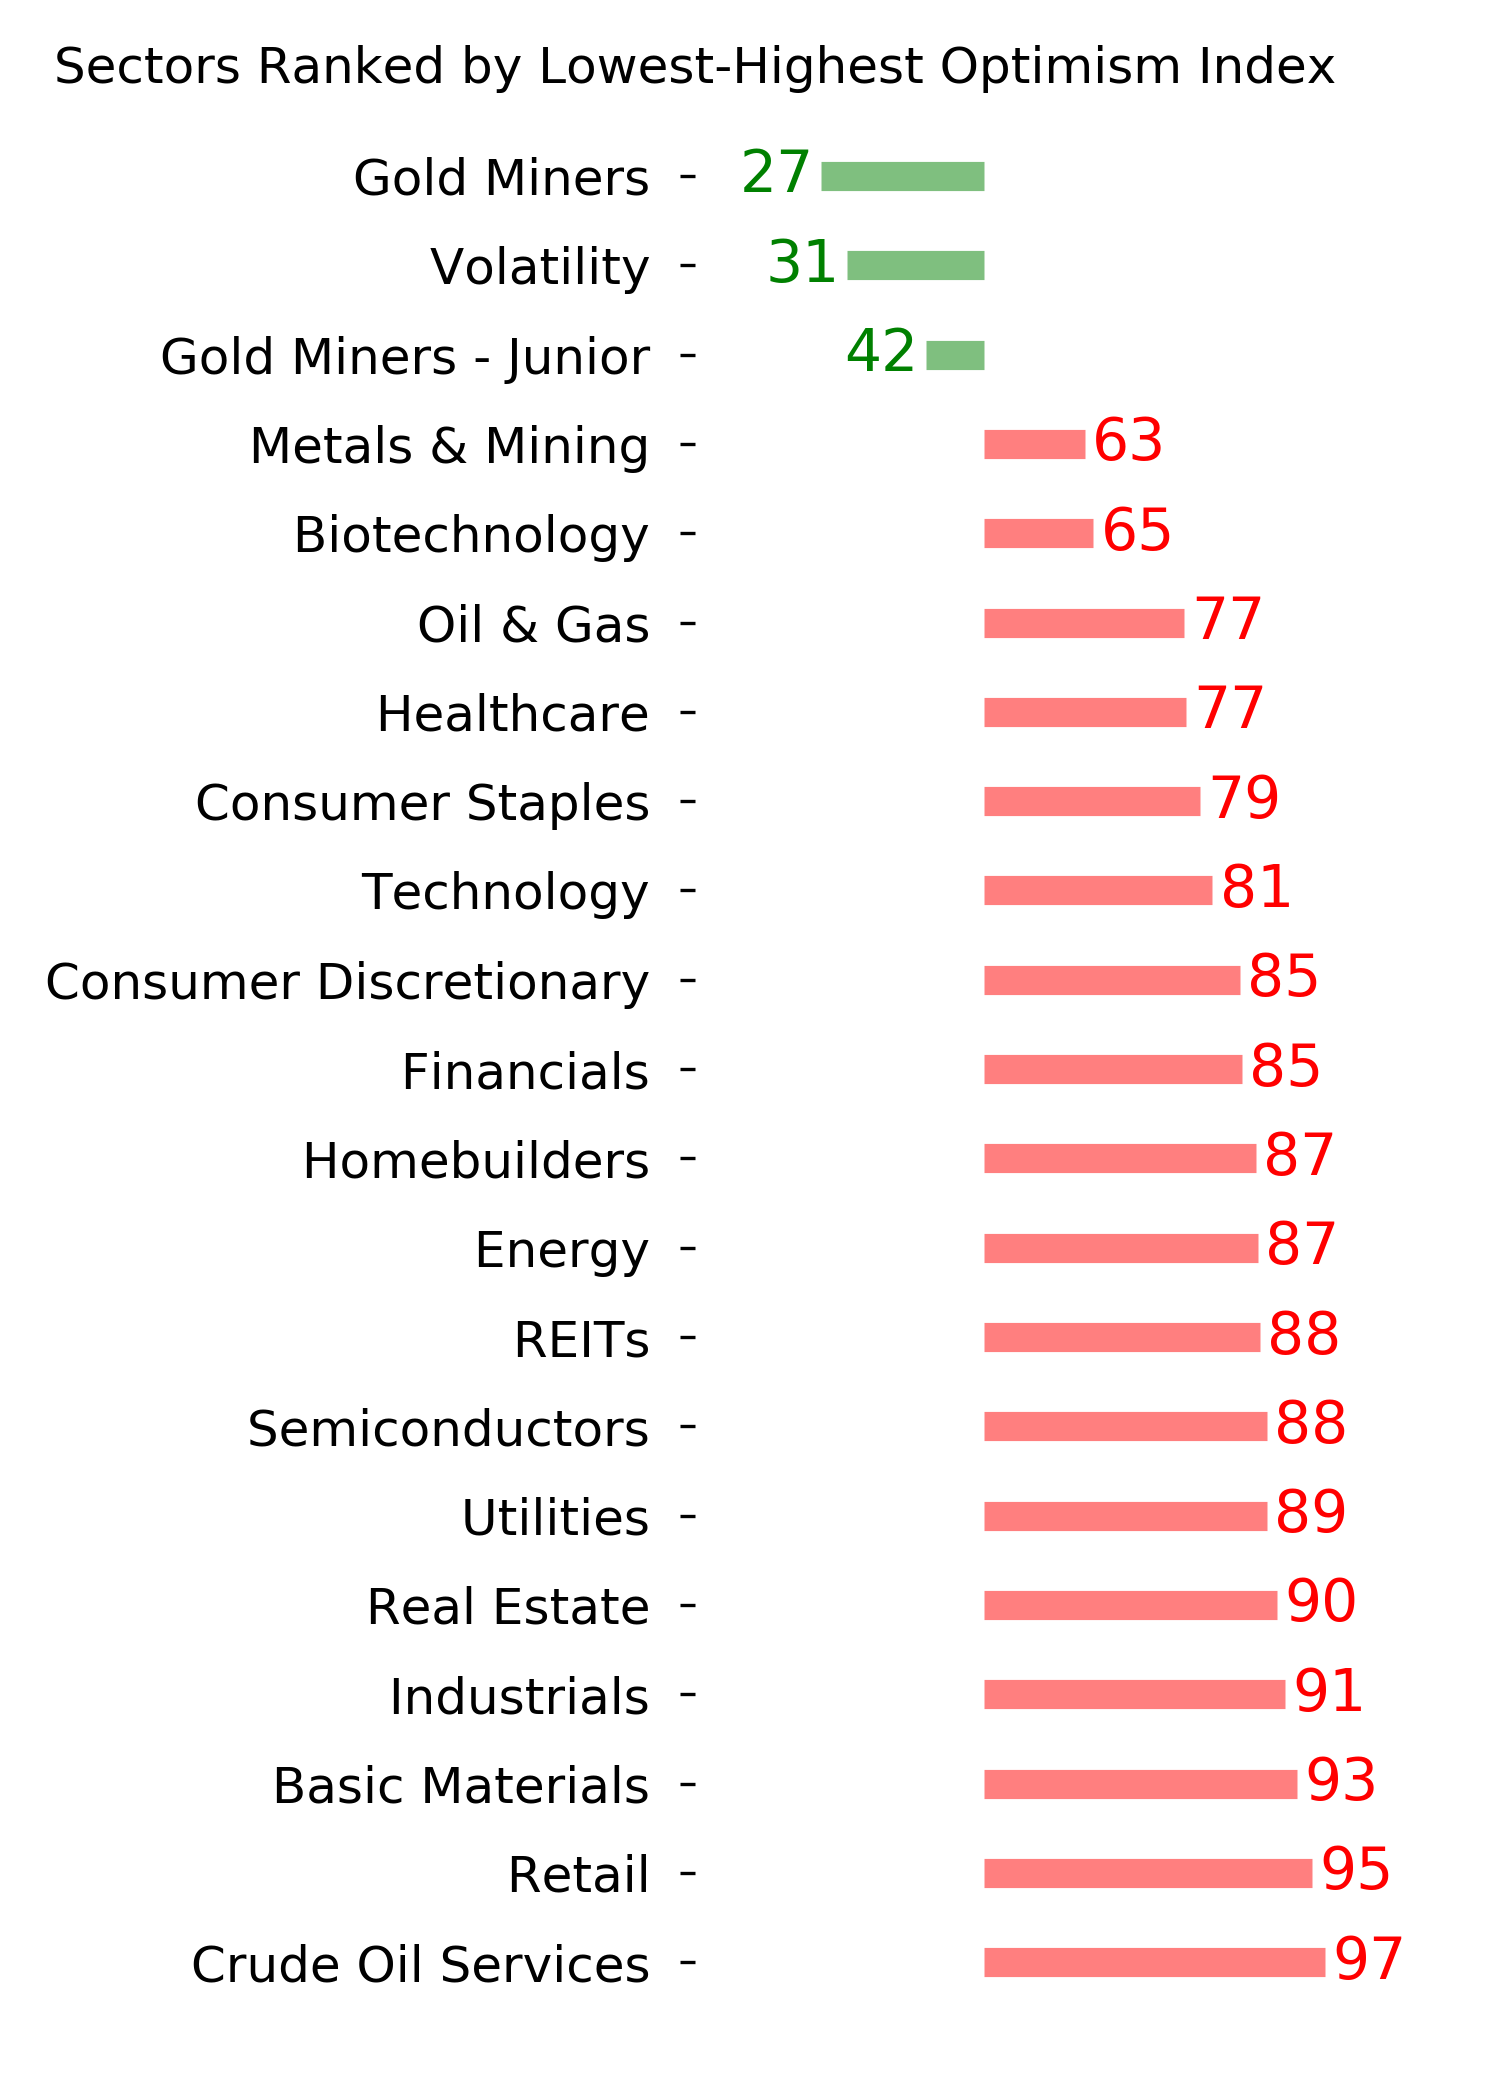
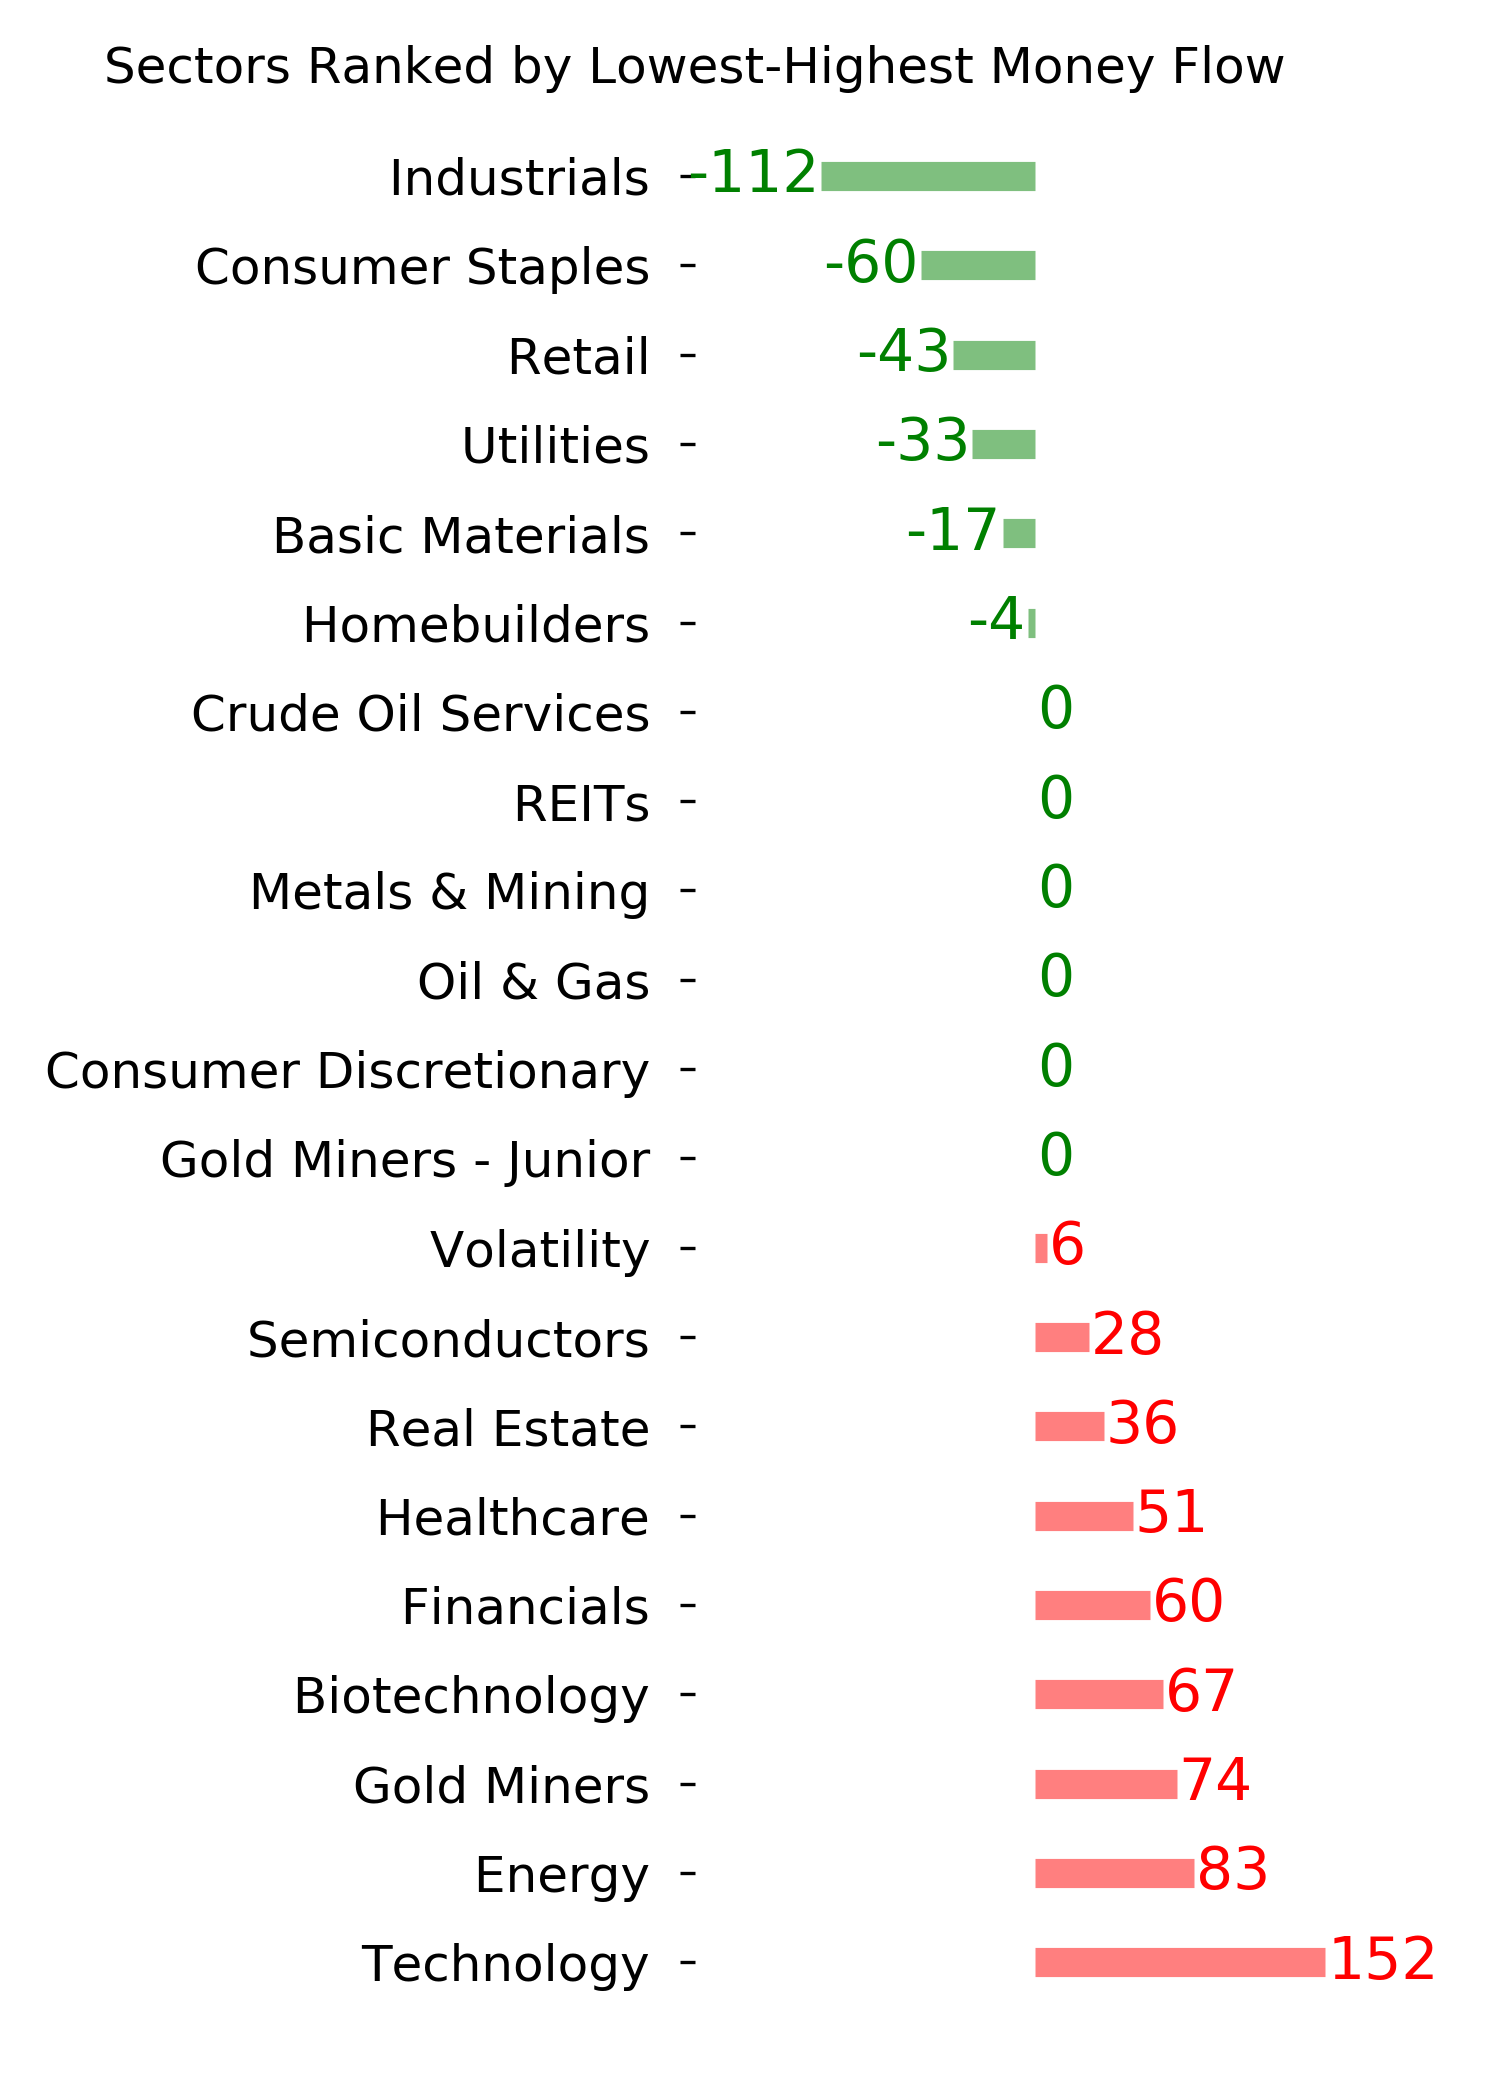
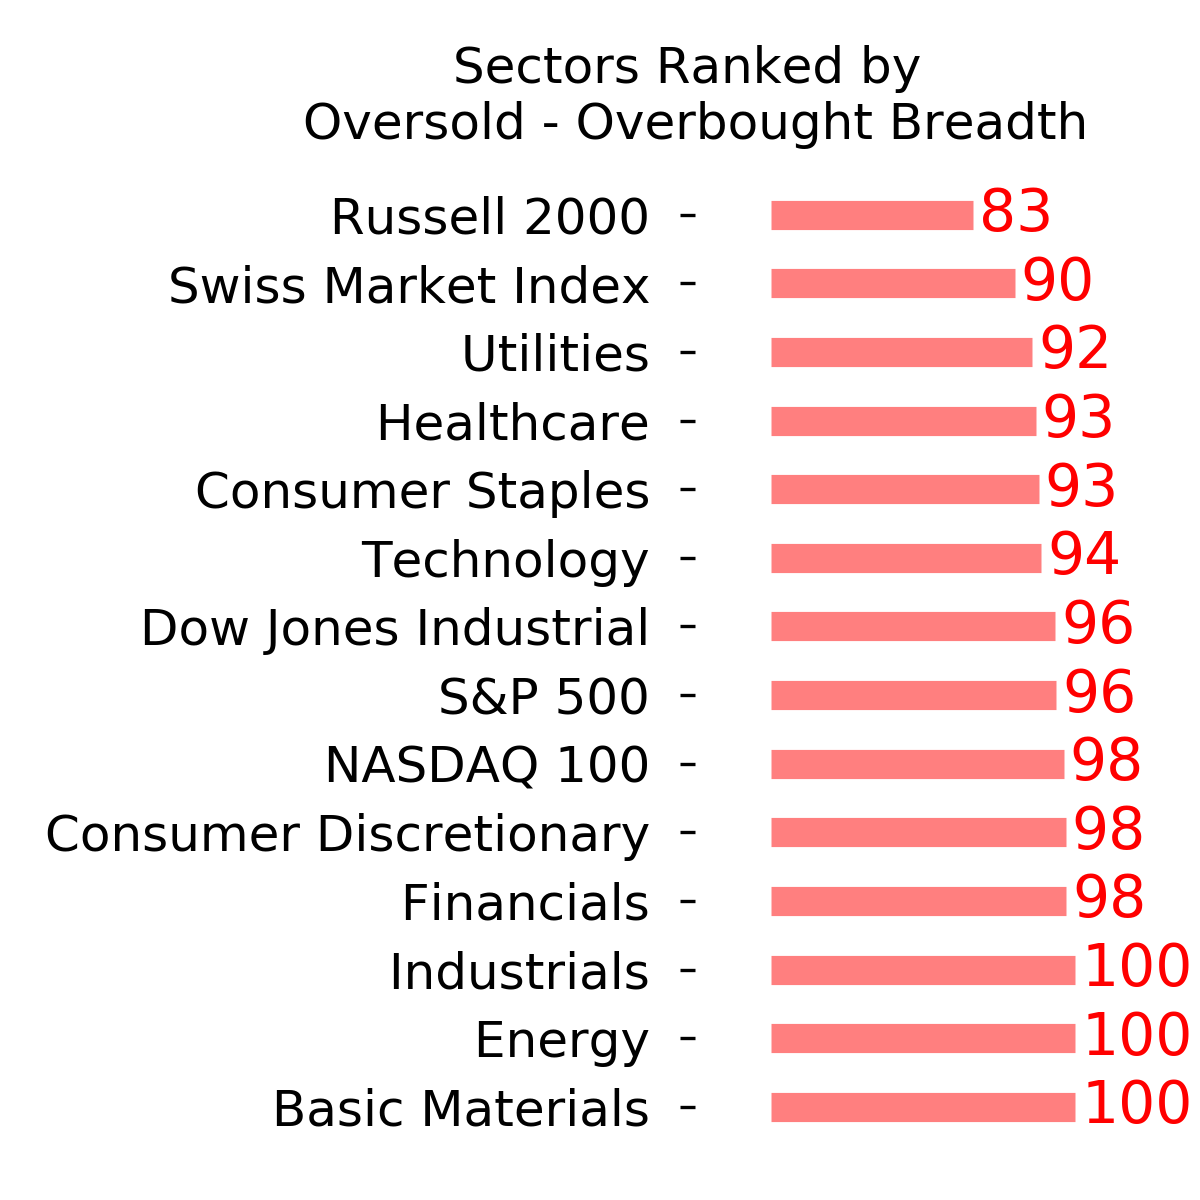
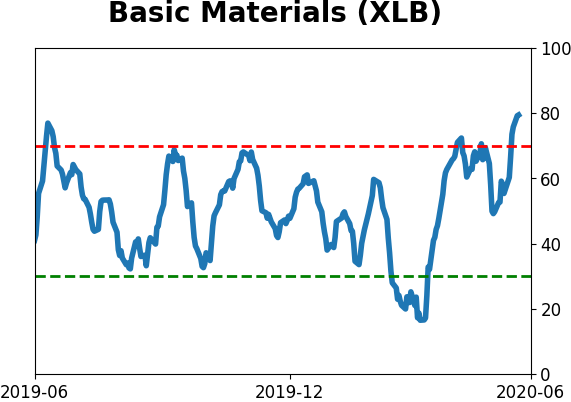
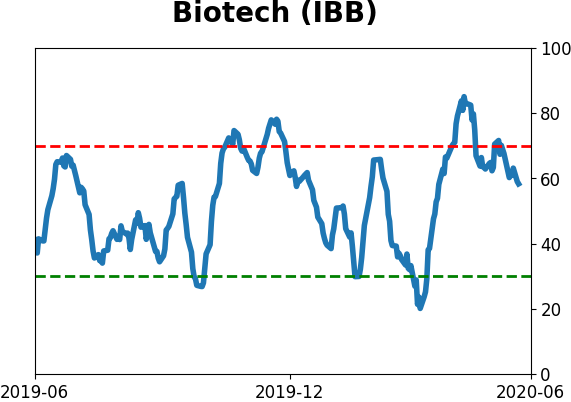
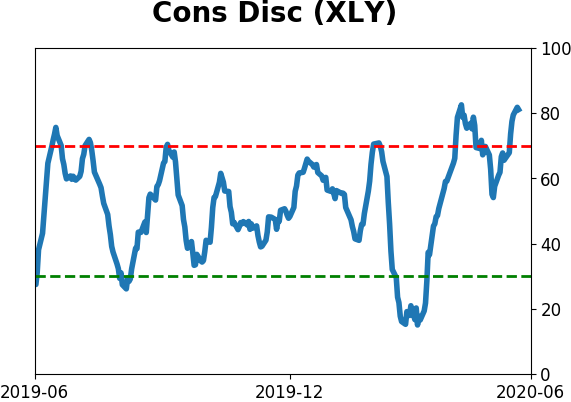
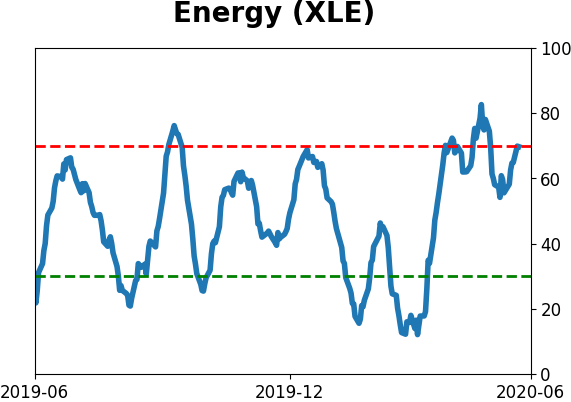
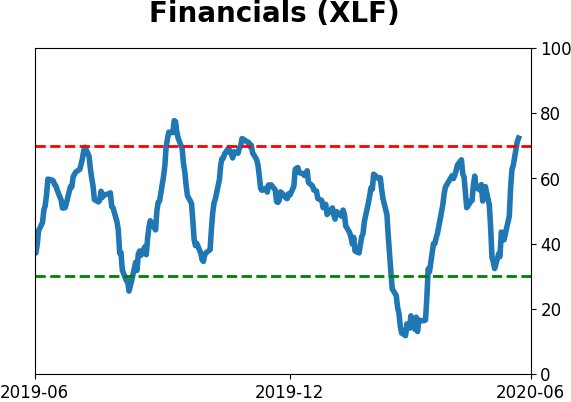
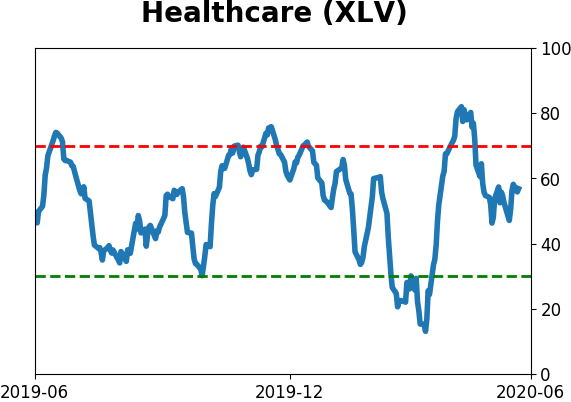
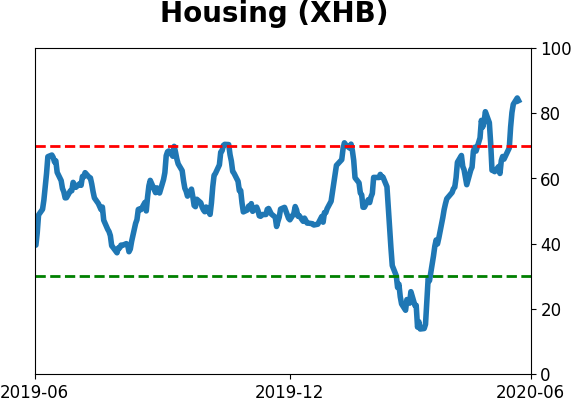
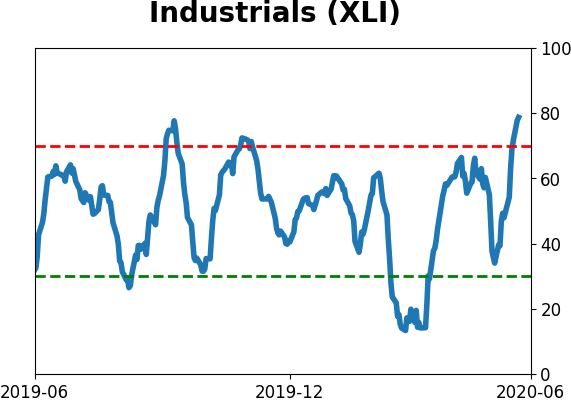
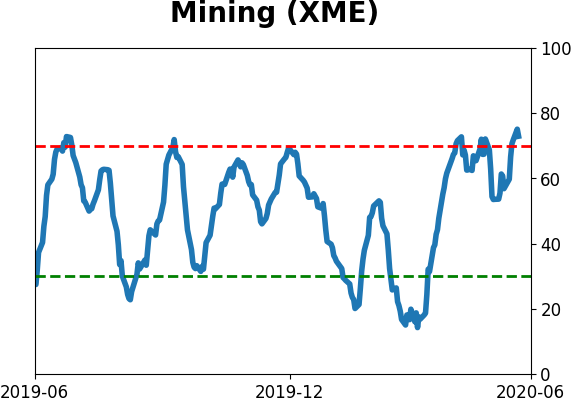
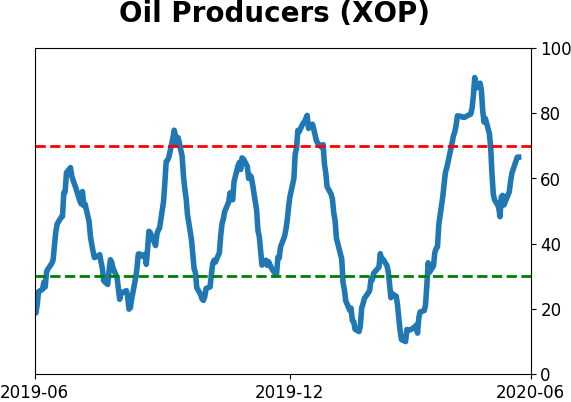
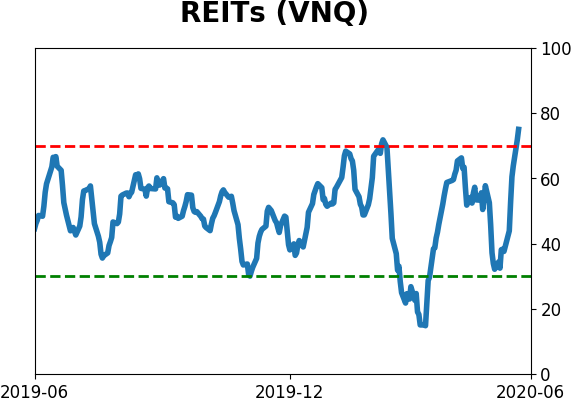
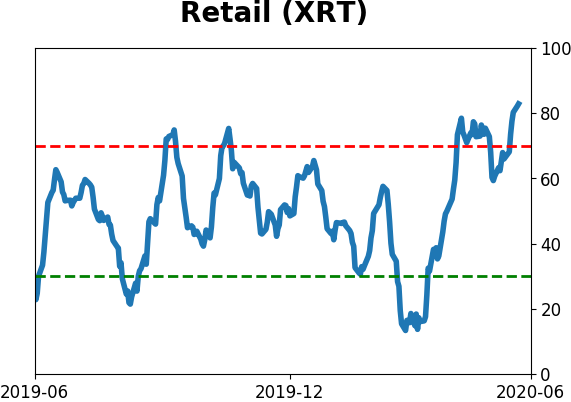
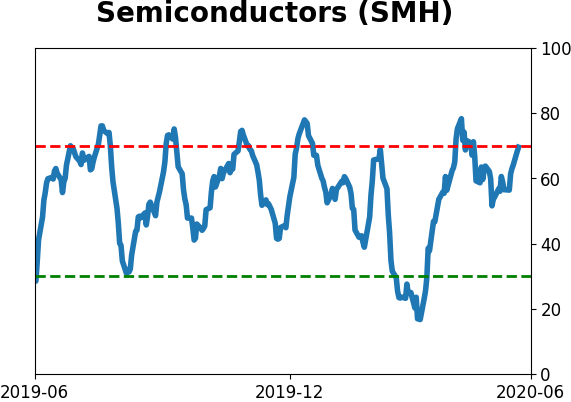
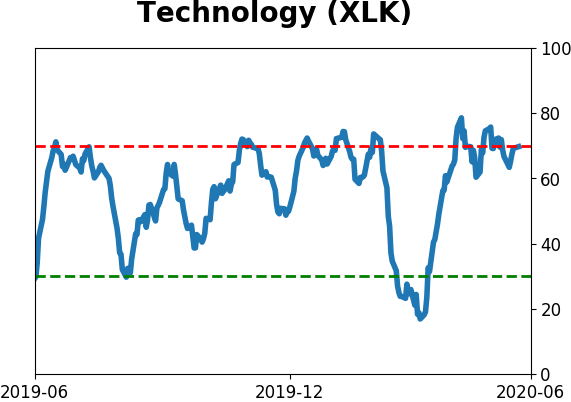
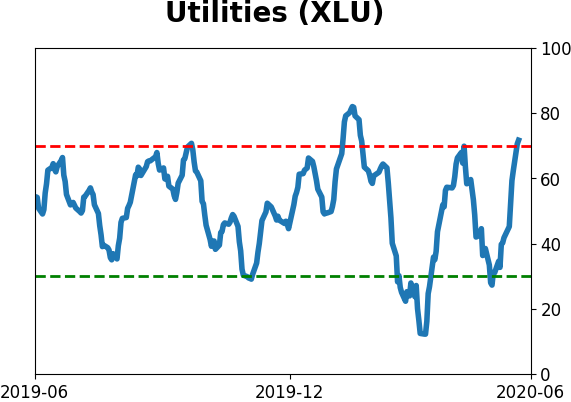
Sector ETF's - 10-Day Moving Average
|
|
|
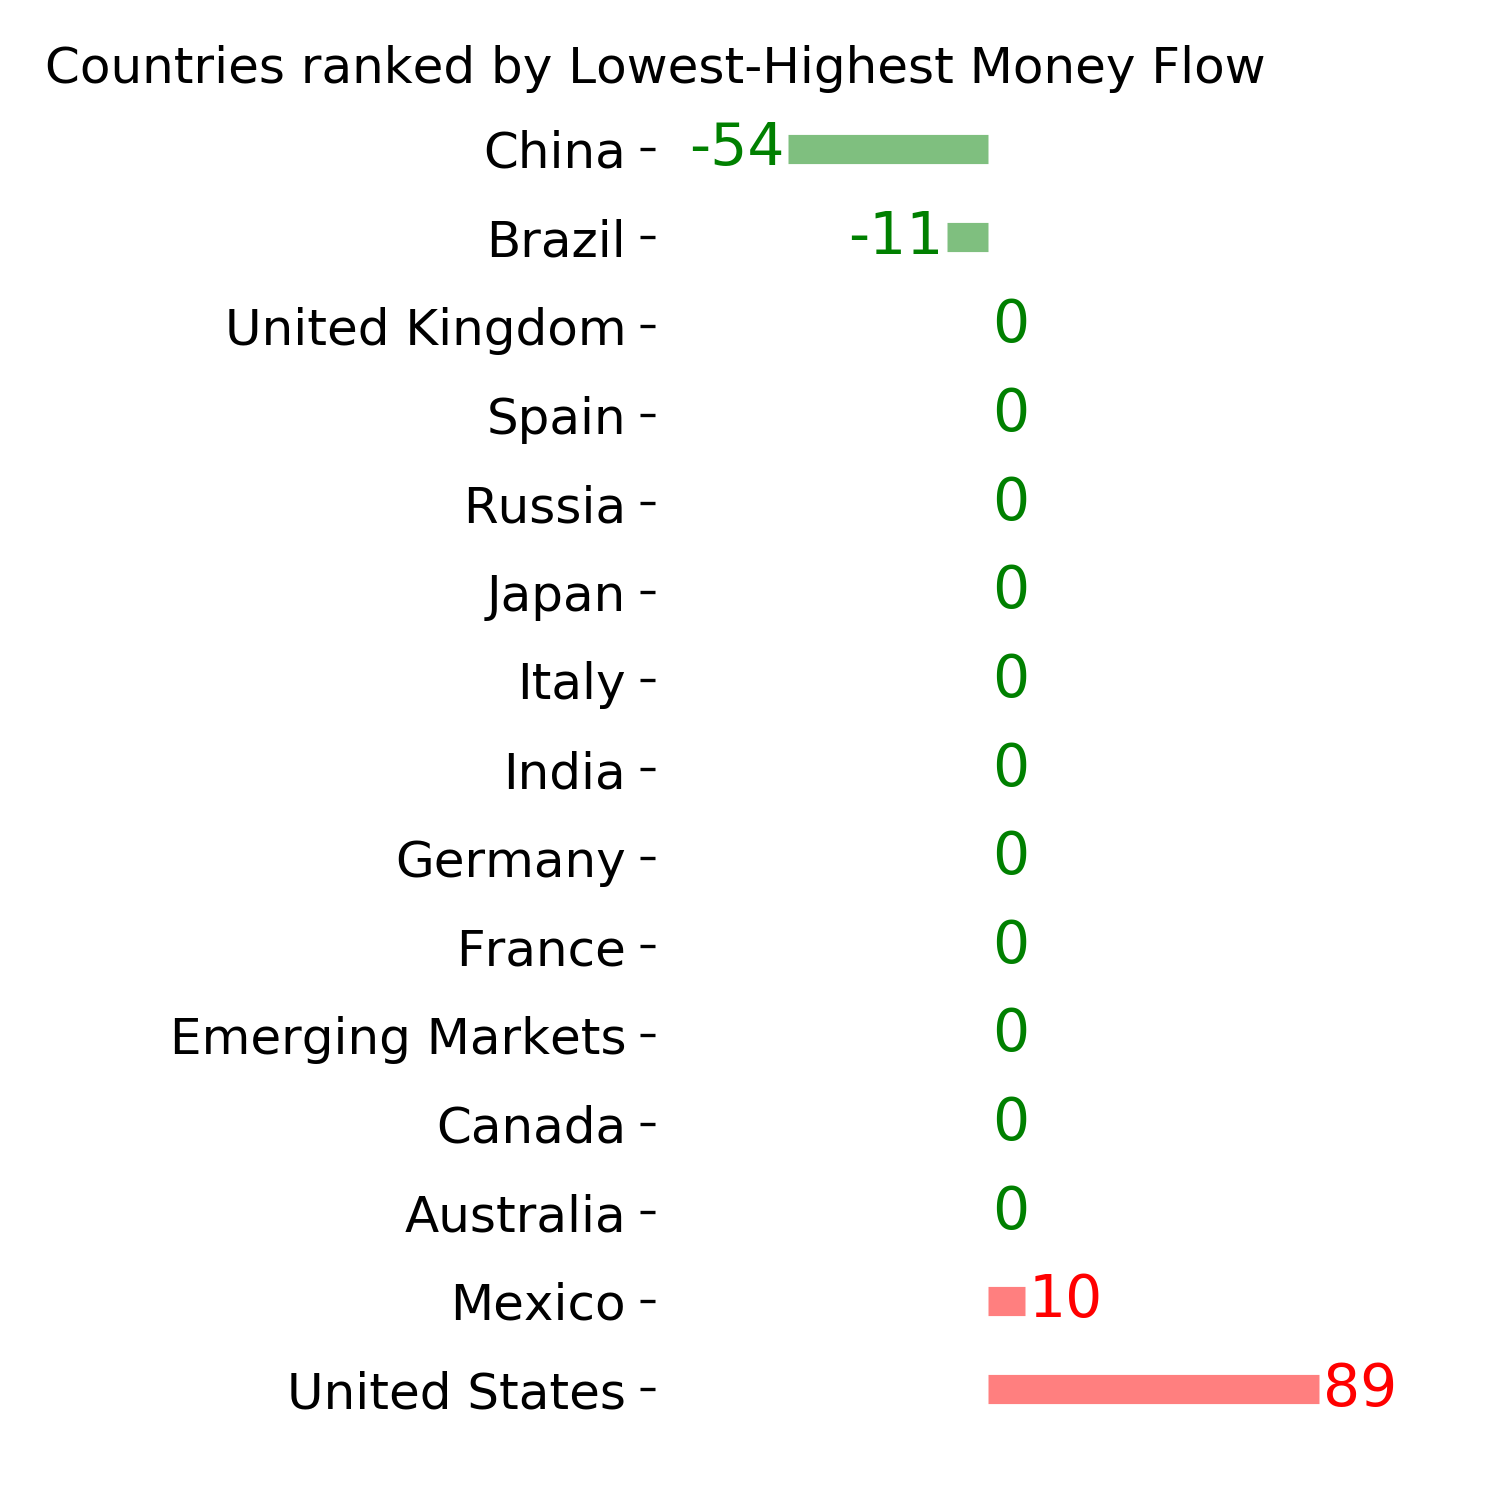
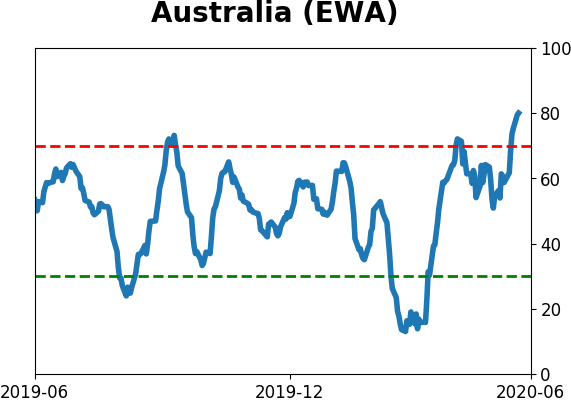
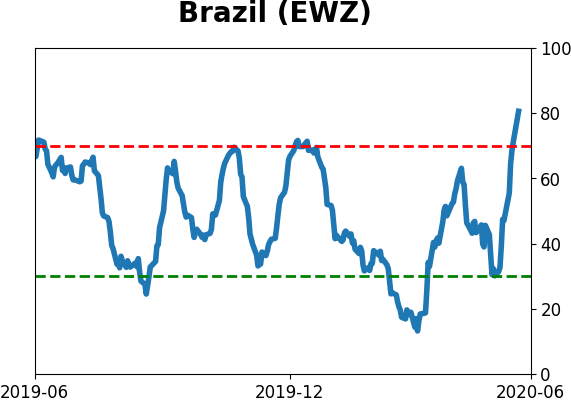
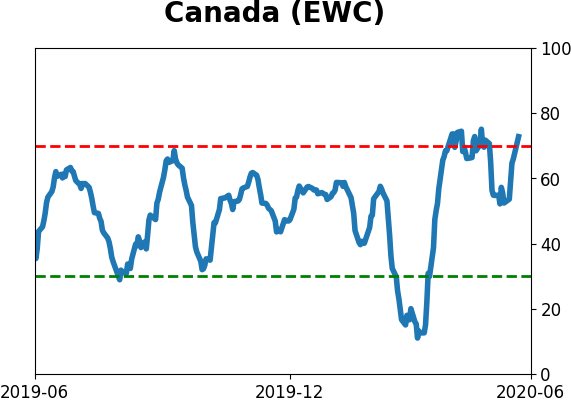
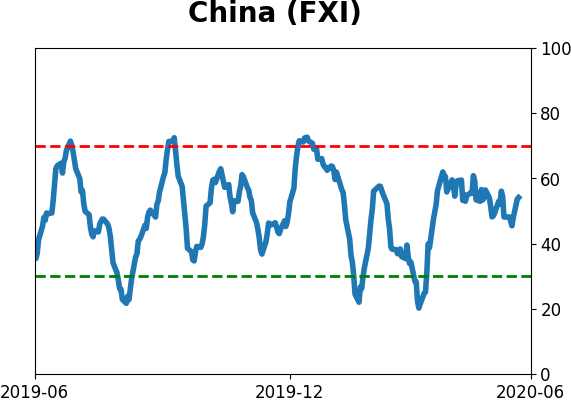
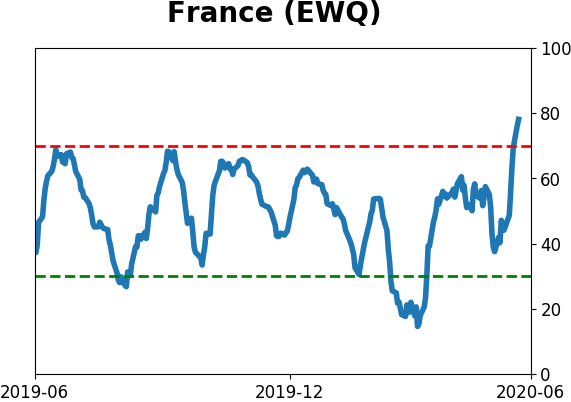
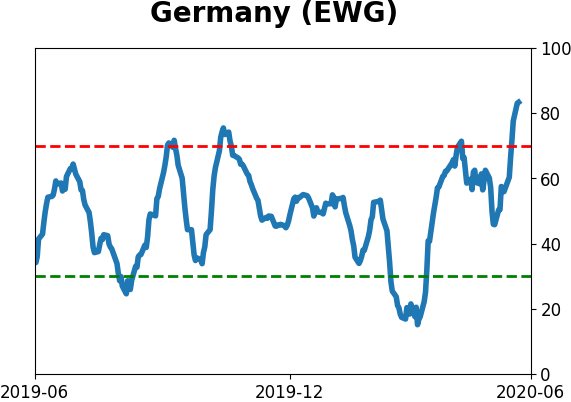
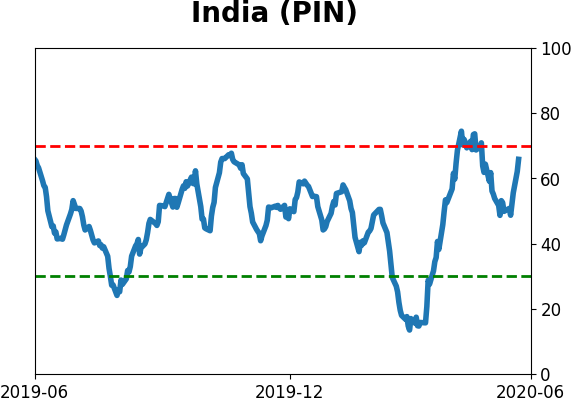
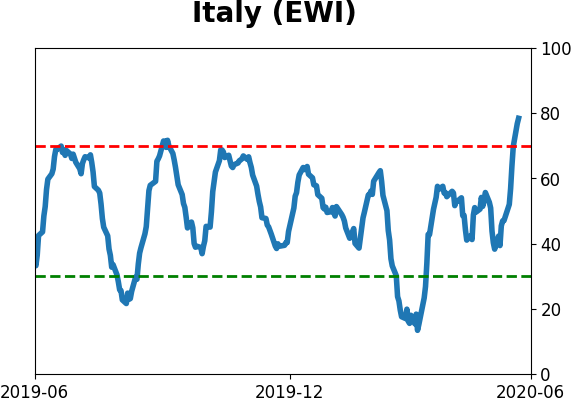
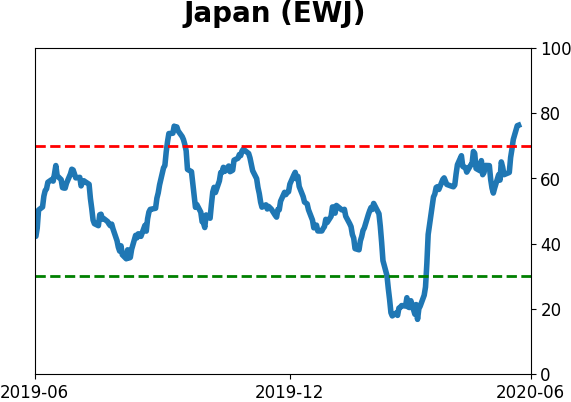
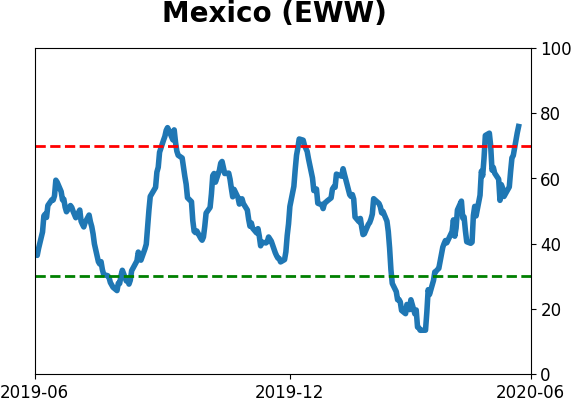
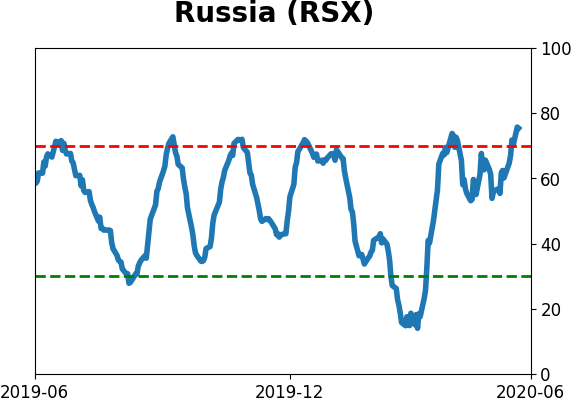
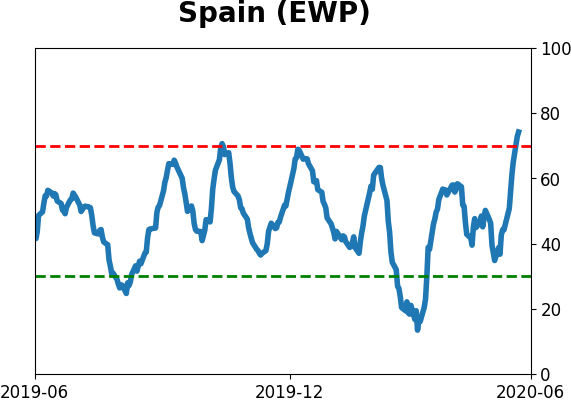
Country ETF's - 10-Day Moving Average
|
|
|
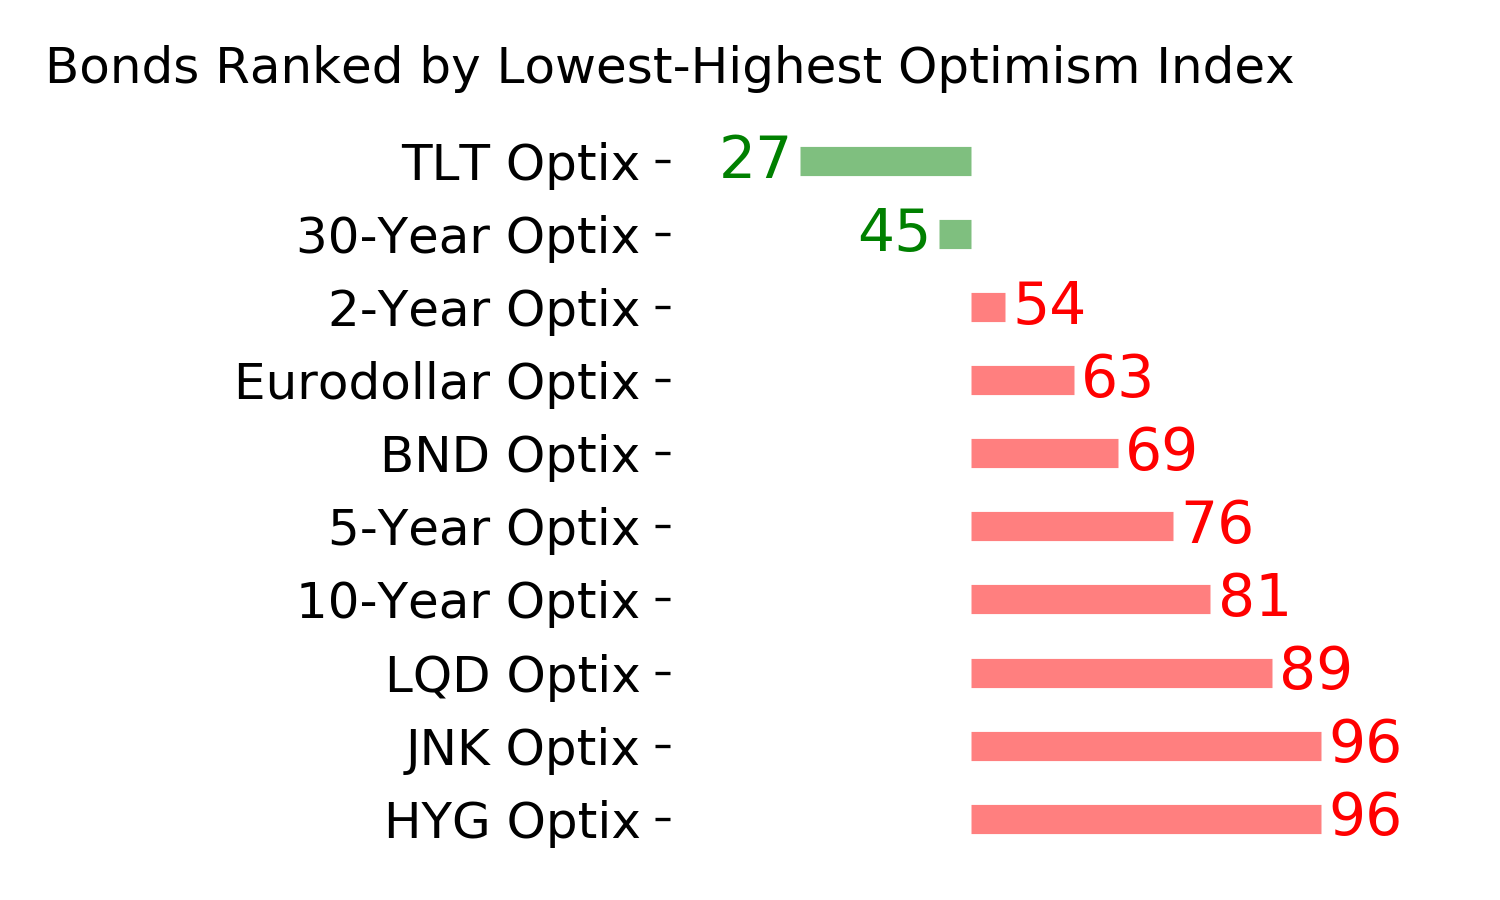
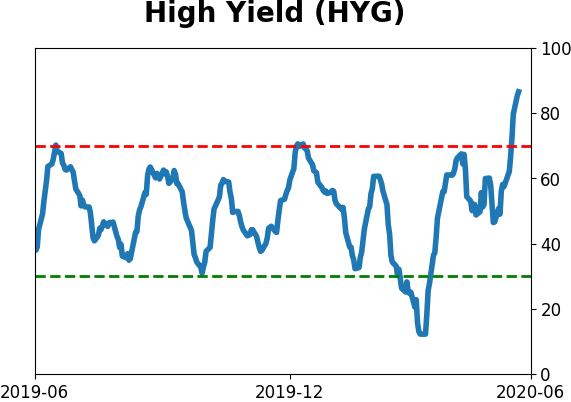
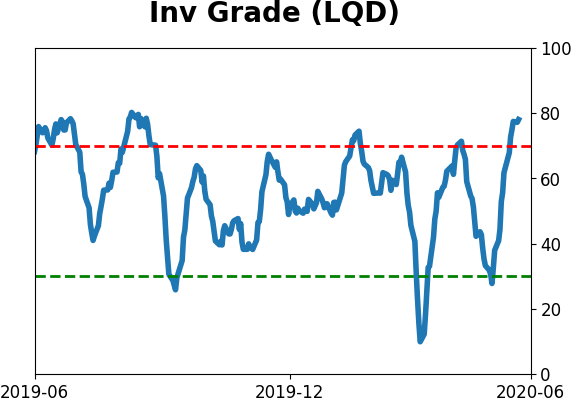
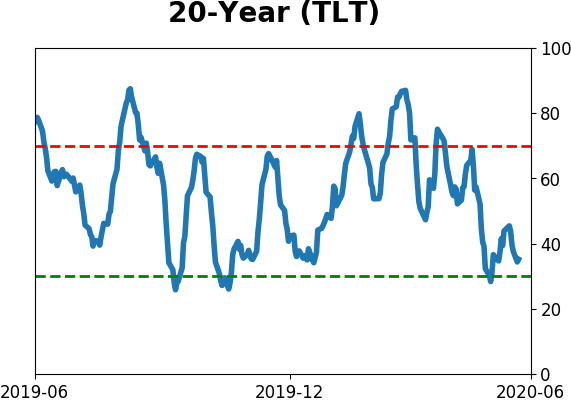
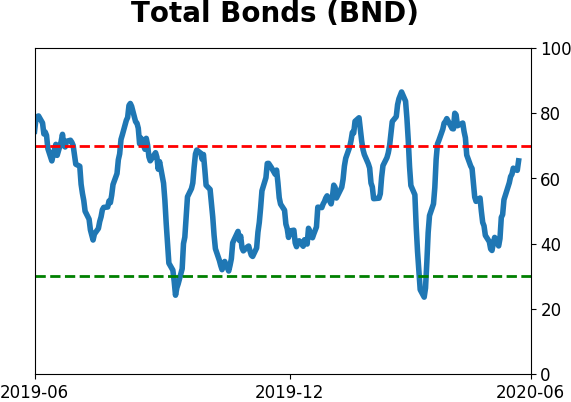
Bond ETF's - 10-Day Moving Average
|
|
|
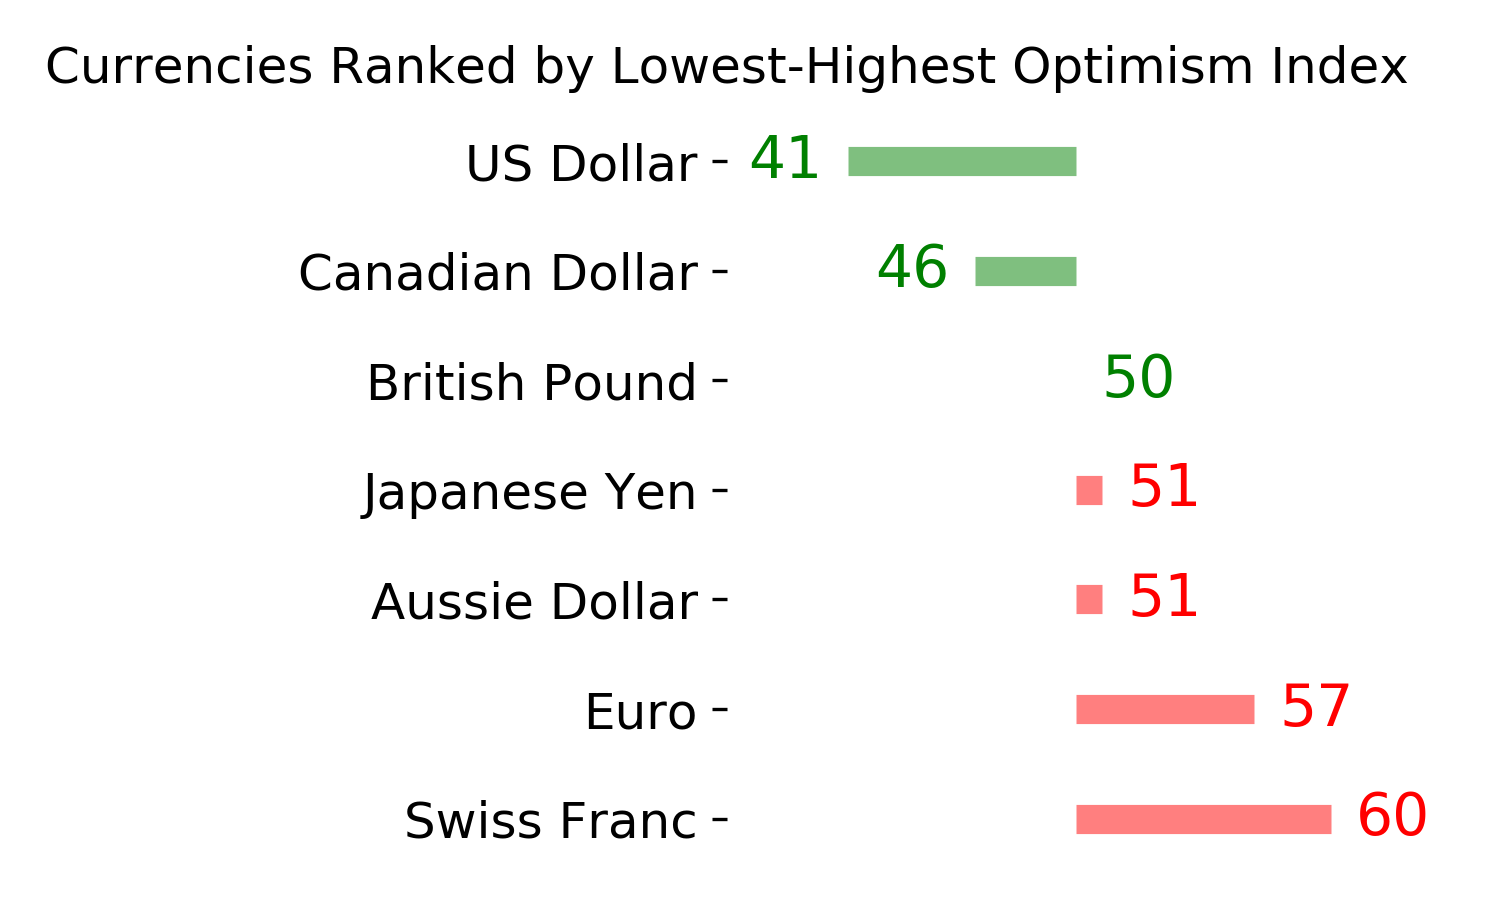
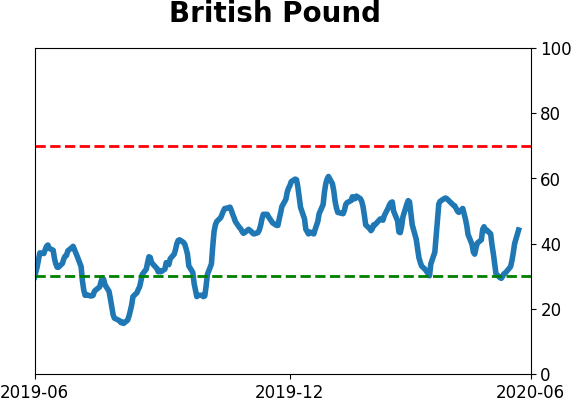
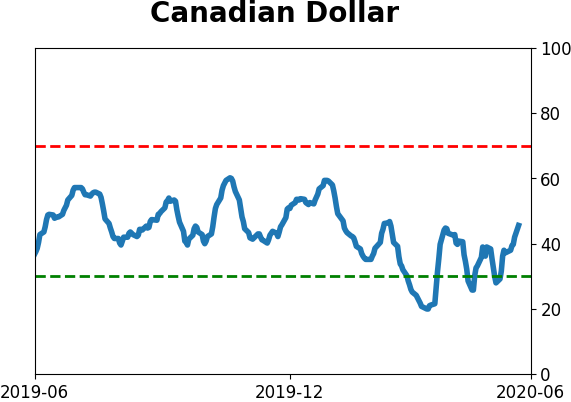
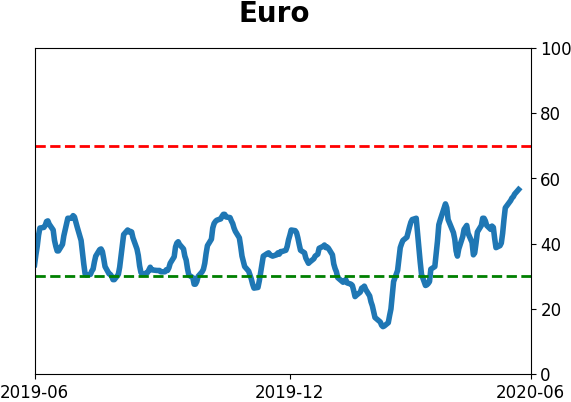
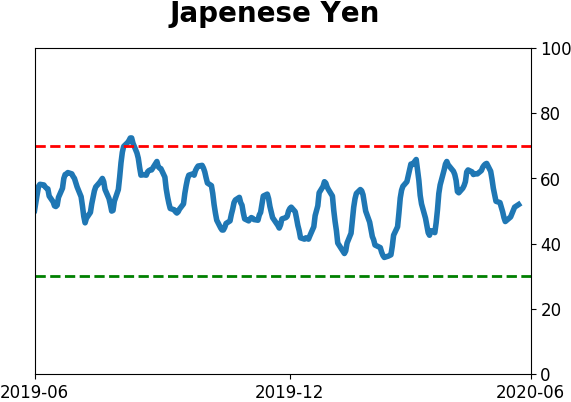
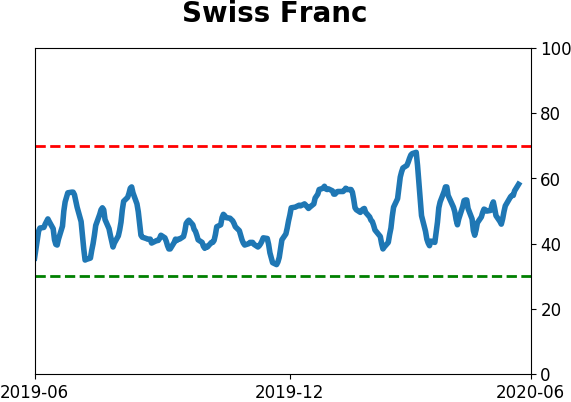
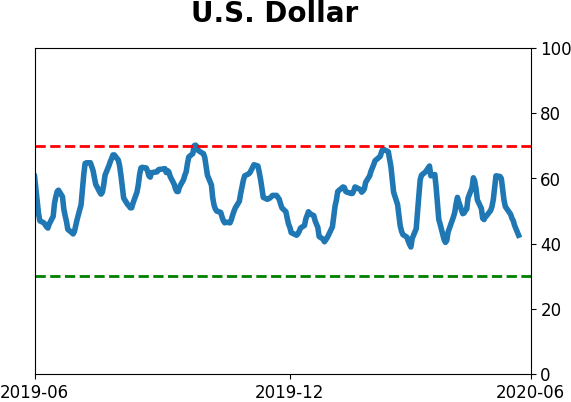
Currency ETF's - 5-Day Moving Average
|
|
|
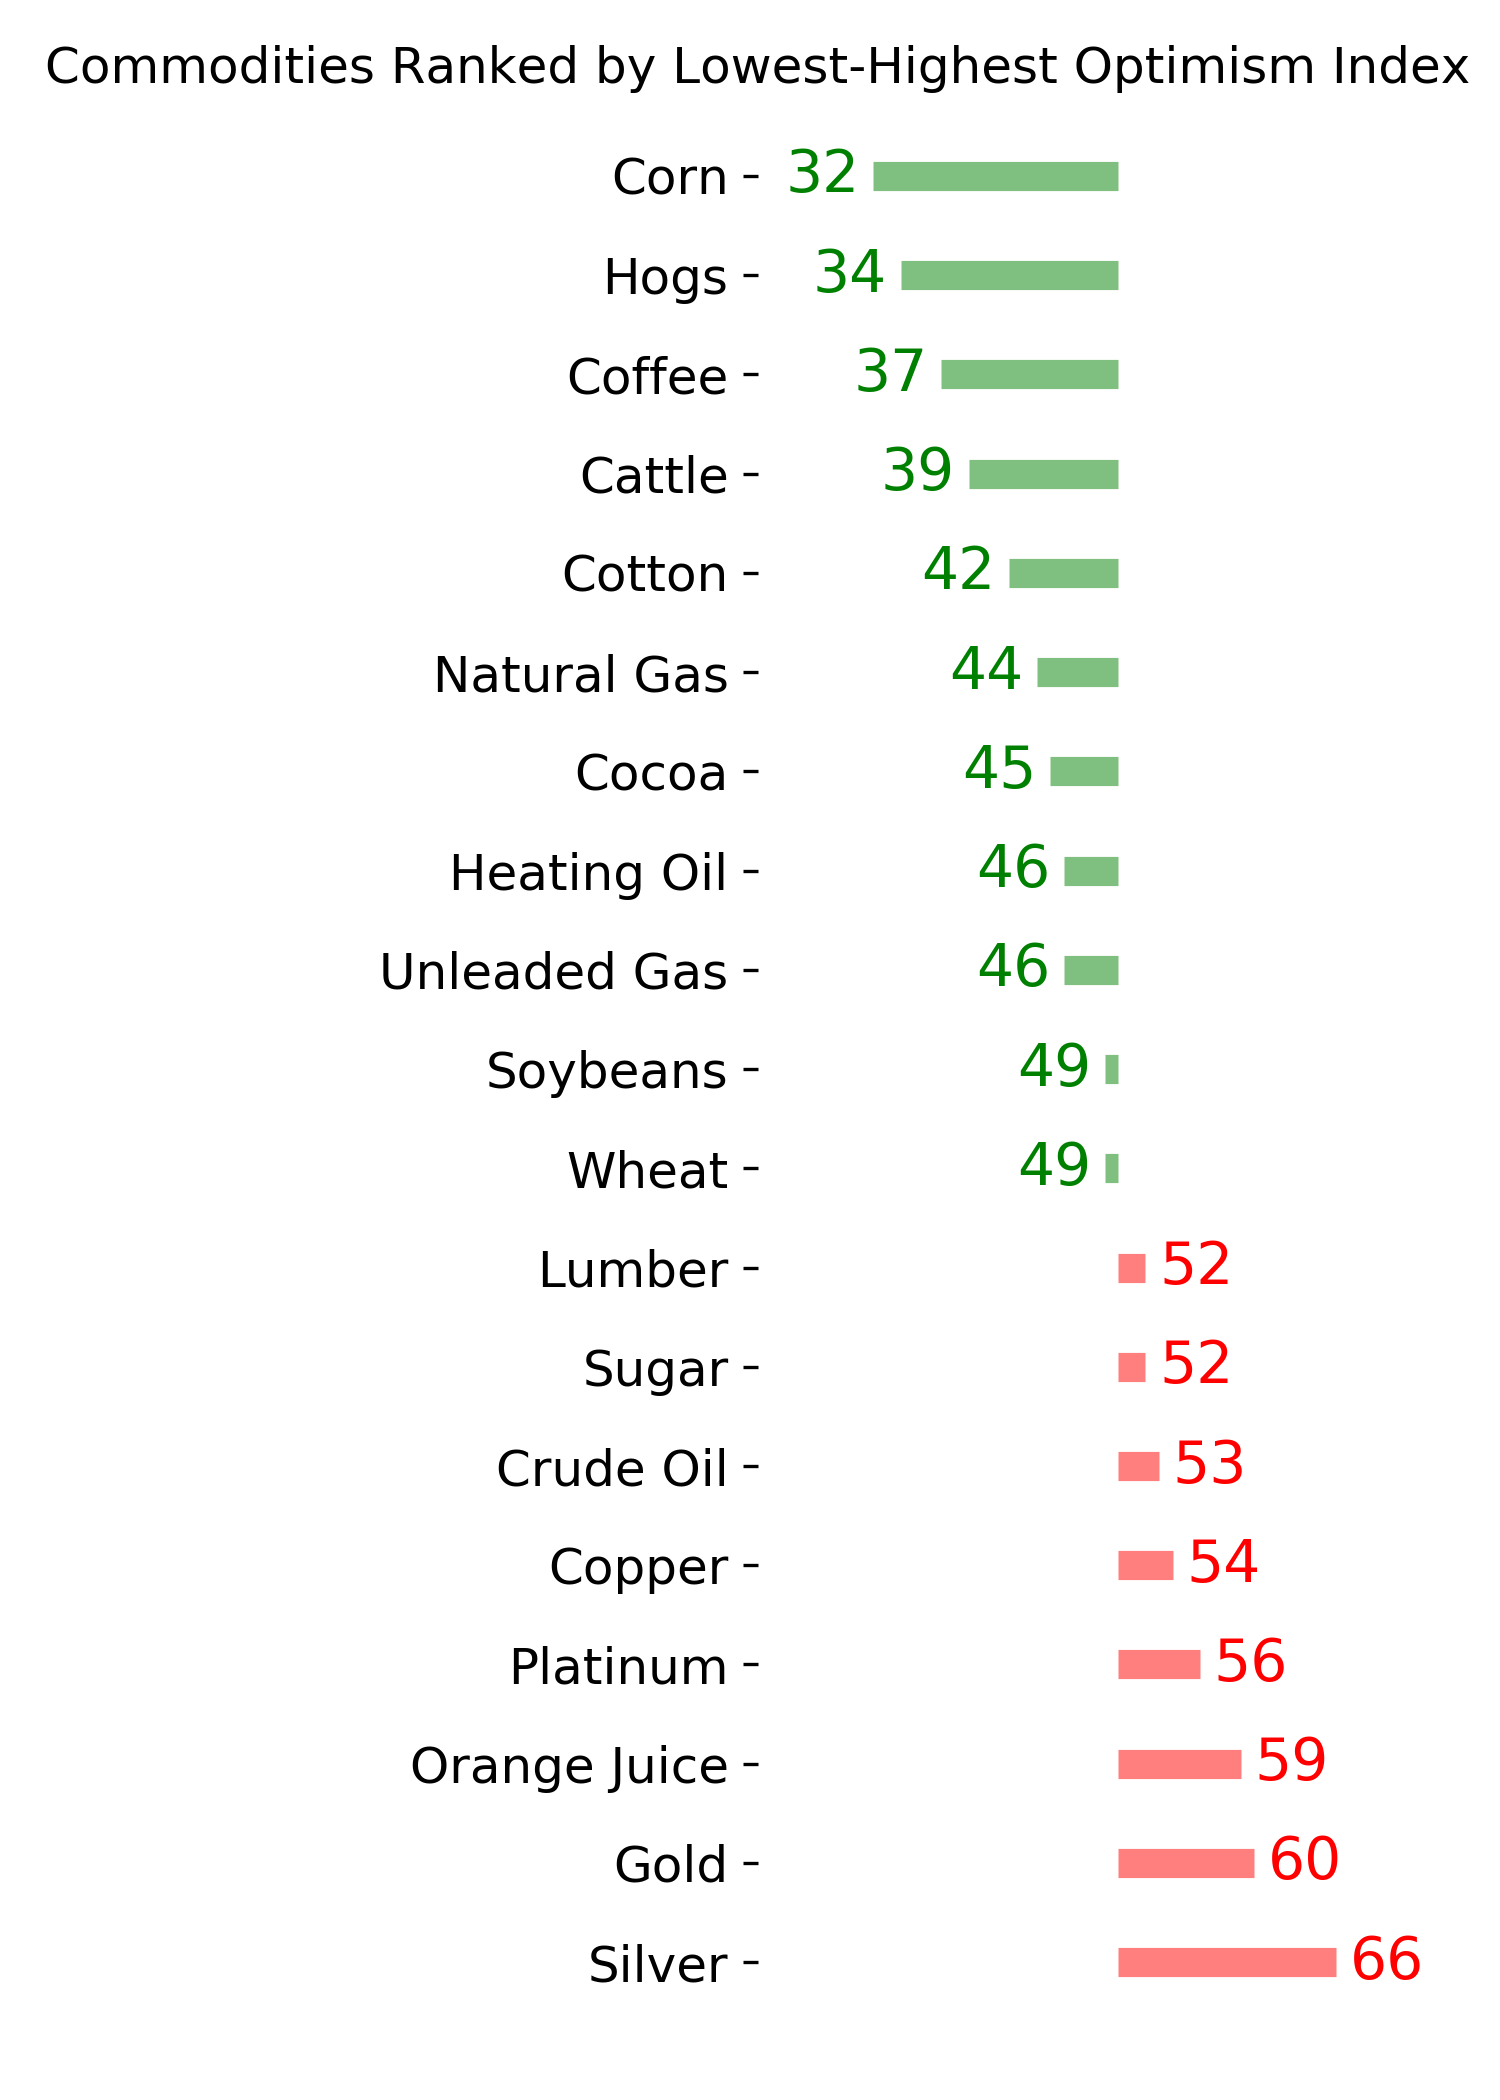
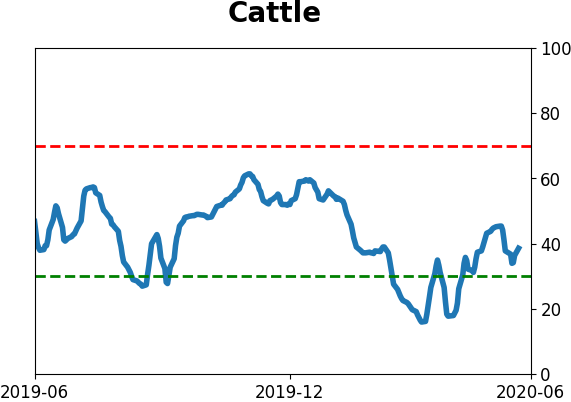
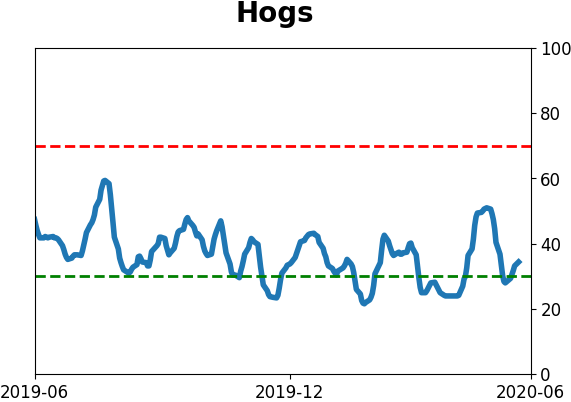
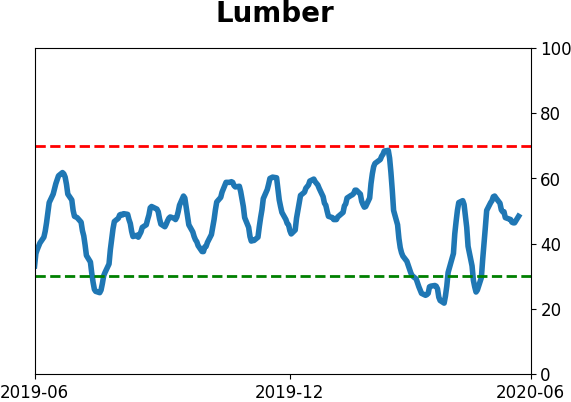
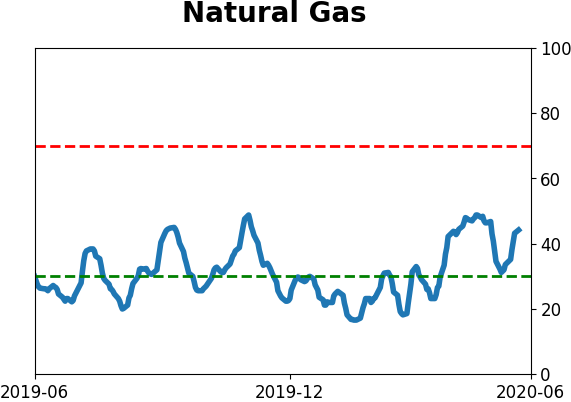
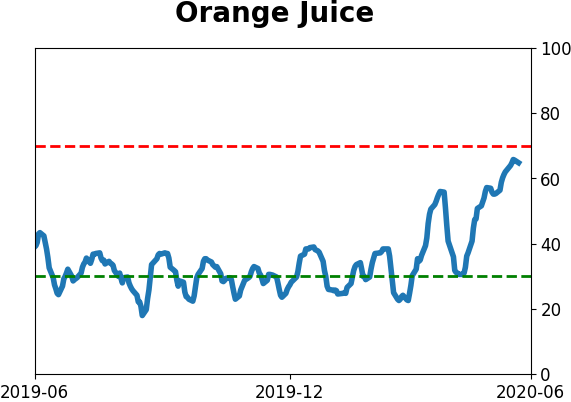
Commodity ETF's - 5-Day Moving Average
|
|