Headlines
|
|
Another Record Month as Momentum Rolls On:
Stocks have enjoyed a historic stretch of gains. The S&P 500 just notched its 4th straight record monthly close. The total return on small-cap stocks just increased for the 8th straight month. And the Dow Industrials have jumped more than 50% over the past 14 months. All are historic anomalies.
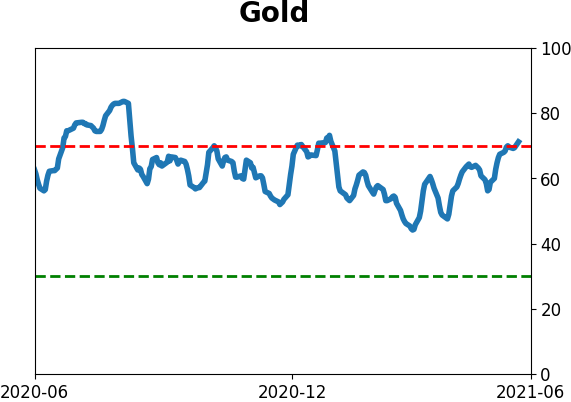
Gold follows through: In a report from May 18, we looked at what happens when gold crosses above its 200-day average after months below it. There was a solid correlation between its returns over the next two weeks and returns a year later. Gold has continued to rally since that cross, lowering the probability that this will be a failed breakout. For gold miners, the NYSE Arca Gold Bugs index has consolidated into a flag pattern (most technicians would consider this a positive) but is at almost the exact same level it was at 10 days ago, so no solid conclusion there.
Bottom Line:
See the Outlook & Allocations page for more details on these summaries STOCKS: Hold
The speculative frenzy in February is wrung out. Internal dynamics have mostly held up, with some exceptions. Many of our studies still show a mixed to poor short-term view, with medium- and long-term ones turning more positive. BONDS: Hold
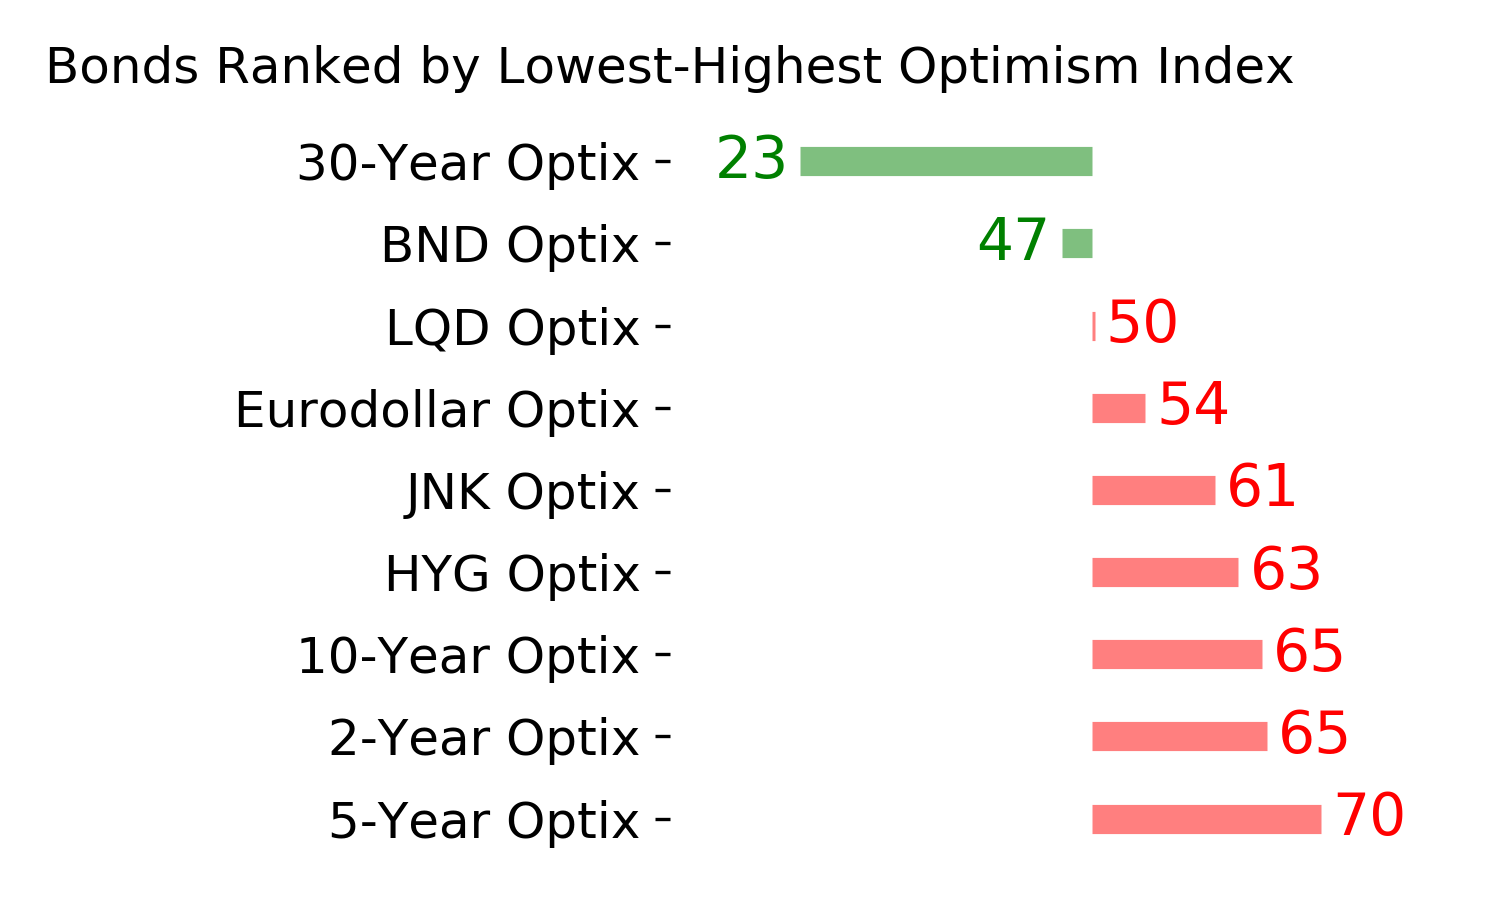
Various parts of the market got hit in March, with the lowest Bond Optimism Index we usually see during healthy environments. After a shaky couple of weeks, the broad bond market has modestly recovered. Not a big edge here either way. GOLD: Hold
Gold and miners have done very well, recovering above long-term trend lines. The issue is that both have tended to perform poorly after similar situations - will have to wait and see how it plays out.
|
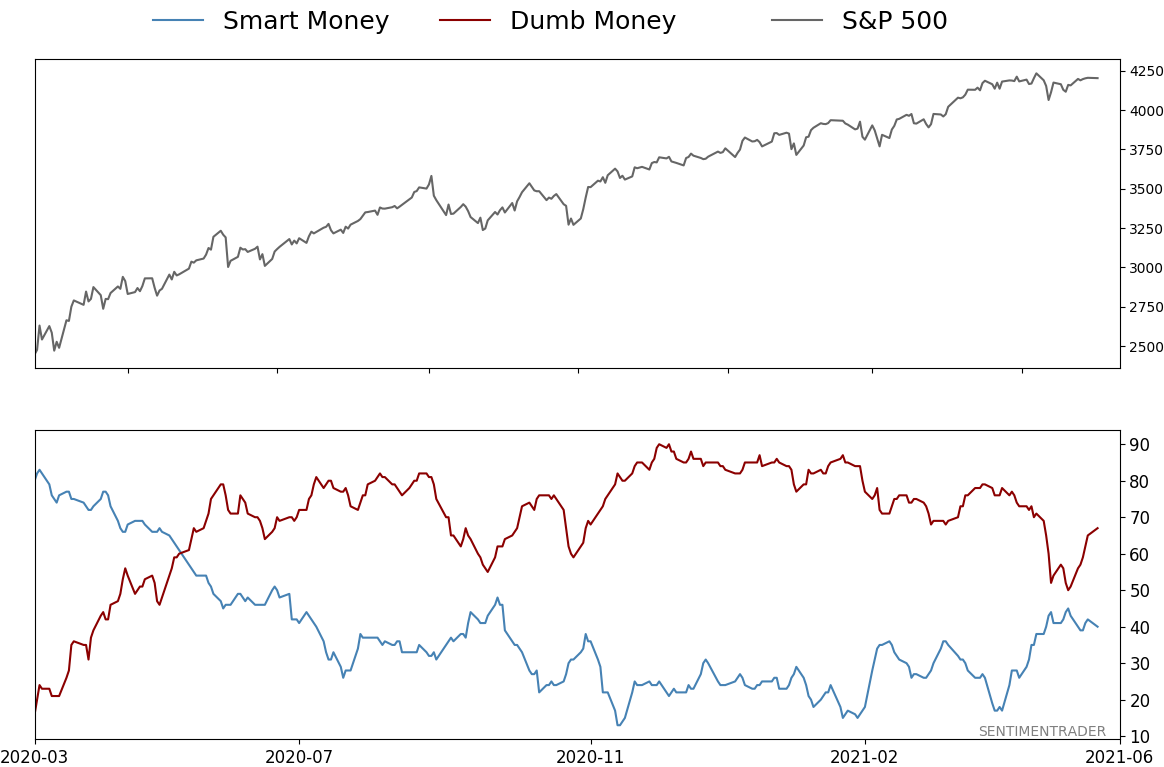
Smart / Dumb Money Confidence
|
Smart Money Confidence: 40%
Dumb Money Confidence: 67%
|
|
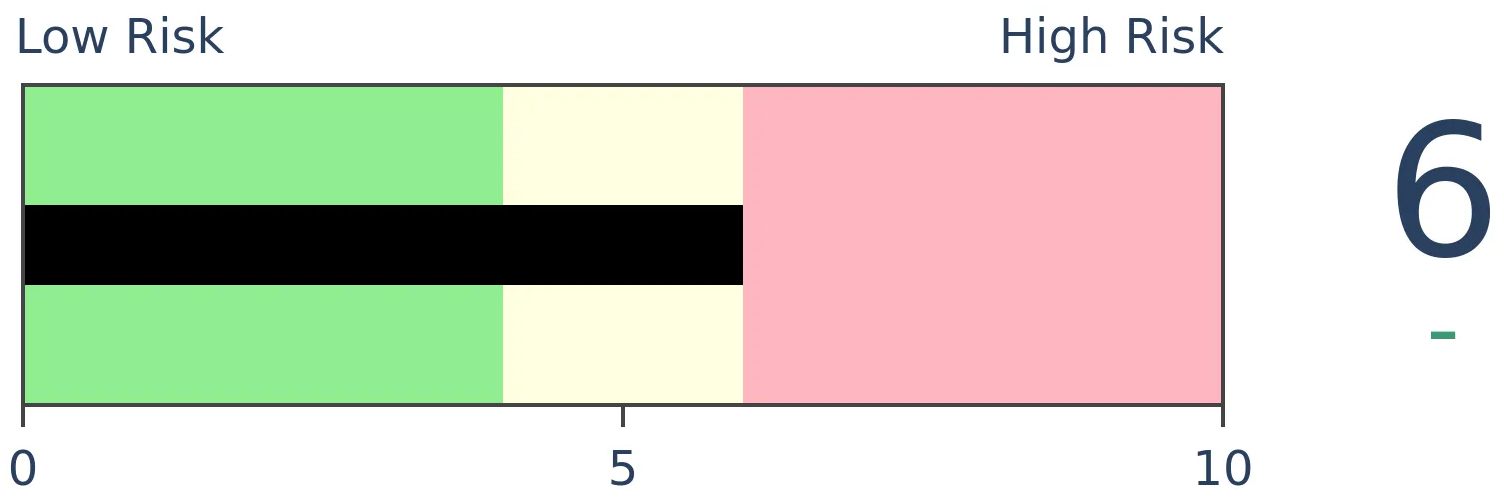
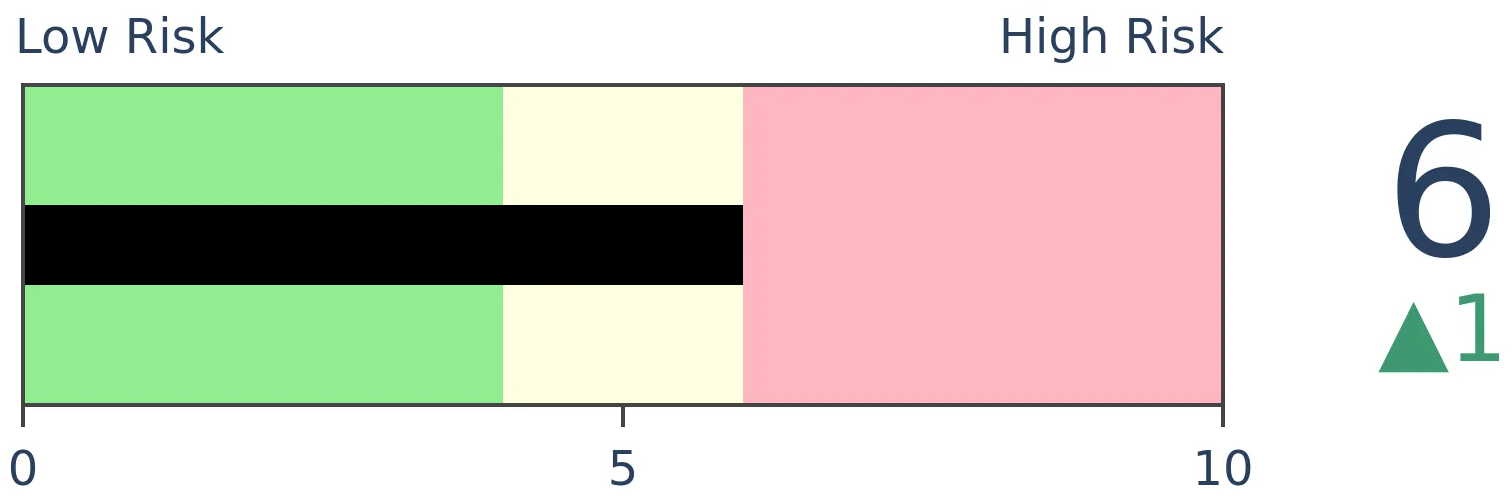
Risk Levels
Stocks Short-Term
|
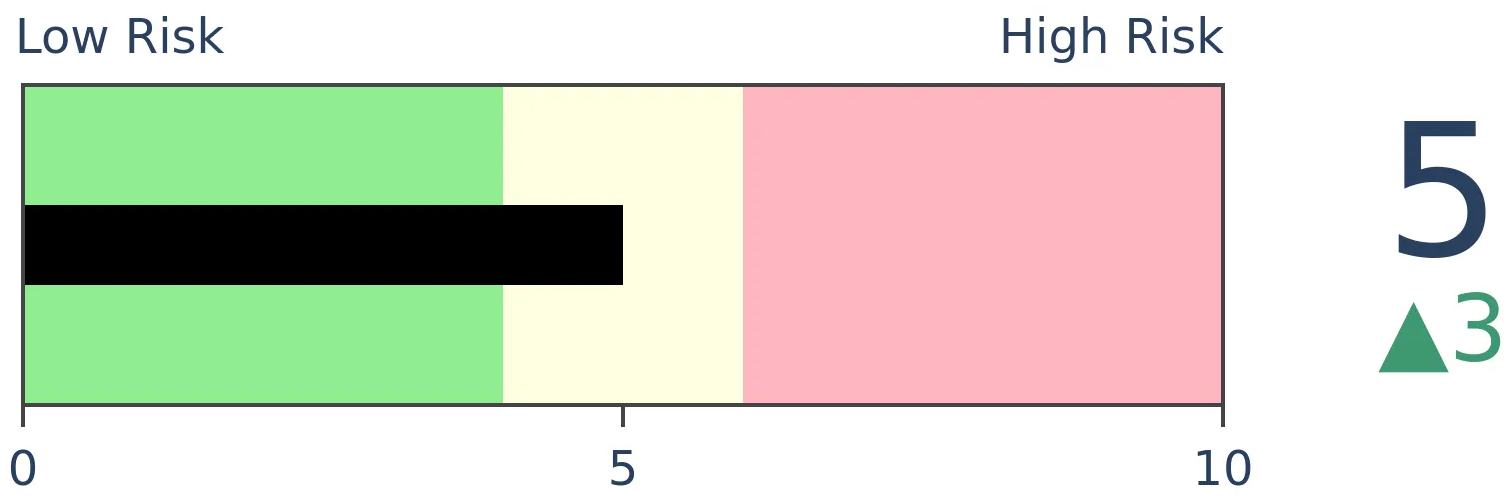
Stocks Medium-Term
|
|
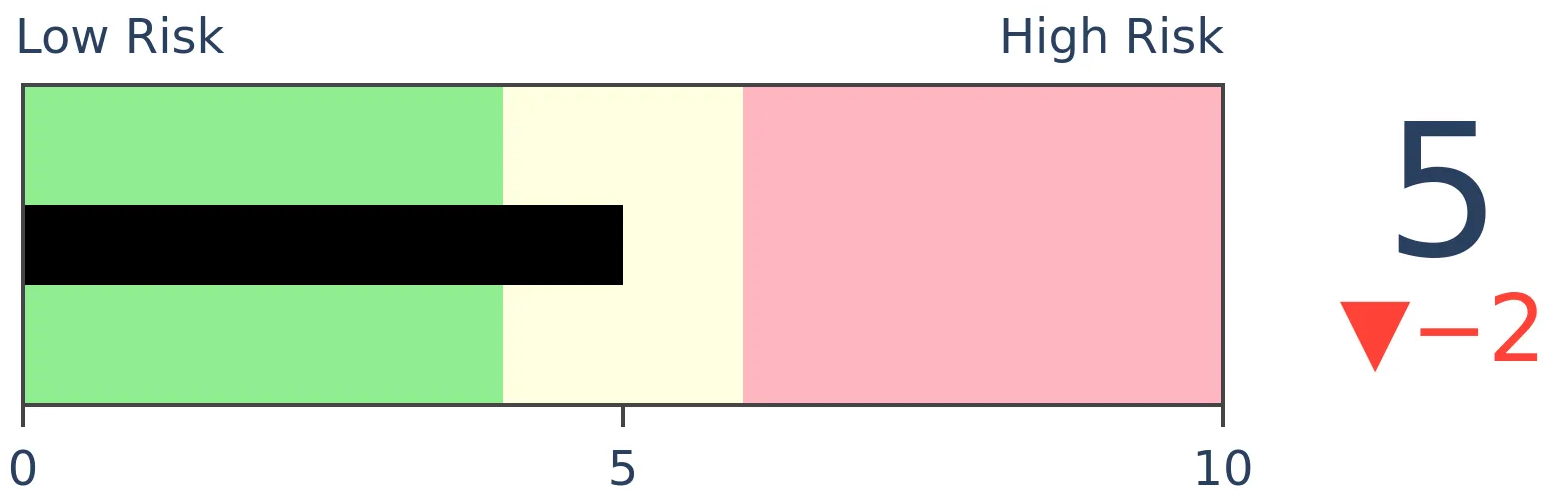
Bonds

|
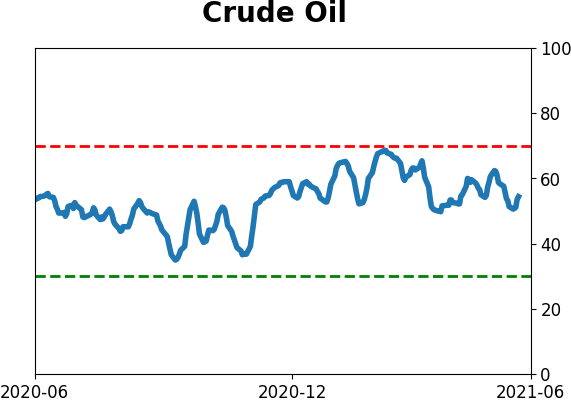
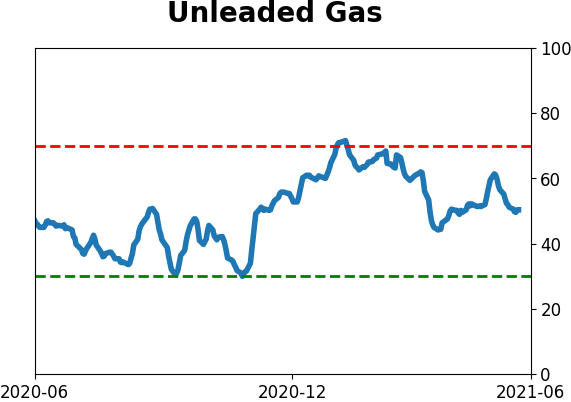
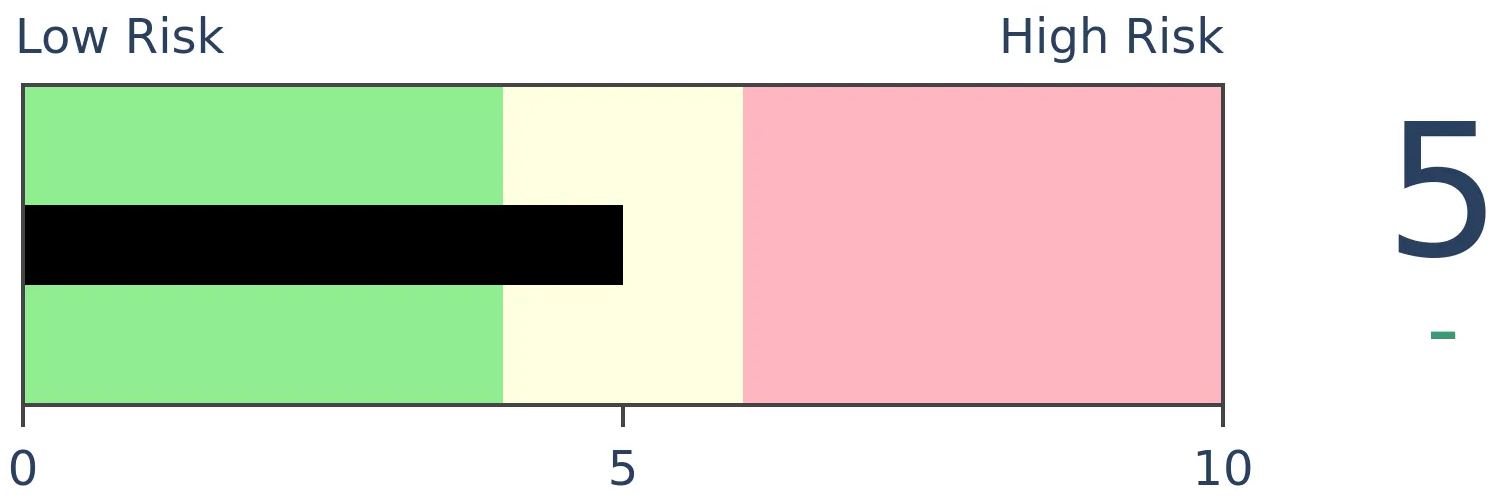
Crude Oil
|
|
Gold
|
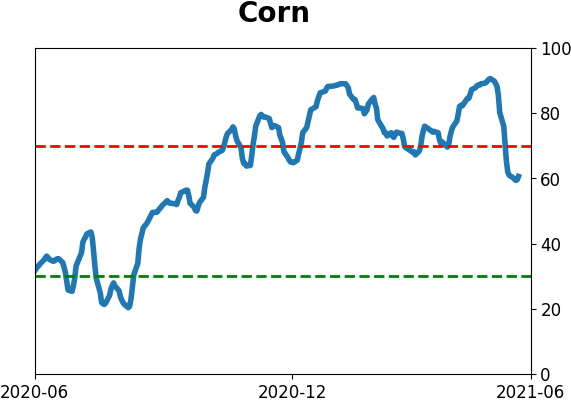
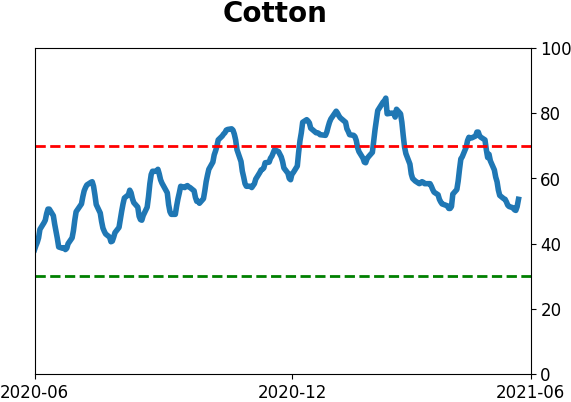
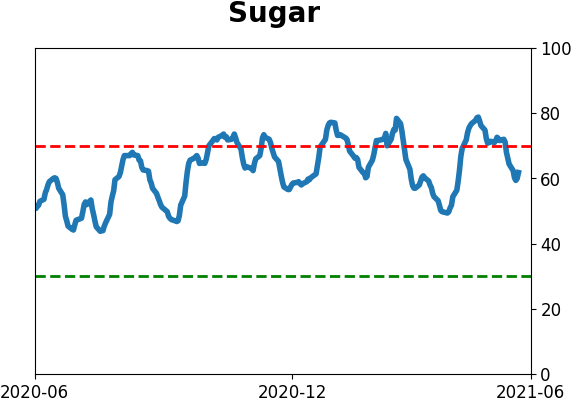
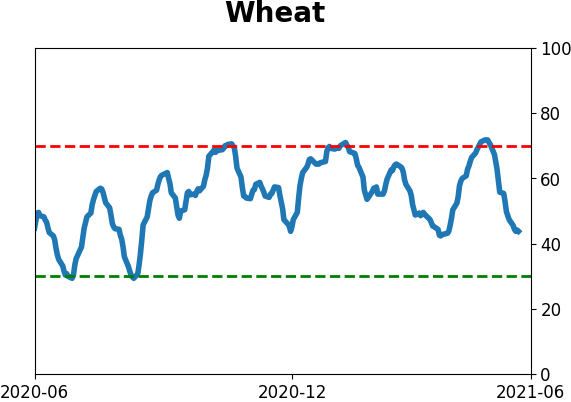
Agriculture
|
|
Research
BOTTOM LINE
Stocks have enjoyed a historic stretch of gains. The S&P 500 just notched its 4th straight record monthly close. The total return on small-cap stocks just increased for the 8th straight month. And the Dow Industrials have jumped more than 50% over the past 14 months. All are historic anomalies.
FORECAST / TIMEFRAME
None
|
With a flood of money combining with preternaturally calm conditions in the broader market, equity investors can't help themselves. Once again, buying interest was enough to push the S&P 500 to a record monthly close in May.
For the most widely-benchmarked index in the world, this was its 4th consecutive month with an all-time high.
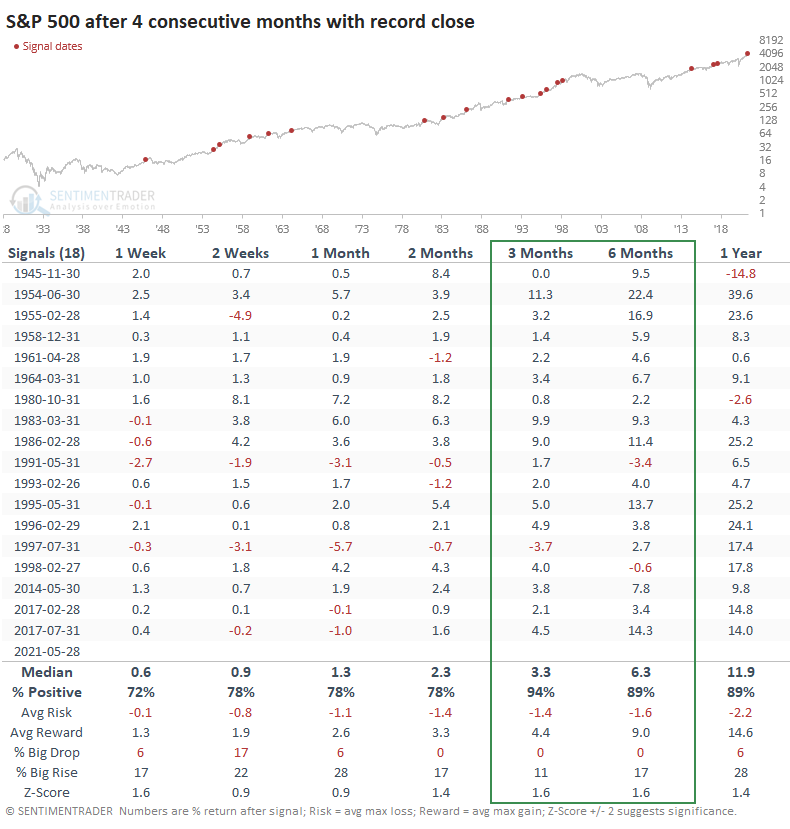
We've seen time and time again since last April that momentum does not die easily. Despite an untold number of challenges, not least of which being euphoric sentiment at times, buyers are still interested. Sellers are not, at least not for more than a few days at a time.
When the index has rolled like this, it's rarely lost. The S&P's future returns were good - above random - but the biggest standout was its consistency. Over the next 3-6 months, losses were hard to find, and they were small anyway.
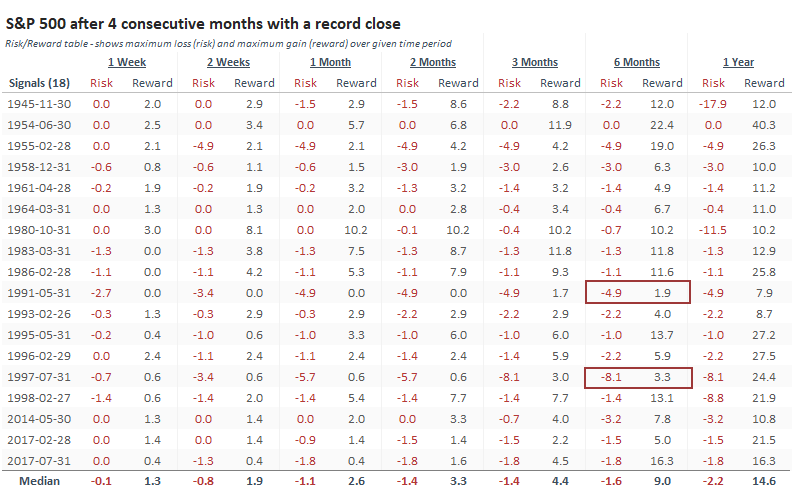
Looking at the Risk/Reward table, we can see that risk outweighed reward over the next six months only twice, and those two were reversed during the subsequent six months. Impressive.
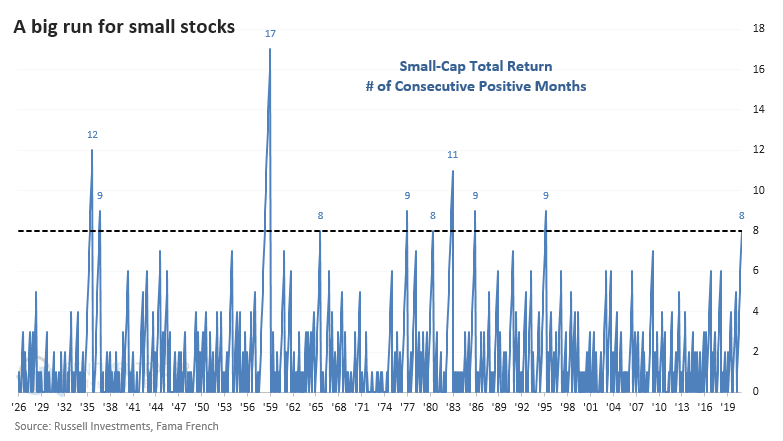
SMALL-CAPS ON THE BEST RUN IN 27 YEARS
While they've settled back recently, part of the momentum has been due to a tremendous run in Small-Cap stocks, which just ended their 8th straight month with a positive total return, tied for the 5th-longest streak since 1926.
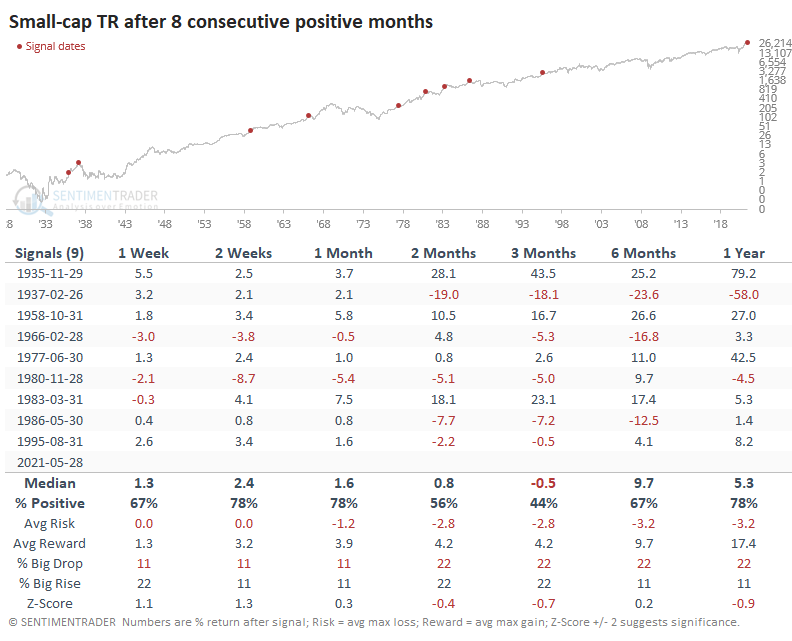
After other 8-month winning streaks, Small-Caps have tended to keep going, but there were some rough patches. A few times, they lost more than 10% over the next six months, though there was only one (very) large loss a year later.
PAPA DOW RECORDS HISTORIC STRETCH
Looking at the other end of the spectrum, the Dow Jones Industrial Average just celebrated its 125th anniversary by recording its 6th-largest gain over a 14-month stretch.
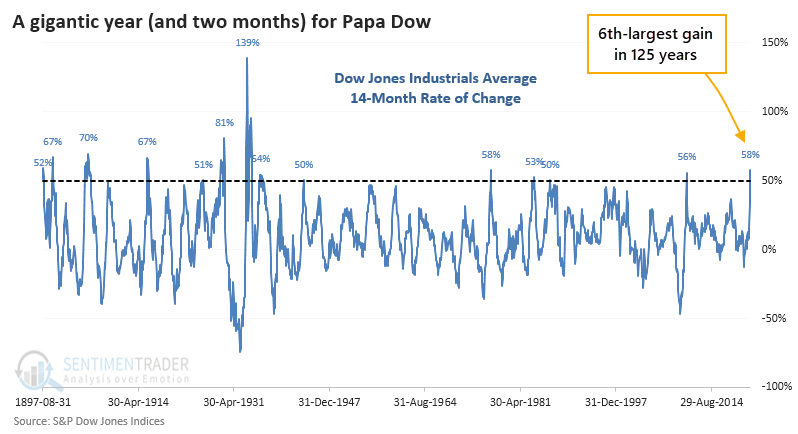
The only reason we're looking at a 14-month rate of change is that it coincides with the low last March, so we're cherry-picking the time frame. During its illustrious history, Papa Dow has managed a 14-month 50% gain 13 other times. The table below shows its future returns over a longer time frame.
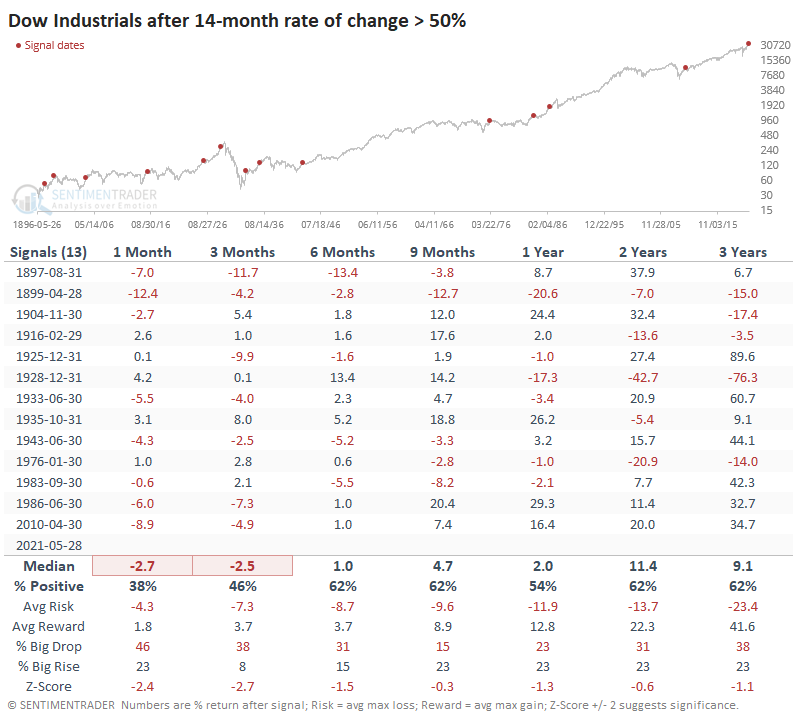
Over the next few months, the Dow often wasn't able to hold its momentum at such a high level, with a handful of corrections along the way. Out of the 13 instances, there were 3 that ended up leading to bear markets at some point during the next year, but all of those were before 1929.
The overall theme from these displays of historic momentum weakly suggests that investors should curb their enthusiasm in the shorter-term. I say "weakly" because the future returns in the S&P study were quite good. There is a more compelling suggestion over a medium- to long-term time frame, and it's a positive one.
We've noted for months that there is a historic tension in the types of data we follow. Many of the breadth- and momentum-based ones show behavior often seen near the beginnings of new bull markets. Most of the sentiment- and valuation-based ones show behavior almost always seen near their ends. It's hard, maybe impossible, to reconcile that, and there are no good historical comparisons we can find.
Starting in late January at least, there was a more compelling argument for months of choppy trading activity ahead, which arguably we've seen. It's getting a bit harder to make that same case now, as many sentiment measures have come down from euphoric levels.
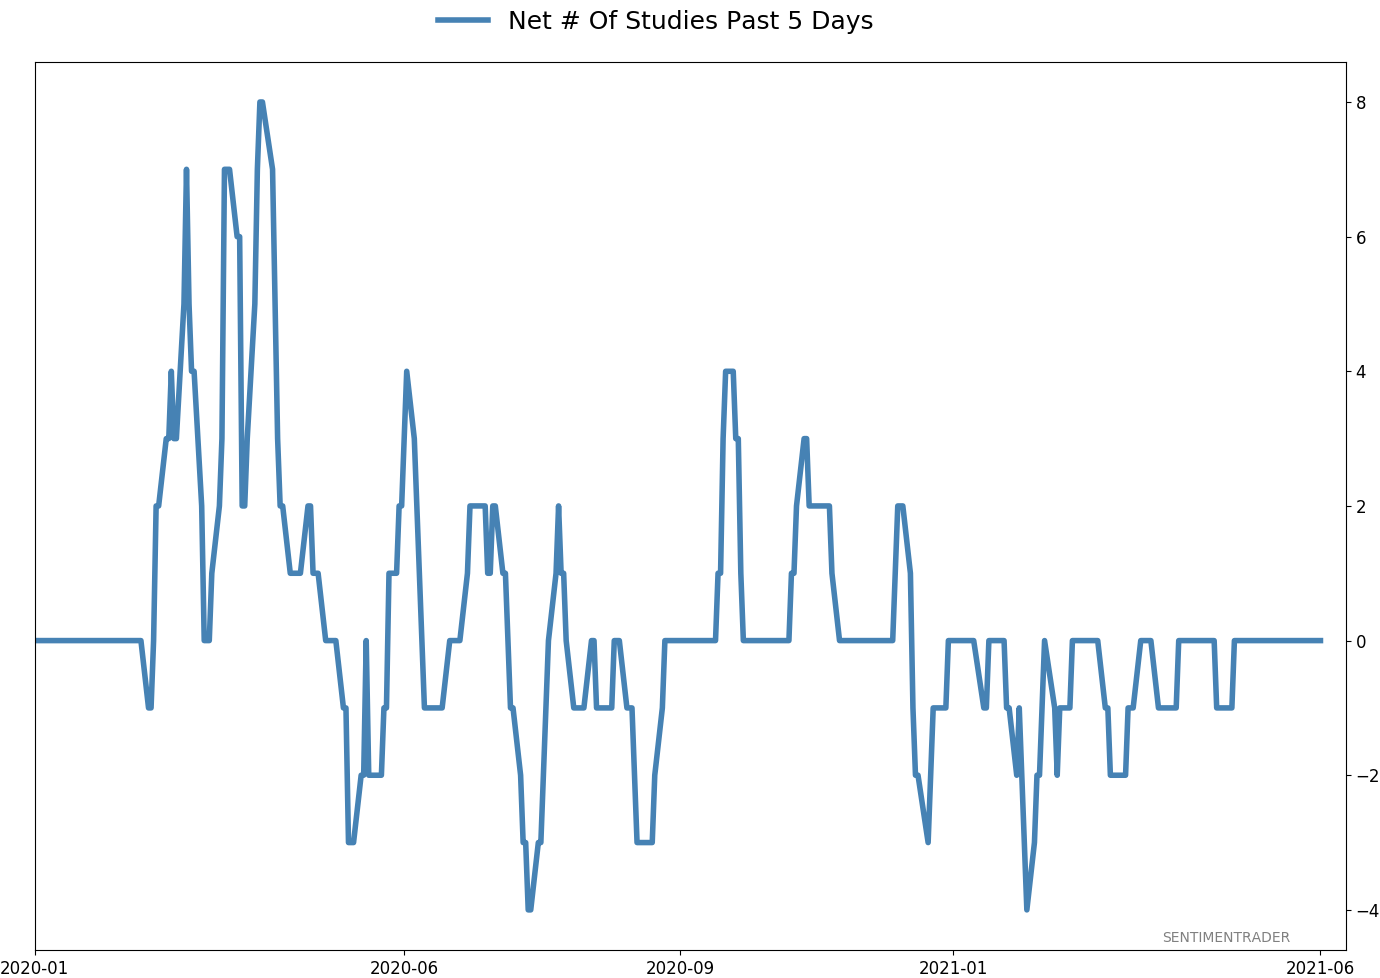
Active Studies
| Time Frame | Bullish | Bearish | | Short-Term | 0 | 0 | | Medium-Term | 1 | 11 | | Long-Term | 11 | 5 |
|
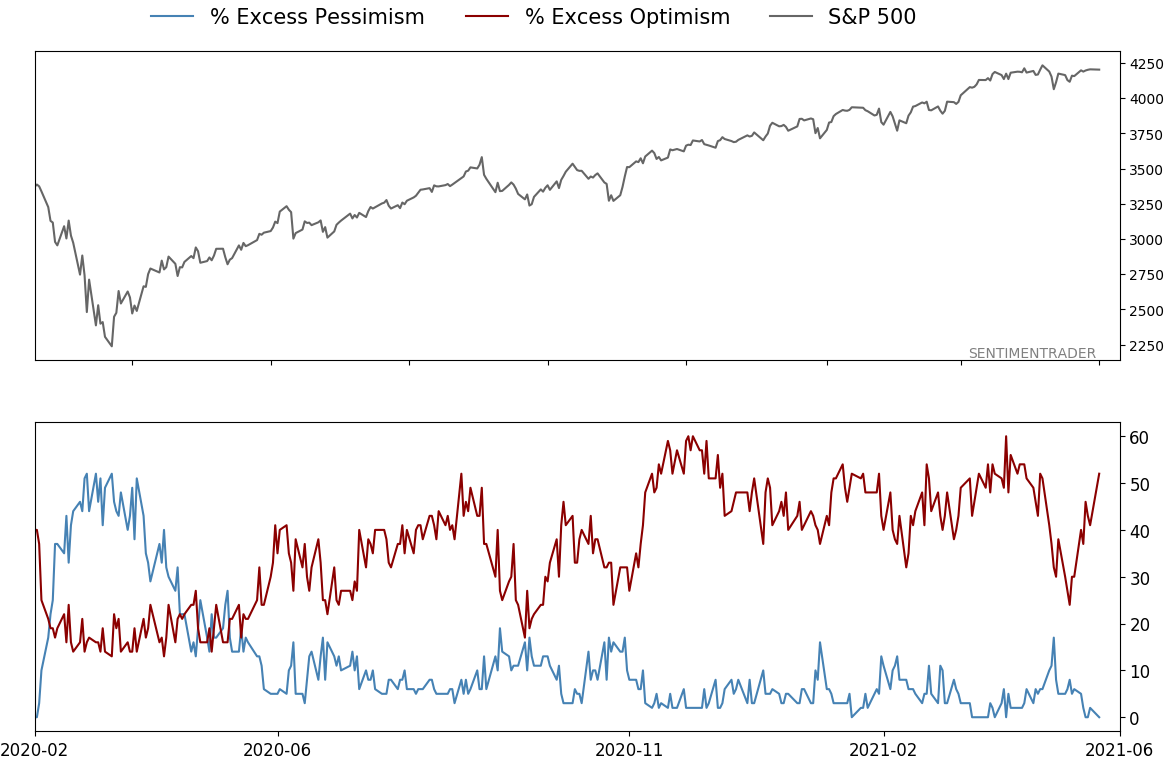
Indicators at Extremes
|
% Showing Pessimism: 0%
Bullish for Stocks
|
|
Portfolio
| Position | Description | Weight % | Added / Reduced | Date | | Stocks | RSP | 4.1 | Added 4.1% | 2021-05-19 | | Bonds | 23.9% BND, 6.9% SCHP | 30.7 | Reduced 7.1% | 2021-05-19 | | Commodities | GCC | 2.6 | Reduced 2.1%
| 2020-09-04 | | Precious Metals | GDX | 5.6 | Reduced 4.2% | 2021-05-19 | | Special Situations | 4.3% XLE, 2.2% PSCE | 7.6 | Reduced 5.6% | 2021-04-22 | | Cash | | 49.4 | | |
|
Updates (Changes made today are underlined)
Much of our momentum and trend work has remained positive for several months, with some scattered exceptions. Almost all sentiment-related work has shown a poor risk/reward ratio for stocks, especially as speculation drove to record highs in exuberance in February. Much of that has worn off, and most of our models are back toward neutral levels. There isn't much to be excited about here. The same goes for bonds and even gold. Gold has been performing well lately and is back above long-term trend lines. The issue is that it has a poor record of holding onto gains when attempting a long-term trend change like this, so we'll take a wait-and-see approach. RETURN YTD: 9.8% 2020: 8.1%, 2019: 12.6%, 2018: 0.6%, 2017: 3.8%, 2016: 17.1%, 2015: 9.2%, 2014: 14.5%, 2013: 2.2%, 2012: 10.8%, 2011: 16.5%, 2010: 15.3%, 2009: 23.9%, 2008: 16.2%, 2007: 7.8%
|
|
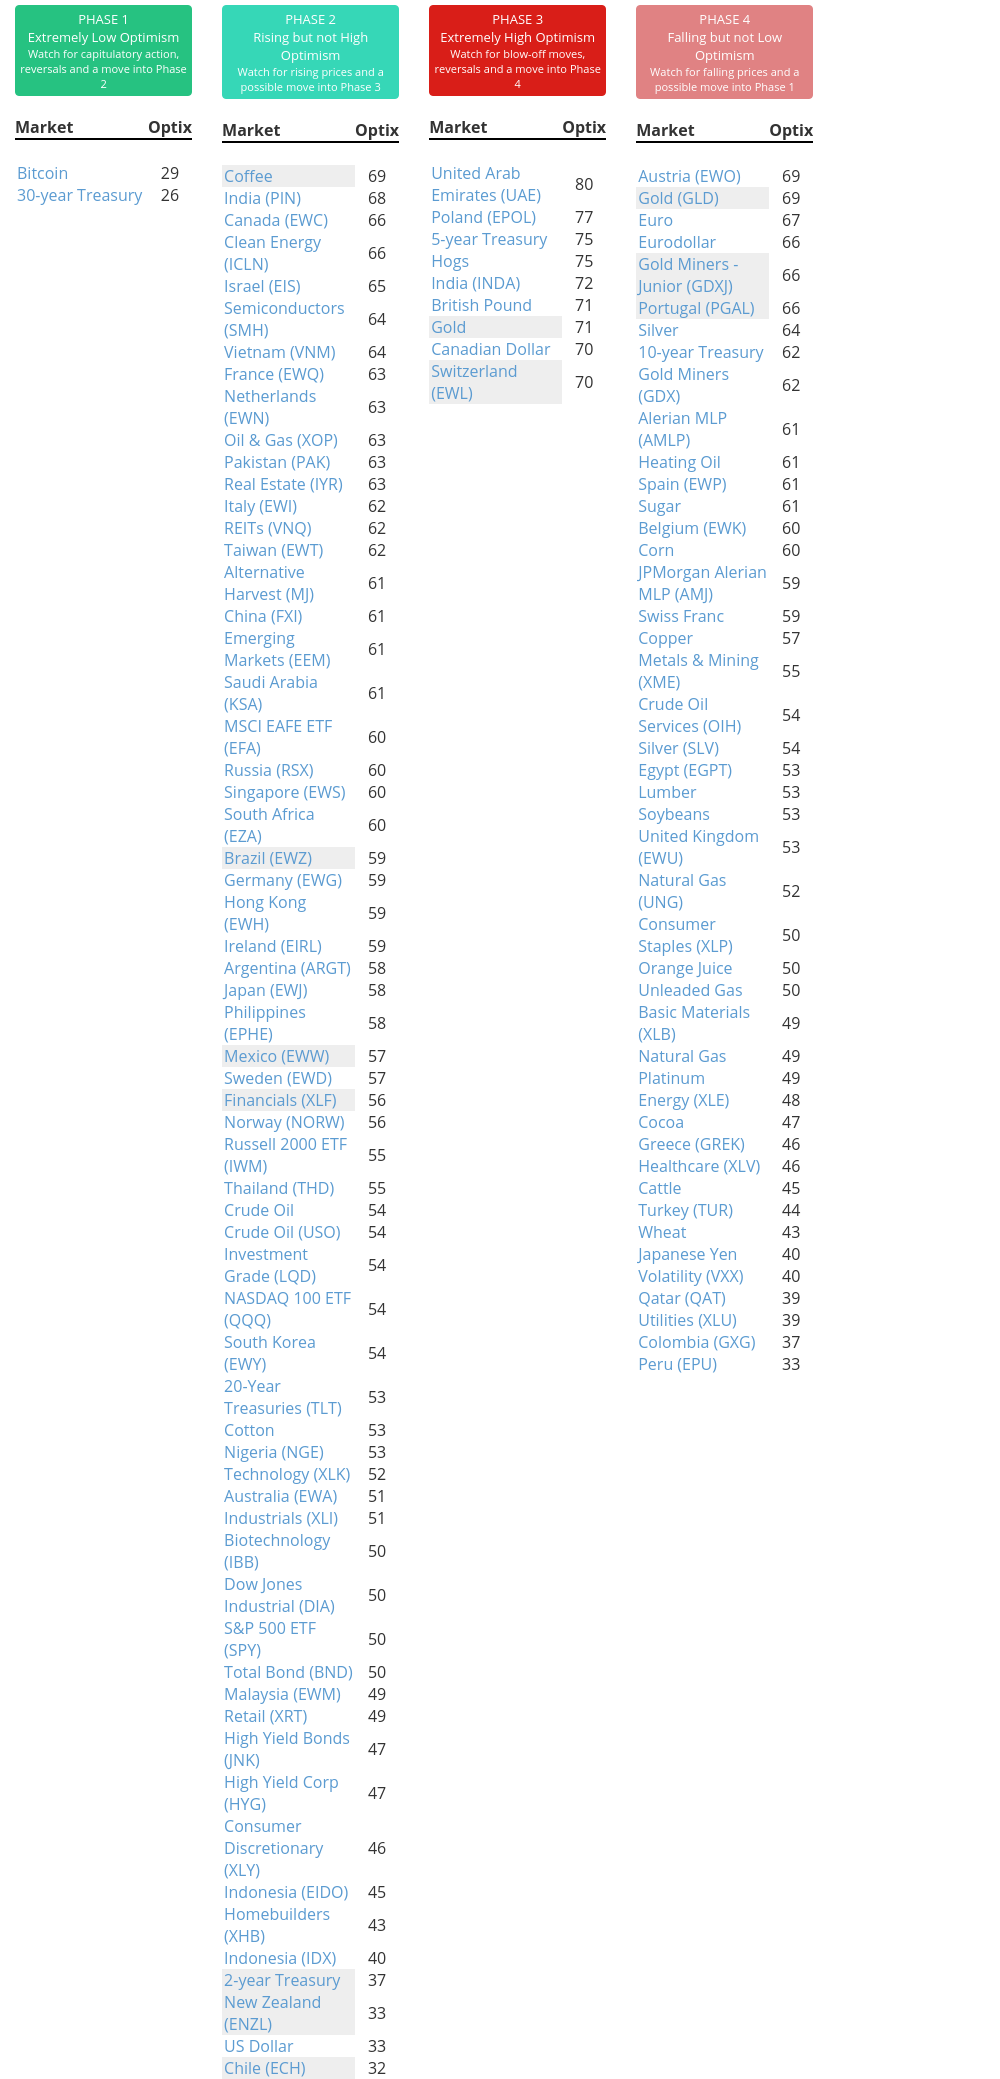
Phase Table
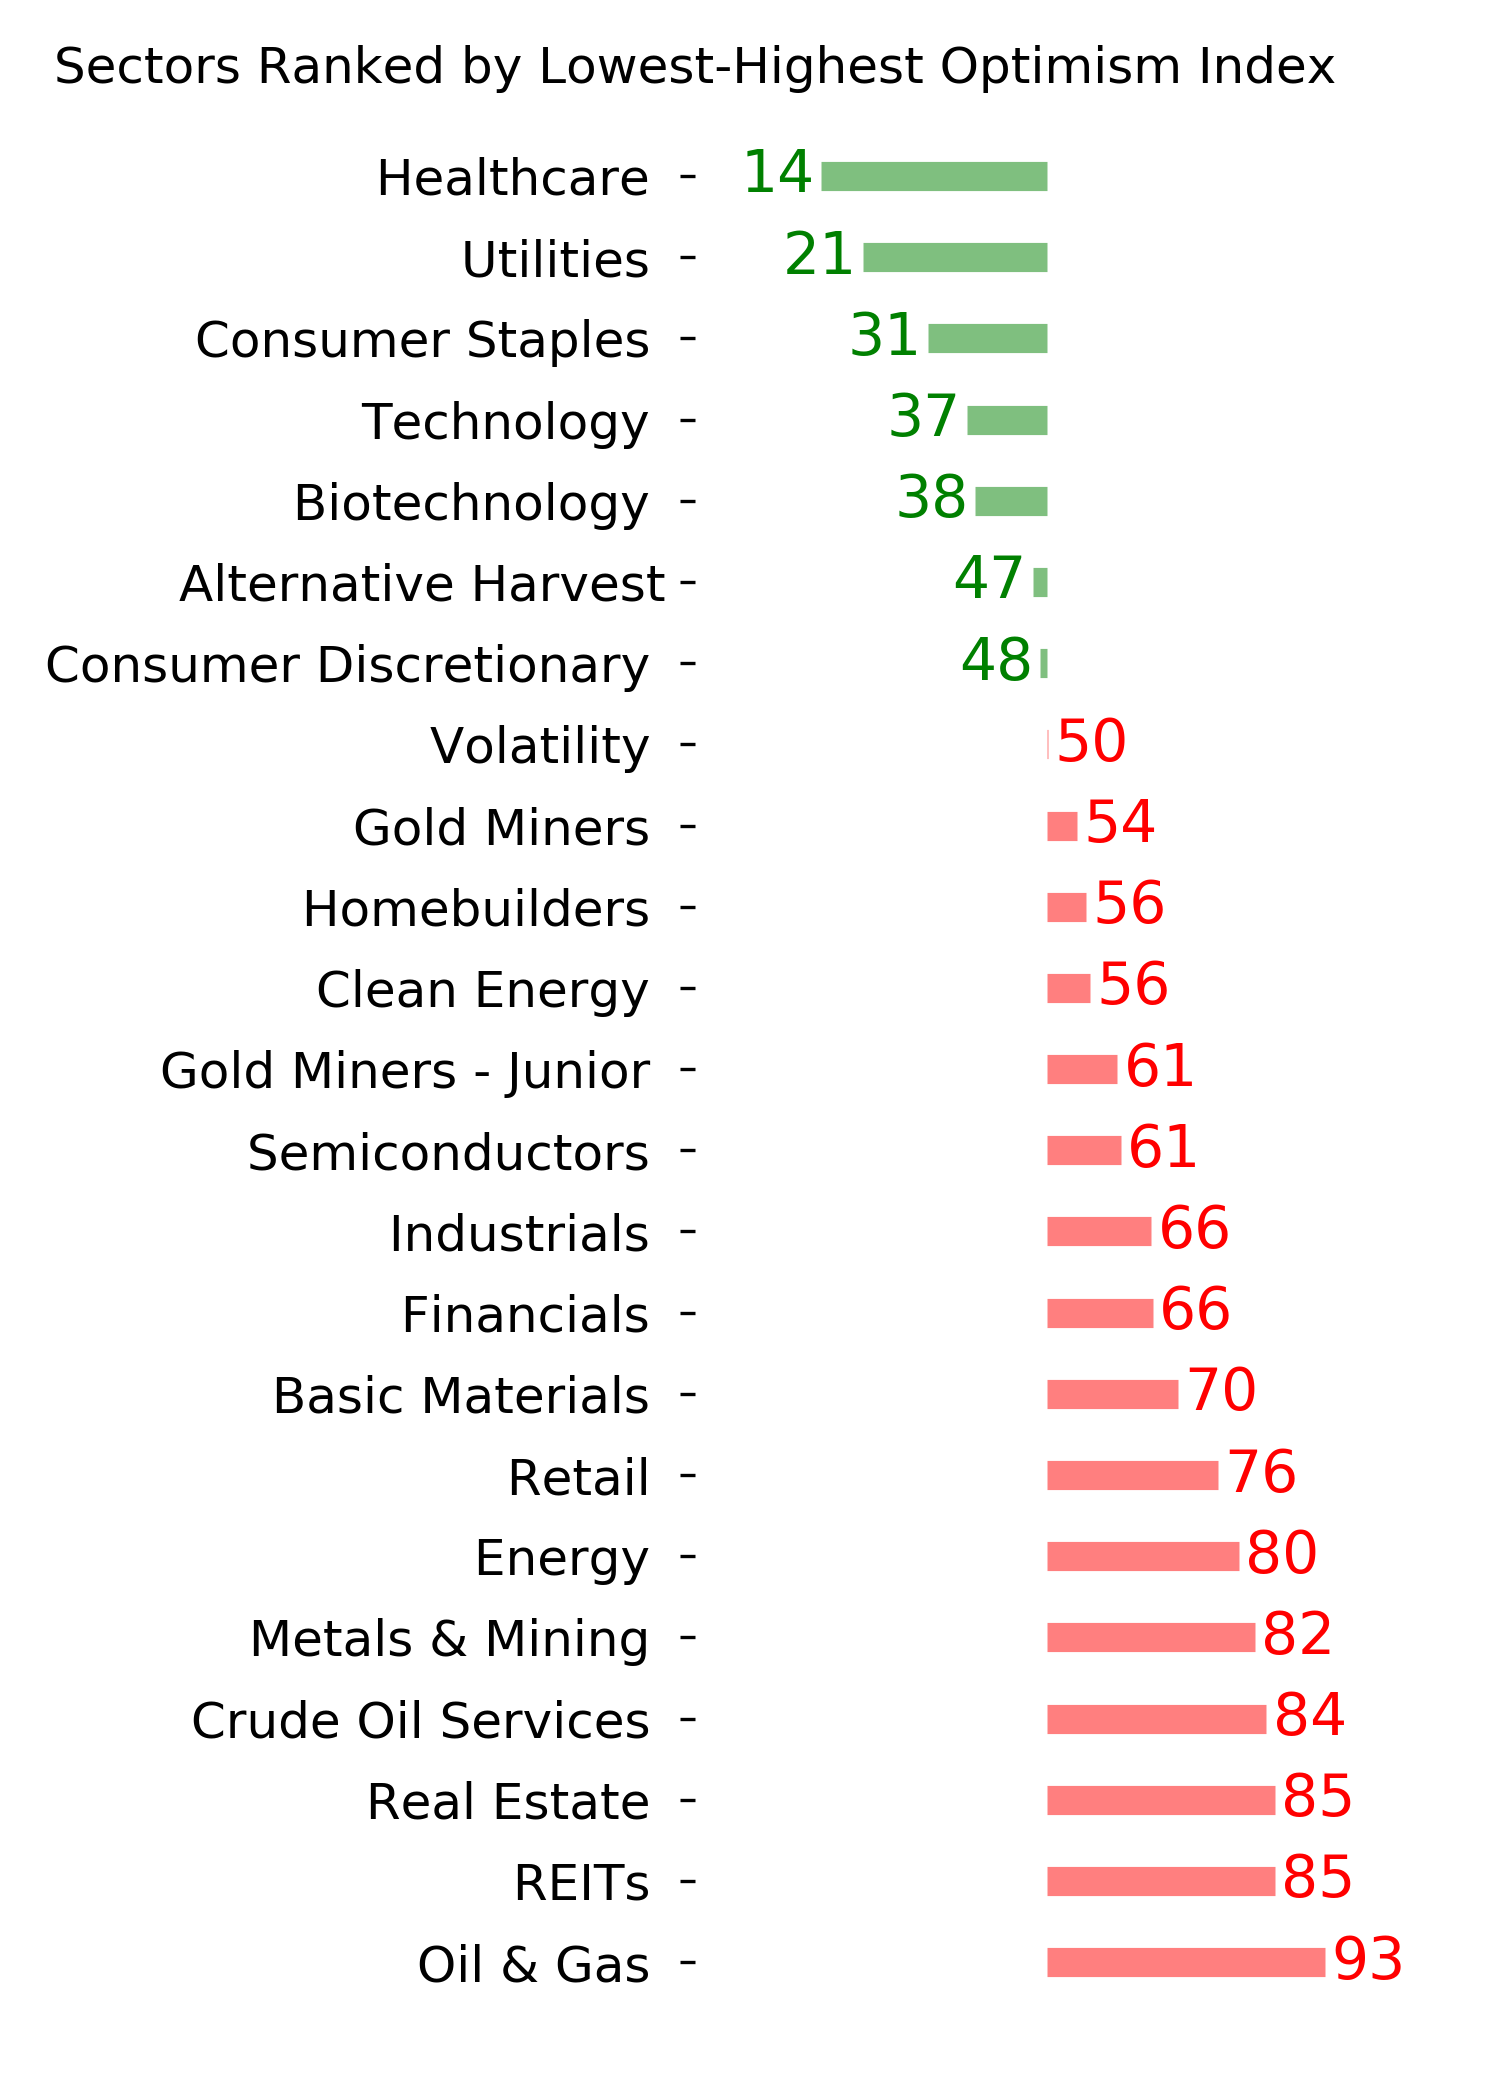
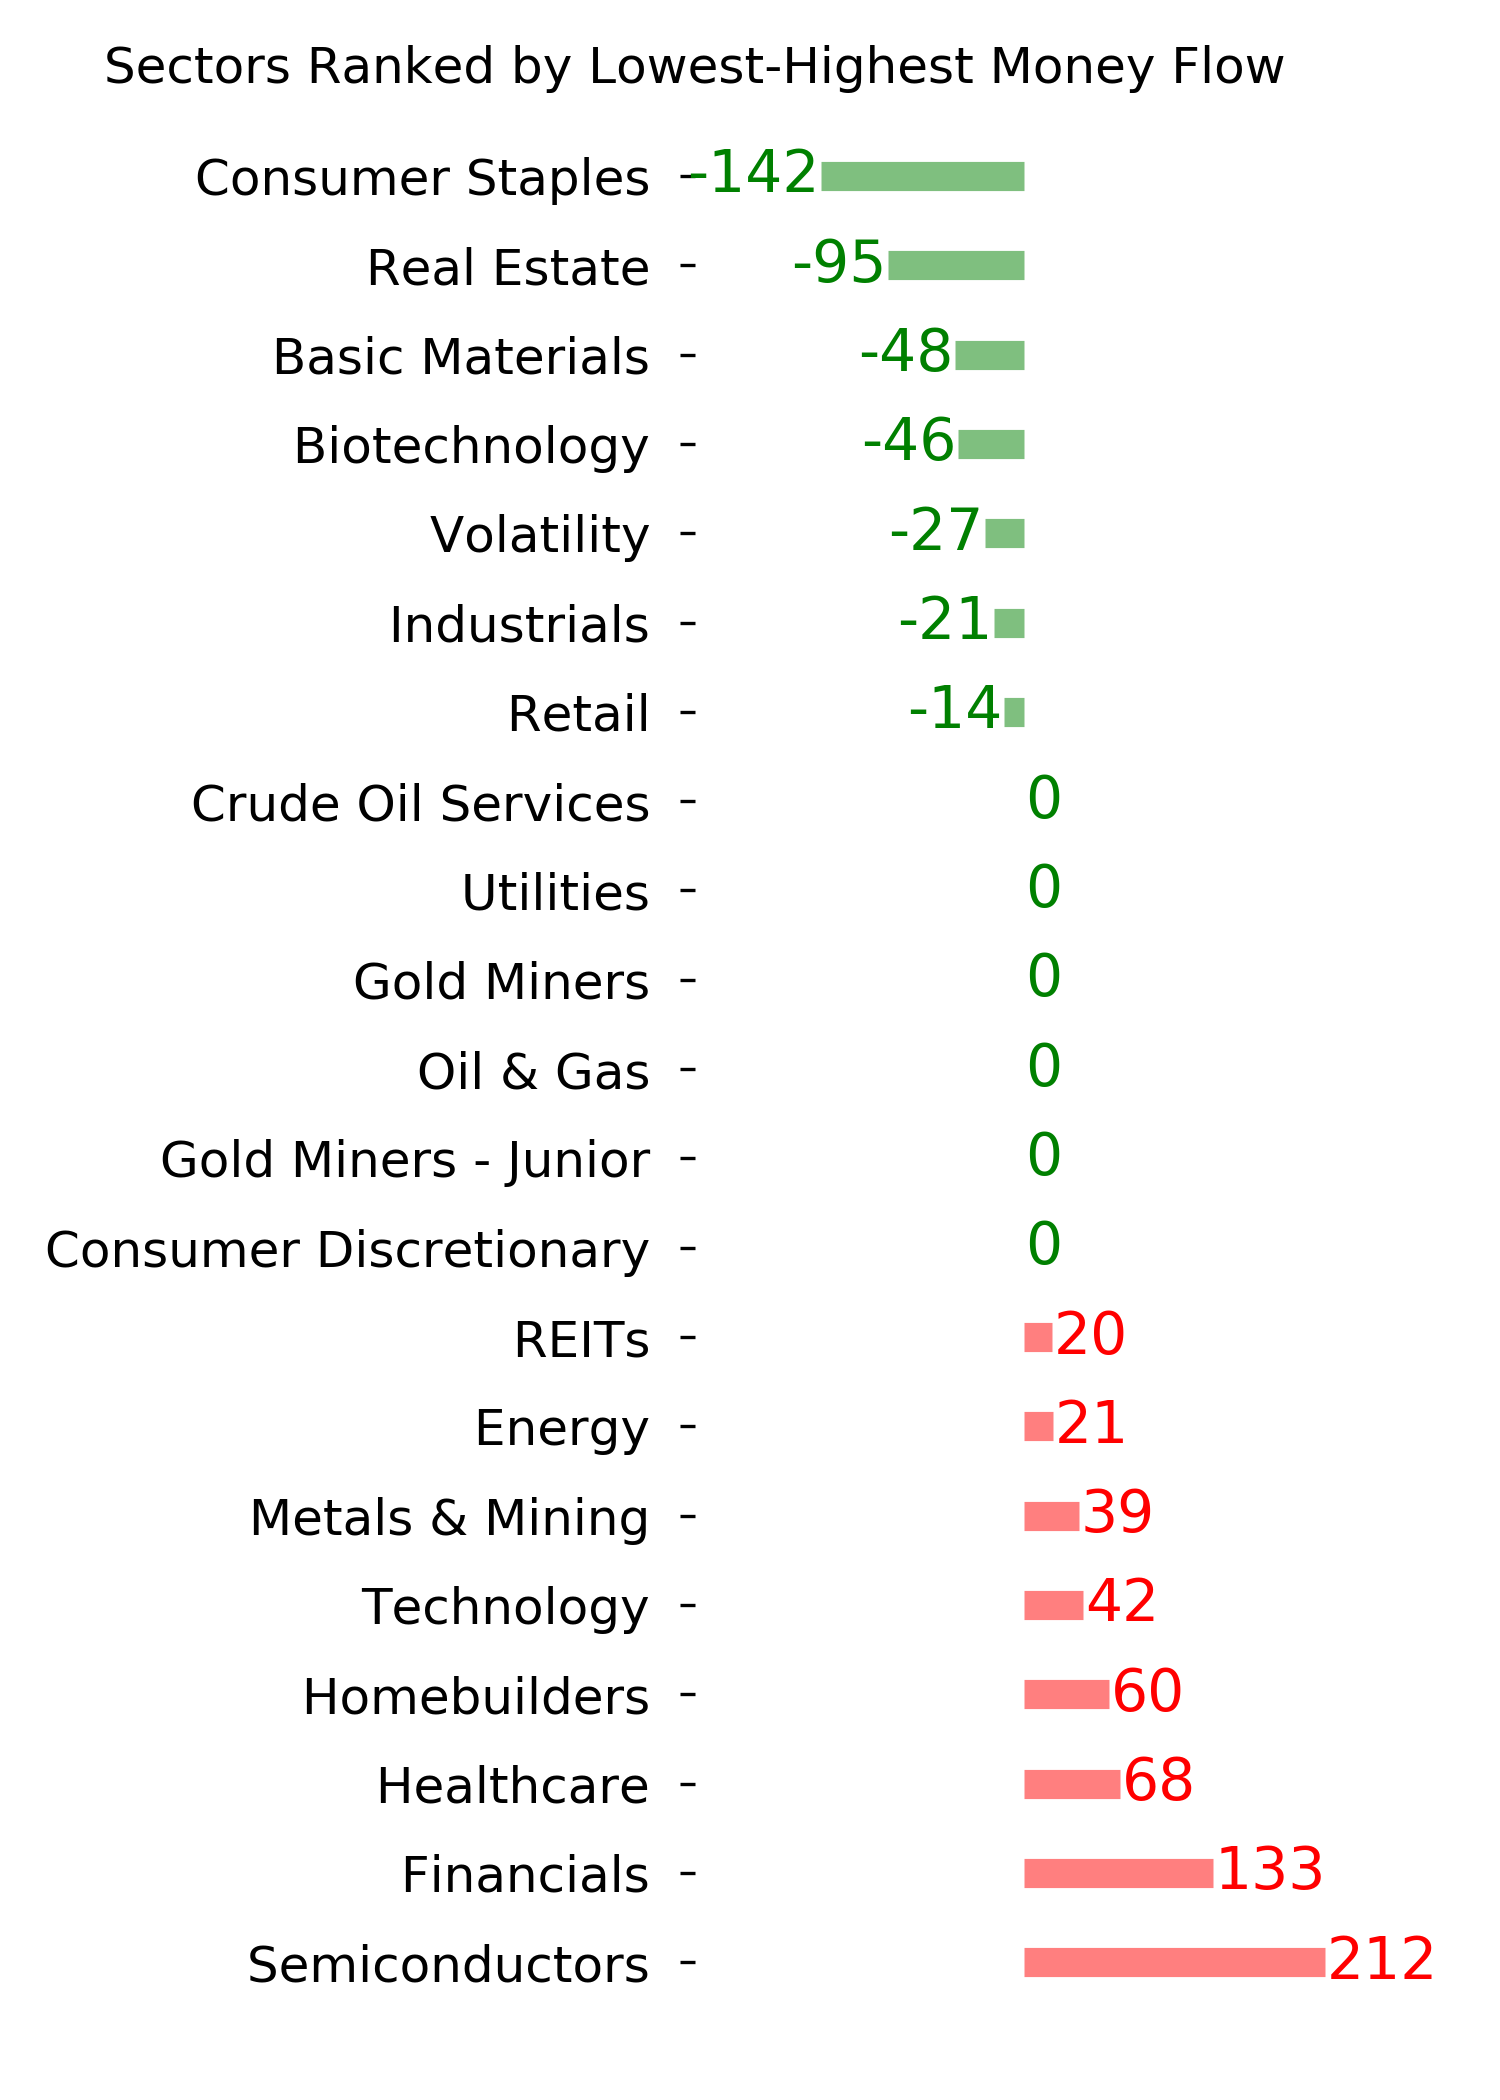
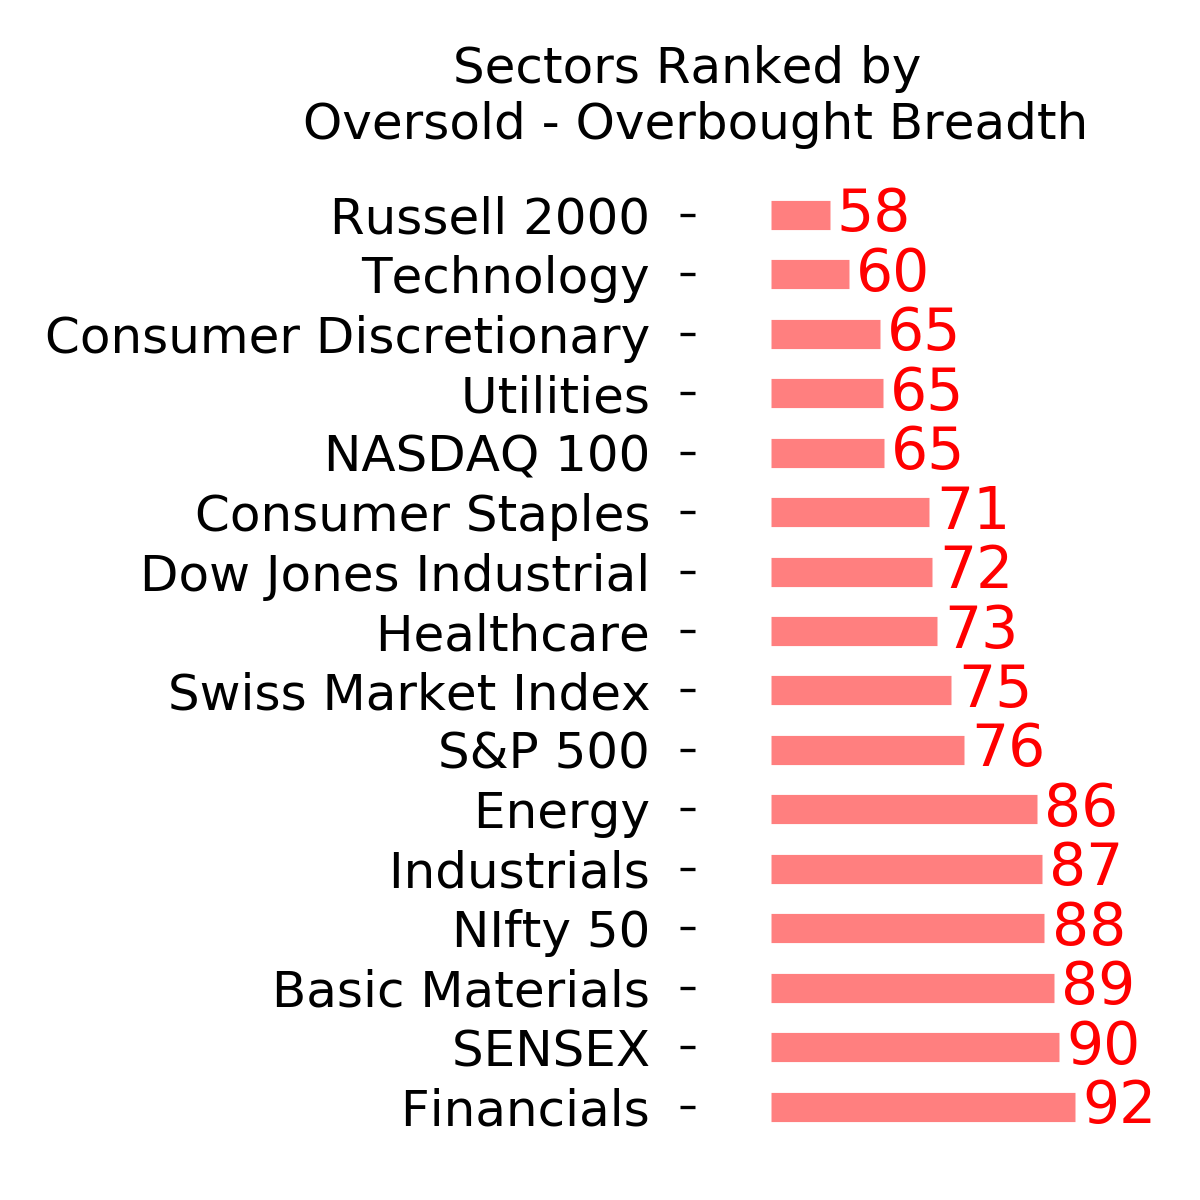
Ranks
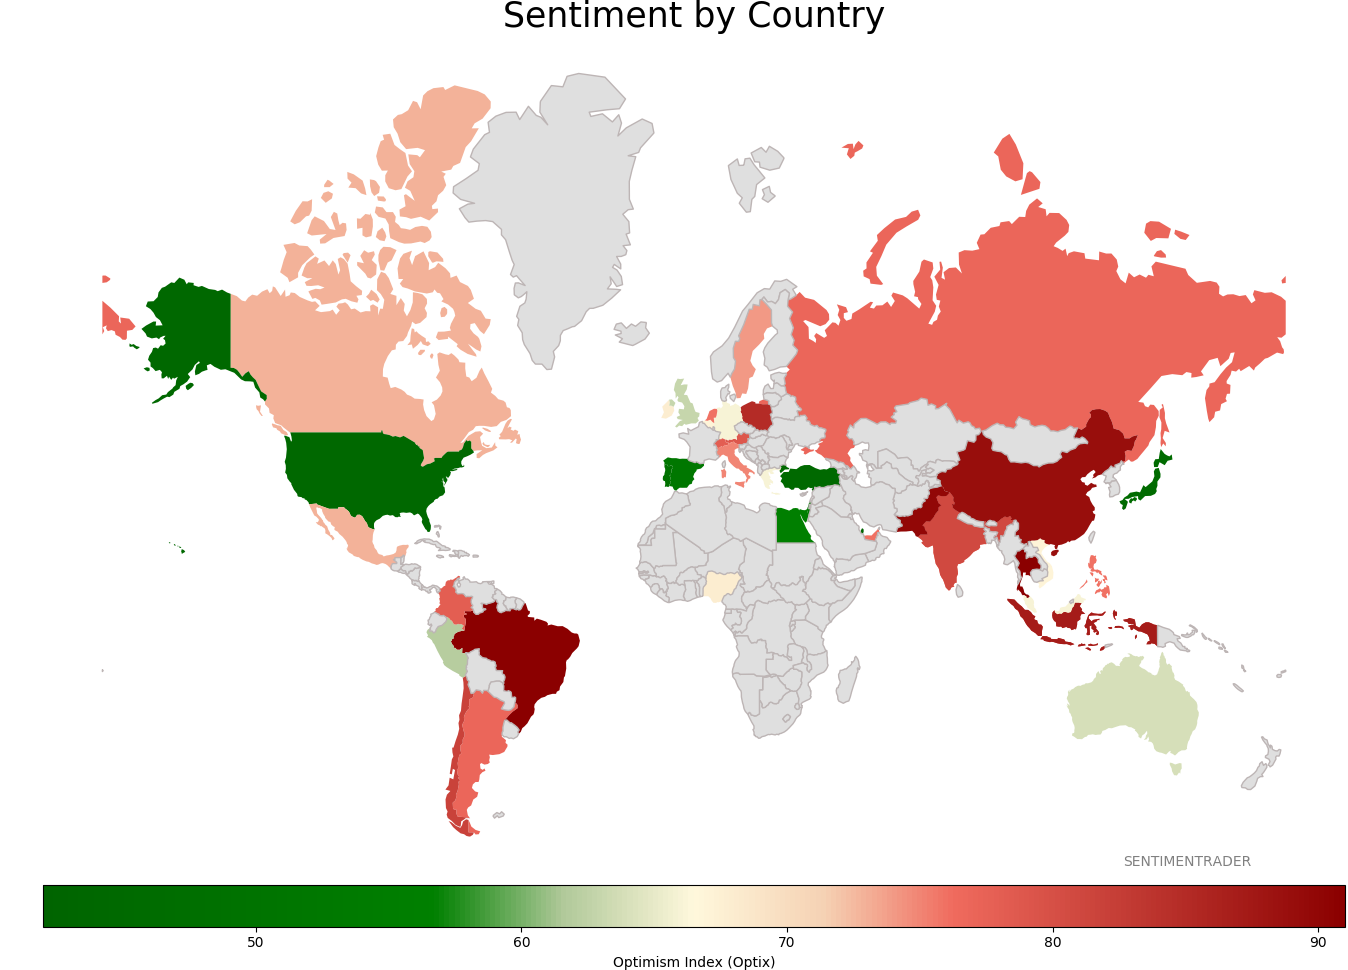
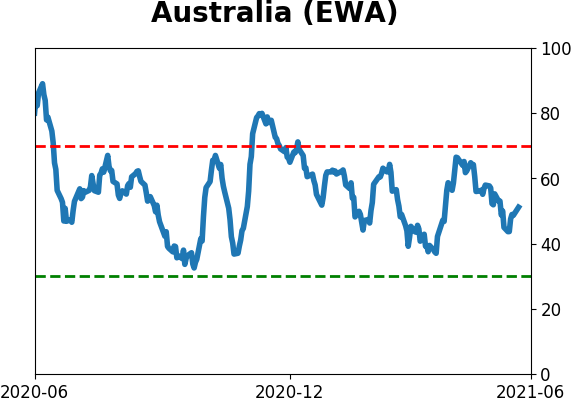
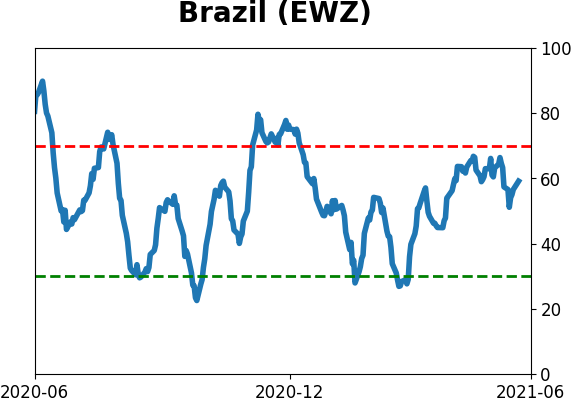
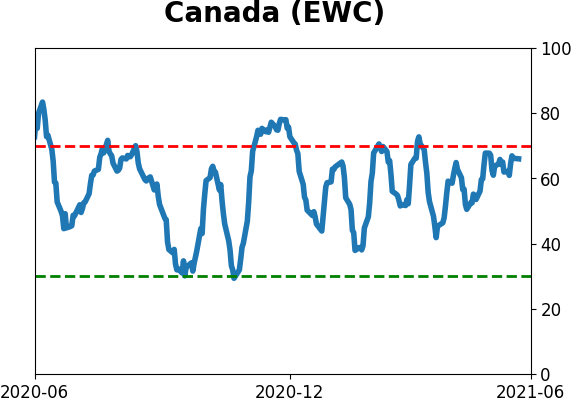
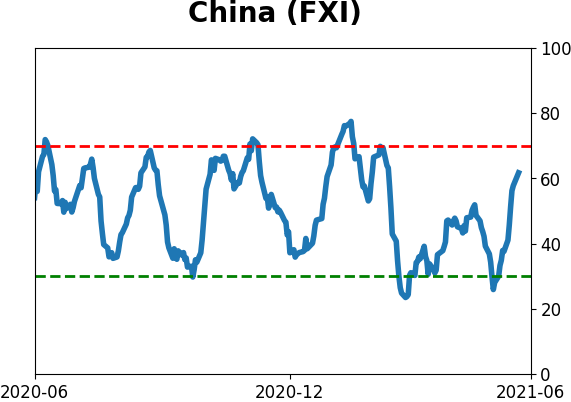
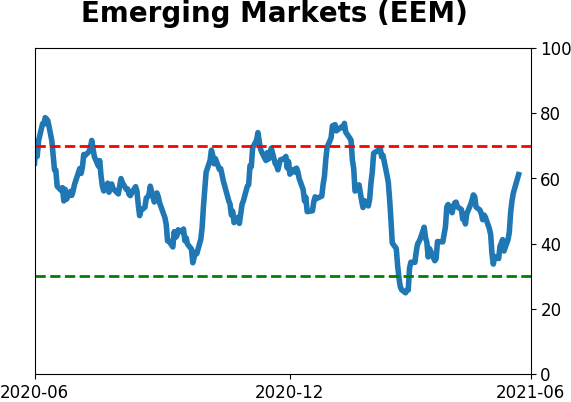
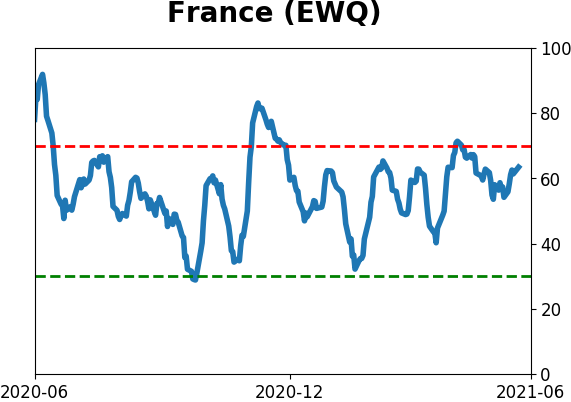
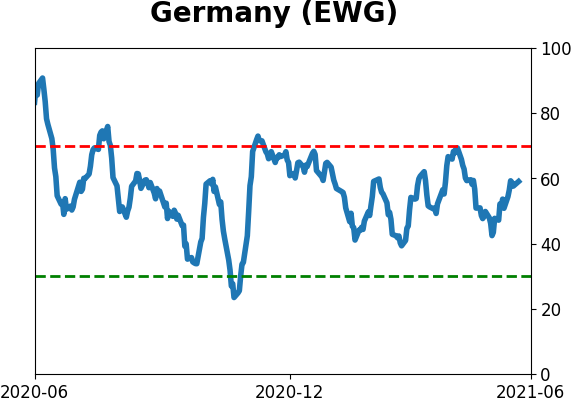
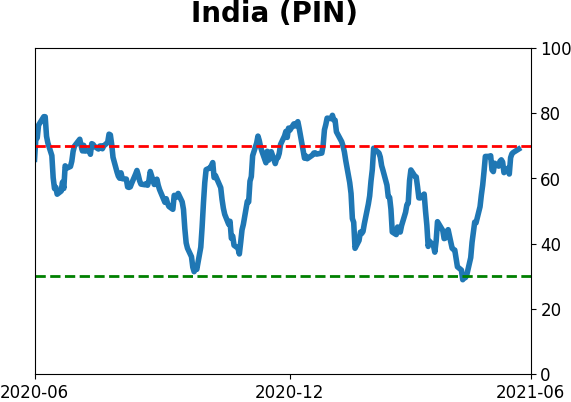
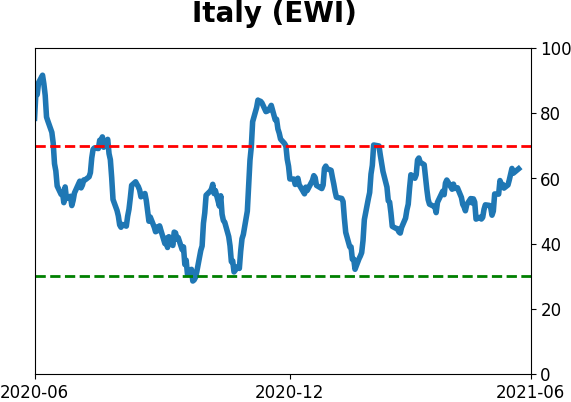
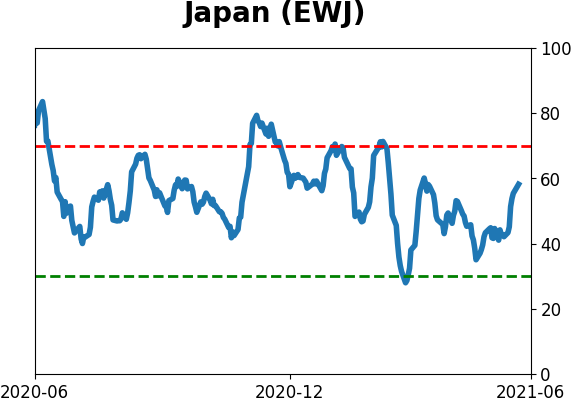
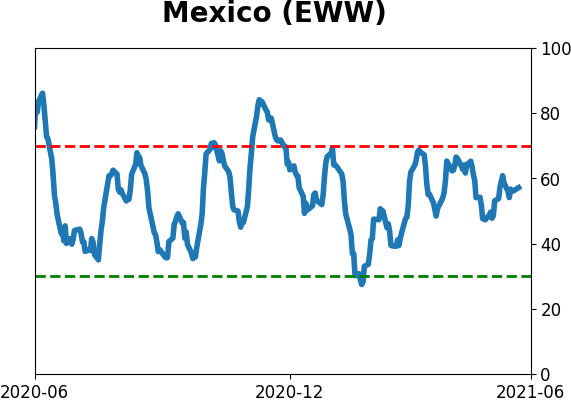
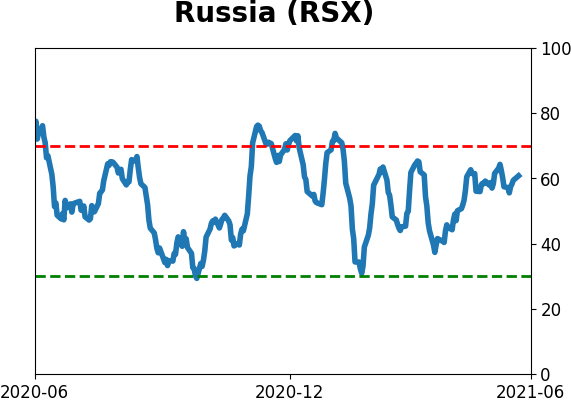
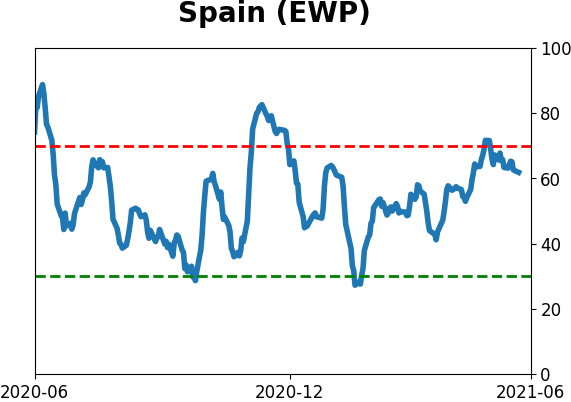
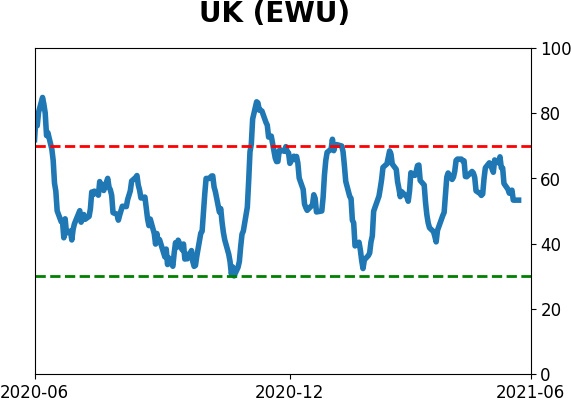
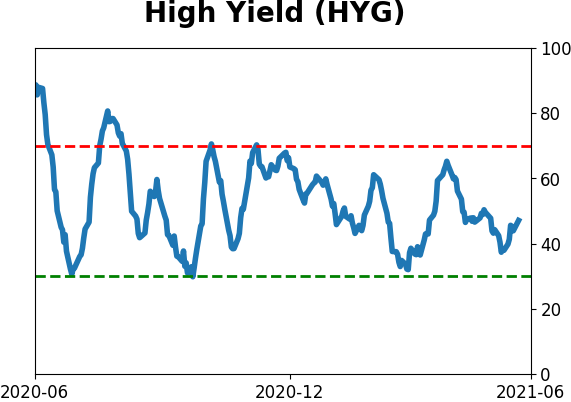
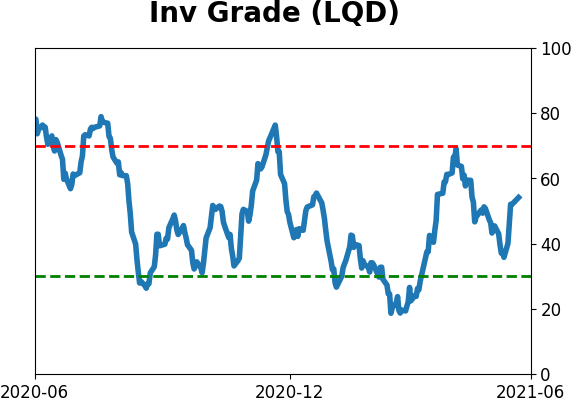
Sentiment Around The World
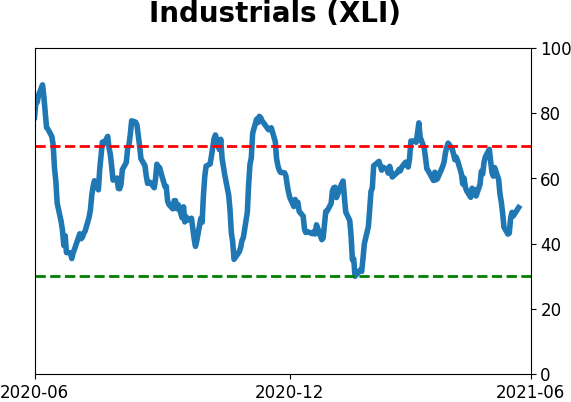
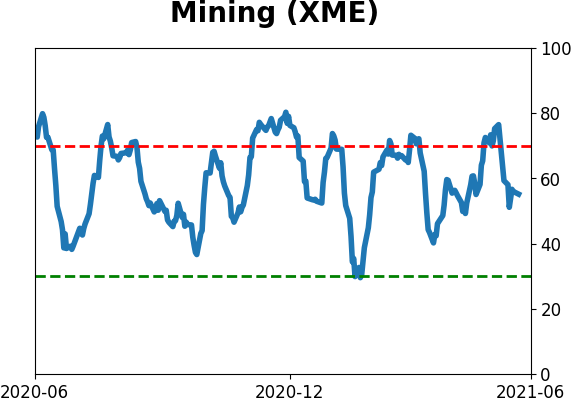
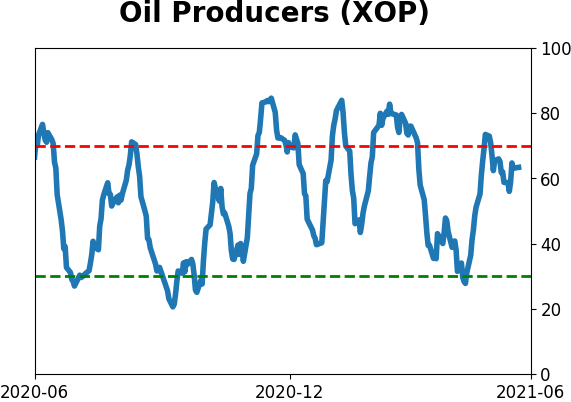
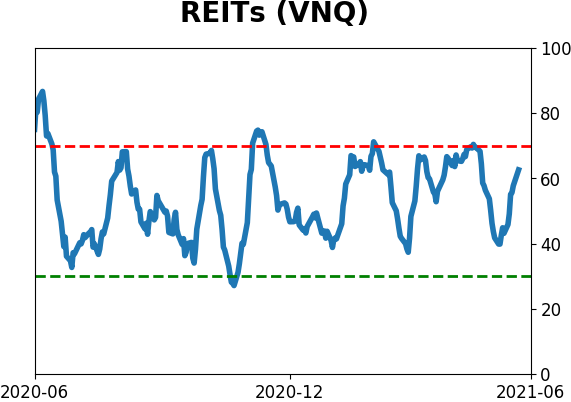
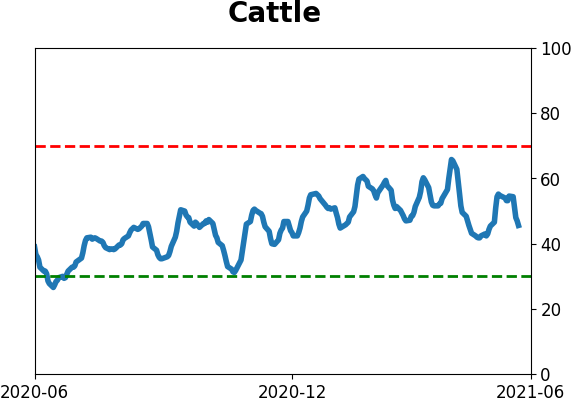
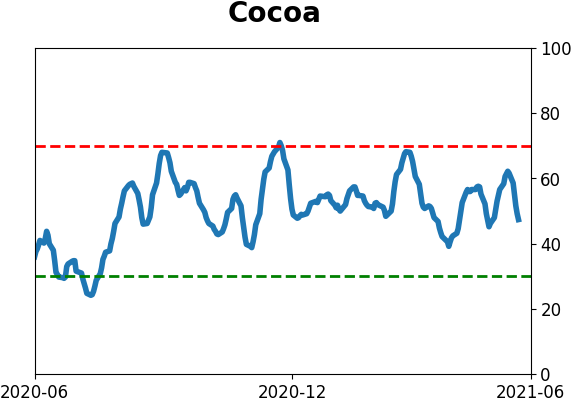
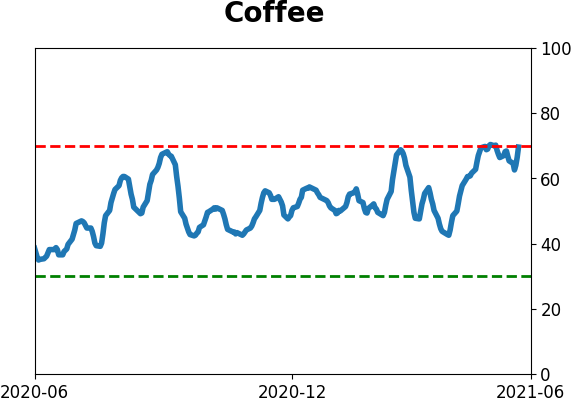
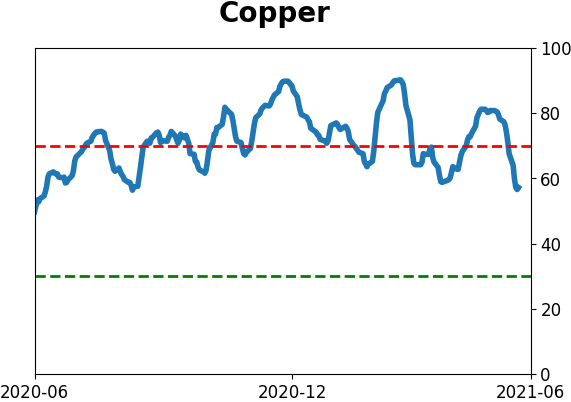
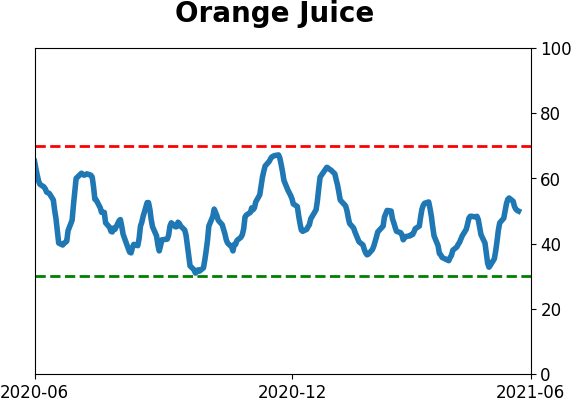
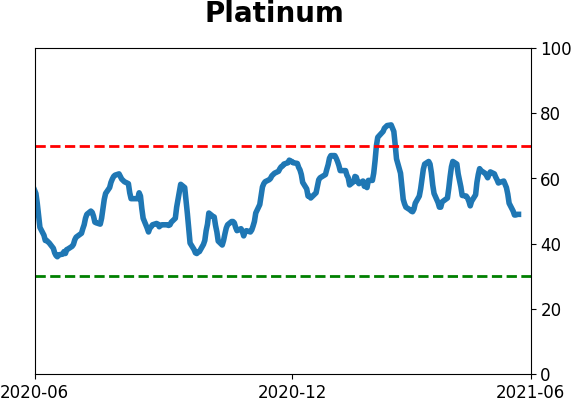
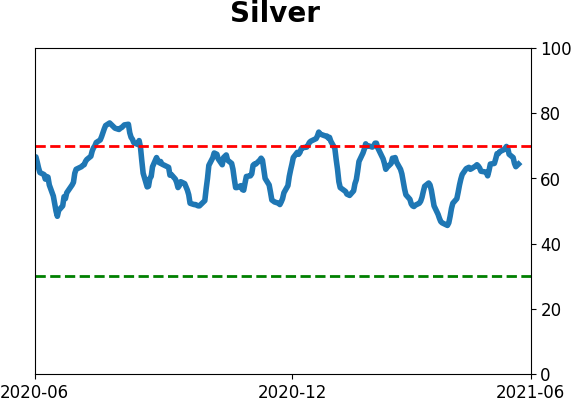
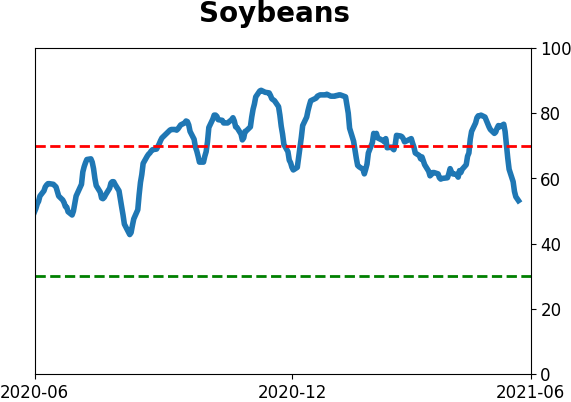
Optimism Index Thumbnails
|
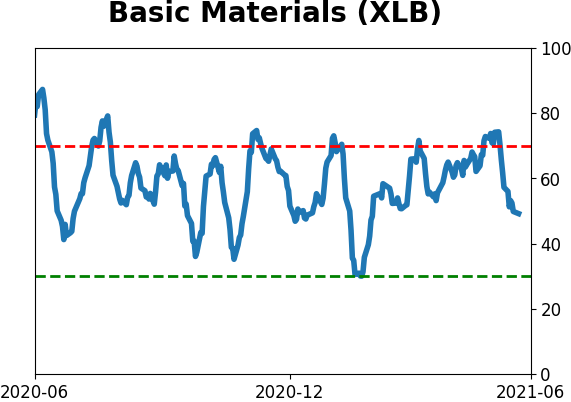
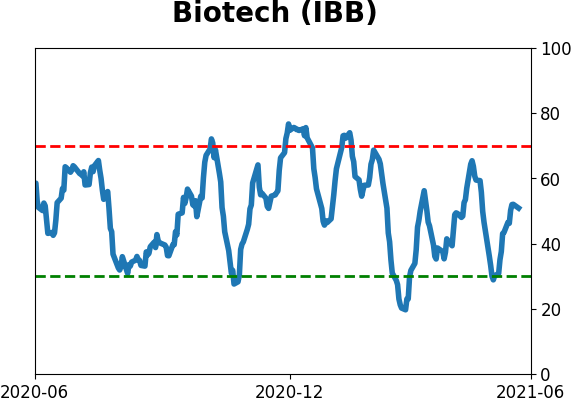
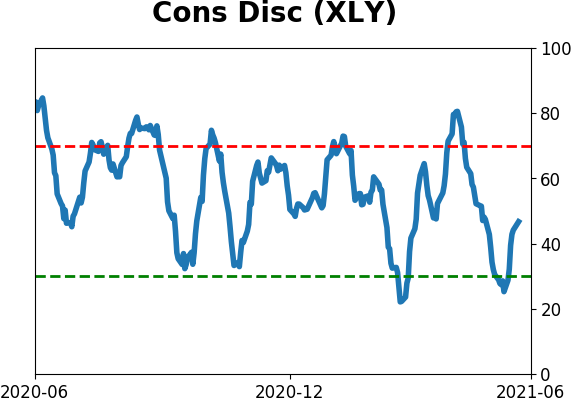
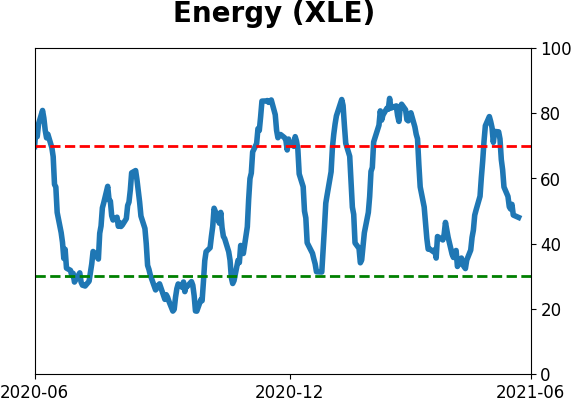
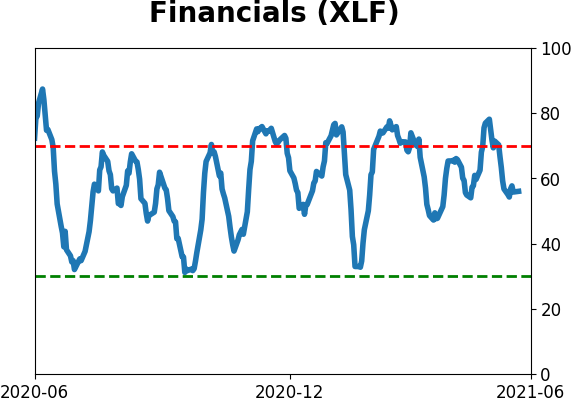
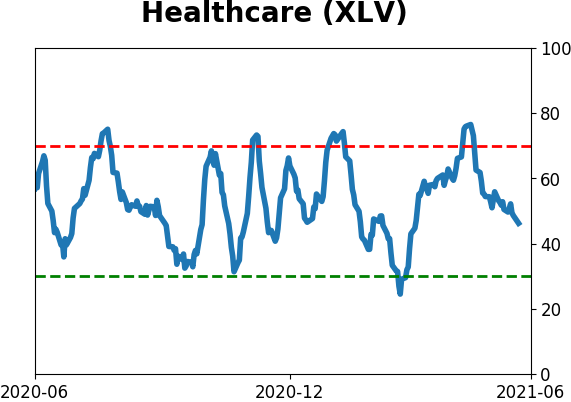
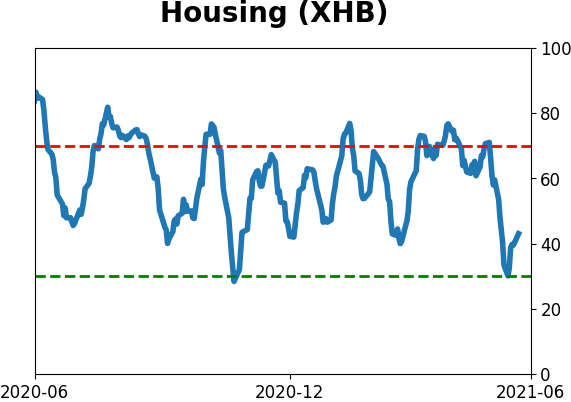
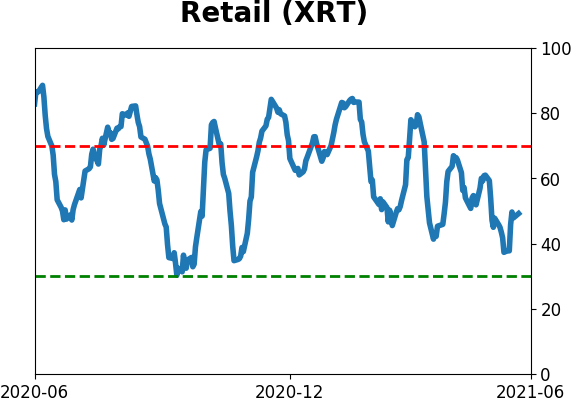
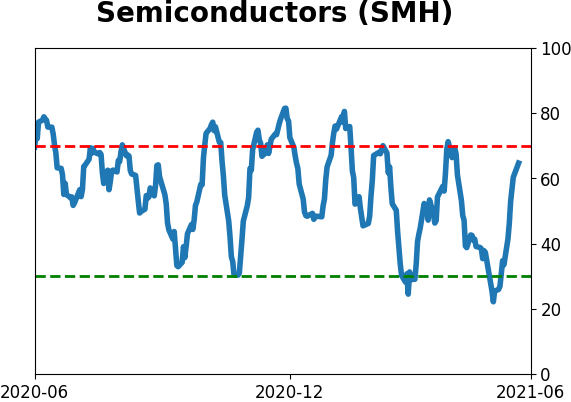
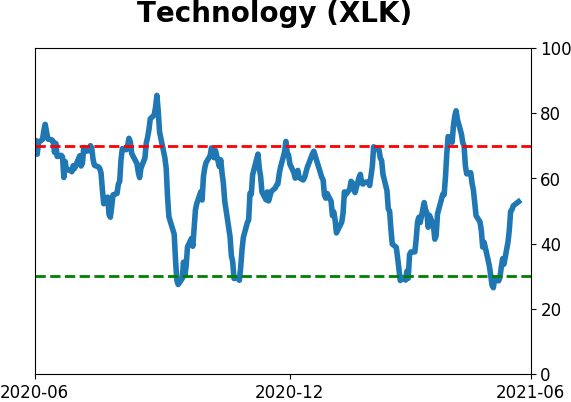
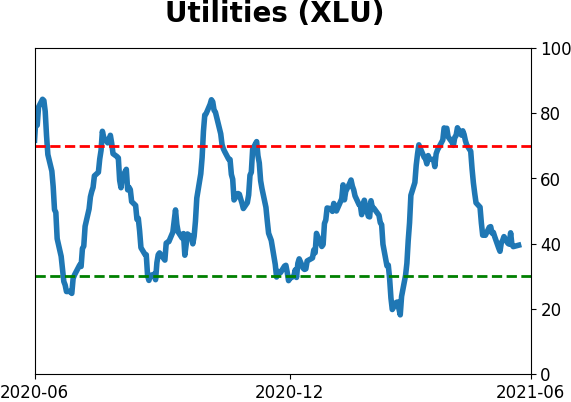
Sector ETF's - 10-Day Moving Average
|
|
|
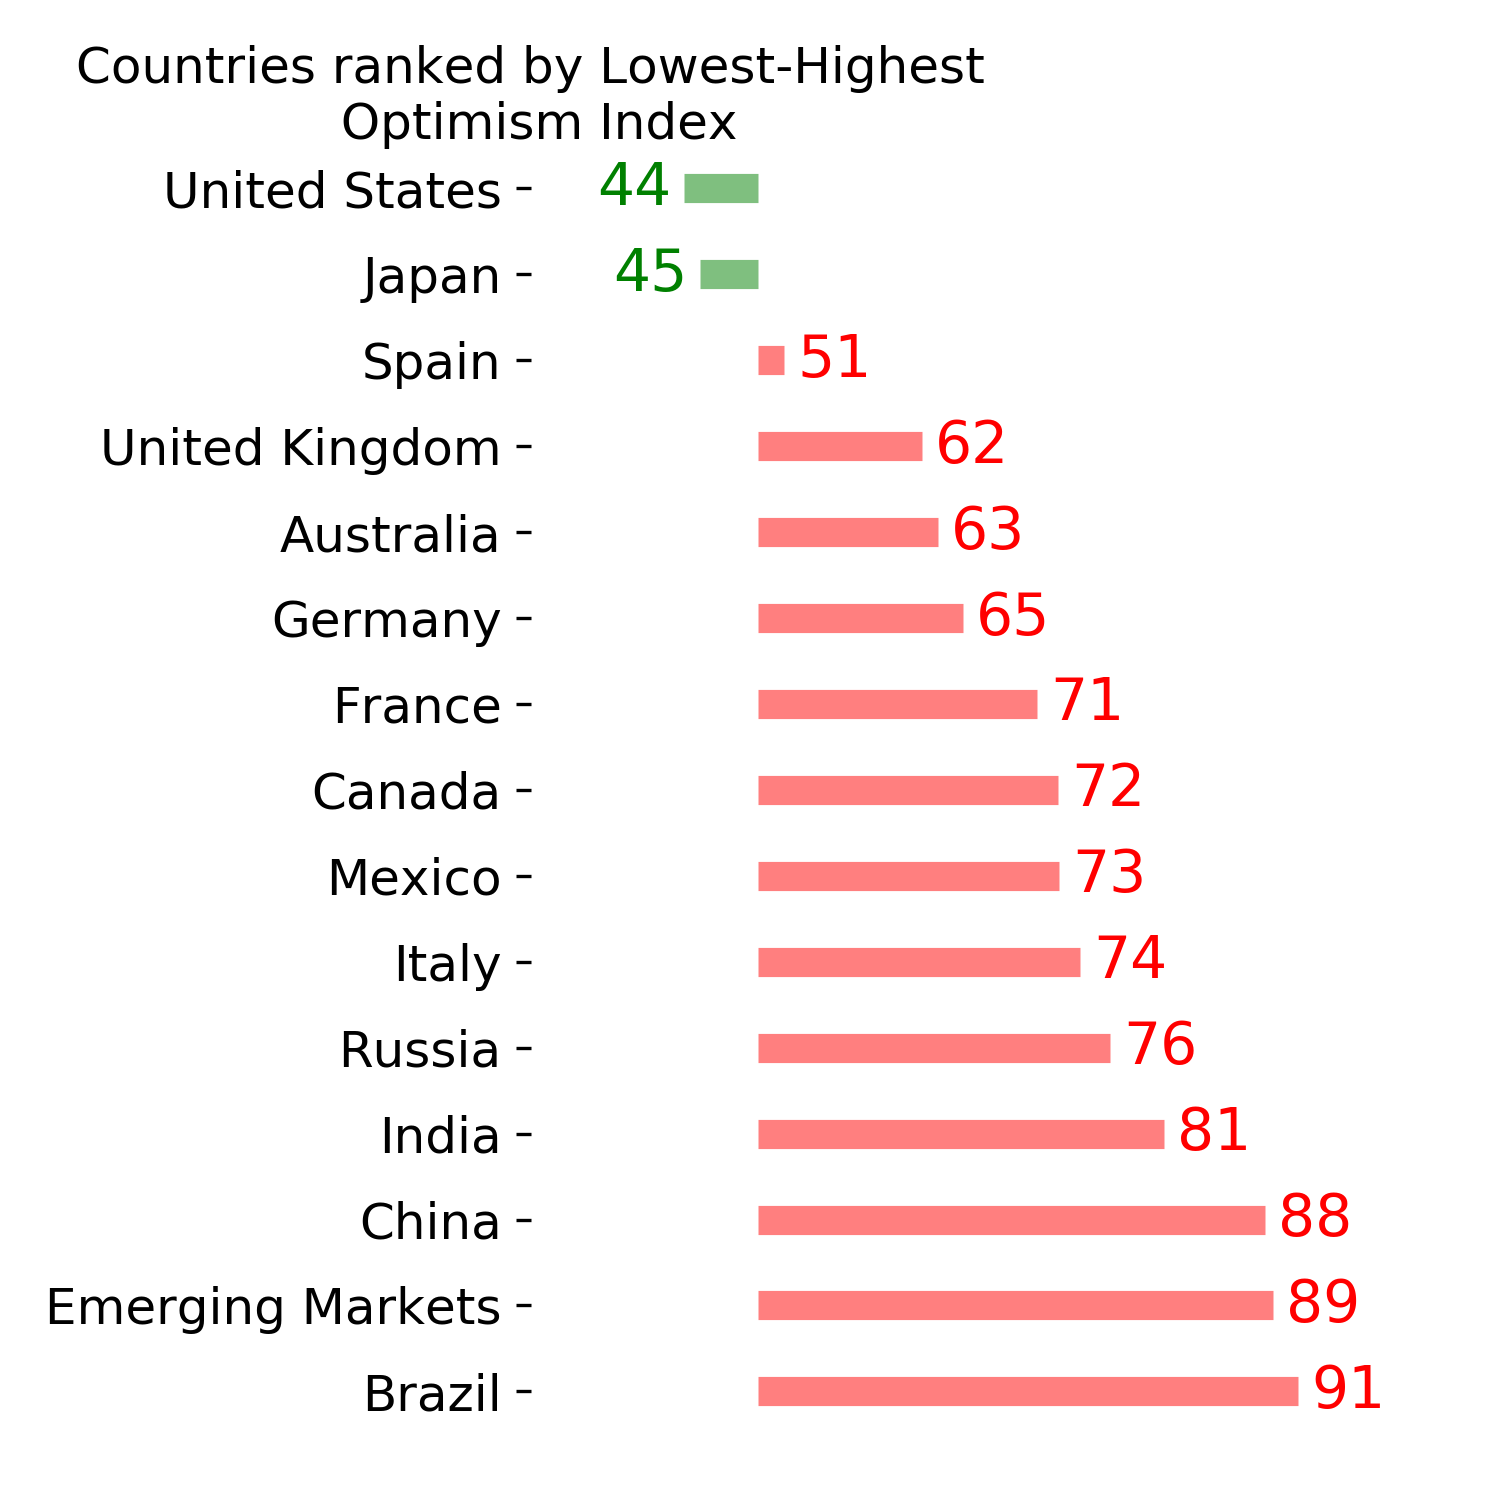
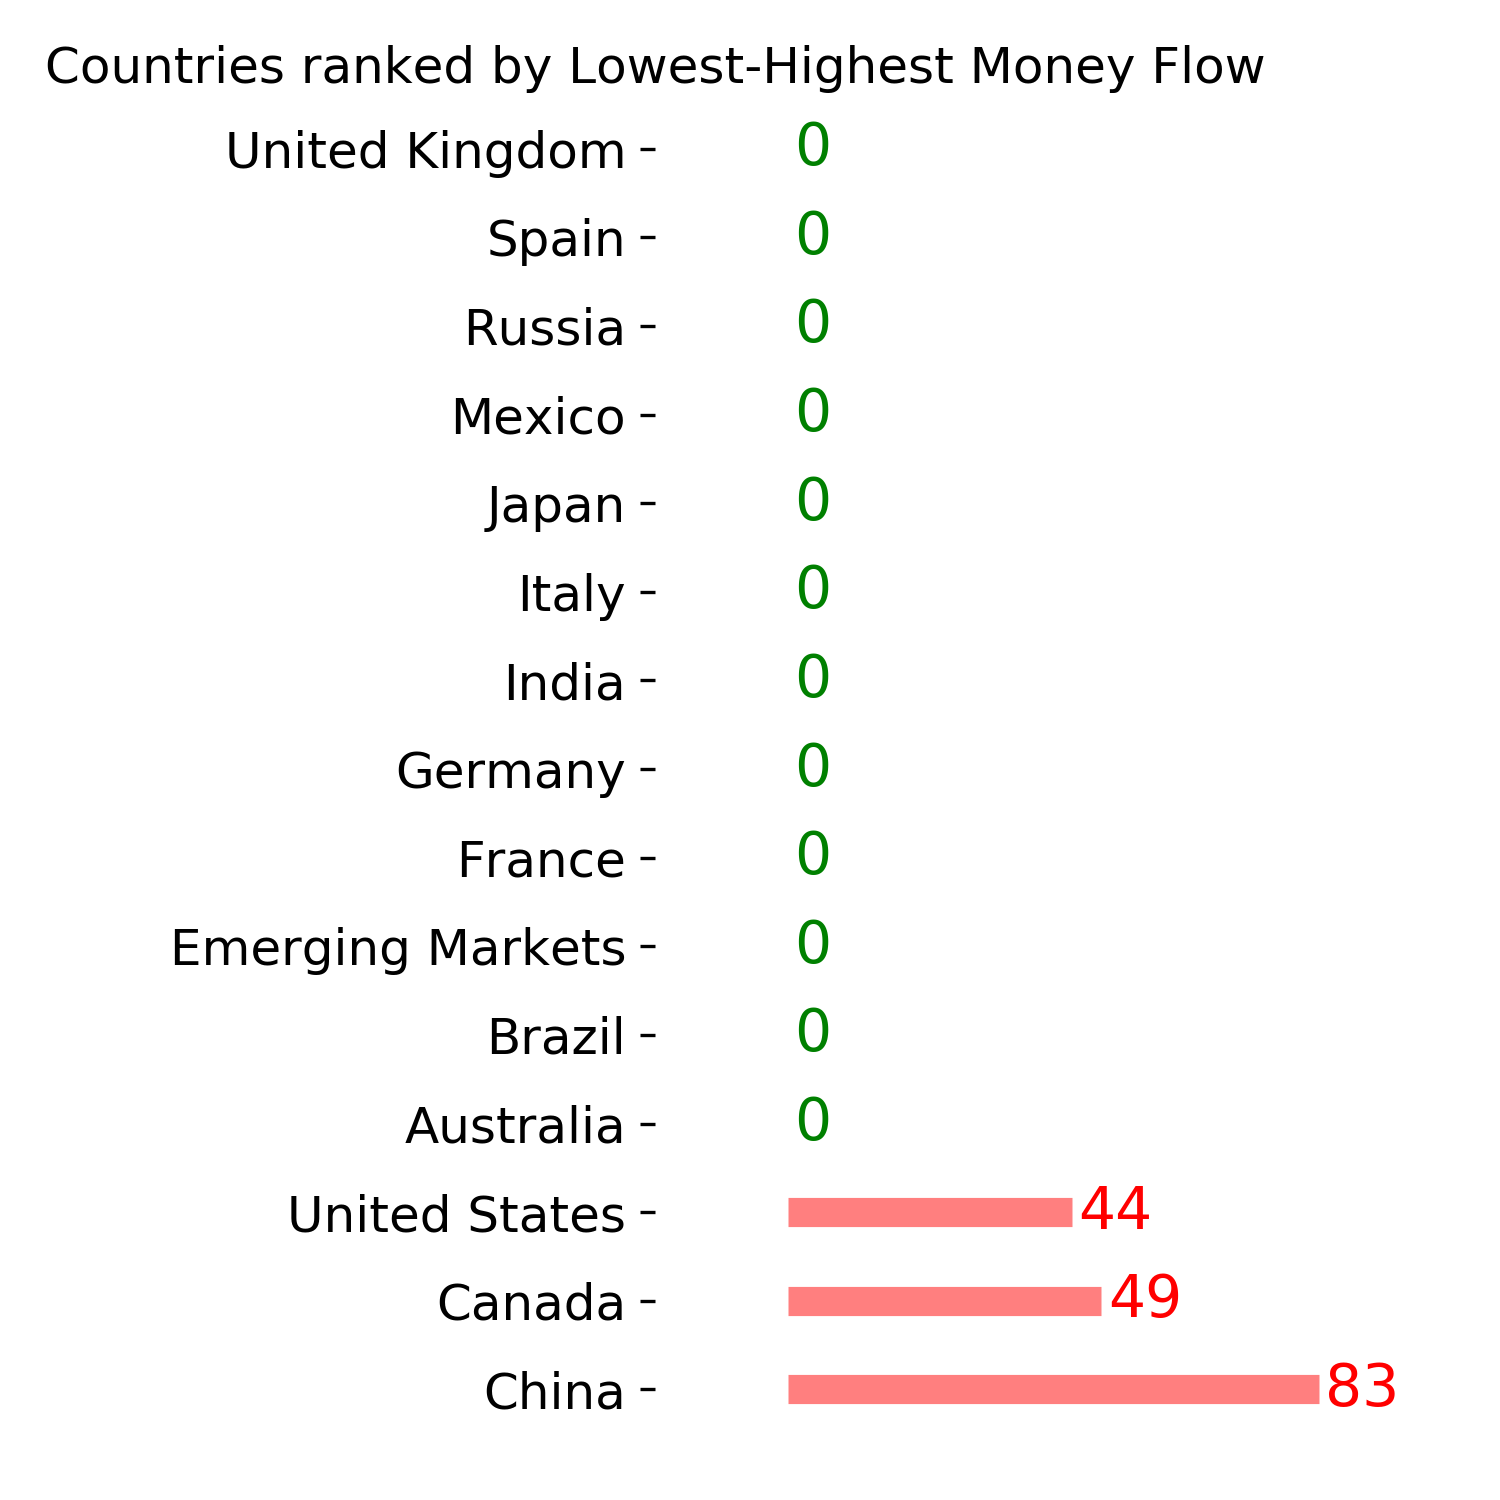
Country ETF's - 10-Day Moving Average
|
|
|
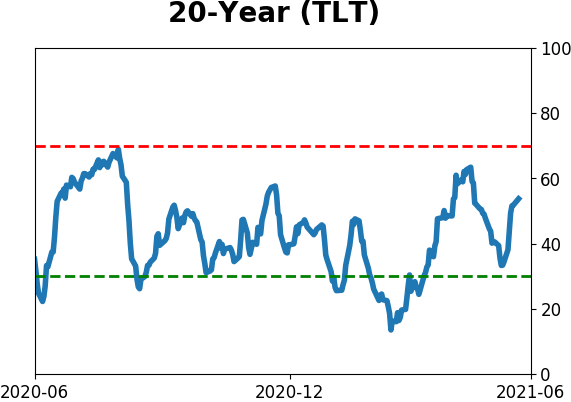
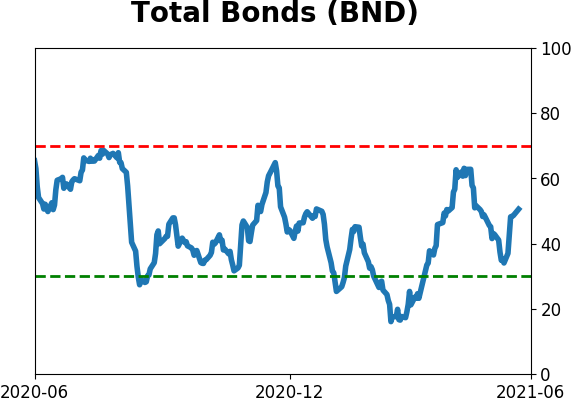
Bond ETF's - 10-Day Moving Average
|
|
|
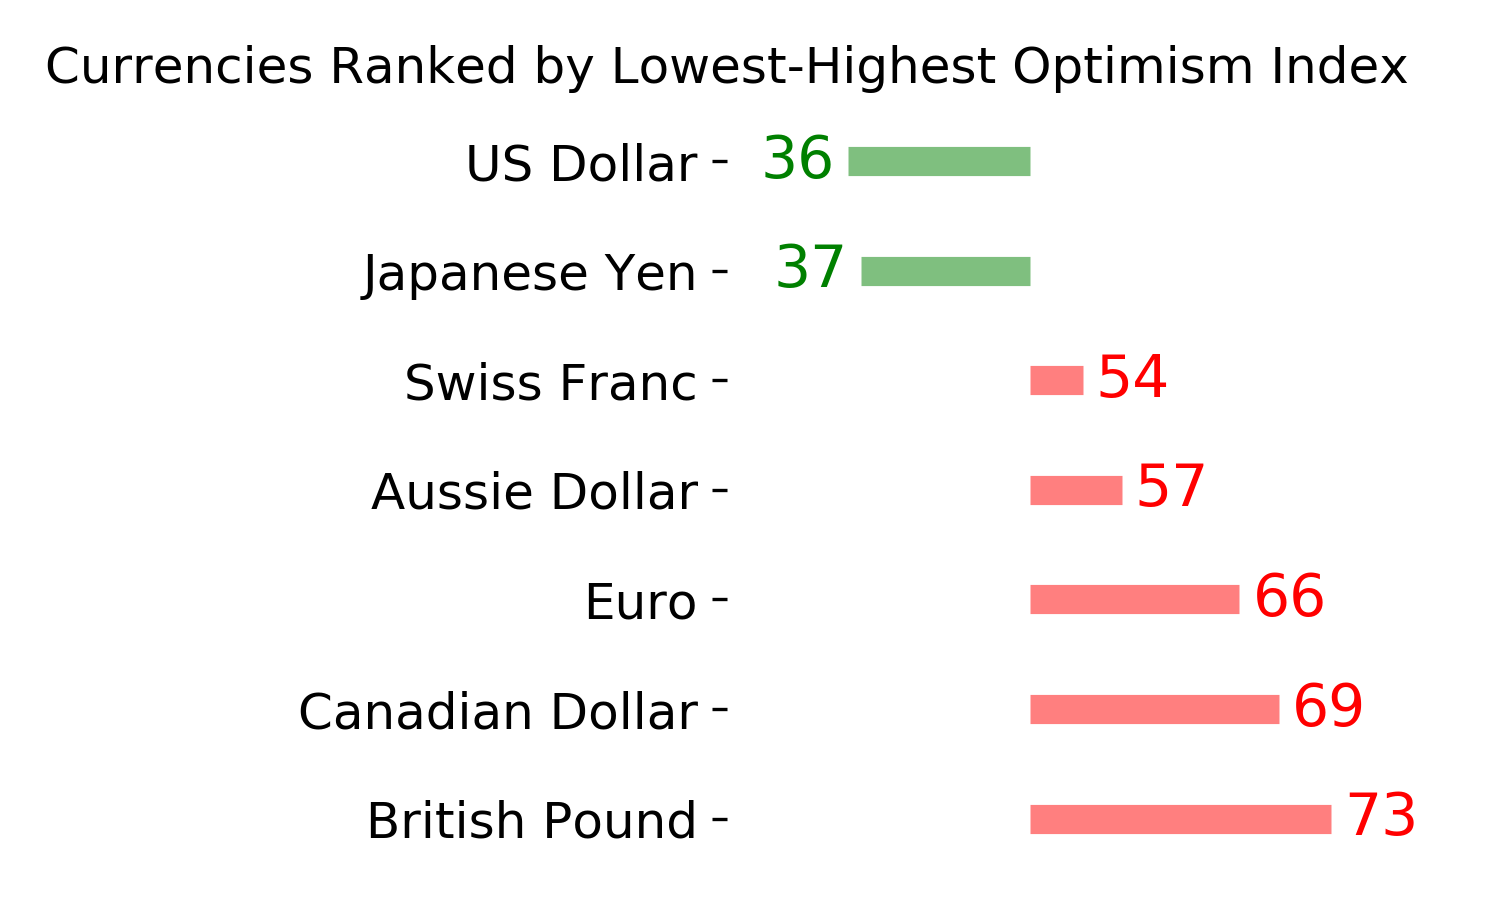
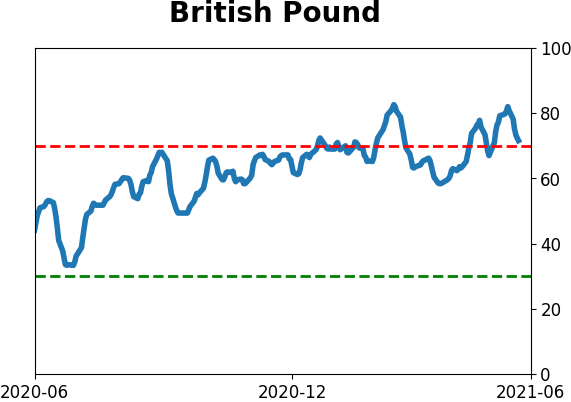
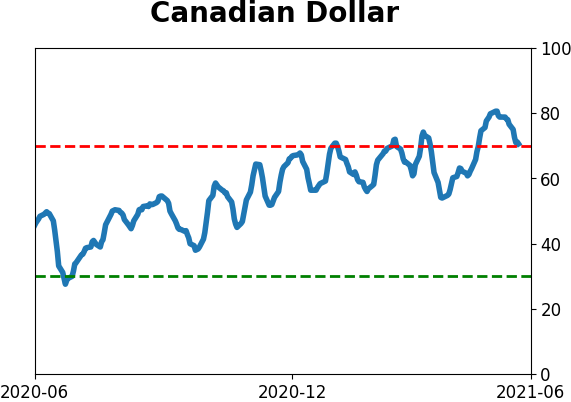
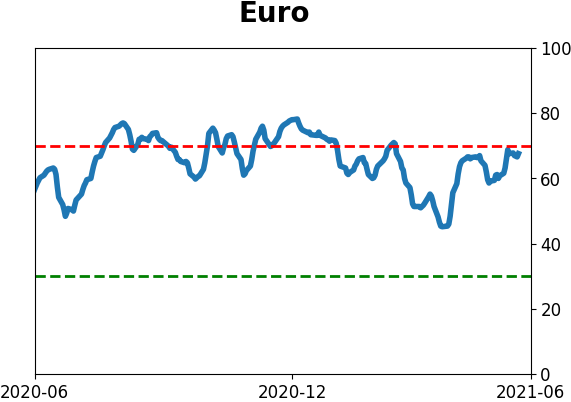
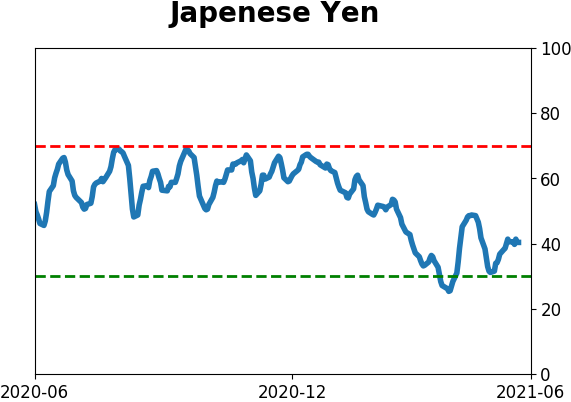
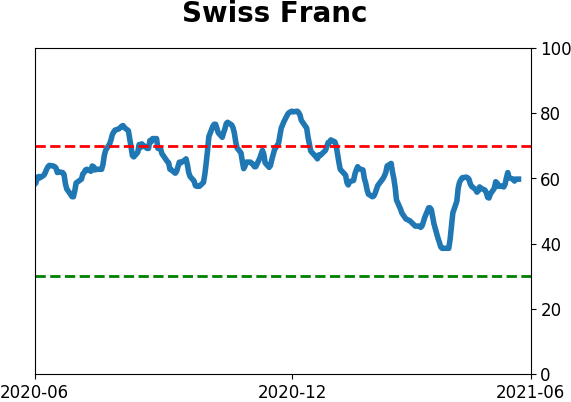
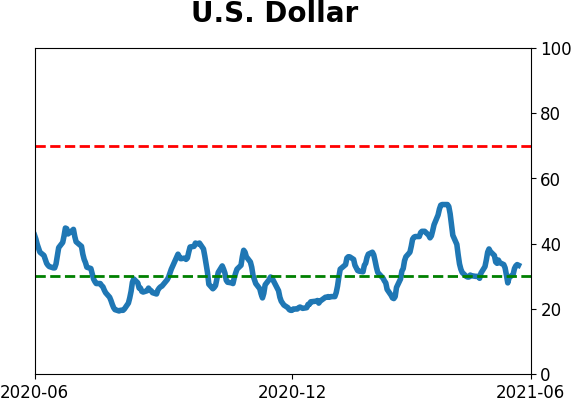
Currency ETF's - 5-Day Moving Average
|
|
|
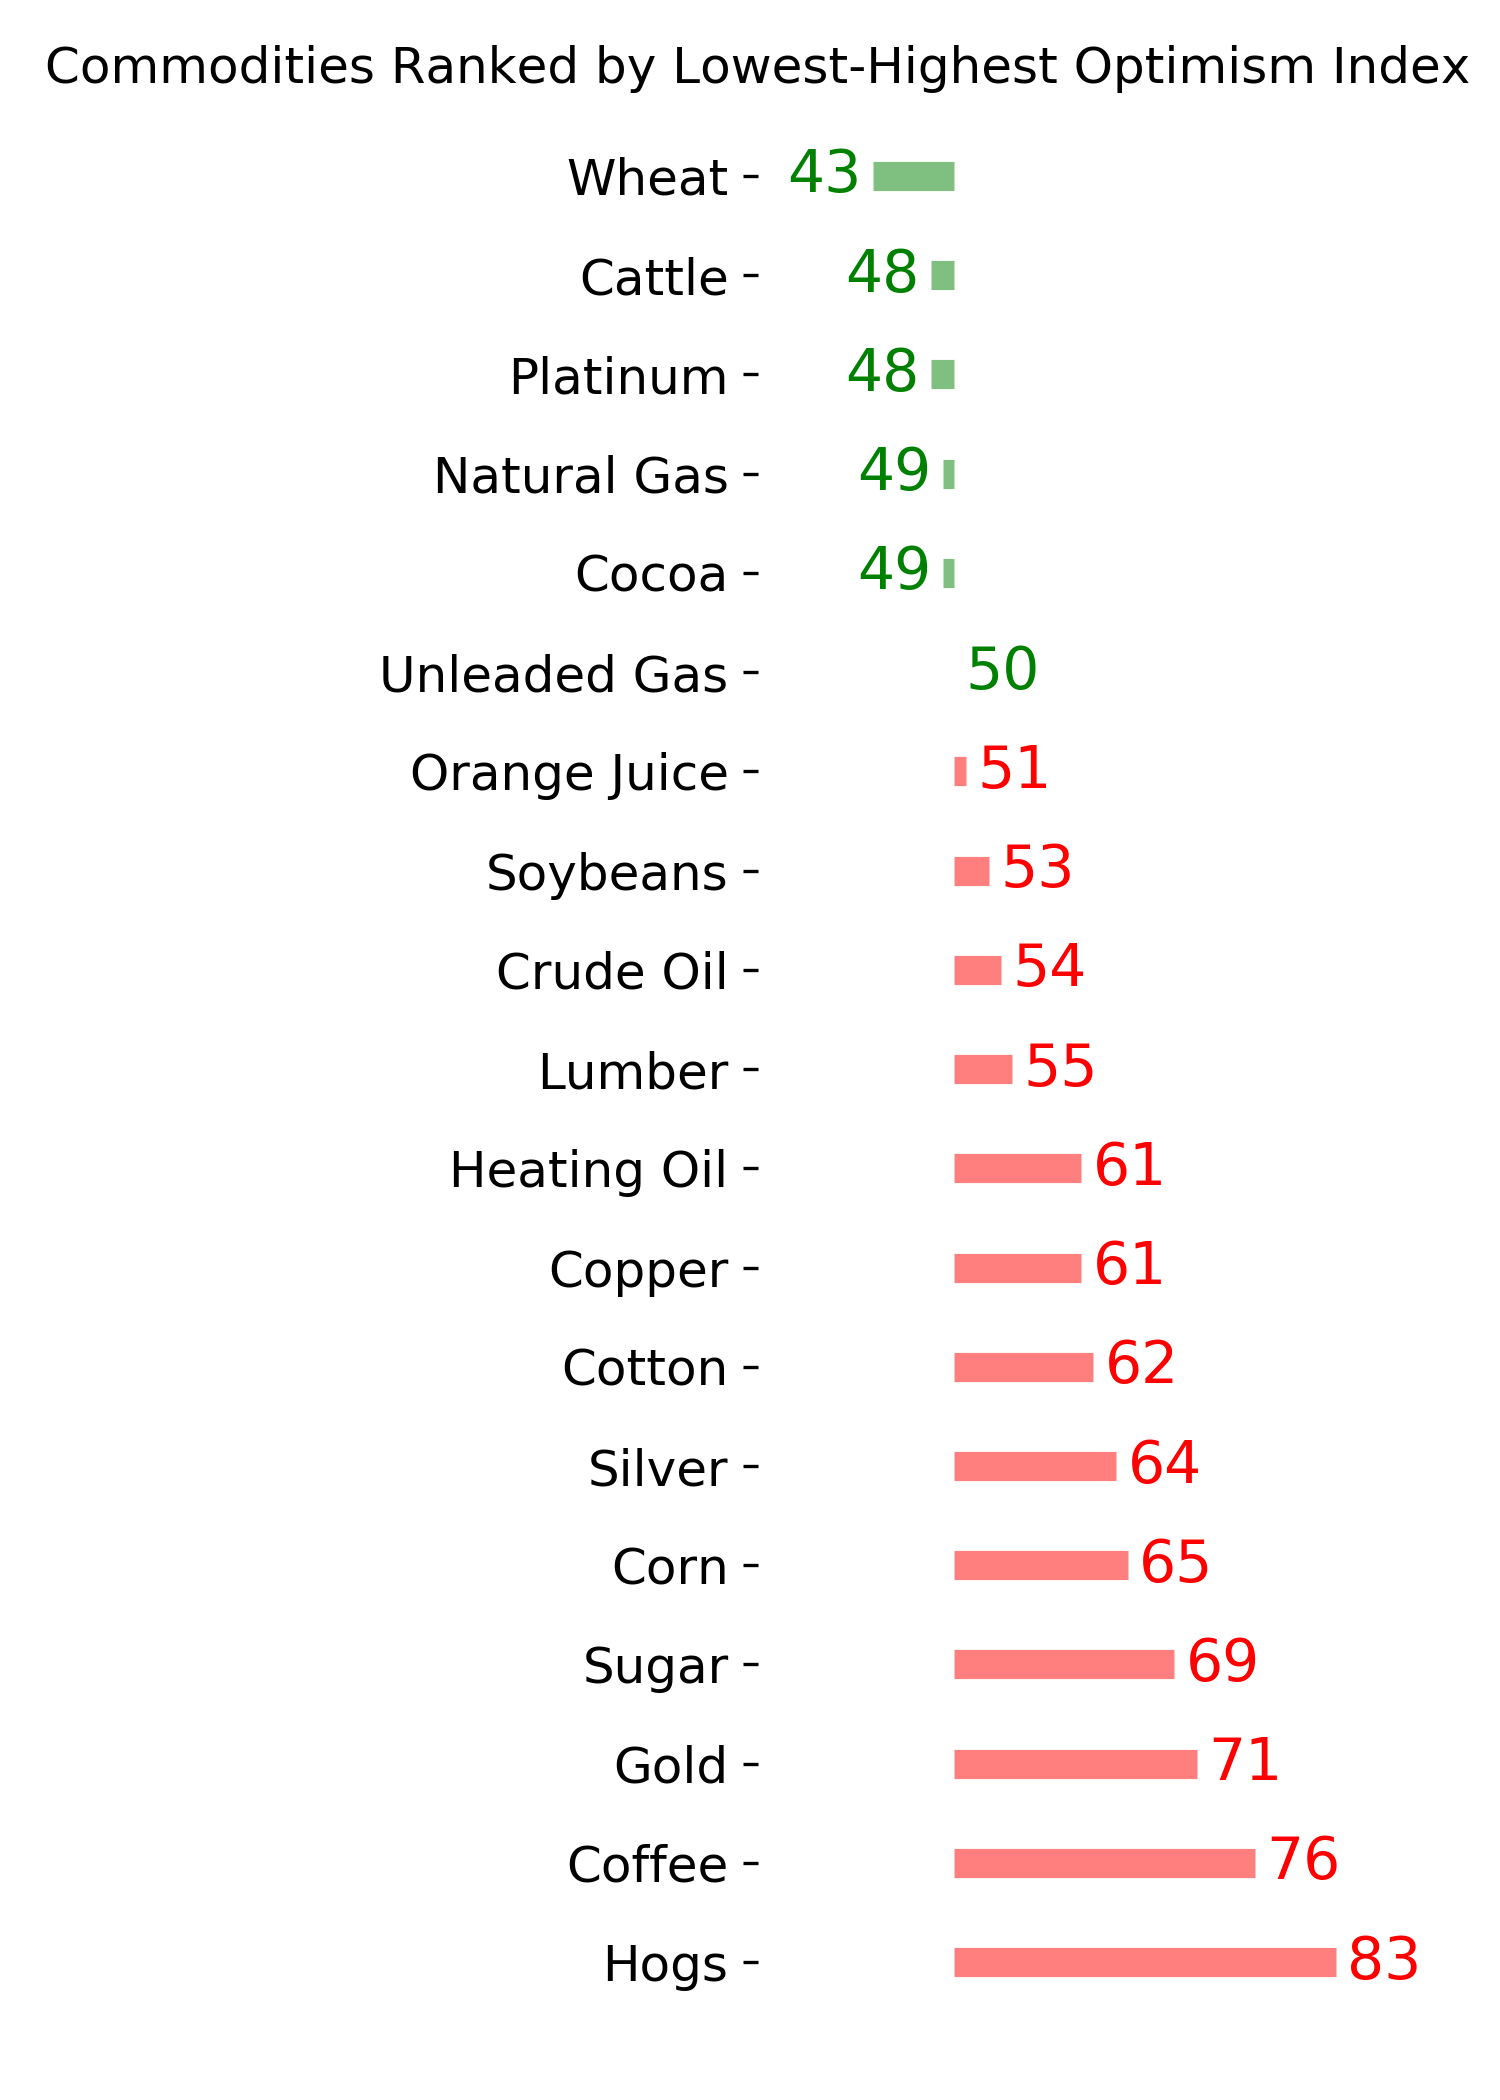
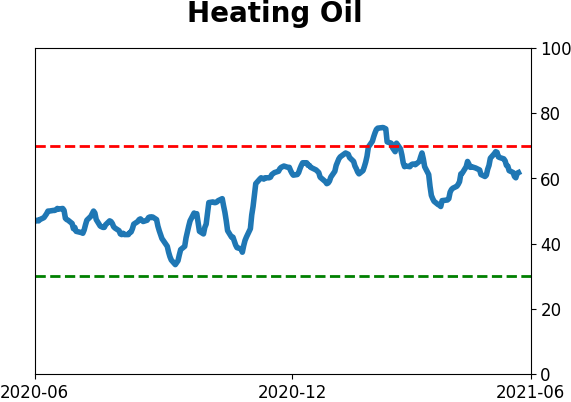
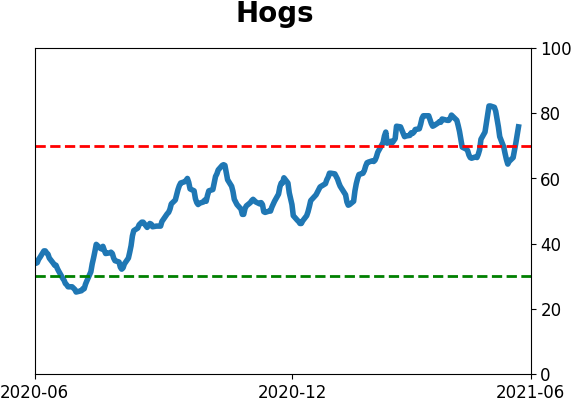
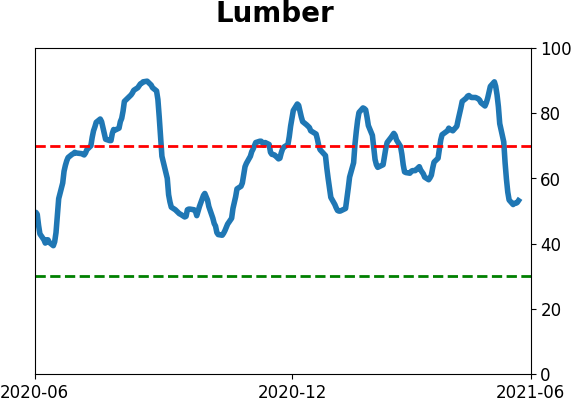
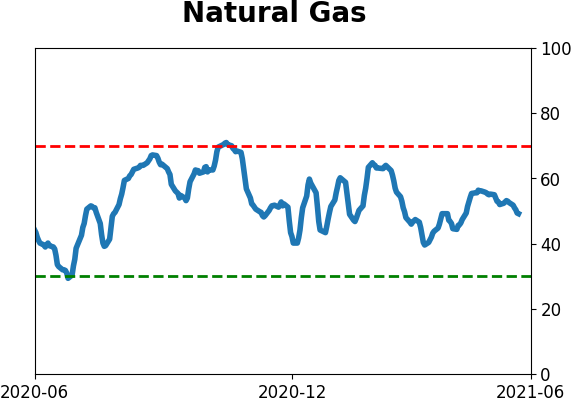
Commodity ETF's - 5-Day Moving Average
|
|