Headlines
|
|
Euro area sentiment is recovering from depression:
A broad-based survey of business and consumer sentiment in the euro area has just now started to improve after plunging into depression. The two other times the survey started to recover from such a low level indicated long-term recoveries in euro area stocks.
So many recoveries in trend, it's historic:
A near-record number of stocks within the S&P 500 have recovered above their 50-day averages relative to their 200-day averages. The S&P index itself has moved from more than 25% below its 50-day to more than 10% above. And the S&P joined the Nasdaq as the two indexes leading the "big four" out of a major decline.
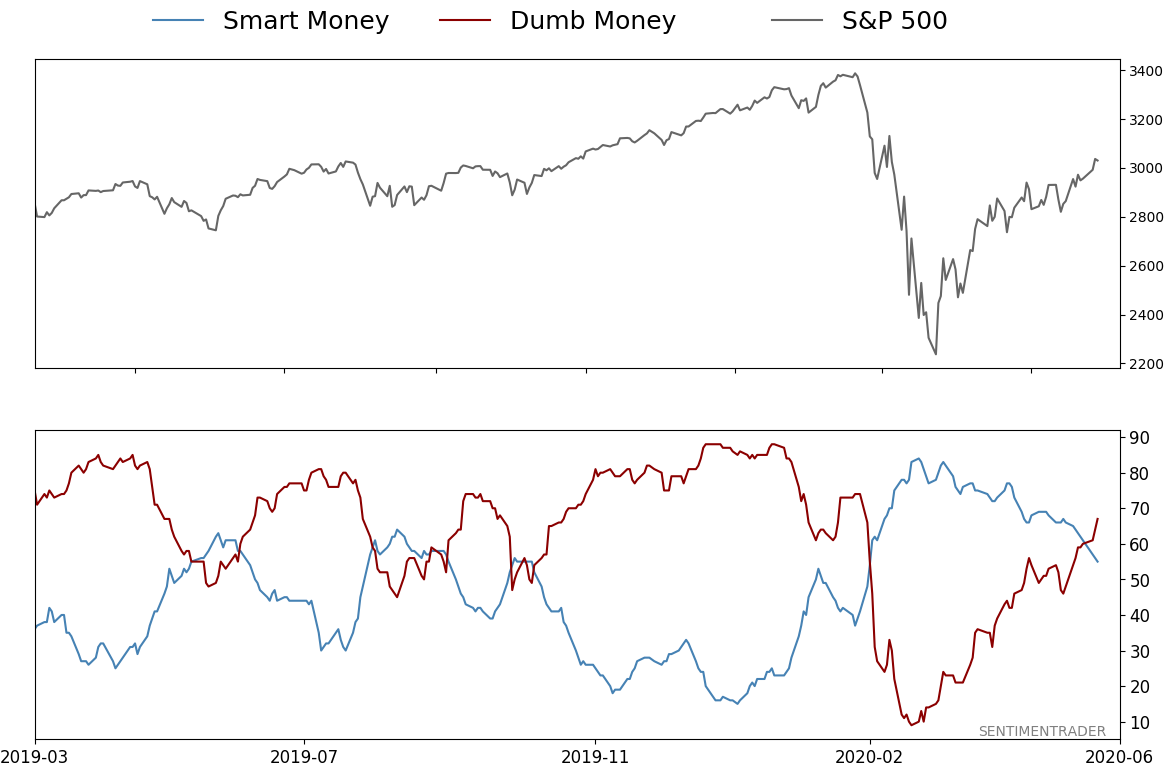
Money managers vs individual investors: Professional money managers in the NAAIM survey are about 82% exposed to stocks. Individual investors in the AAII survey are only 33% bullish. This is one of the widest spreads since the inception of the NAAIM survey in 2006. It's tempting to think of this as "smart money" versus "dumb money" because the S&P 500's annualized return when the spread was 40% or more was +7.7%. When it was below 0 (when money managers were more negative than individuals), then its return was only +1.0%. Not a strong edge, but maybe a slight positive for stocks here.
|
Smart / Dumb Money Confidence
|
Smart Money Confidence: 55%
Dumb Money Confidence: 67%
|
|
Risk Levels
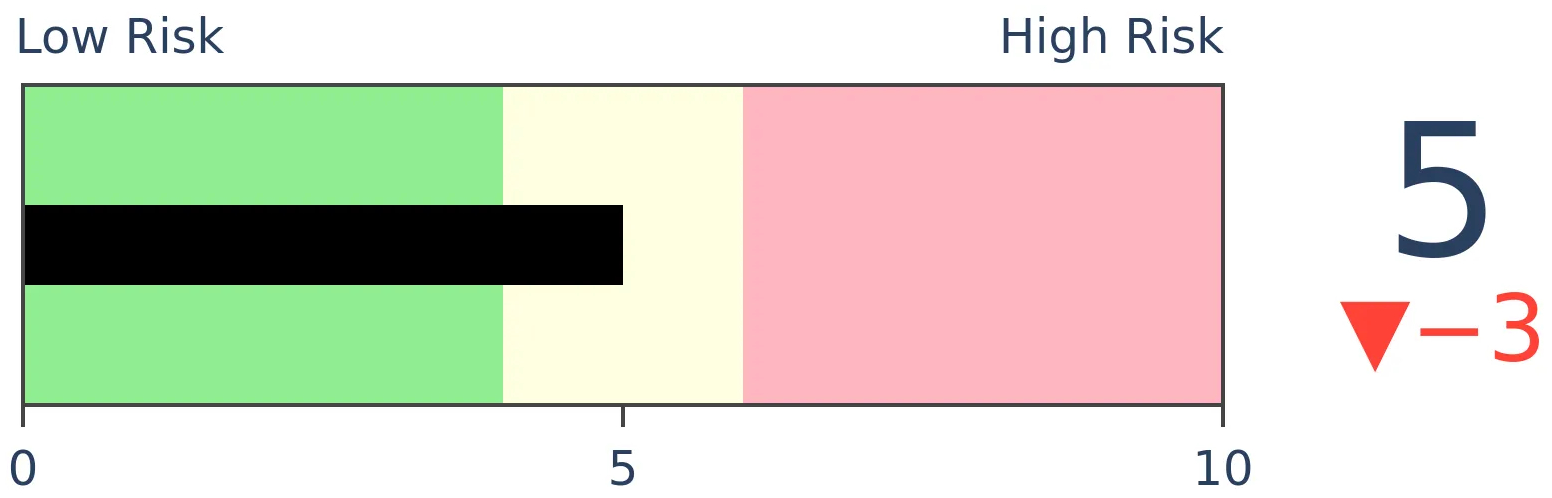
Stocks Short-Term
|
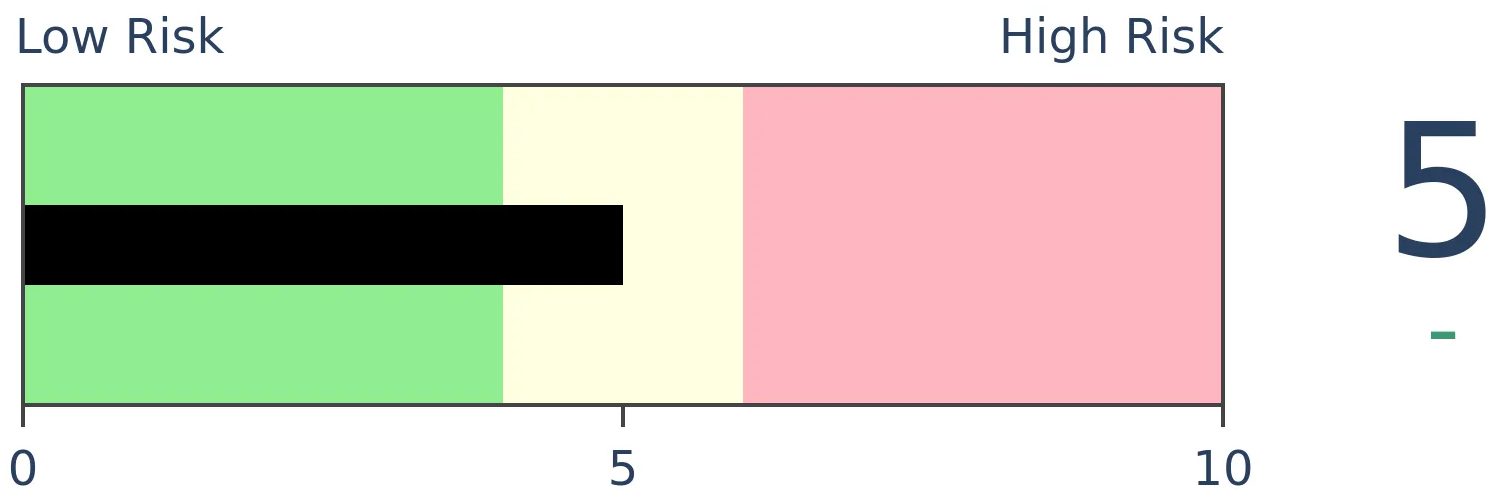
Stocks Medium-Term
|
|
Bonds
|
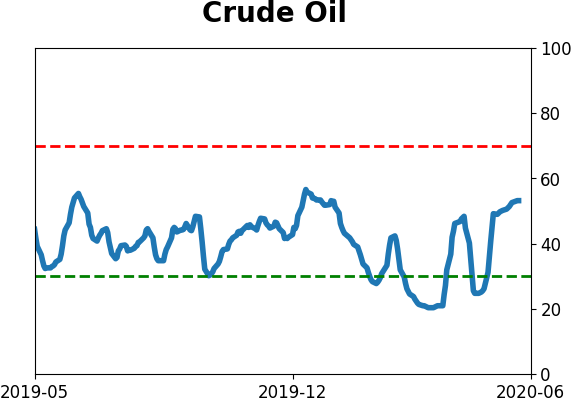
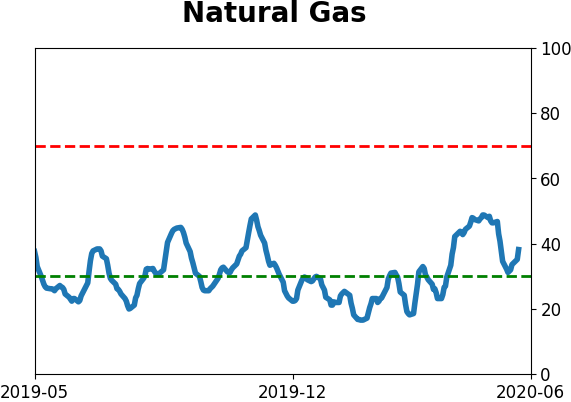
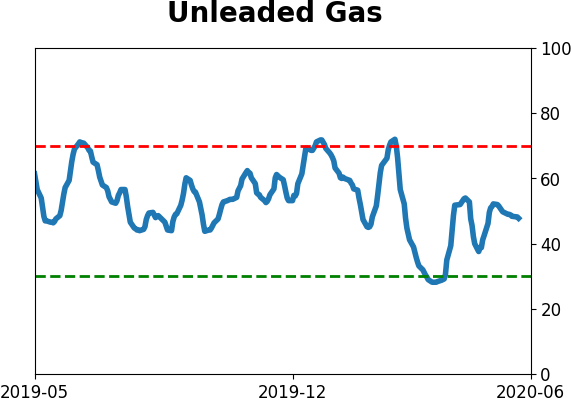
Crude Oil
|
|
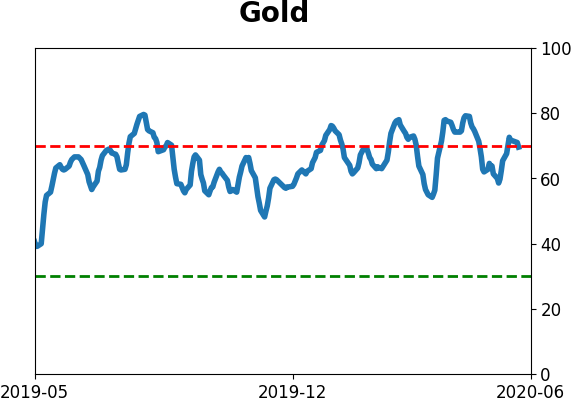
Gold

|
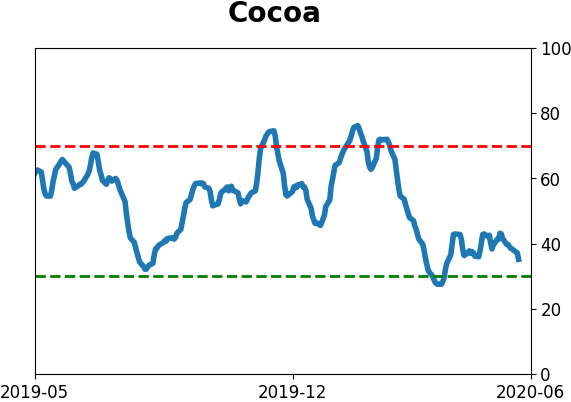
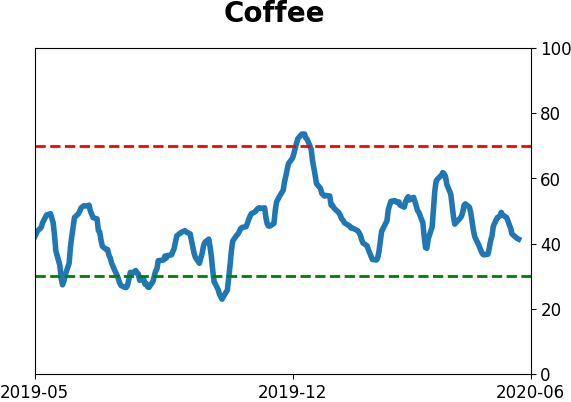
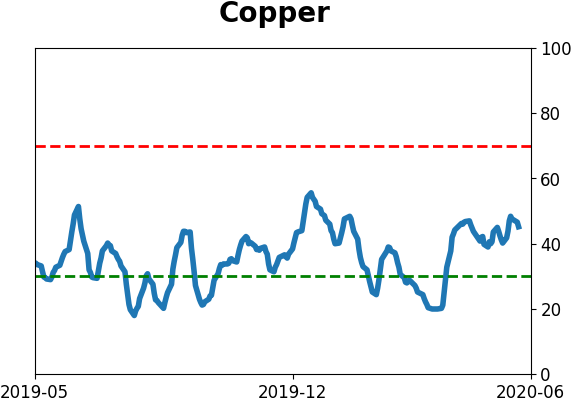
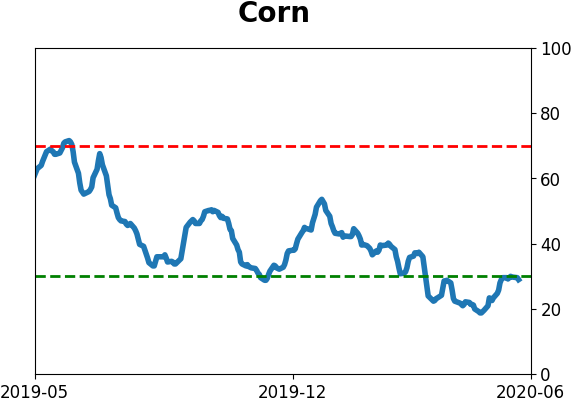
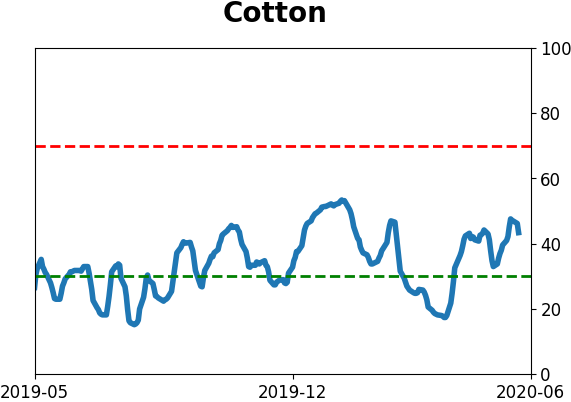
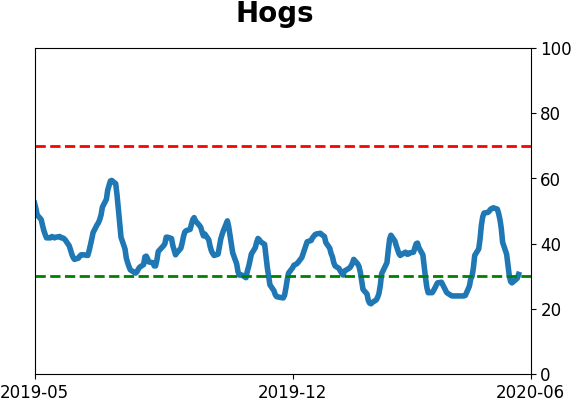
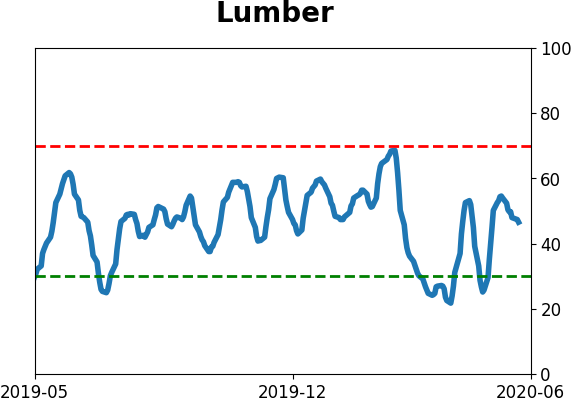
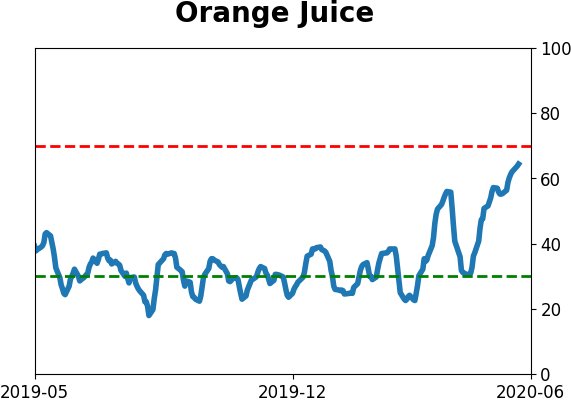
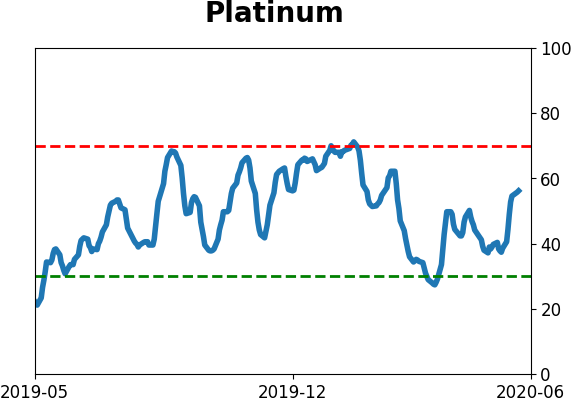
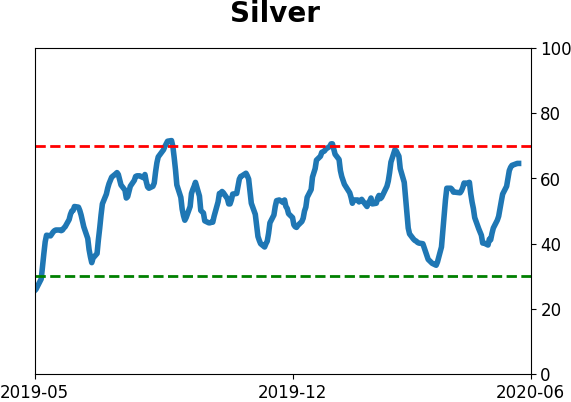
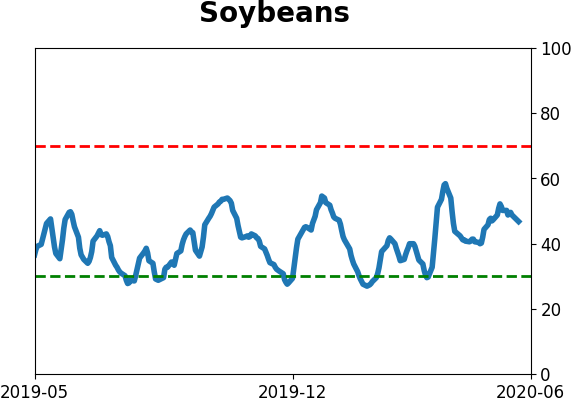
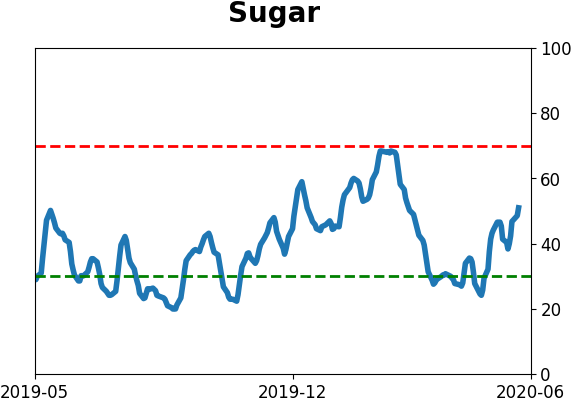
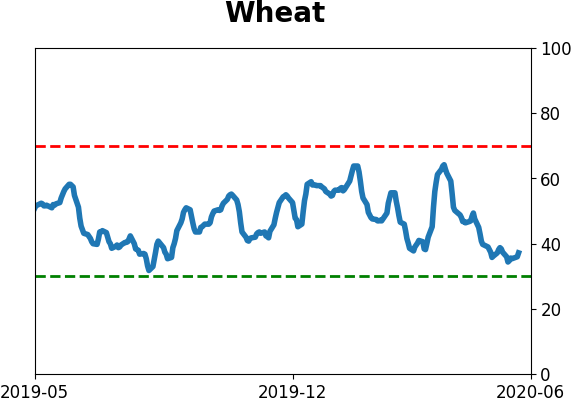
Agriculture
|
|
Research
BOTTOM LINE
A broad-based survey of business and consumer sentiment in the euro area has just now started to improve after plunging into depression. The two other times the survey started to recover from such a low level indicated long-term recoveries in euro area stocks.
FORECAST / TIMEFRAME
FEZ -- Up, Long-Term
|
Investors have been pulling a near-record amount of money from overseas mutual funds and ETFs. Sentiment toward non-U.S. stocks has been souring for a while and several measures suggest that pessimism overseas was even worse than what was seen in the U.S.
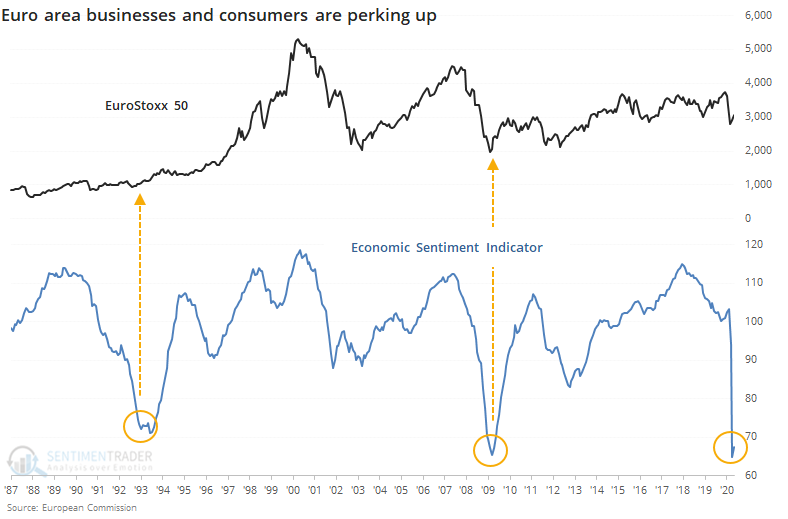
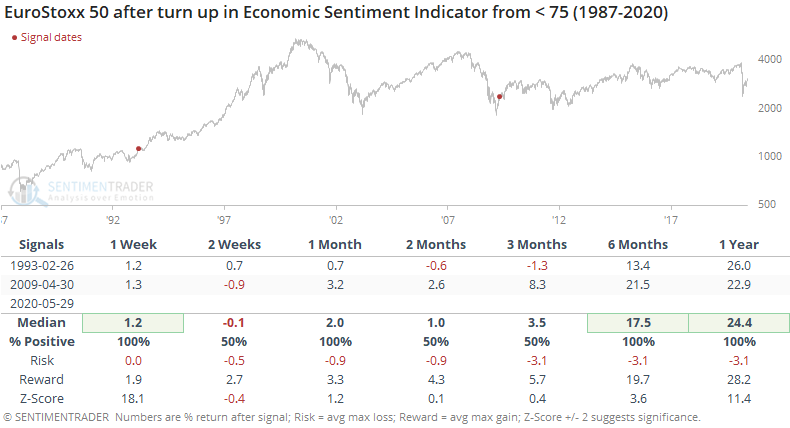
As noted by Bloomberg, a survey of businesses and consumers by the European Commission shows that some of that pessimism might finally be wearing off. Their Economic Sentiment Indicator has just now started to turn from an extremely depressed level.
According to the European Commission (via Bloomberg), this should reflect a broad base of sentiment:
"The Economic Sentiment Indicator is calculated from the European Commission's Business and Consumer Surveys. It is constructed from the following indicators: the industrial confidence indicator (40%), the service confidence indicator (30%), the consumer confidence indicator (20%), the construction confidence indicator (5%), and the retail trade confidence indicator (5%)."
Clearly, there isn't a big sample size to draw on here. But the two other times that sentiment turned up from such depressed levels led to impressive long-term returns in the EuroStoxx 50 index.
While sentiment in the U.S. has mostly recovered from exceptionally depressed levels (on some measures) in March and April, it has either continued to decline or is only now curling up overseas. That has been a very good long-term sign for most major overseas indexes.
BOTTOM LINE
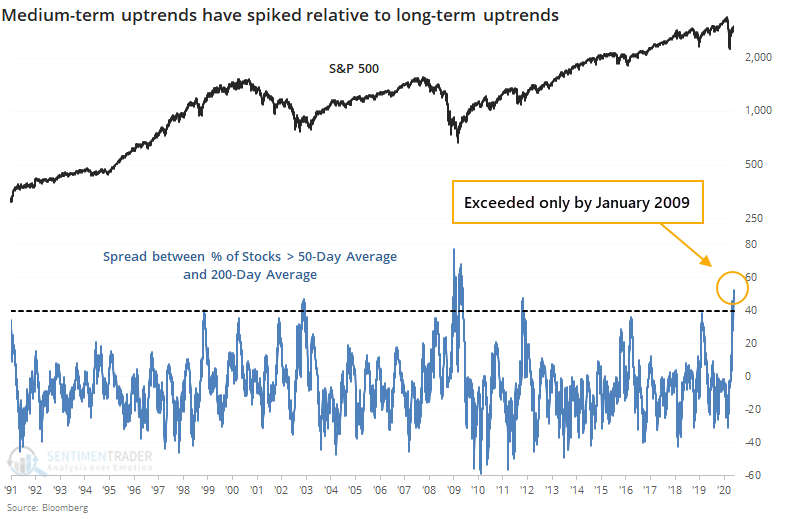
A near-record number of stocks within the S&P 500 have recovered above their 50-day averages relative to their 200-day averages. The S&P index itself has moved from more than 25% below its 50-day to more than 10% above. And the S&P joined the Nasdaq as the two indexes leading the "big four" out of a major decline.
FORECAST / TIMEFRAME
SPY -- Up, Long-Term
|
We've spent a lot of time looking at the 50- and 200-day moving averages over the past week, and this will likely be one of the last posts about it for a long while. This form of looking at the market has become wildly popular lately and while that doesn't mean it's no longer effective, it's certainly becoming less unique.
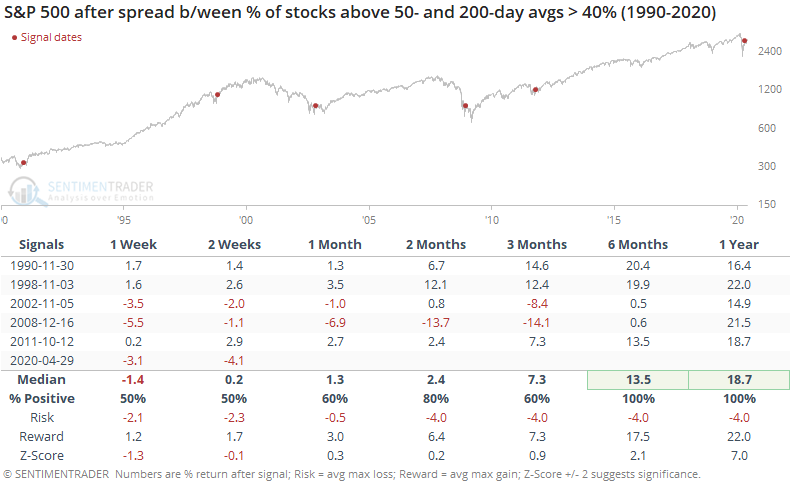
As we saw on Wednesday, there has been a surge in stocks within the S&P 500 rising above their 50-day moving averages but relatively few have climbed above their 200-day averages. As of Wednesday, 95% of S&P stocks were above their 50-day average but only 43% were above their 200-day, so the spread between them was more than 50%. That's the 2nd-highest in 30 years, next to January 2009.
By the time the spread hit 40%, it indicated moments of medium-term upside momentum during markets that were showing longer-term struggles. As a result, forward returns were shaky in the shorter-term, but positive over the next 6-12 months every time. When the spread got this high in 2009, it indicated only the beginning of the long-term bottoming process.
For the S&P 500 index itself, it has cycled from more than 25% below its 50-day moving average, one of the most oversold readings in history, to more than 10% above, one of the most overbought.
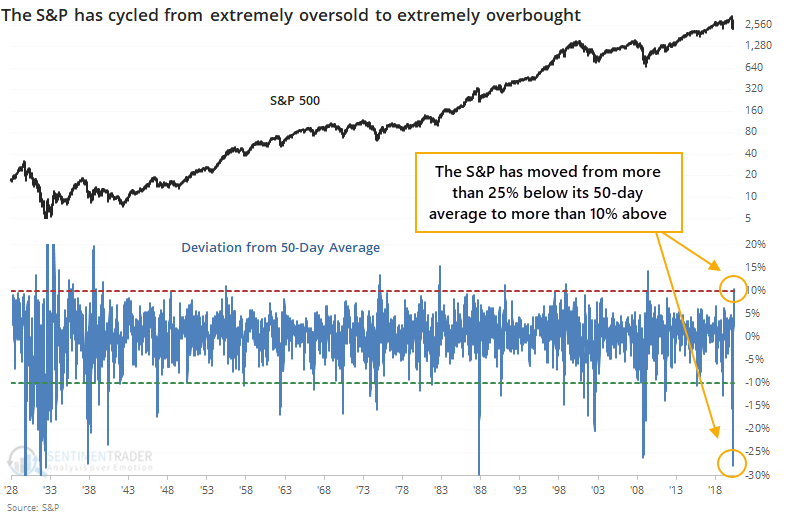
If we look at lesser extremes, times when it moved from 10% below to 10% above, then we get the following.
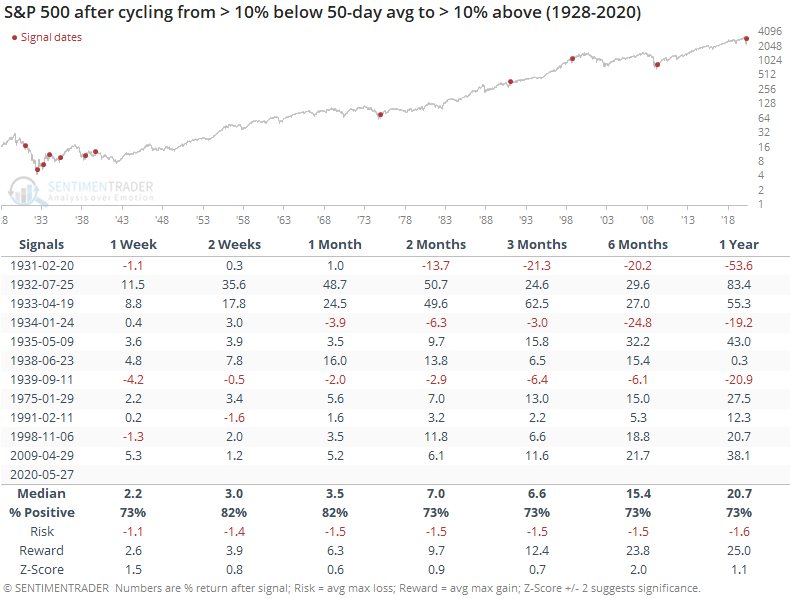
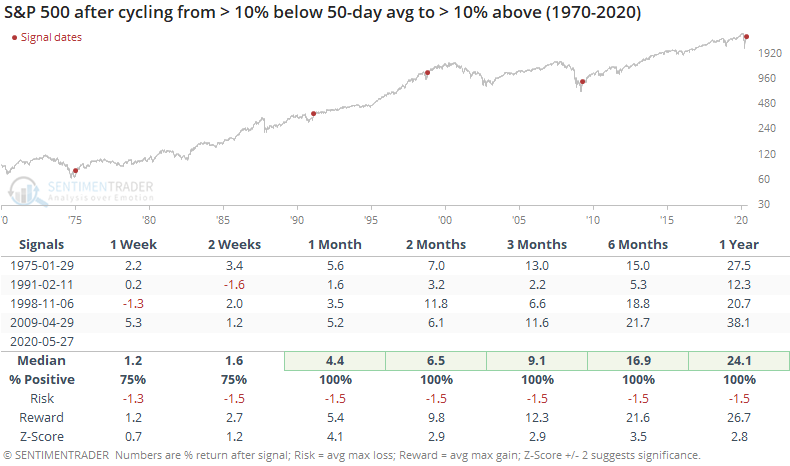
Returns were mixed-to-positive, but the negatives were due to the 1930s. If we make the assumption that lessons have been learned and we're not going to repeat some of those same mistakes, then we can focus on the post-1930s era. Those forward returns were pristine.
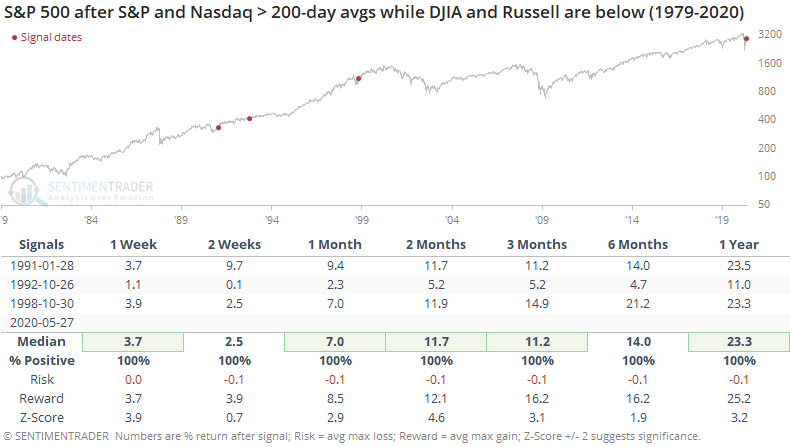
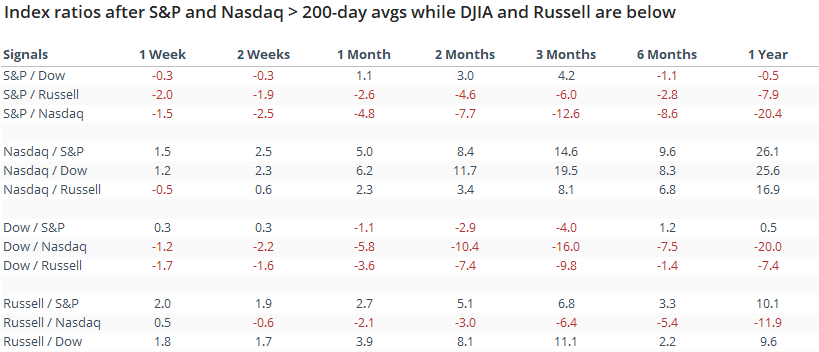
The S&P 500 and Nasdaq Composite are the first of the "big four" equity indexes to trade above their 200-day averages. The Dow Industrials and Russell 2000 remain below. When the S&P and Nasdaq led the other two out of declines, it was a good sign the few other times it happened.
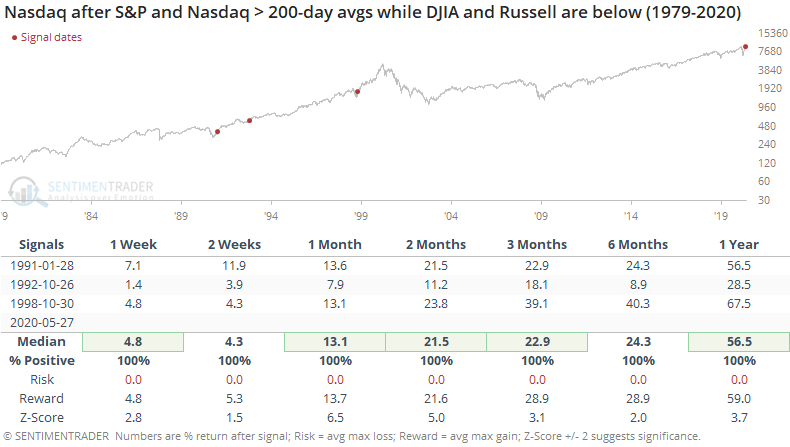
For the Nasdaq, it was an even better signal. Those one-year returns and risk/reward skews are impressive, with the caveat that the sample size is minuscule.
Comparing all four indexes to each other, the Nasdaq consistently outperformed the others. The Russell also tended to do well. The S&P and Dow consistently under-performed.
The overall takeaway from the indexes and stocks recovering above their medium- and long-term averages is that this kind of behavior, to this degree, have typically only come during long-term recoveries, with excellent medium- to long-term returns. The short- to medium-term was more of a question.
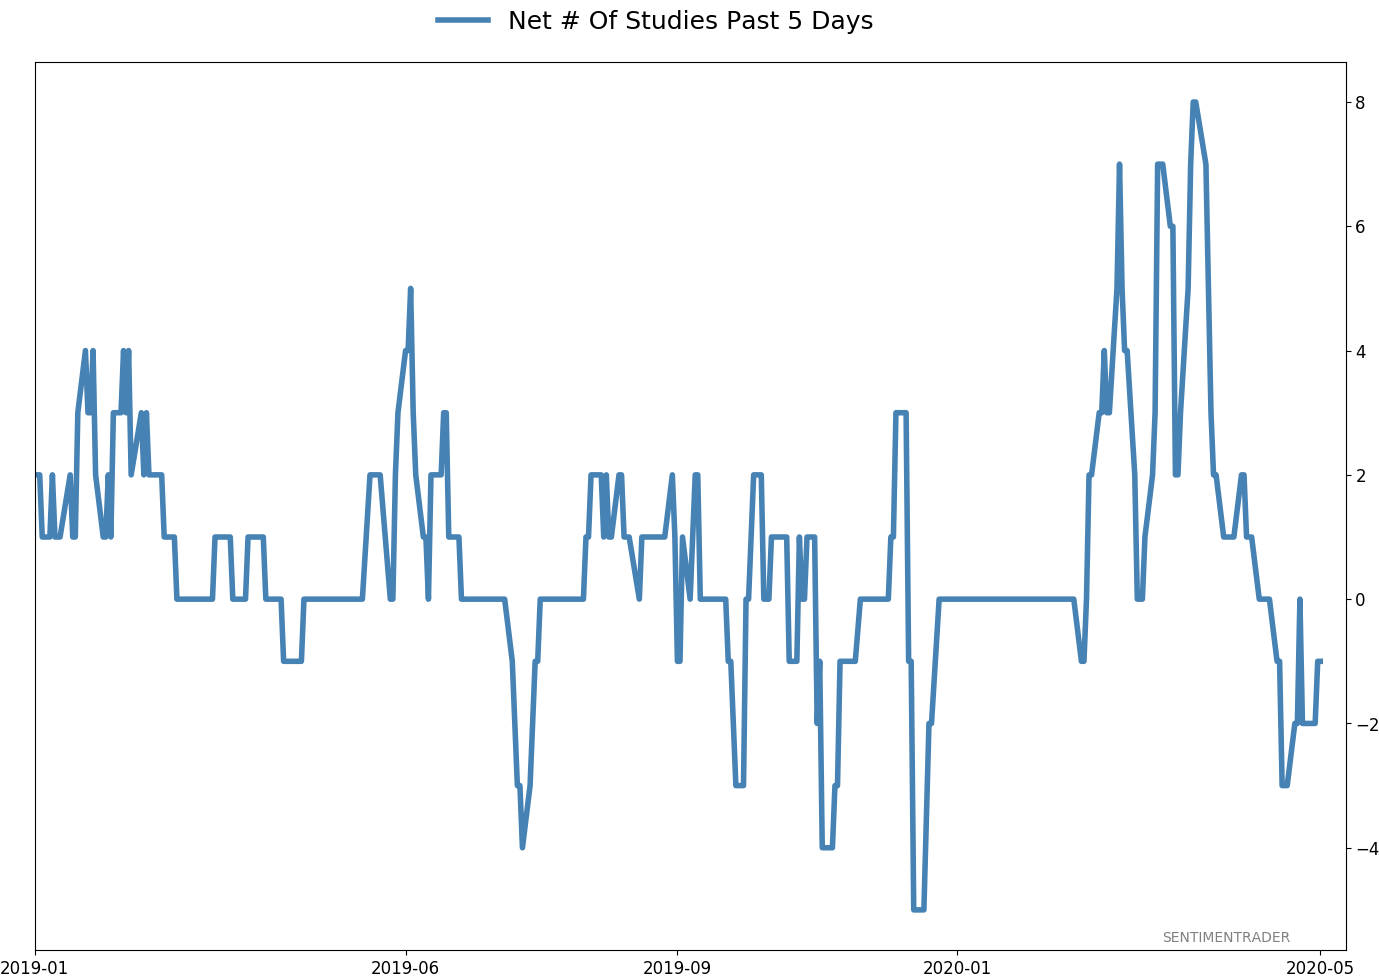
Active Studies
| Time Frame | Bullish | Bearish | | Short-Term | 0 | 1 | | Medium-Term | 8 | 4 | | Long-Term | 34 | 1 |
|
Indicators at Extremes
Portfolio
| Position | Weight % | Added / Reduced | Date | | Stocks | 38.9 | Reduced 10% | 2020-05-13 | | Bonds | 0.0 | Reduced 6.7% | 2020-02-28 | | Commodities | 5.1 | Added 2.4%
| 2020-02-28 | | Precious Metals | 0.0 | Reduced 3.6% | 2020-02-28 | | Special Situations | 0.0 | Reduced 31.9% | 2020-03-17 | | Cash | 56.0 | | |
|
Updates (Changes made today are underlined)
In the first months of the year, we saw manic trading activity. From big jumps in specific stocks to historic highs in retail trading activity to record highs in household confidence to almost unbelievable confidence among options traders. All of that came amid a market where the average stock couldn't keep up with their indexes. There were signs of waning momentum in stocks underlying the major averages, which started triggering technical warning signs in late January. The kinds of extremes we saw in December and January typically take months to wear away, but the type of selling in March went a long way toward getting there. When we place the kind of moves we saw into March 23 into the context of coming off an all-time high, there has been a high probability of a multi-month rebound. After stocks bottomed on the 23rd, they enjoyed a historic buying thrust and retraced a larger amount of the decline than "just a bear market rally" tends to. While other signs are mixed that panic is subsiding, those thrusts are the most encouraging sign we've seen in years. Shorter-term, there have been some warning signs popping up and our studies have stopped showing as positively skewed returns. I reduced my exposure some in late April and was looking for a pattern of lower highs and lower lows to reduce it further. With weakness on May 12, our studies turned even more negative over the short- to medium-term so I reduced a bit more. Some short-term indicators are already nearing oversold so we may get a quick rebound but it is what it is. If we see a clear pattern of lower lows, I may reduce even further in the week(s) ahead. Long-term prospects look decent because of the thrusts we saw off the low, but I'm more comfortable in cash in the interim. I'd consider adding back if we see our indicators and studies start to skew to the upside again, or if price action turns clearly better, indicating my caution is wrong.
RETURN YTD: -6.8% 2019: 12.6%, 2018: 0.6%, 2017: 3.8%, 2016: 17.1%, 2015: 9.2%, 2014: 14.5%, 2013: 2.2%, 2012: 10.8%, 2011: 16.5%, 2010: 15.3%, 2009: 23.9%, 2008: 16.2%, 2007: 7.8%
|
|
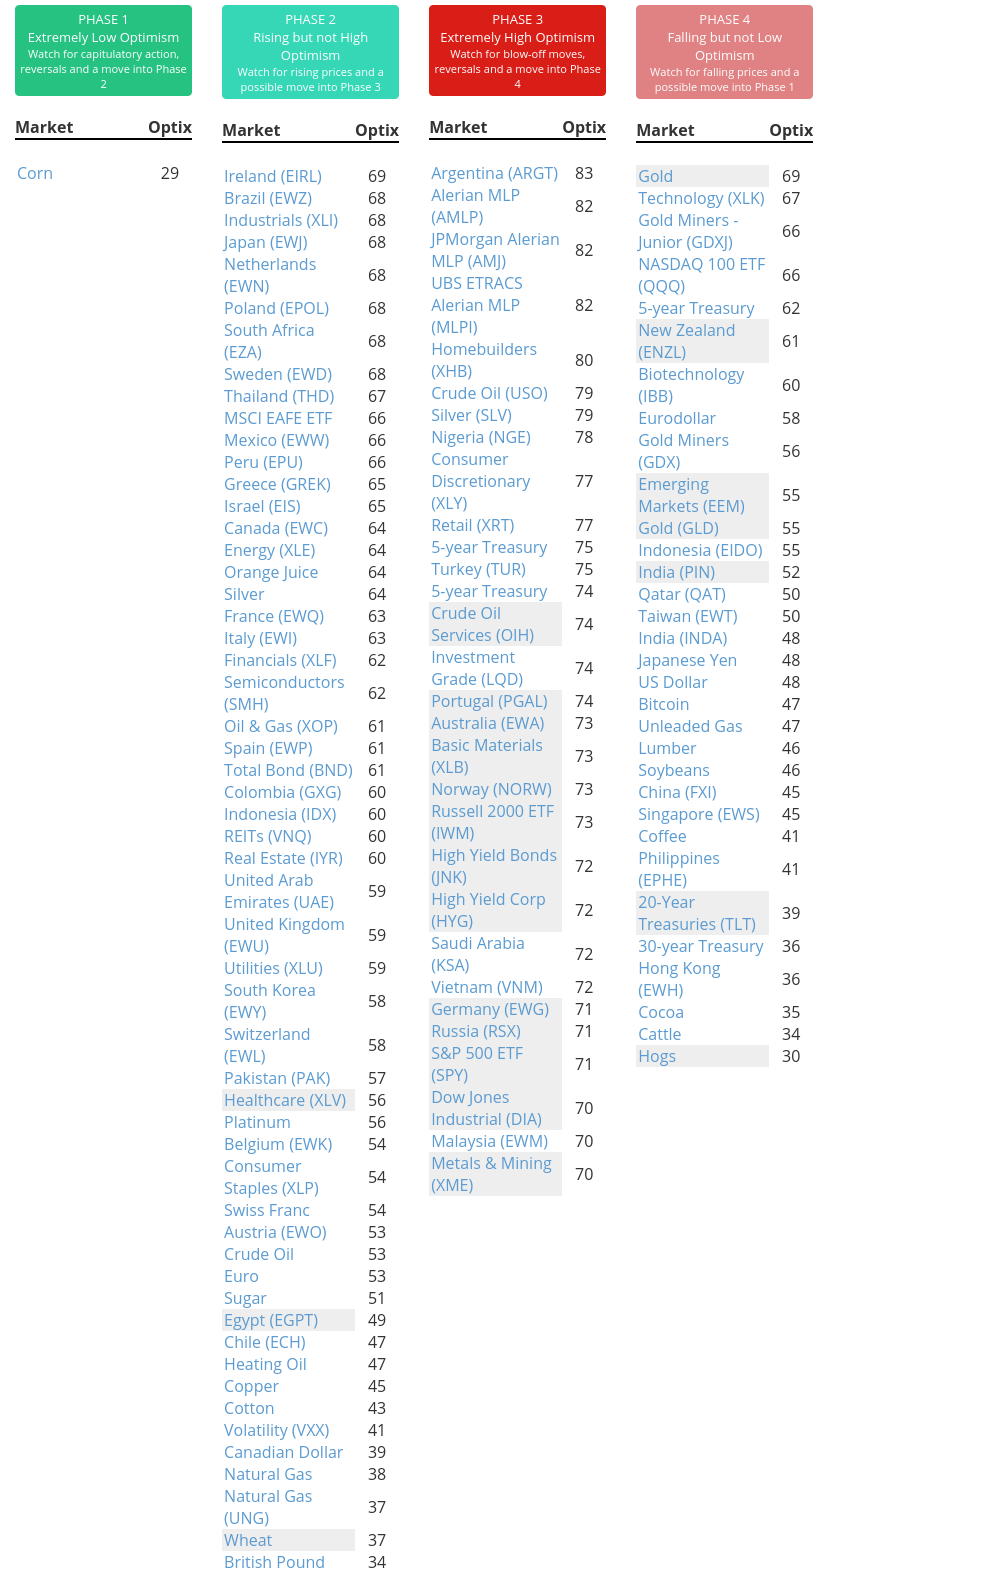
Phase Table
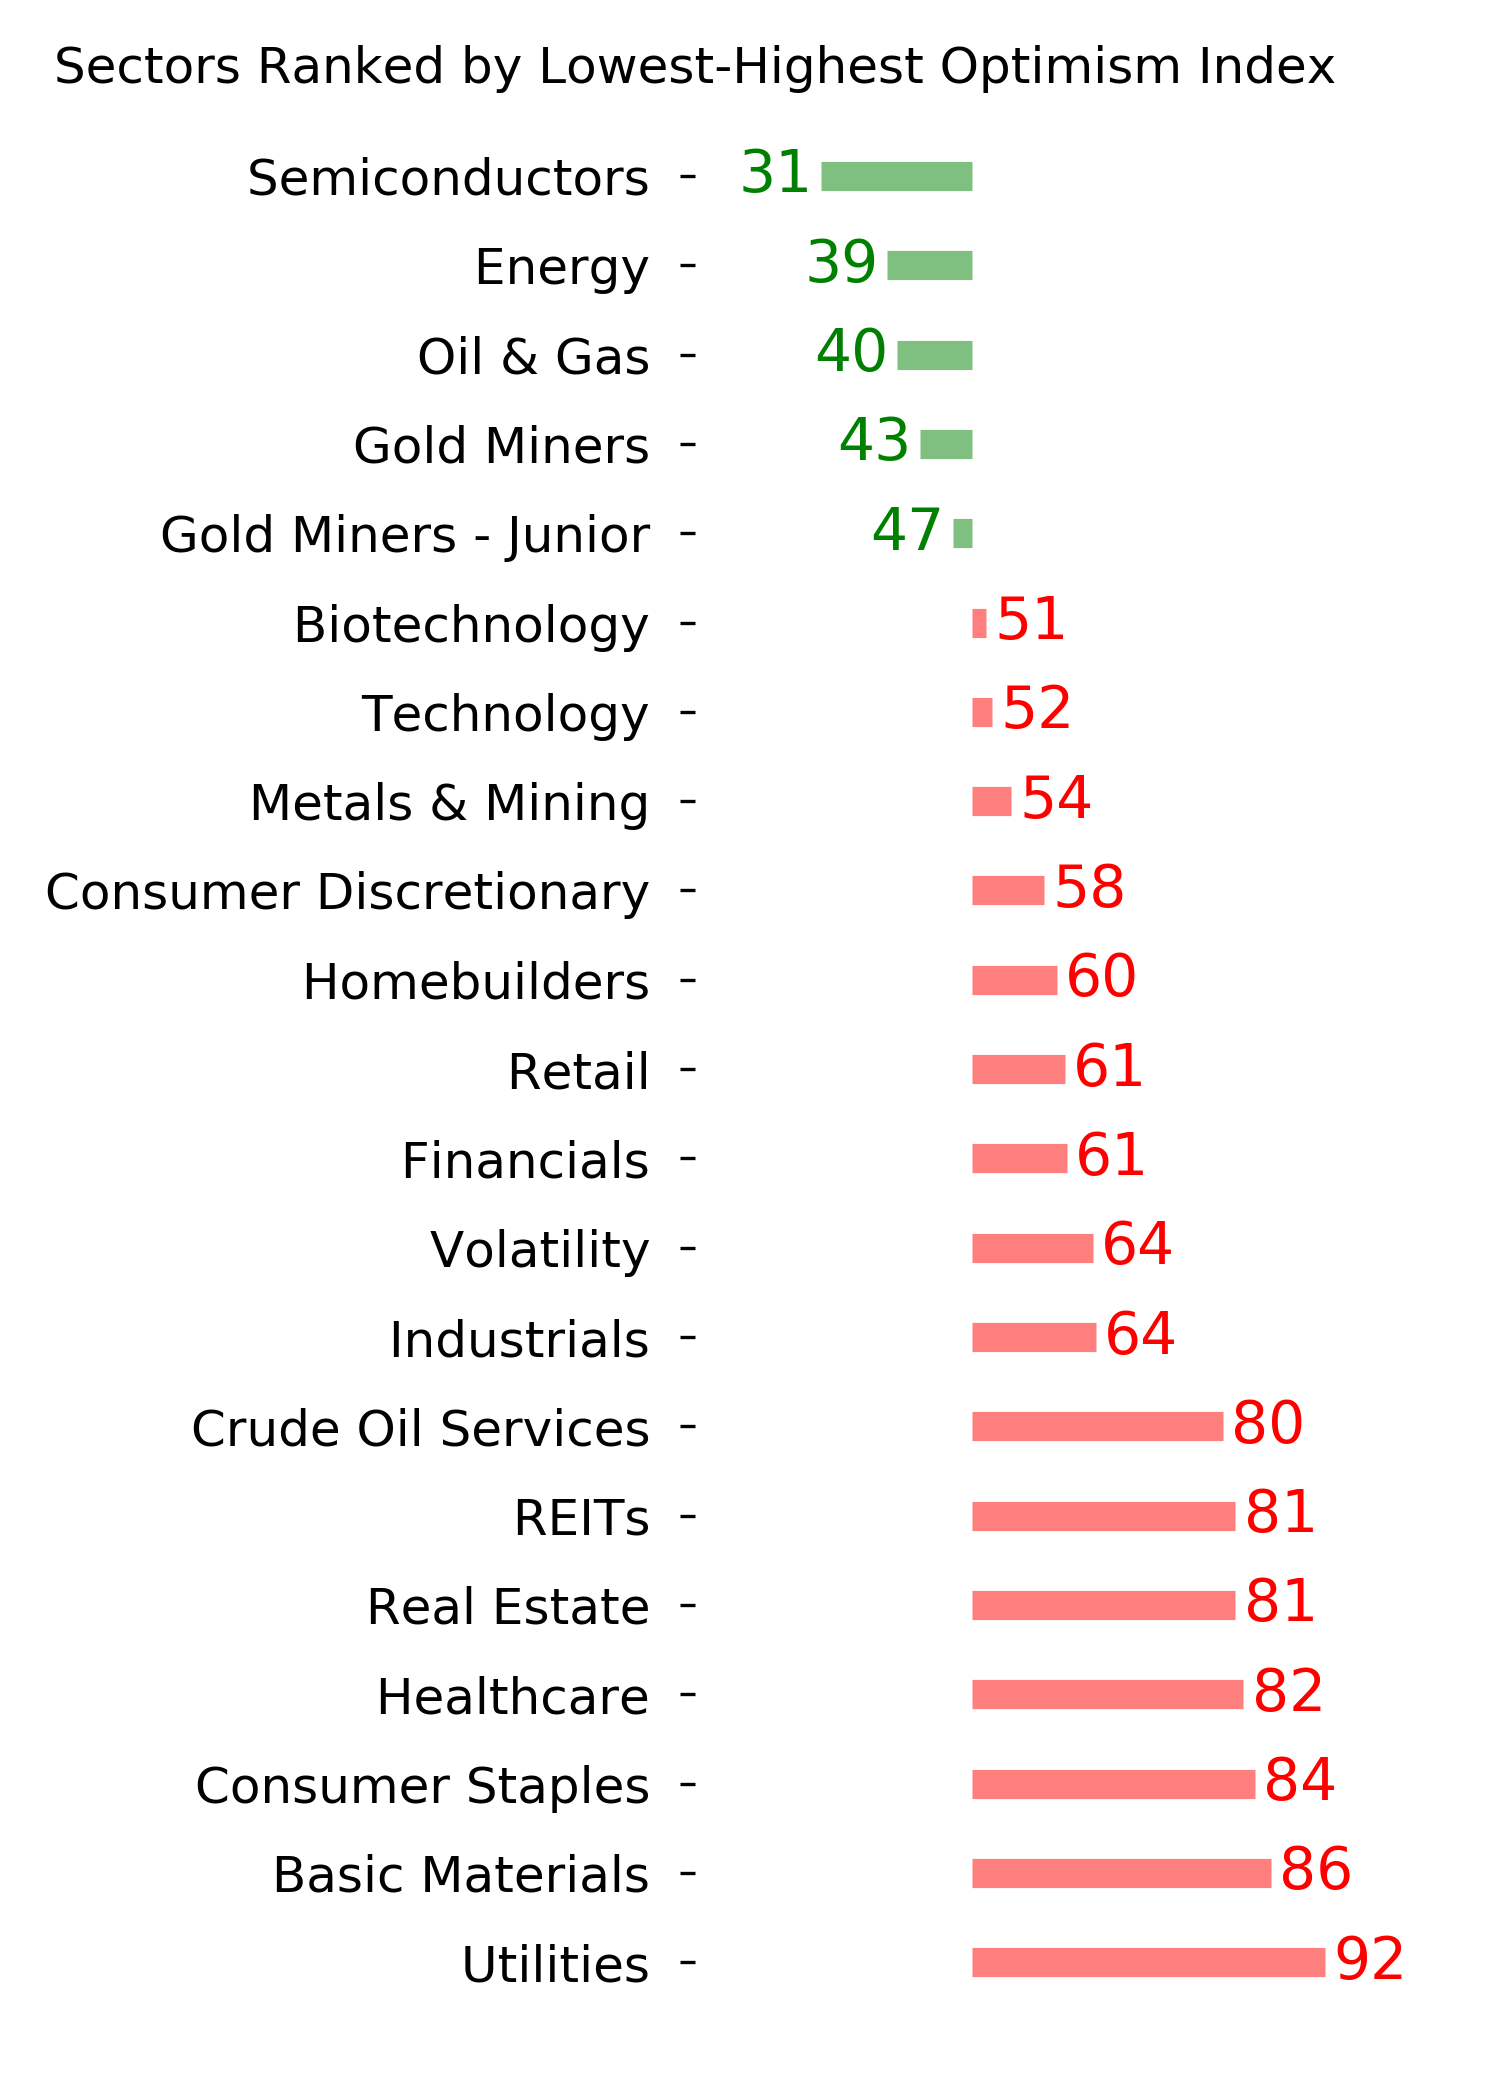
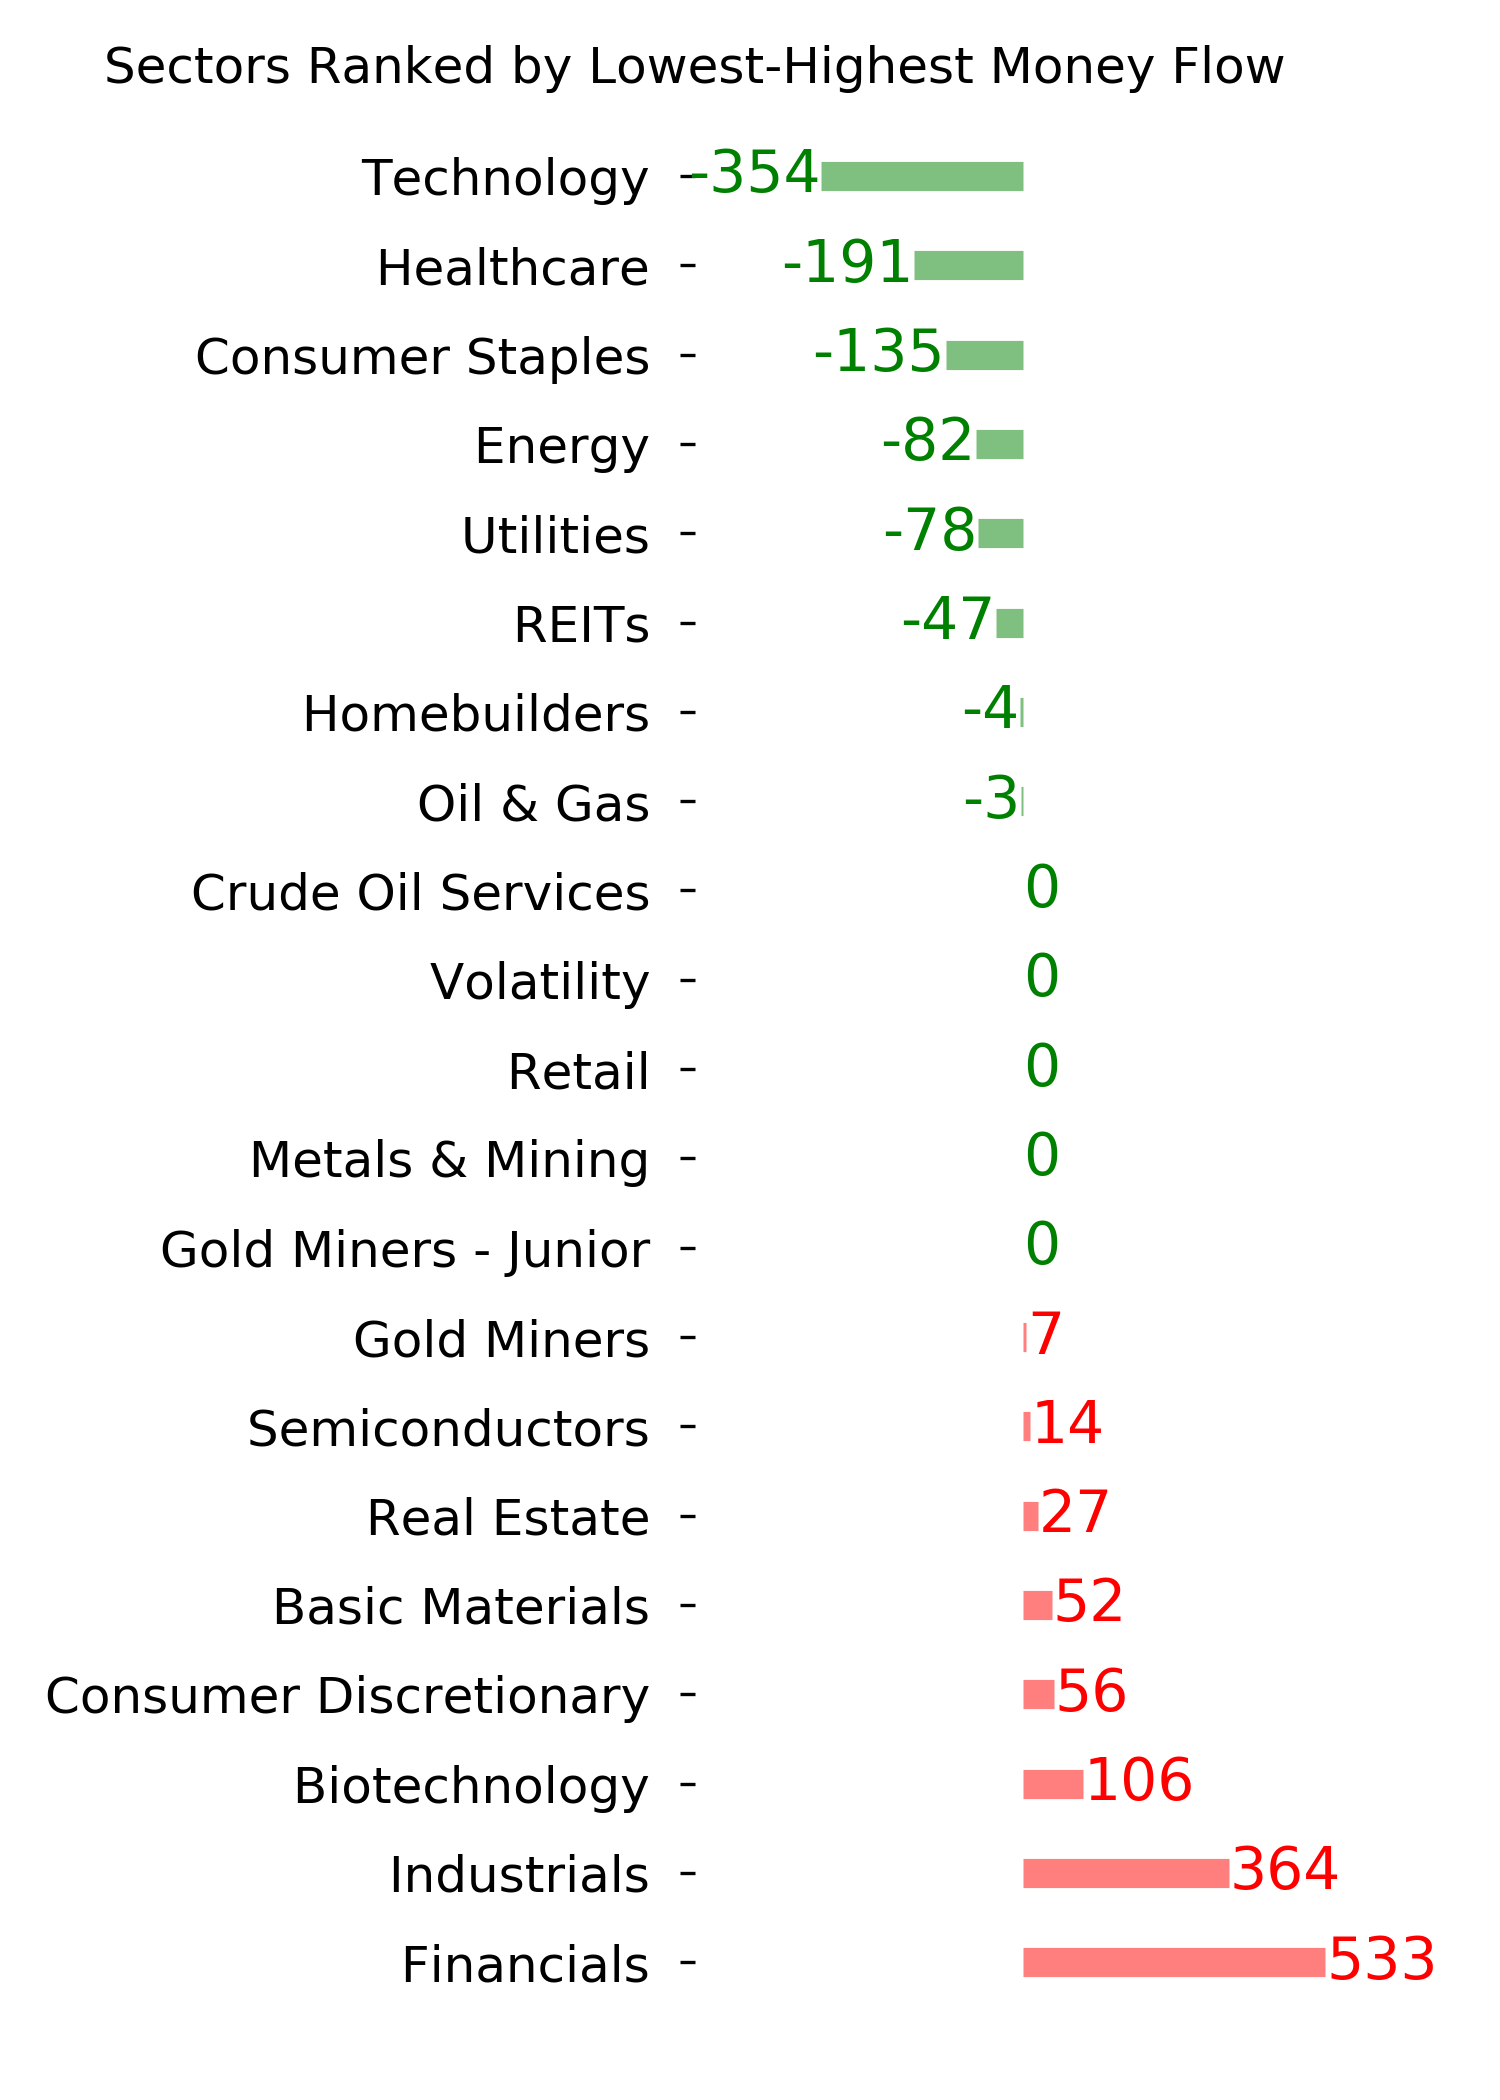
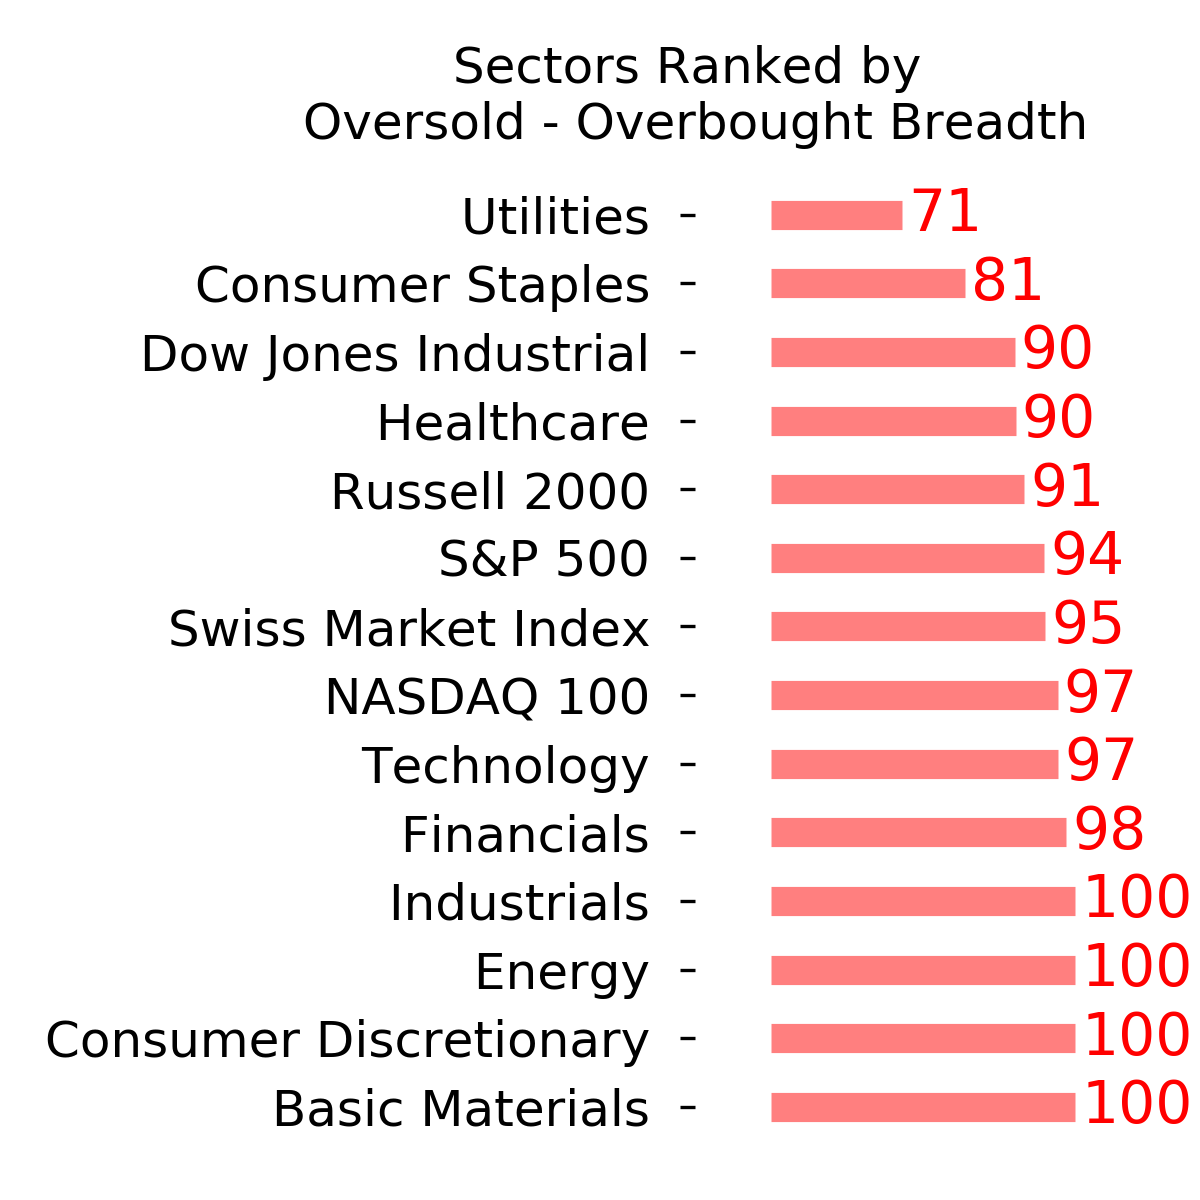
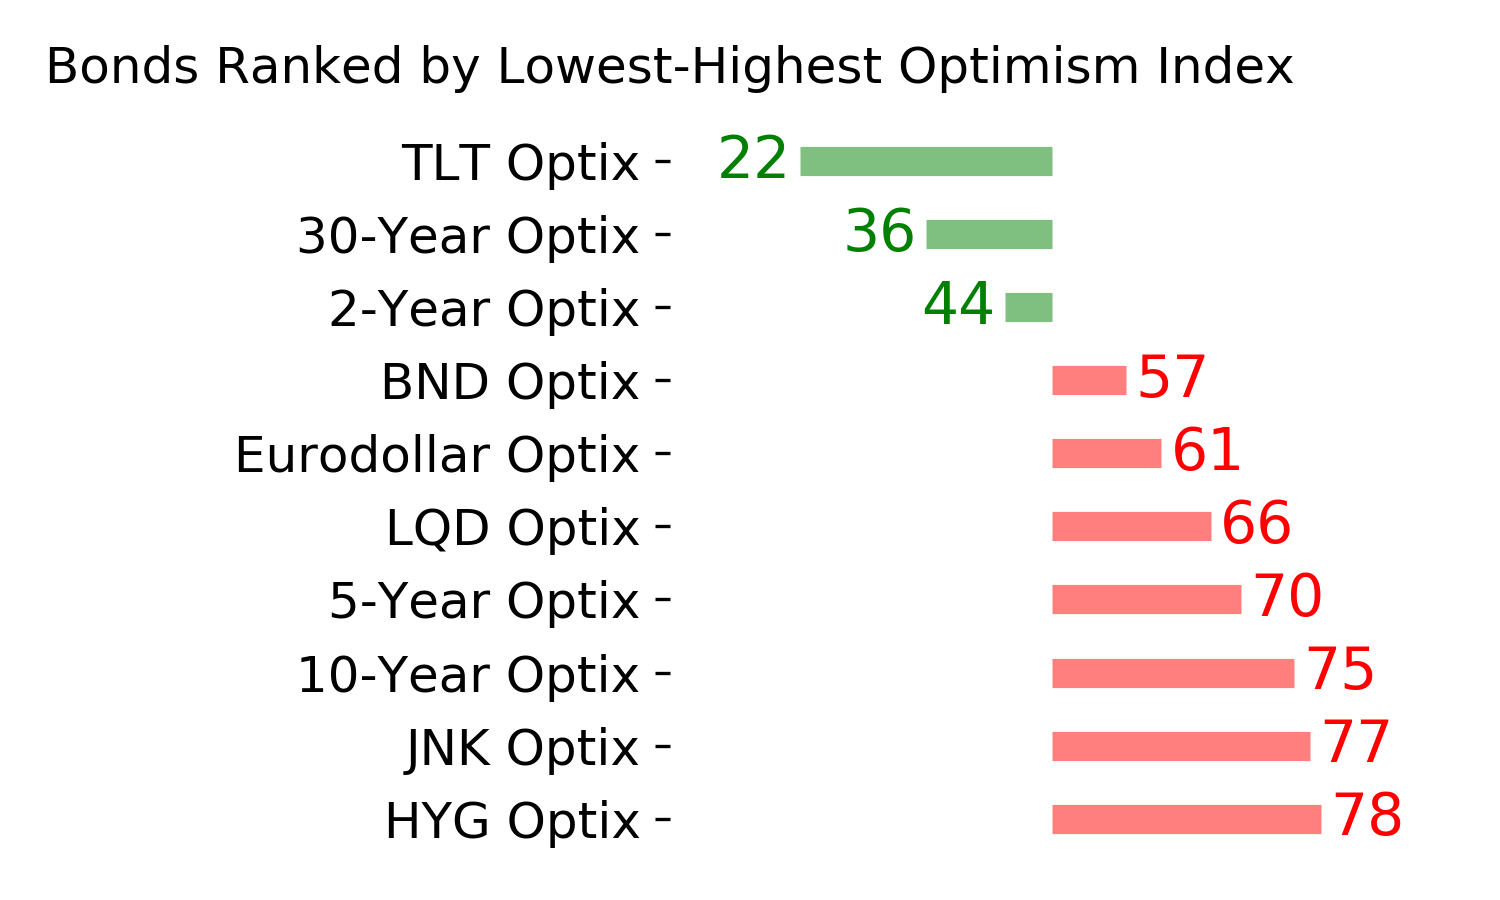
Ranks
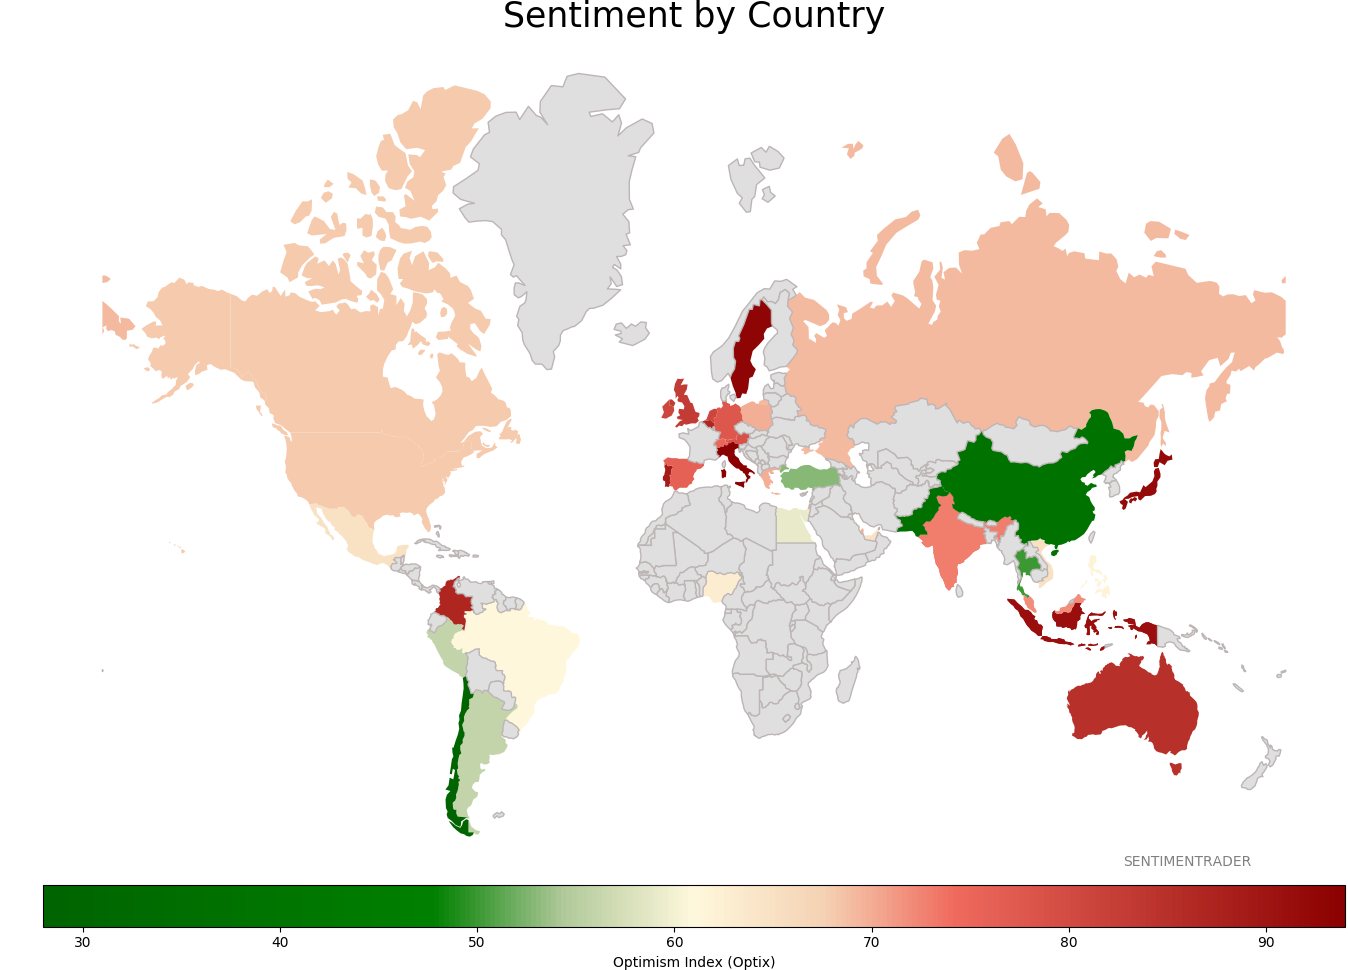
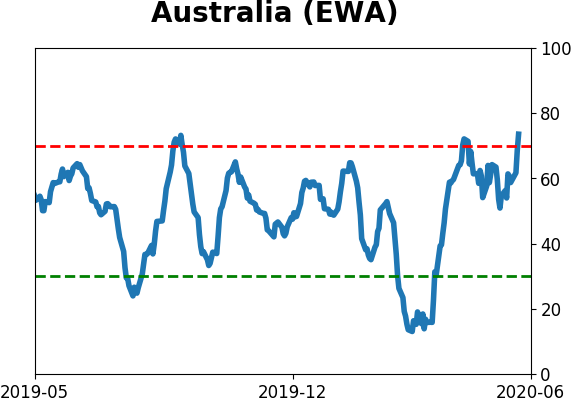
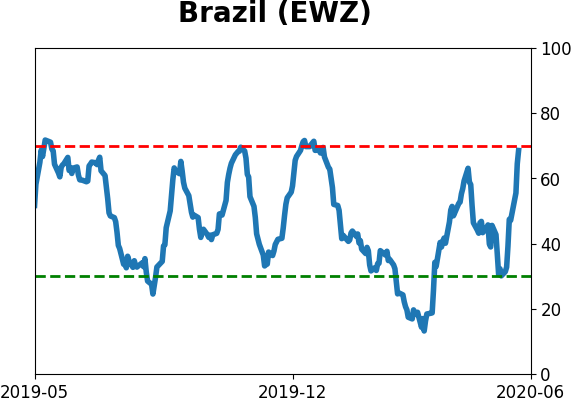
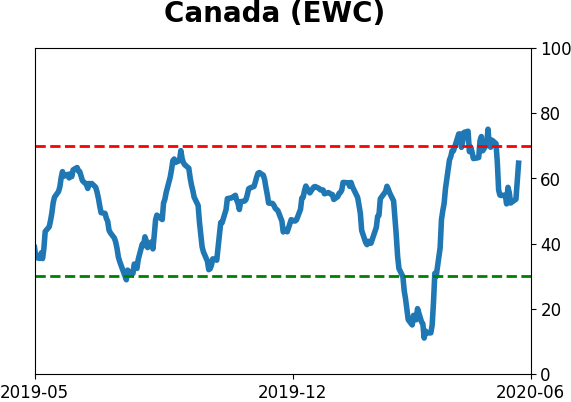
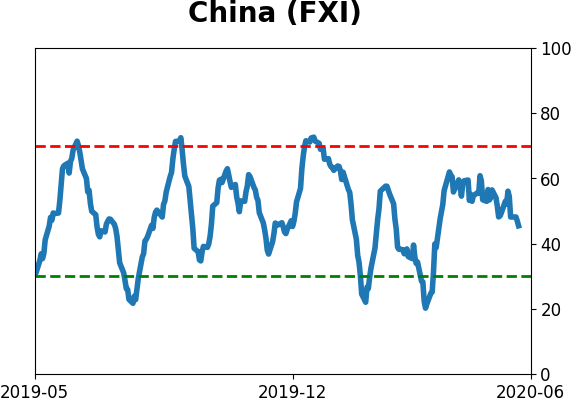
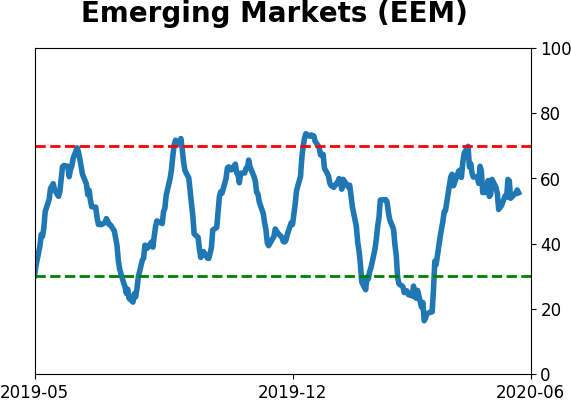
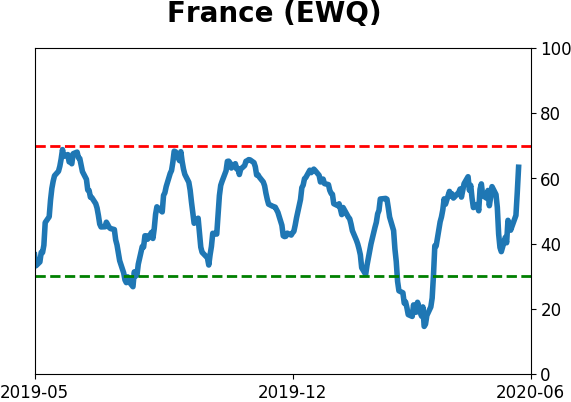
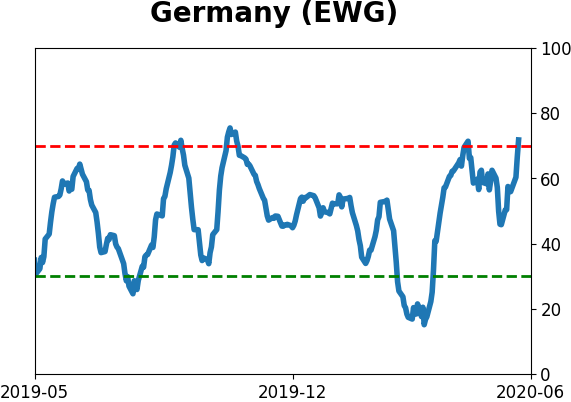
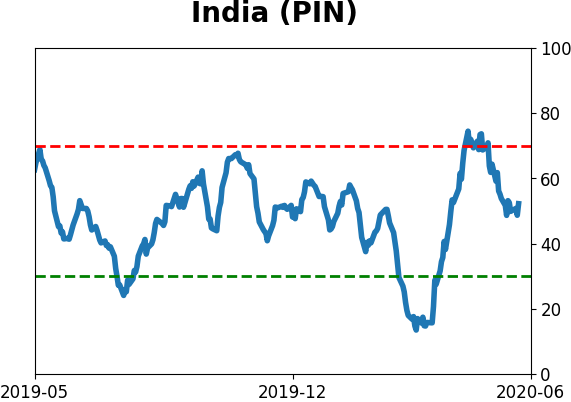
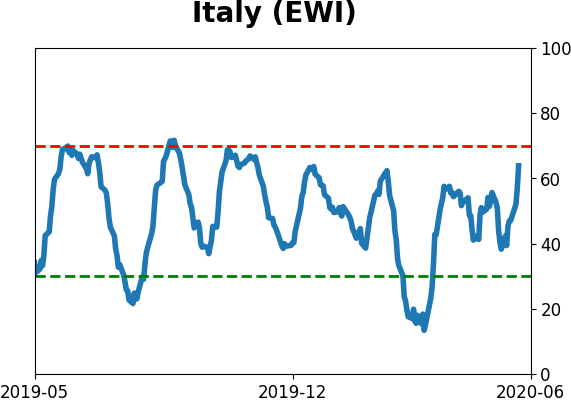
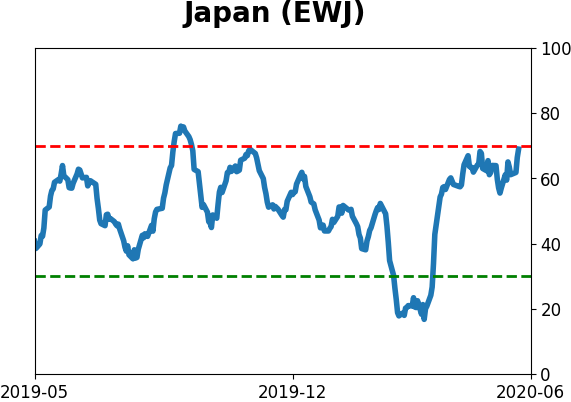
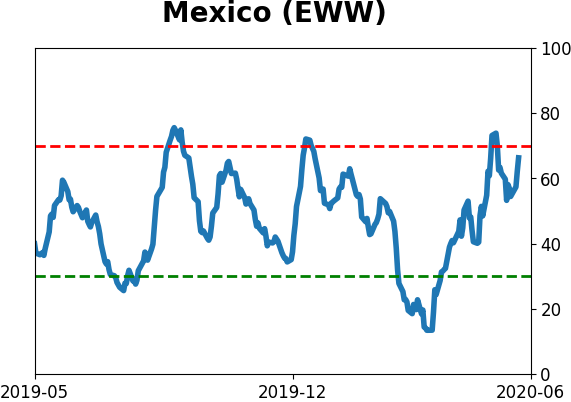
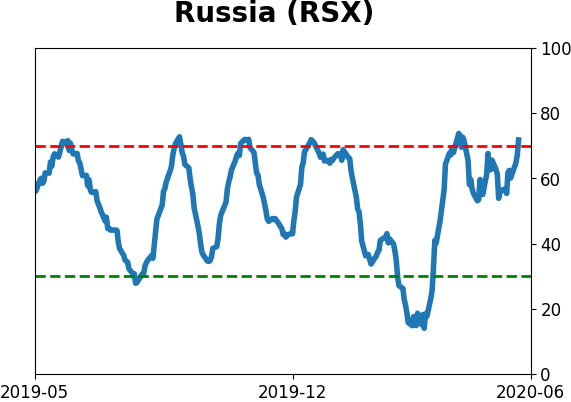
Sentiment Around The World
Optimism Index Thumbnails
|
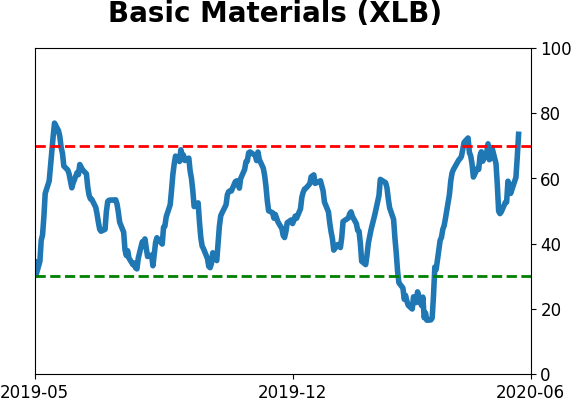
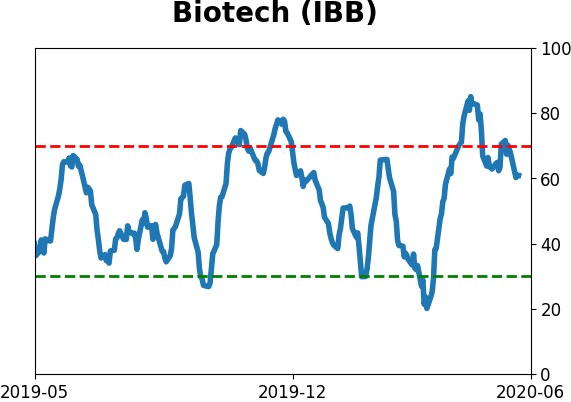
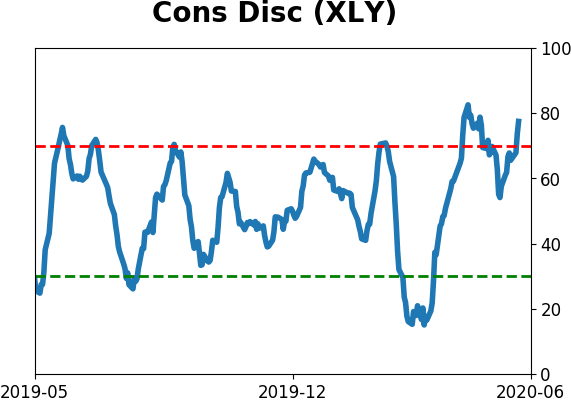
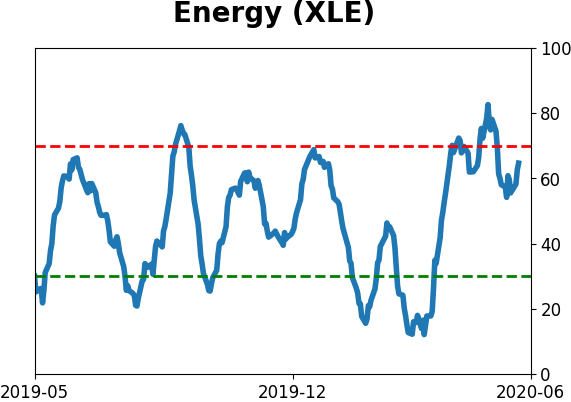
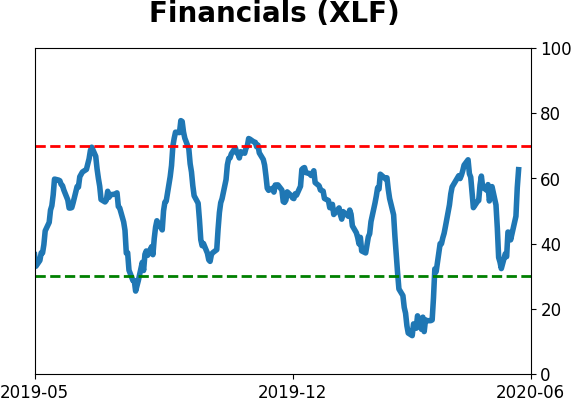
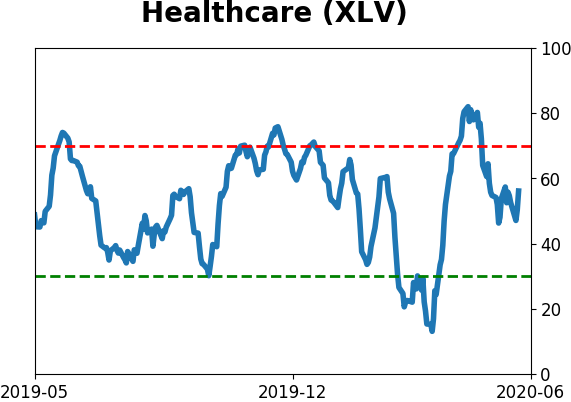
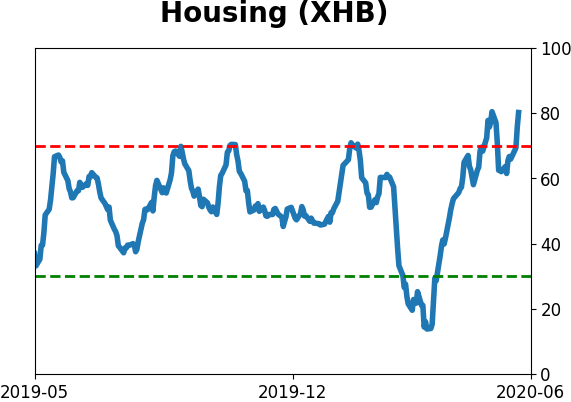
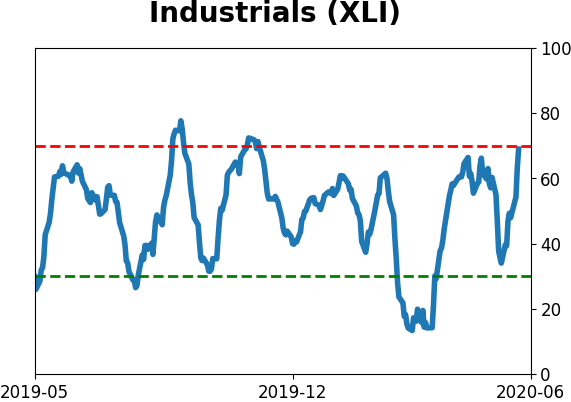
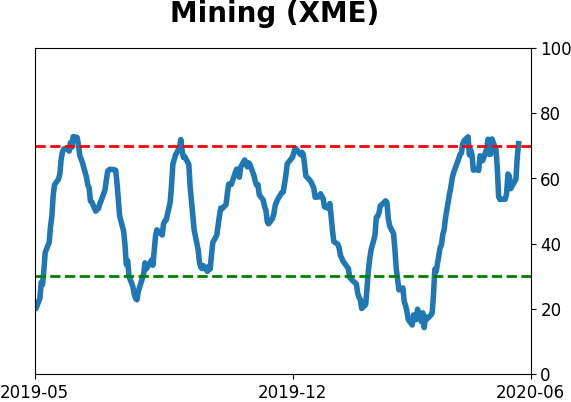
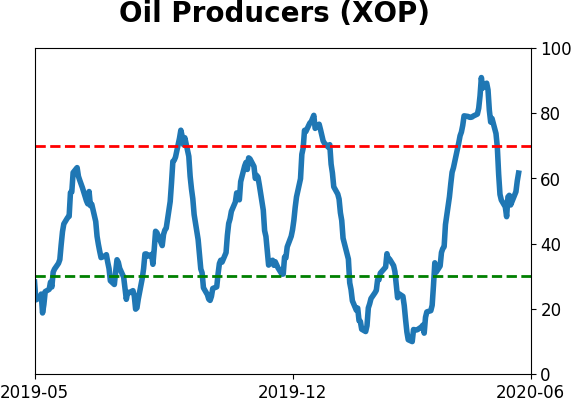
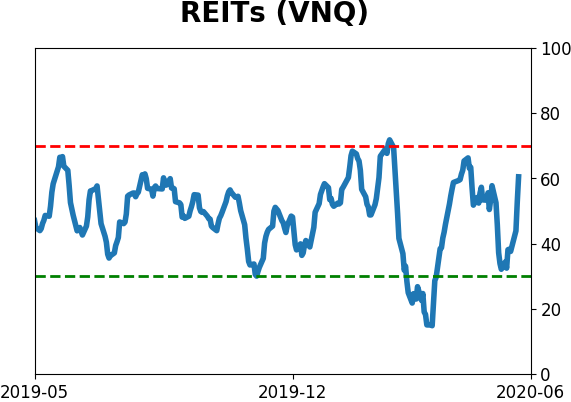
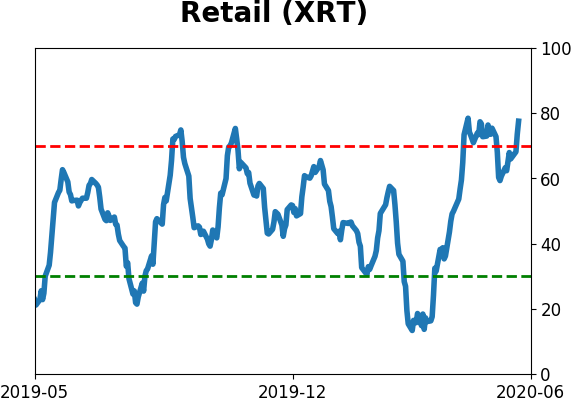
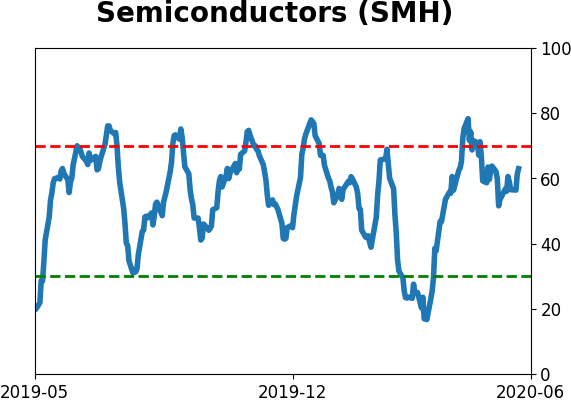
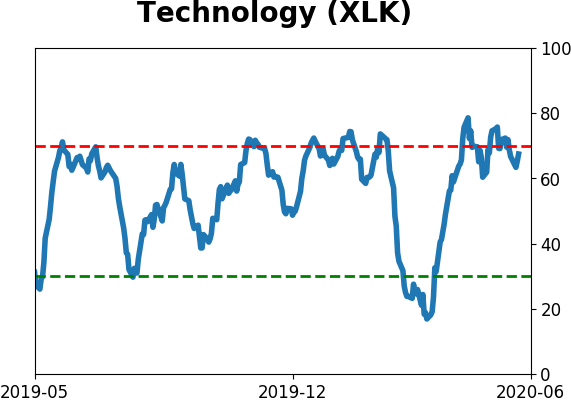
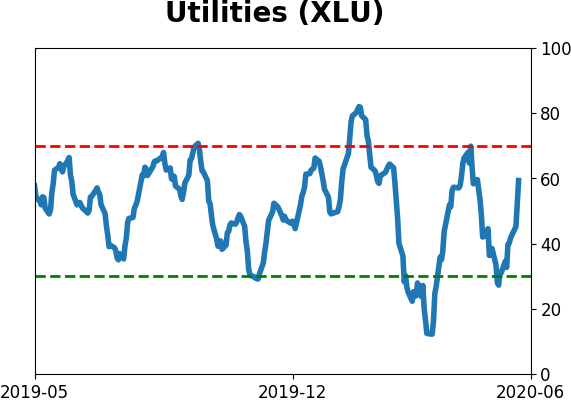
Sector ETF's - 10-Day Moving Average
|
|
|
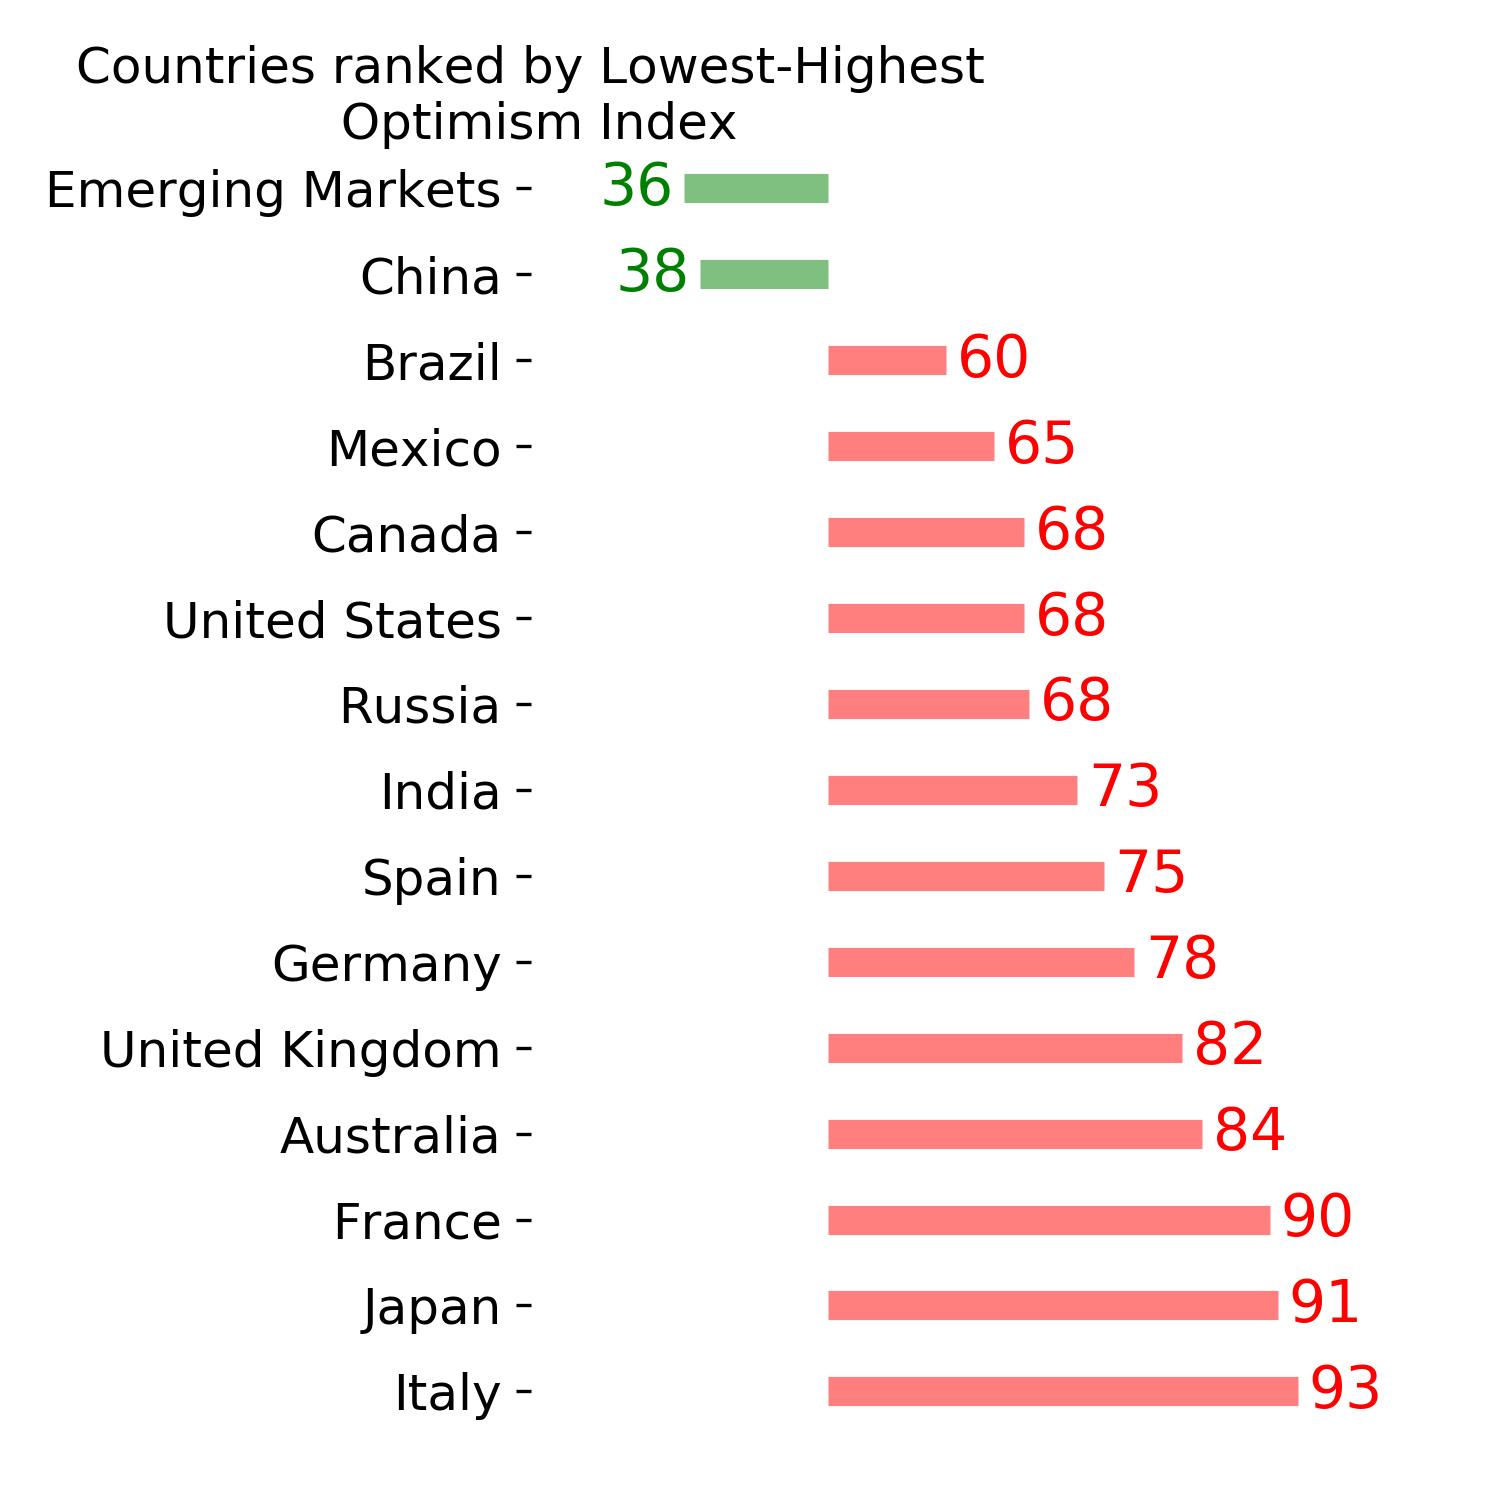
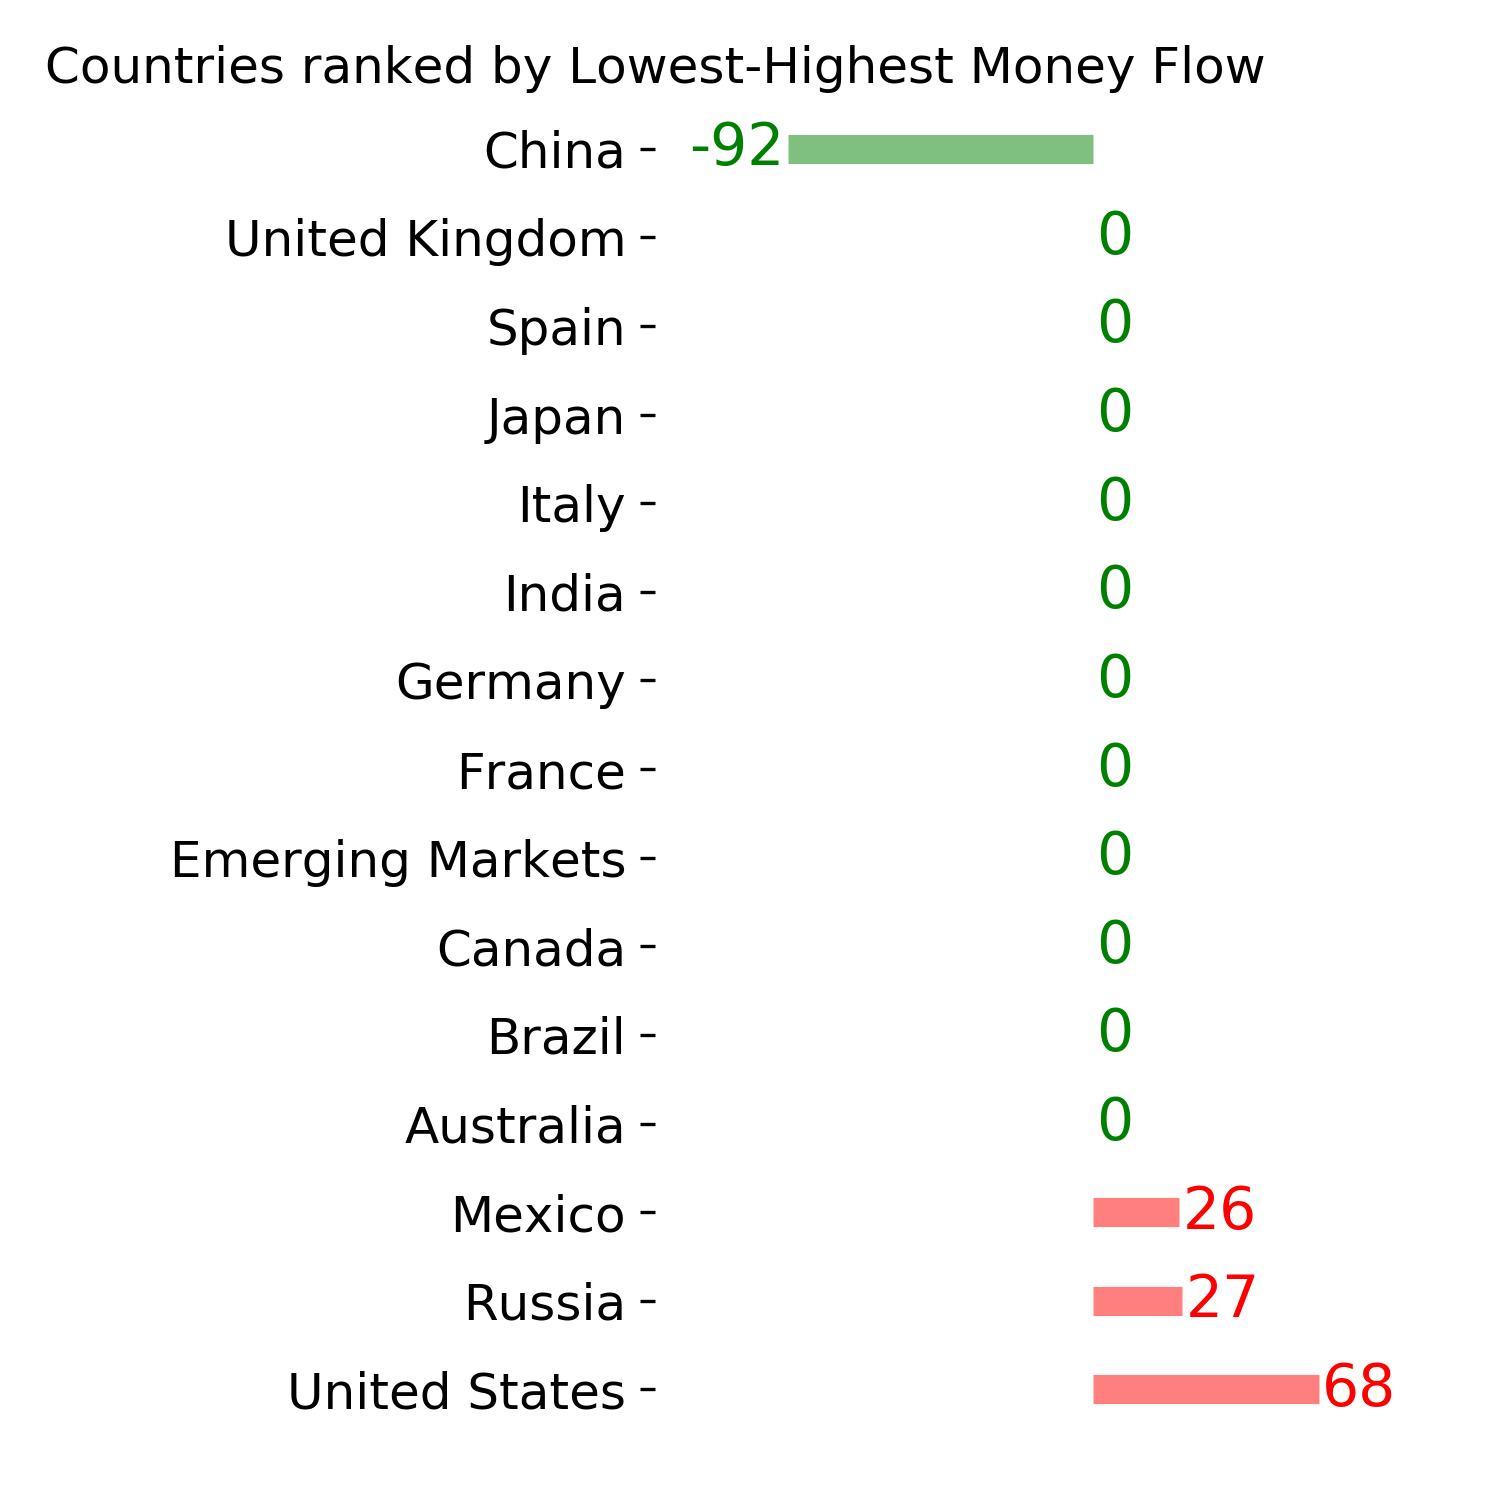
Country ETF's - 10-Day Moving Average
|
|
|
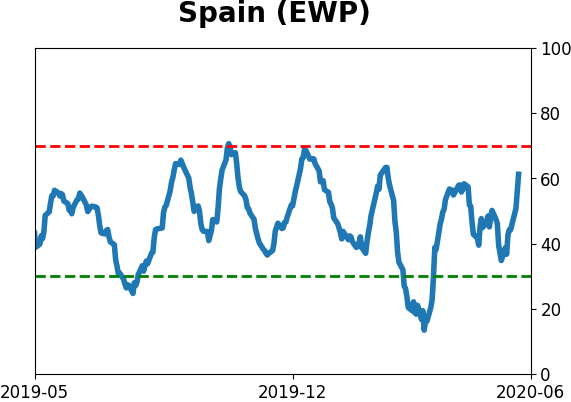
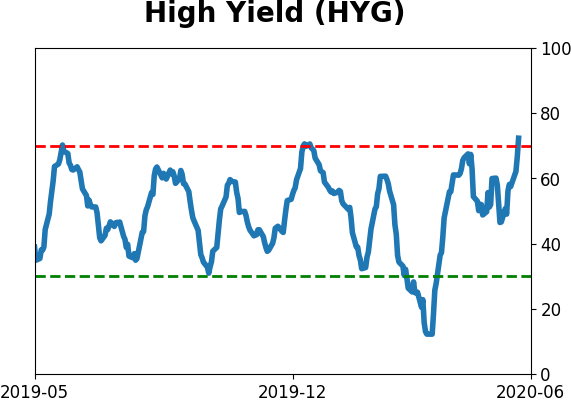
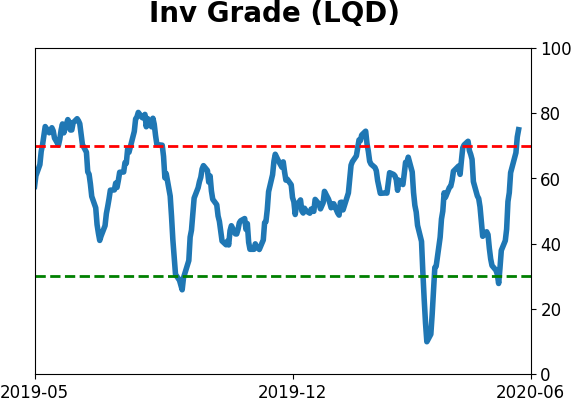
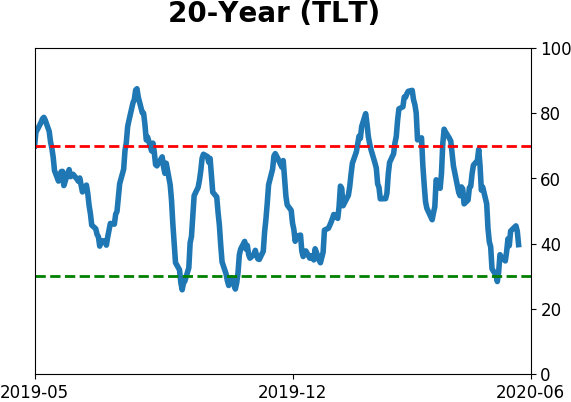
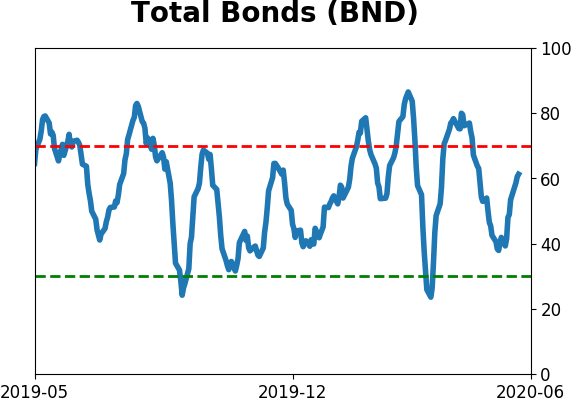
Bond ETF's - 10-Day Moving Average
|
|
|
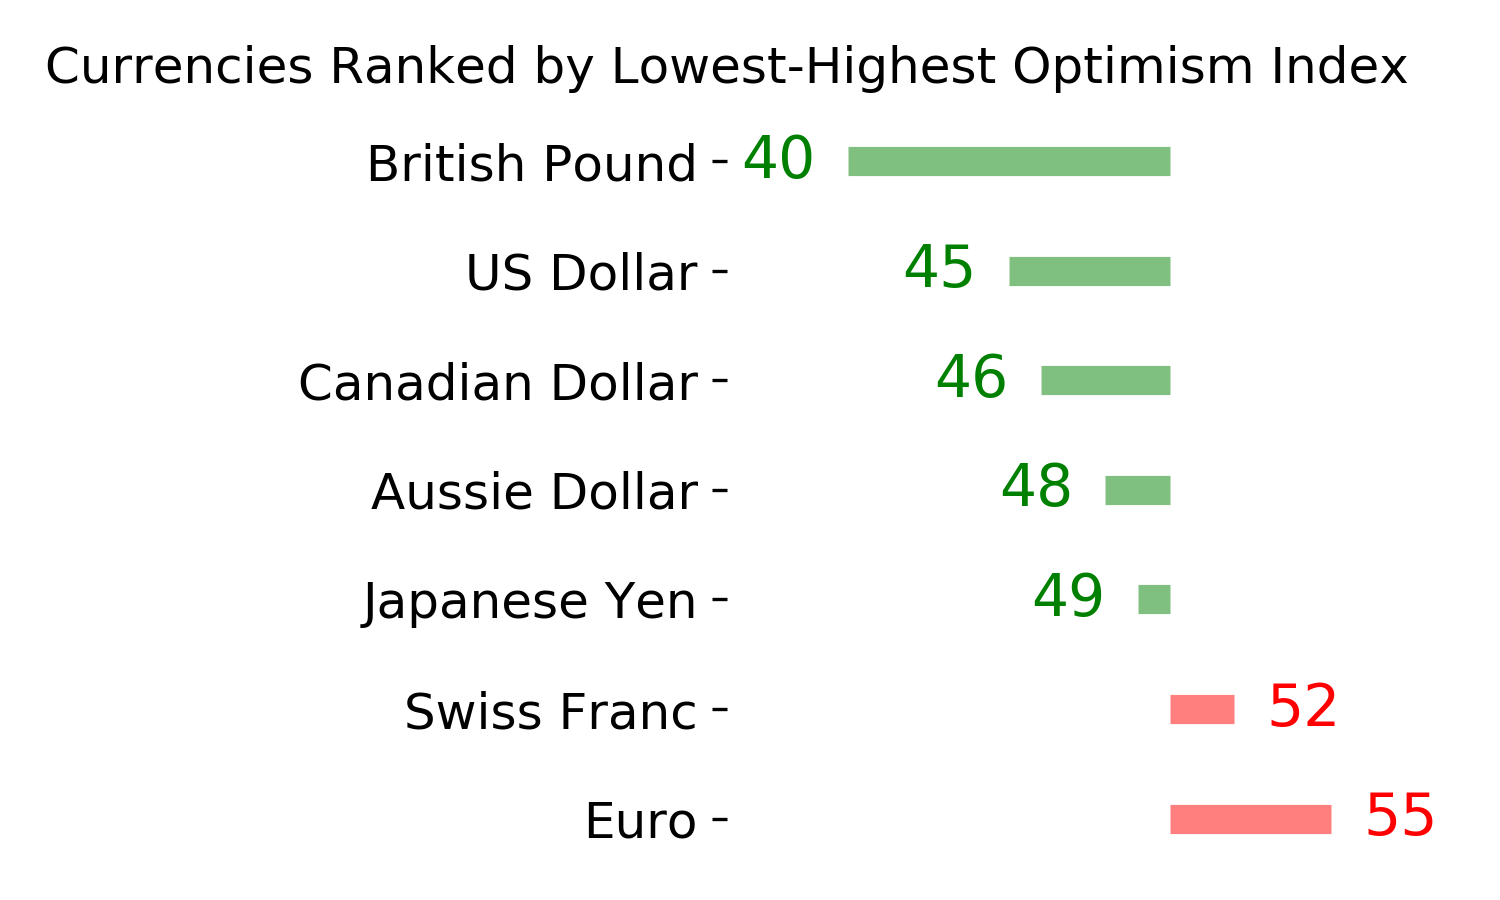
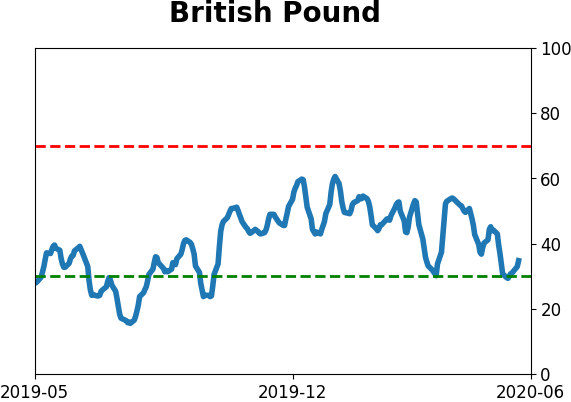
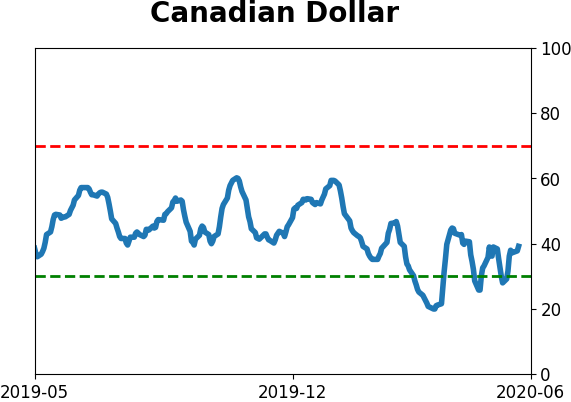
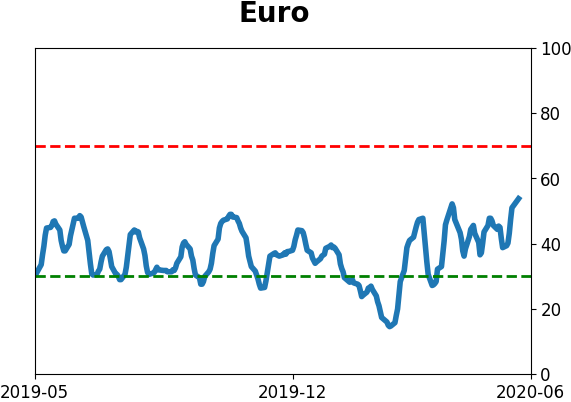
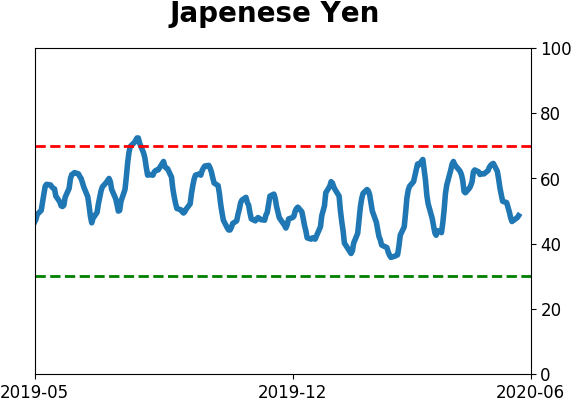
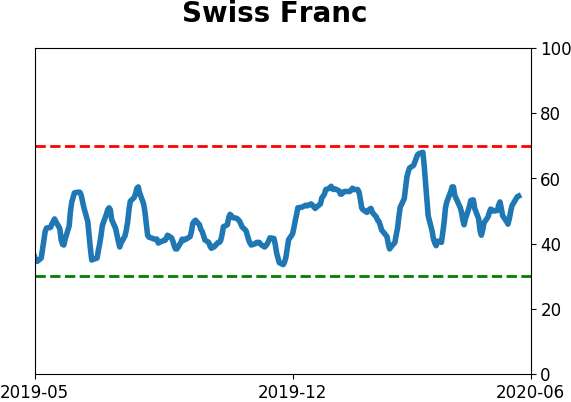
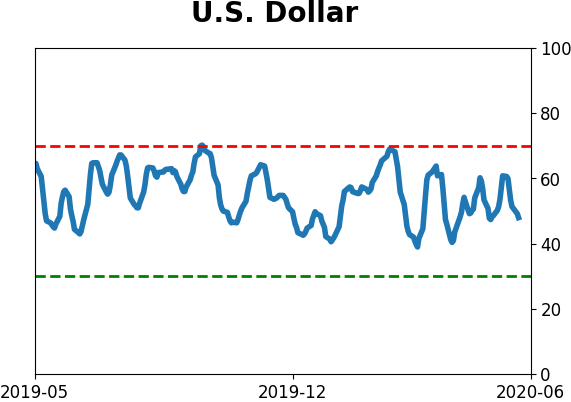
Currency ETF's - 5-Day Moving Average
|
|
|
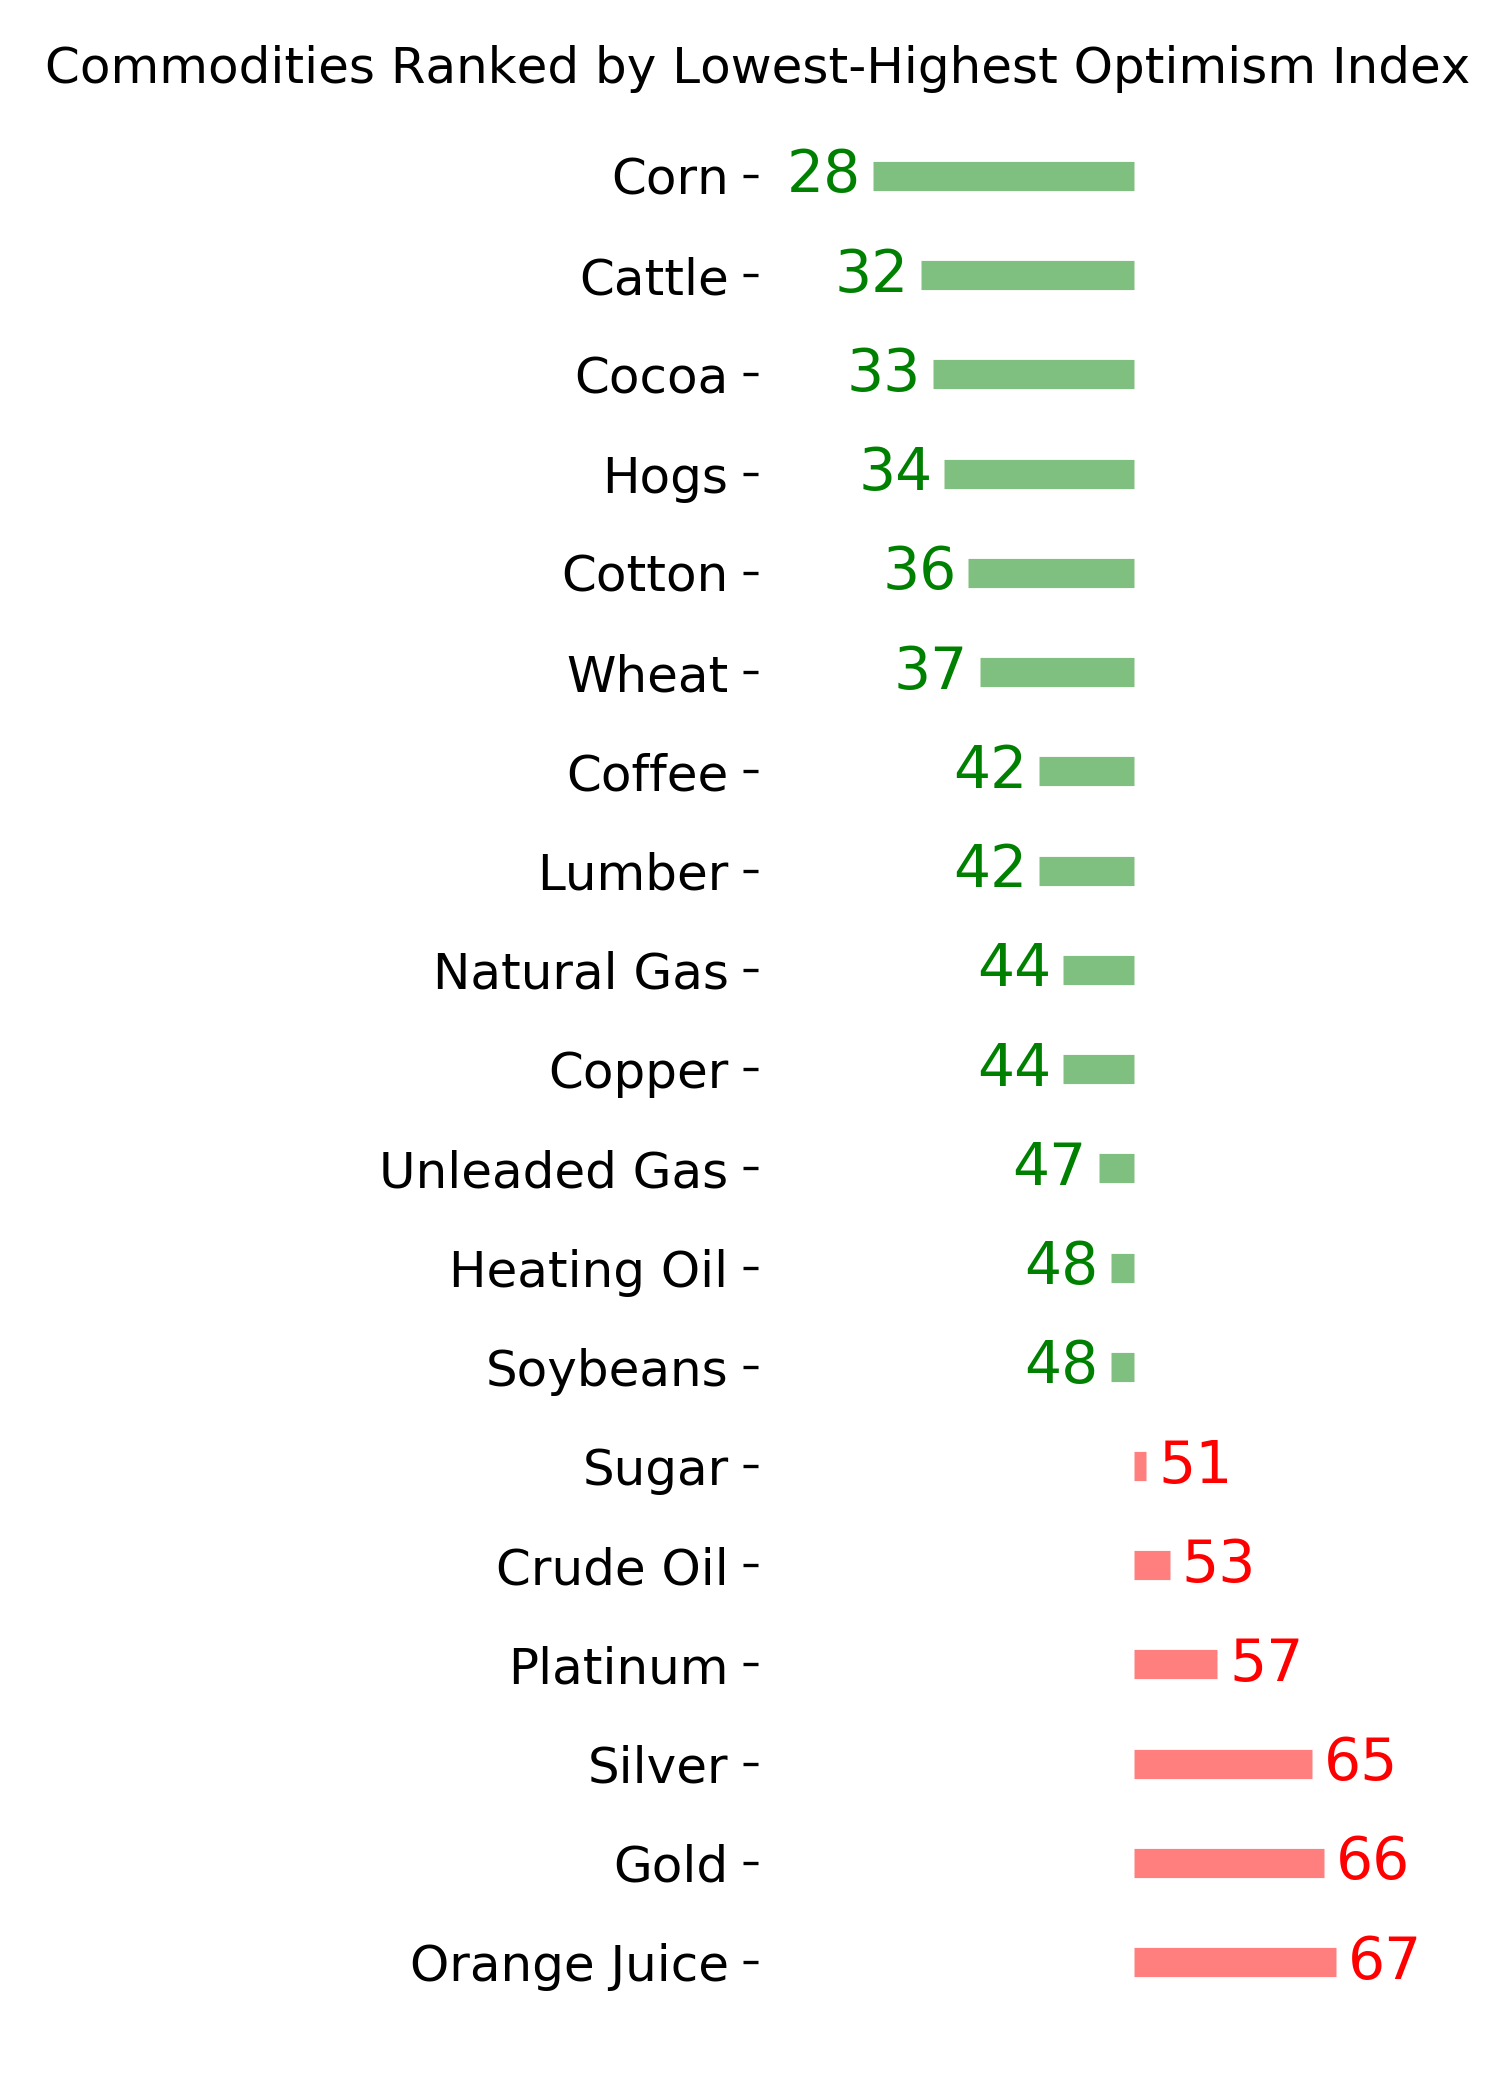
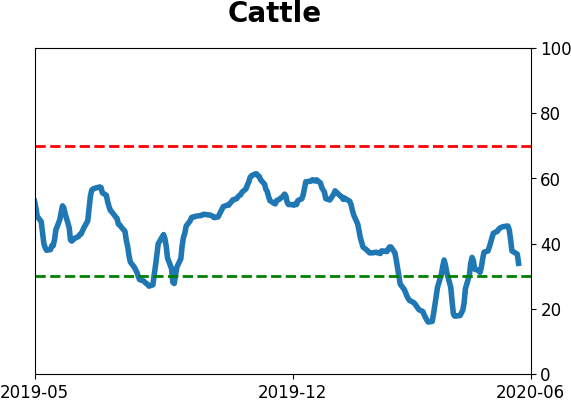
Commodity ETF's - 5-Day Moving Average
|
|