Headlines
|
|
Yield Fears Are Driving Stocks, And That's Bad for Gold:
Traders are pricing in future volatility expectations in the S&P 500 based in large part on movements in 10-year Treasury yields. When the correlation between the VIX and yields has been as high as it is now, stocks wobbled, but gold tended to fare even worse.
Bottom Line:
See the Outlook & Allocations page for more details on these summaries STOCKS: Hold
The speculative frenzy in February is wrung out. Internal dynamics have mostly held up, with some exceptions. Many of our studies still show a mixed to poor short-term view, with medium- and long-term ones turning more positive. BONDS: Hold
Various parts of the market got hit in March, with the lowest Bond Optimism Index we usually see during healthy environments. After a shaky couple of weeks, the broad bond market has modestly recovered. Not a big edge here either way. GOLD: Hold
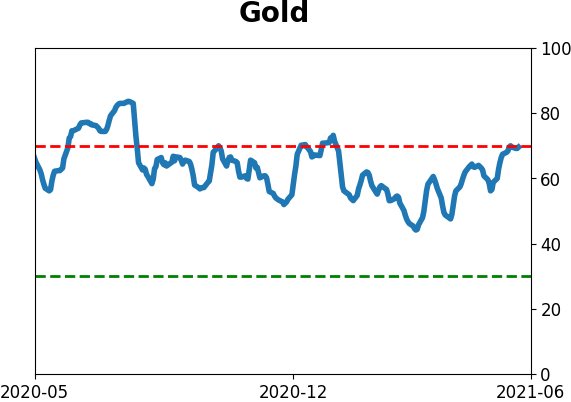
Gold and miners have done very well, recovering above long-term trend lines. The issue is that both have tended to perform poorly after similar situations - will have to wait and see how it plays out.
|
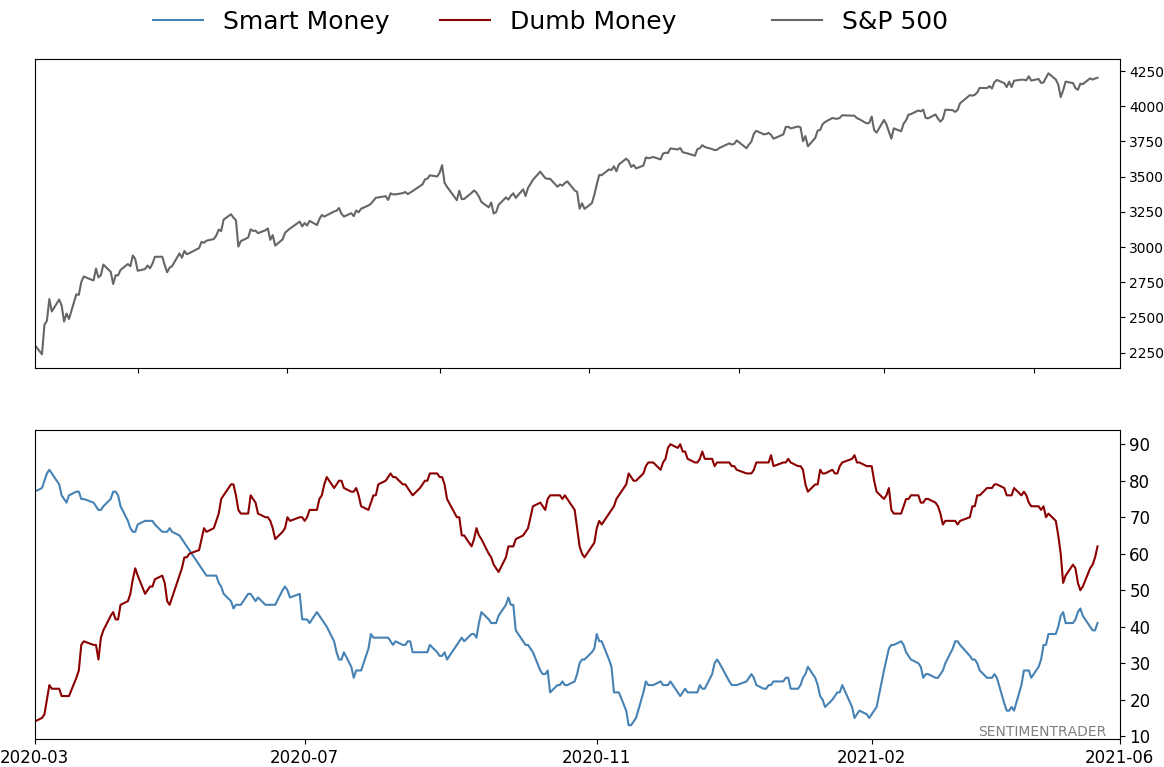
Smart / Dumb Money Confidence
|
Smart Money Confidence: 41%
Dumb Money Confidence: 62%
|
|
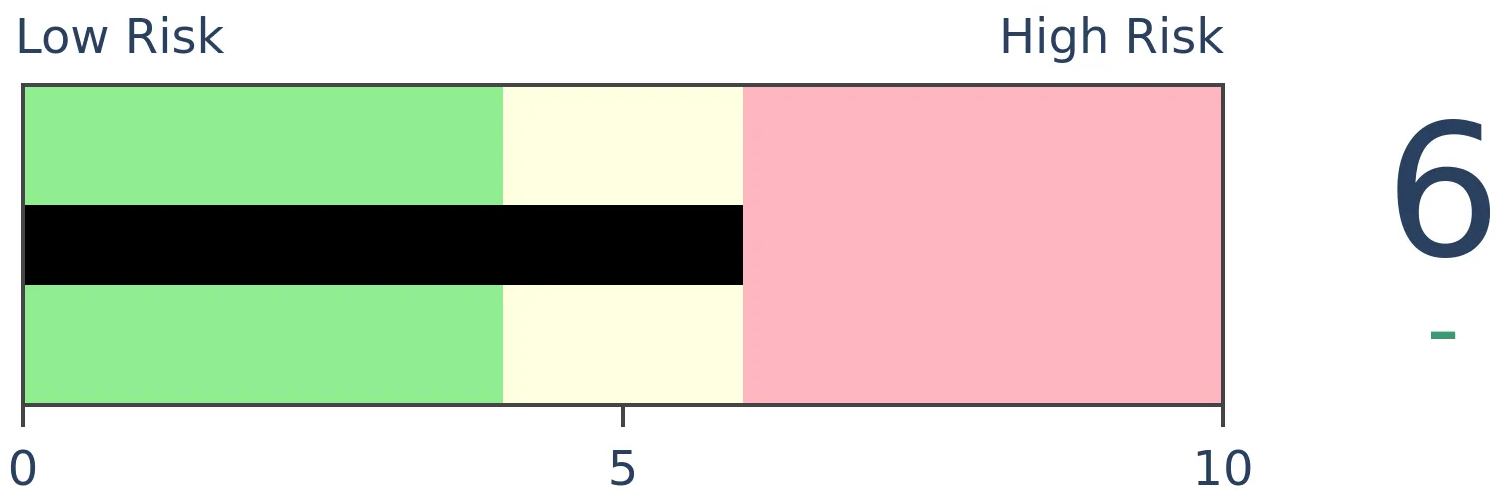
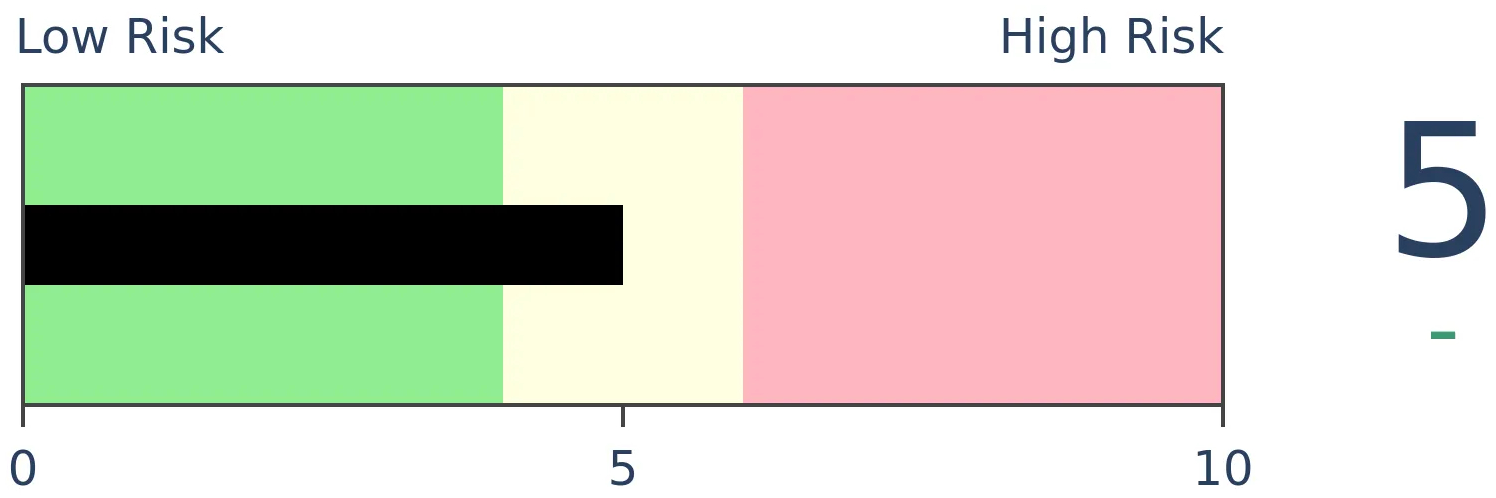
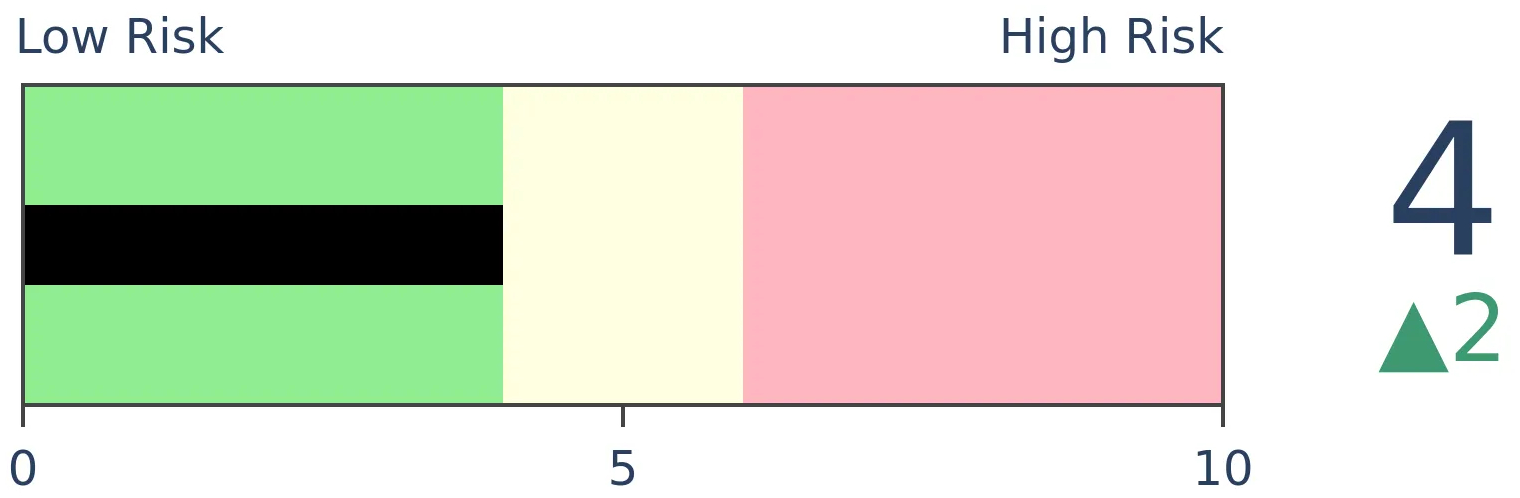
Risk Levels
Stocks Short-Term
|
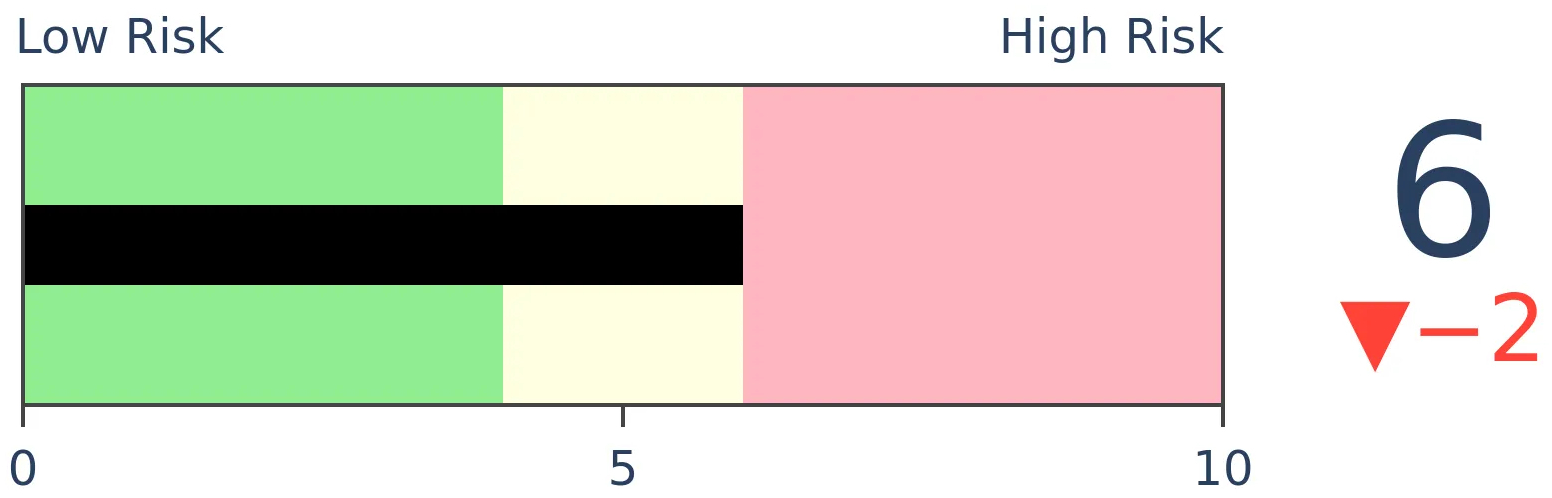
Stocks Medium-Term
|
|
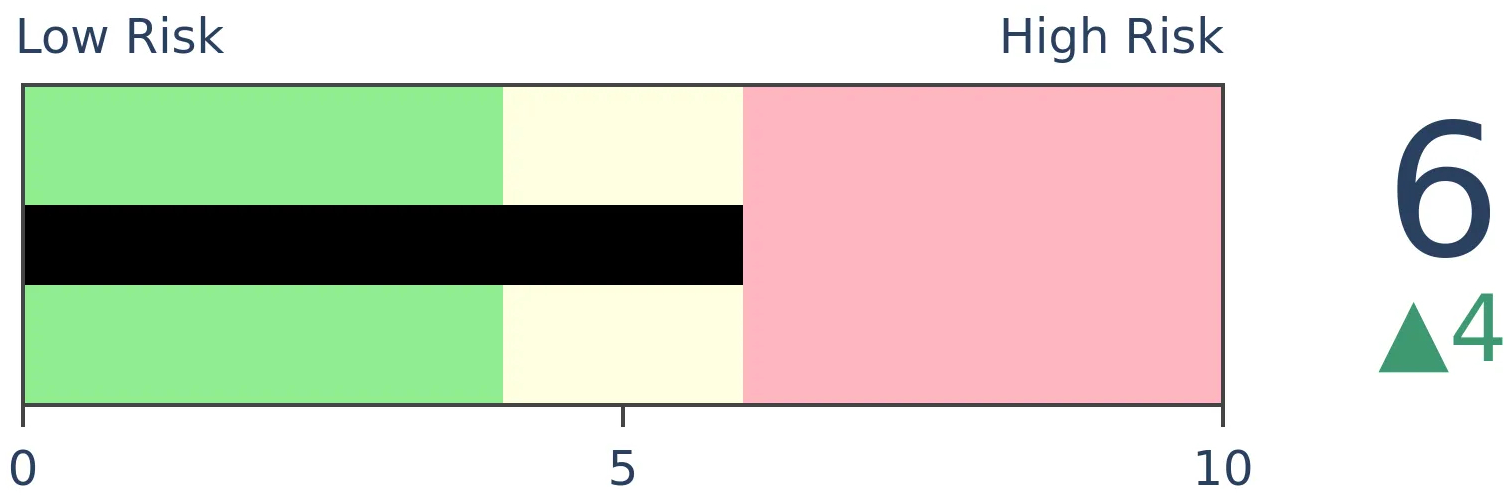
Bonds
|
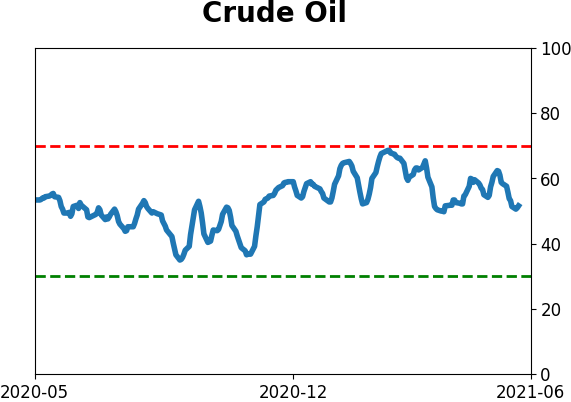
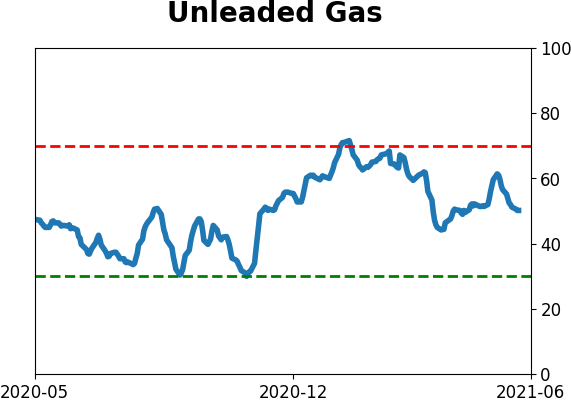
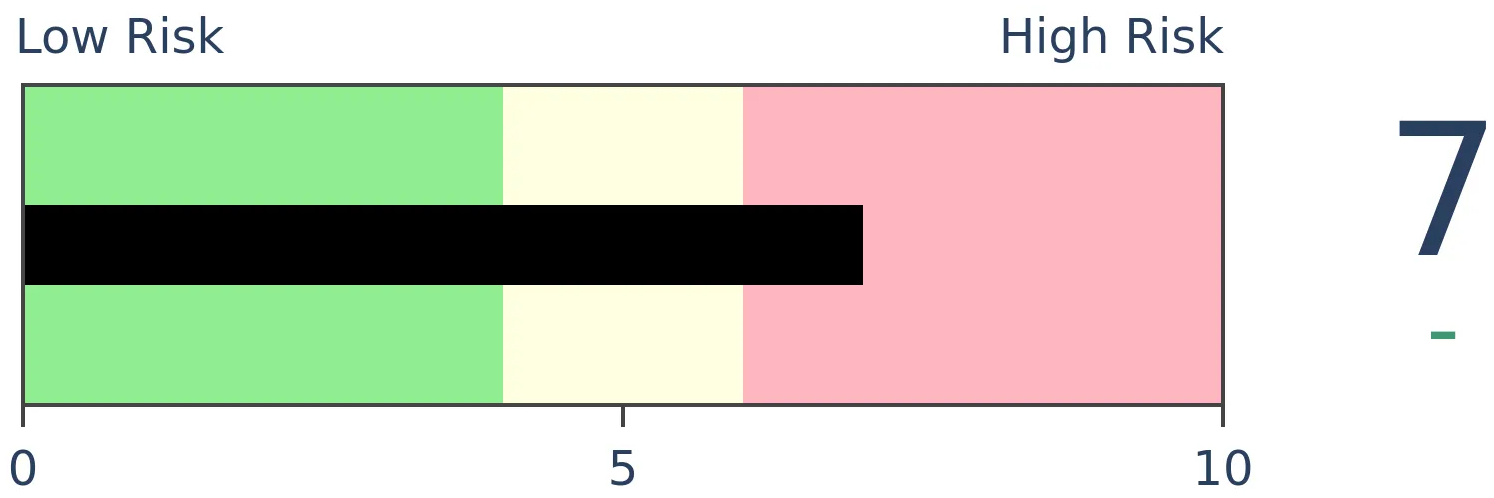
Crude Oil
|
|
Gold
|
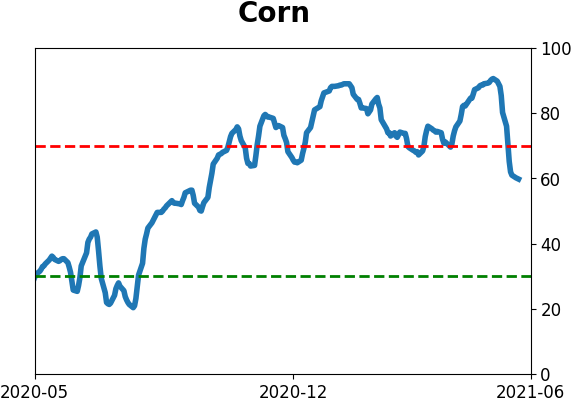
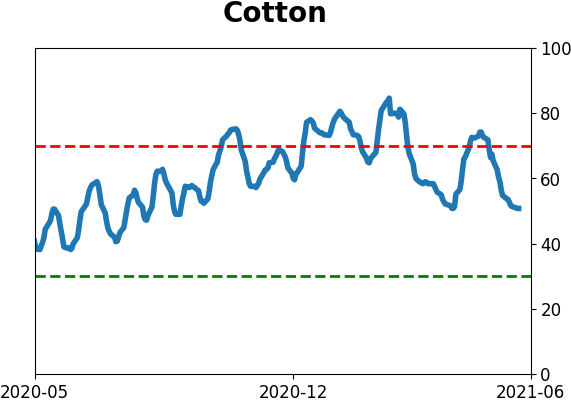
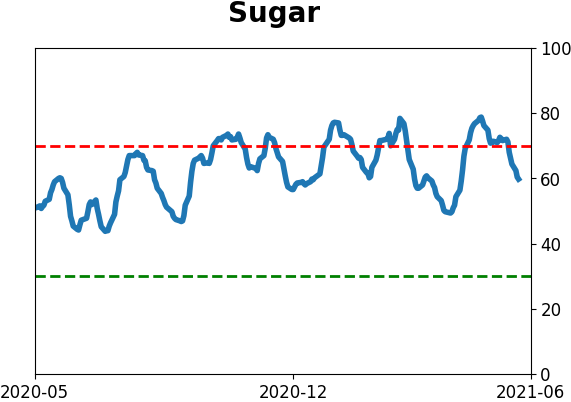
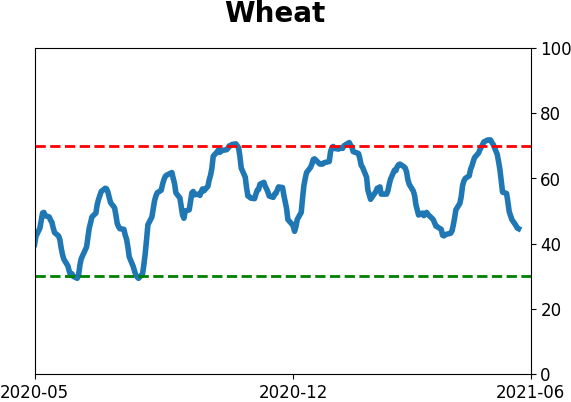
Agriculture
|
|
Research
BOTTOM LINE
Traders are pricing in future volatility expectations in the S&P 500 based in large part on movements in 10-year Treasury yields. When the correlation between the VIX and yields has been as high as it is now, stocks wobbled, but gold tended to fare even worse.
FORECAST / TIMEFRAME
GLD -- Down, Medium-Term
|
Investors love to latch onto narratives. They're simple, make theoretical sense...and are often completely wrong.
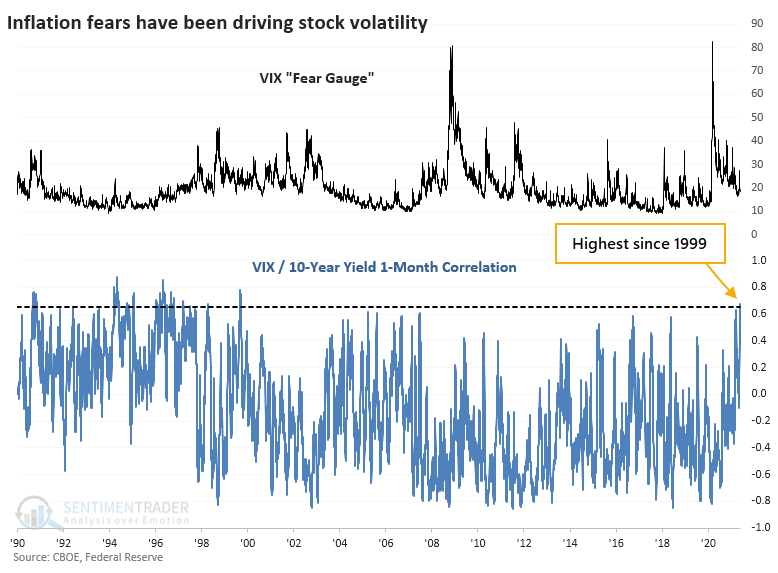
Lately, the narrative has been that stocks have stalled because of fears over inflation. We saw on Wednesday that those fears are valid - when an investor is losing money on earnings after inflation, stocks have often tanked.
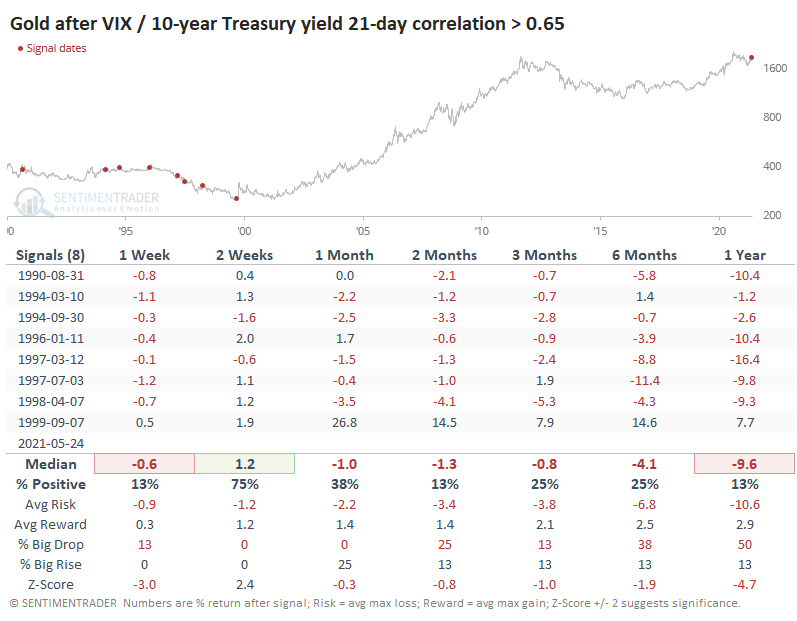
This happens to be one of those narratives that has some solid empirical evidence. Over the past month, about when stocks started to go into a holding pattern, the correlation in daily changes between the VIX "fear gauge" and the yield on 10-year Treasury notes skyrocketed to the highest level since 1999.
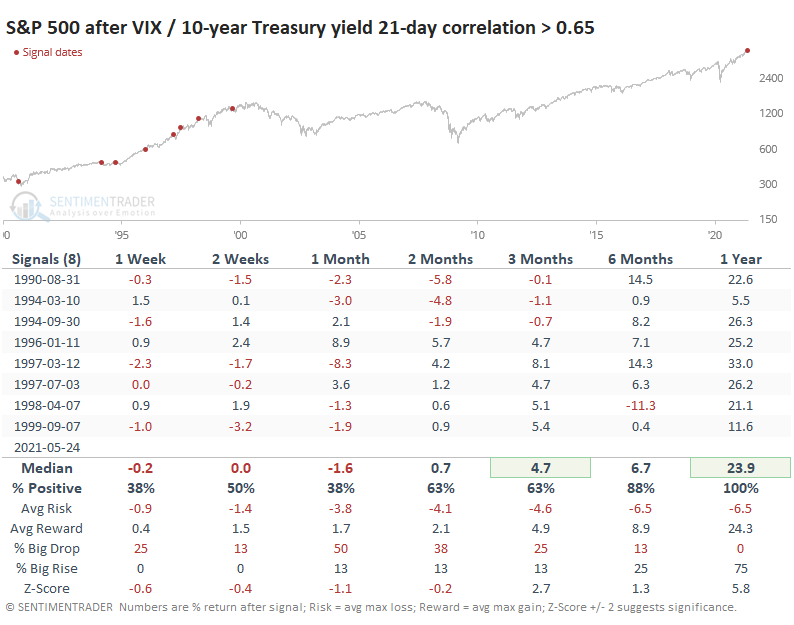
HIGH CORRELATIONS MIXED FOR STOCKS, BAD FOR GOLD
Yields drove investors' expectations for volatility throughout much of the 1990s. During that time, when the correlation got to as high a level as it's at now, the S&P showed weak short-term returns but good medium- to long-term ones.
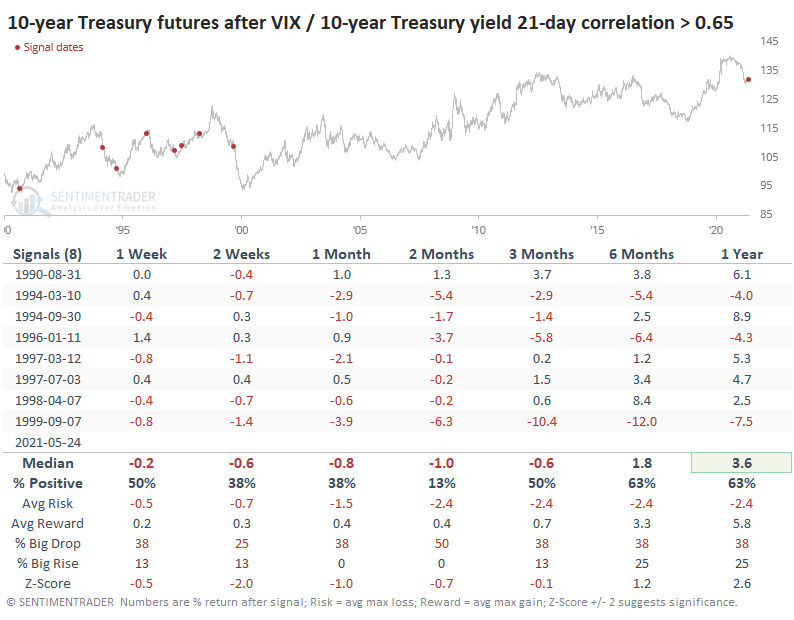
The VIX showed mixed returns with no consistent pattern. 10-year Treasury futures prices, which move opposite to its yield, had a strong tendency to decline over the short- t0 medium-term.
When investors had been this focused on yields, gold took it on the chin.
USING THE SYNTHETIC VIX FOR MORE HISTORY
A single market environment - the 1990s - doesn't give us much to work with. So, if we use the synthetic VIX that we looked at with bitcoin, we can get a rough approximation of how this would have looked before 1990.
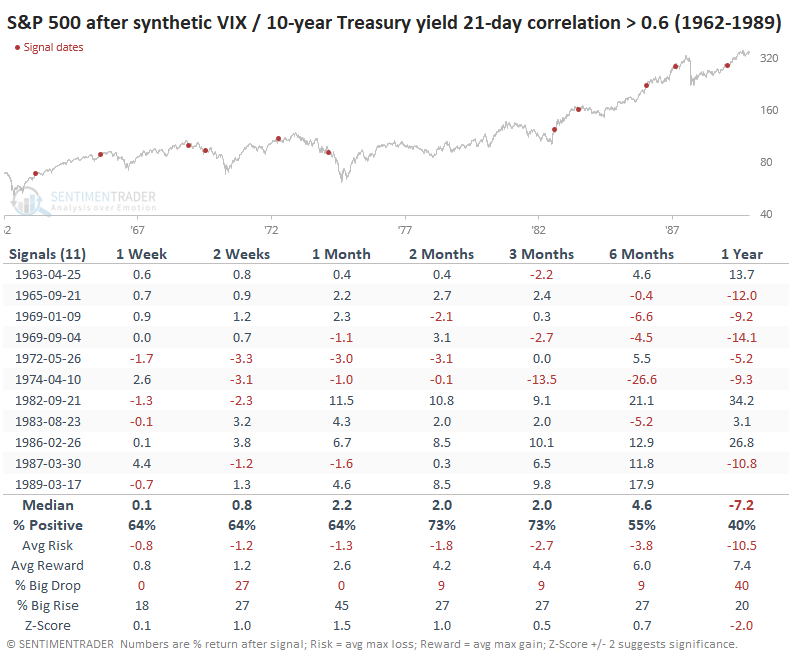
Not much of a conclusion here. Again, it's not a perfect substitute for the VIX, especially over a relatively short time frame like a month, but for what it's worth, it was a better short-term sign before the 1990s.
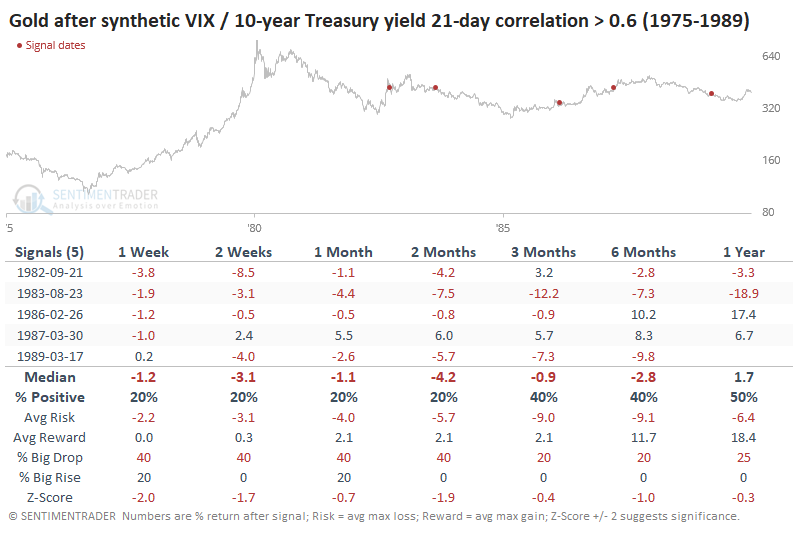
Using gold since 1975, it was still ugly.
Whatever fear traders are showing right now is largely due to inflation and the impact on interest rates. What's less clear is what that might mean going forward. We'd place more weight on the instances that reflect the VIX's actual values. Unfortunately, those only triggered during a single decade.
If we look at lesser correlations from 2001 - 2019, then markets mostly performed similarly. The S&P still showed weak short-term returns and stronger long-term ones. Gold was weak short-term but then saw better medium-term returns thanks to the bull run in the 2000s.
This rate-driven fear has been more of a consistent factor for gold, and not in a good way. If we can take anything from this behavior, it's that gold has not reacted well in the weeks and months ahead.
Active Studies
| Time Frame | Bullish | Bearish | | Short-Term | 0 | 0 | | Medium-Term | 1 | 11 | | Long-Term | 11 | 5 |
|
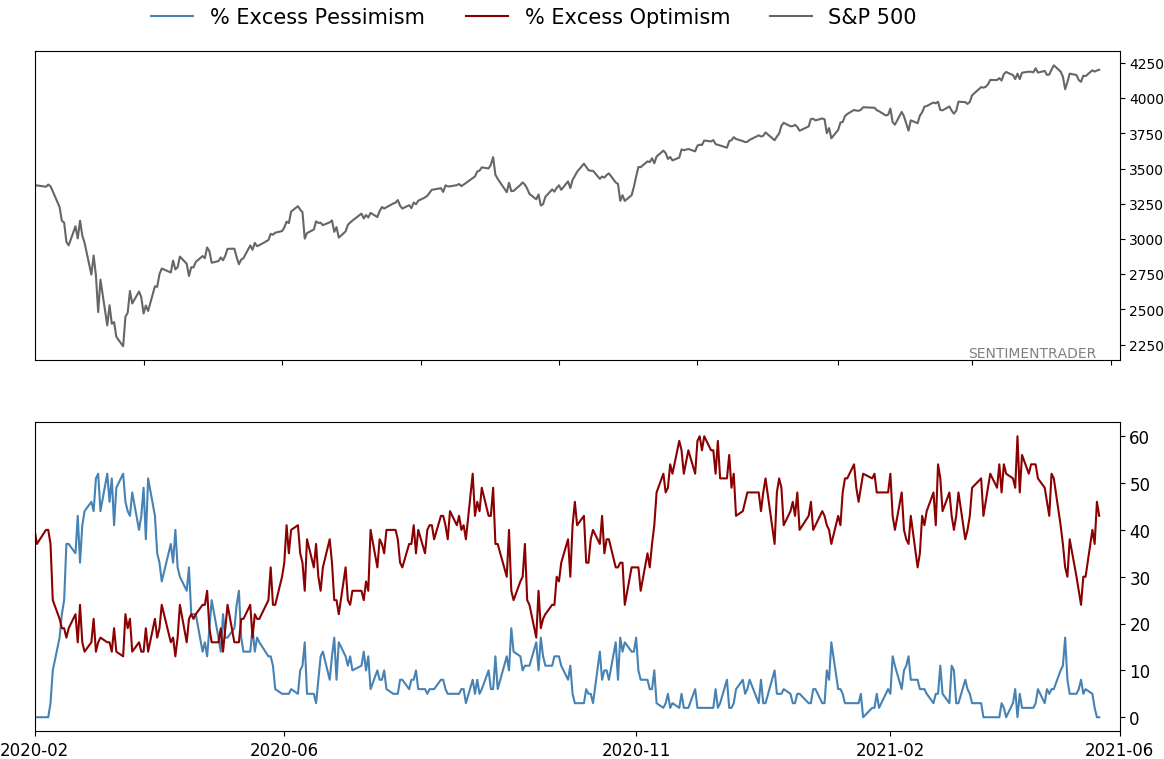
Indicators at Extremes
|
% Showing Pessimism: 0%
Bullish for Stocks
|
|
Portfolio
| Position | Description | Weight % | Added / Reduced | Date | | Stocks | RSP | 4.1 | Added 4.1% | 2021-05-19 | | Bonds | 23.9% BND, 6.9% SCHP | 30.8 | Reduced 7.1% | 2021-05-19 | | Commodities | GCC | 2.5 | Reduced 2.1%
| 2020-09-04 | | Precious Metals | GDX | 5.6 | Reduced 4.2% | 2021-05-19 | | Special Situations | 4.3% XLE, 2.2% PSCE | 7.2 | Reduced 5.6% | 2021-04-22 | | Cash | | 49.8 | | |
|
Updates (Changes made today are underlined)
Much of our momentum and trend work has remained positive for several months, with some scattered exceptions. Almost all sentiment-related work has shown a poor risk/reward ratio for stocks, especially as speculation drove to record highs in exuberance in February. Much of that has worn off, and most of our models are back toward neutral levels. There isn't much to be excited about here. The same goes for bonds and even gold. Gold has been performing well lately and is back above long-term trend lines. The issue is that it has a poor record of holding onto gains when attempting a long-term trend change like this, so we'll take a wait-and-see approach. RETURN YTD: 9.3% 2020: 8.1%, 2019: 12.6%, 2018: 0.6%, 2017: 3.8%, 2016: 17.1%, 2015: 9.2%, 2014: 14.5%, 2013: 2.2%, 2012: 10.8%, 2011: 16.5%, 2010: 15.3%, 2009: 23.9%, 2008: 16.2%, 2007: 7.8%
|
|
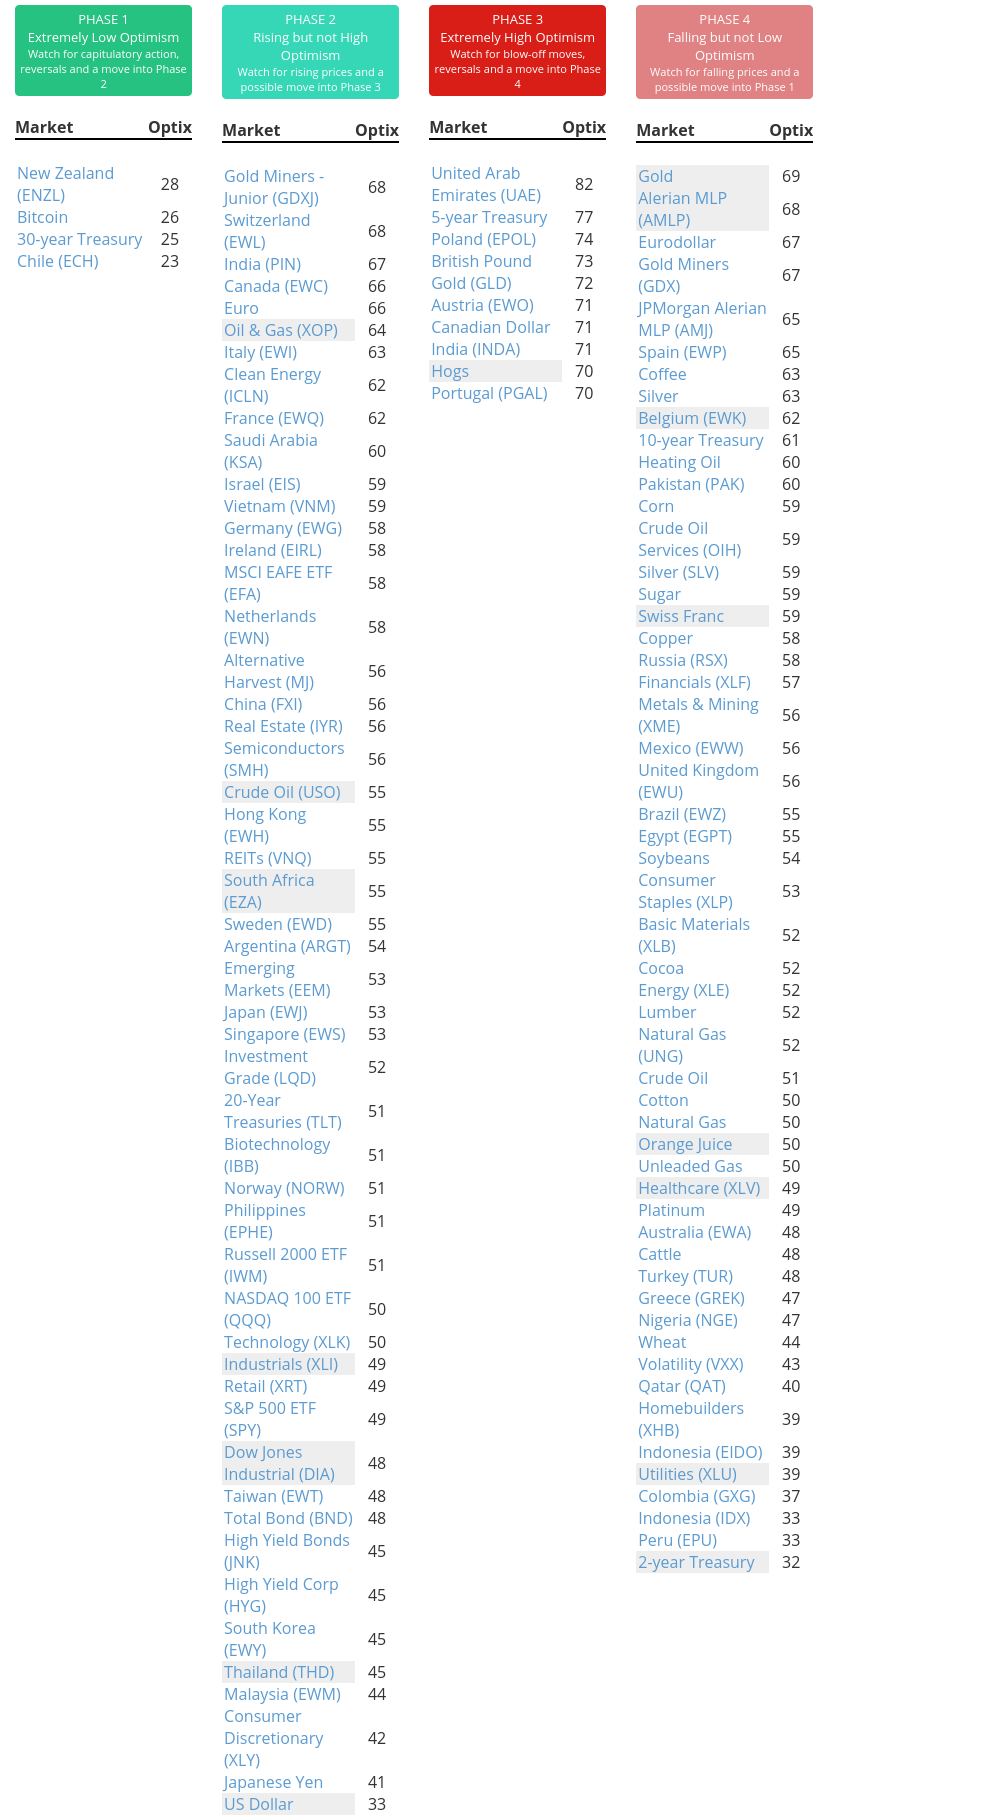
Phase Table
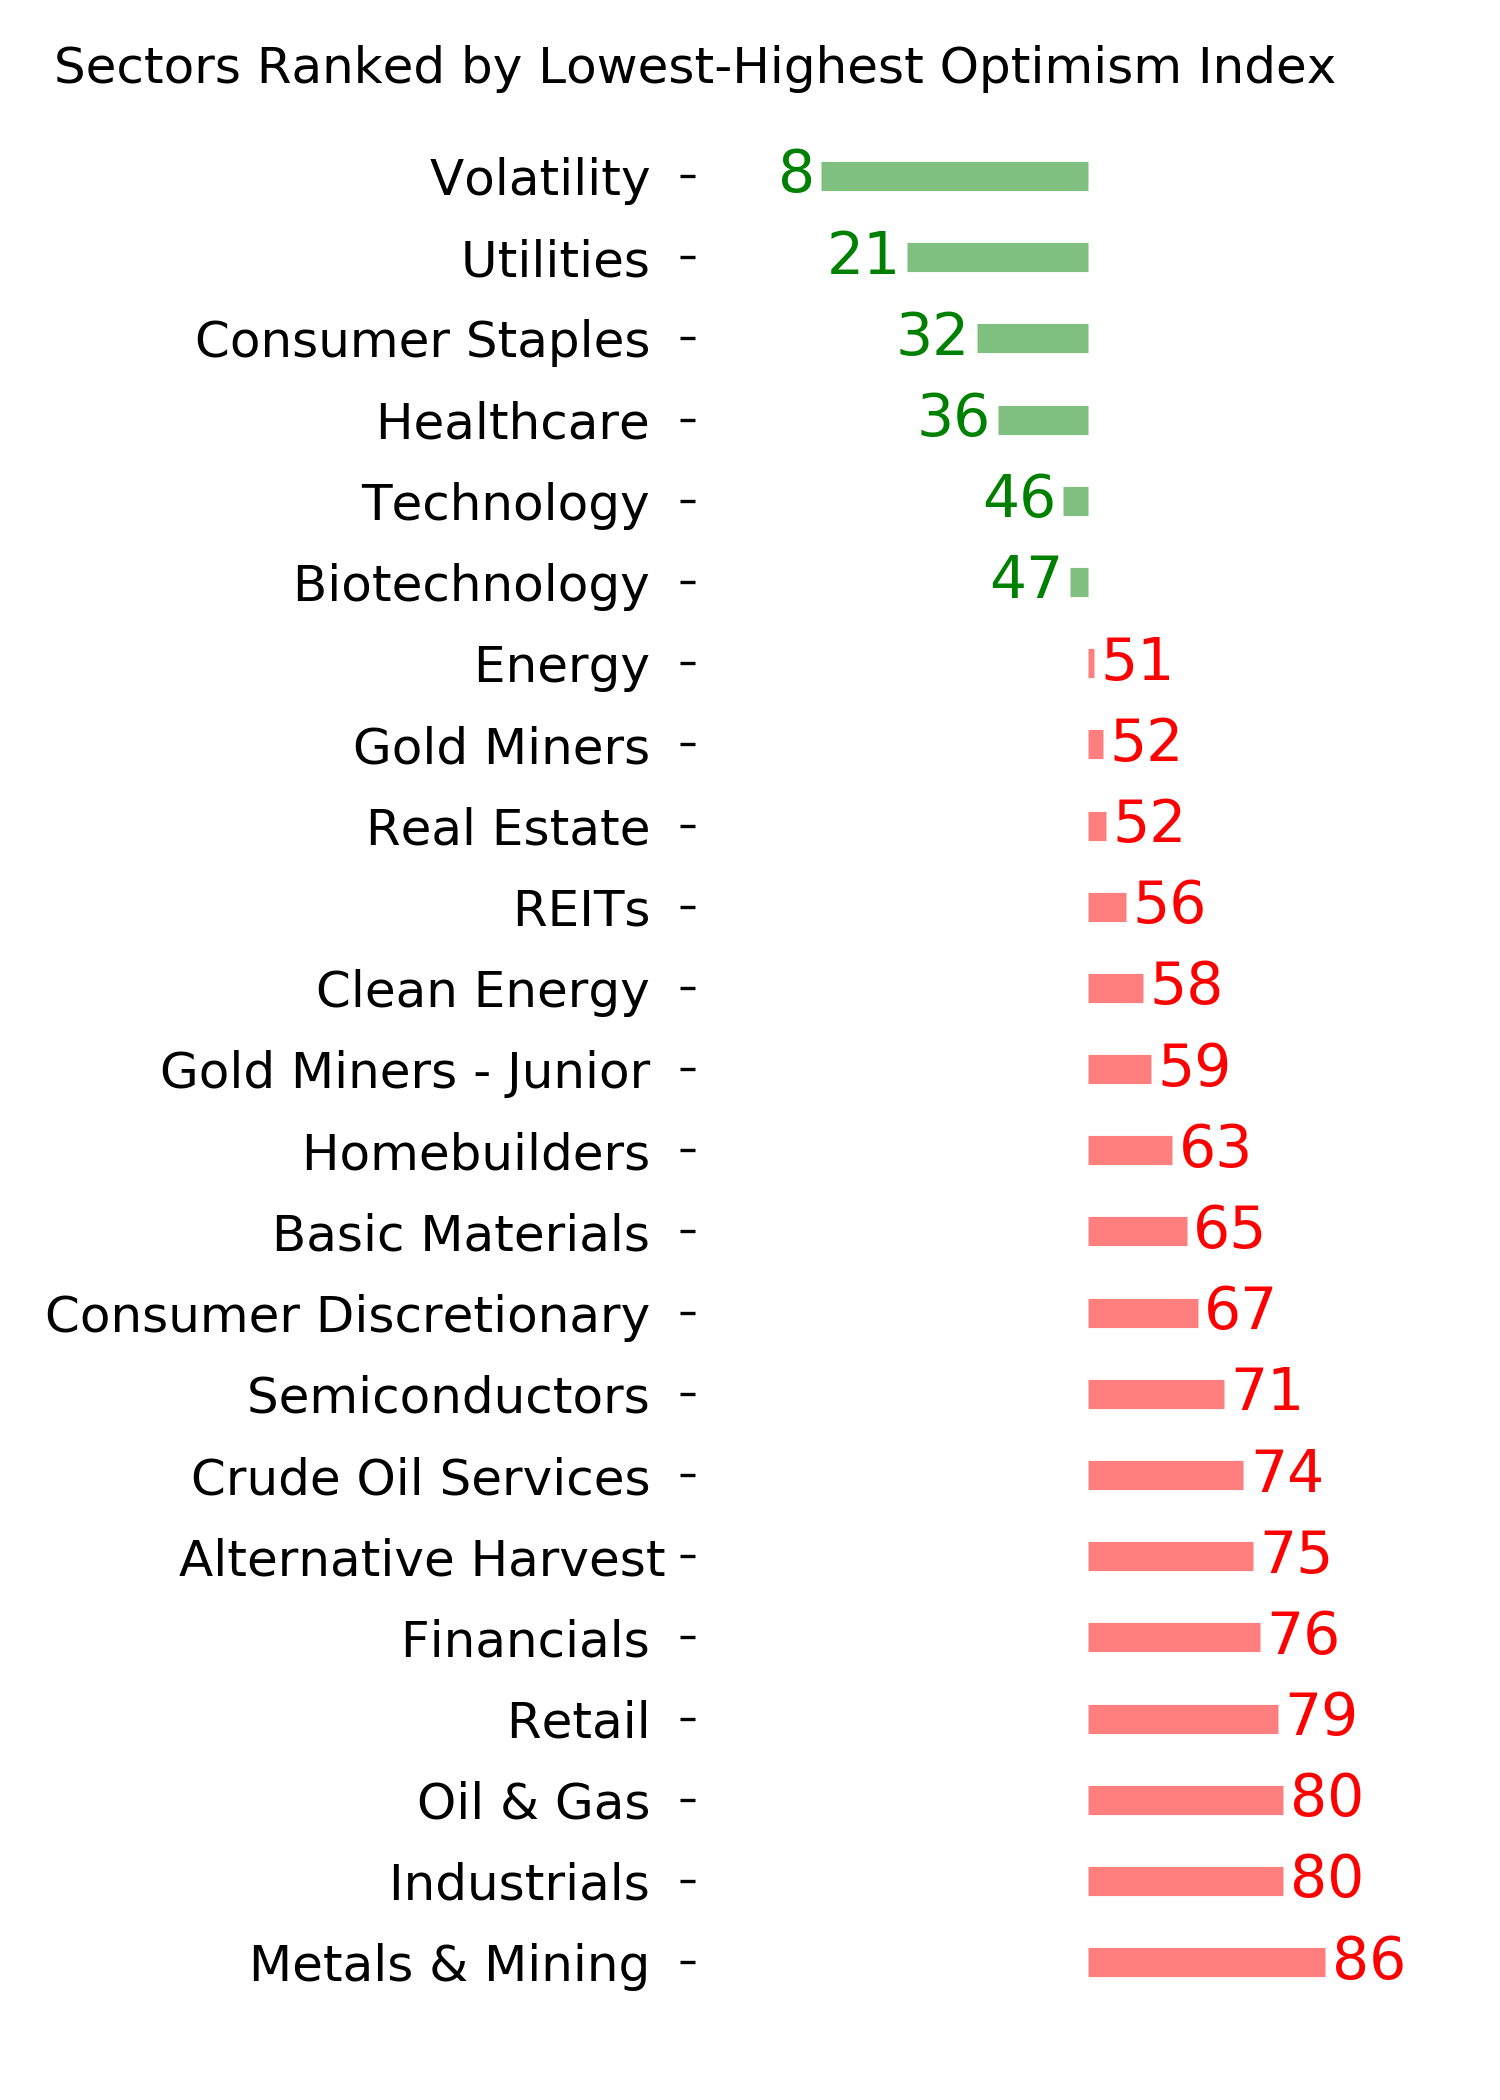
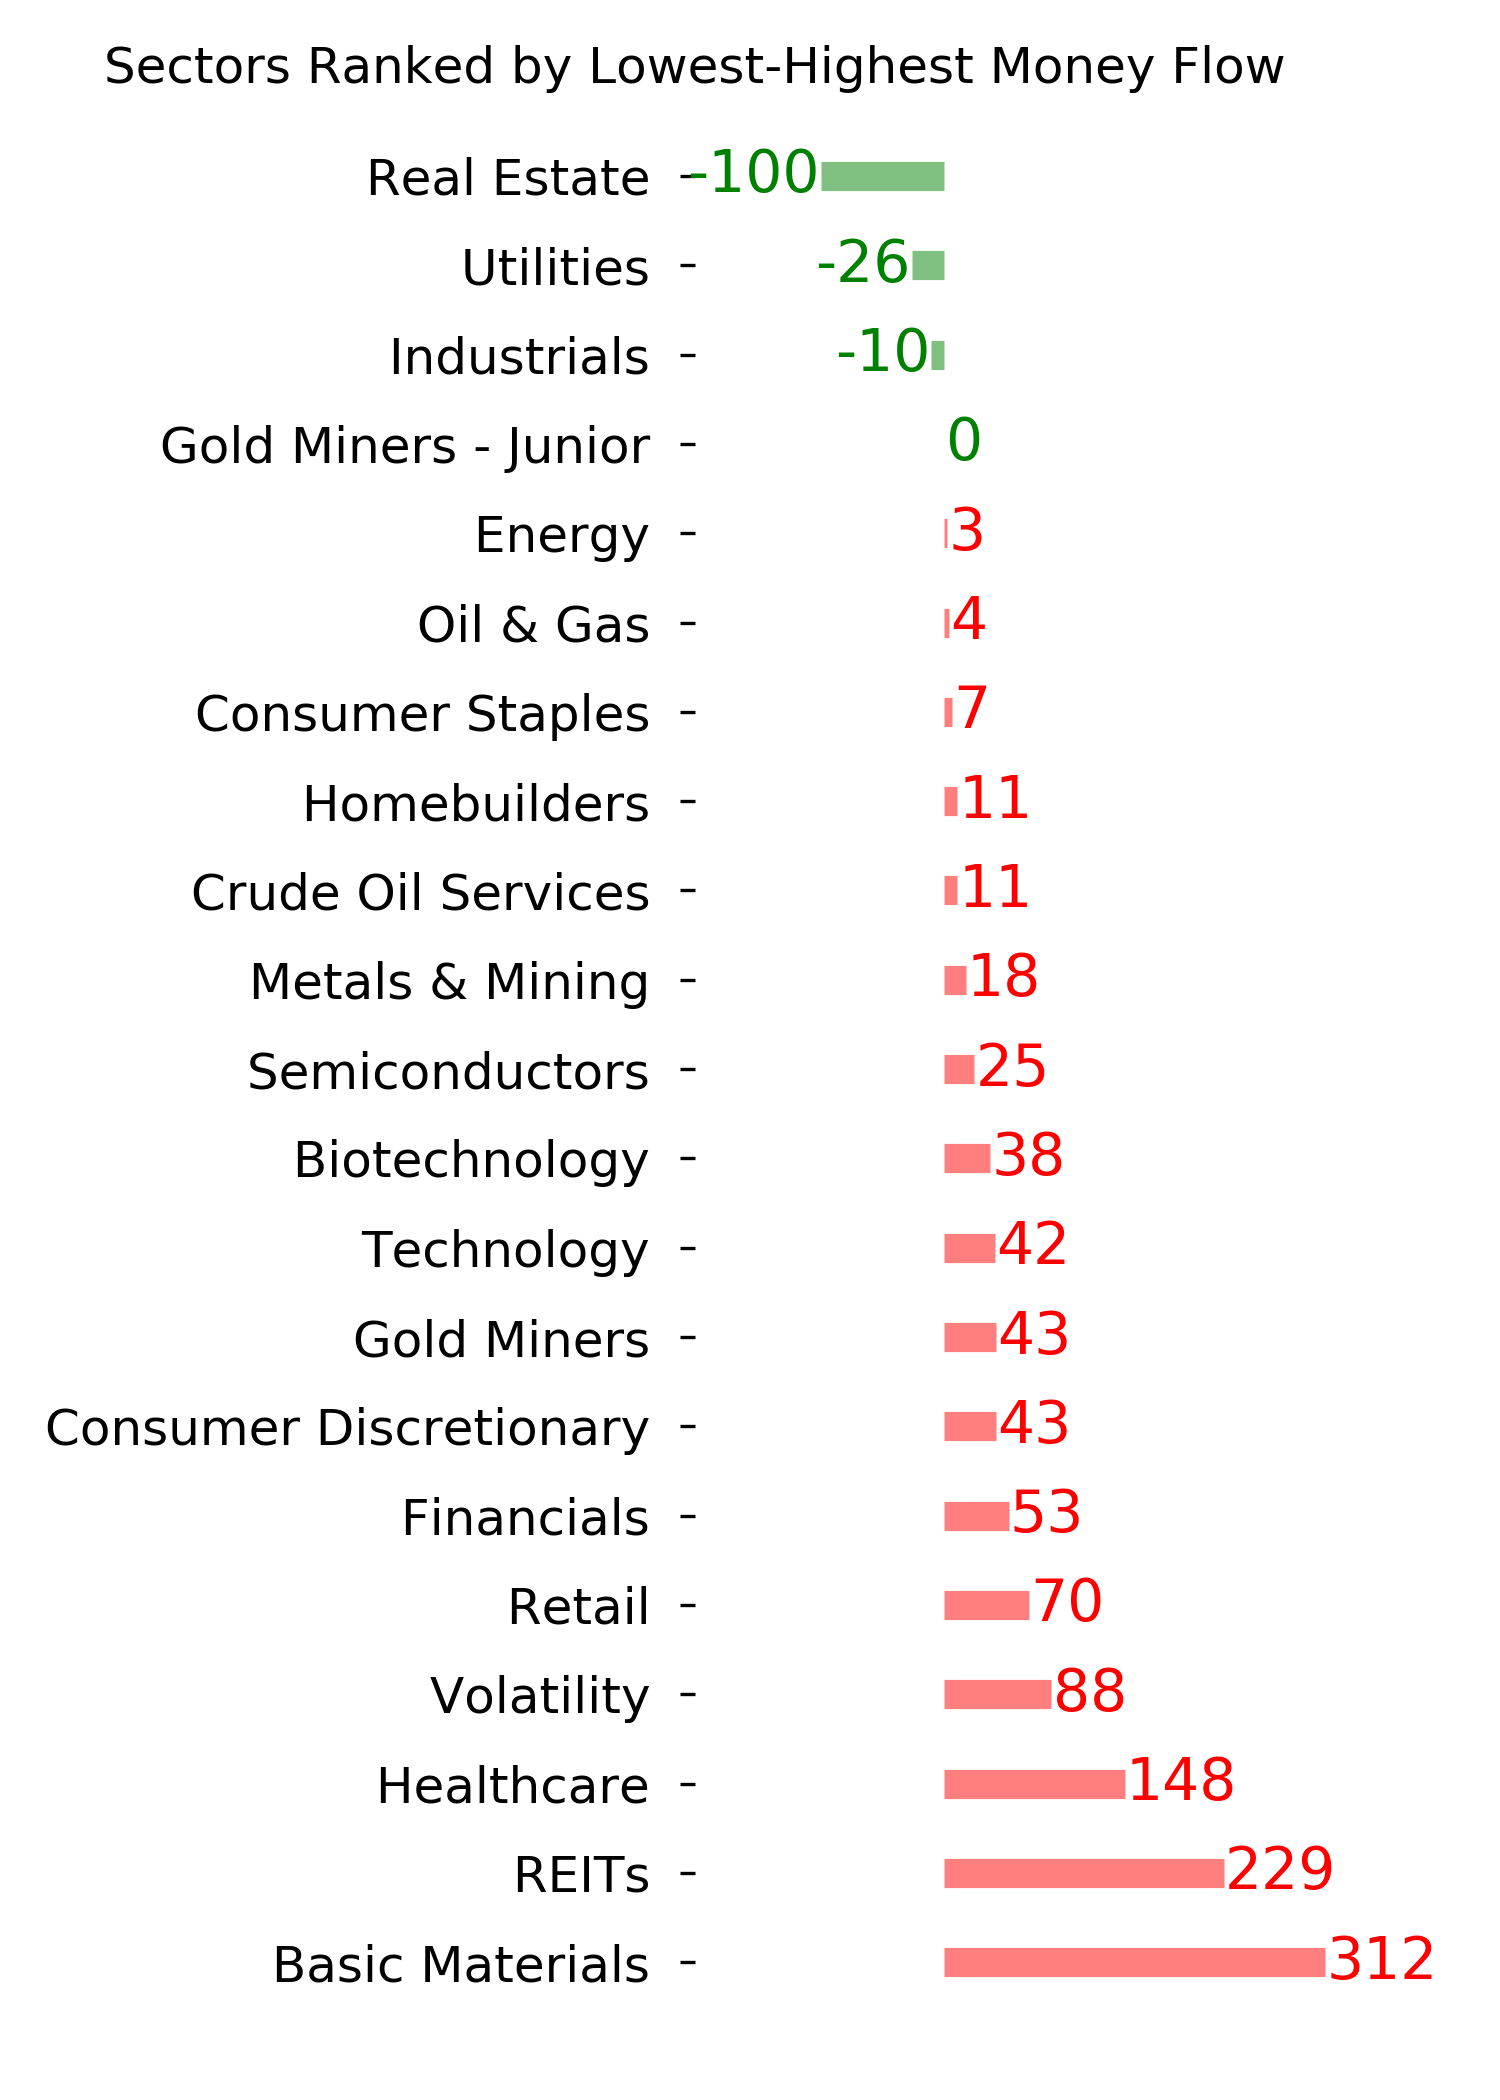
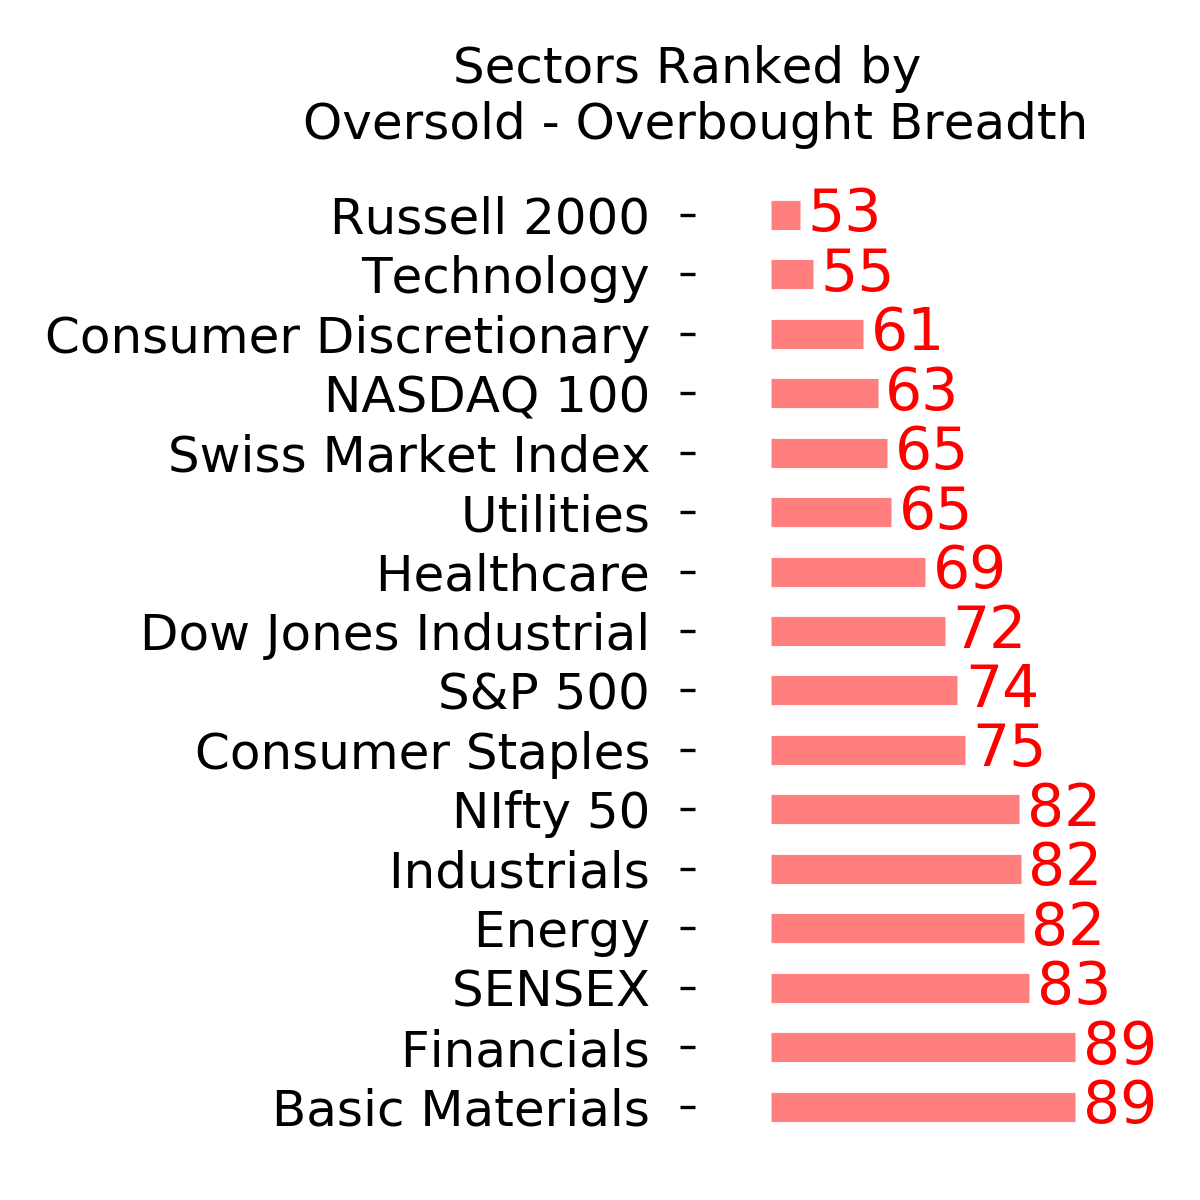
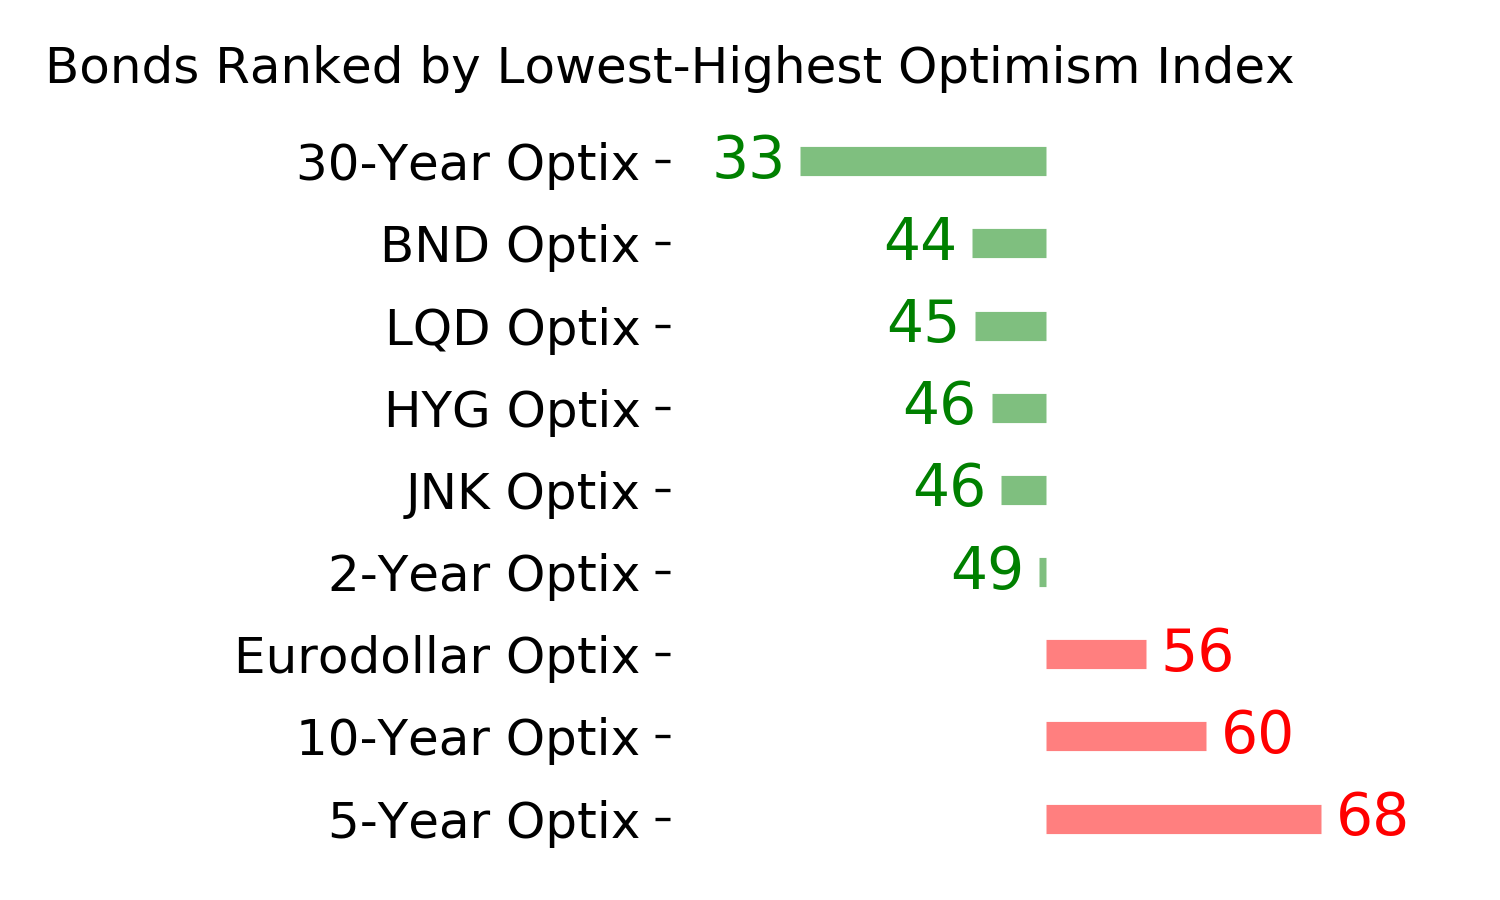
Ranks
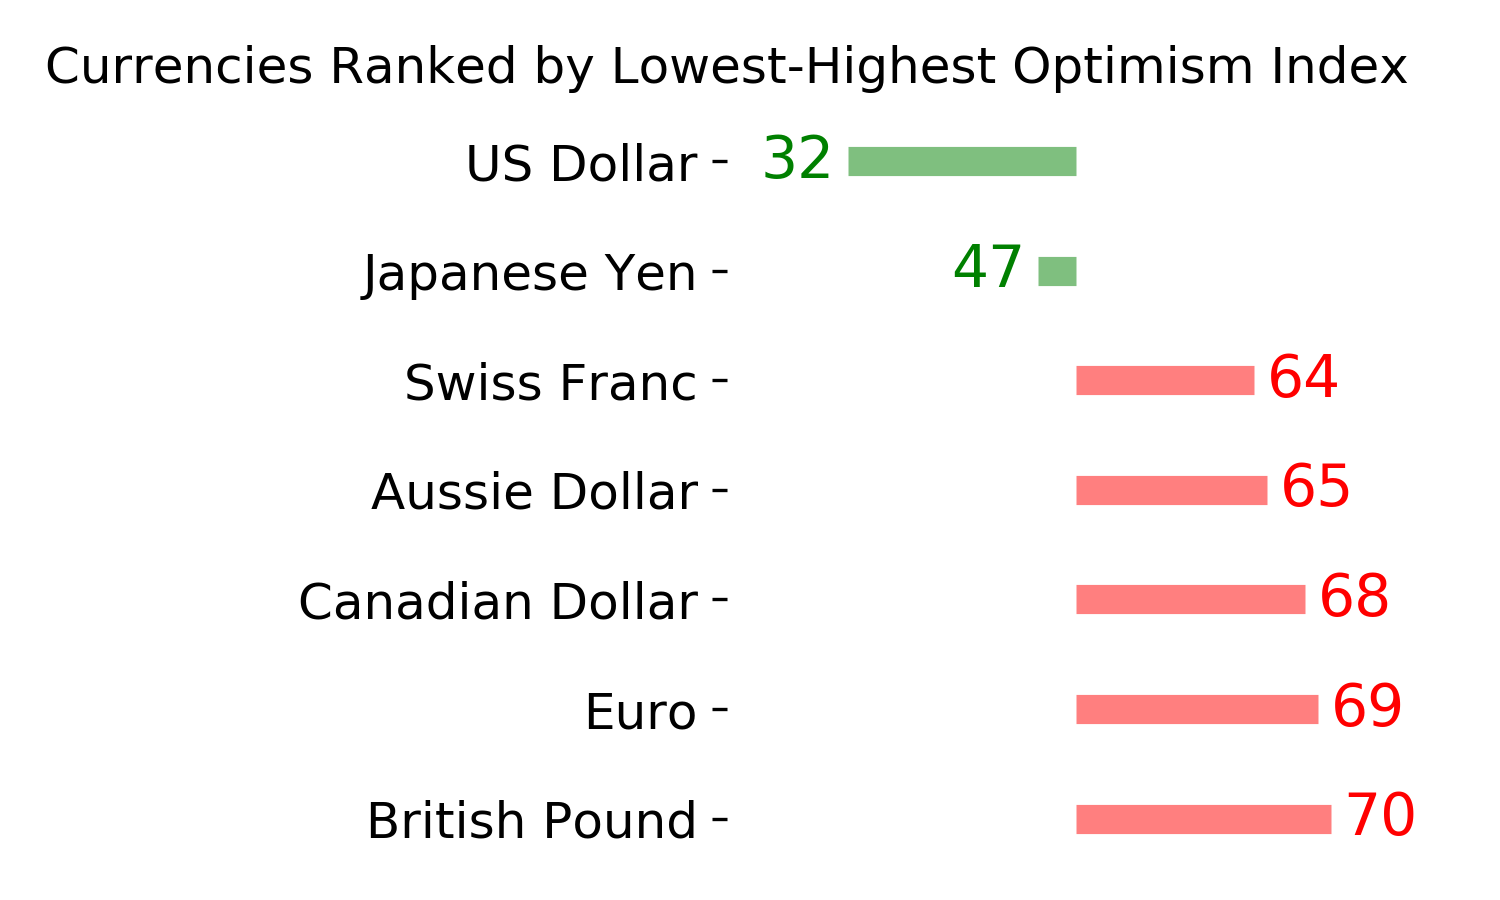
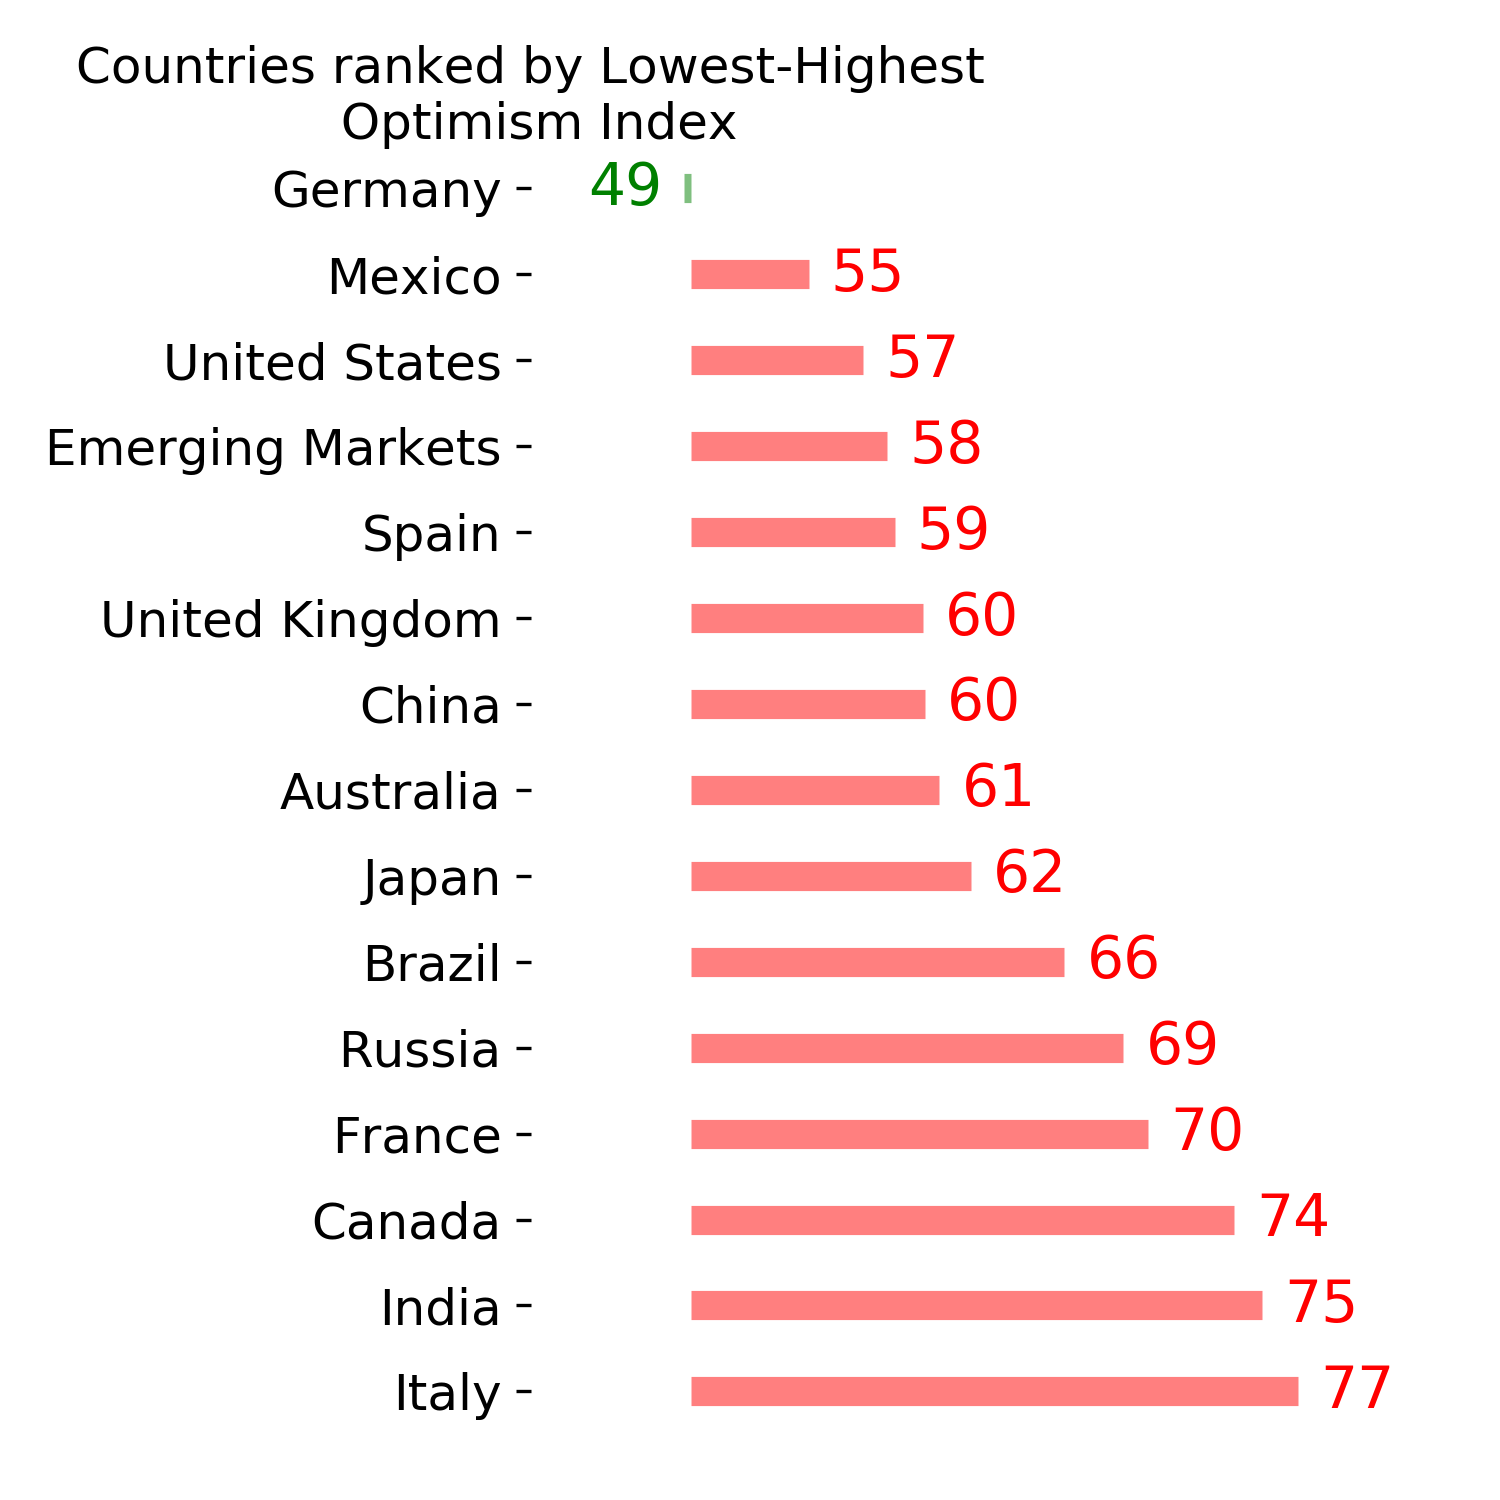
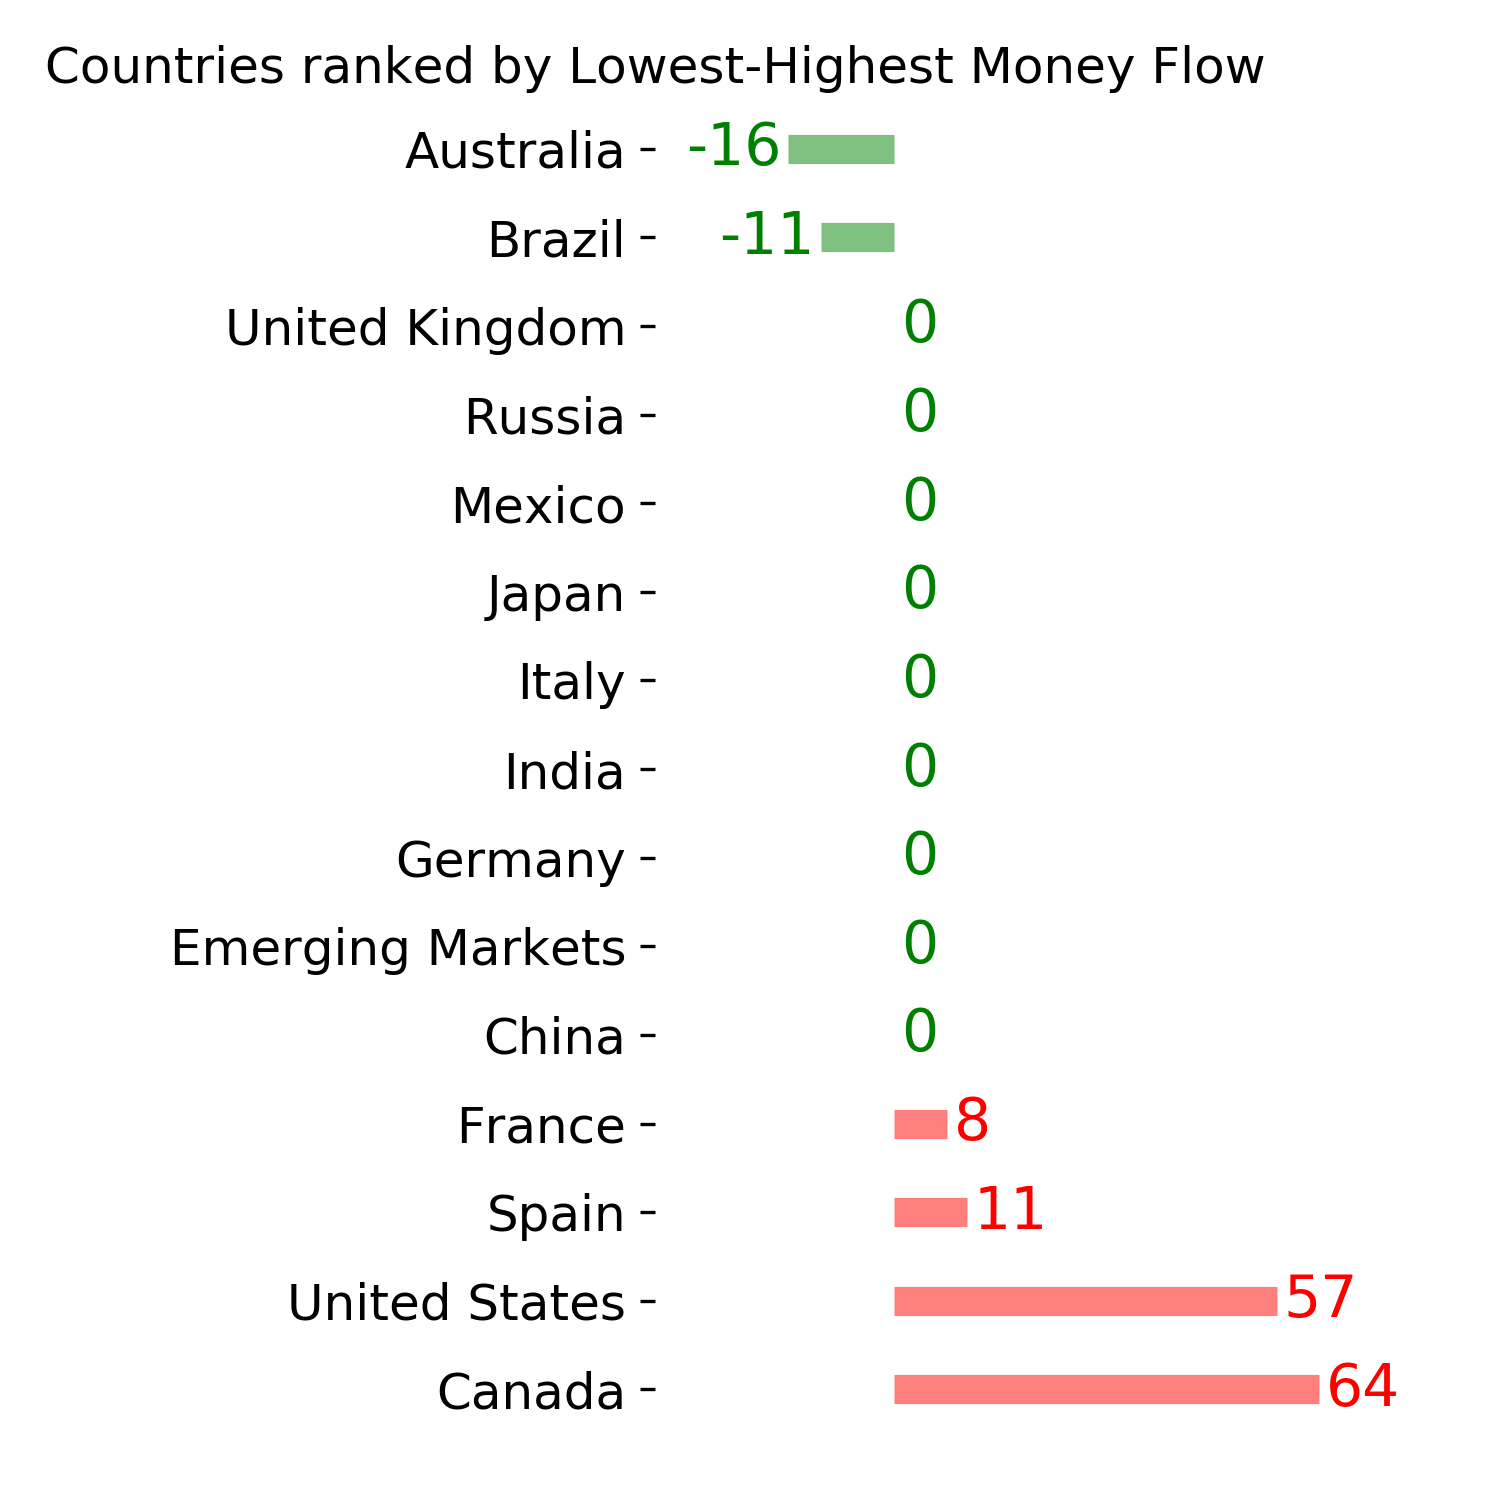
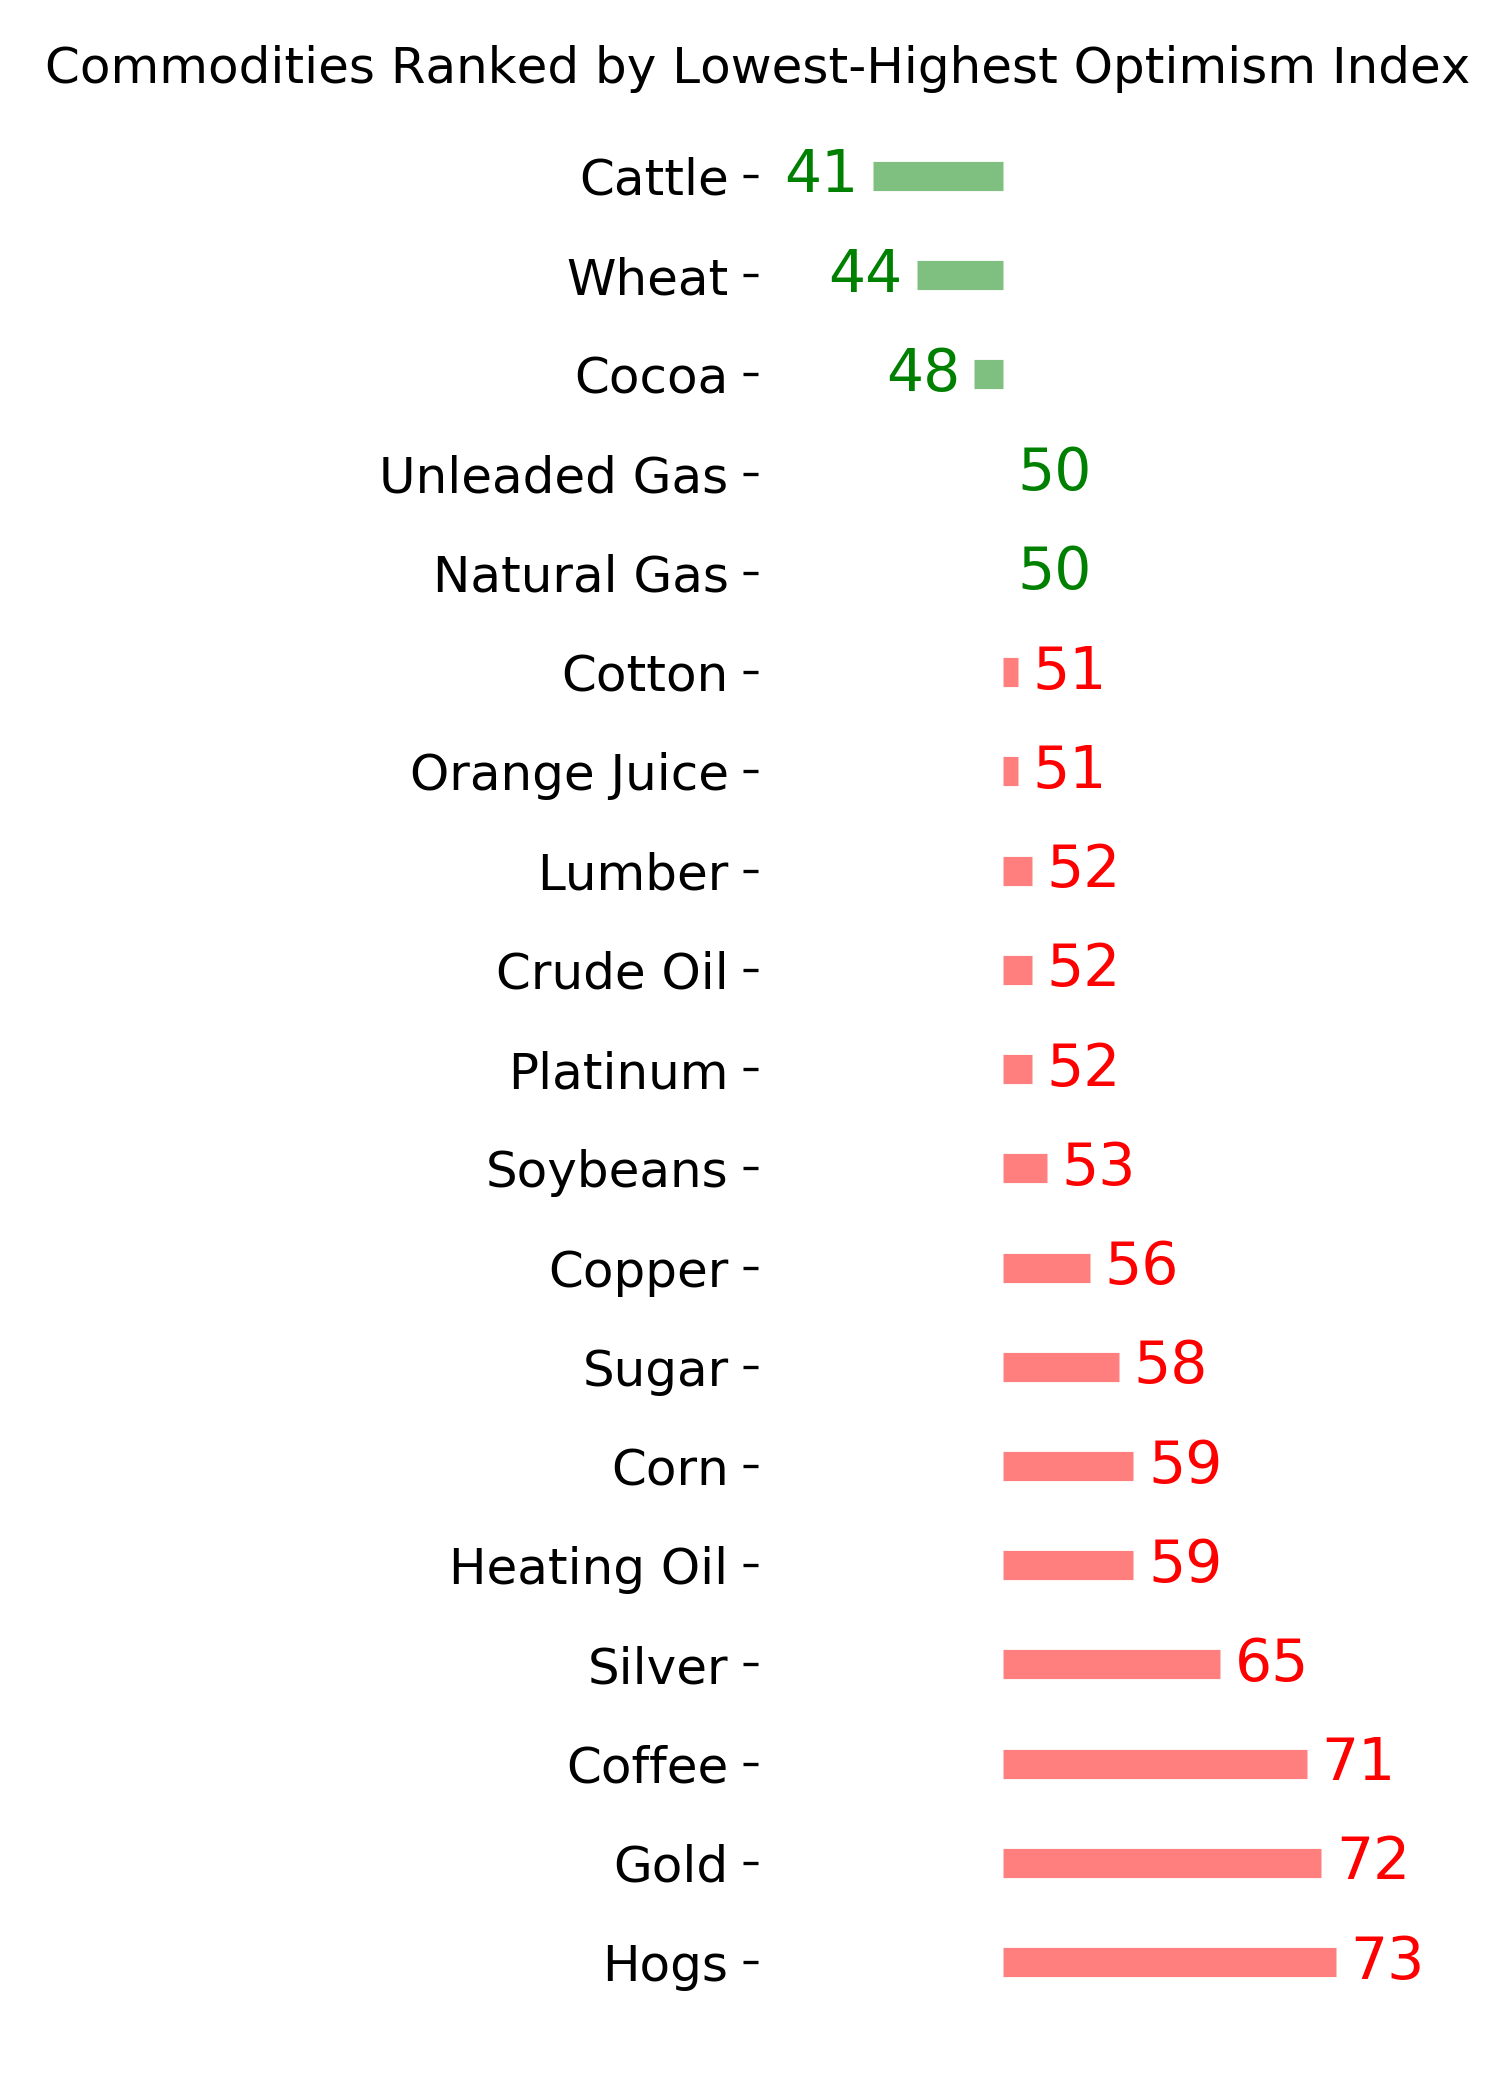
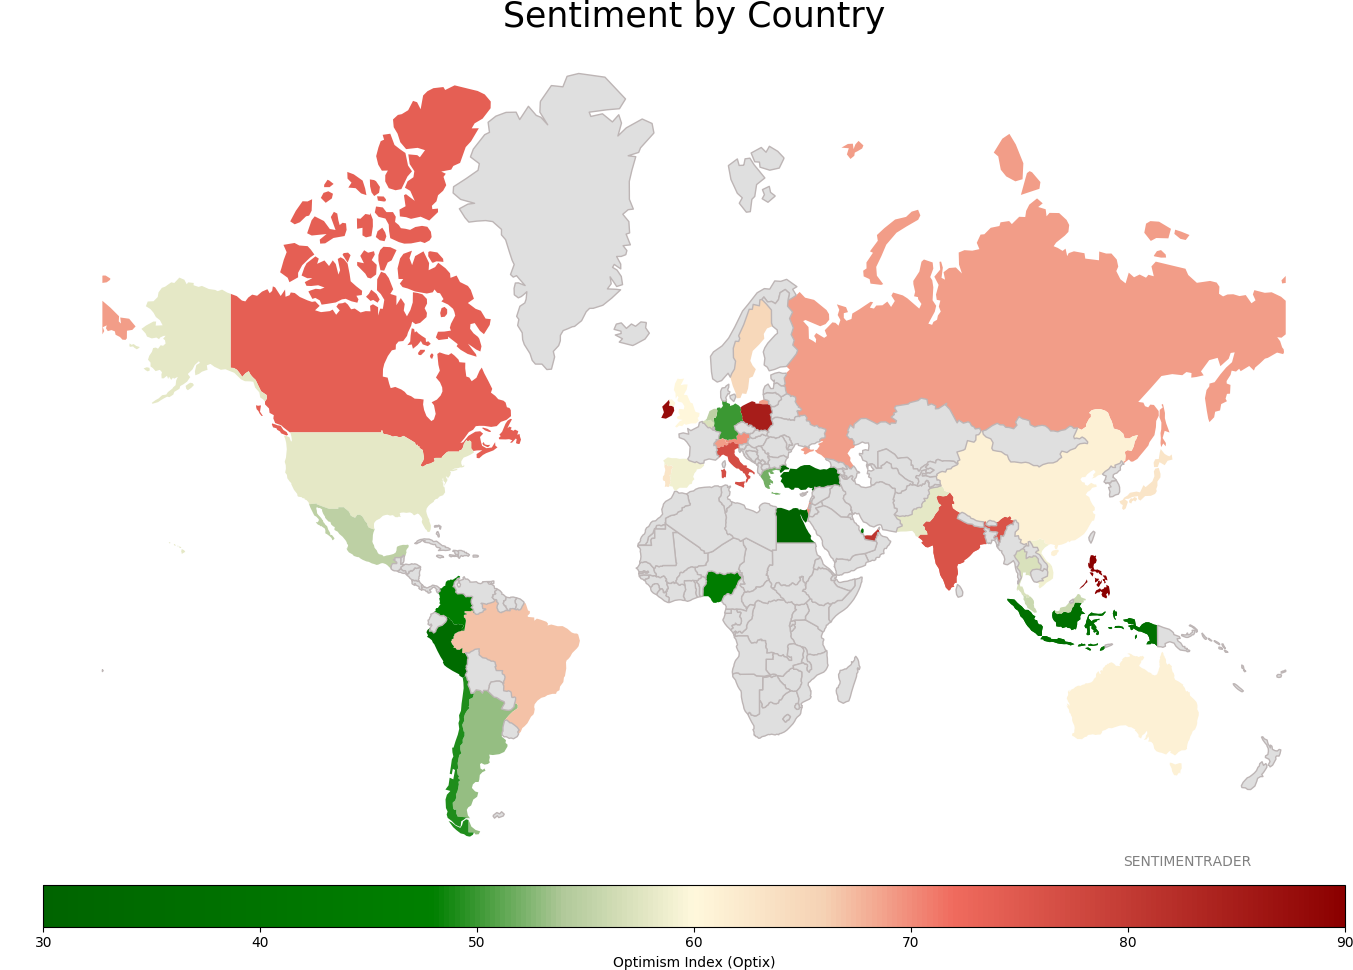
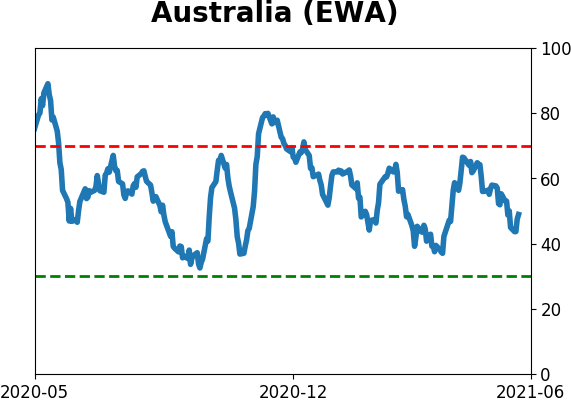
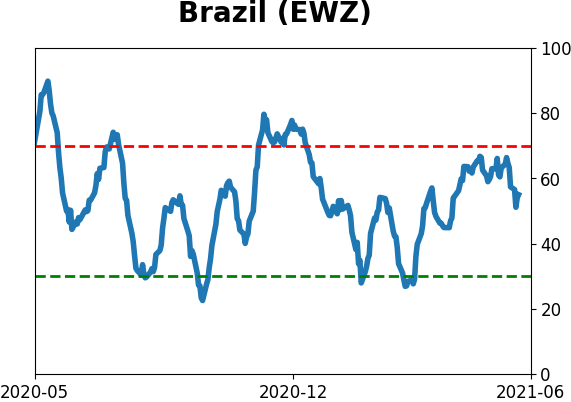
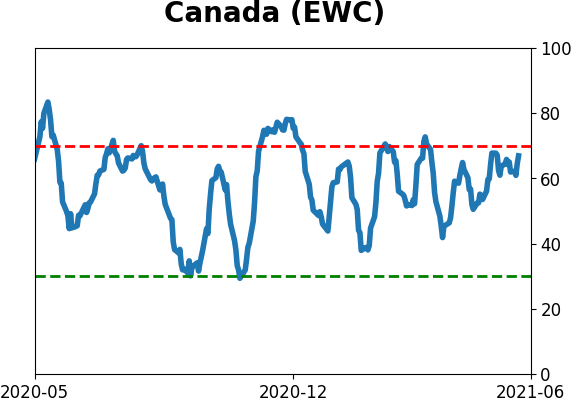
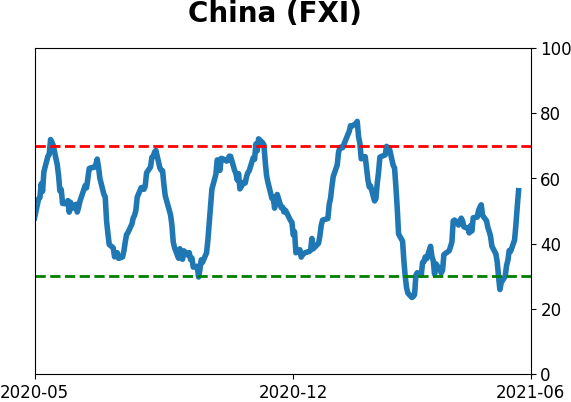
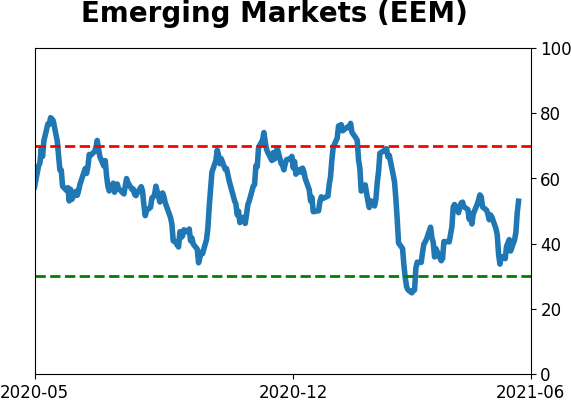
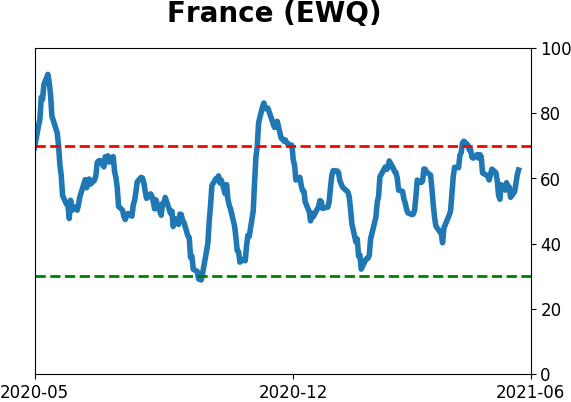
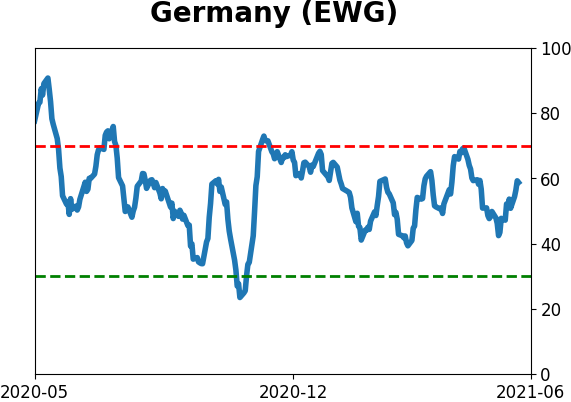
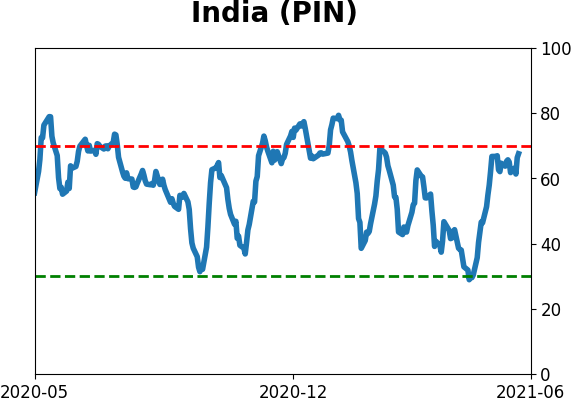
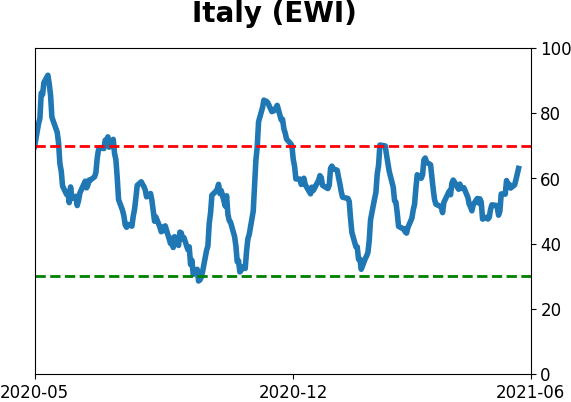
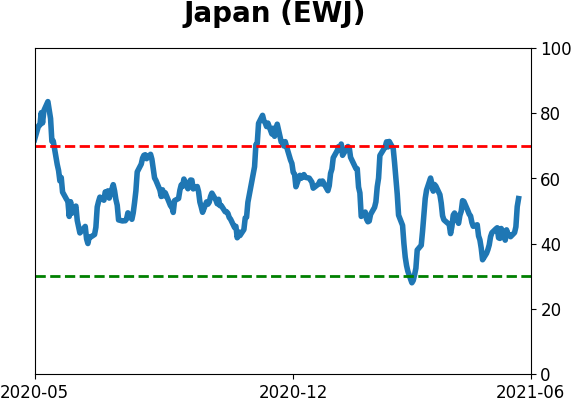
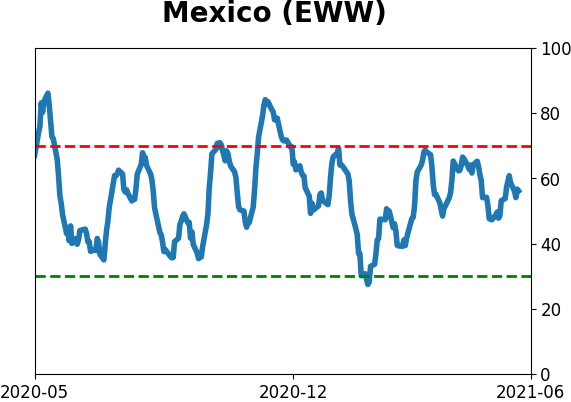
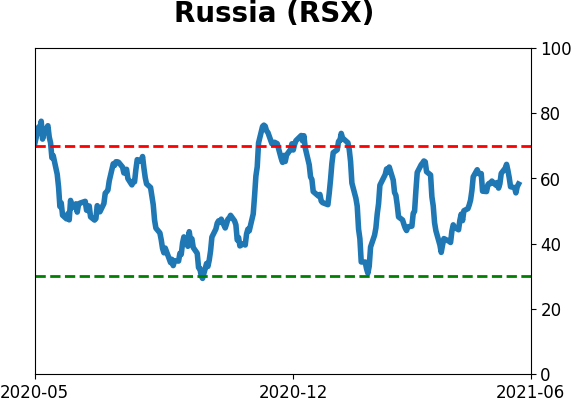
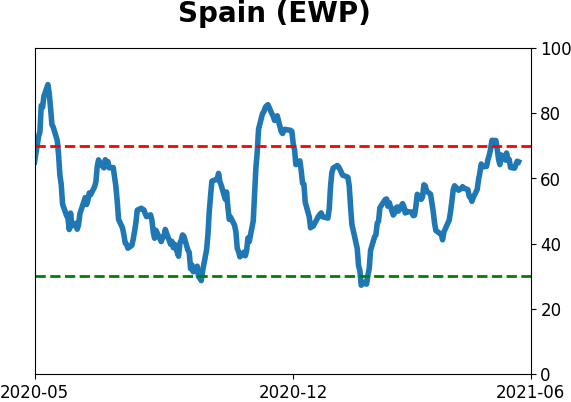
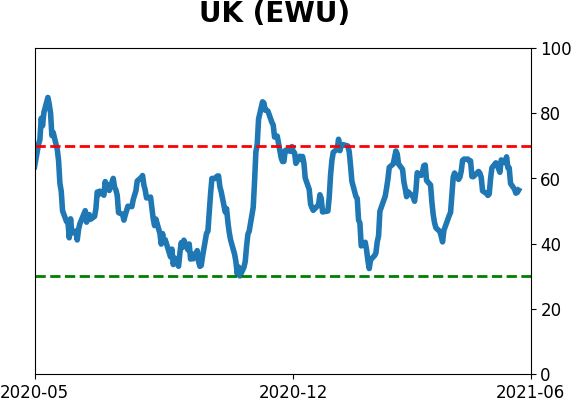
Sentiment Around The World
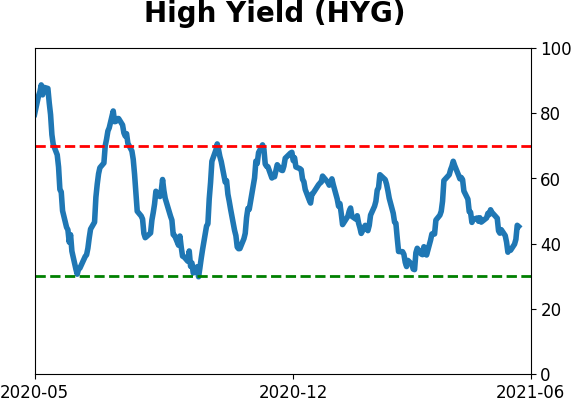
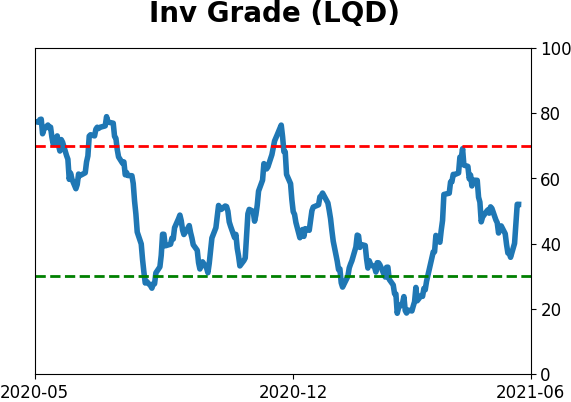
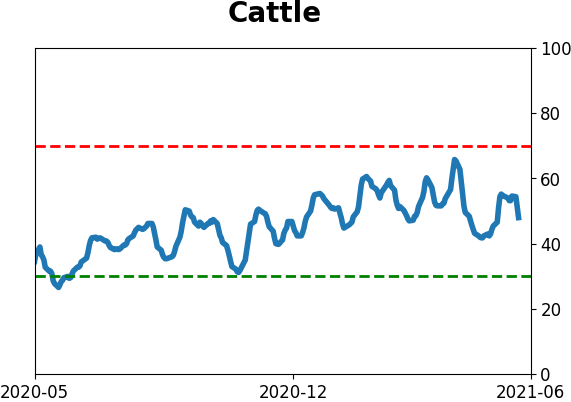
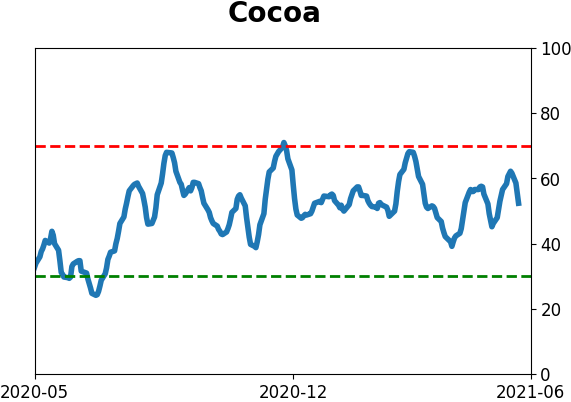
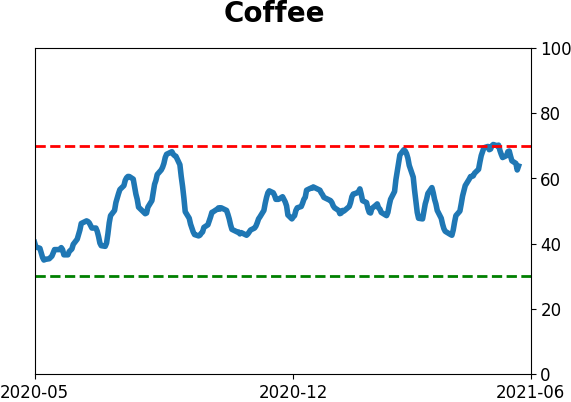
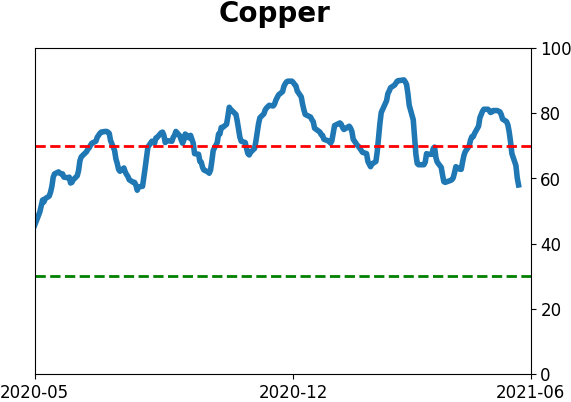
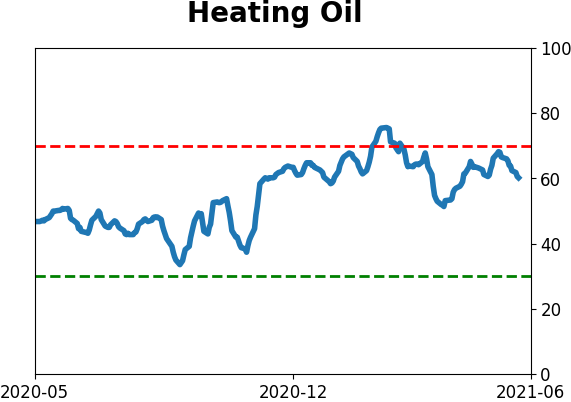
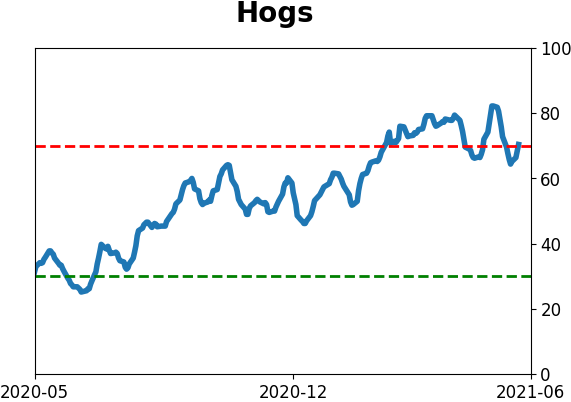
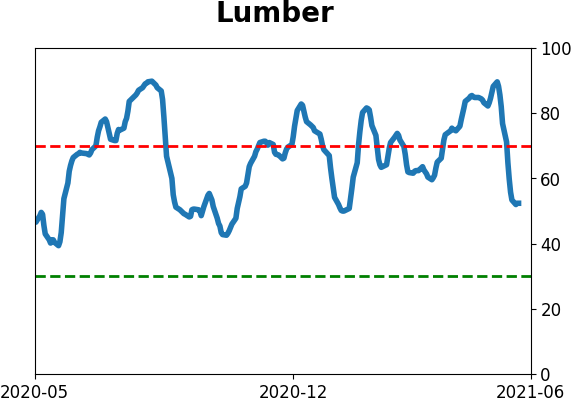
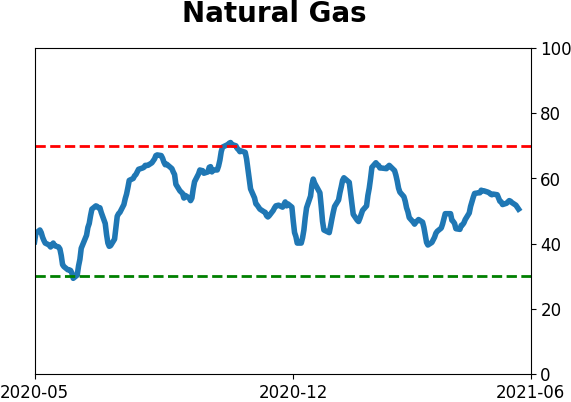
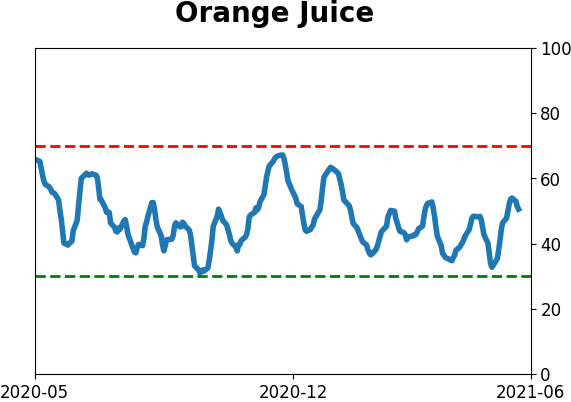
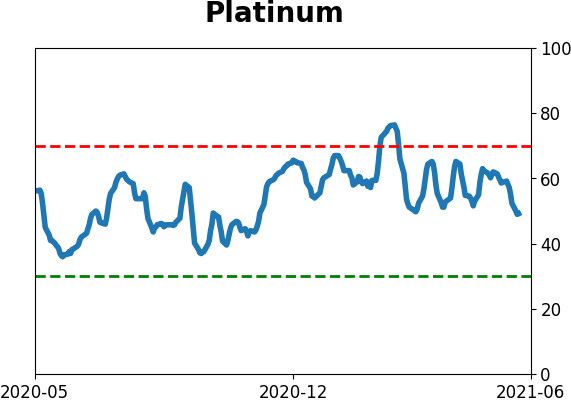
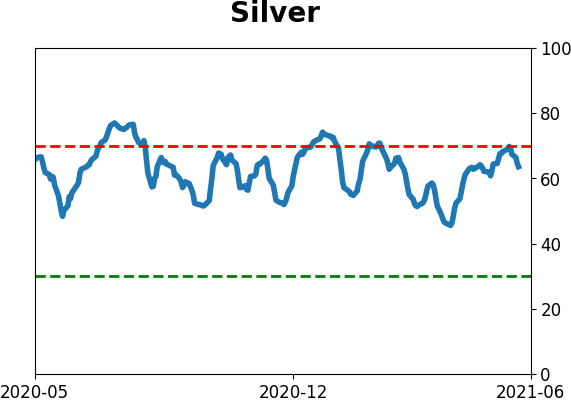
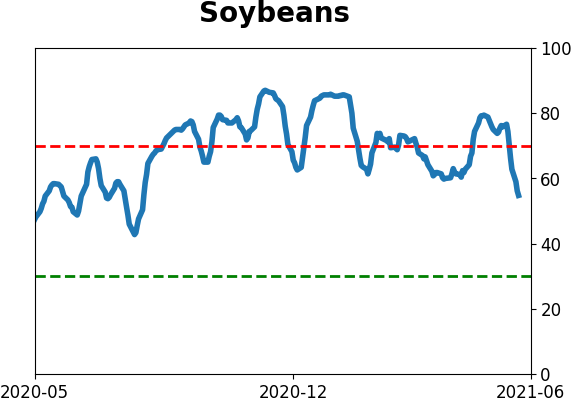
Optimism Index Thumbnails
|
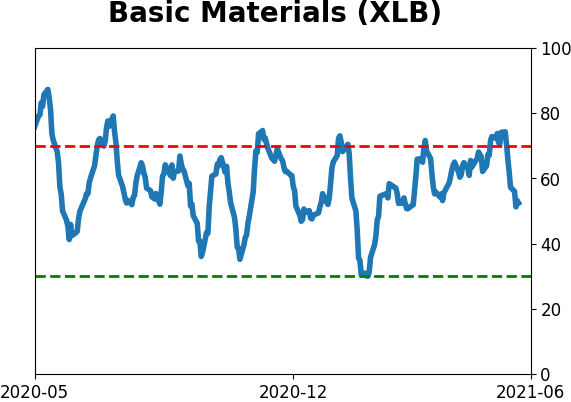
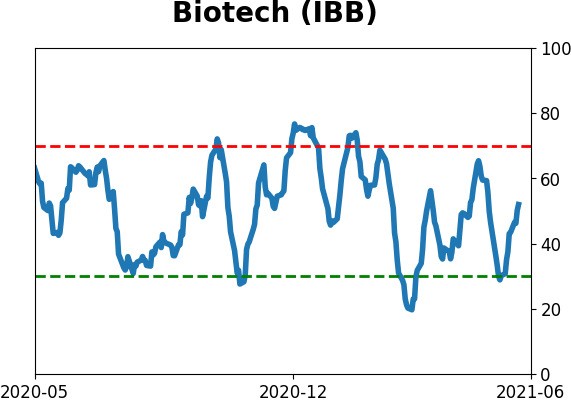
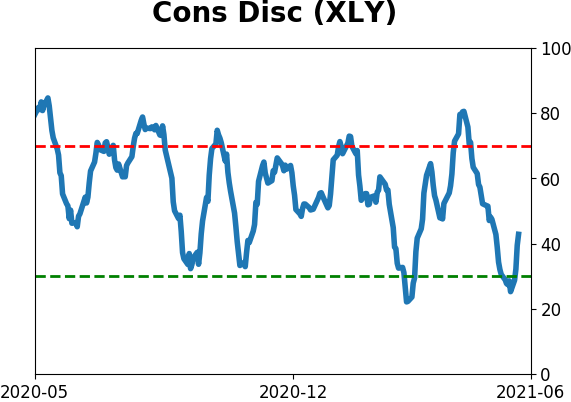
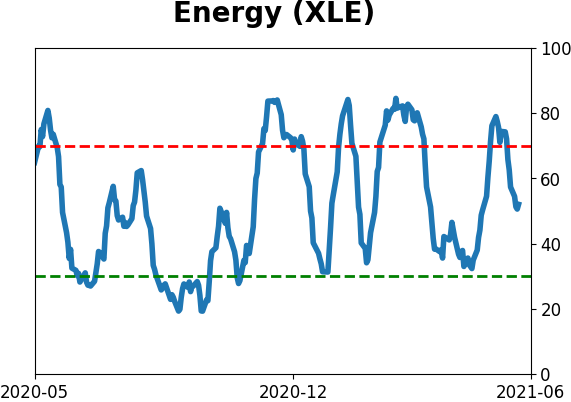
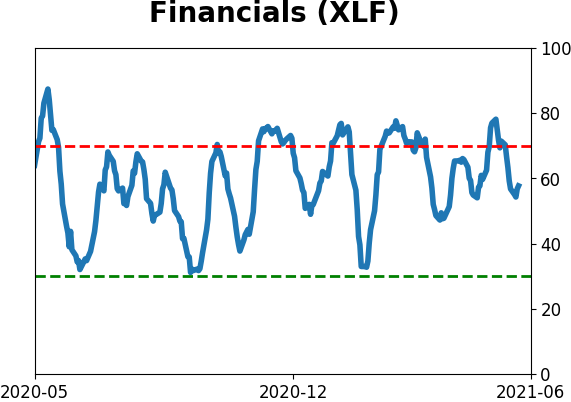
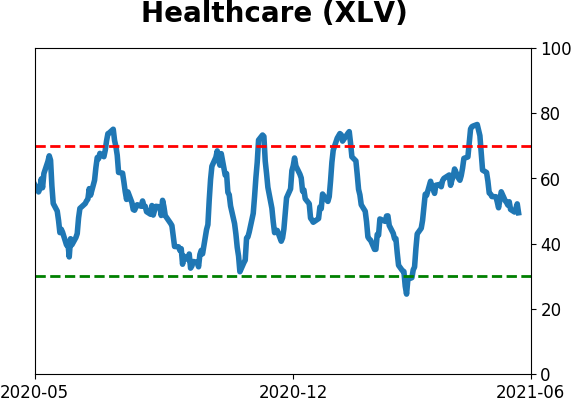
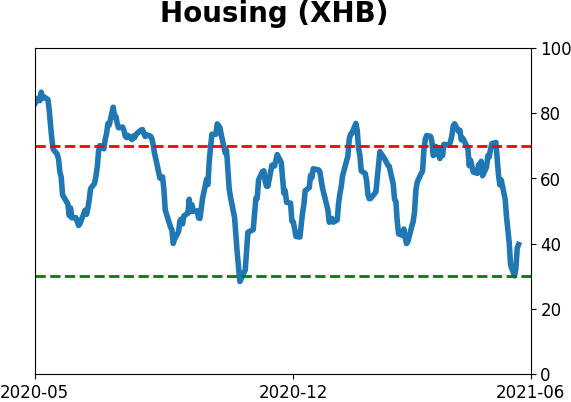
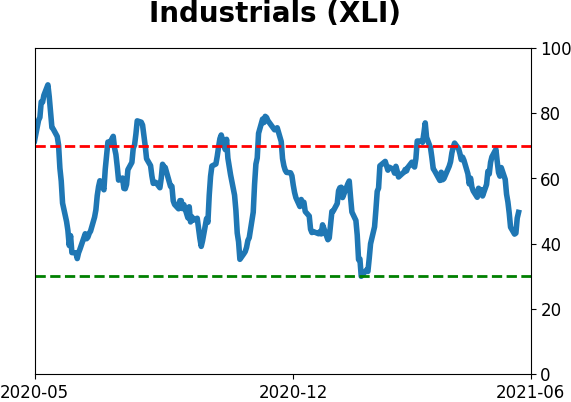
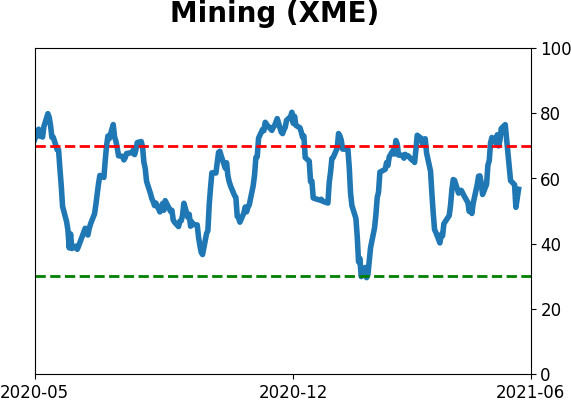
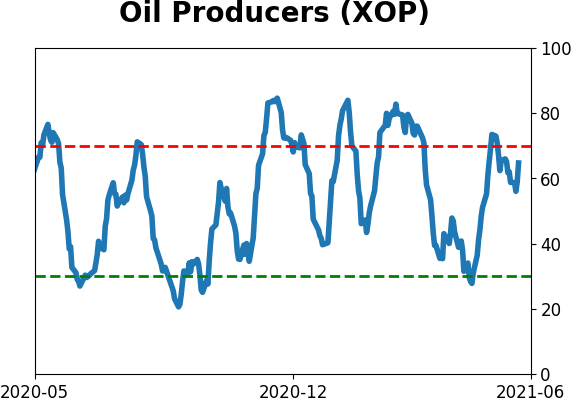
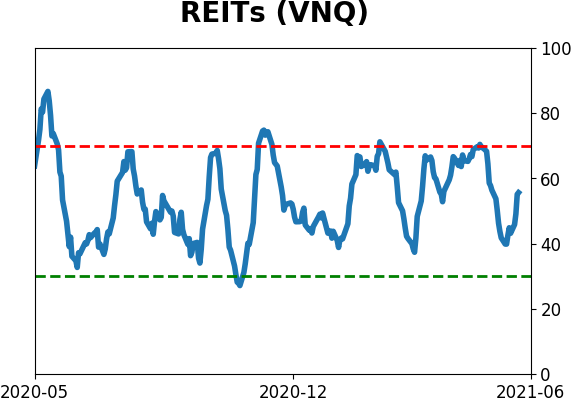
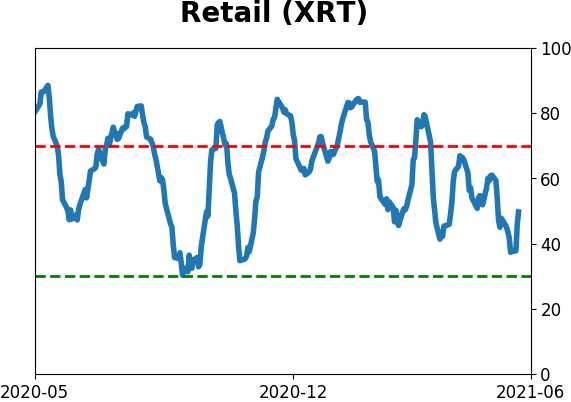
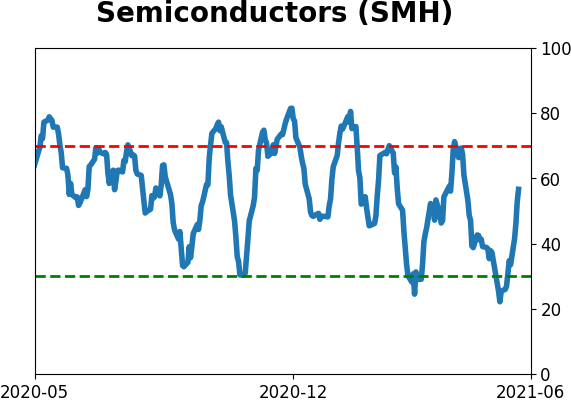
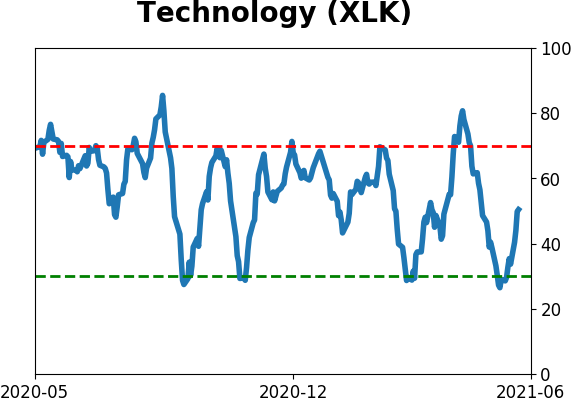
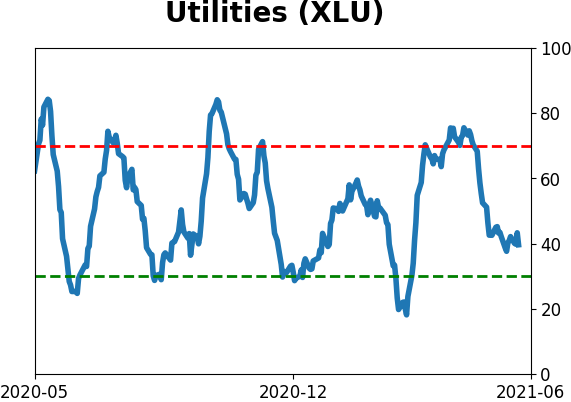
Sector ETF's - 10-Day Moving Average
|
|
|
Country ETF's - 10-Day Moving Average
|
|
|
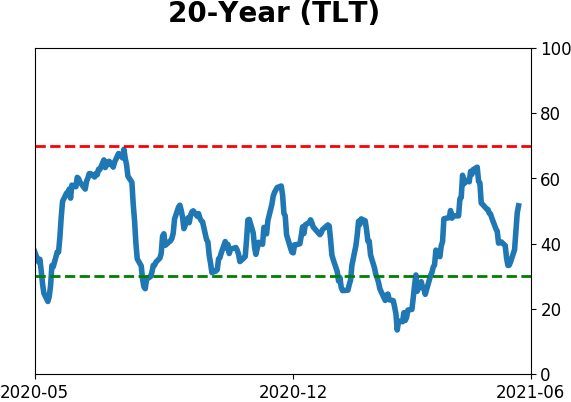
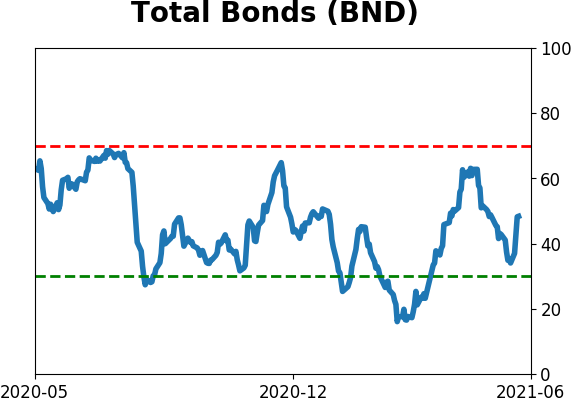
Bond ETF's - 10-Day Moving Average
|
|
|
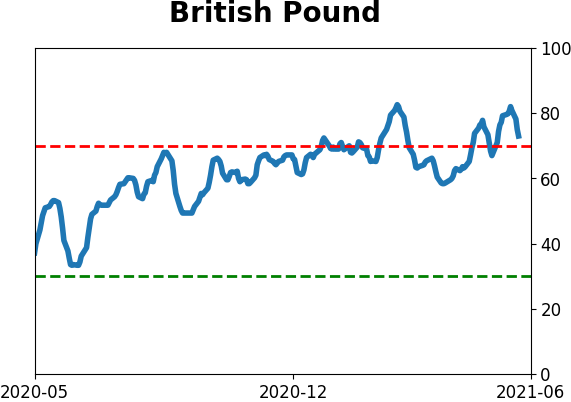
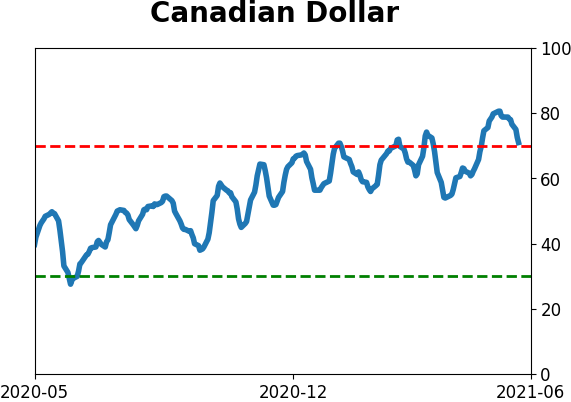
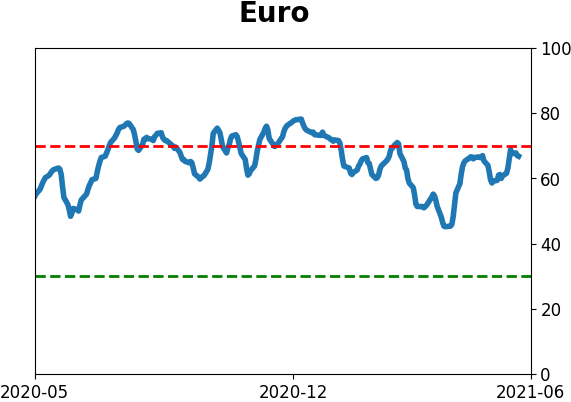
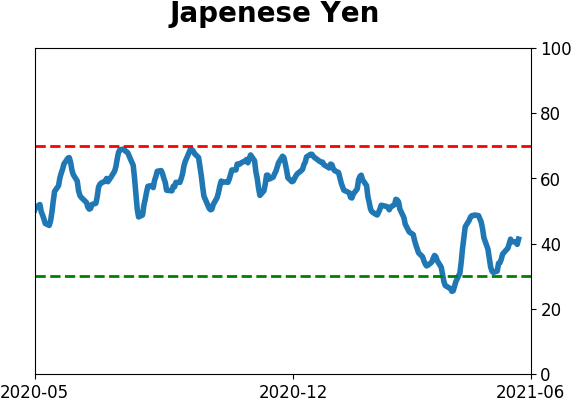
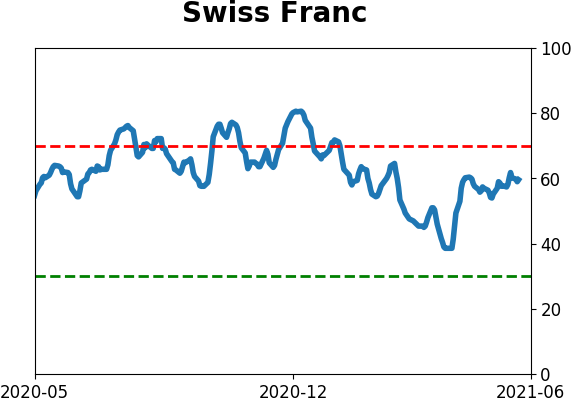
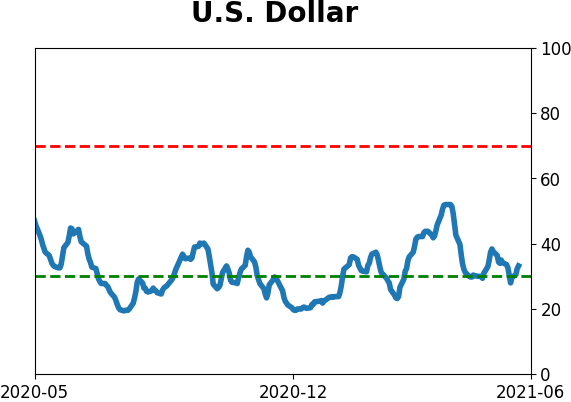
Currency ETF's - 5-Day Moving Average
|
|
|
Commodity ETF's - 5-Day Moving Average
|
|