Headlines
|
|
S&P fully recovers from its long-term deviation:
The S&P 500 has fully recovered after falling more than 20% below its long-term 200-day moving average. This is by far the fastest it has ever been able to make up such a negative deviation from its trend.
A complete recovery in medium-term trends:
With a continued surge this week, the percentages of stocks within the S&P 500 and Russell 2000 have recovered from extremely depressed levels to extremely high ones. Other times these indexes have cycled from one extreme to the other preceded further gains in the indexes every time.
Make that two out of the Big Four: The S&P 500 has joined the Nasdaq Composite as two of the "big four" equity indexes above their 200-day averages. Since 1979, there have only been 3 other times those two indexes led out of a decline, with both the Dow Industrials and Russell 2000 still below their averages. Those were 1991-01-28, 1992-10-26, and 1998-10-30. All three dates led to higher prices for the S&P across every time frame, averaging more than 11% over the next two months.
|
Smart / Dumb Money Confidence
|
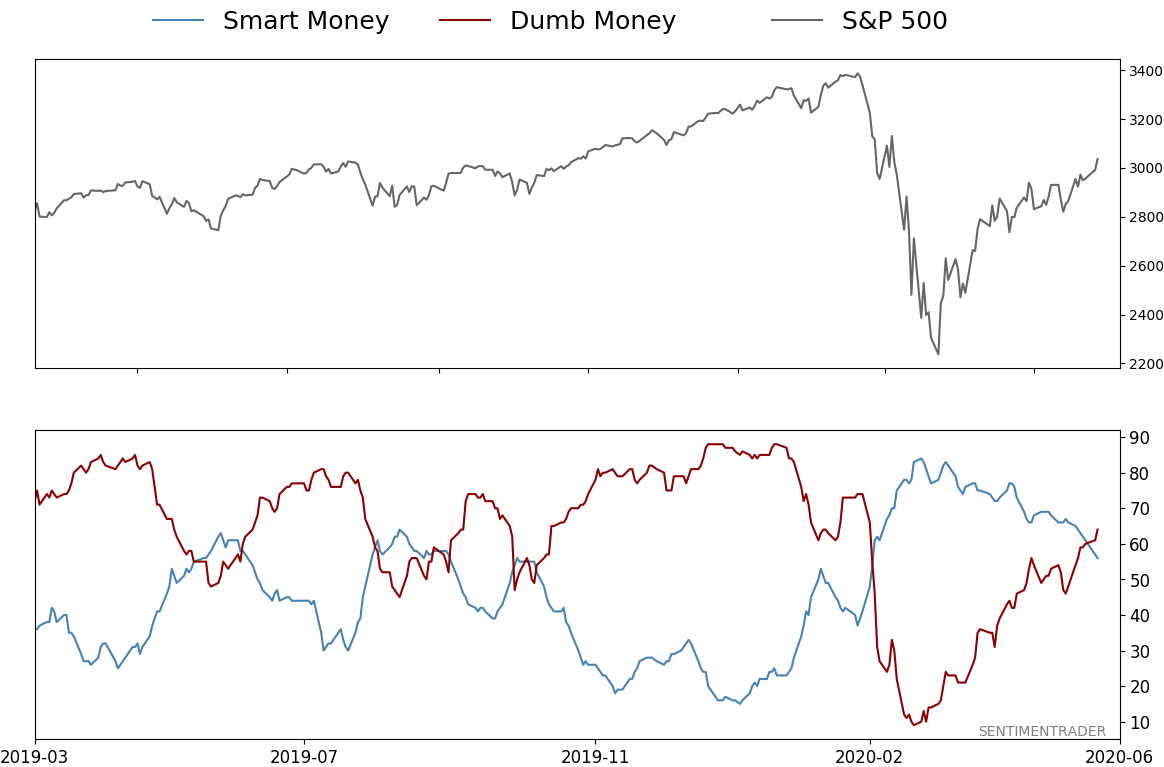
Smart Money Confidence: 56%
Dumb Money Confidence: 64%
|
|
Risk Levels
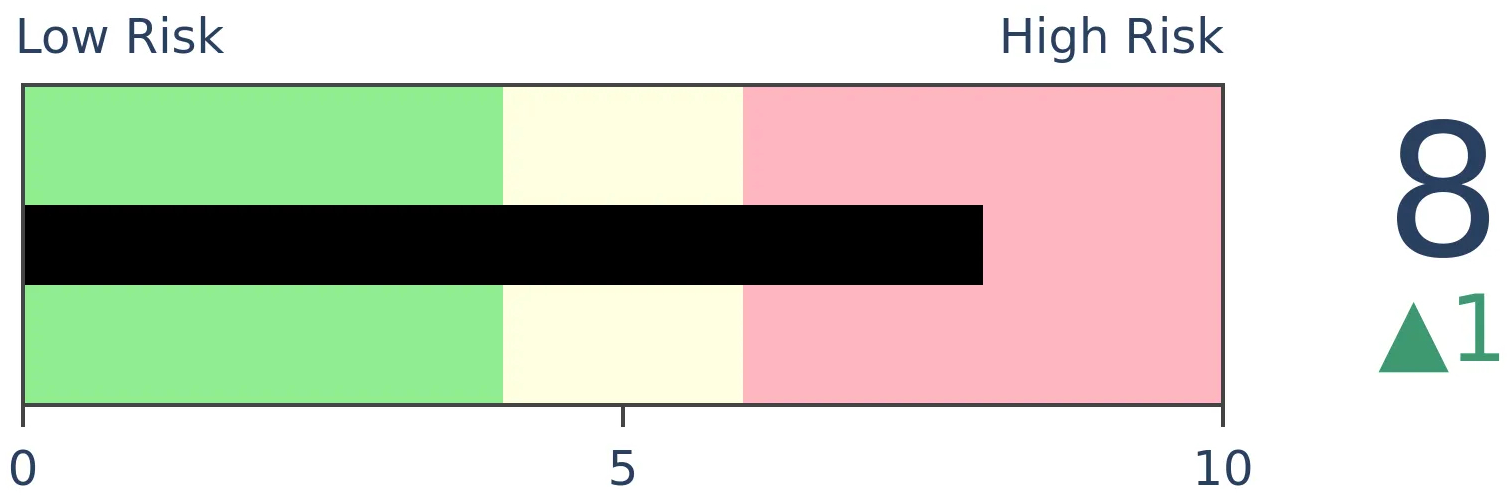
Stocks Short-Term
|
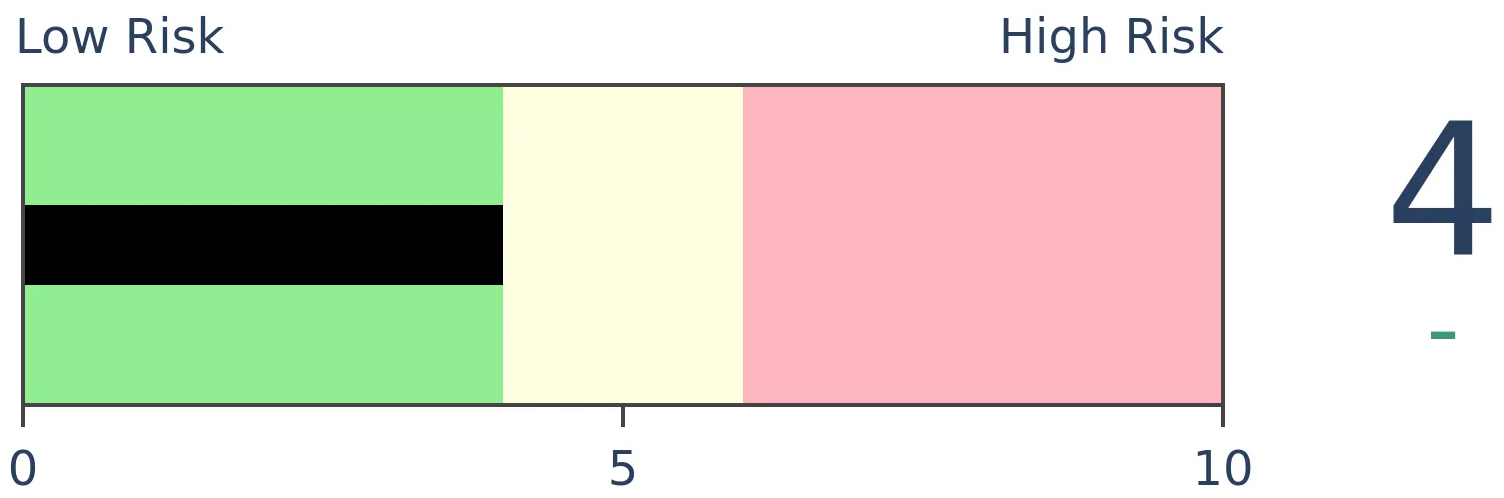
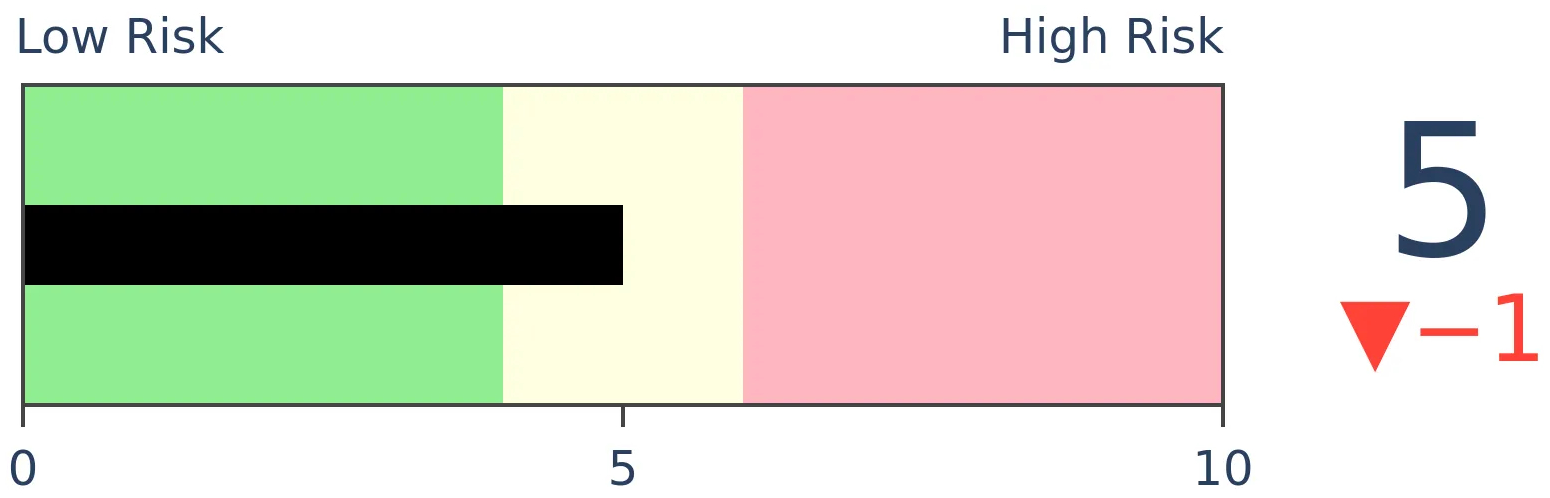
Stocks Medium-Term

|
|
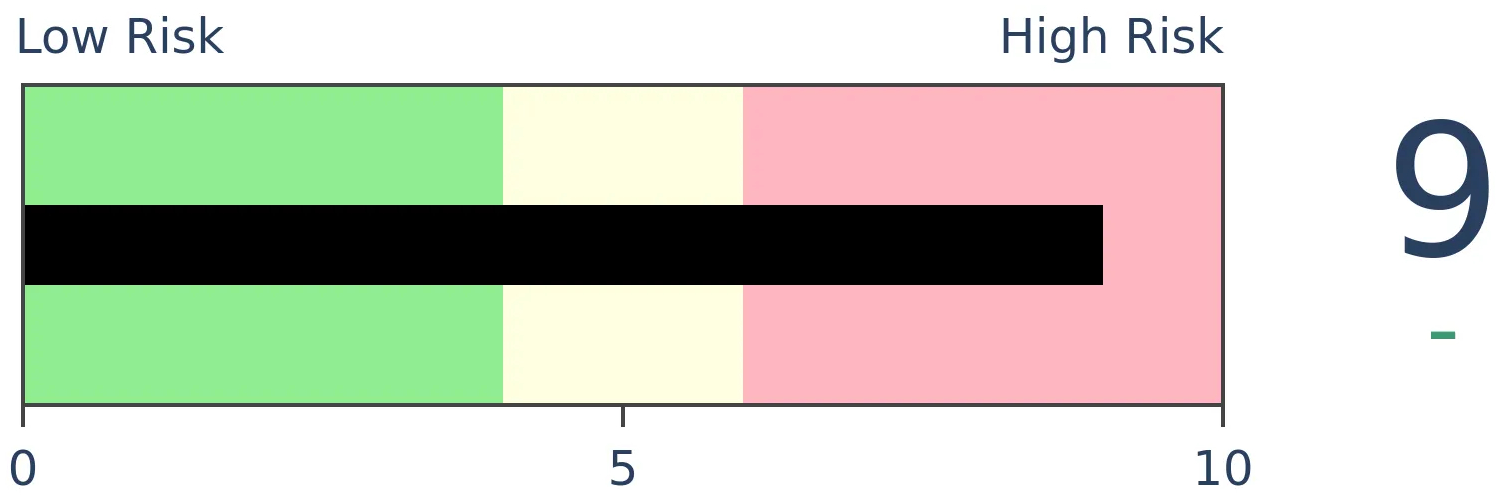
Bonds
|
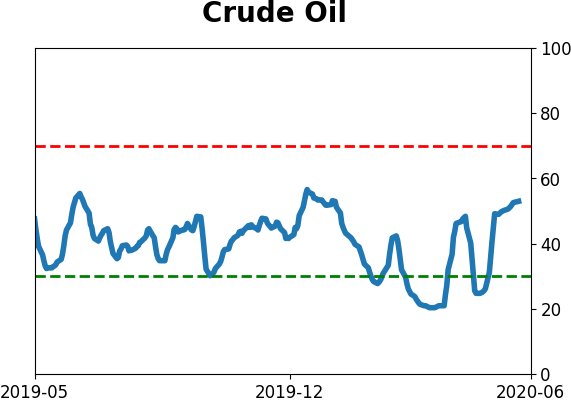
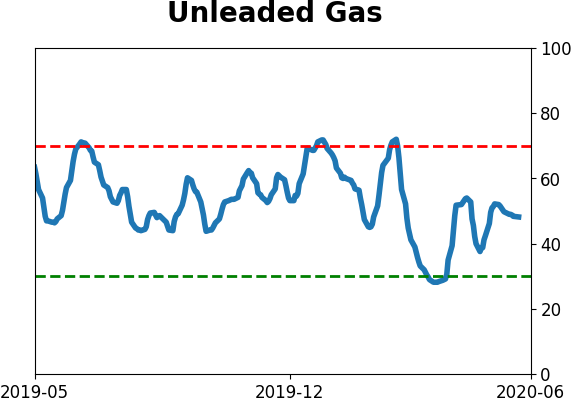
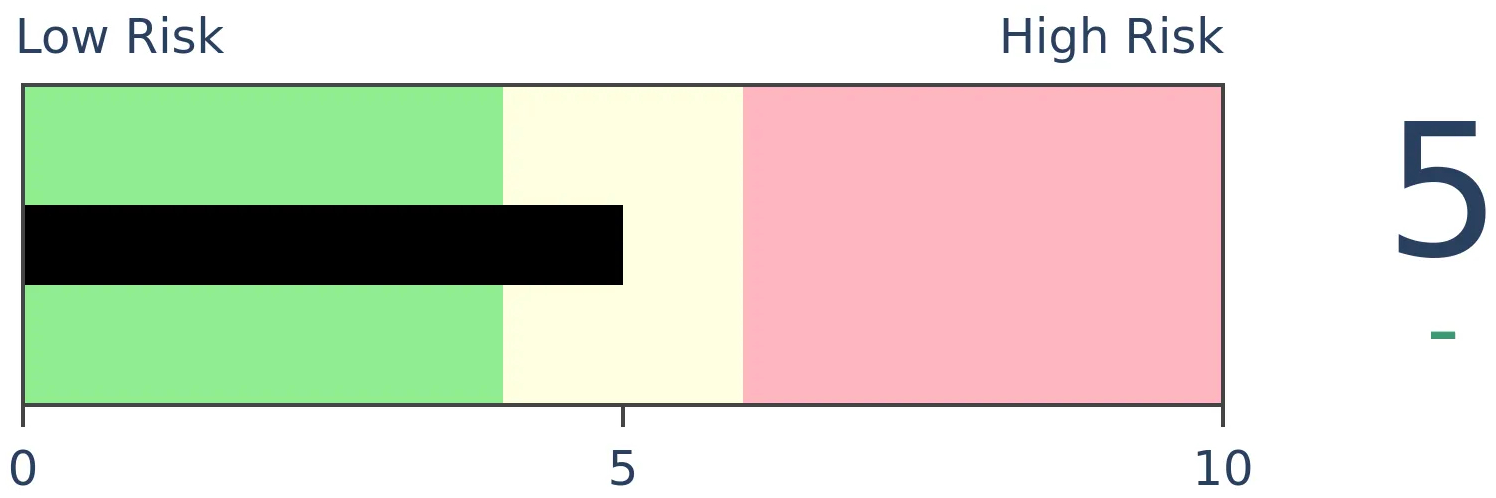
Crude Oil
|
|
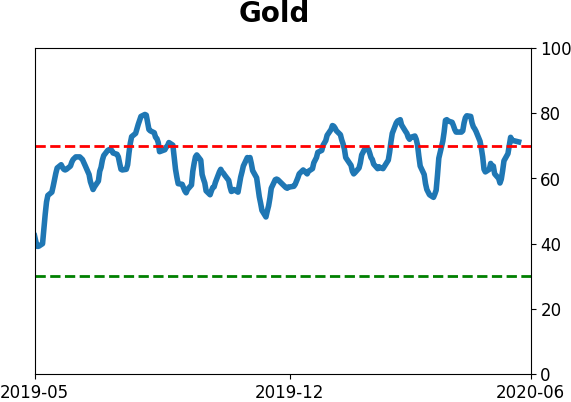
Gold
|
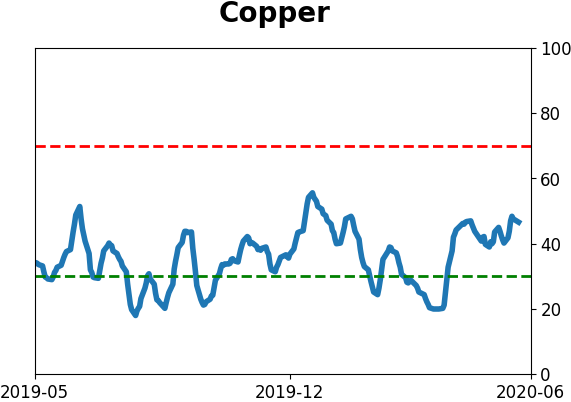
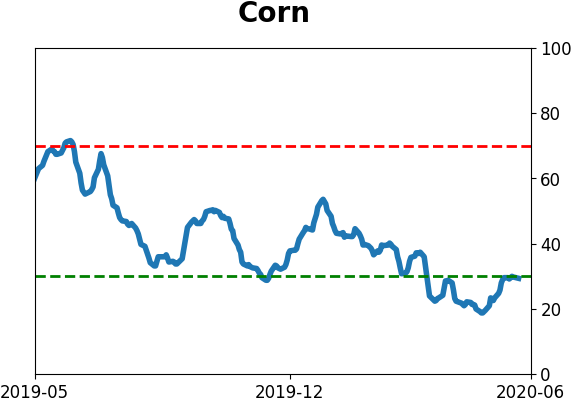
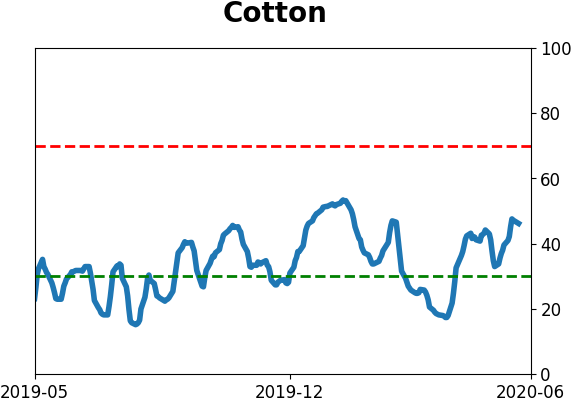
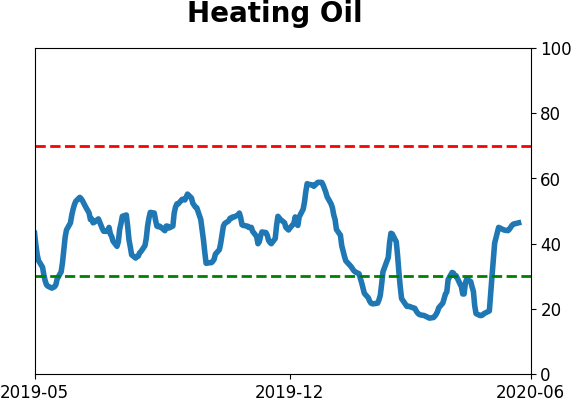
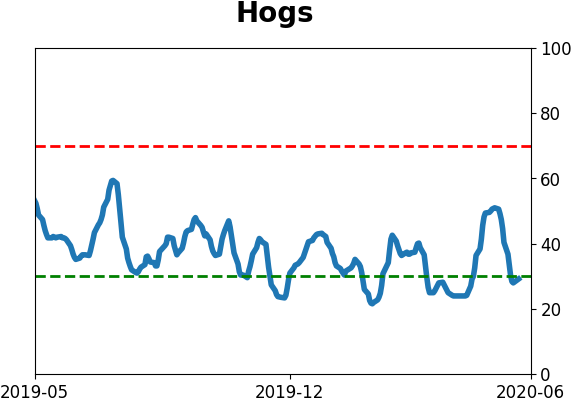
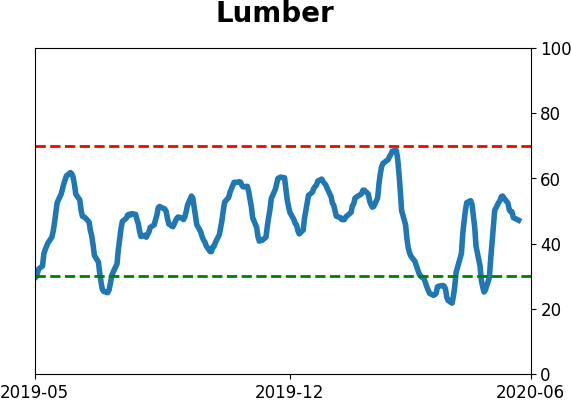
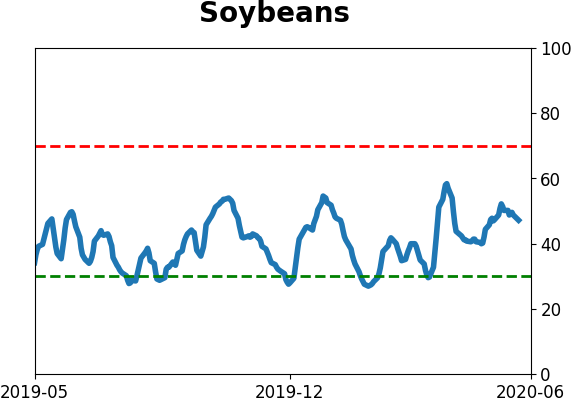
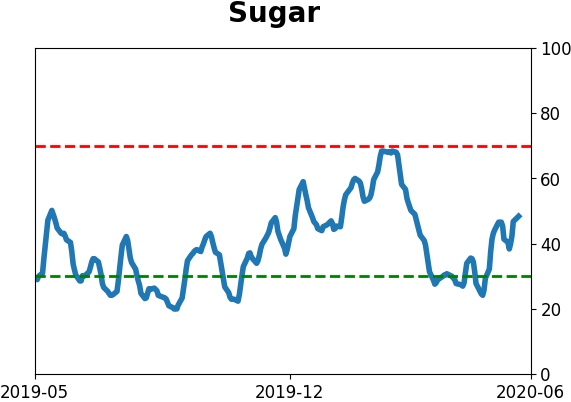
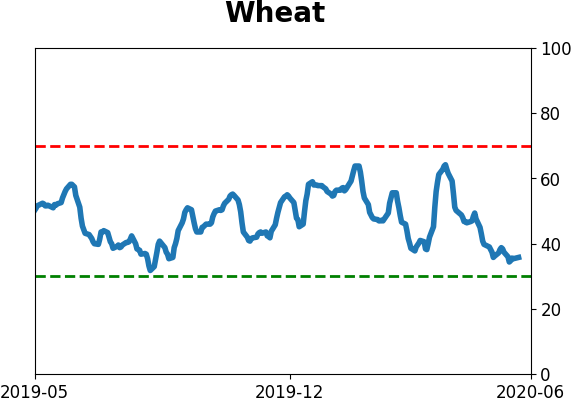
Agriculture
|
|
Research
BOTTOM LINE
The S&P 500 has fully recovered after falling more than 20% below its long-term 200-day moving average. This is by far the fastest it has ever been able to make up such a negative deviation from its trend.
FORECAST / TIMEFRAME
None
|
In what almost seems like no time at all, the S&P 500 has recovered above its 200-day moving average. That's quite a feat considering it was more than 25% below its average in March, one of its worst deviations from trend ever.
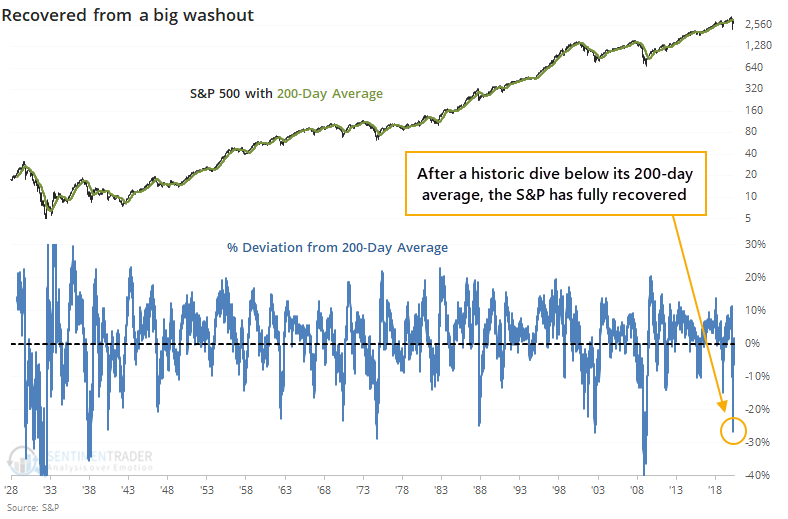
What's truly remarkable is how quickly it's gone. On average, it has taken the S&P more than 200 days to close above its average after falling more than 20% below it. This time, it took a mere 56 sessions. That is - by far - a record turnaround. No other instance even comes close. What's even more astounding is that these quick 56 days included a month when it was stuck just below the 200-day.
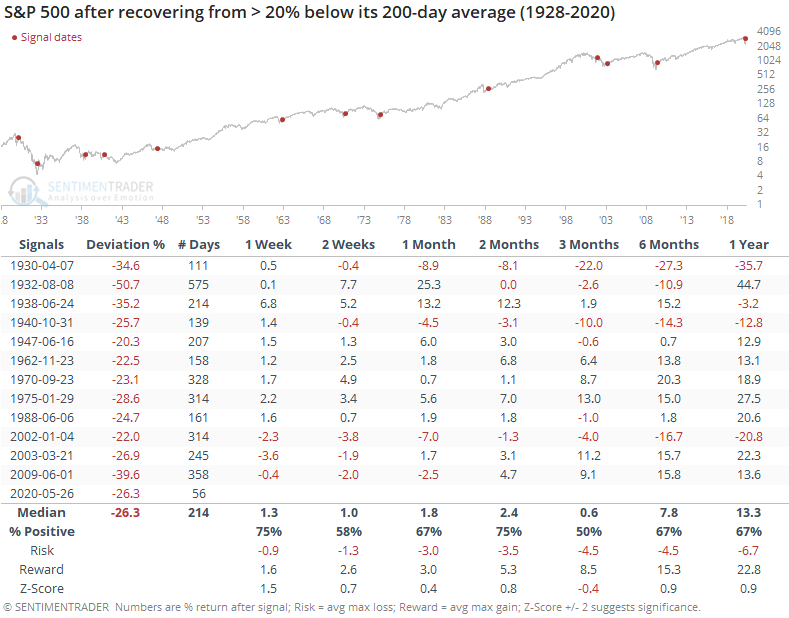
If we focus only on the fastest turnarounds, the ones that took fewer than 214 days to recover, then the future returns looked like the following.
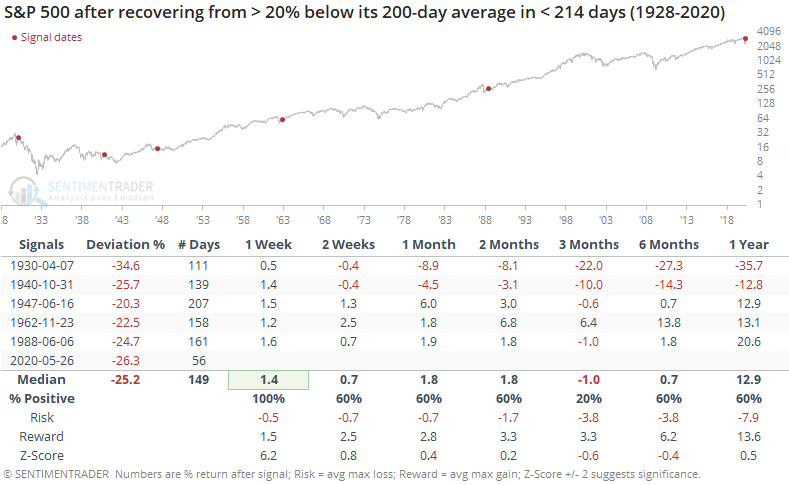
The recovery in 1962 took about three times as long as the current one, but it was a good sign as stocks continued to add to their gains in the months ahead.
The others, not so much. Once the S&P moved back above its average, it continued to rally for the next week, then started to fall apart in several cases. Only that one from 1962 still showed a gain after three months. It's a good sign that the S&P is back above its average, but we shouldn't necessarily count on it remaining above. As long as it does, great. If it fails, then it has some precedents that really struggled afterward.
BOTTOM LINE
With a continued surge this week, the percentages of stocks within the S&P 500 and Russell 2000 have recovered from extremely depressed levels to extremely high ones. Other times these indexes have cycled from one extreme to the other preceded further gains in the indexes every time.
FORECAST / TIMEFRAME
SPY -- Up, Medium-Term
|
Starting on March 26, we started spending a lot of time on two major factors that strongly suggested we were not seeing "just another bear market rally." Namely, there was a historic level of widespread buying pressure and prices had retraced more of the decline than bear market rallies typically do.
By mid-April, we went over another type of breadth thrust that nearly triggered, but didn't quite. Based on traditional ways of looking at things, stocks still hadn't really achieved terminal velocity, the kind of slam-dunk, no-questions-asked sustained buying pressure that has signaled the all-clear in past rallies. Again, that's only looking at things in a traditional way.
That argument is getting more difficult to make. With Tuesday's jump, an overwhelming number of stocks have at least moved into medium-term uptrends. As Troy shows in a premium note, the percentage of stocks above their 50-day moving averages has spiked across indexes, both domestic and overseas. As the rally gets closer and closer to lasting for 50 days, it's natural to see more and more stocks close above their 50-day averages.
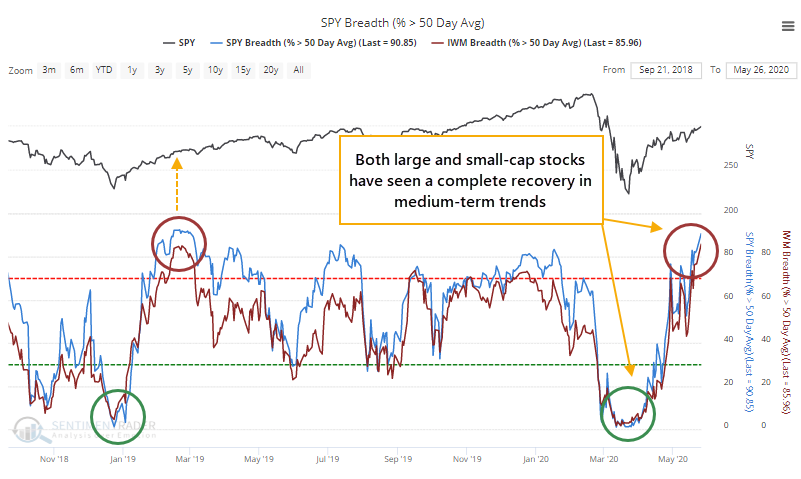
Looking at the most benchmarked index in the world, fewer than 10% of stocks were trading above their averages 35 days ago and now more than 90% of them are. When it cycles from one extreme to the other like this, it has preceded further medium-term gains every time and the risk/reward ratio was ridiculously positive.
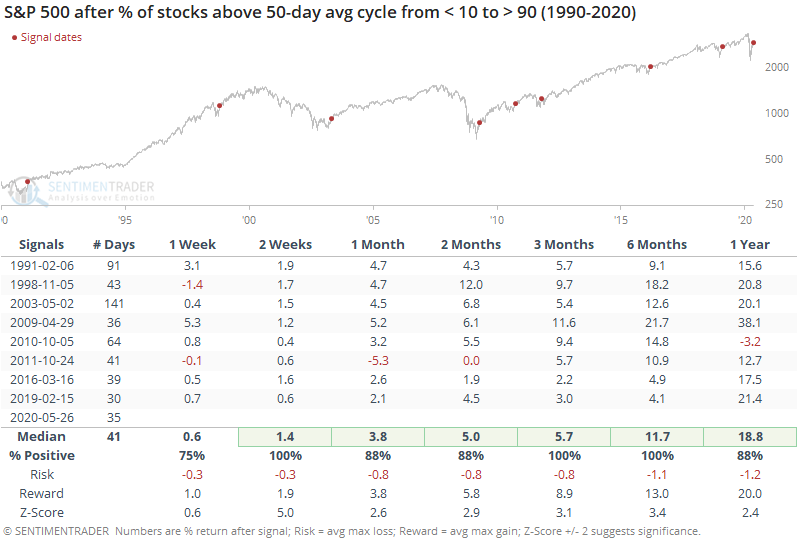
This is the 2nd-fastest that so many stocks have cycled from one extreme to the other, exceeded only by February 2019. It took slightly longer in April 2009 and March 2016. All three of those were tremendous kick-off rallies.
There is some concern that so many stocks are above their 50-day averages but fewer than 40% are yet above their 200-days. In the above table, April 2009 saw only 31% of stocks above their 200-day averages at the time, and October 2011 saw 44%. All the others had more than 50% of members above their long-term averages, so perhaps it's a modest concern but the evidence is limited.
It's not just large-caps, which get most of the attention. There are more stocks in the Russell 2000 than the S&P 500 (duh) so it's harder for that index to see such extremes, even though they tend to be more volatile. Still, within that index, fewer than 15% of stocks were above their 50-day averages, and now more than 85% are.
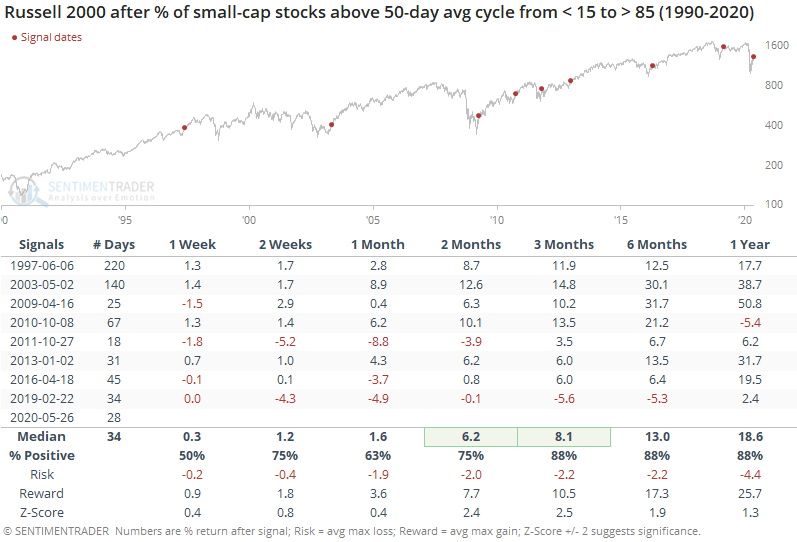
As Troy noted in his post, very high readings in this measure have led to some rocky returns for the Russell, especially in recent years. And its record after cycling from one extreme to the other wasn't quite as good as the S&P's.
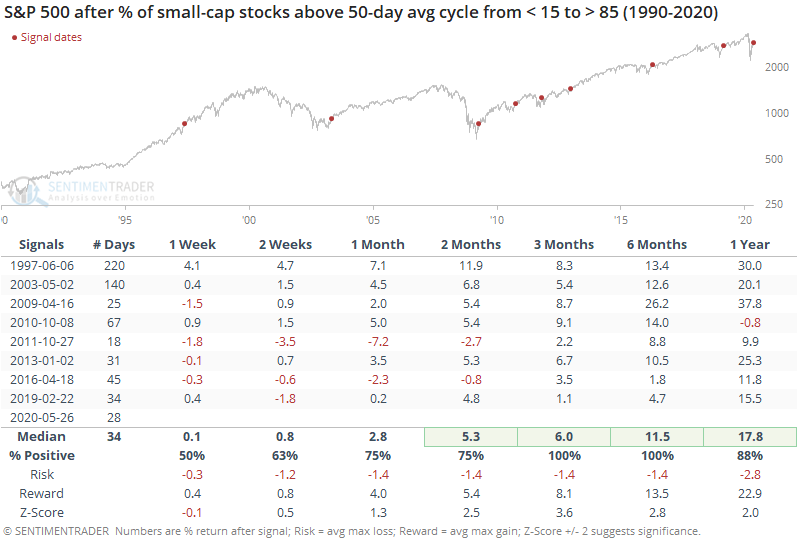
If we look at how the S&P did after those extremes in small-cap stocks, again it was impressive. The dates were slightly different but mostly the same general time frames as the first table.
Even among indexes across the world, we're seeing longer-term recoveries. The 20-day average of countries with a rising 200-day moving average has just started to curl up from zero. Going back to 1987, this has only happened 3 other times, all lasting recoveries.
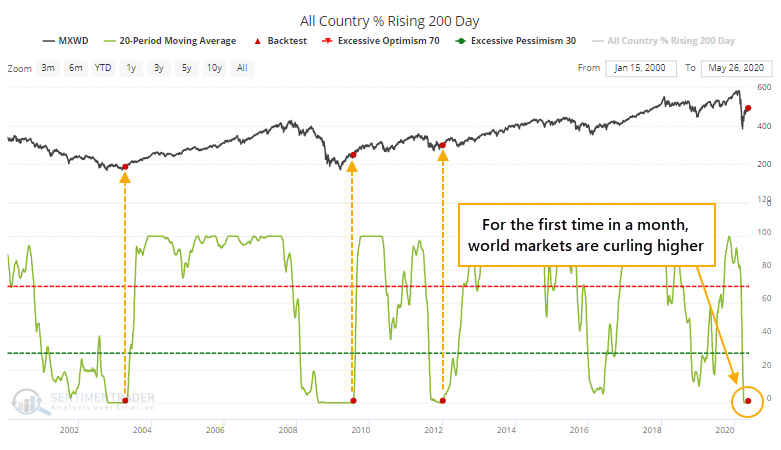
It's extremely hard to ignore the positive implications of this, even though we haven't seen much of the digestion that normally comes after an initial recovery.
So, how do we reconcile that against some of the negatives that have popped up, especially the surge in speculative activity? Sometimes, we simply can't. There are a couple of times in most years when everything we look at tilts a certain direction, which makes having high confidence in an outlook "easy." This is not one of those times. We'd still give more weight to the negatives over the short- to medium-term but the positives medium- to long-term.
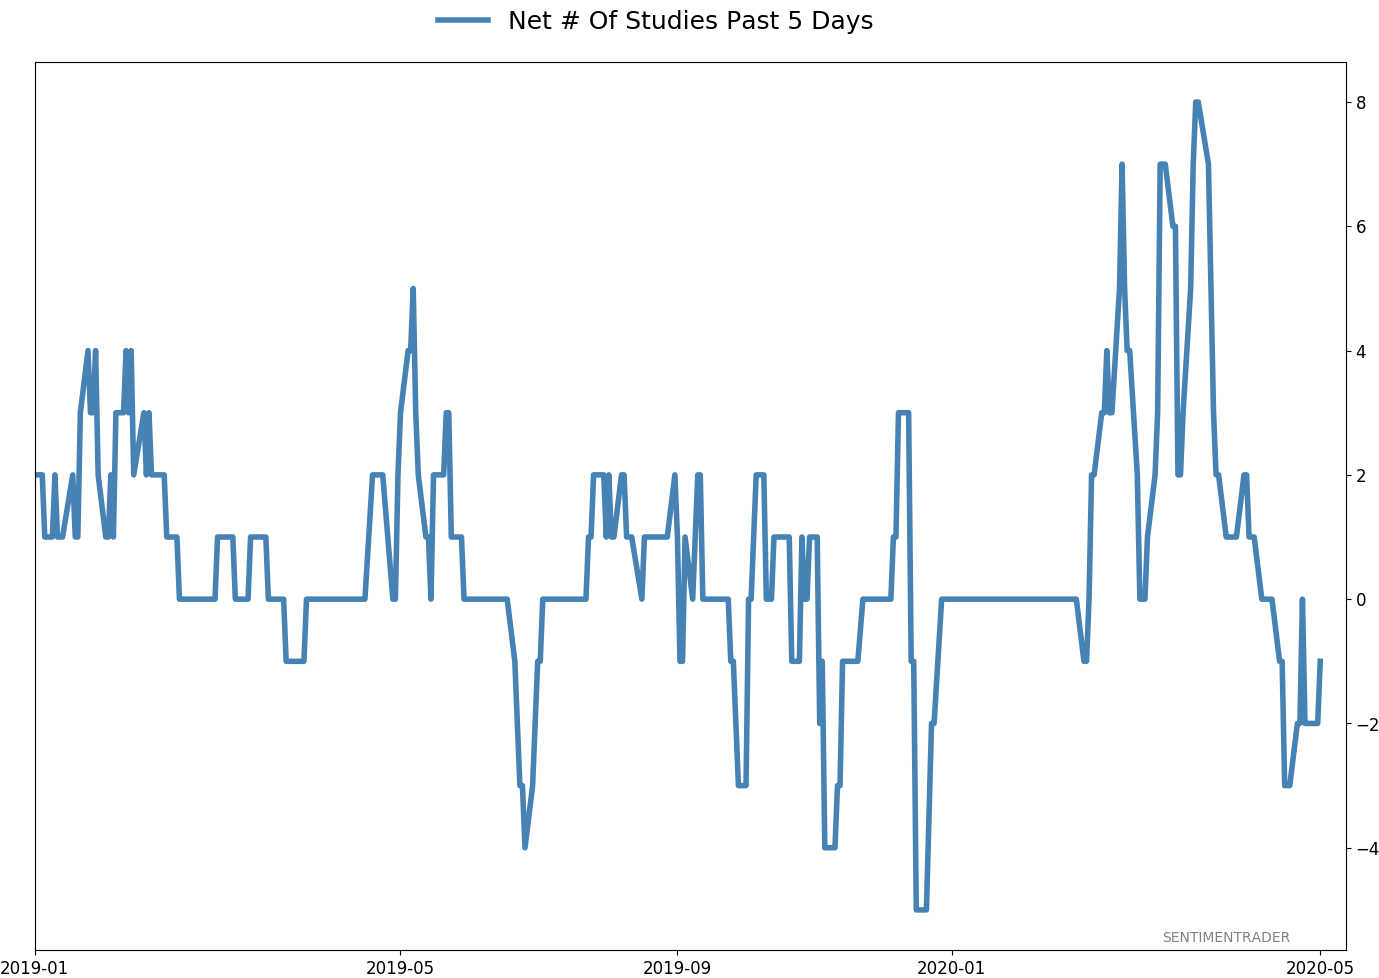
Active Studies
| Time Frame | Bullish | Bearish | | Short-Term | 0 | 1 | | Medium-Term | 8 | 4 | | Long-Term | 33 | 1 |
|
Indicators at Extremes
Portfolio
| Position | Weight % | Added / Reduced | Date | | Stocks | 38.9 | Reduced 10% | 2020-05-13 | | Bonds | 0.0 | Reduced 6.7% | 2020-02-28 | | Commodities | 5.1 | Added 2.4%
| 2020-02-28 | | Precious Metals | 0.0 | Reduced 3.6% | 2020-02-28 | | Special Situations | 0.0 | Reduced 31.9% | 2020-03-17 | | Cash | 56.0 | | |
|
Updates (Changes made today are underlined)
In the first months of the year, we saw manic trading activity. From big jumps in specific stocks to historic highs in retail trading activity to record highs in household confidence to almost unbelievable confidence among options traders. All of that came amid a market where the average stock couldn't keep up with their indexes. There were signs of waning momentum in stocks underlying the major averages, which started triggering technical warning signs in late January. The kinds of extremes we saw in December and January typically take months to wear away, but the type of selling in March went a long way toward getting there. When we place the kind of moves we saw into March 23 into the context of coming off an all-time high, there has been a high probability of a multi-month rebound. After stocks bottomed on the 23rd, they enjoyed a historic buying thrust and retraced a larger amount of the decline than "just a bear market rally" tends to. While other signs are mixed that panic is subsiding, those thrusts are the most encouraging sign we've seen in years. Shorter-term, there have been some warning signs popping up and our studies have stopped showing as positively skewed returns. I reduced my exposure some in late April and was looking for a pattern of lower highs and lower lows to reduce it further. With weakness on May 12, our studies turned even more negative over the short- to medium-term so I reduced a bit more. Some short-term indicators are already nearing oversold so we may get a quick rebound but it is what it is. If we see a clear pattern of lower lows, I may reduce even further in the week(s) ahead. Long-term prospects look decent because of the thrusts we saw off the low, but I'm more comfortable in cash in the interim. I'd consider adding back if we see our indicators and studies start to skew to the upside again, or if price action turns clearly better, indicating my caution is wrong.
RETURN YTD: -6.8% 2019: 12.6%, 2018: 0.6%, 2017: 3.8%, 2016: 17.1%, 2015: 9.2%, 2014: 14.5%, 2013: 2.2%, 2012: 10.8%, 2011: 16.5%, 2010: 15.3%, 2009: 23.9%, 2008: 16.2%, 2007: 7.8%
|
|
Phase Table
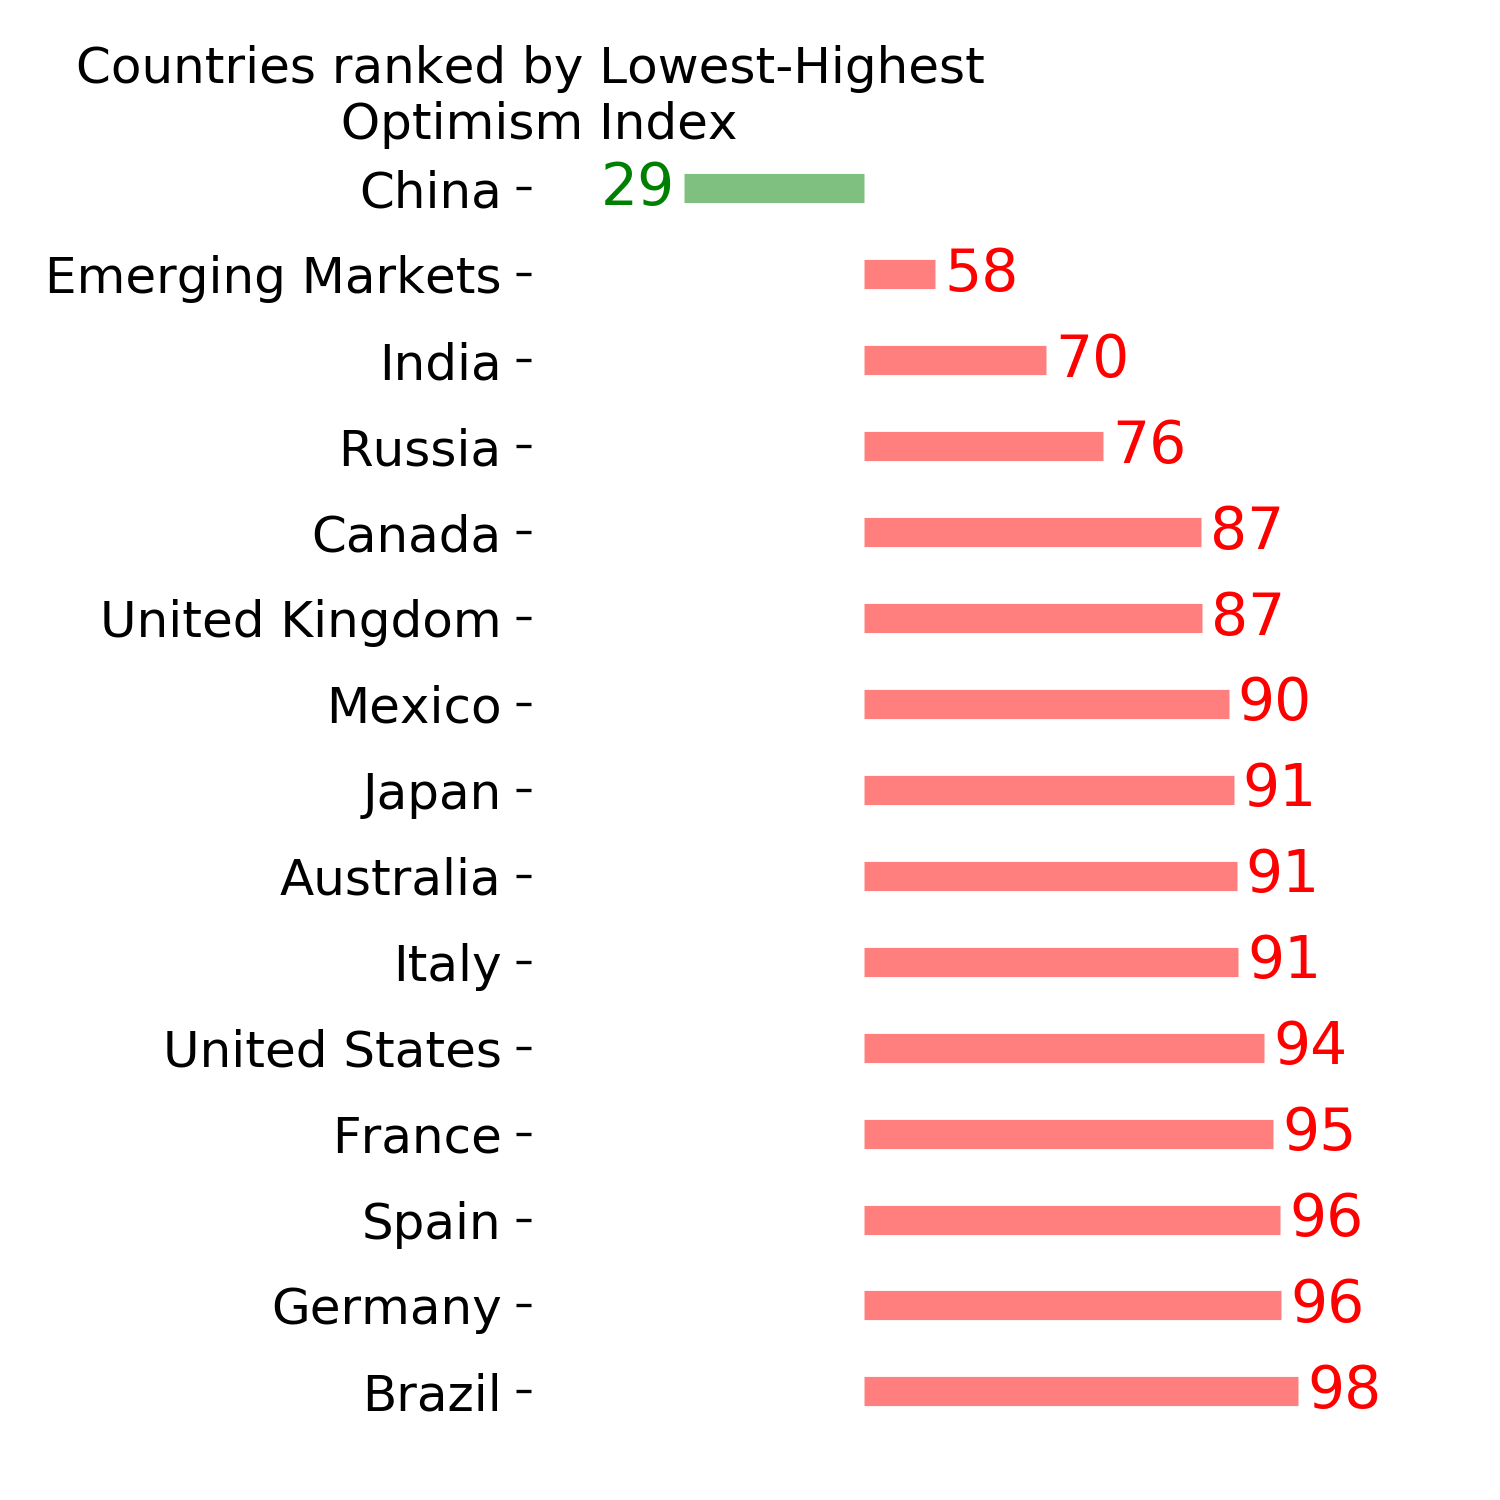
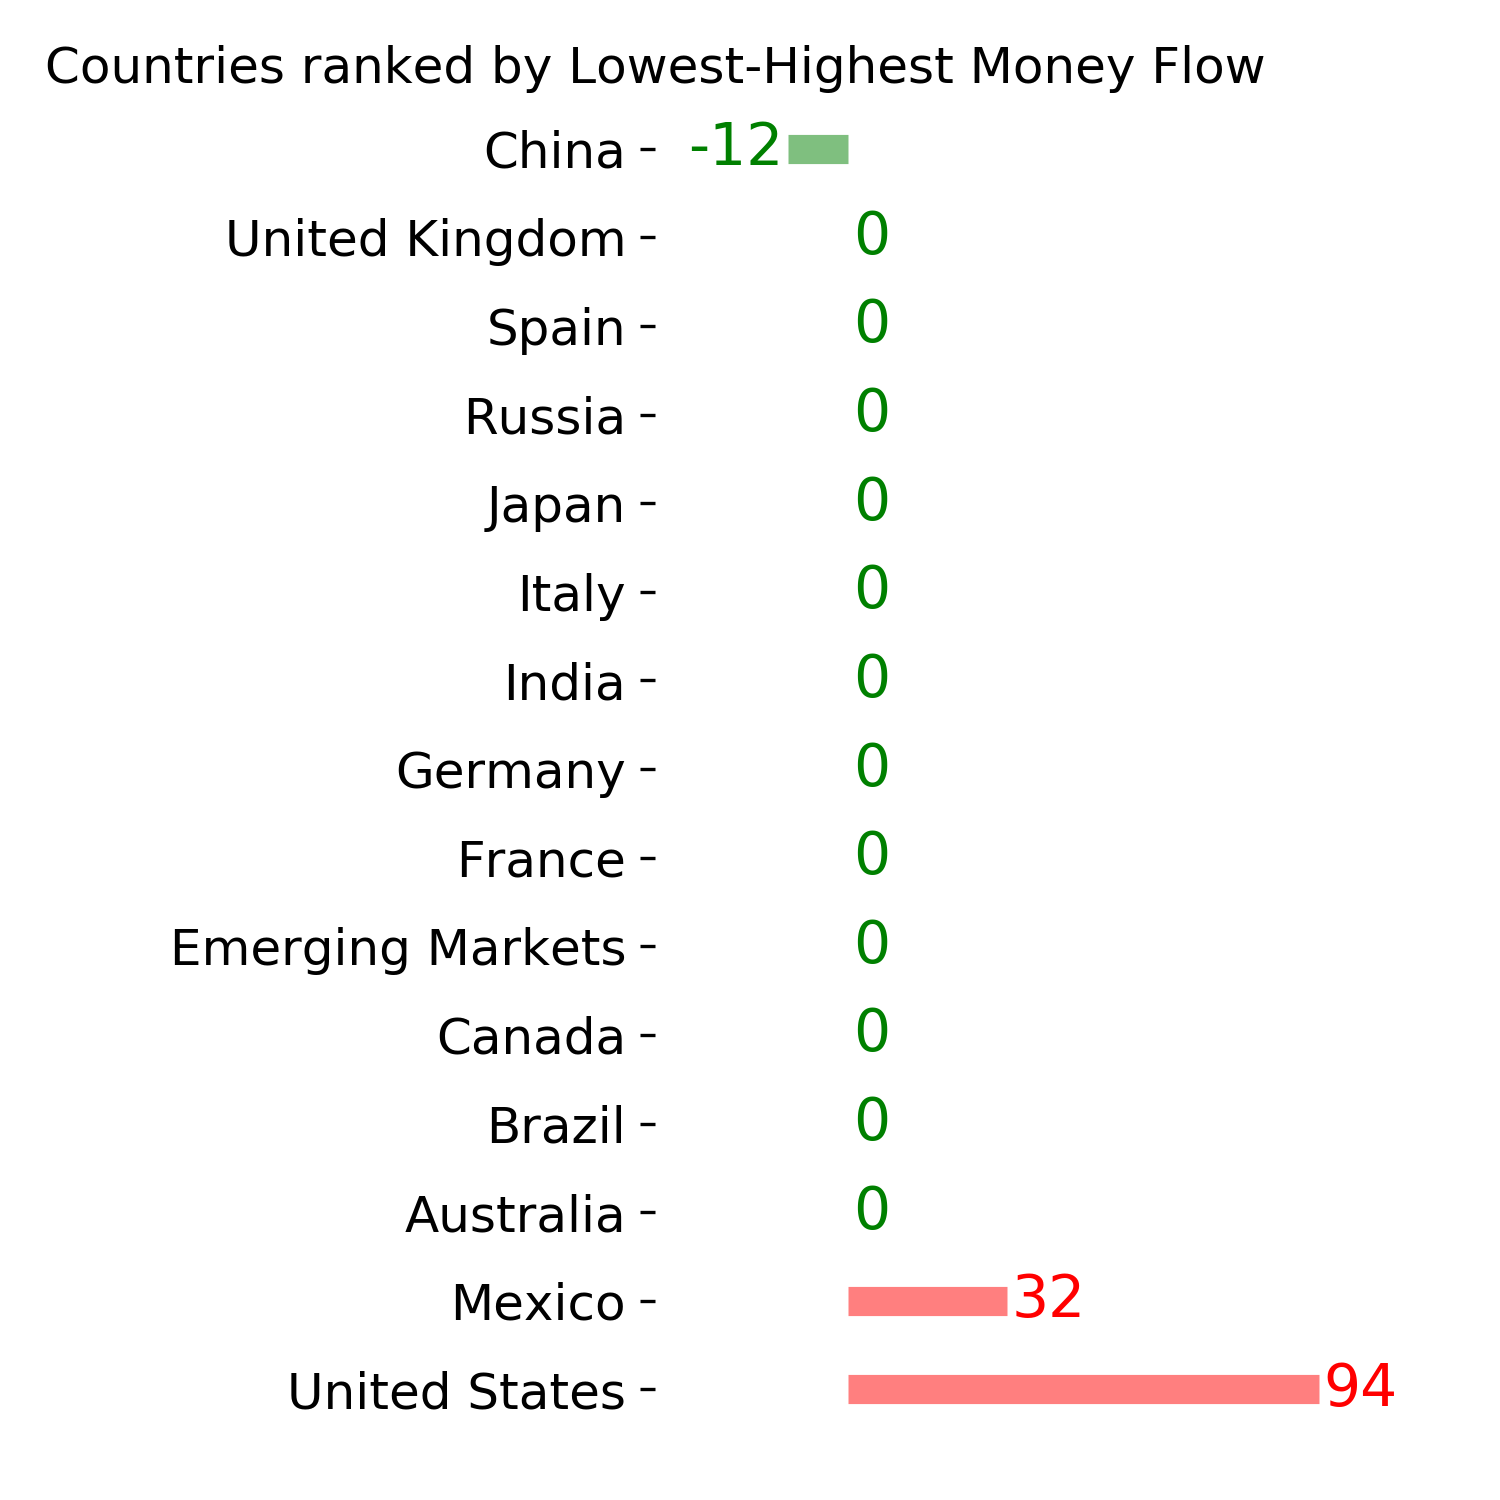
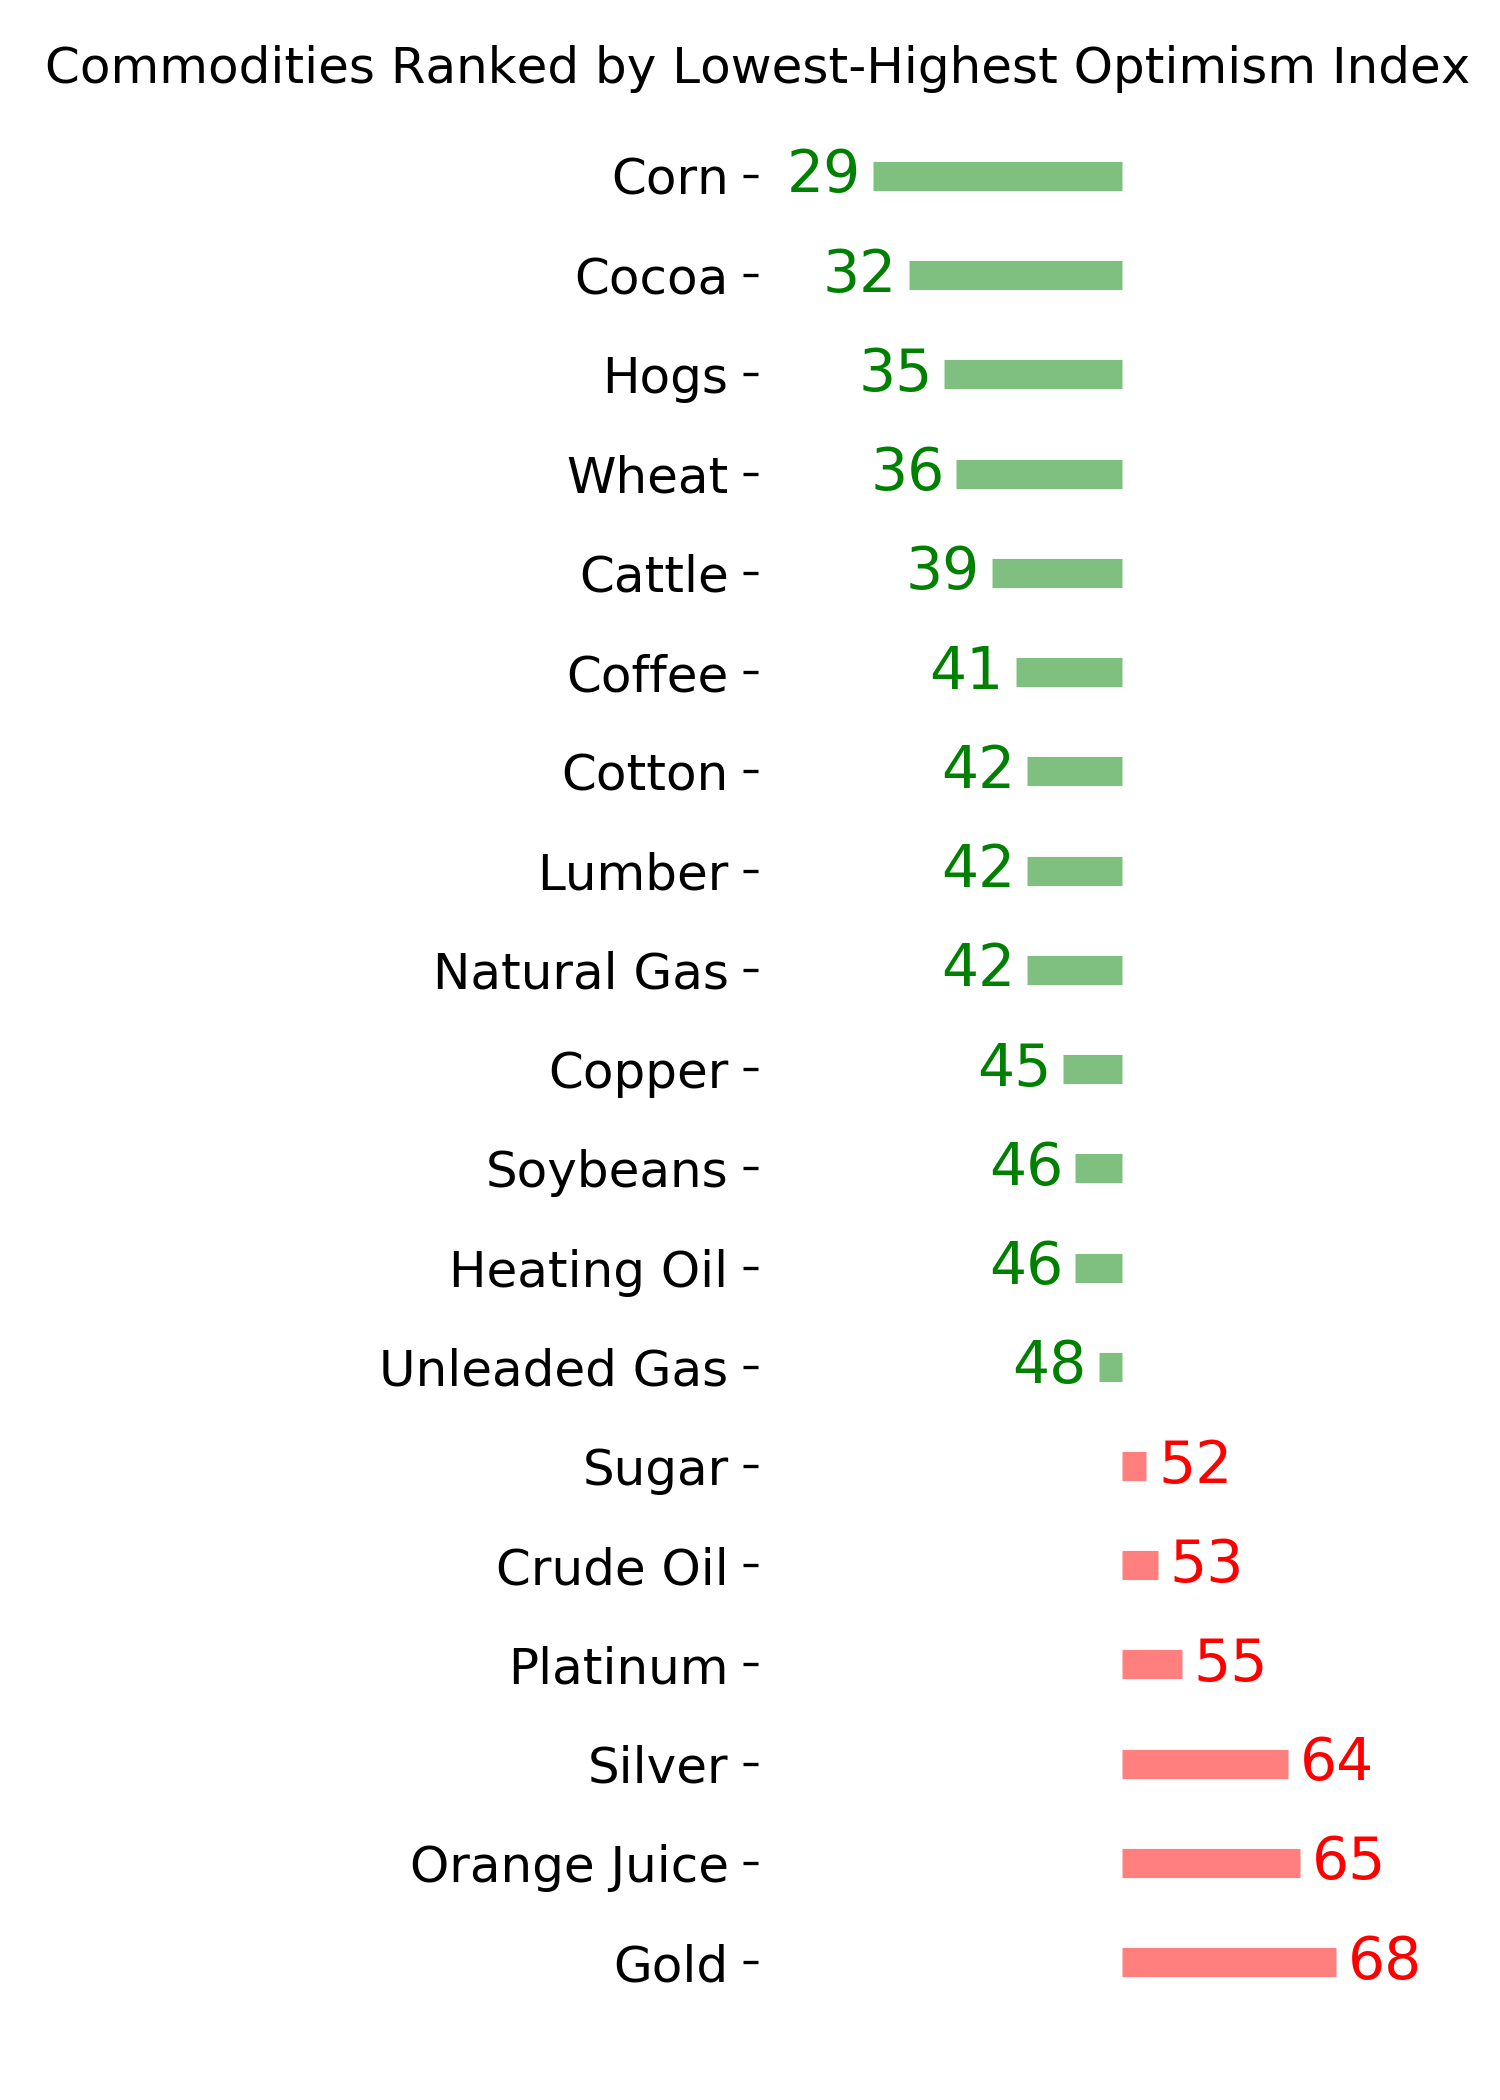
Ranks
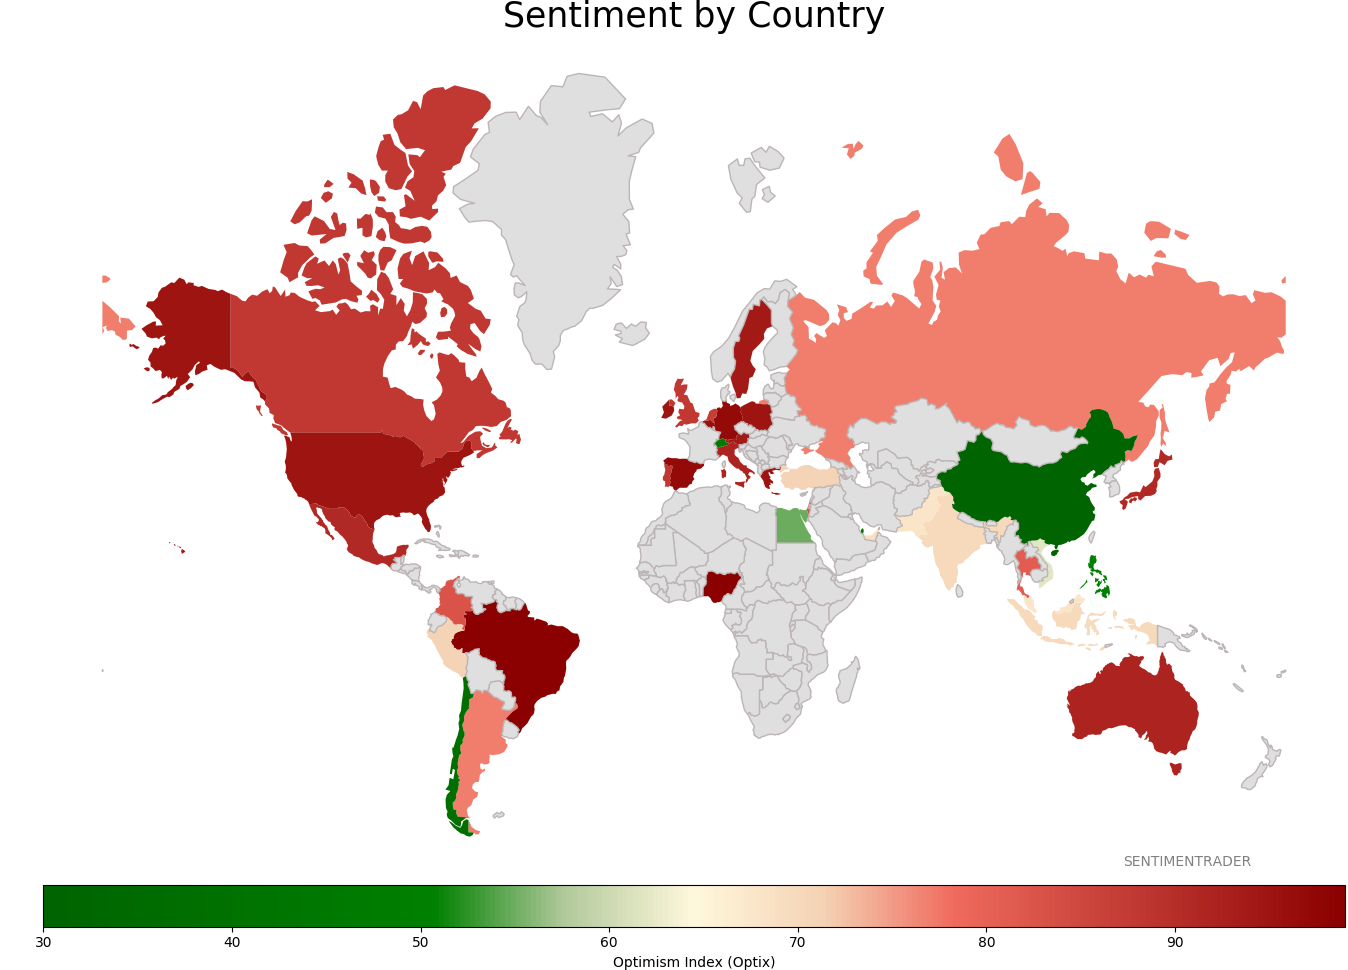
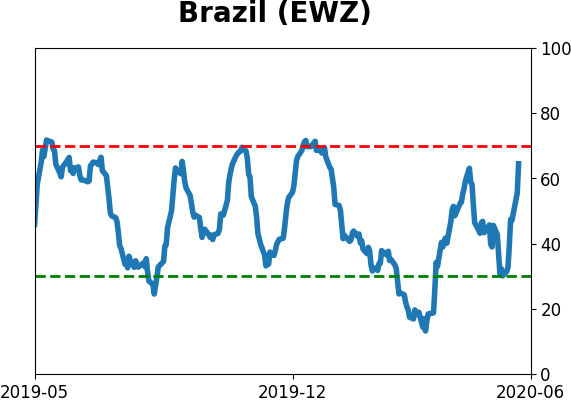
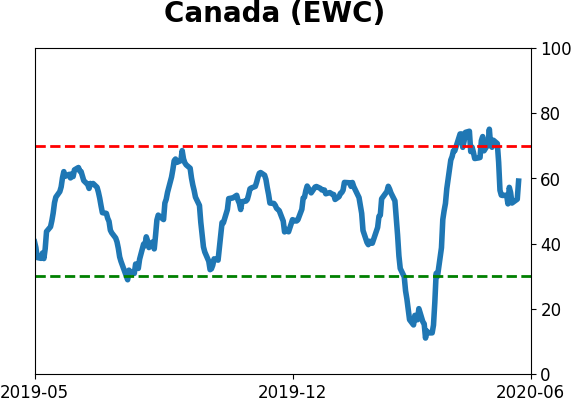
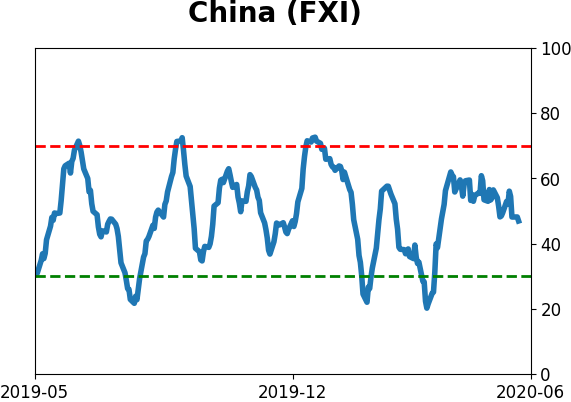
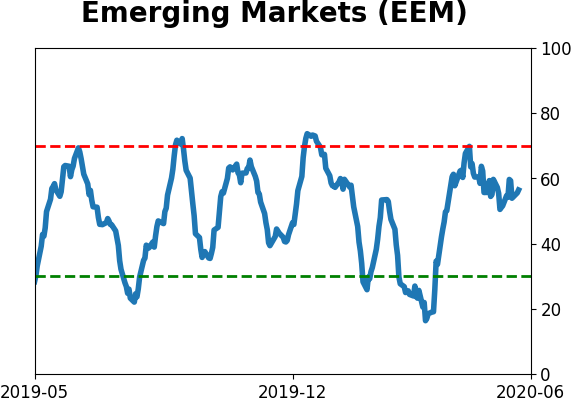
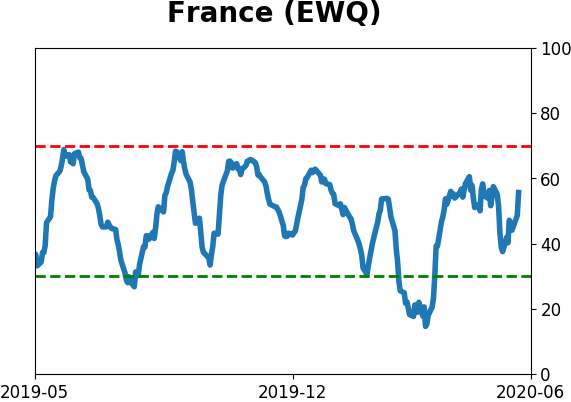
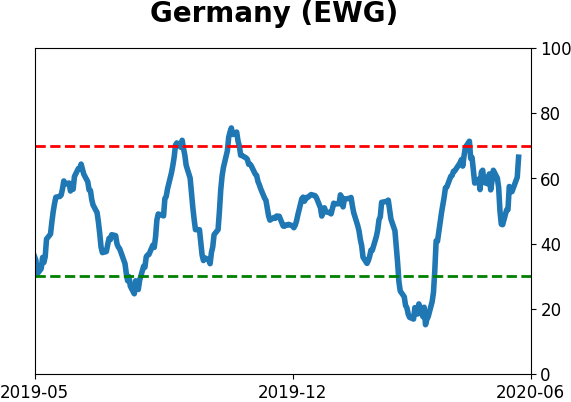
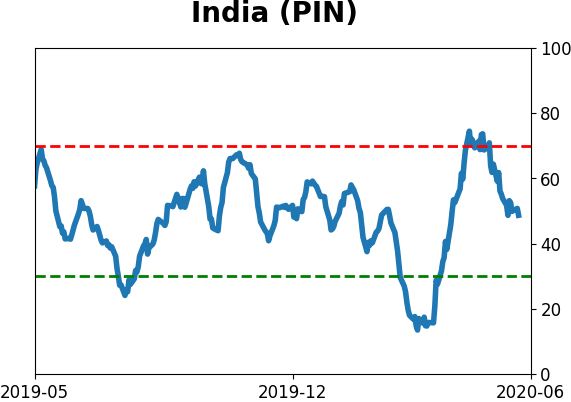
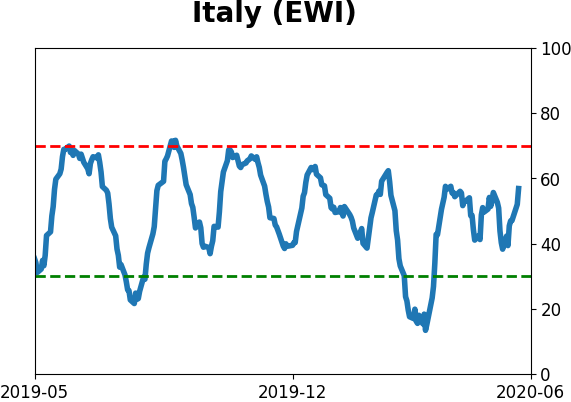
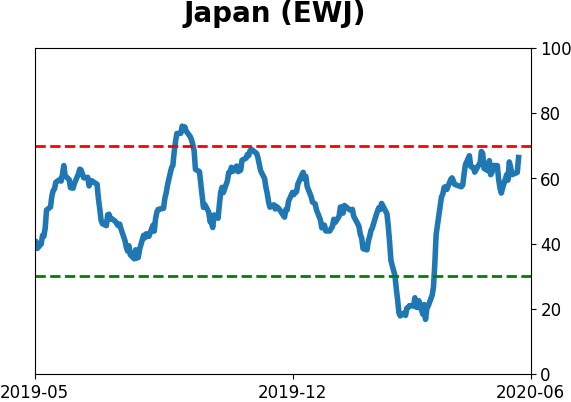
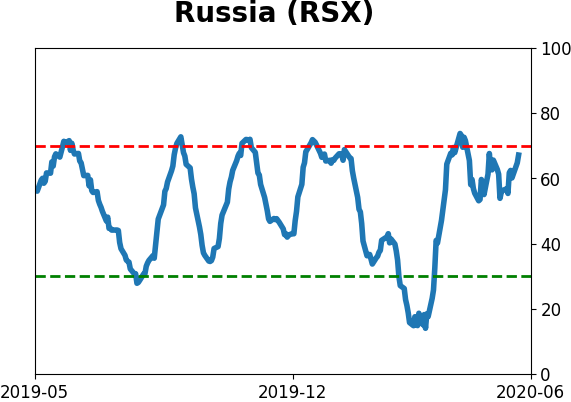
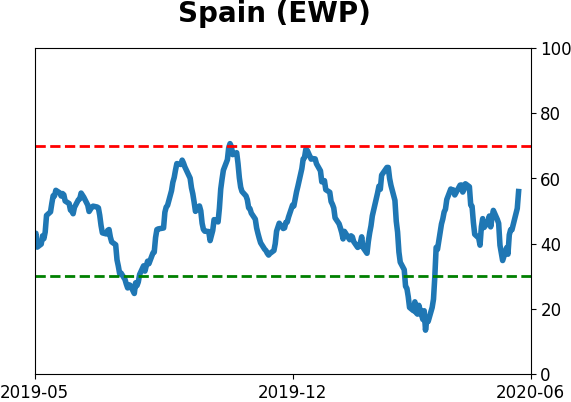
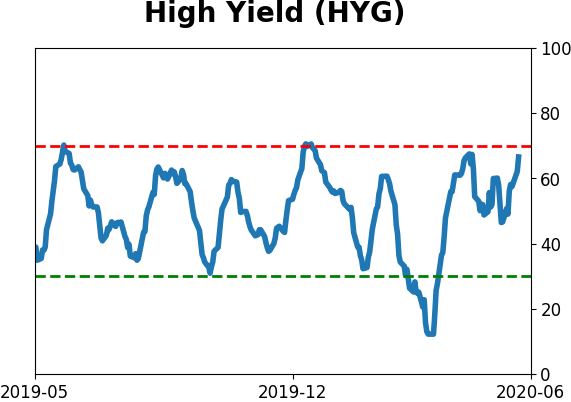
Sentiment Around The World
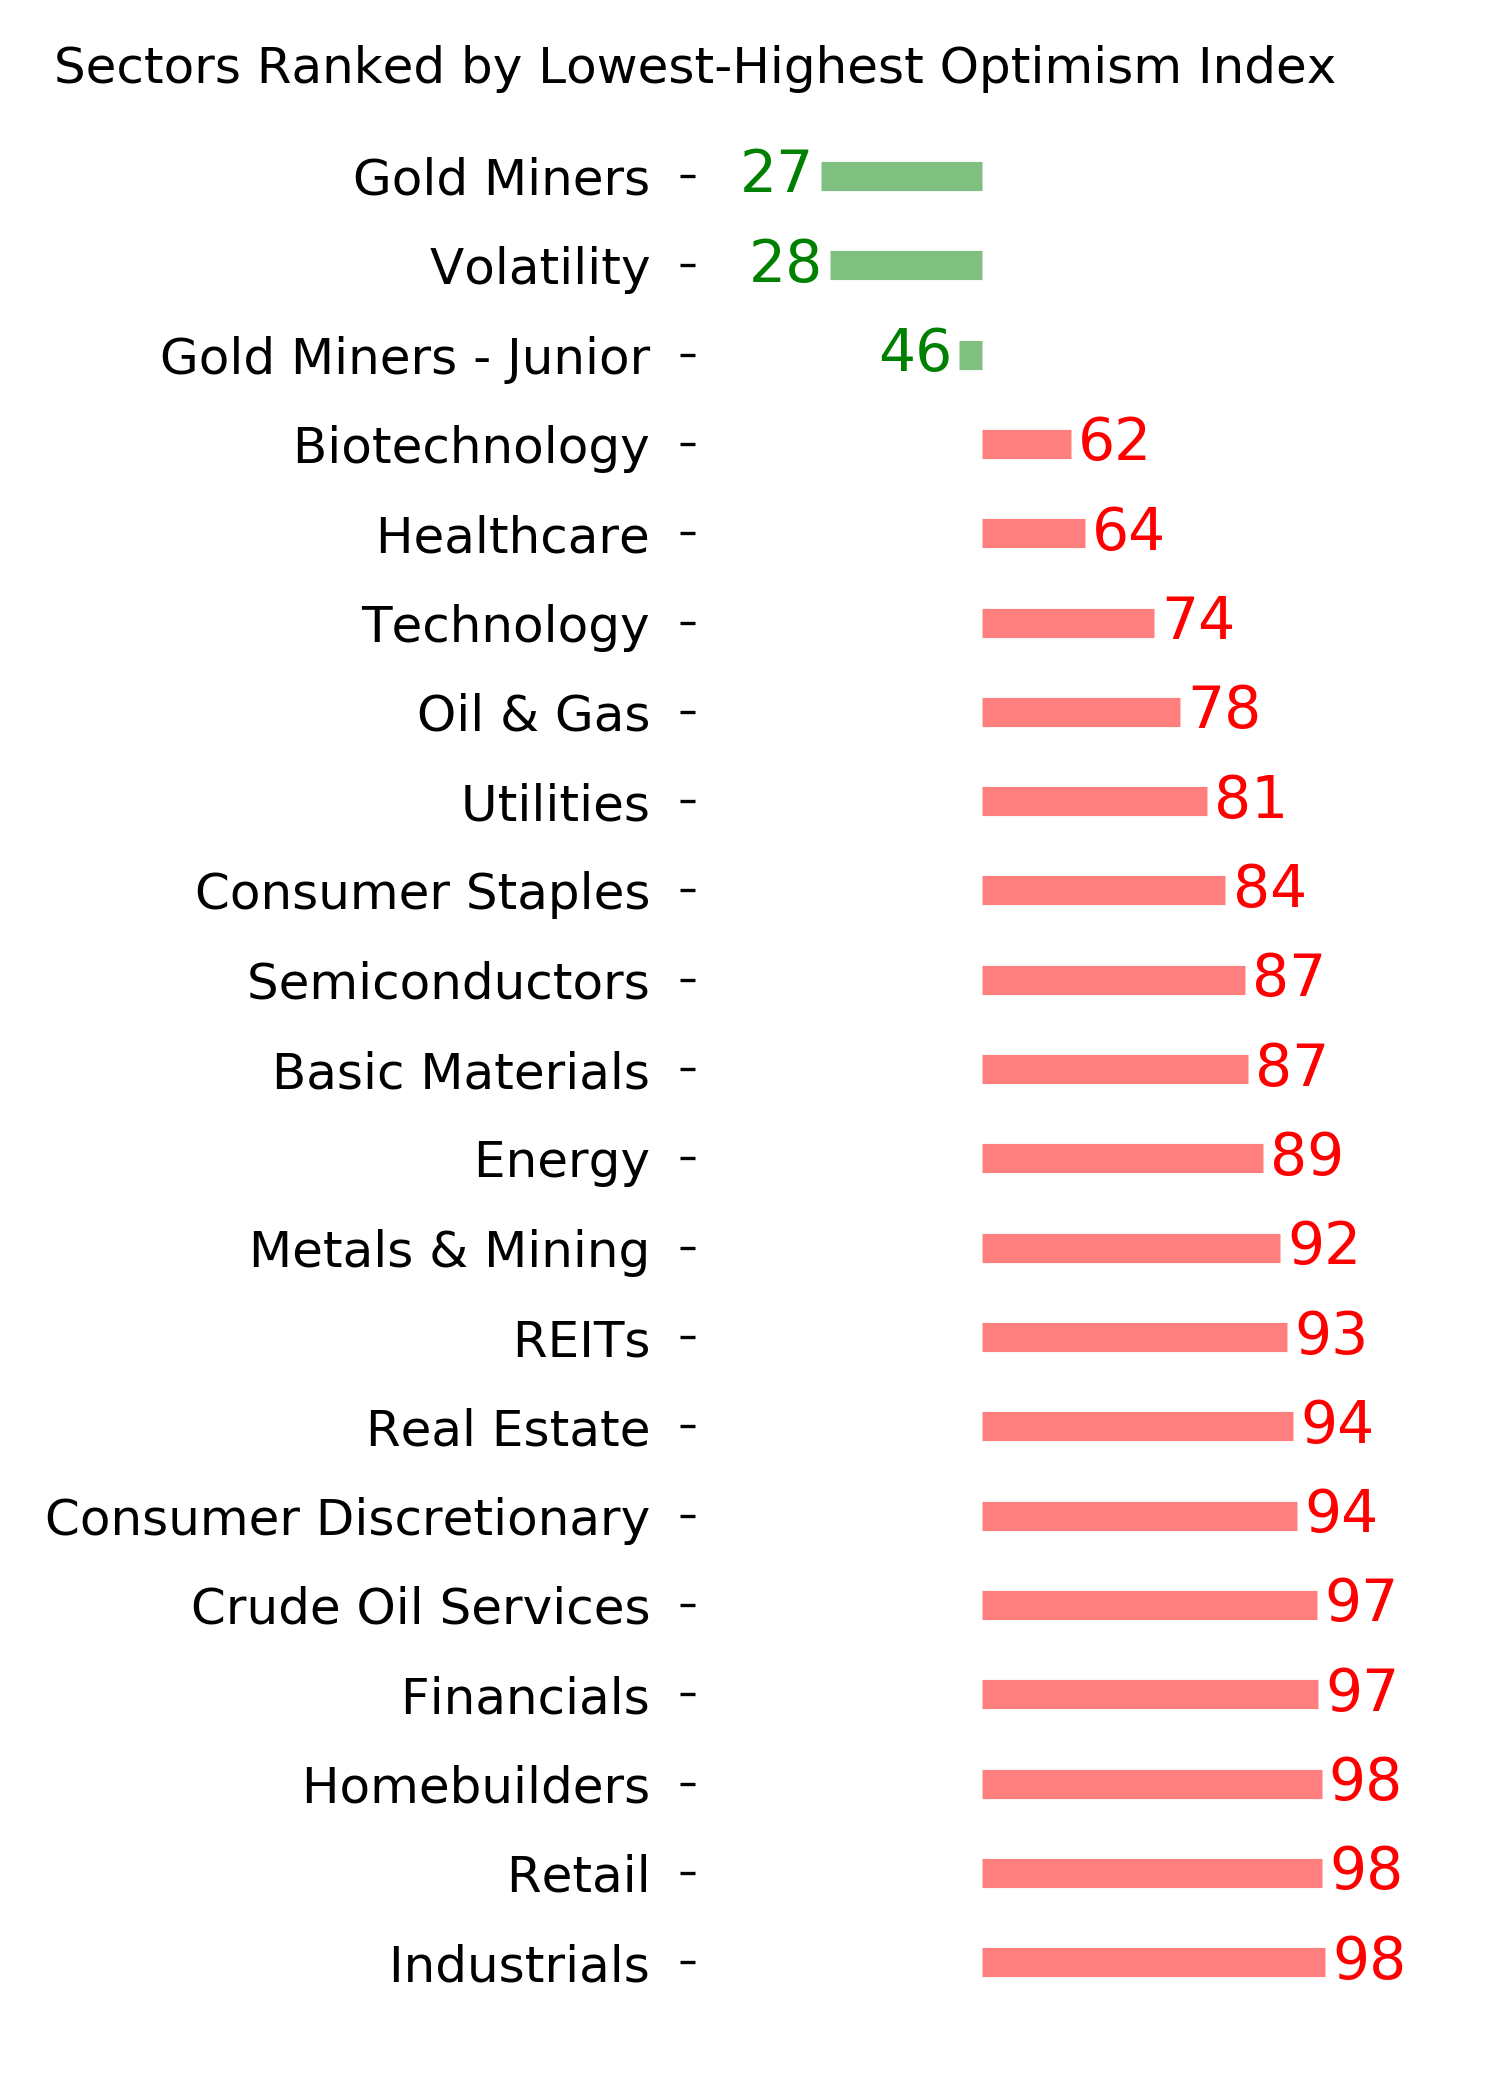
Optimism Index Thumbnails
|
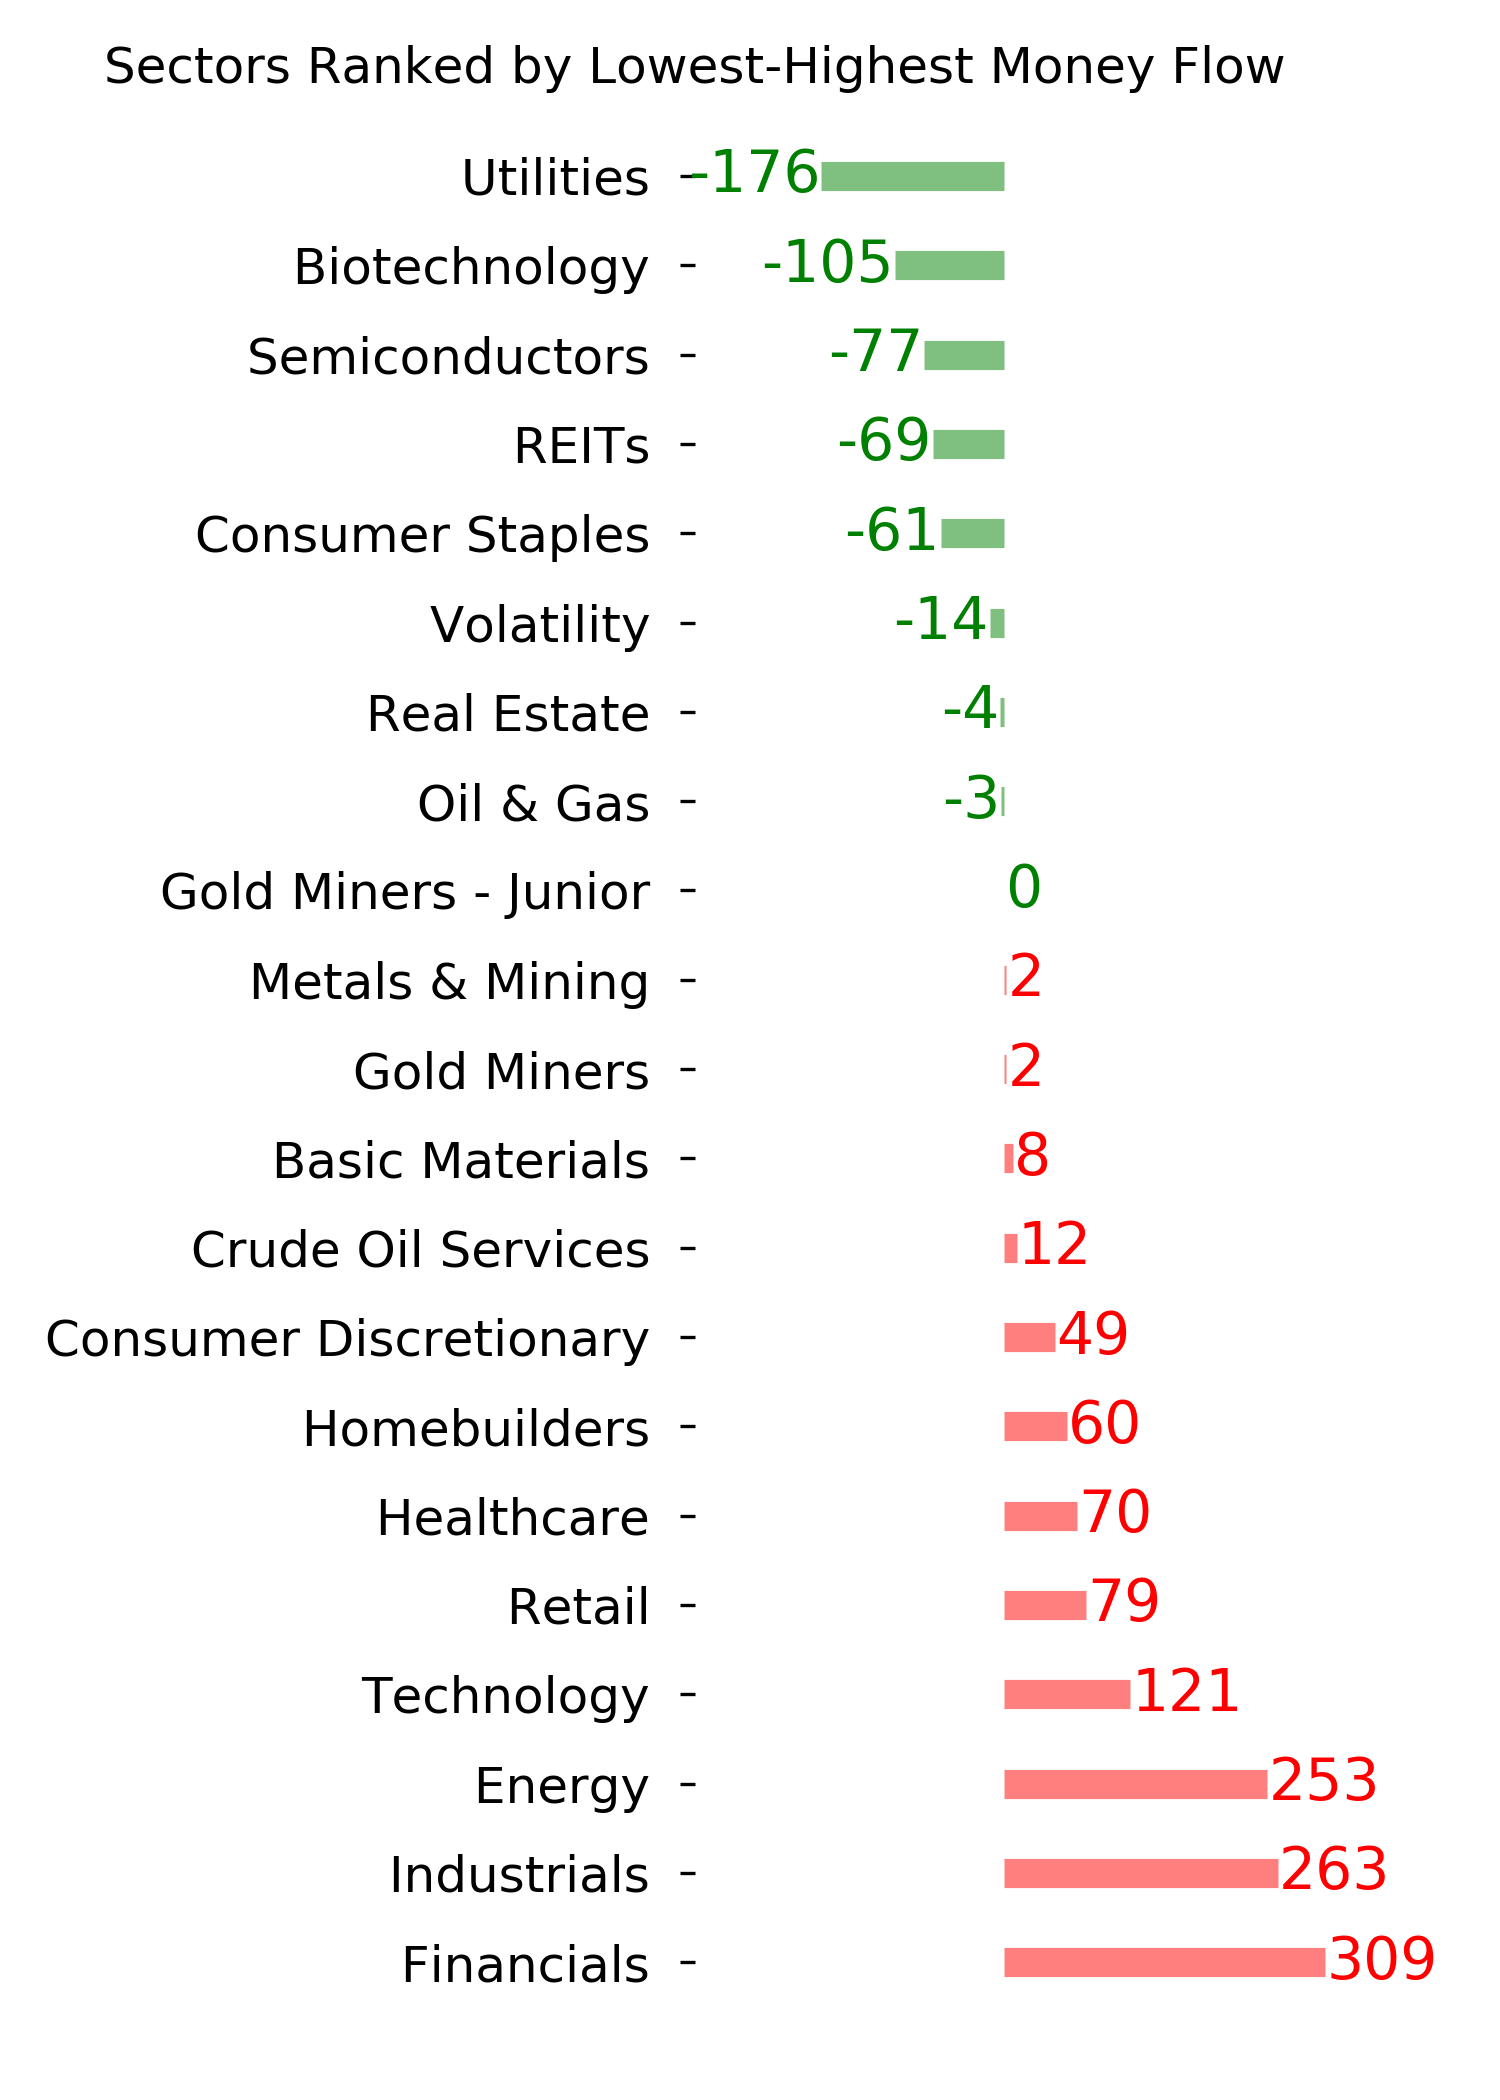
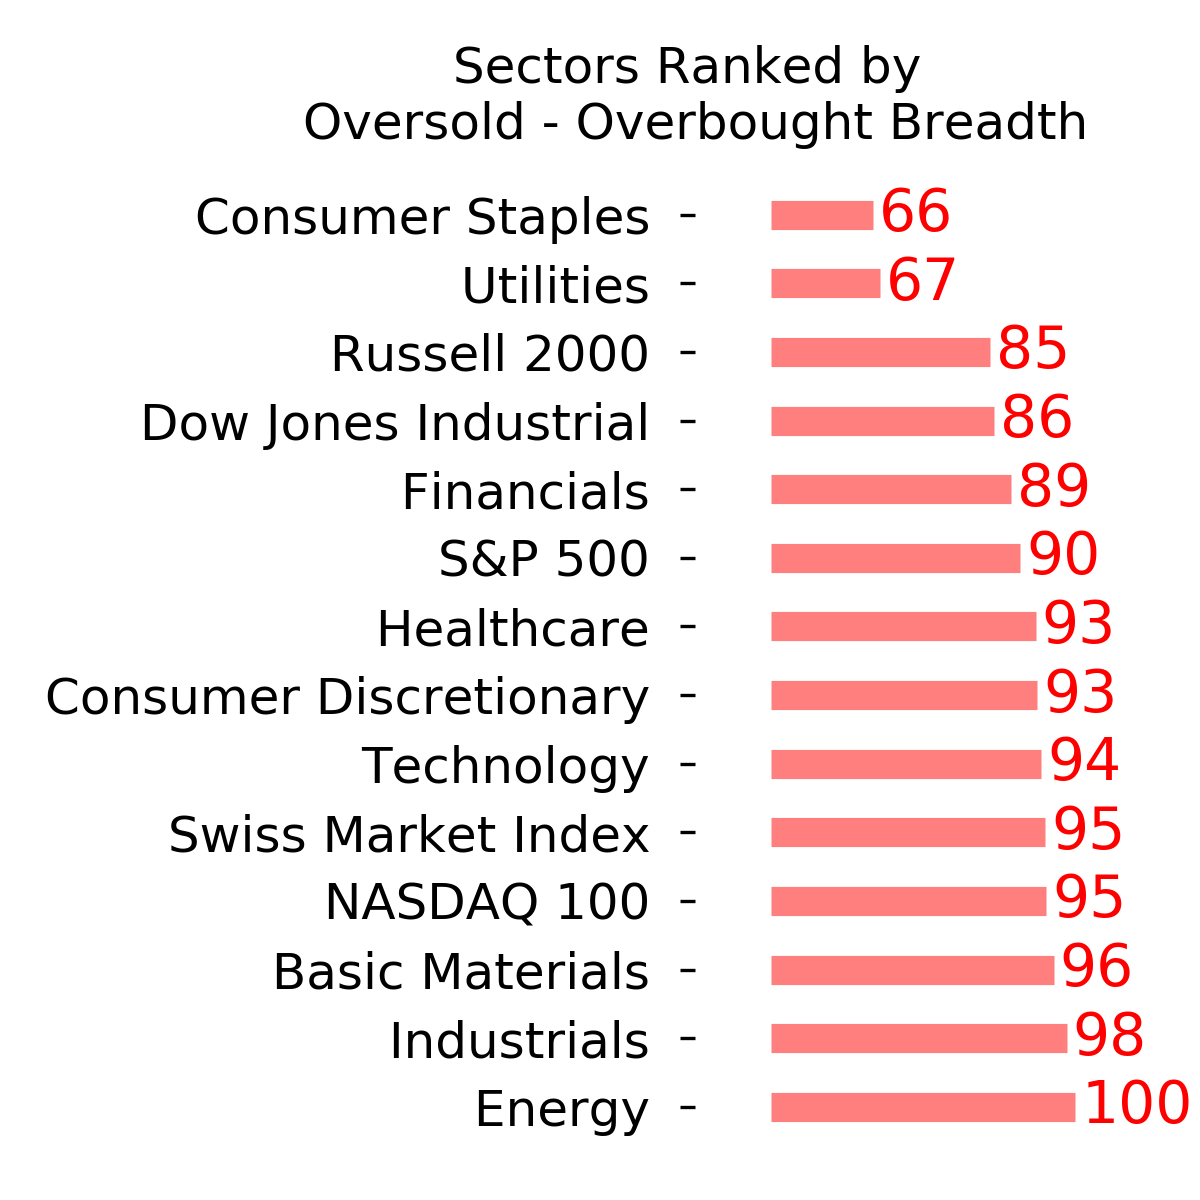
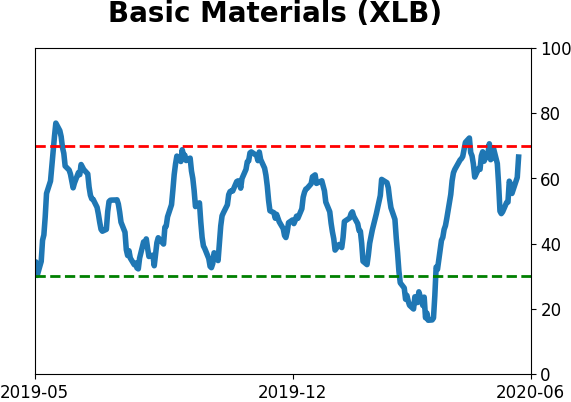
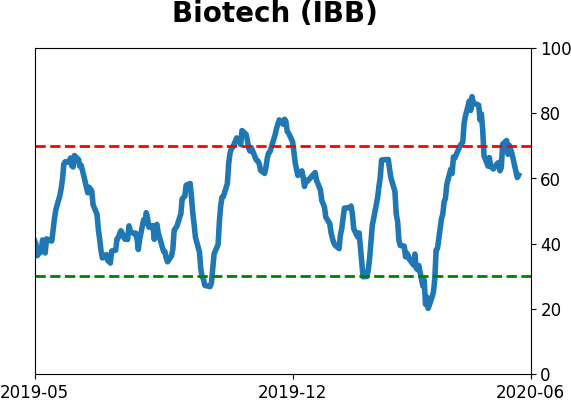
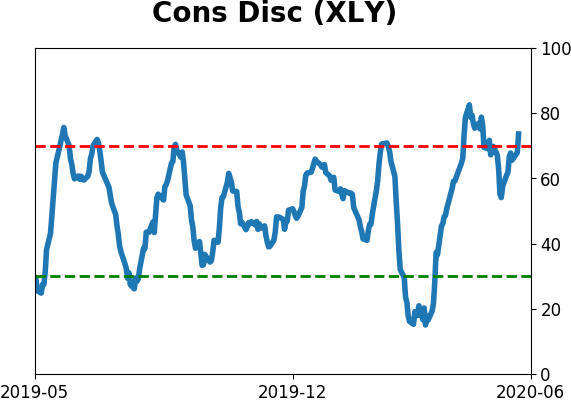
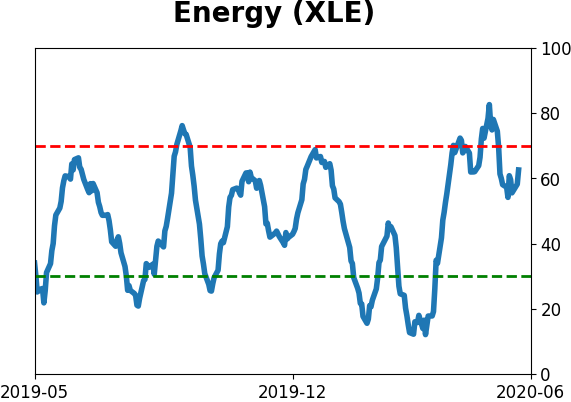
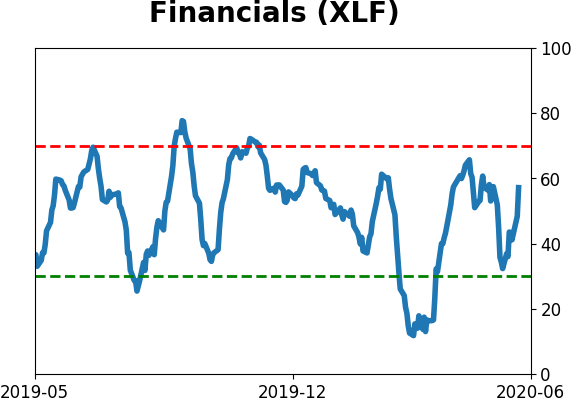
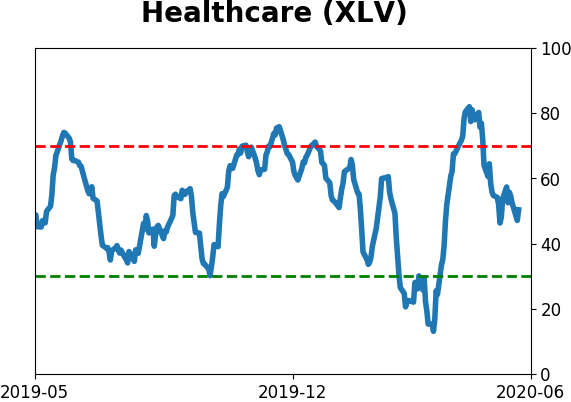
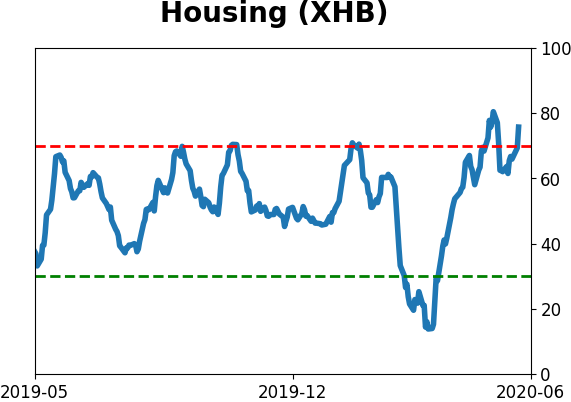
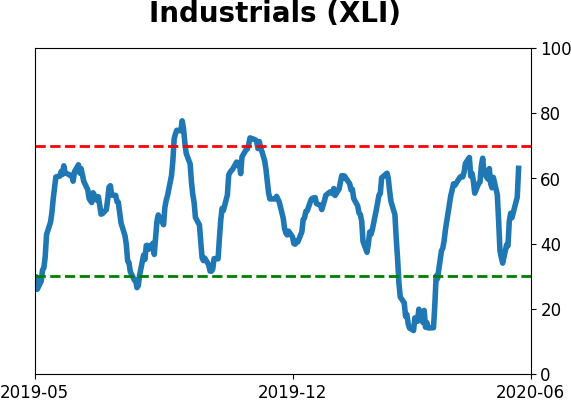
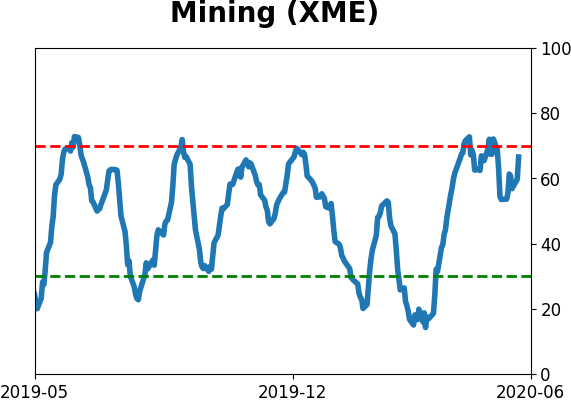
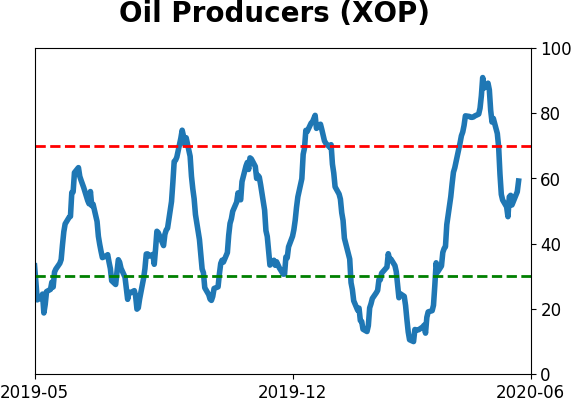
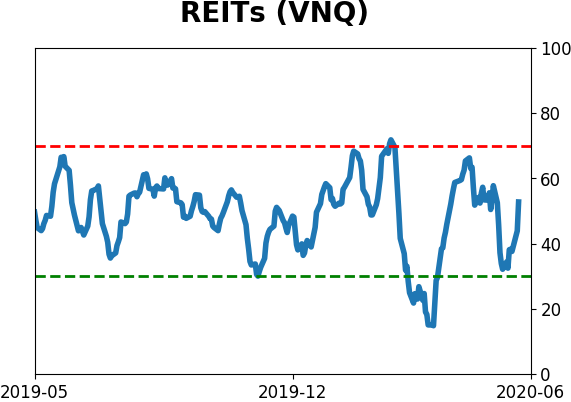
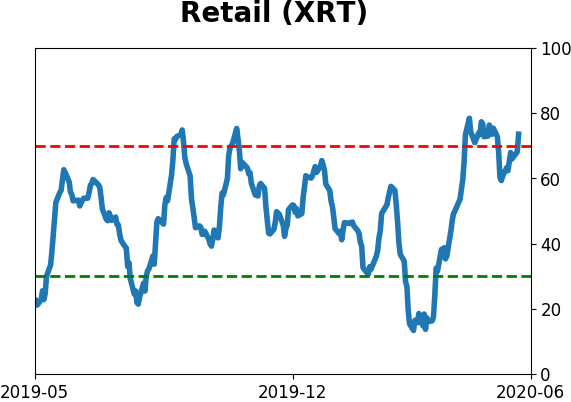
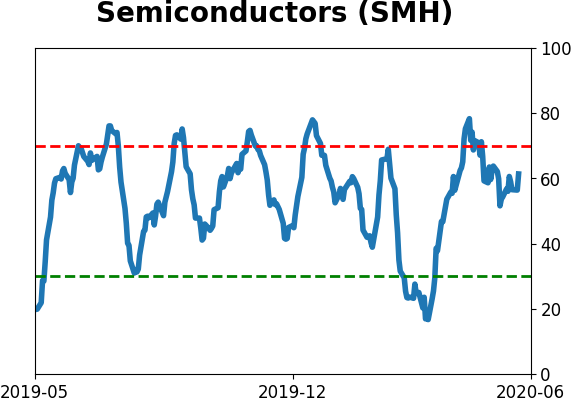
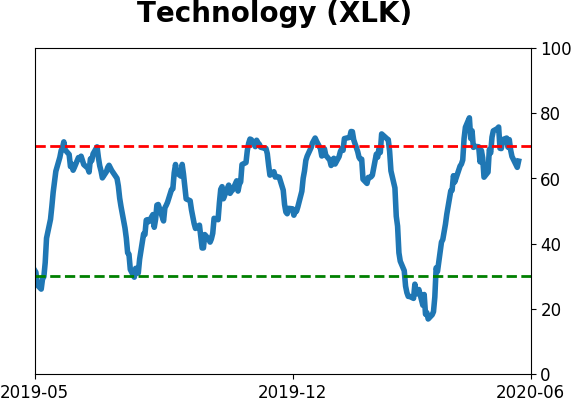
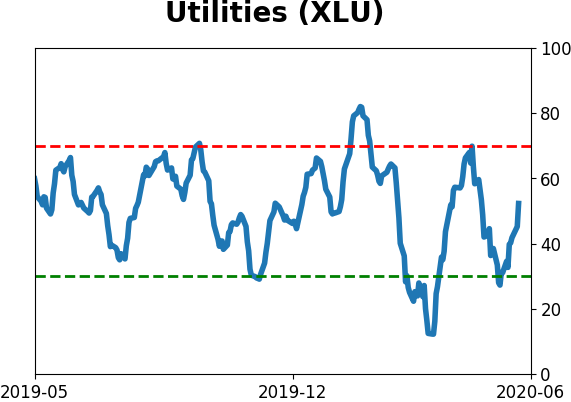
Sector ETF's - 10-Day Moving Average
|
|
|
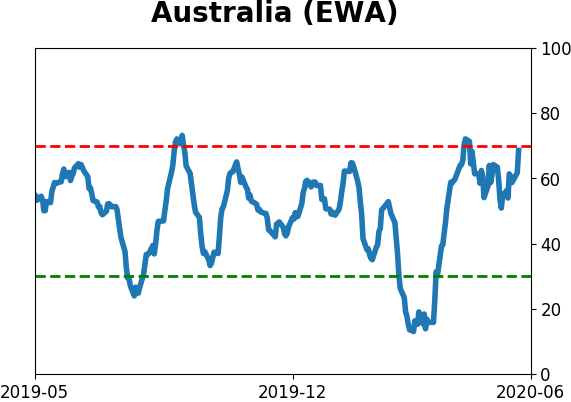
Country ETF's - 10-Day Moving Average
|
|
|
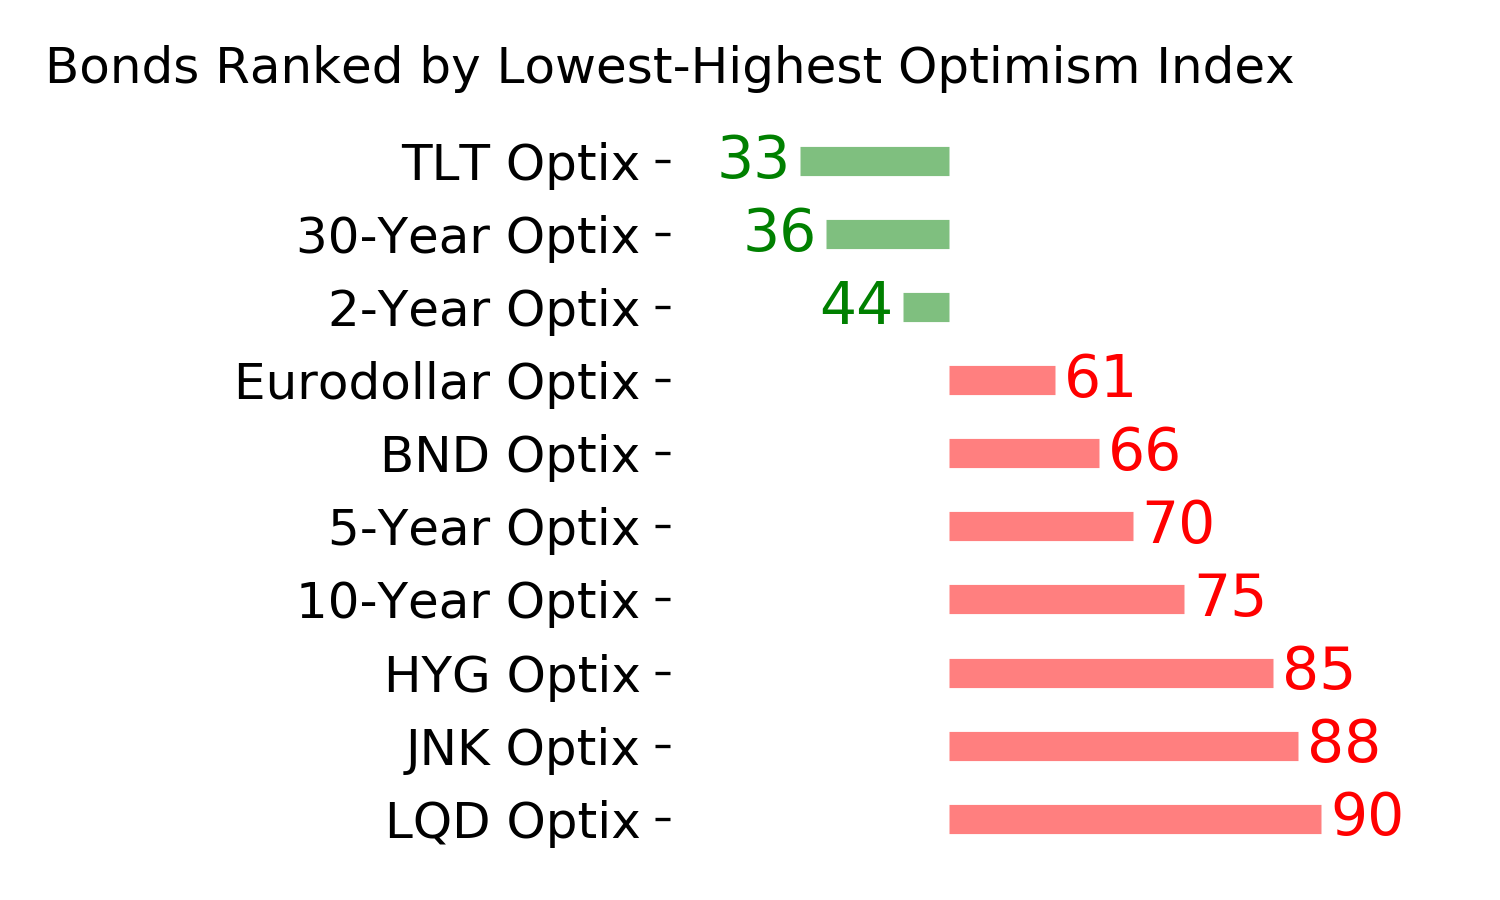
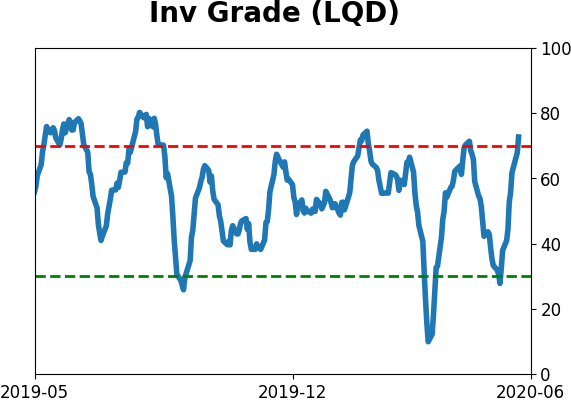
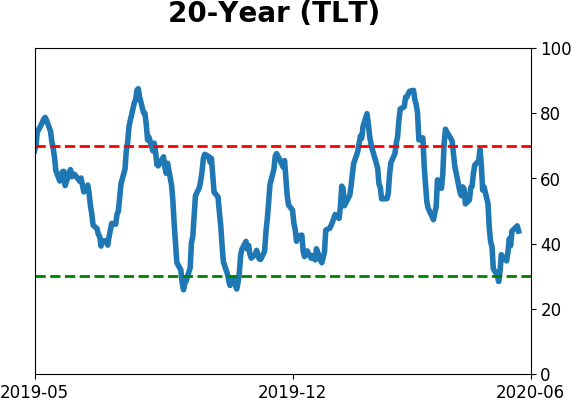
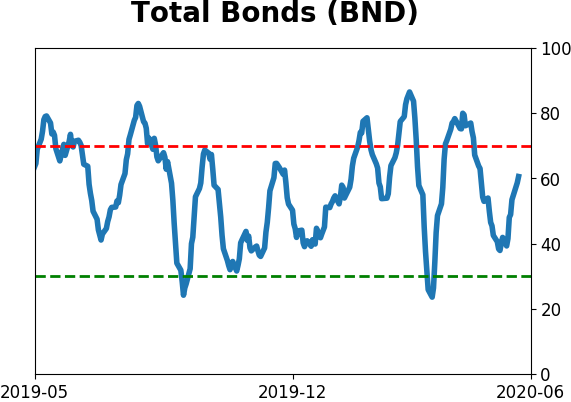
Bond ETF's - 10-Day Moving Average
|
|
|
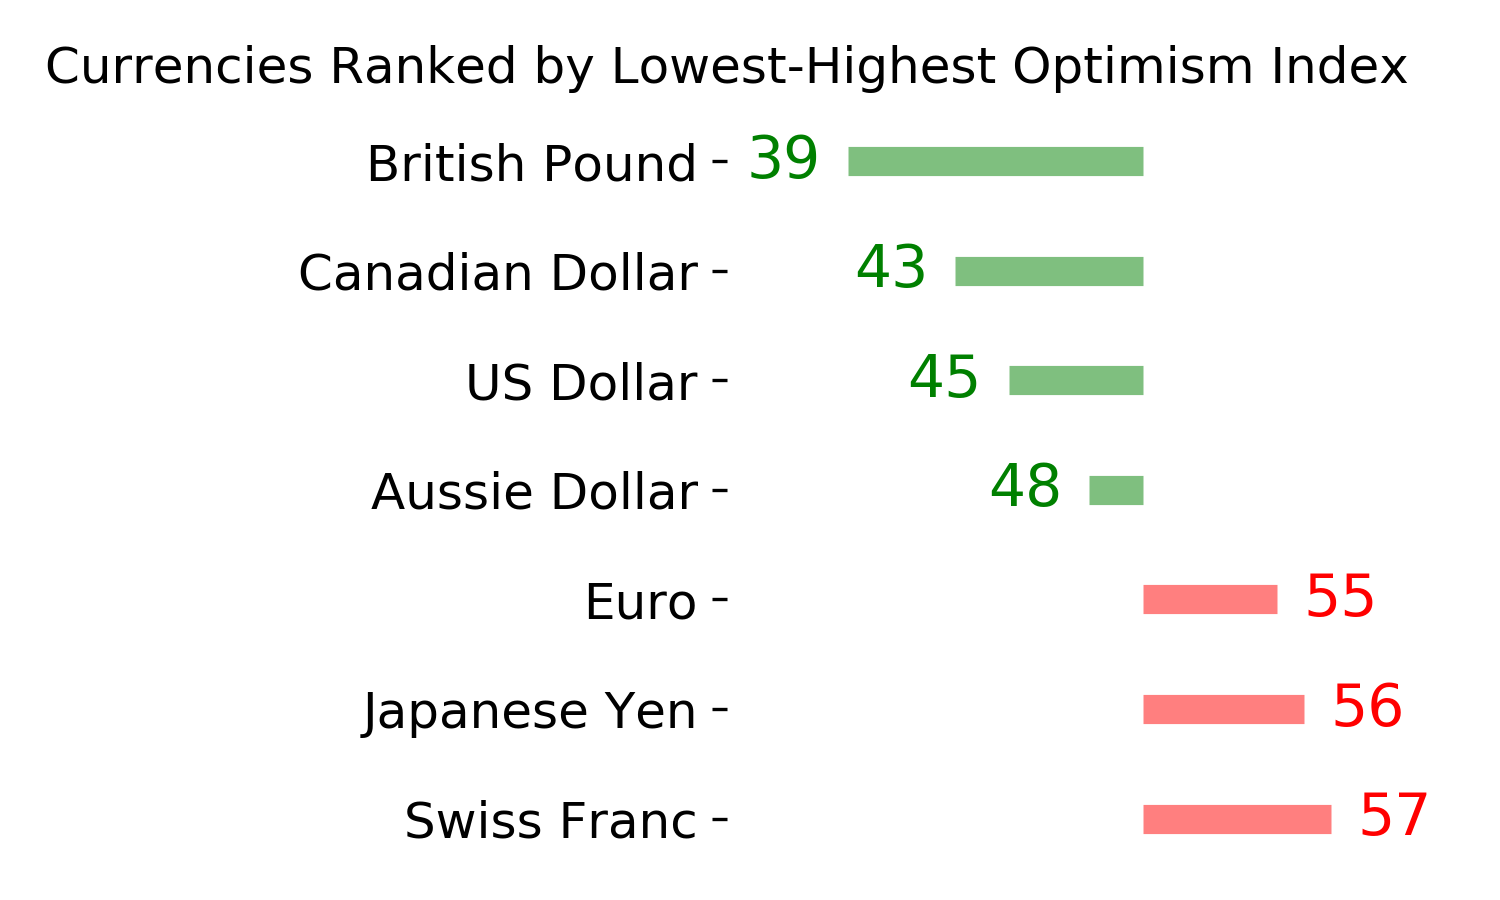
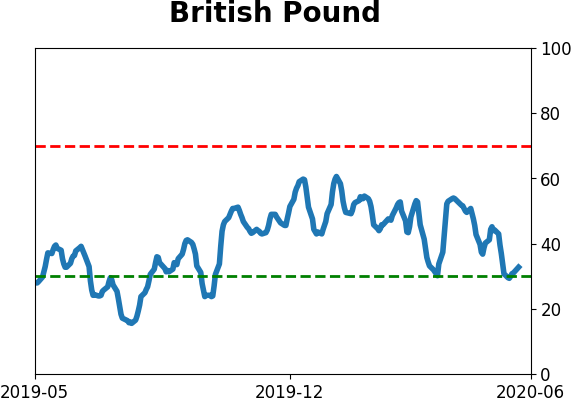
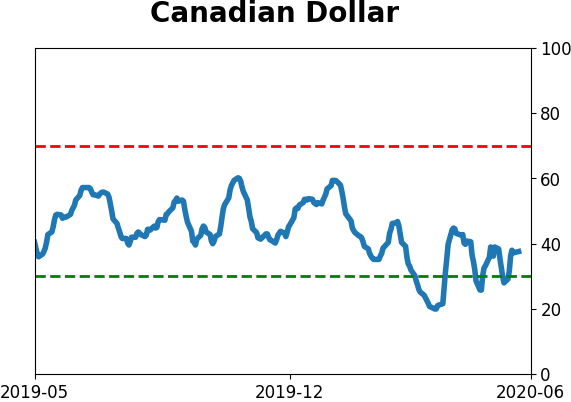
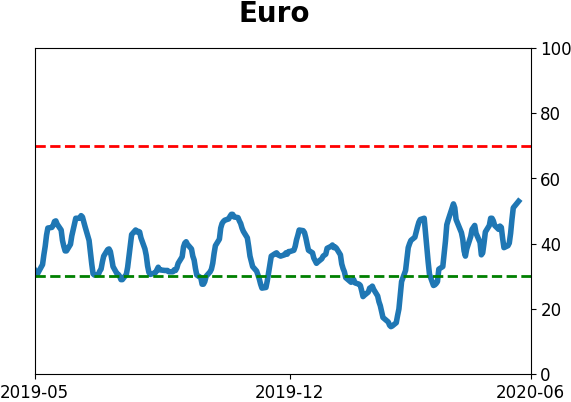
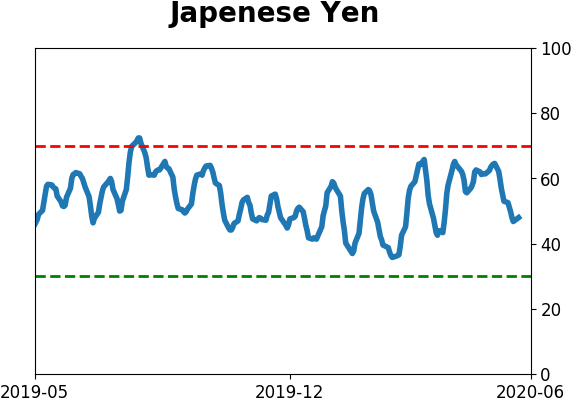
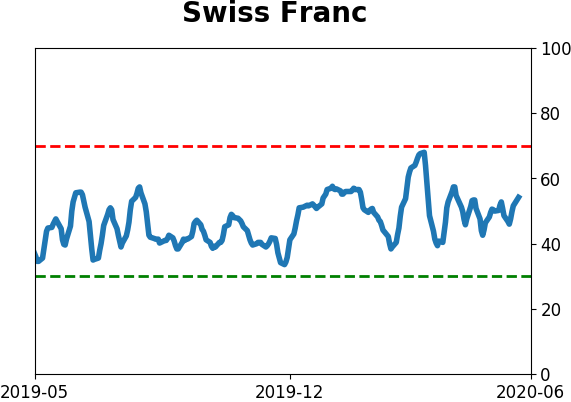
Currency ETF's - 5-Day Moving Average
|
|
|
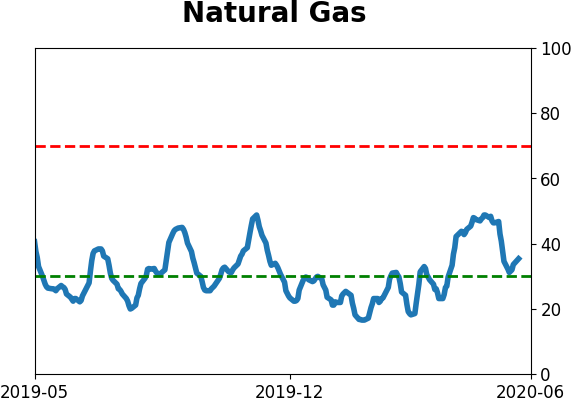
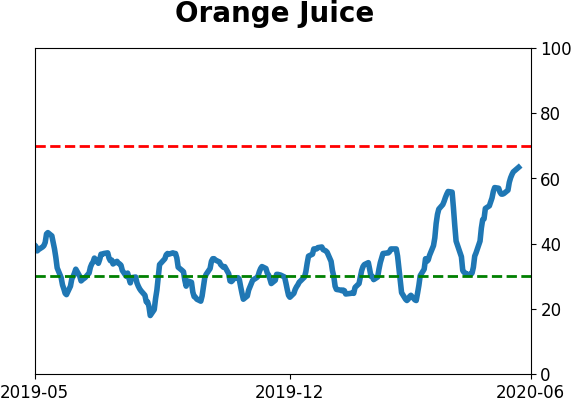
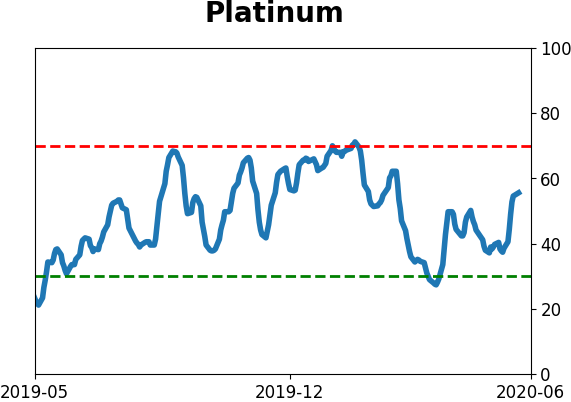
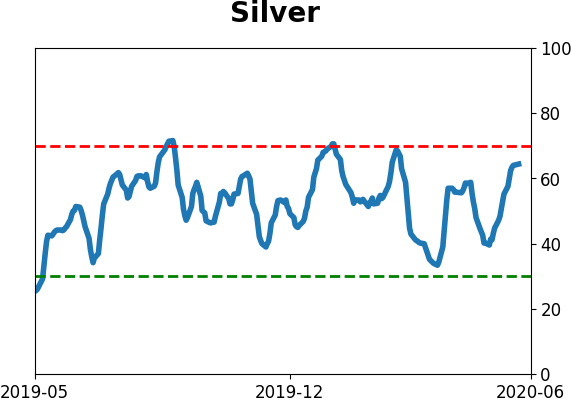
Commodity ETF's - 5-Day Moving Average
|
|