Headlines
|
|
Why Bitcoin's Volatility is Not a Good Sign:
Bitcoin has plunged below its 200-day moving average, ending its 3rd-longest streak above. That helped trigger one of the biggest-ever spikes in a synthetic VIX for the coin. There are signs of short-term pessimism, but this kind of volatility has had a negative history for bitcoin.
Bottom Line:
See the Outlook & Allocations page for more details on these summaries STOCKS: Hold
The speculative frenzy in February is wrung out. Internal dynamics have mostly held up, with some exceptions. Many of our studies still show a mixed to poor short-term view, with medium- and long-term ones turning more positive. BONDS: Hold
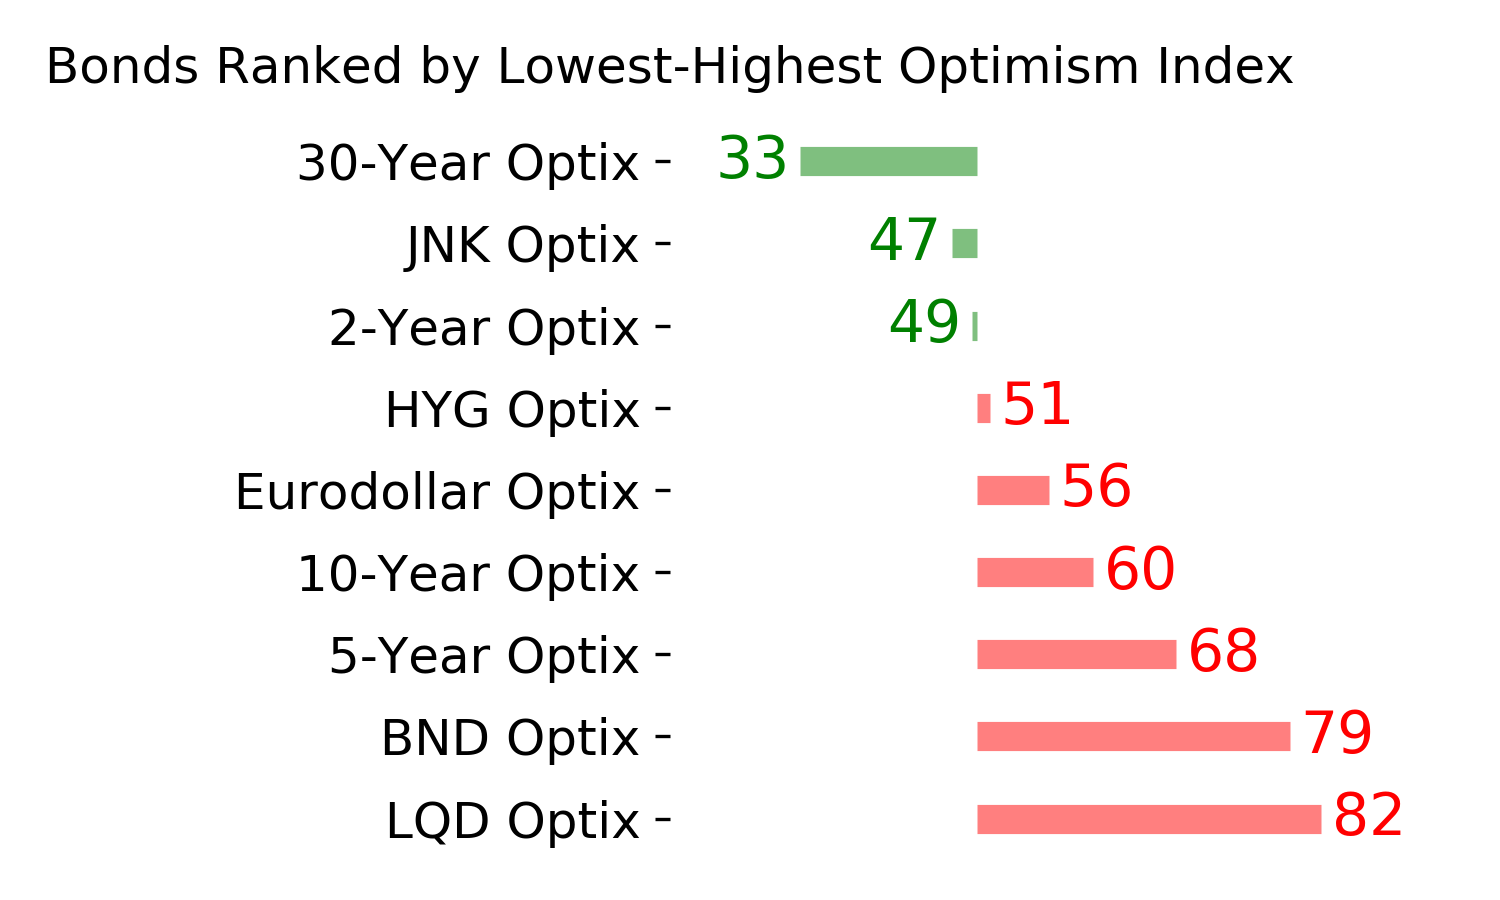
Various parts of the market got hit in March, with the lowest Bond Optimism Index we usually see during healthy environments. After a shaky couple of weeks, the broad bond market has modestly recovered. Not a big edge here either way. GOLD: Hold
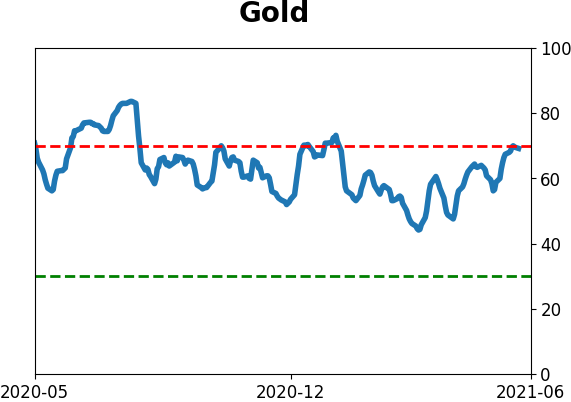
Gold and miners have done very well, recovering above long-term trend lines. The issue is that both have tended to perform poorly after similar situations - will have to wait and see how it plays out.
|
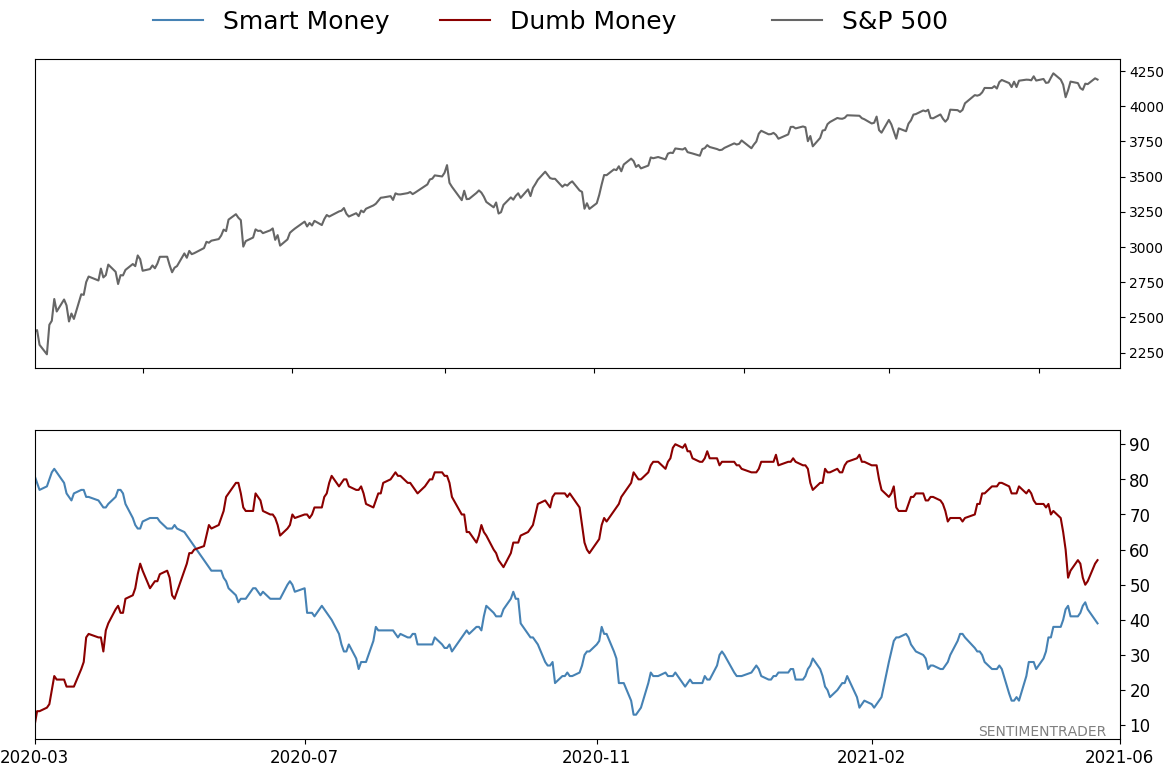
Smart / Dumb Money Confidence
|
Smart Money Confidence: 39%
Dumb Money Confidence: 57%
|
|
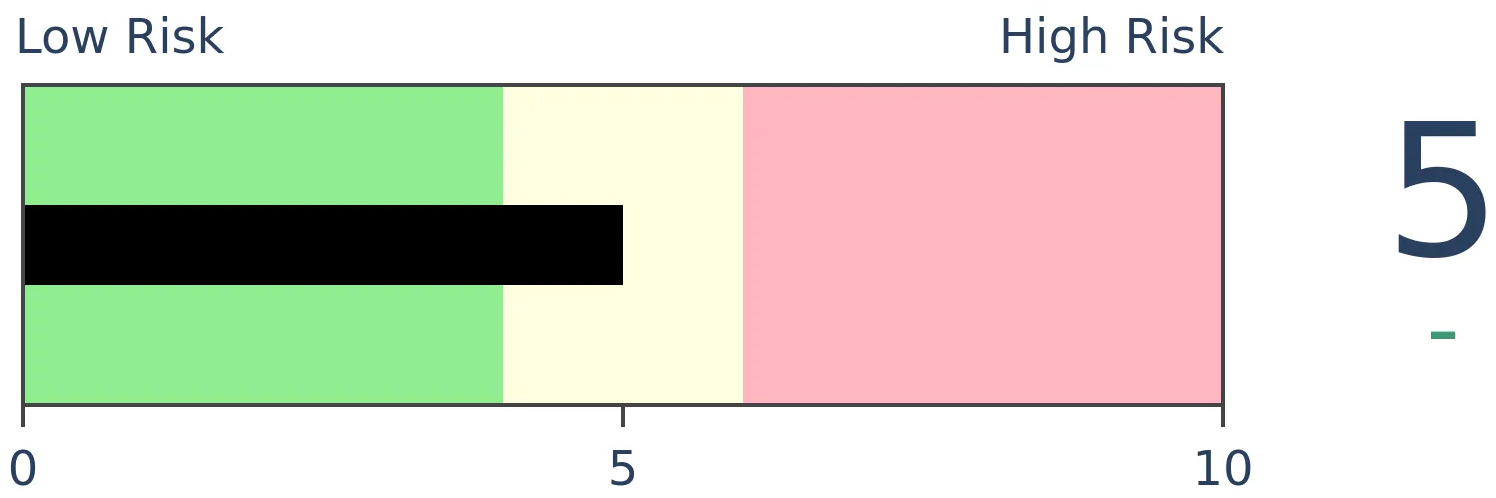
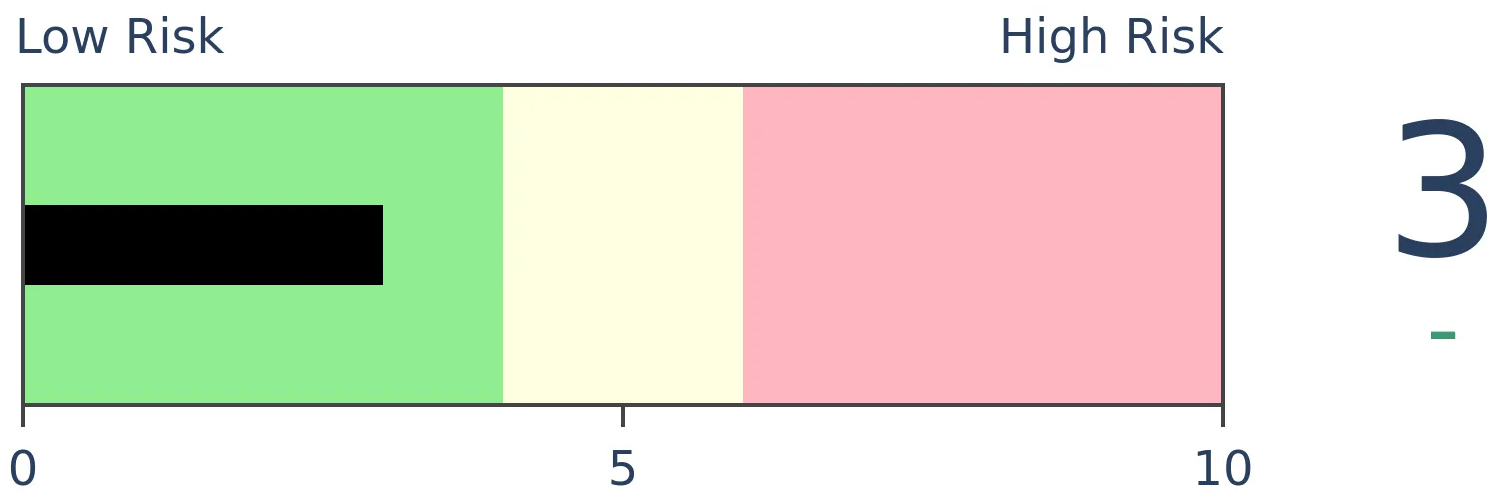
Risk Levels
Stocks Short-Term
|
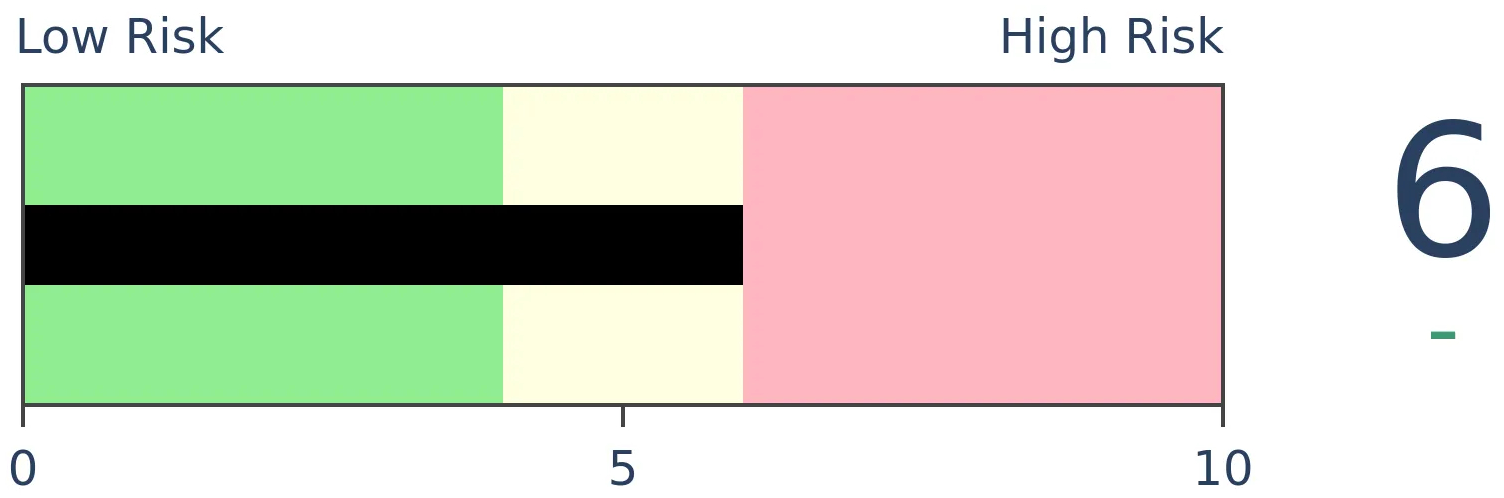
Stocks Medium-Term
|
|
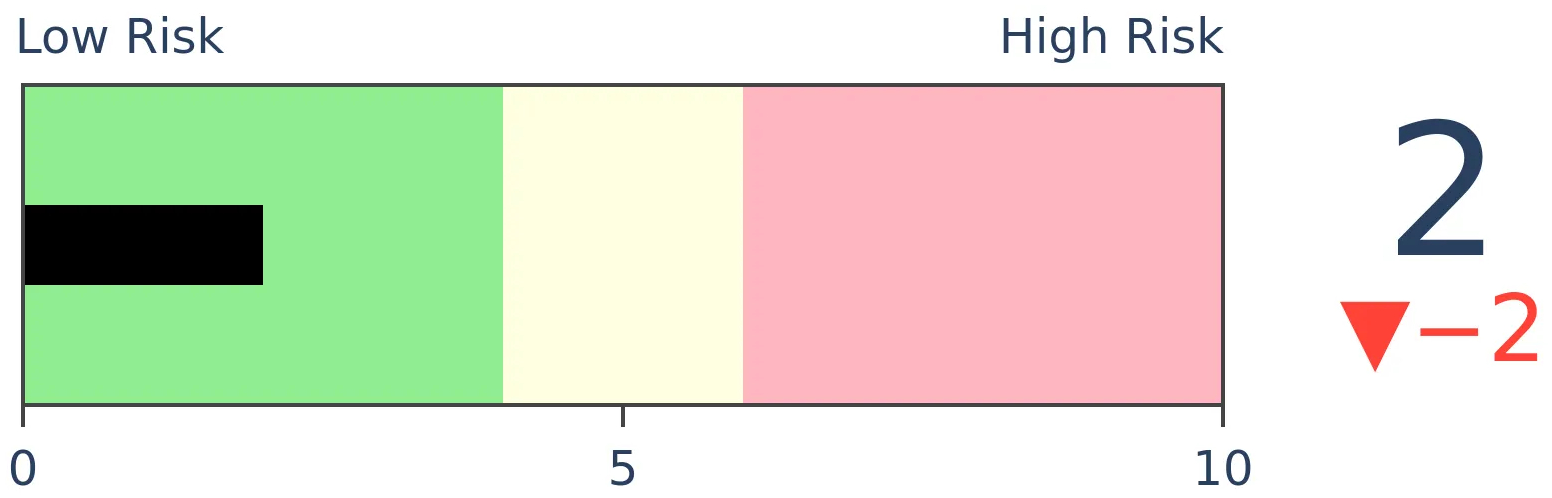
Bonds
|
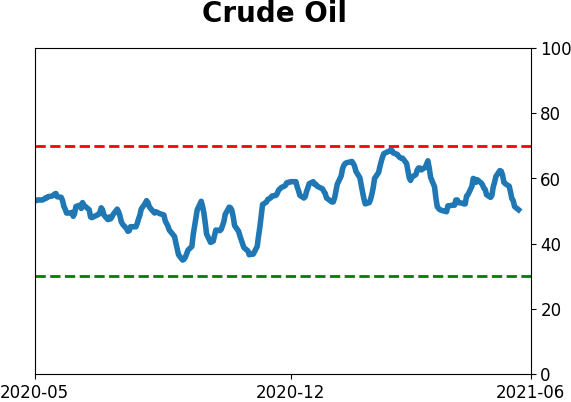
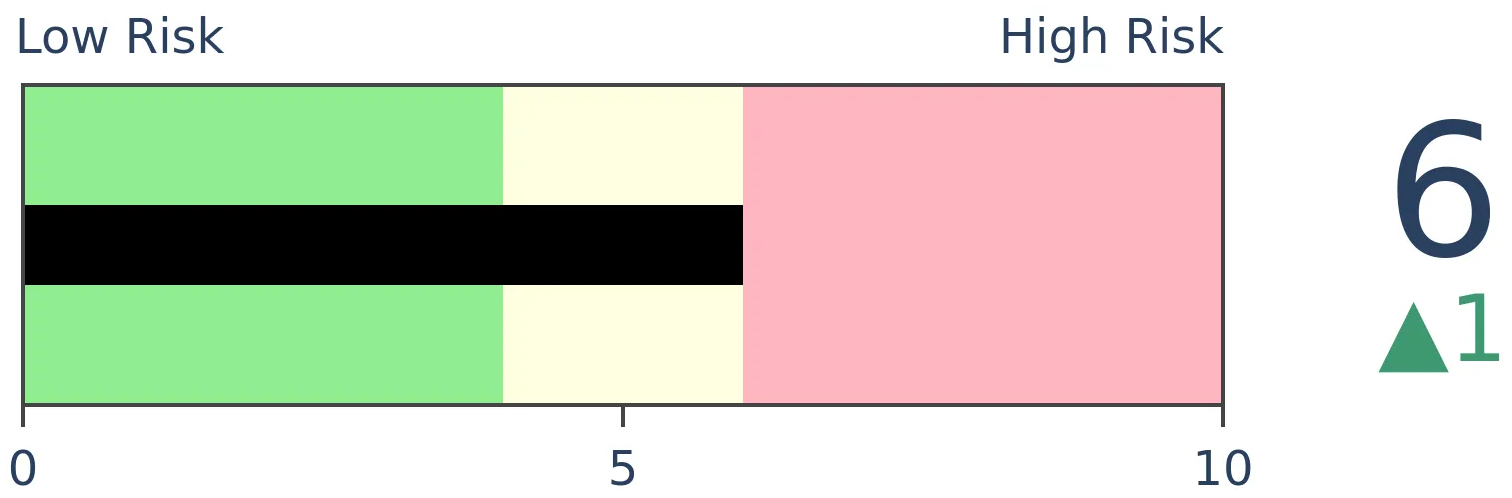
Crude Oil
|
|
Gold
|
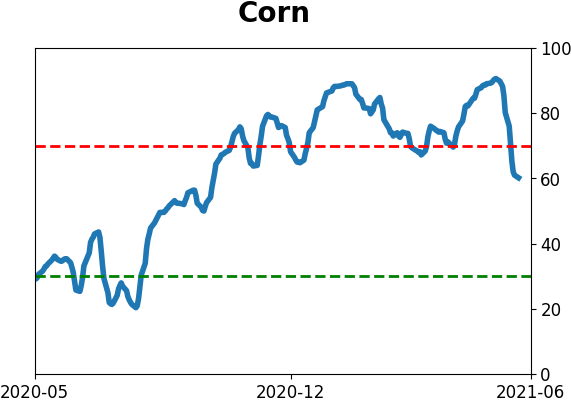
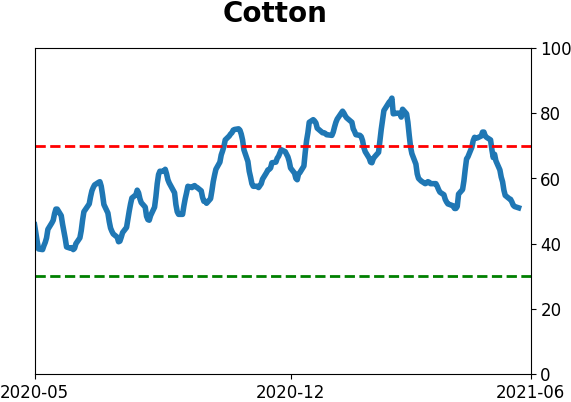
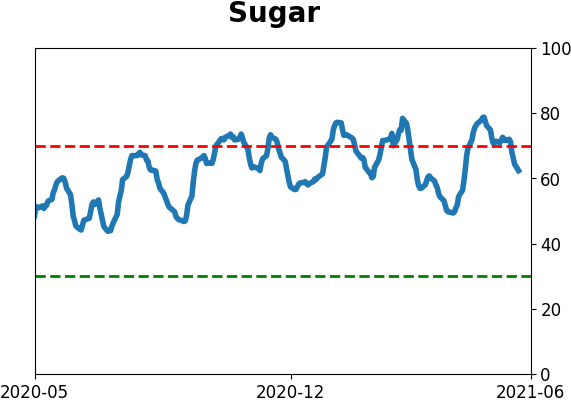
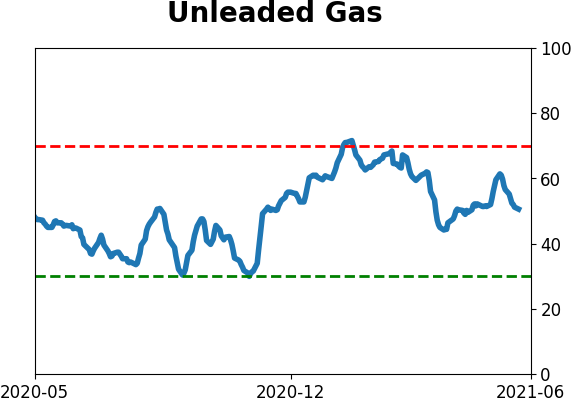
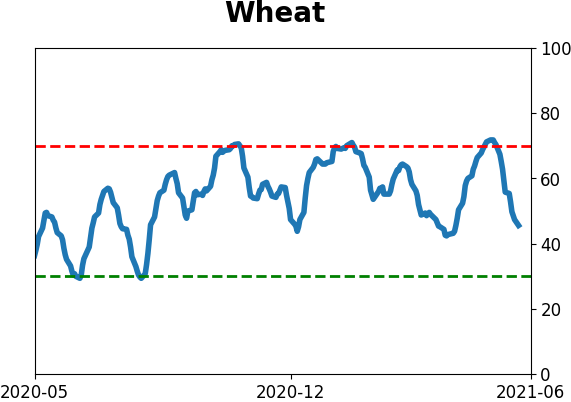
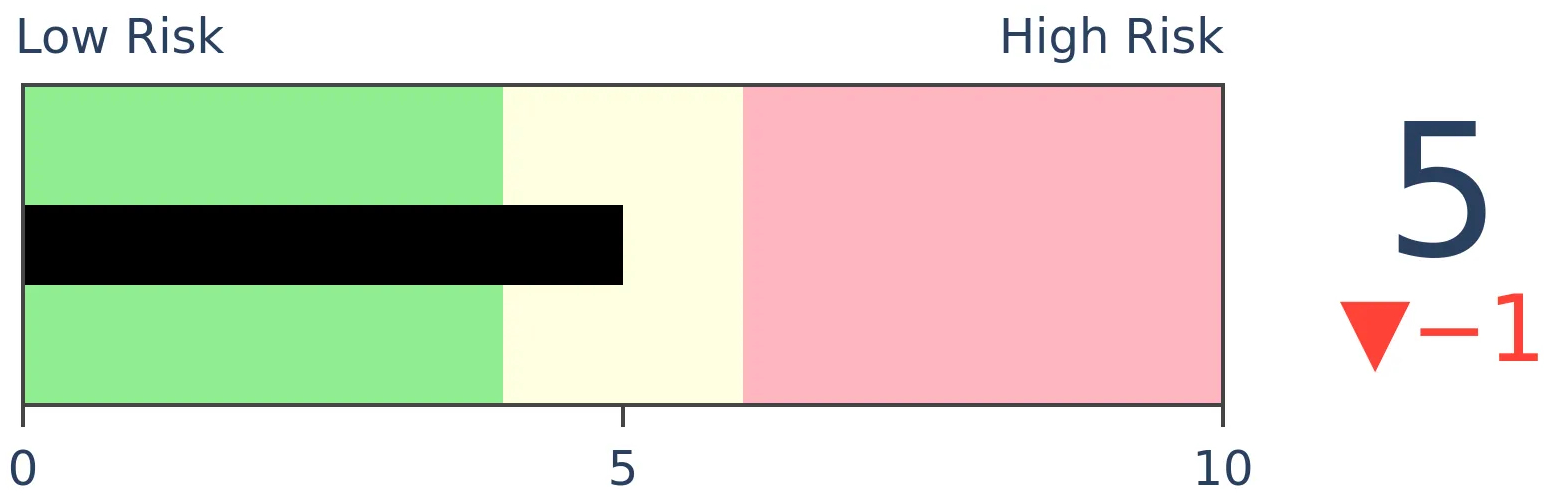
Agriculture
|
|
Research
BOTTOM LINE
Bitcoin has plunged below its 200-day moving average, ending its 3rd-longest streak above. That helped trigger one of the biggest-ever spikes in a synthetic VIX for the coin. There are signs of short-term pessimism, but this kind of volatility has had a negative history for bitcoin.
FORECAST / TIMEFRAME
BITCOIN -- Down, Long-Term
|
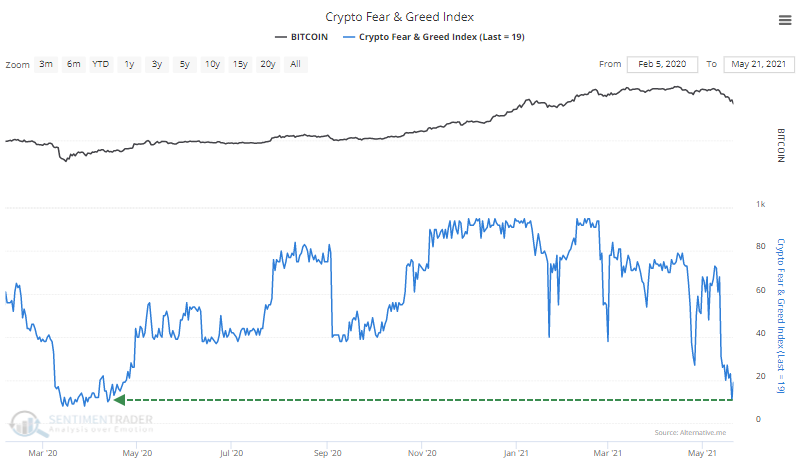
Cryptocurrencies have had one of the most explosive weeks in years.
After a plunge, recovery, plunge, and another recovery, traders became pessimistic enough to push the Crypto Fear & Greed model below 12%, the lowest in over a year.
Created by Alternative.me, the index is calculated from six factors, paraphrased below:
- Volatility (25%) - The current volatility and maximum drawdown of bitcoin.
- Market Momentum/Volume (25%) - Current volume and market momentum.
- Social Media (15%) - Twitter posts on various hashtags for Bitcoin are counted and measured for interactions.)
- Surveys (15%) - A weekly crypto poll.
- Dominance (10%) - Measuring the market cap share of Bitcoin relative to the entire market.
- Trends (10%) - Google Trends data for various Bitcoin-related search queries, looking at search volumes change.
With such a fast-moving market, it's almost impossible to stay on top of extremes, especially with a market that trades 24 hours a day. The model first dipped below 12 late last week, and already the moves in bitcoin have been among the most extreme among any days since the model's inception in 2018.
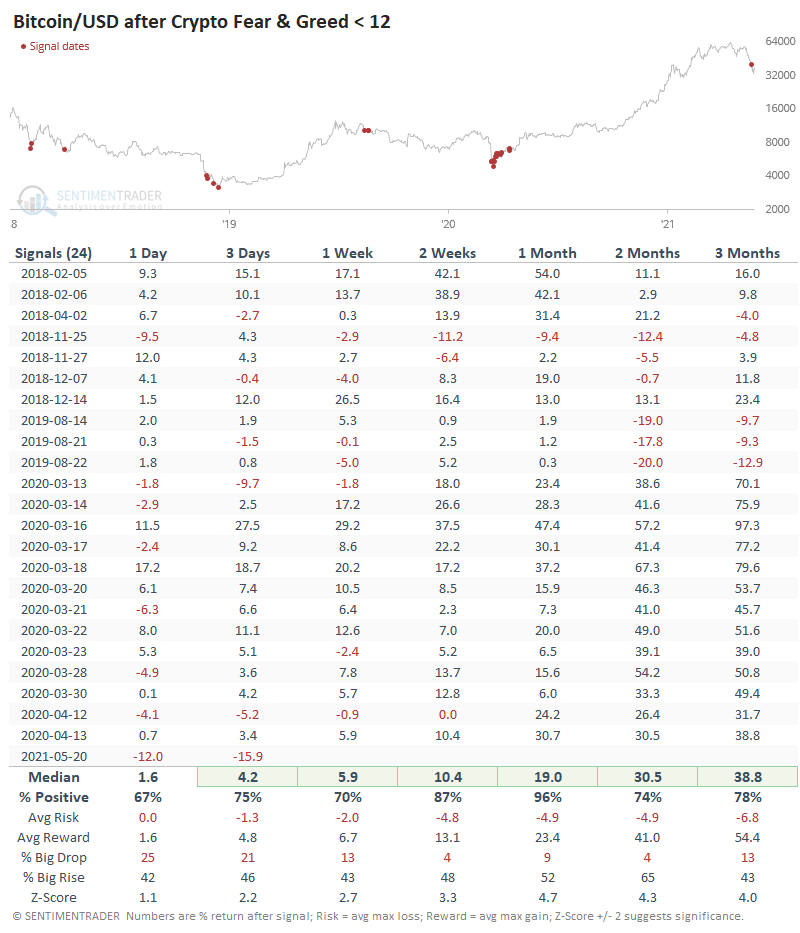
Even after pessimism hit an extreme late last week, bitcoin plunged further, more than any other date, though it has since made up most of those losses. Bitcoin rallied over the next month following 23 out of the 24 other days when Fear & Greed dropped below 12.
Ethereum, too, has shown moves far beyond any other day when crypto optimism dropped to such a low level.
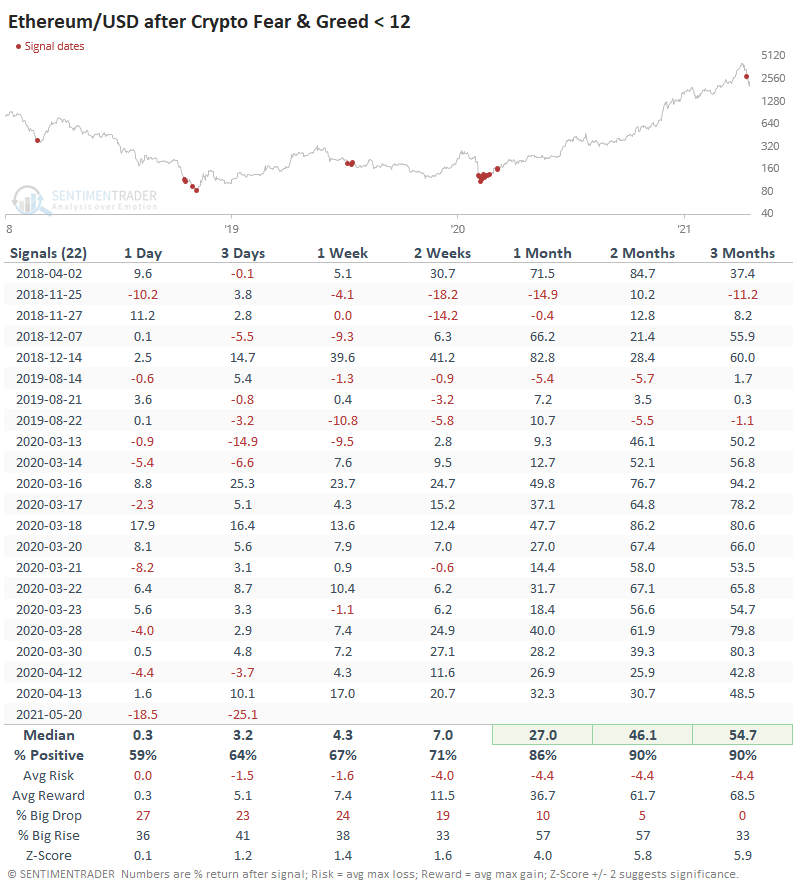
Like bitcoin, the initial reaction was more severe than any other day, but any losses tended to be reversed in the month(s) ahead.
More than any other factor, volatility drives sentiment, especially in this market. So if we focus on that, we can get a handle on similar conditions, if there are any.
One of the better ways to do this is to use the same calculations to create a synthetic VIX for stocks, which we last discussed in July. The calculation is based on five different models using open-high-low-close data.
- Parkinson High-Low Model
- Garman-Klass Volatility Model
- Garman-Klass YZ Estimator Model
- Rogers-Satchell Volatility Model
- Yang-Zhang Volatility Model
This isn't as clean for crypto because there isn't necessarily a good cutoff point to determine trading sessions. We rely on Bloomberg's data of the Bitcoin/USD cross rate to determine session times.
When we use these models to craft a synthetic VIX, it spits out a number that has been matched few times in bitcoin's history, at just over 200%.
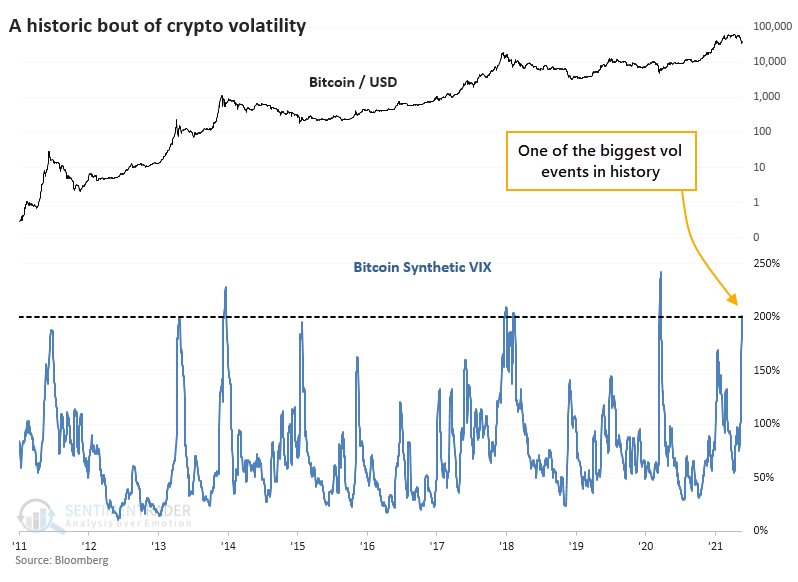
There have been six other times when volatility exploded like this. Forward returns in bitcoin were do-or-die, and mostly the latter.
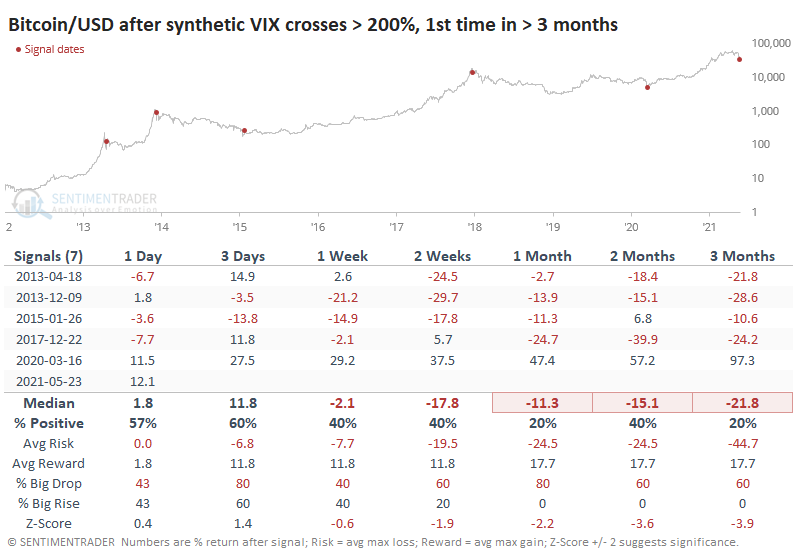
The only time that a volatility event like this marked a bottom was in March 2020, at the height of pandemic-related liquidations. That came after eight months of selling pressure, while this one did not - crypto markets were hitting record highs only a month ago.
There were three other times when bitcoin was recently at a peak, and then volatility spiked, in April and December 2013, then again in December 2017. All three preceded large and persistent losses for the coin.
This volatility has pushed bitcoin below its 200-day average. The annualized returns on the coin are ridiculous, but at least we can see that it's been "trendy" with much higher returns when above average than below. That seems tautological, but not all markets are like this.
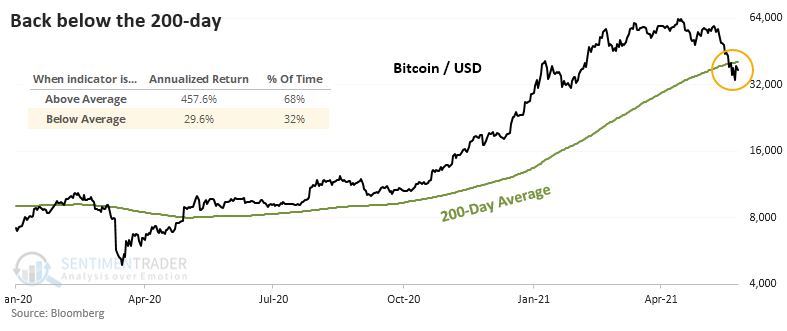
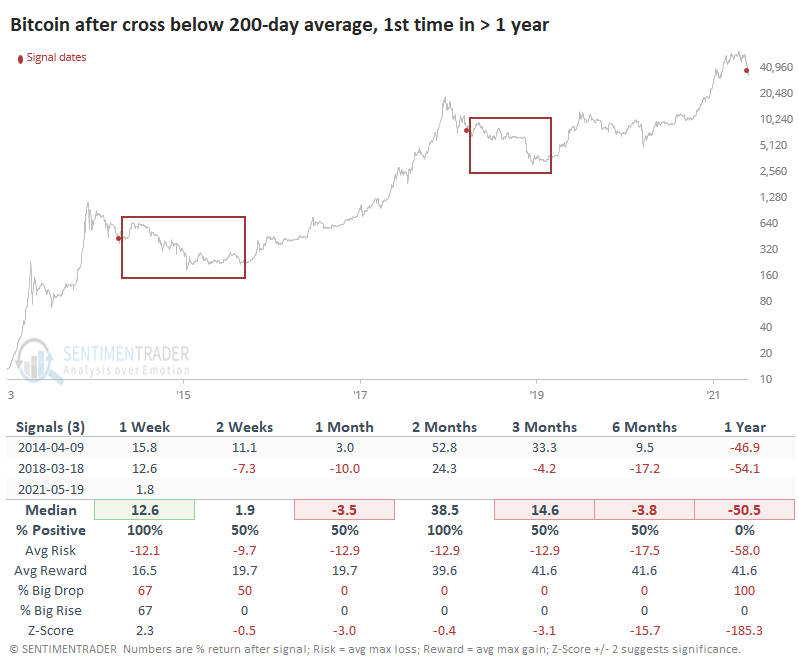
Thus ends the coin's 3rd-longest streak above its 200-day average.

After the ends of the other two longest streaks, the next year or so was...uncomfortable. So much for diamond hands and laser eyes.
The spike in volatility due to the crash last week punctured the bubble of optimism surrounding crypto in general and pushed most measures, like our Bitcoin Optimism Index and others, to the lowest levels in years, or nearly so. Other times we've seen that bitcoin has typically rebounded.
The biggest "but" is that usually, we've seen that kind of pessimism after many months of declines. When we see it due to a sudden volatility event quickly following new highs in crypto, it's been during long-term topping events. The end of the streak above the 200-day average, and the gigantic spike in volatility, are not good signs if history is any kind of a guide at all here. We'd put more weight on that than the shorter-term signs of fear.
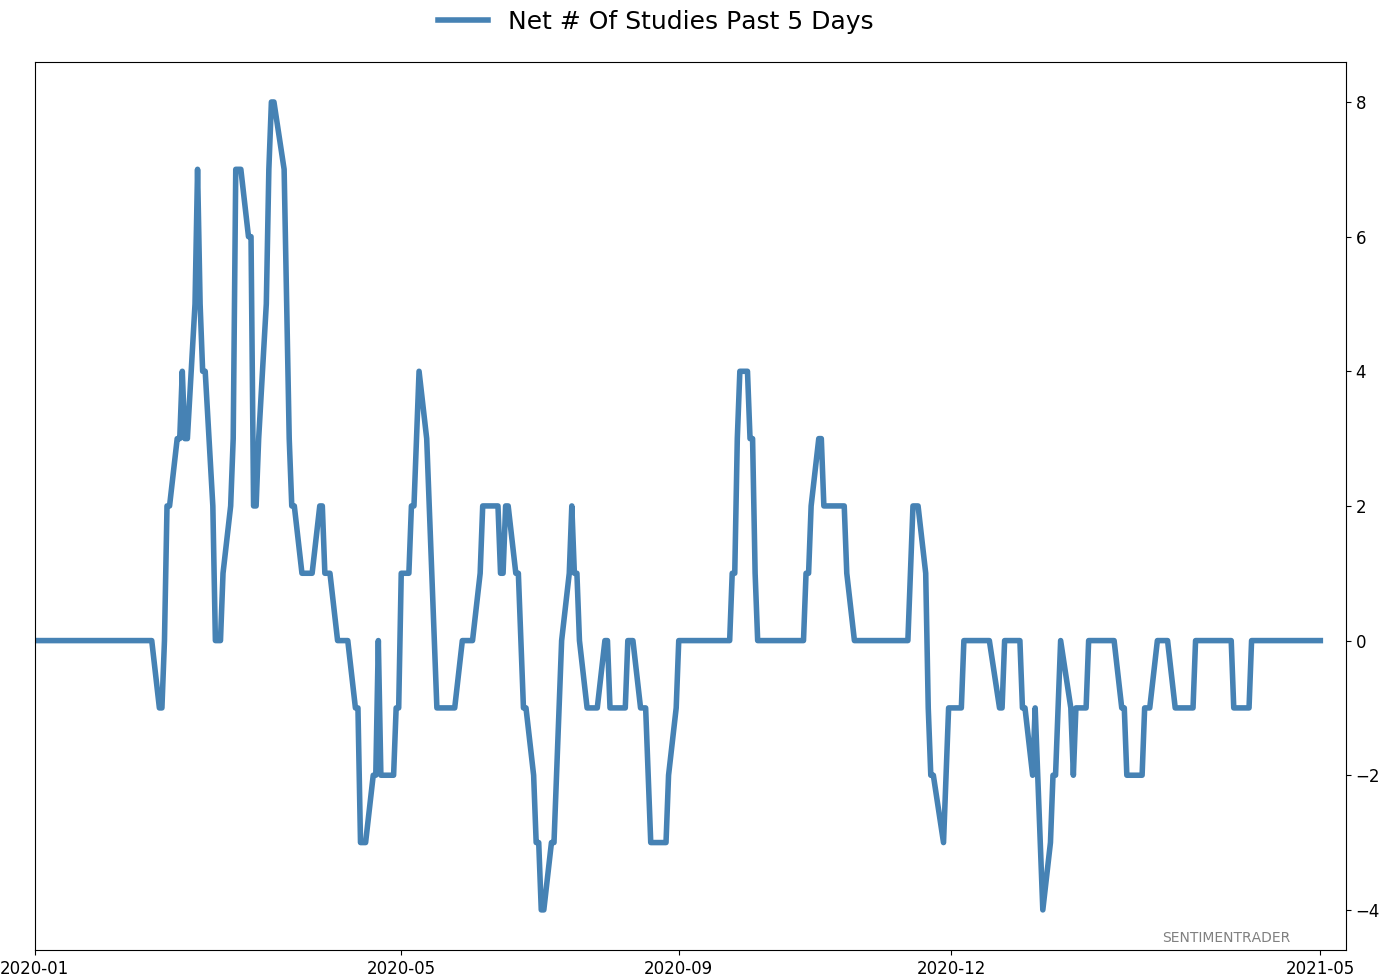
Active Studies
| Time Frame | Bullish | Bearish | | Short-Term | 0 | 0 | | Medium-Term | 1 | 11 | | Long-Term | 11 | 4 |
|
Indicators at Extremes
Portfolio
| Position | Description | Weight % | Added / Reduced | Date | | Stocks | RSP | 4.1 | Added 4.1% | 2021-05-19 | | Bonds | 23.9% BND, 6.9% SCHP | 30.8 | Reduced 7.1% | 2021-05-19 | | Commodities | GCC | 2.5 | Reduced 2.1%
| 2020-09-04 | | Precious Metals | GDX | 5.6 | Reduced 4.2% | 2021-05-19 | | Special Situations | 4.3% XLE, 2.2% PSCE | 7.2 | Reduced 5.6% | 2021-04-22 | | Cash | | 49.8 | | |
|
Updates (Changes made today are underlined)
Much of our momentum and trend work has remained positive for several months, with some scattered exceptions. Almost all sentiment-related work has shown a poor risk/reward ratio for stocks, especially as speculation drove to record highs in exuberance in February. Much of that has worn off, and most of our models are back toward neutral levels. There isn't much to be excited about here. The same goes for bonds and even gold. Gold has been performing well lately and is back above long-term trend lines. The issue is that it has a poor record of holding onto gains when attempting a long-term trend change like this, so we'll take a wait-and-see approach. RETURN YTD: 9.2% 2020: 8.1%, 2019: 12.6%, 2018: 0.6%, 2017: 3.8%, 2016: 17.1%, 2015: 9.2%, 2014: 14.5%, 2013: 2.2%, 2012: 10.8%, 2011: 16.5%, 2010: 15.3%, 2009: 23.9%, 2008: 16.2%, 2007: 7.8%
|
|
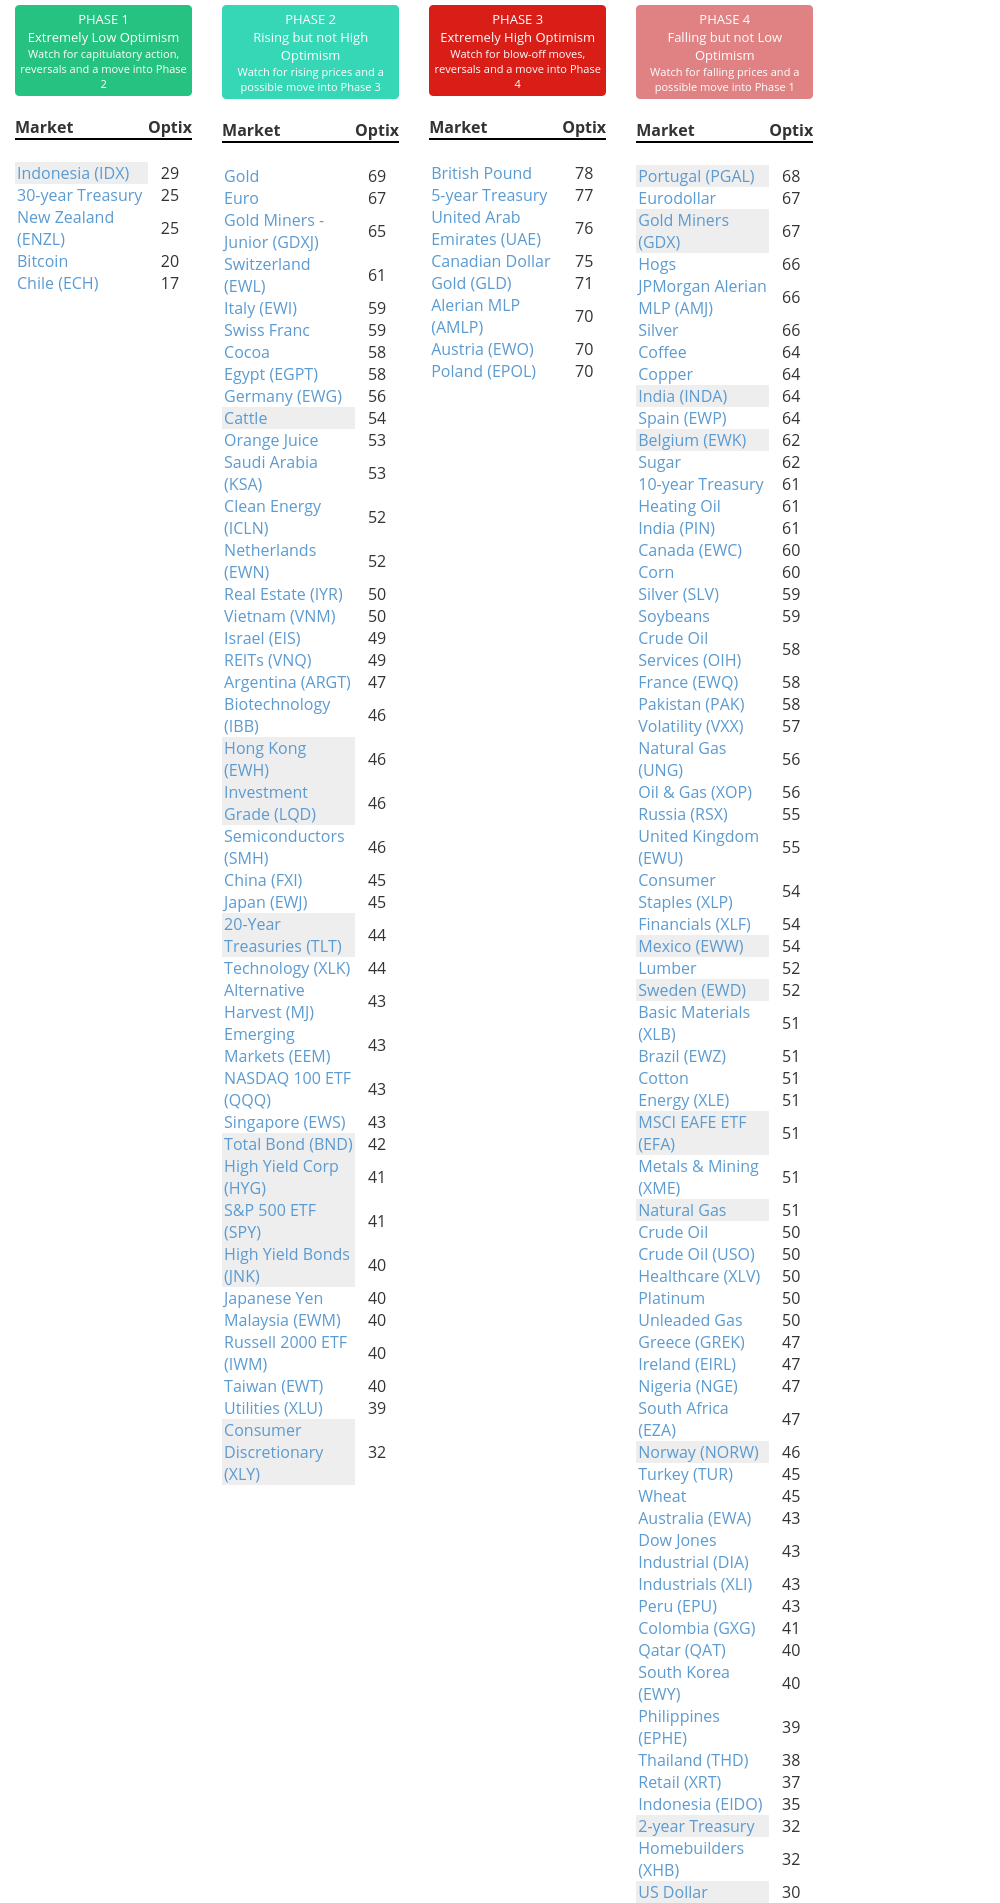
Phase Table
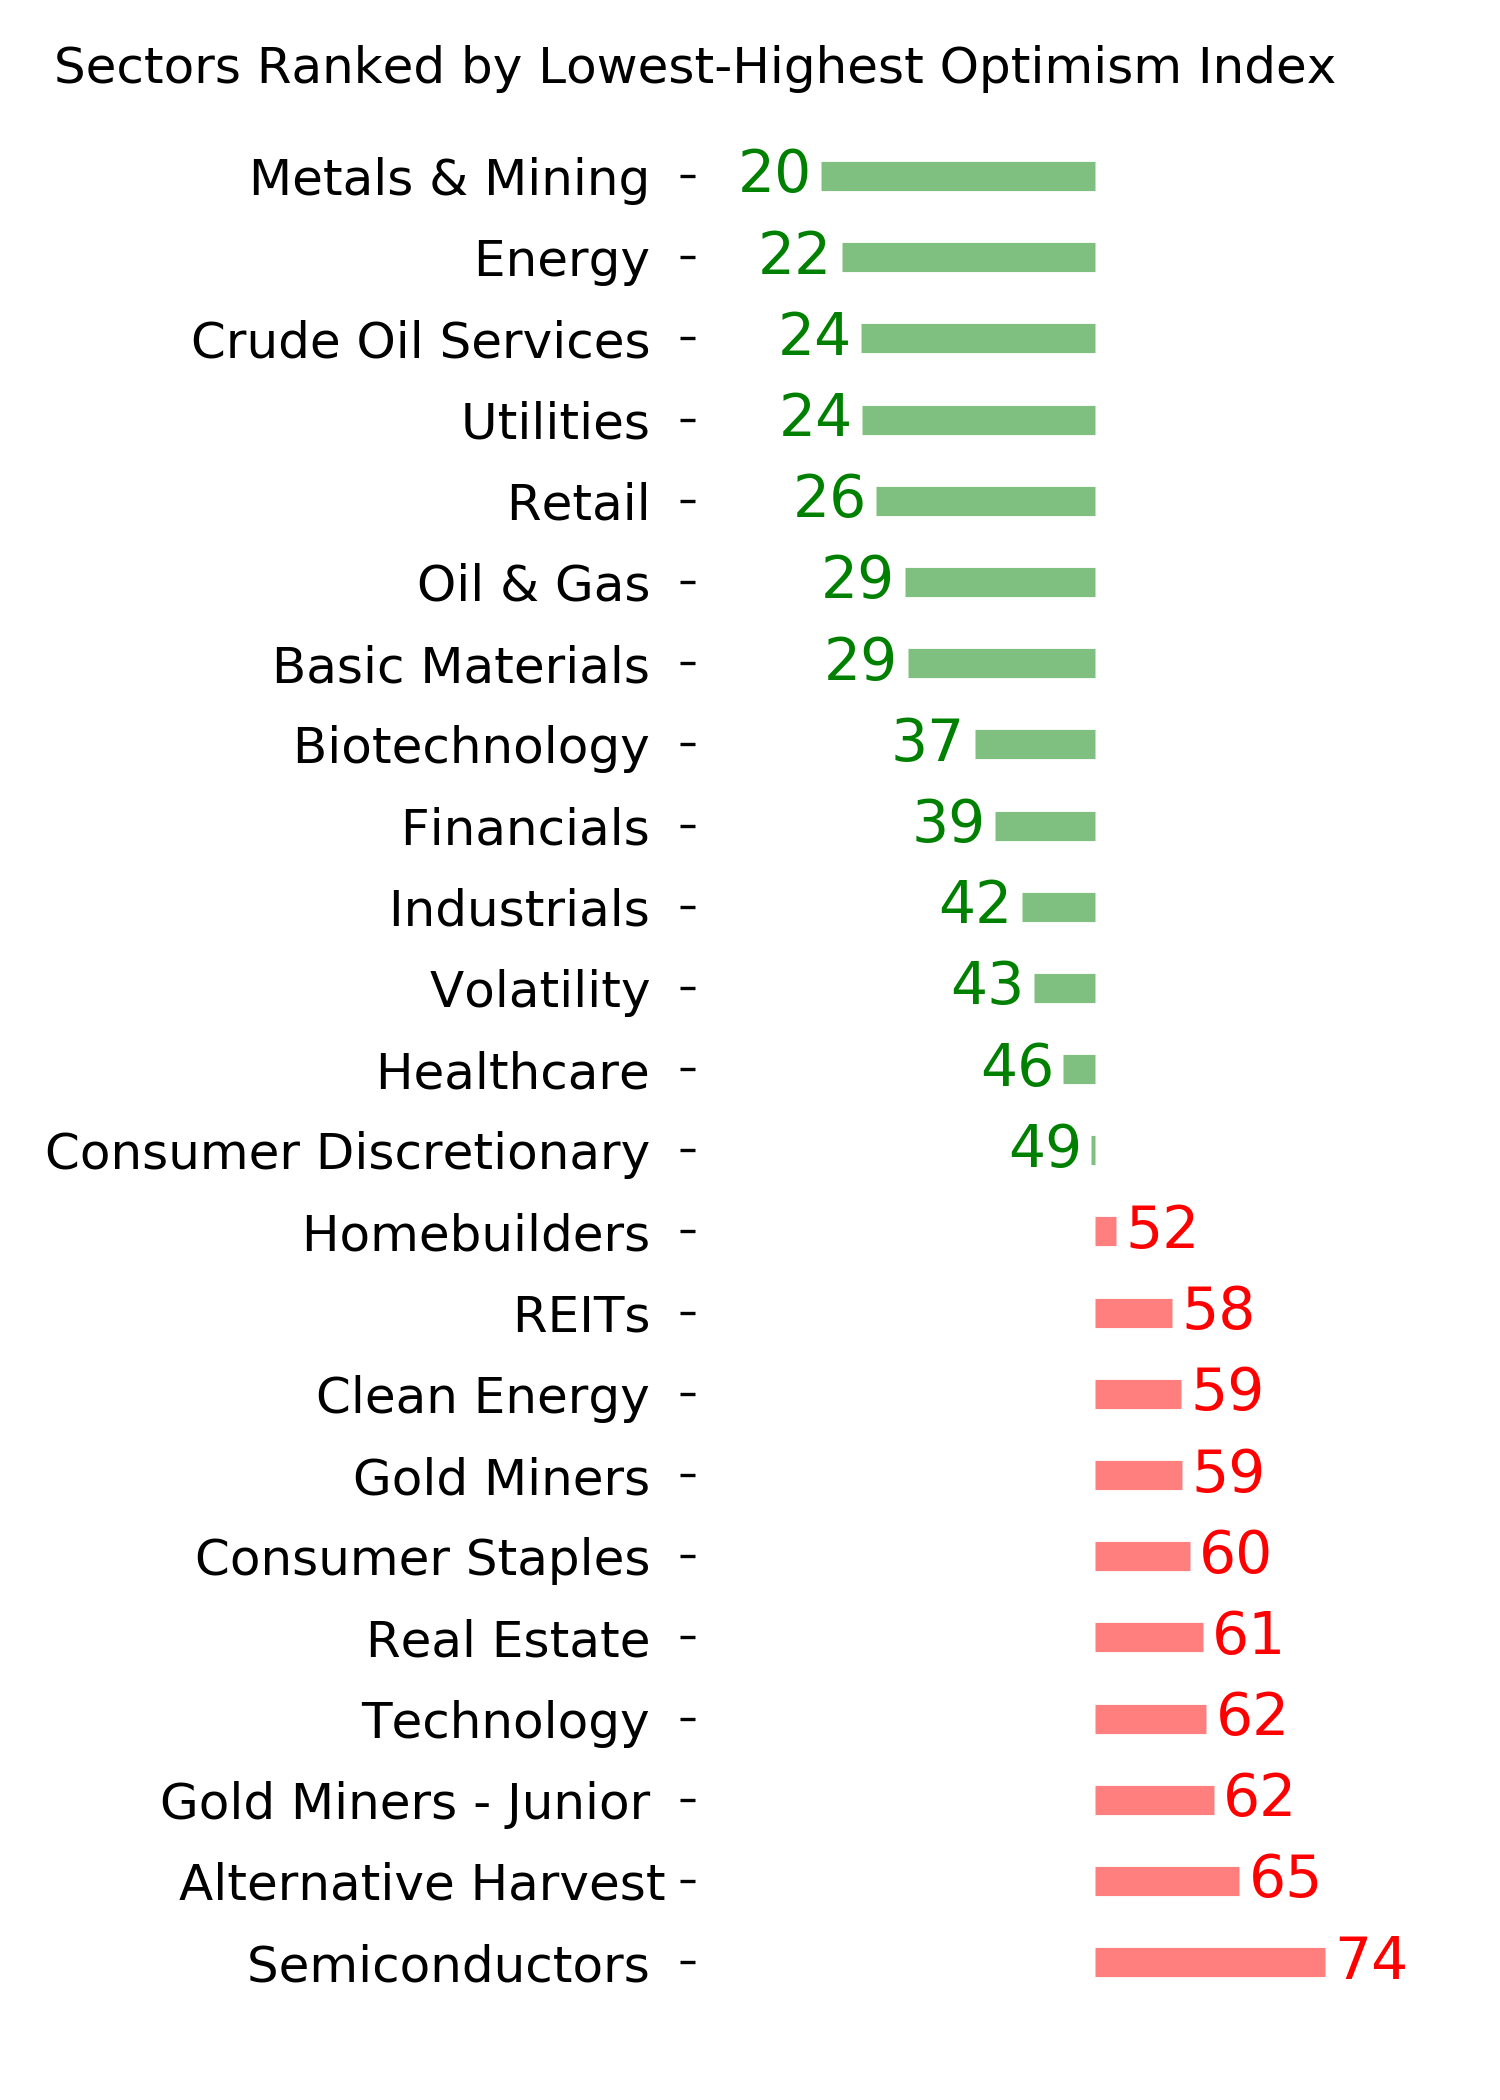
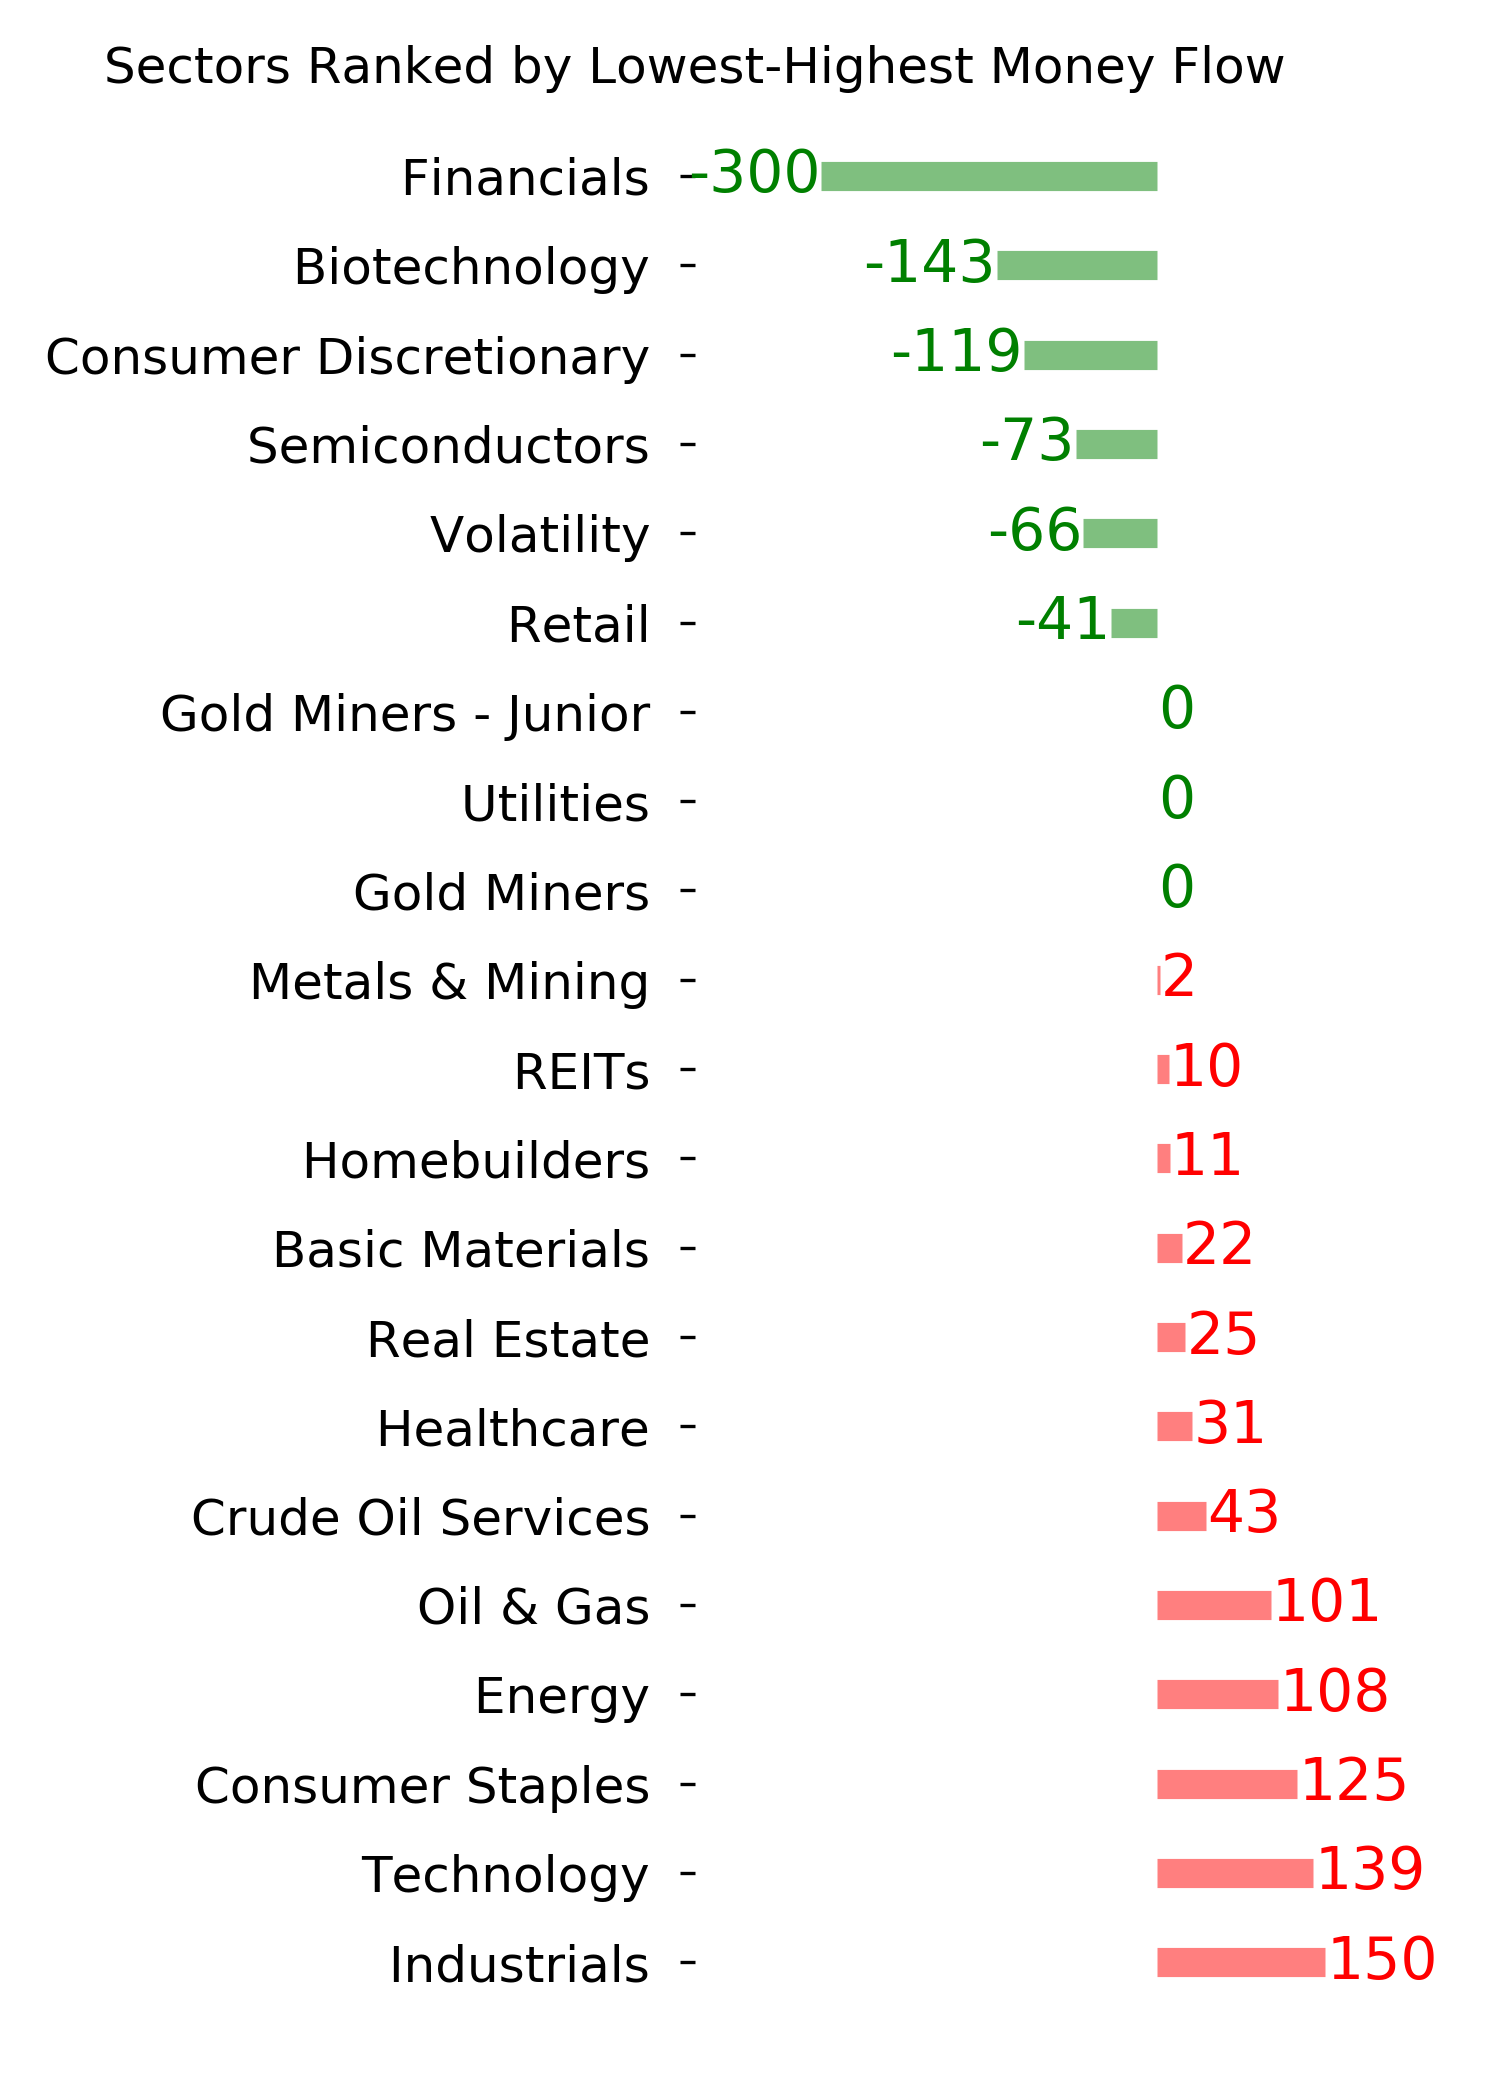
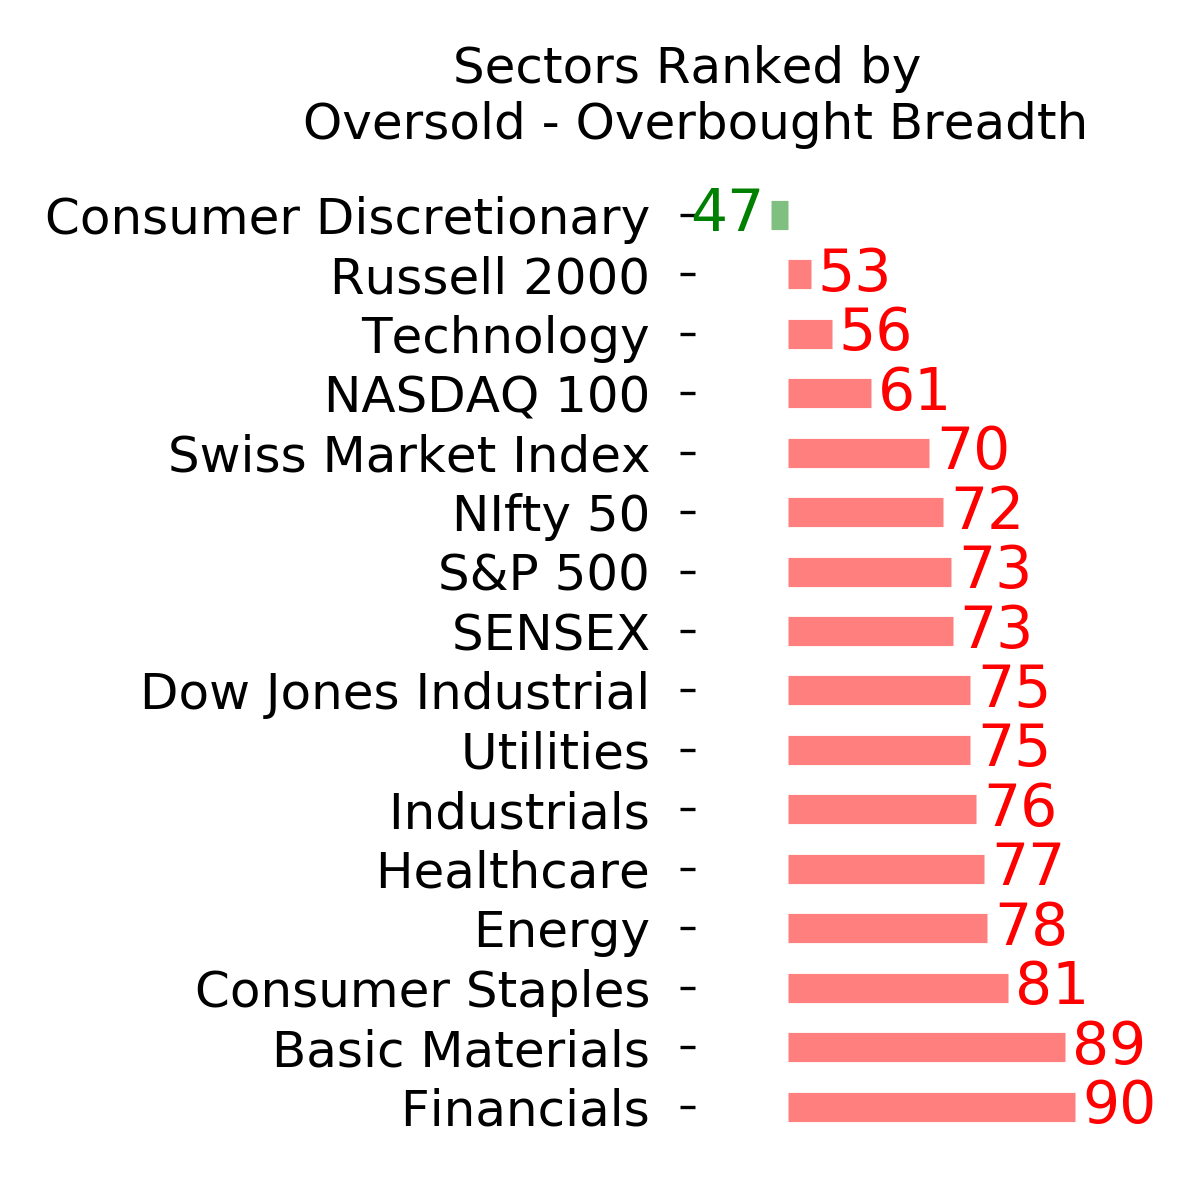
Ranks
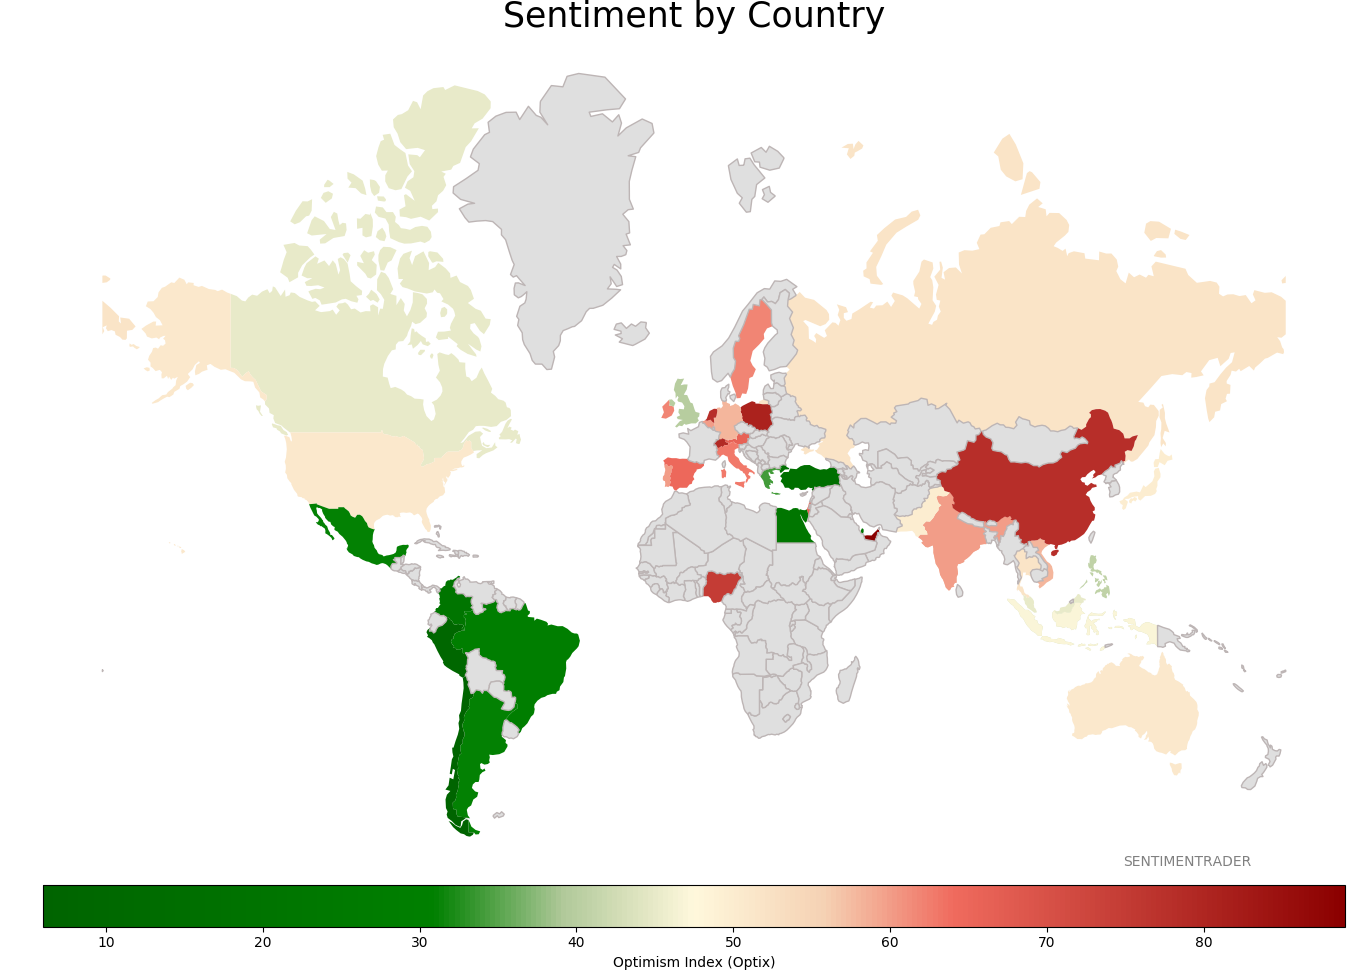
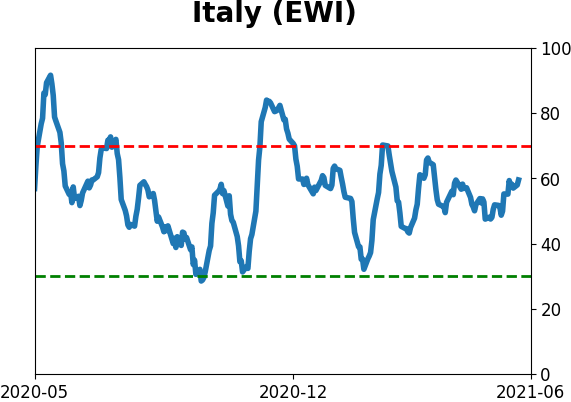
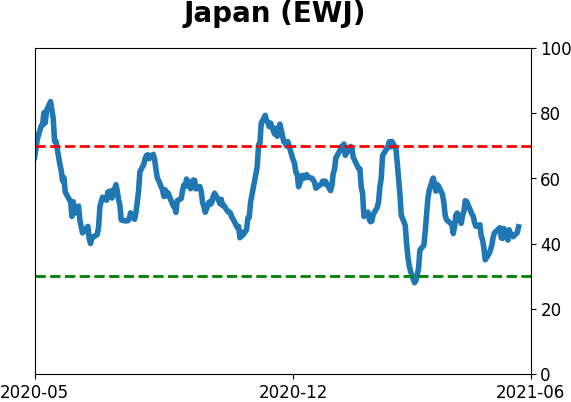
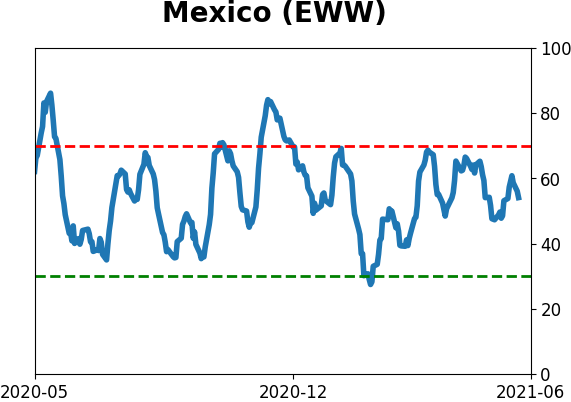
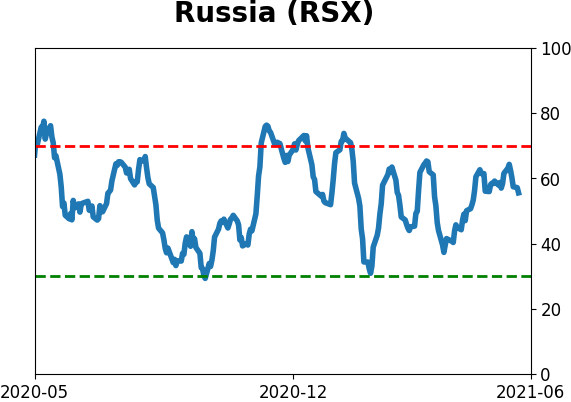
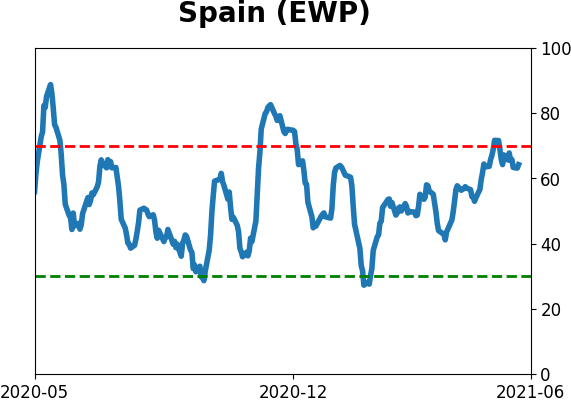
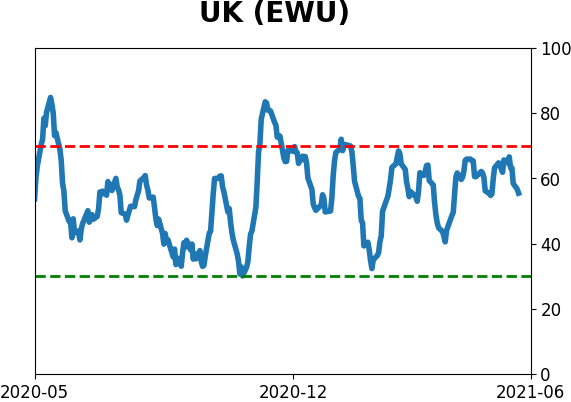
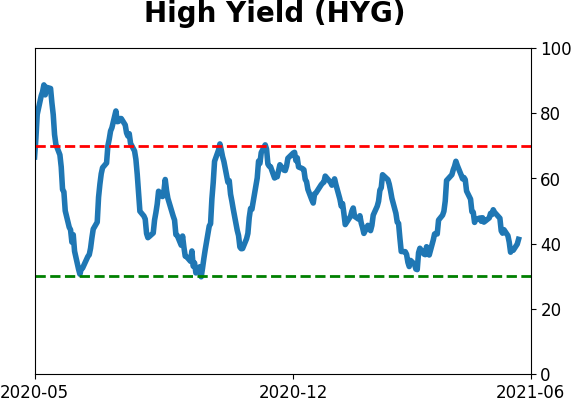
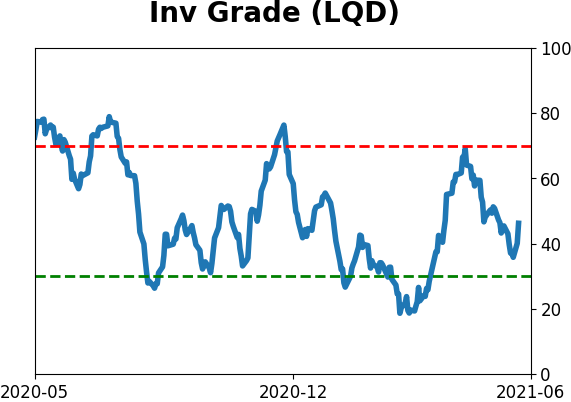
Sentiment Around The World
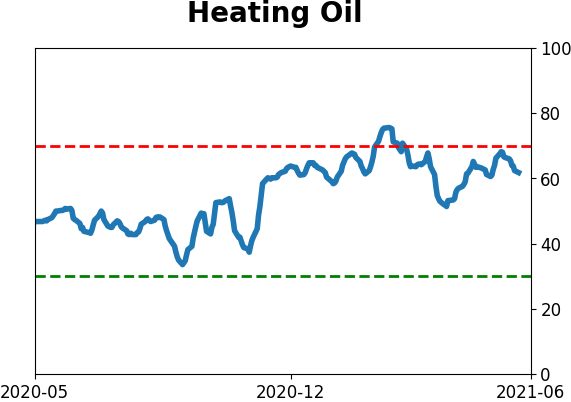
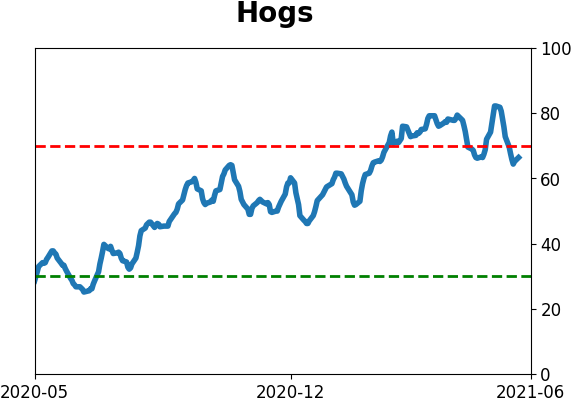
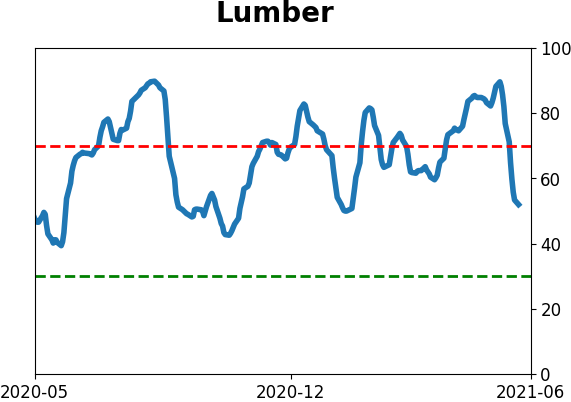
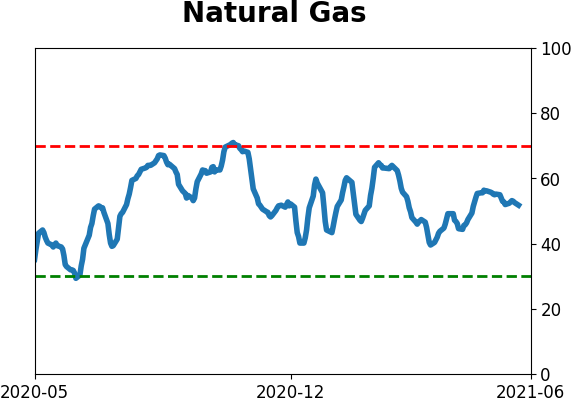
Optimism Index Thumbnails
|
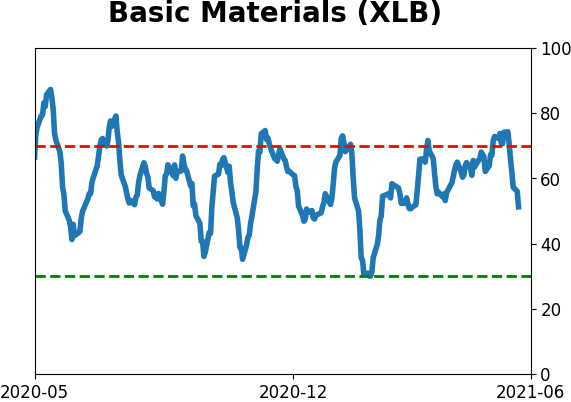
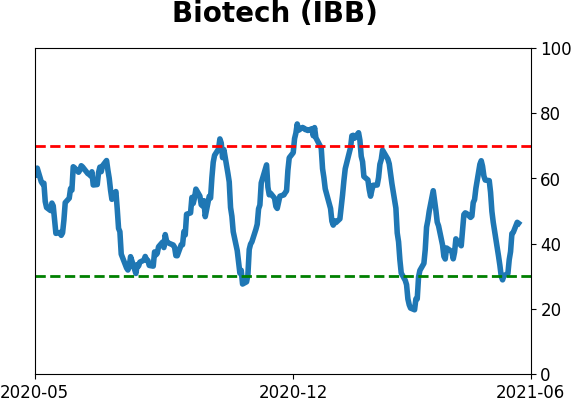
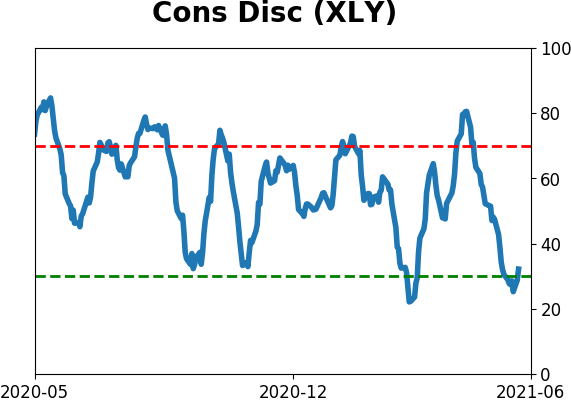
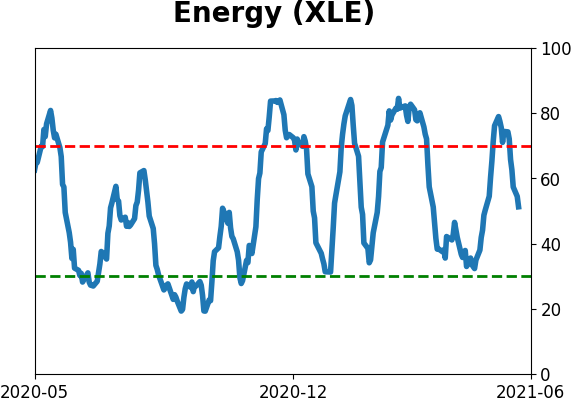
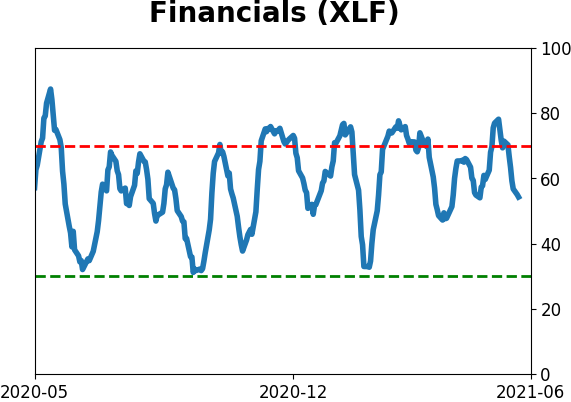
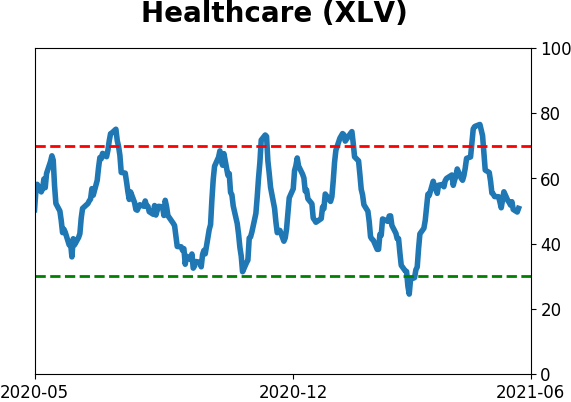
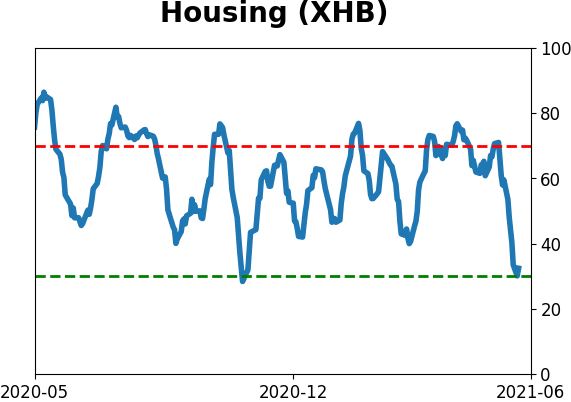
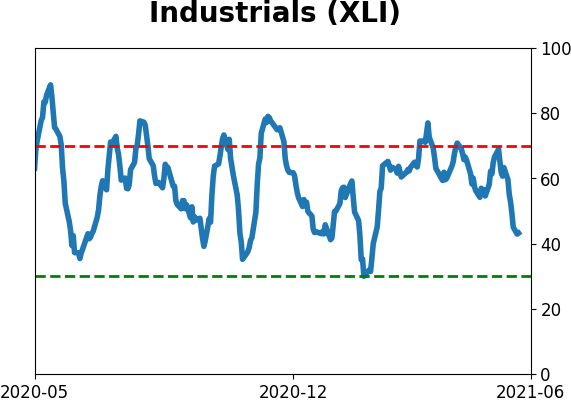
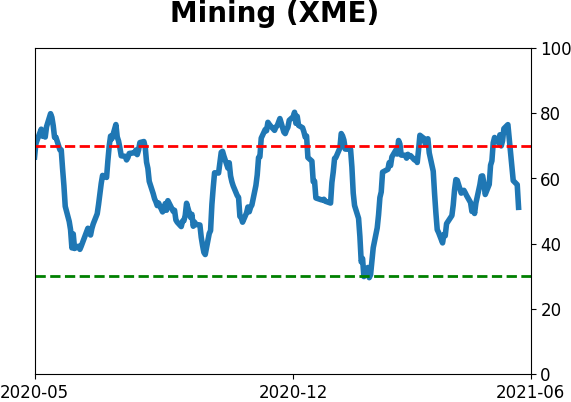
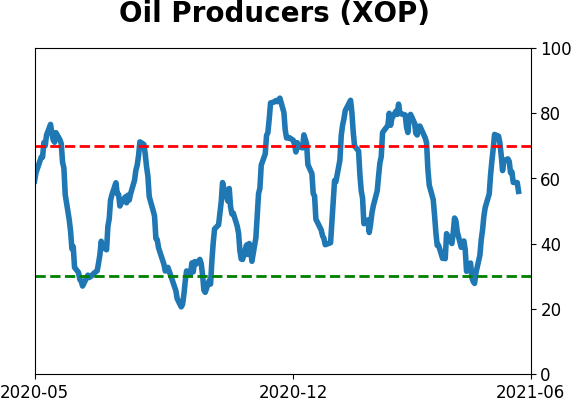
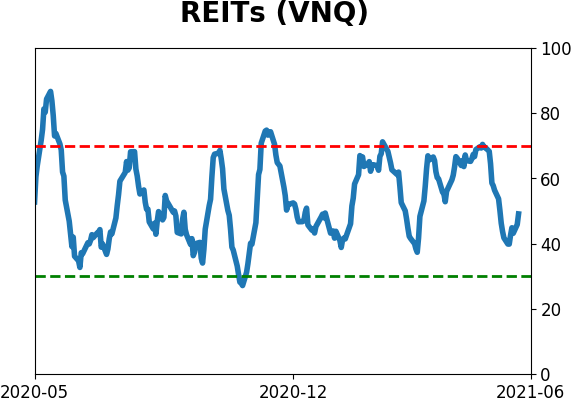
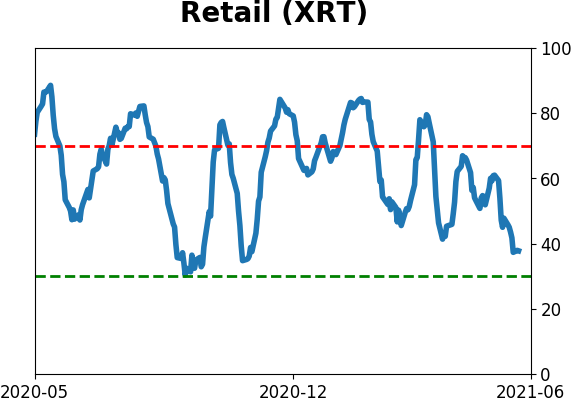
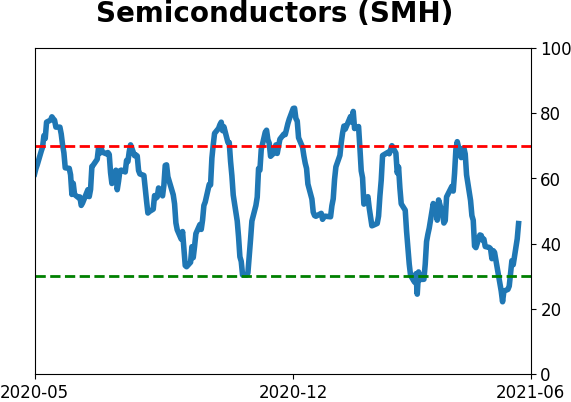
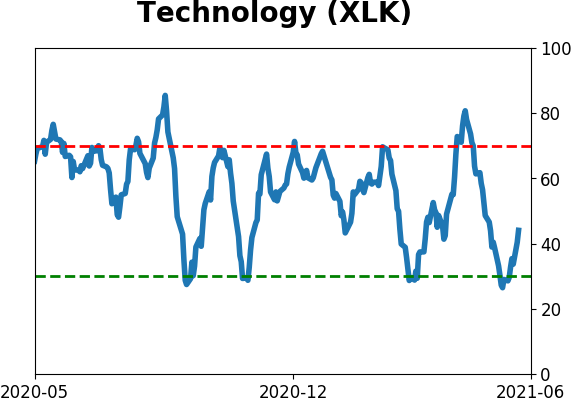
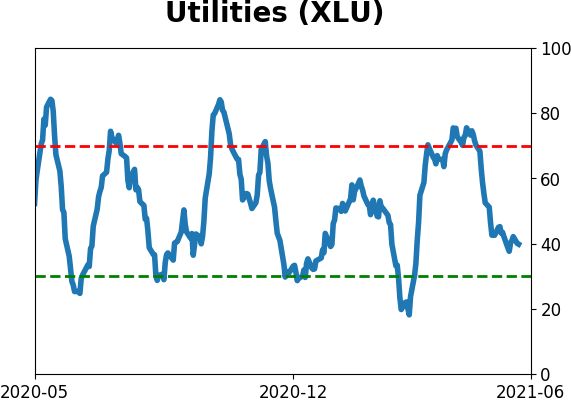
Sector ETF's - 10-Day Moving Average
|
|
|
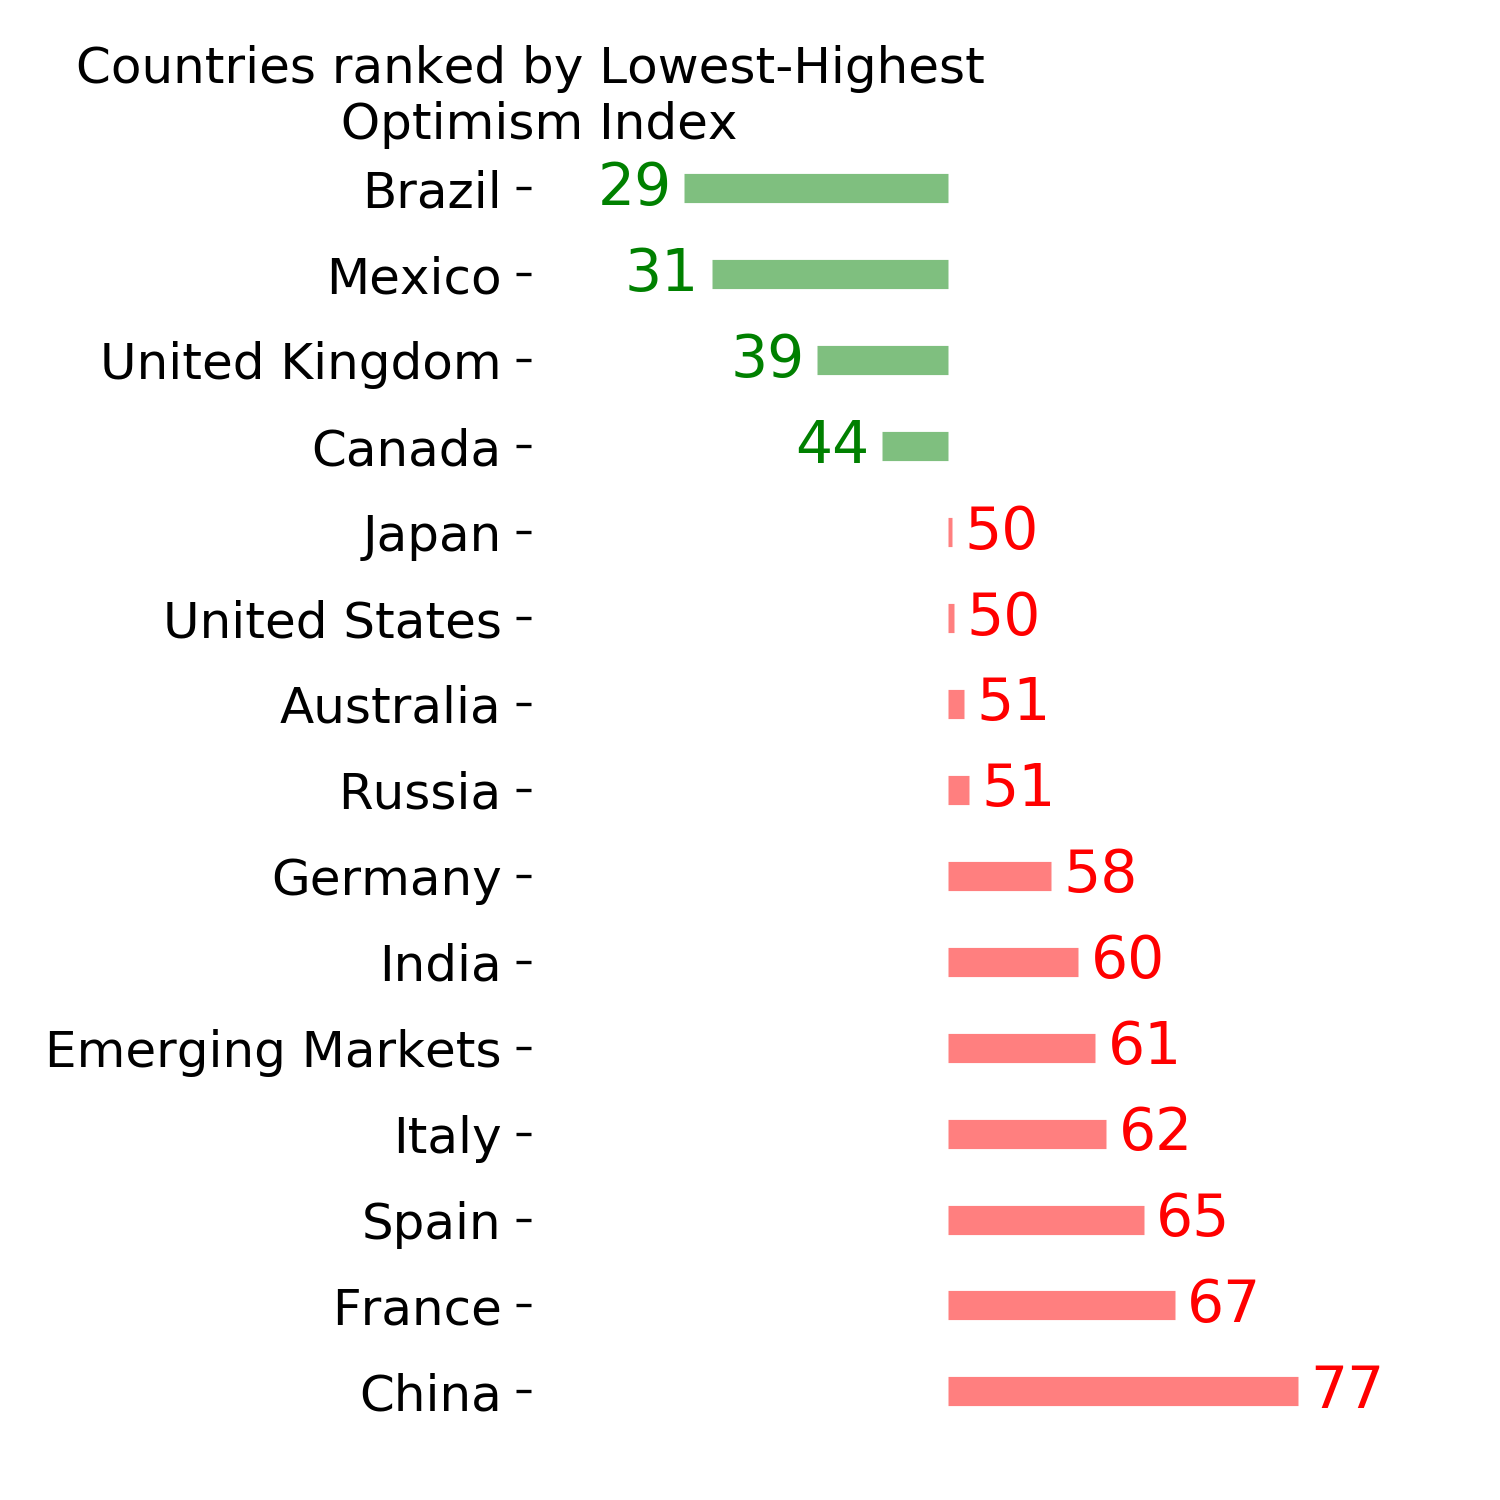
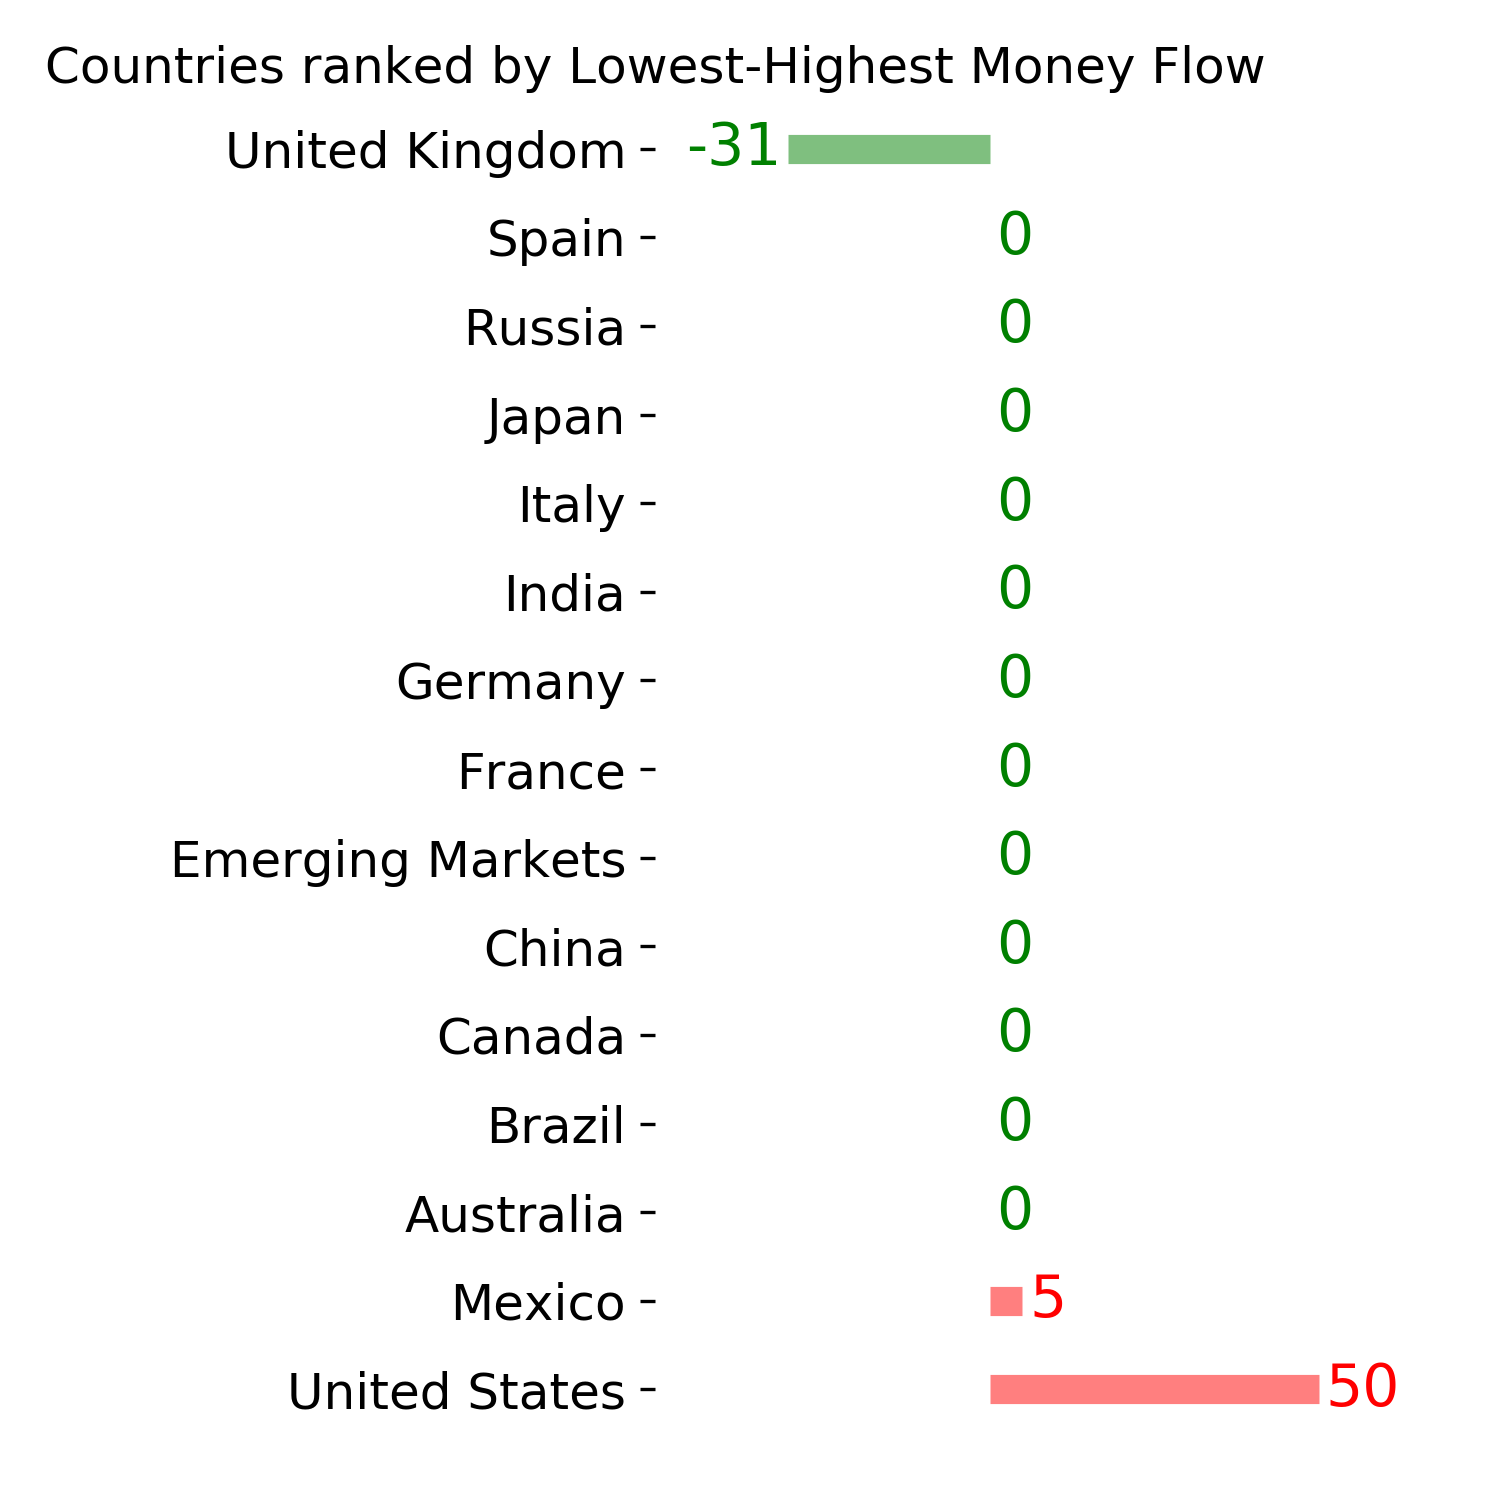
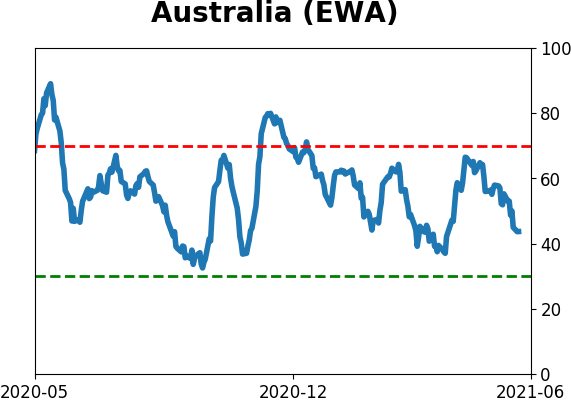
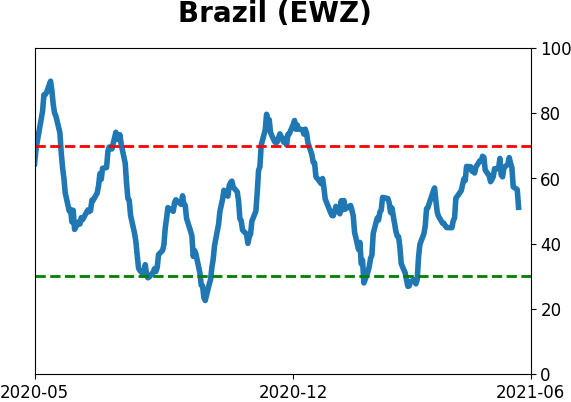
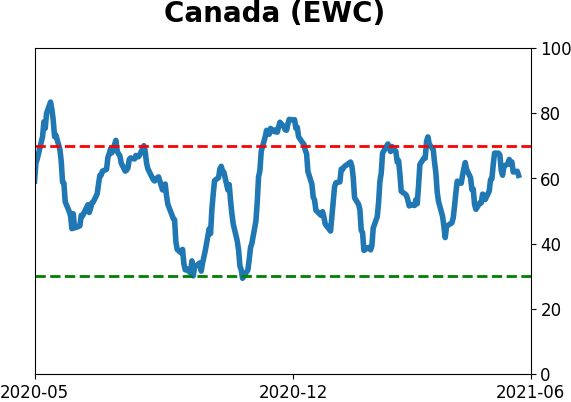
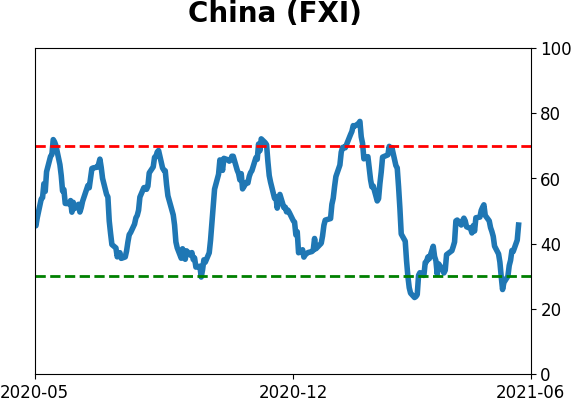
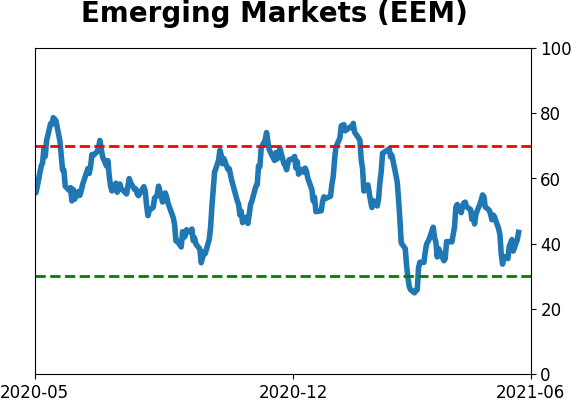
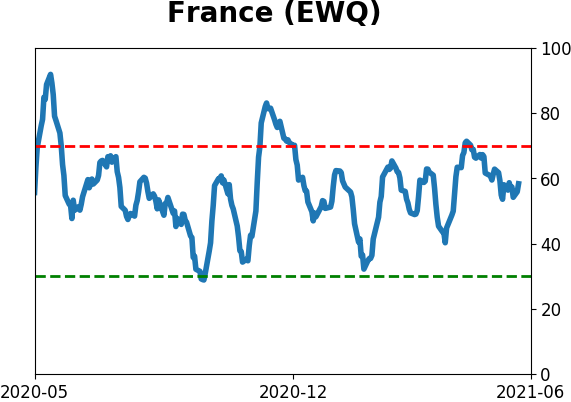
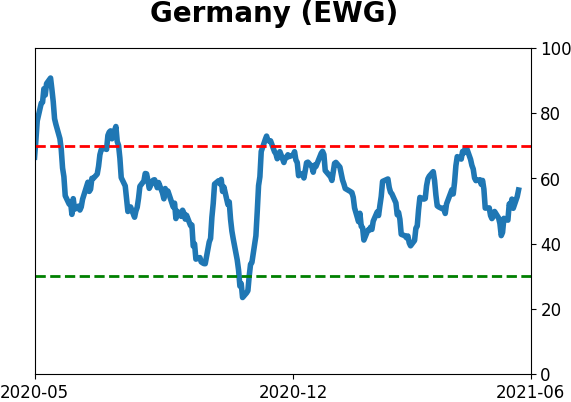
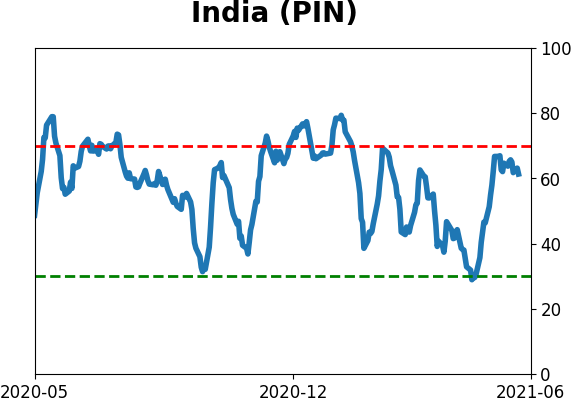
Country ETF's - 10-Day Moving Average
|
|
|
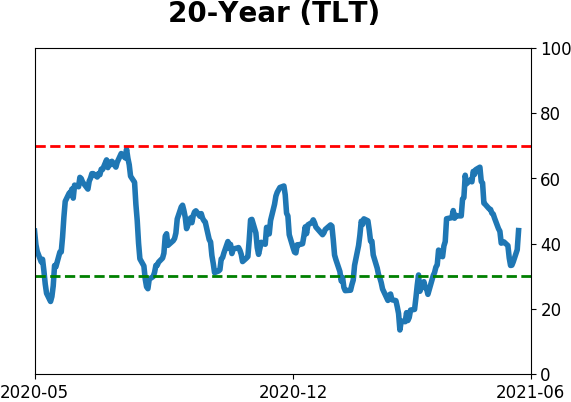
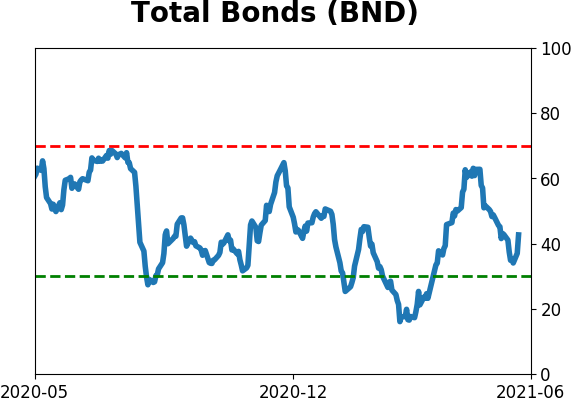
Bond ETF's - 10-Day Moving Average
|
|
|
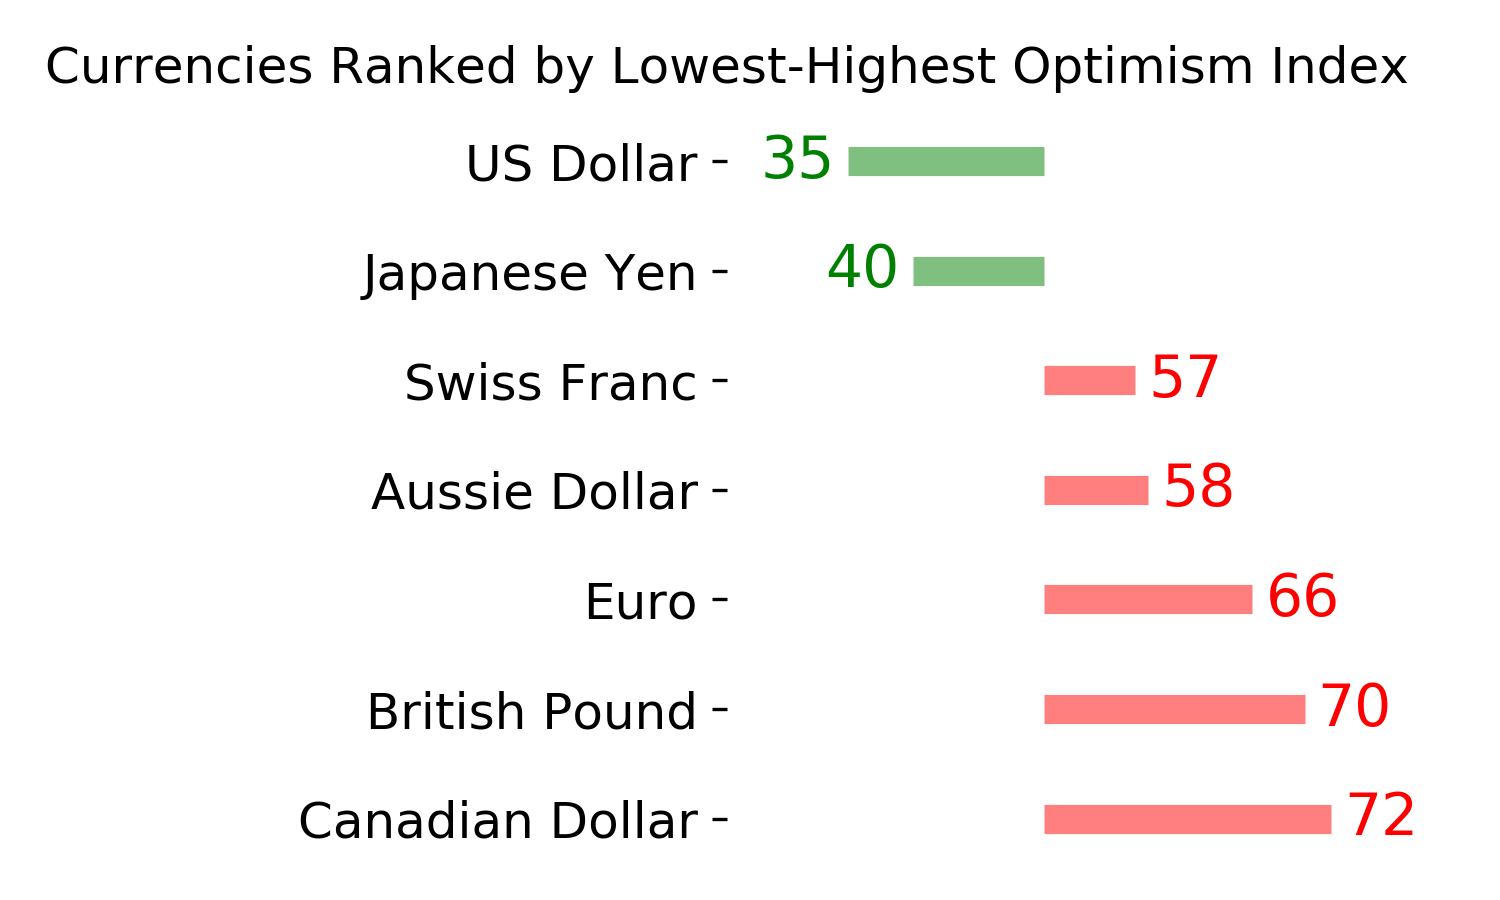
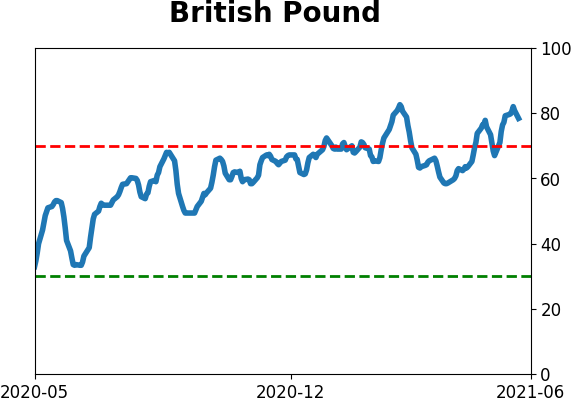
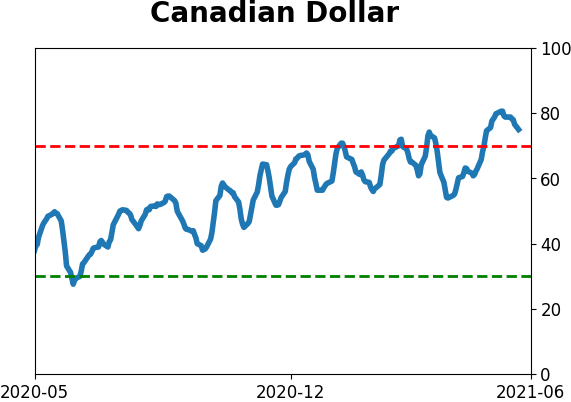
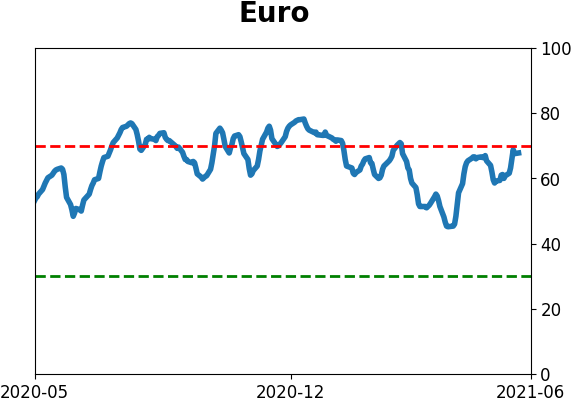
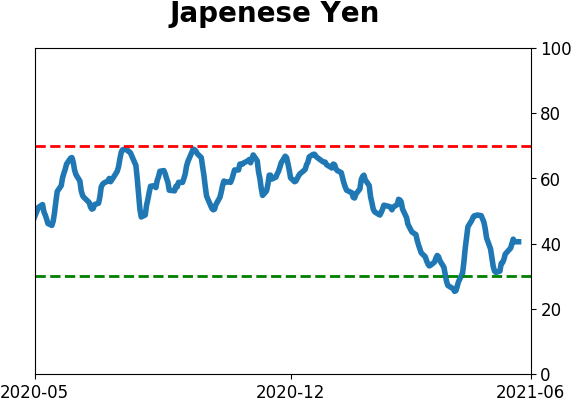
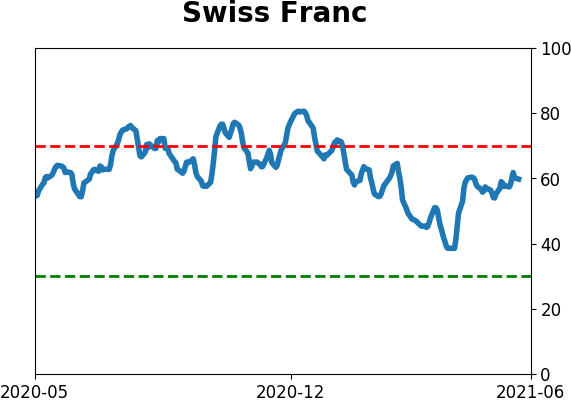
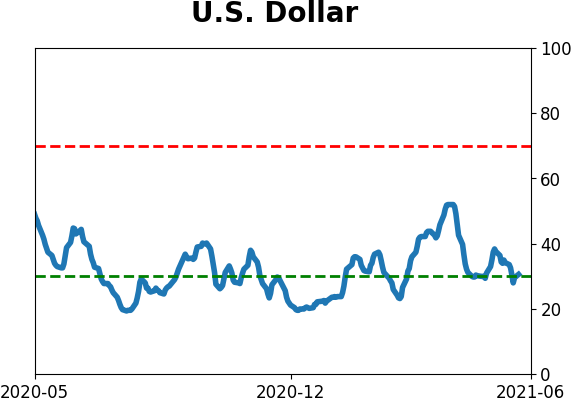
Currency ETF's - 5-Day Moving Average
|
|
|
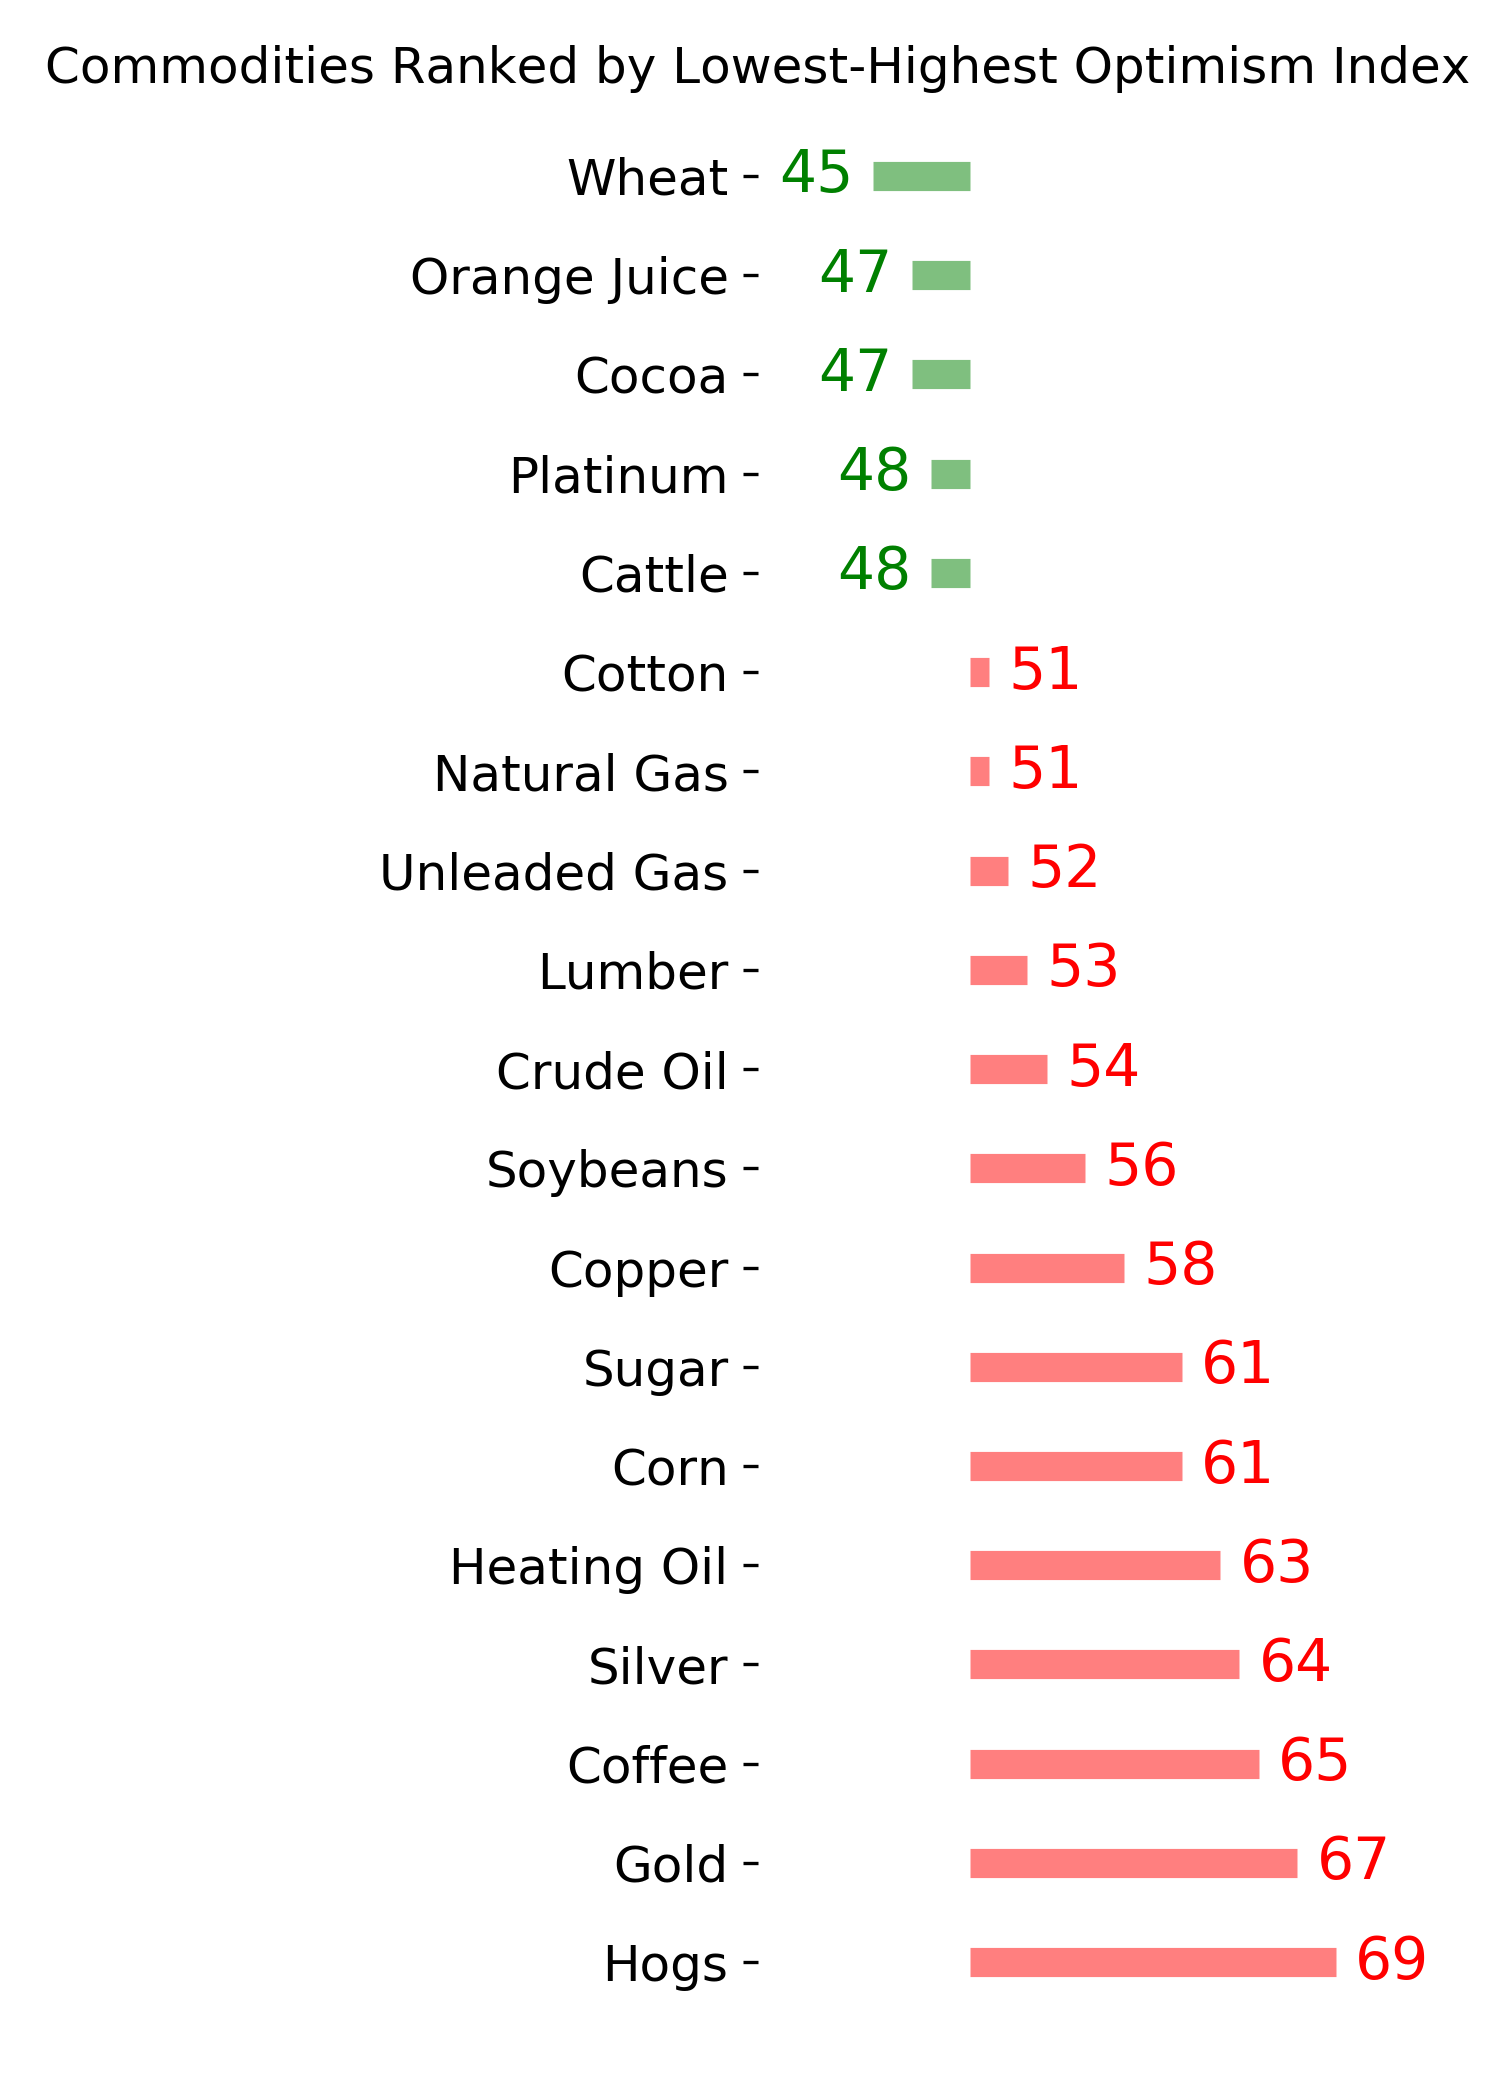
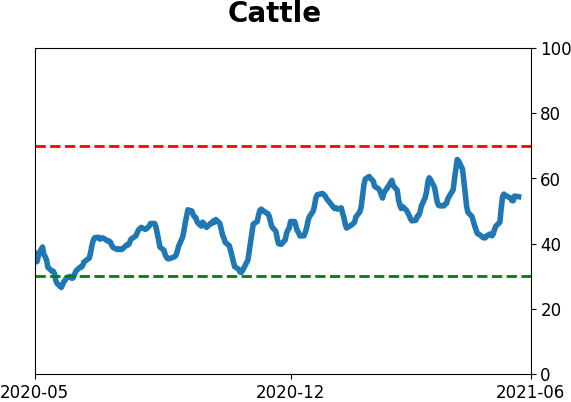
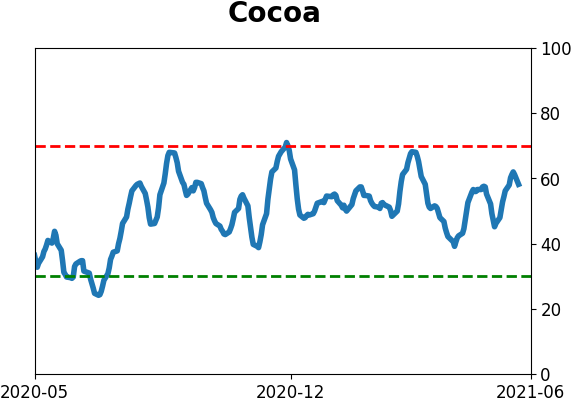
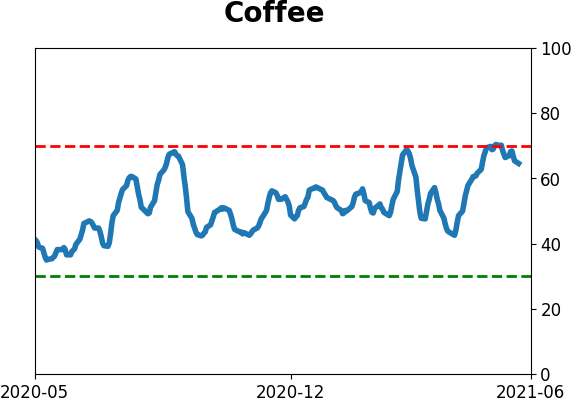
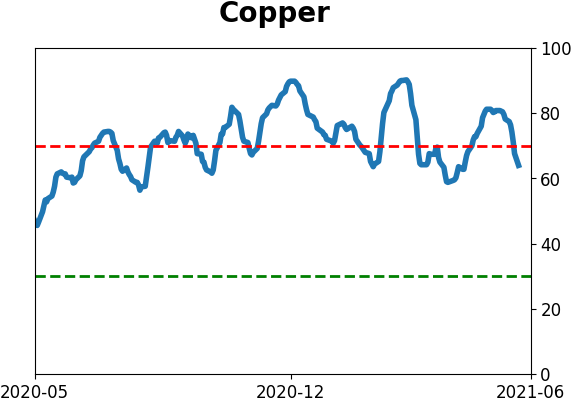
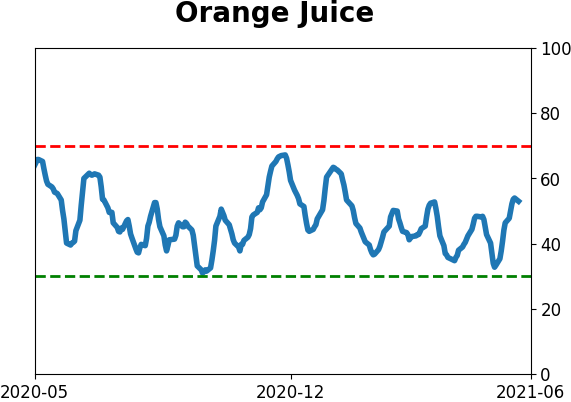
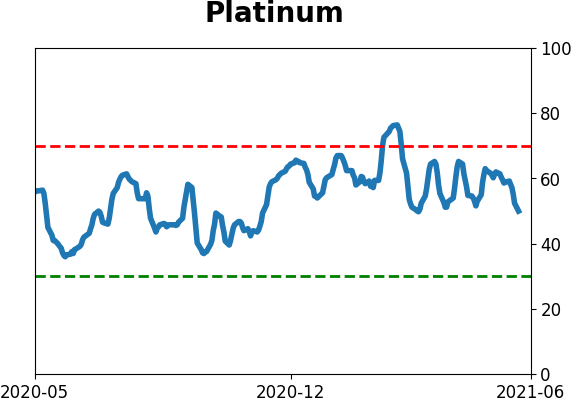
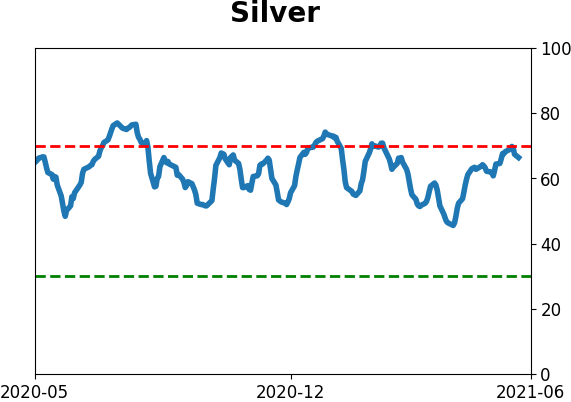
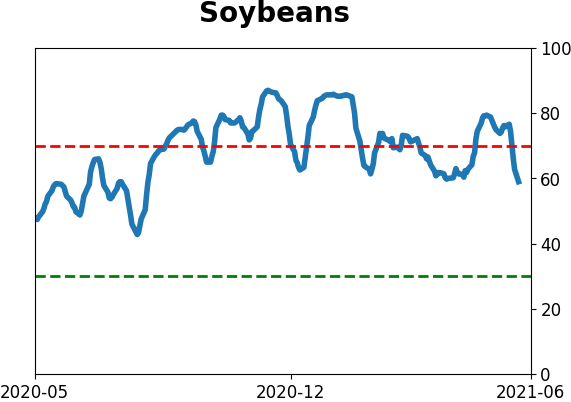
Commodity ETF's - 5-Day Moving Average
|
|