Headlines
|
|
Positive Economic Surprises Come to an End:
For the first time in a year, economic surprises have turned negative. That ends the longest streak in 20 years. After other long streaks of positive surprises, gold suffered as the dollar rallied. Stocks were mixed, but some sectors outperformed others.
Bottom Line:
See the Outlook & Allocations page for more details on these summaries STOCKS: Hold
The speculative frenzy in February is wrung out. Internal dynamics have mostly held up, with some exceptions. Many of our studies still show a mixed to poor short-term view, with medium- and long-term ones turning more positive. BONDS: Hold
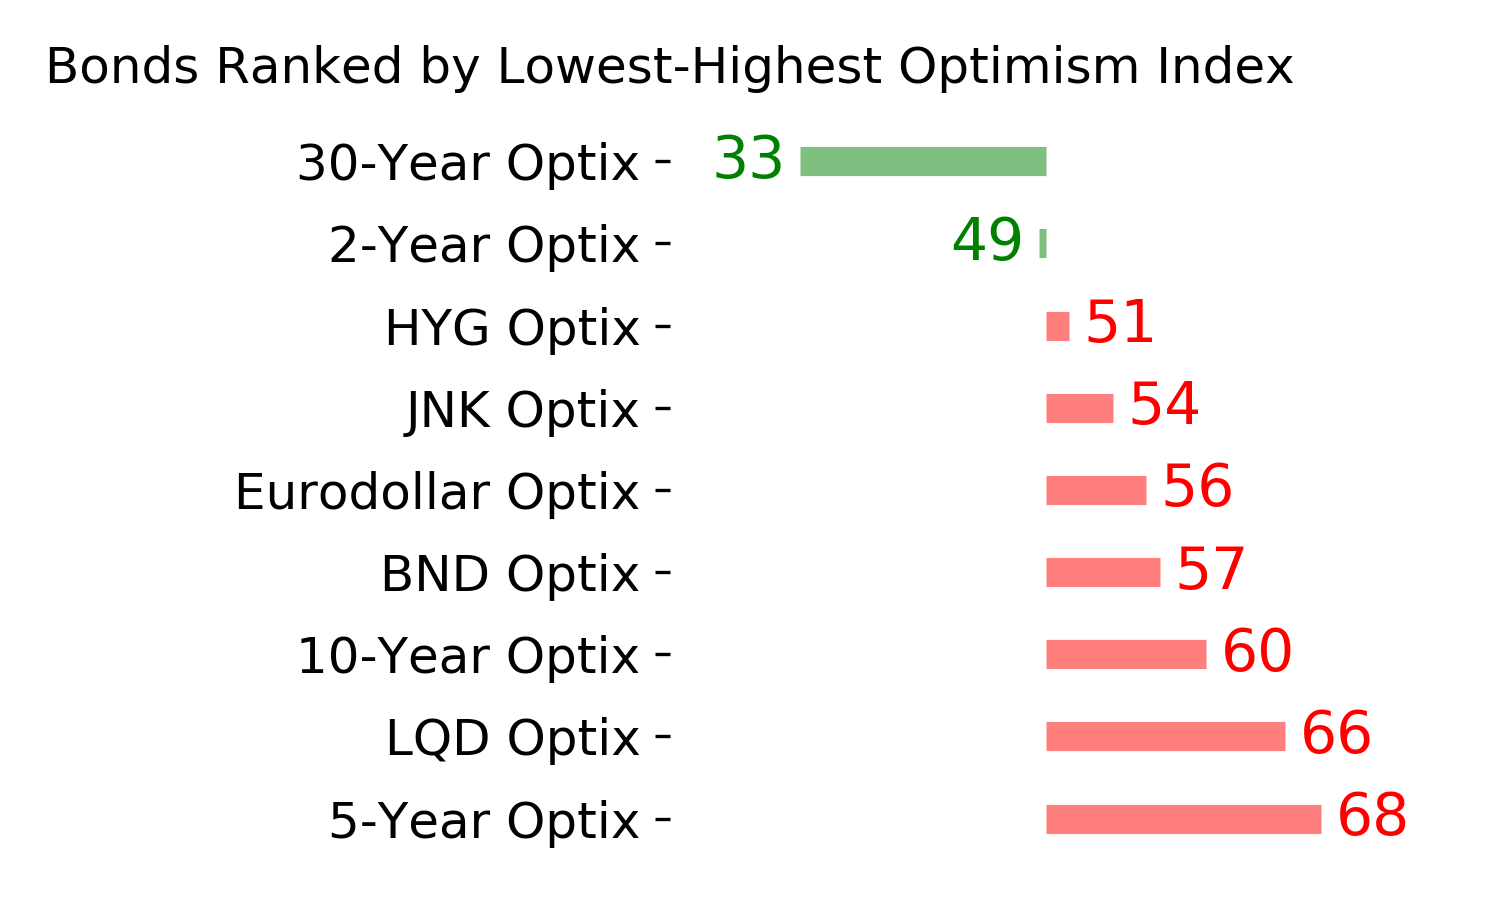
Various parts of the market got hit in March, with the lowest Bond Optimism Index we usually see during healthy environments. After a shaky couple of weeks, the broad bond market has modestly recovered. Not a big edge here either way. GOLD: Hold
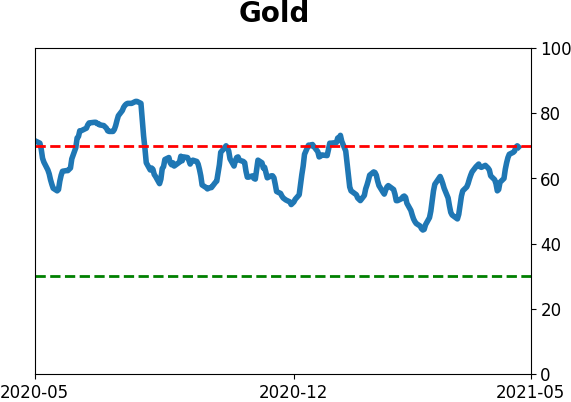
Gold and miners have done very well, recovering above long-term trend lines. The issue is that both have tended to perform poorly after similar situations - will have to wait and see how it plays out.
|
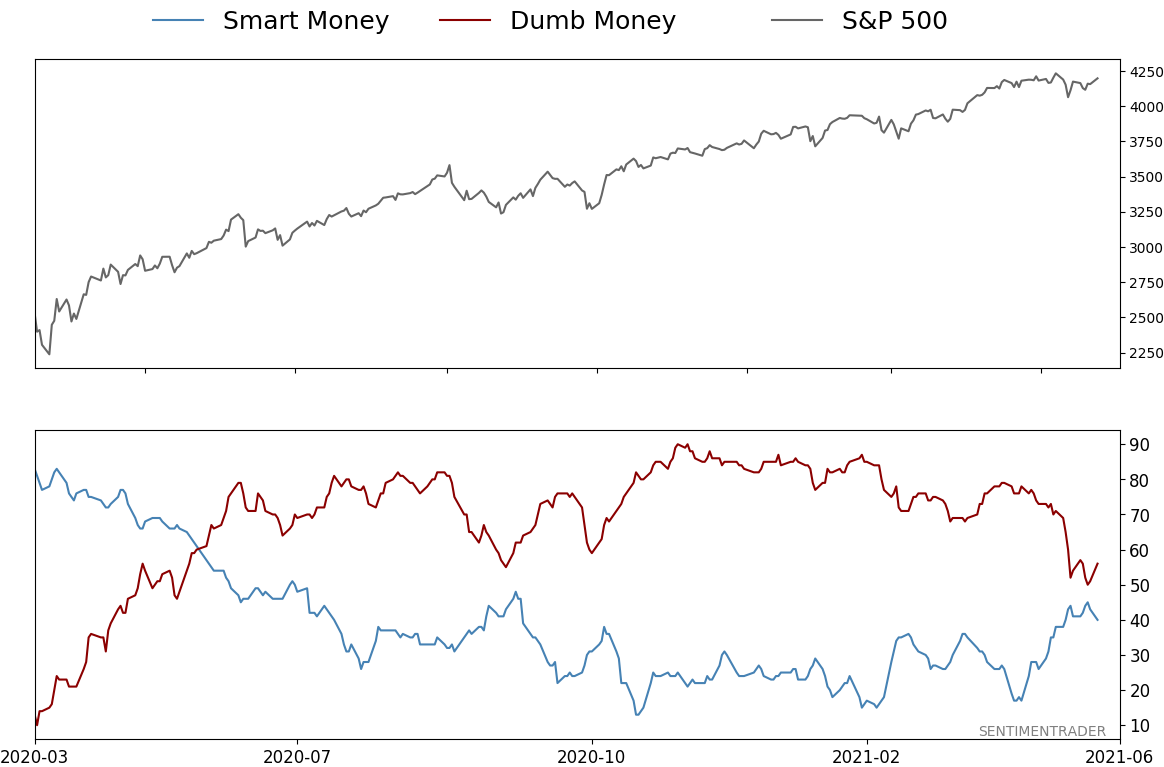
Smart / Dumb Money Confidence
|
Smart Money Confidence: 40%
Dumb Money Confidence: 56%
|
|
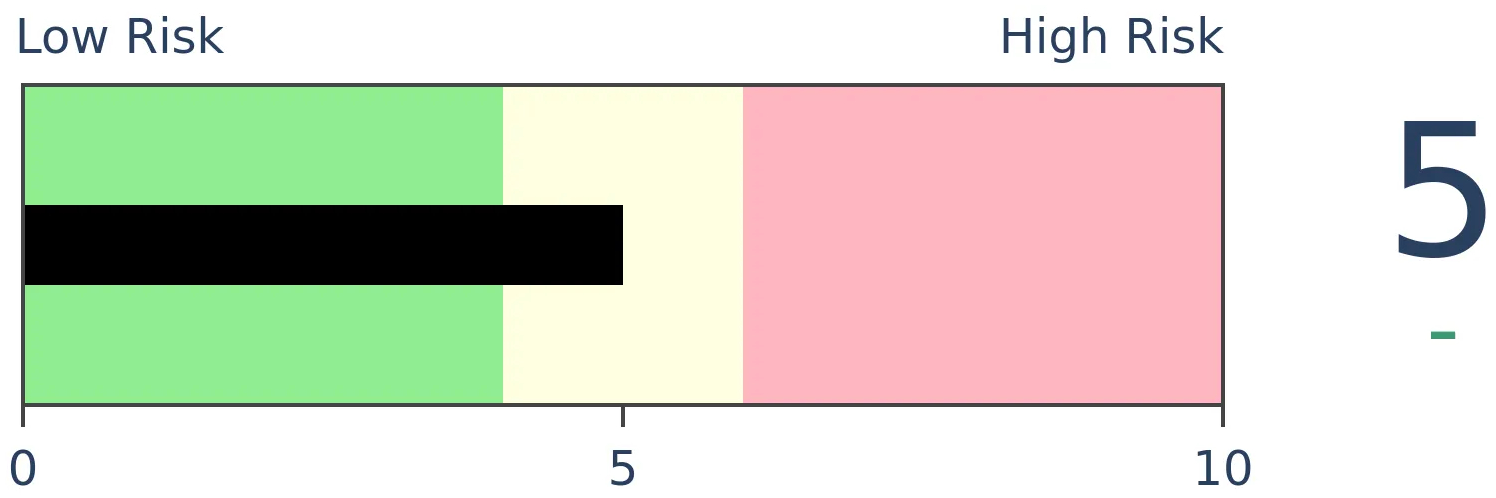
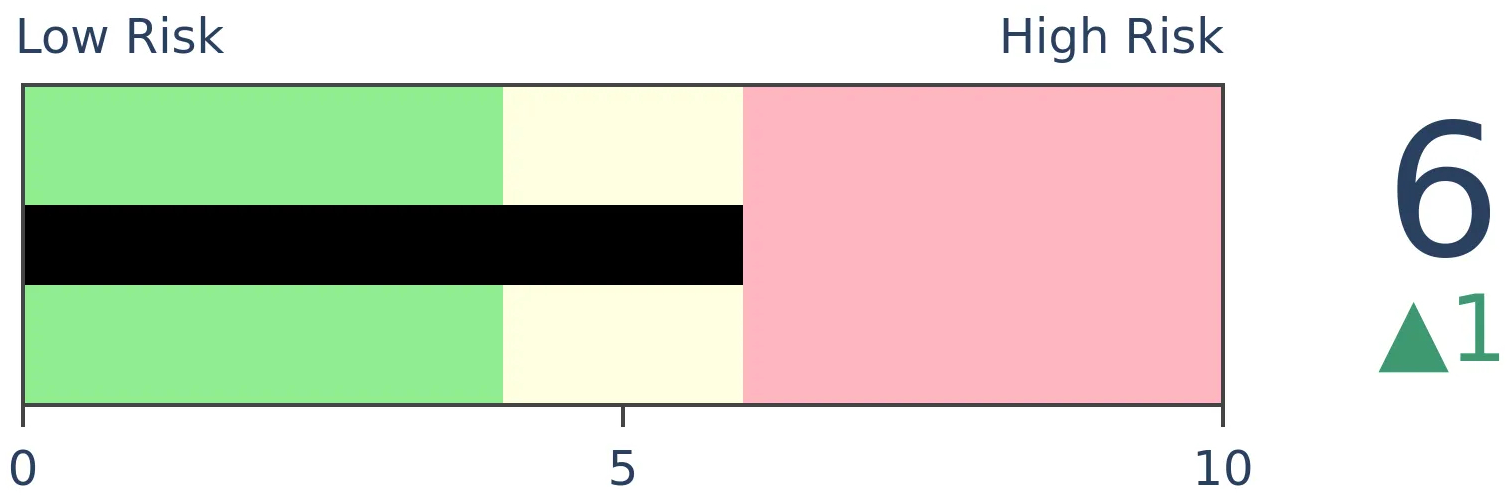
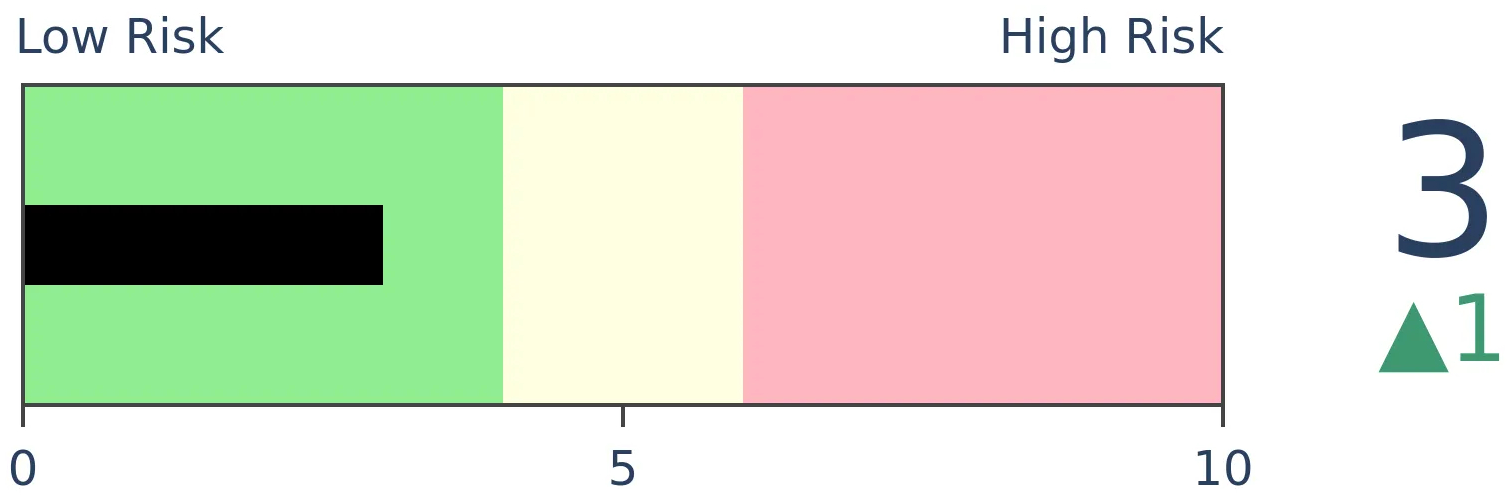
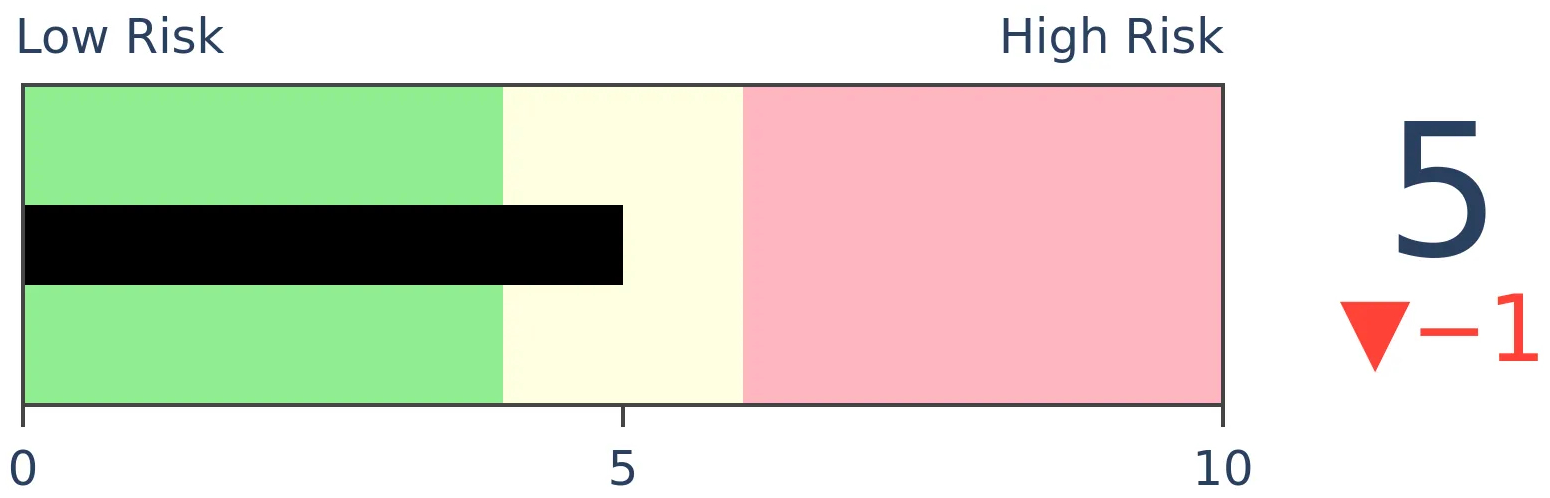
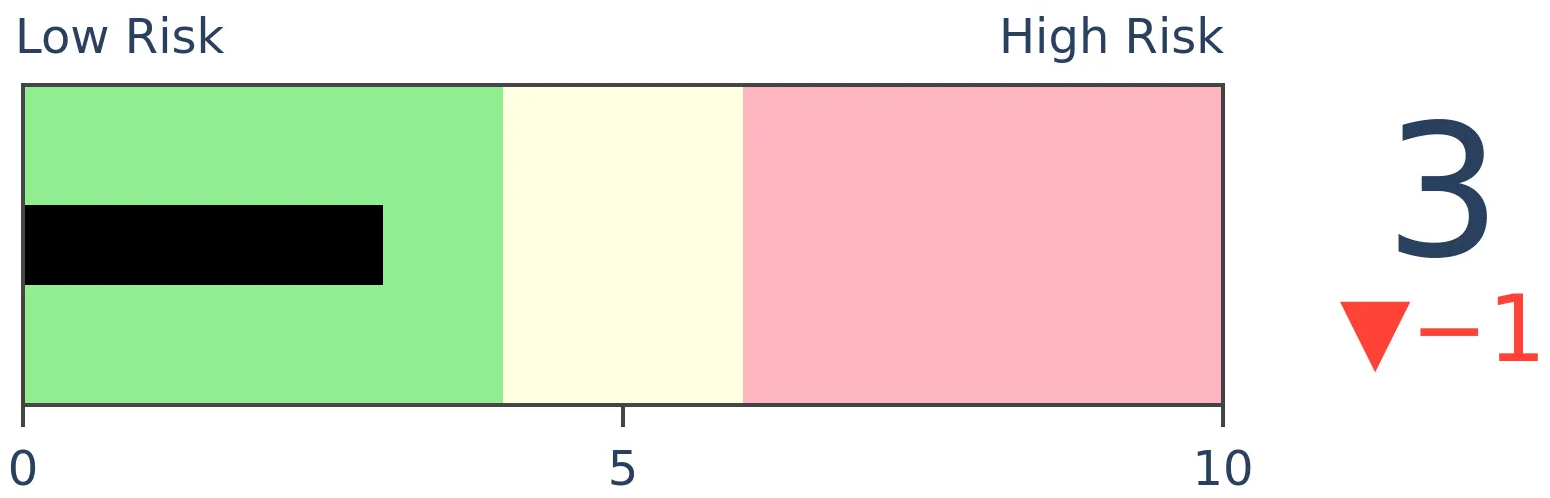
Risk Levels
Stocks Short-Term

|
Stocks Medium-Term
|
|
Bonds
|
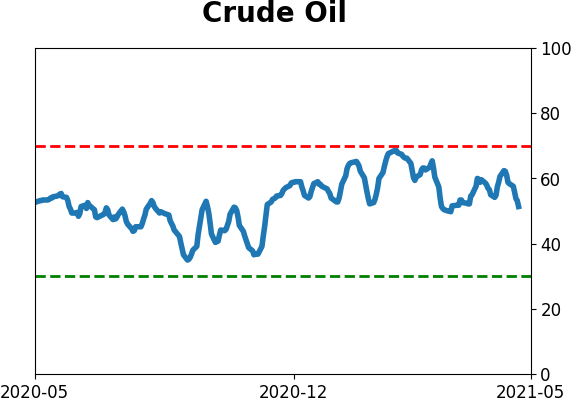
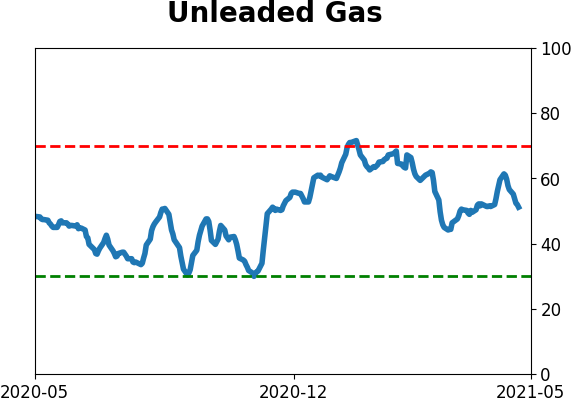
Crude Oil
|
|
Gold
|
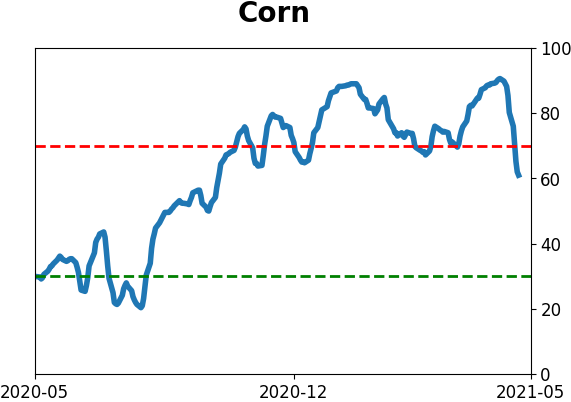
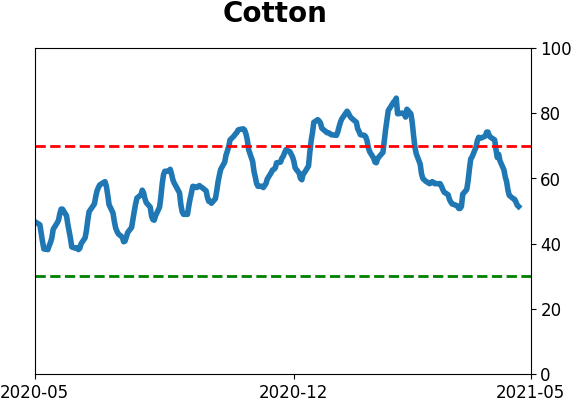
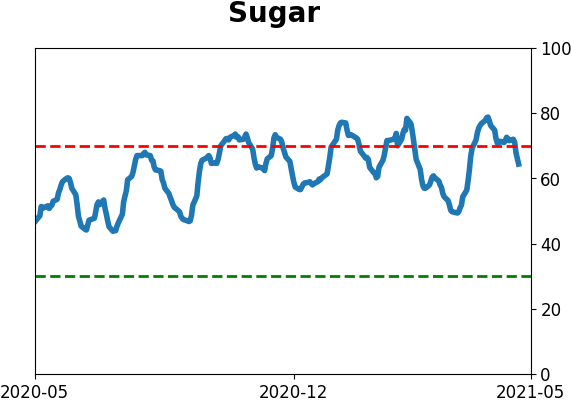
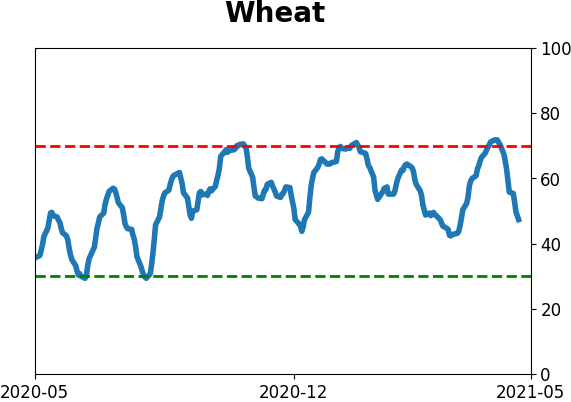
Agriculture
|
|
Research
BOTTOM LINE
For the first time in a year, economic surprises have turned negative. That ends the longest streak in 20 years. After other long streaks of positive surprises, gold suffered as the dollar rallied. Stocks were mixed, but some sectors outperformed others.
FORECAST / TIMEFRAME
GLD -- Down, Medium-Term
|
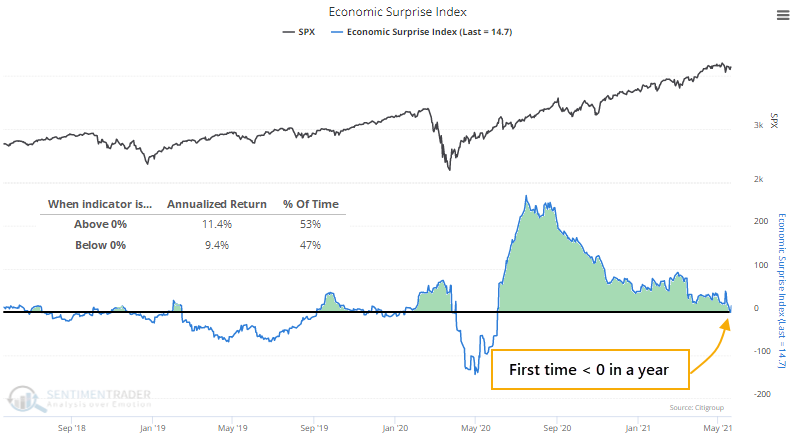
For the first time in a year, economic data is disappointing those who predict it.
The Citi Economic Surprise Index briefly turned negative near the end of last week. That's the first time the index has been negative since May of last year.
The index measures how much that economic data is beating or missing economists' forecasts. As a group, economists tend to self-correct as new data comes in, and then they extrapolate into the future, so the index consistently swings between extremes.
END OF THE LONGEST STREAK EVER
We can see from the chart that the S&P 500 has a very slight tendency to show a better return when surprises are positive than when they're negative, but it's not a big difference.
What may be more notable is that this is ending a record streak of days with positive surprises.
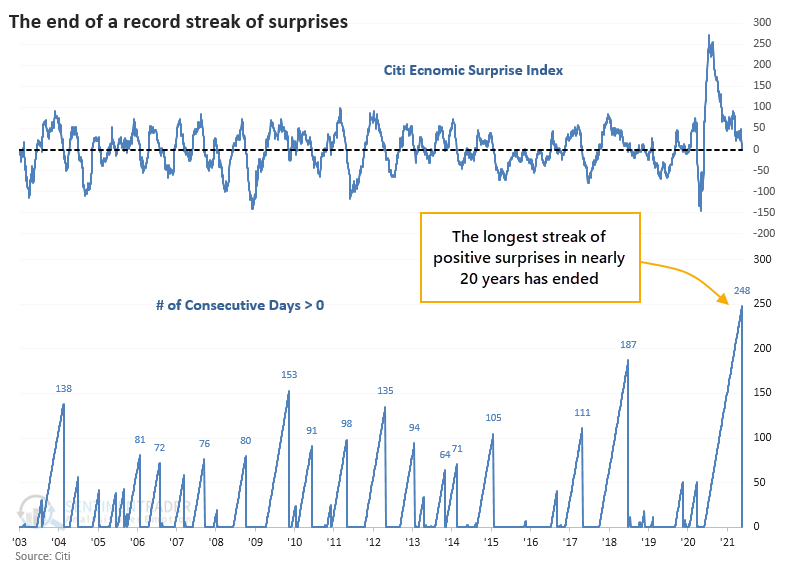
Perhaps stocks will dip once economic data starts to disappoint after investors had become comfortable with positive surprises? To check, we can look at the S&P's future returns after the few other times when a long streak of positives was interrupted.
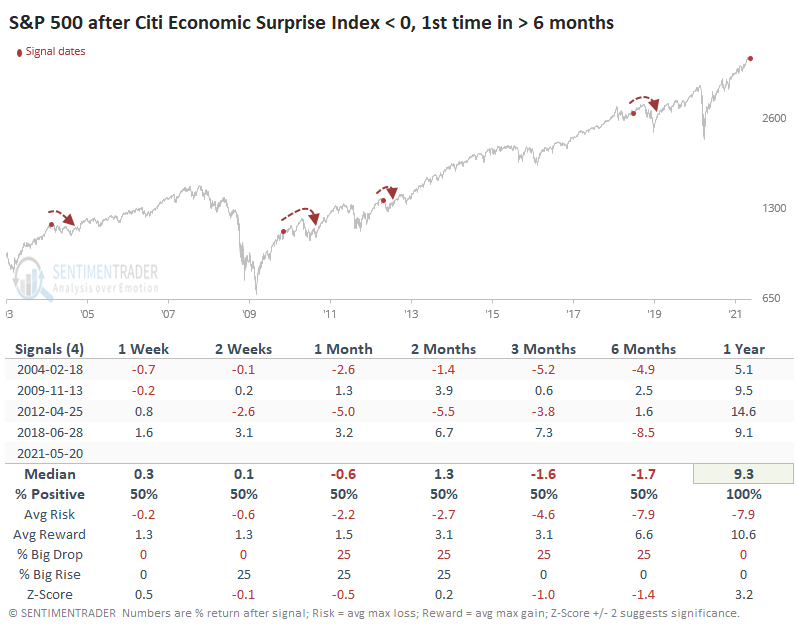
There were only four other times when Economic Surprises lasted six months or longer, and after the ends of those streaks, the S&P showed mixed returns. There were two times when it fell immediately, and the other two saw their short-term gains wiped out in the months ahead. All four showed a positive one-year return, though.
STOCKS MIXED, GOLD NIXED
If we look at the ends of shorter streaks, we can generate a larger sample size.
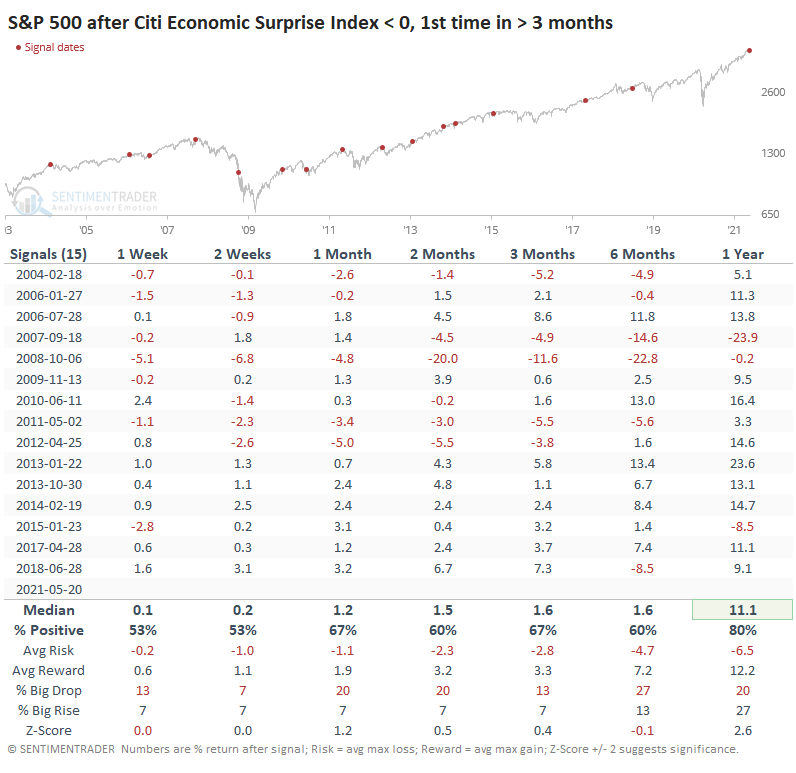
Not much there. Returns were "meh" over the short-term medium-term, a bit above random but with a mediocre risk/reward profile.
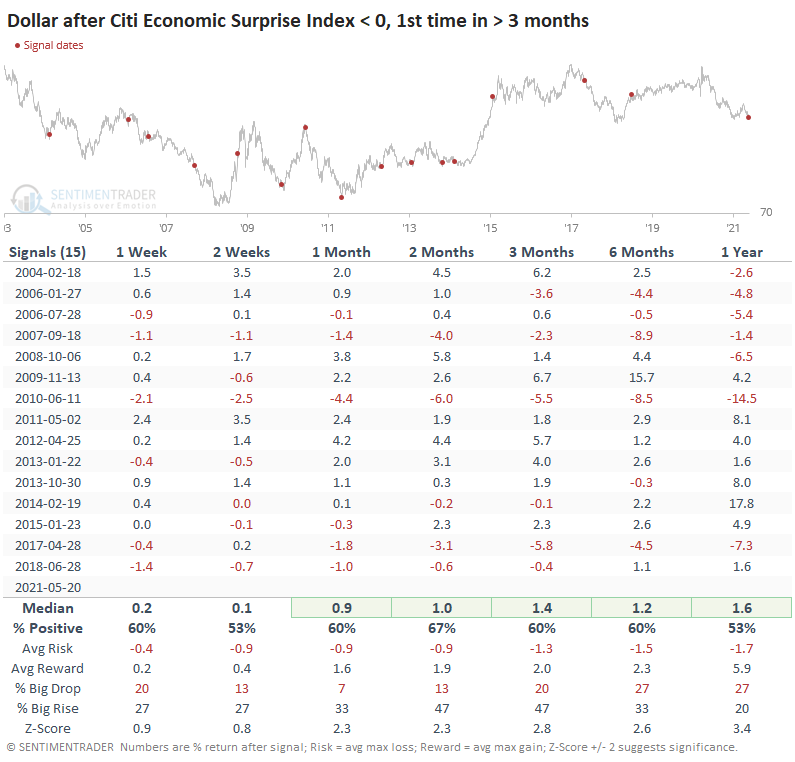
We don't usually show detailed tables for other markets because it has a habit of making eyes glaze over. Still, gold and the dollar showed such consistent behavior after these episodes that it pays to take a look.
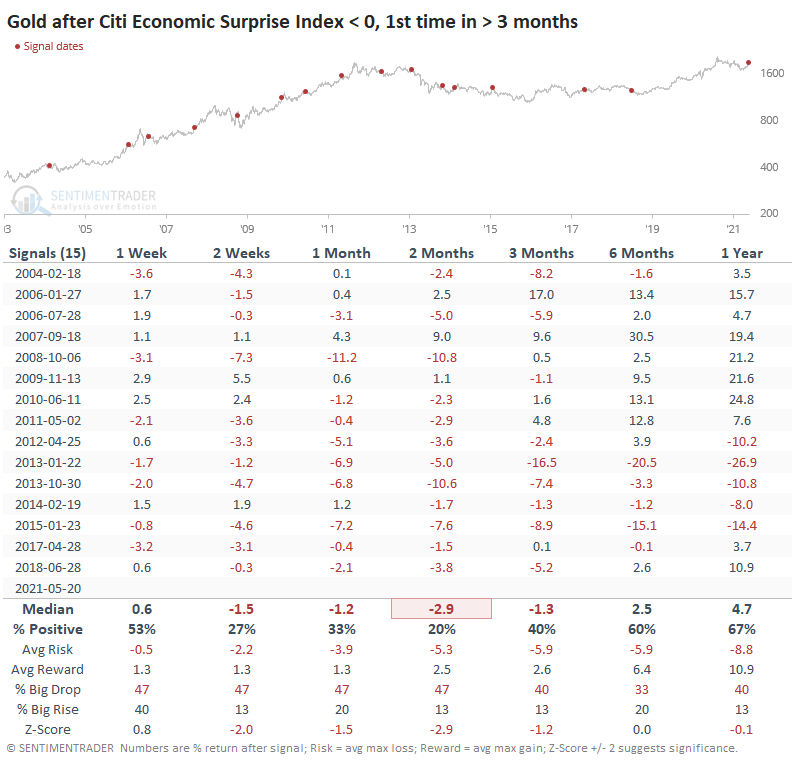
It was not a good sign for the yellow metal. Gold consistently tanked after surprises turned negative, with 14 out of the 15 signals showing a negative return sometime between 2-12 weeks later.
This is due in part to the U.S. dollar, which tended to rally after these signals.
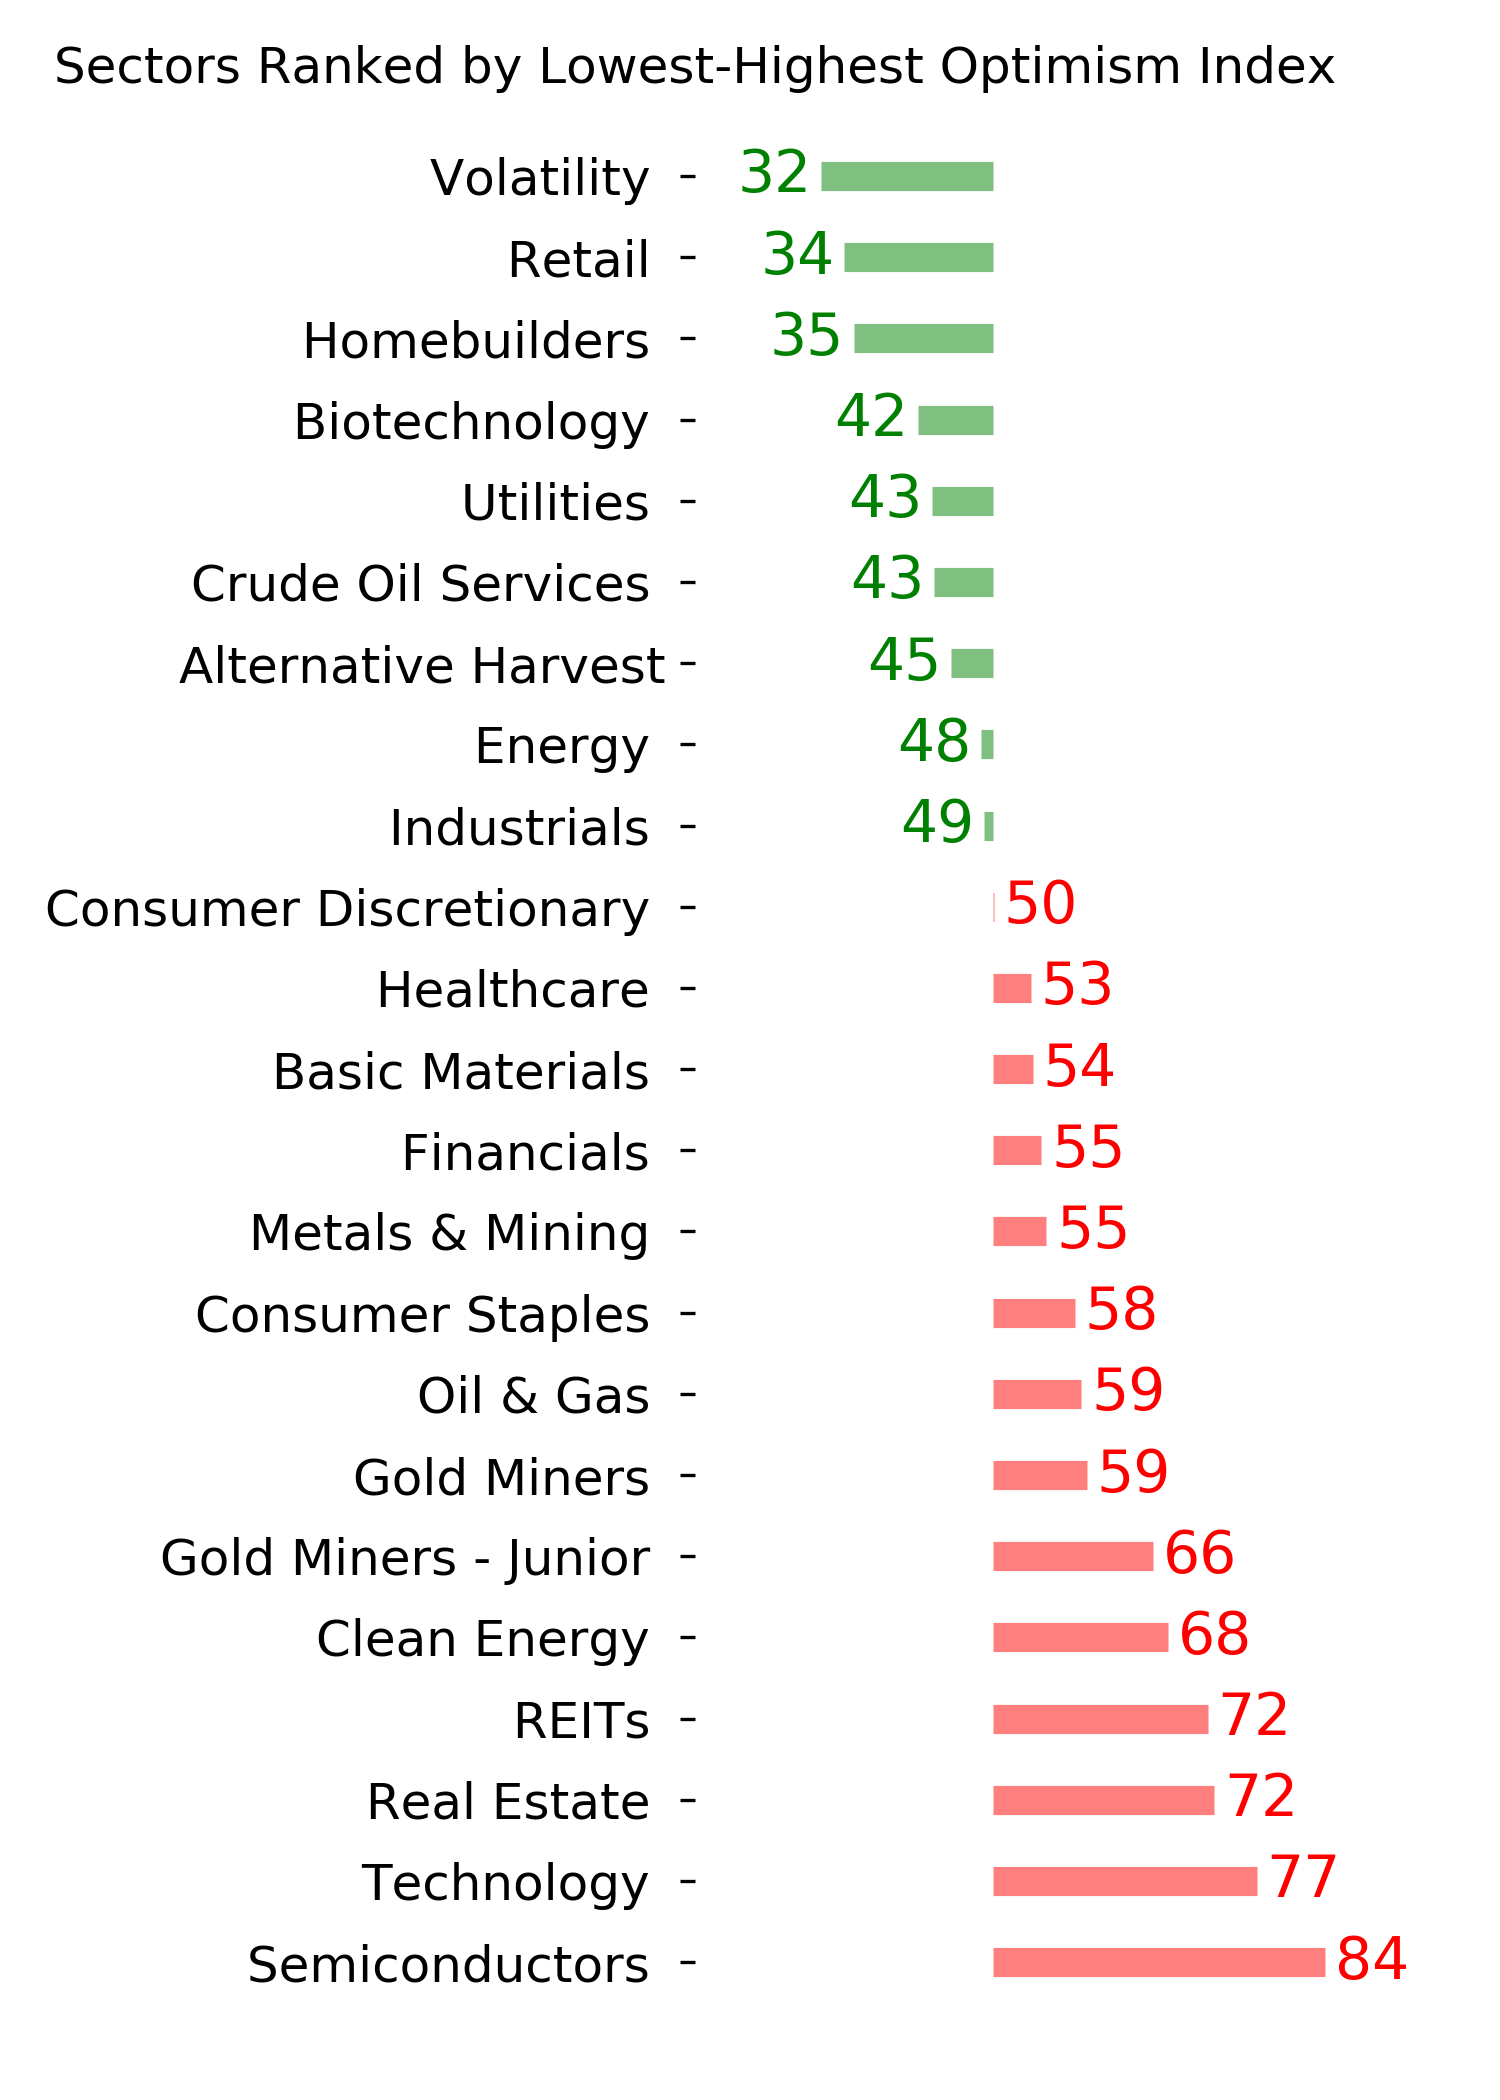
AN ODD BREW OF SECTOR REACTIONS
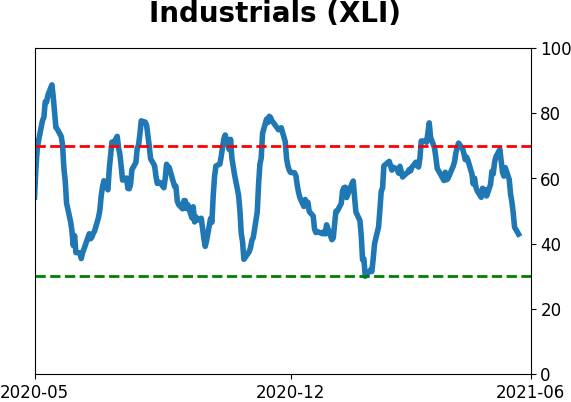
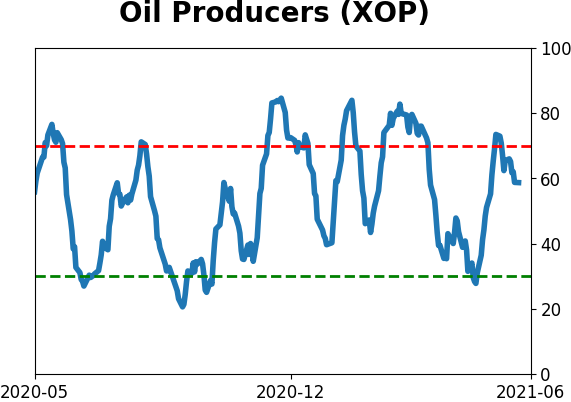
Even though stock indexes like the S&P 500 tended to show mixed returns, sectors like Industrials, Communications, and Utilities showed decent medium-term returns. Energy, Materials, and Tech were laggards.
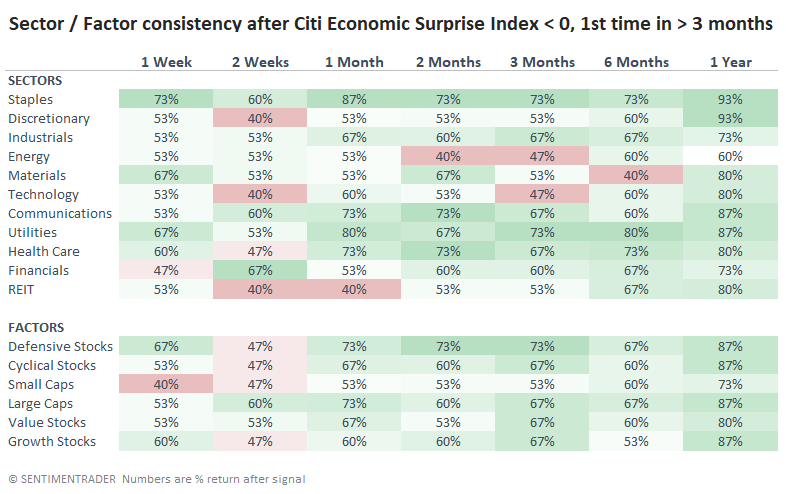
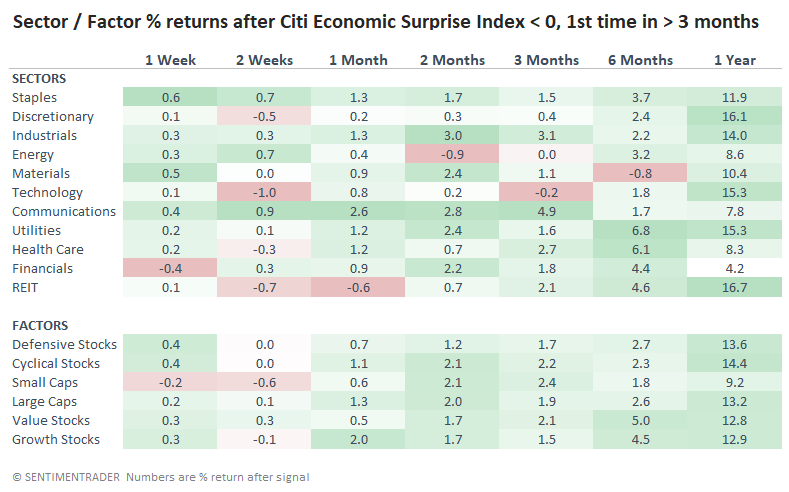 In terms of consistency, the same sectors tended to be near the top/bottom.
There isn't much evidence here to suggest a change to any outlook on the broader stock market. Similar conditions were perhaps a minor negative, but it wasn't consistent enough to be a big worry.
It's a more compelling indicator for other markets, particularly gold. The fact that almost every instance preceded a negative return over a short- to medium-term time frame for the metal is consistent enough to be a worry, especially since it also tends to run into trouble when trying to change its long-term trend.
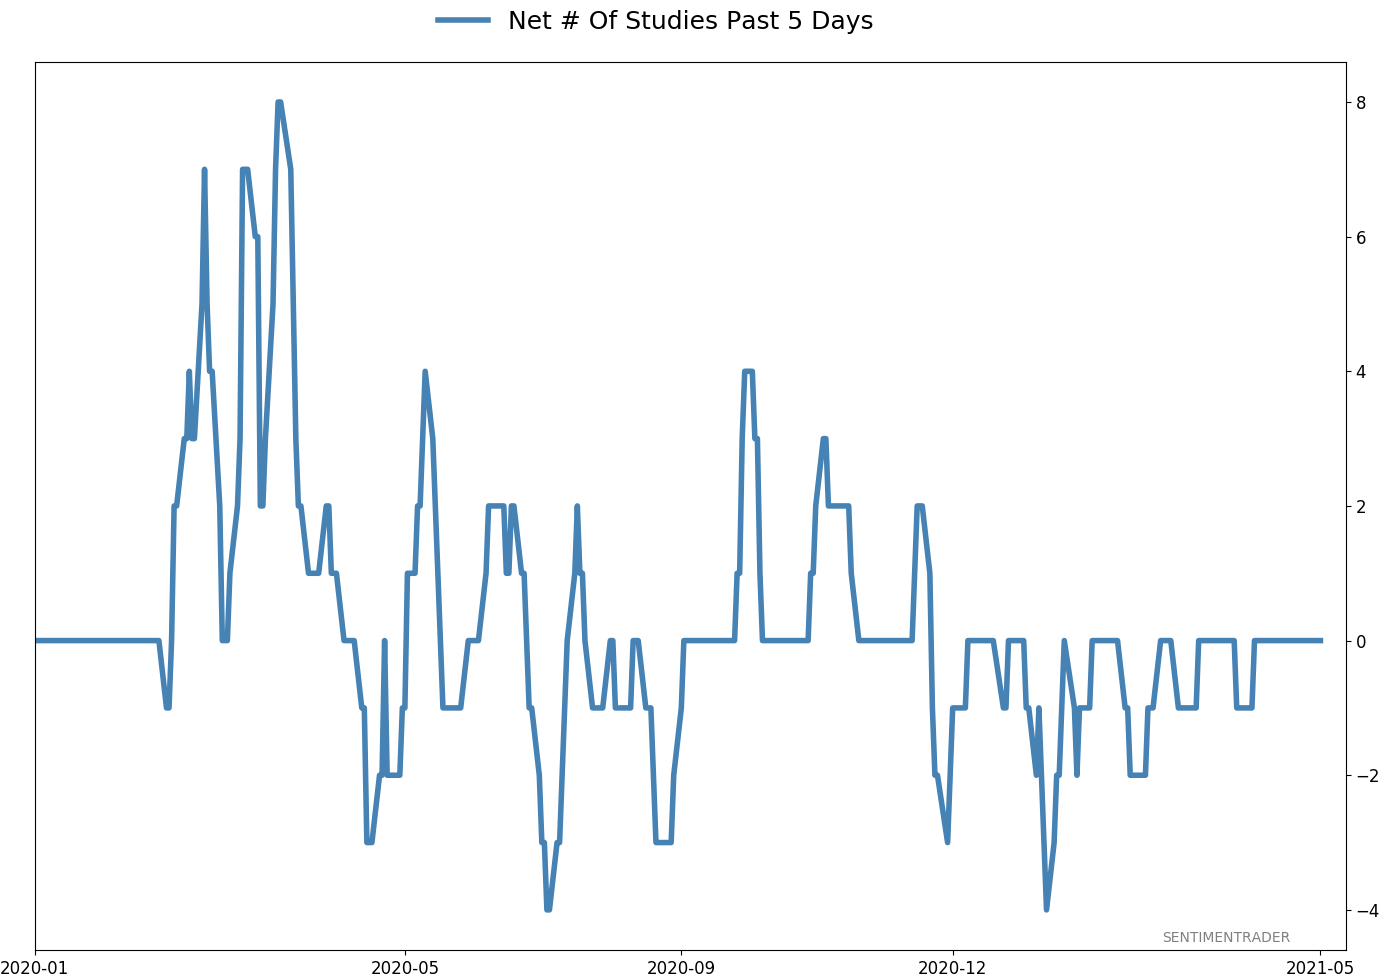
Active Studies
| Time Frame | Bullish | Bearish | | Short-Term | 0 | 0 | | Medium-Term | 1 | 11 | | Long-Term | 11 | 4 |
|
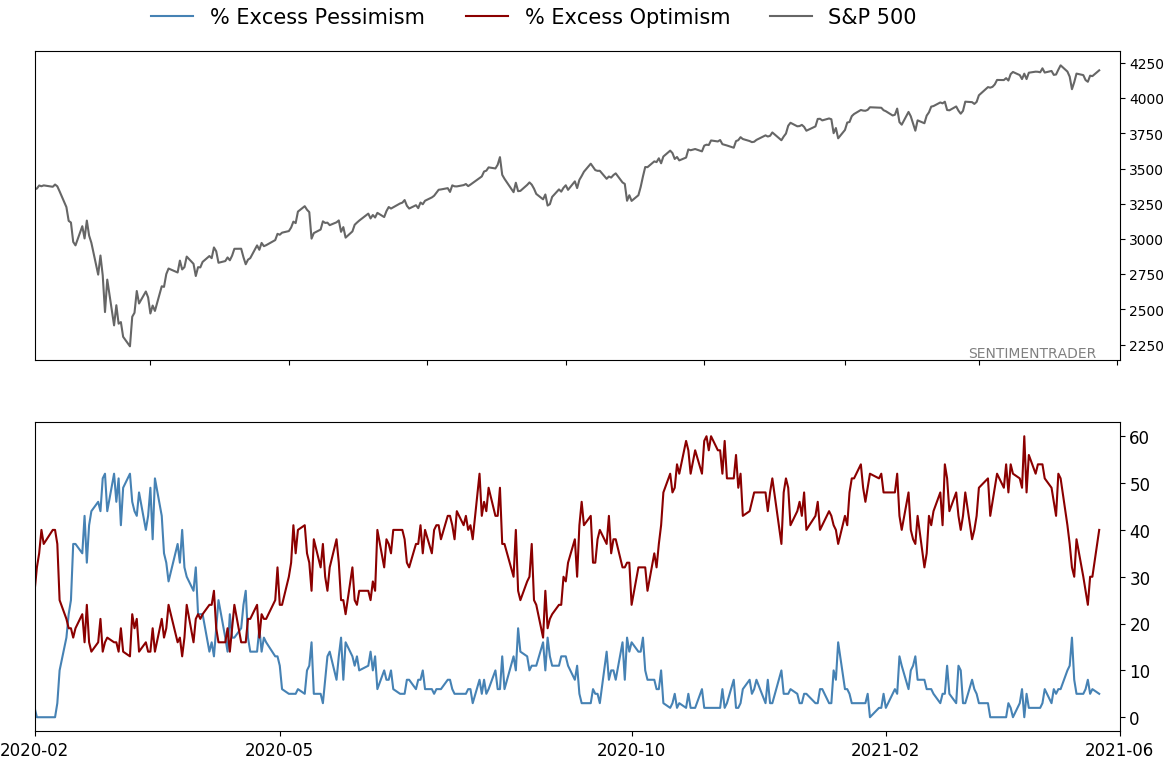
Indicators at Extremes
Portfolio
| Position | Description | Weight % | Added / Reduced | Date | | Stocks | RSP | 4.1 | Added 4.1% | 2021-05-19 | | Bonds | 23.9% BND, 6.9% SCHP | 30.8 | Reduced 7.1% | 2021-05-19 | | Commodities | GCC | 2.5 | Reduced 2.1%
| 2020-09-04 | | Precious Metals | GDX | 5.6 | Reduced 4.2% | 2021-05-19 | | Special Situations | 4.3% XLE, 2.2% PSCE | 7.2 | Reduced 5.6% | 2021-04-22 | | Cash | | 49.8 | | |
|
Updates (Changes made today are underlined)
Much of our momentum and trend work has remained positive for several months, with some scattered exceptions. Almost all sentiment-related work has shown a poor risk/reward ratio for stocks, especially as speculation drove to record highs in exuberance in February. Much of that has worn off, and most of our models are back toward neutral levels. There isn't much to be excited about here. The same goes for bonds and even gold. Gold has been performing well lately and is back above long-term trend lines. The issue is that it has a poor record of holding onto gains when attempting a long-term trend change like this, so we'll take a wait-and-see approach. RETURN YTD: 9.3% 2020: 8.1%, 2019: 12.6%, 2018: 0.6%, 2017: 3.8%, 2016: 17.1%, 2015: 9.2%, 2014: 14.5%, 2013: 2.2%, 2012: 10.8%, 2011: 16.5%, 2010: 15.3%, 2009: 23.9%, 2008: 16.2%, 2007: 7.8%
|
|
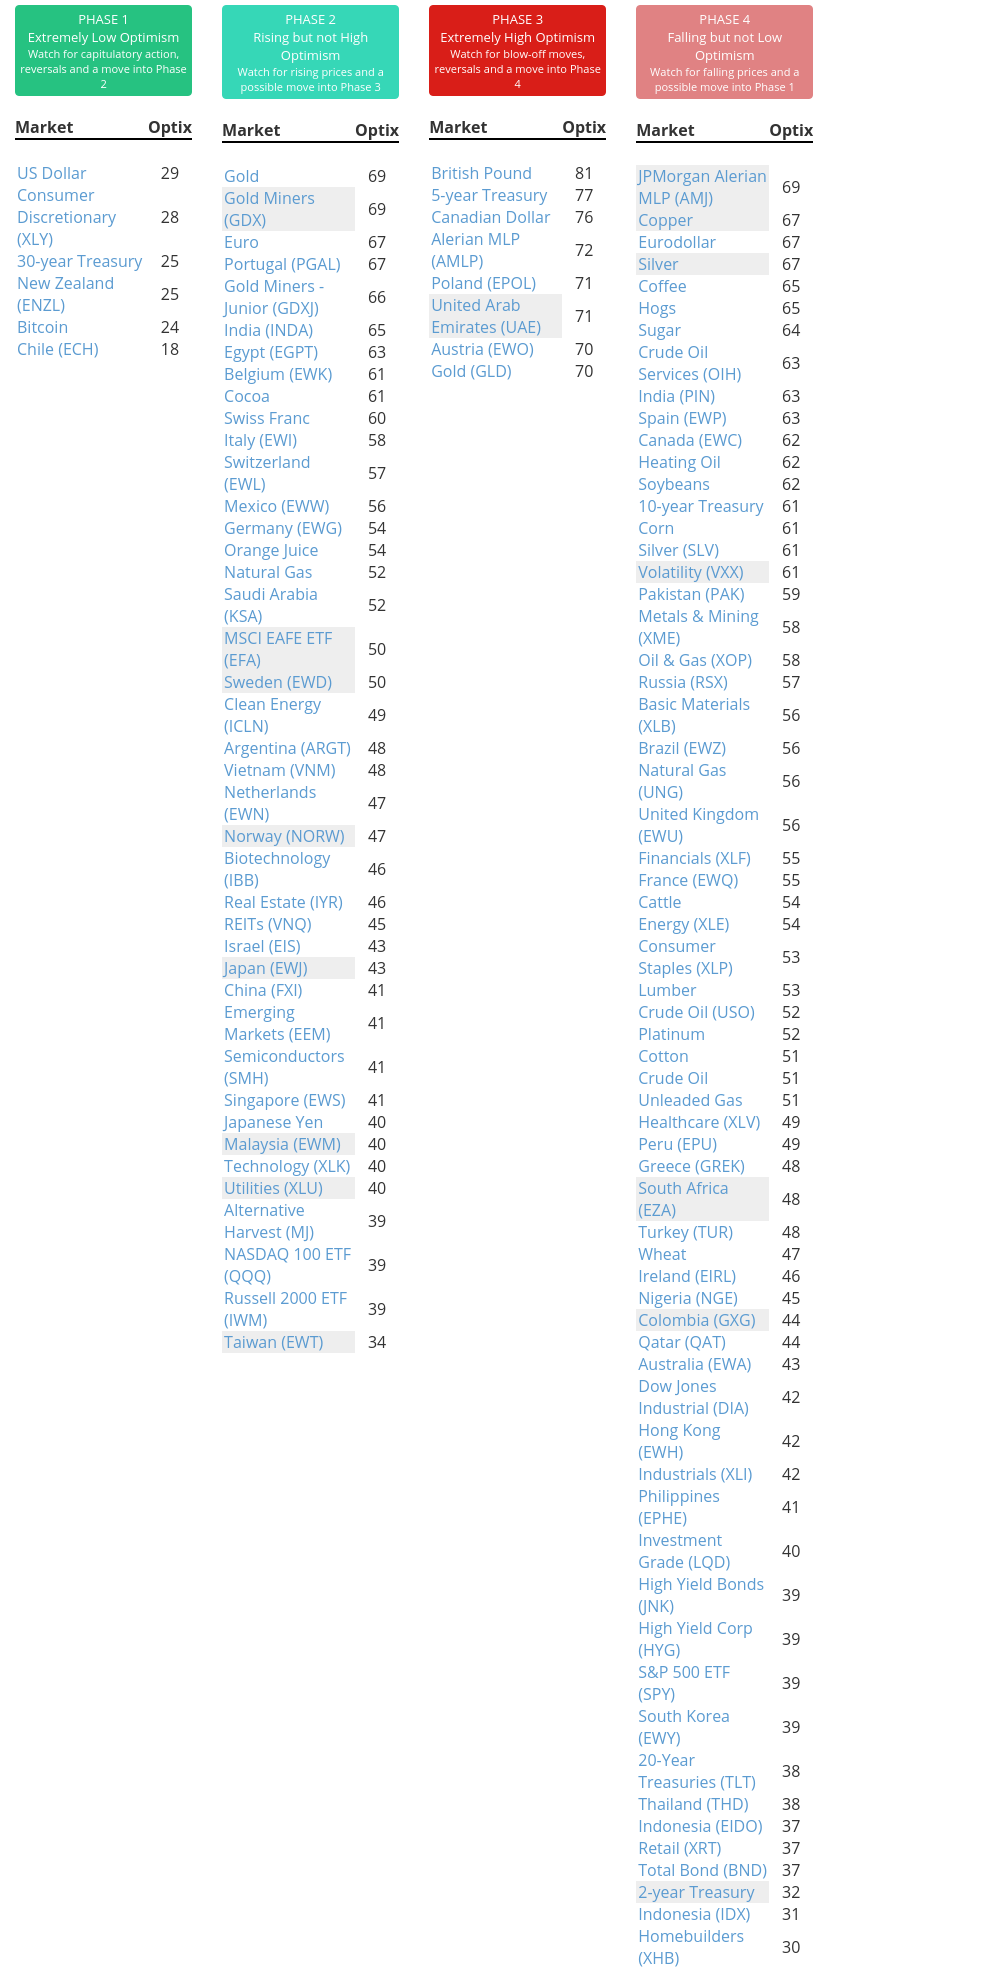
Phase Table
Ranks
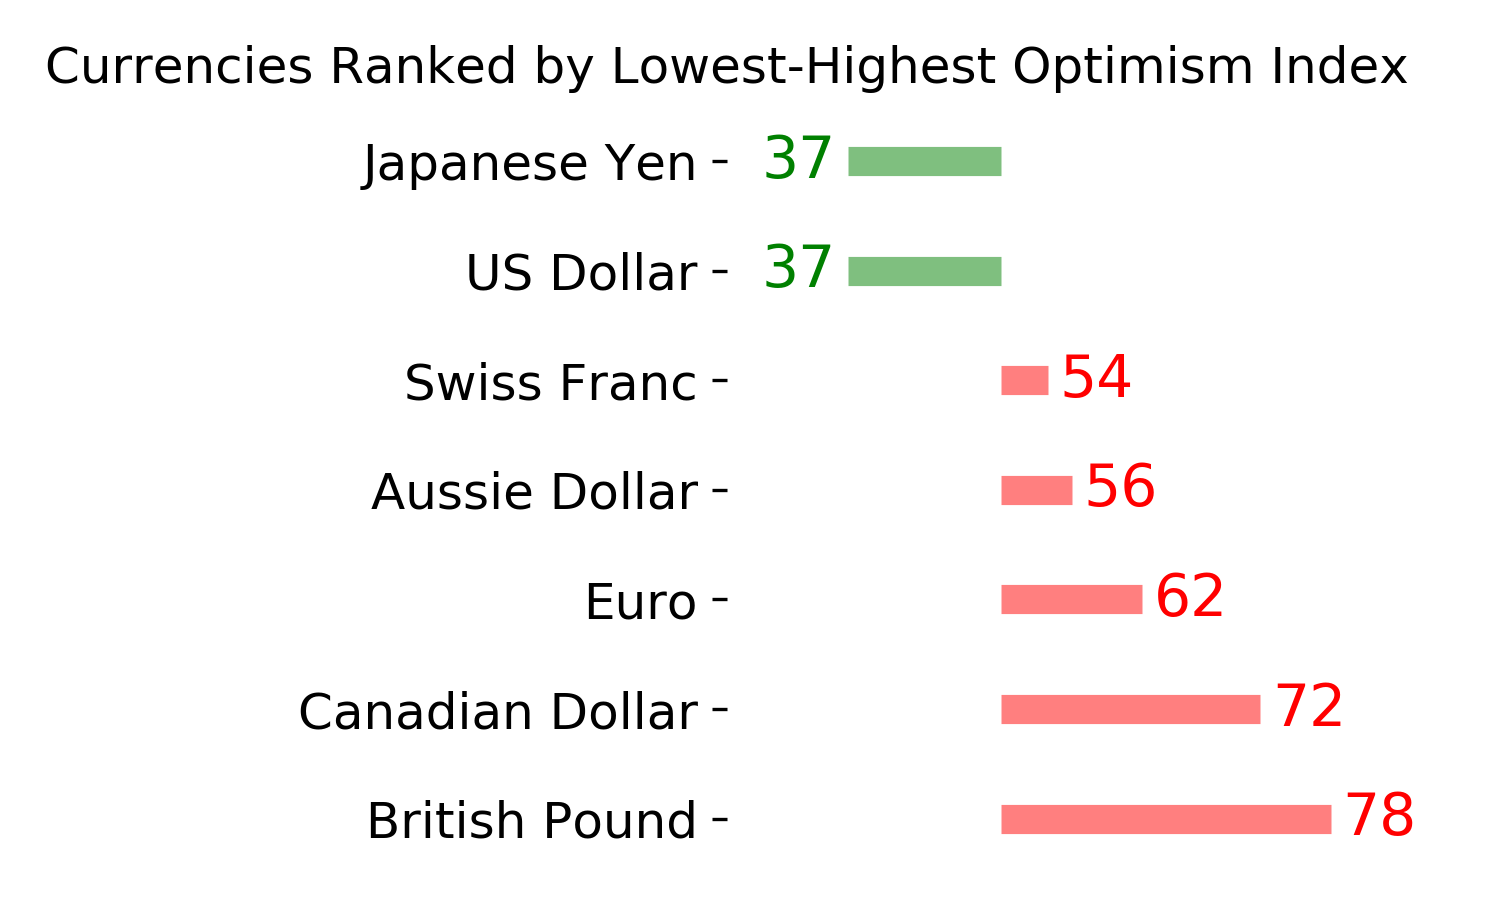
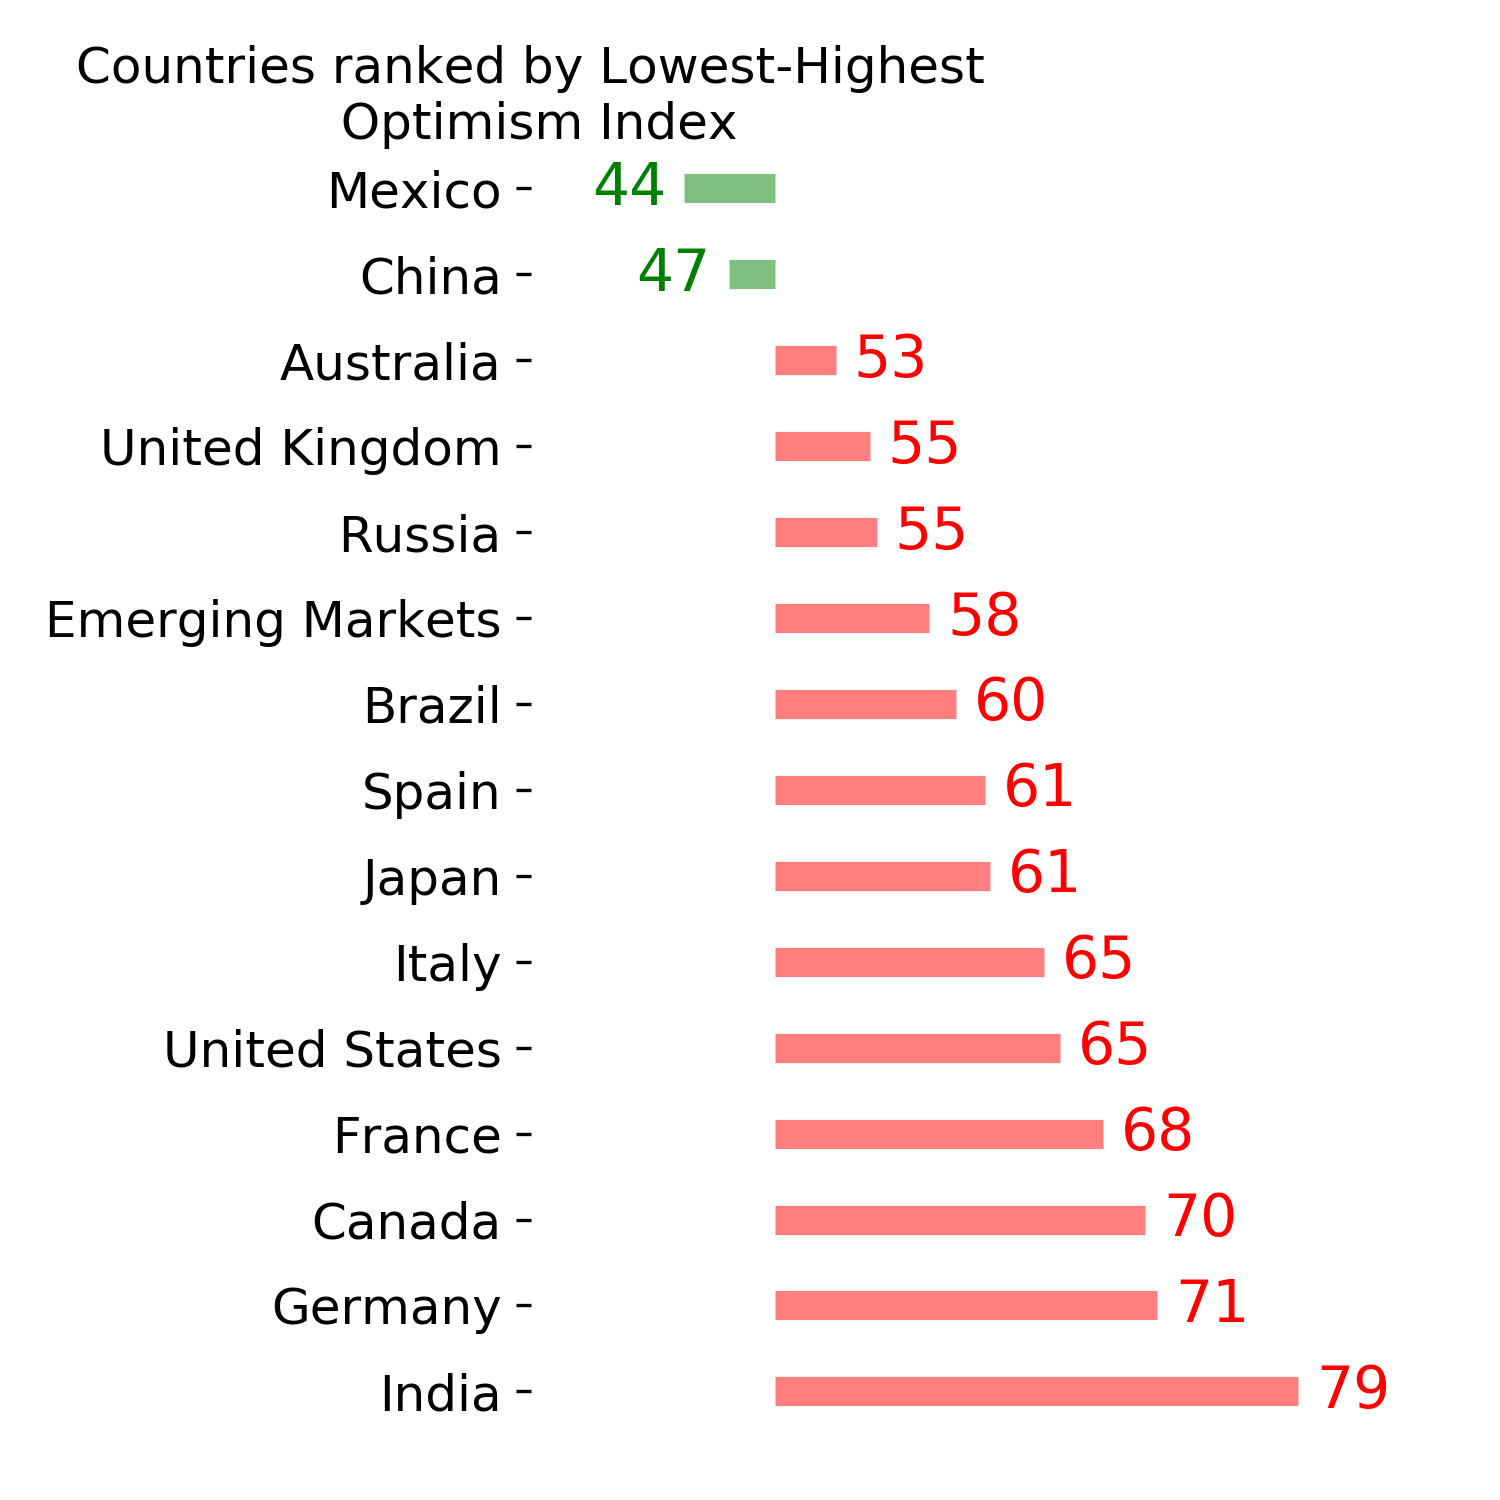
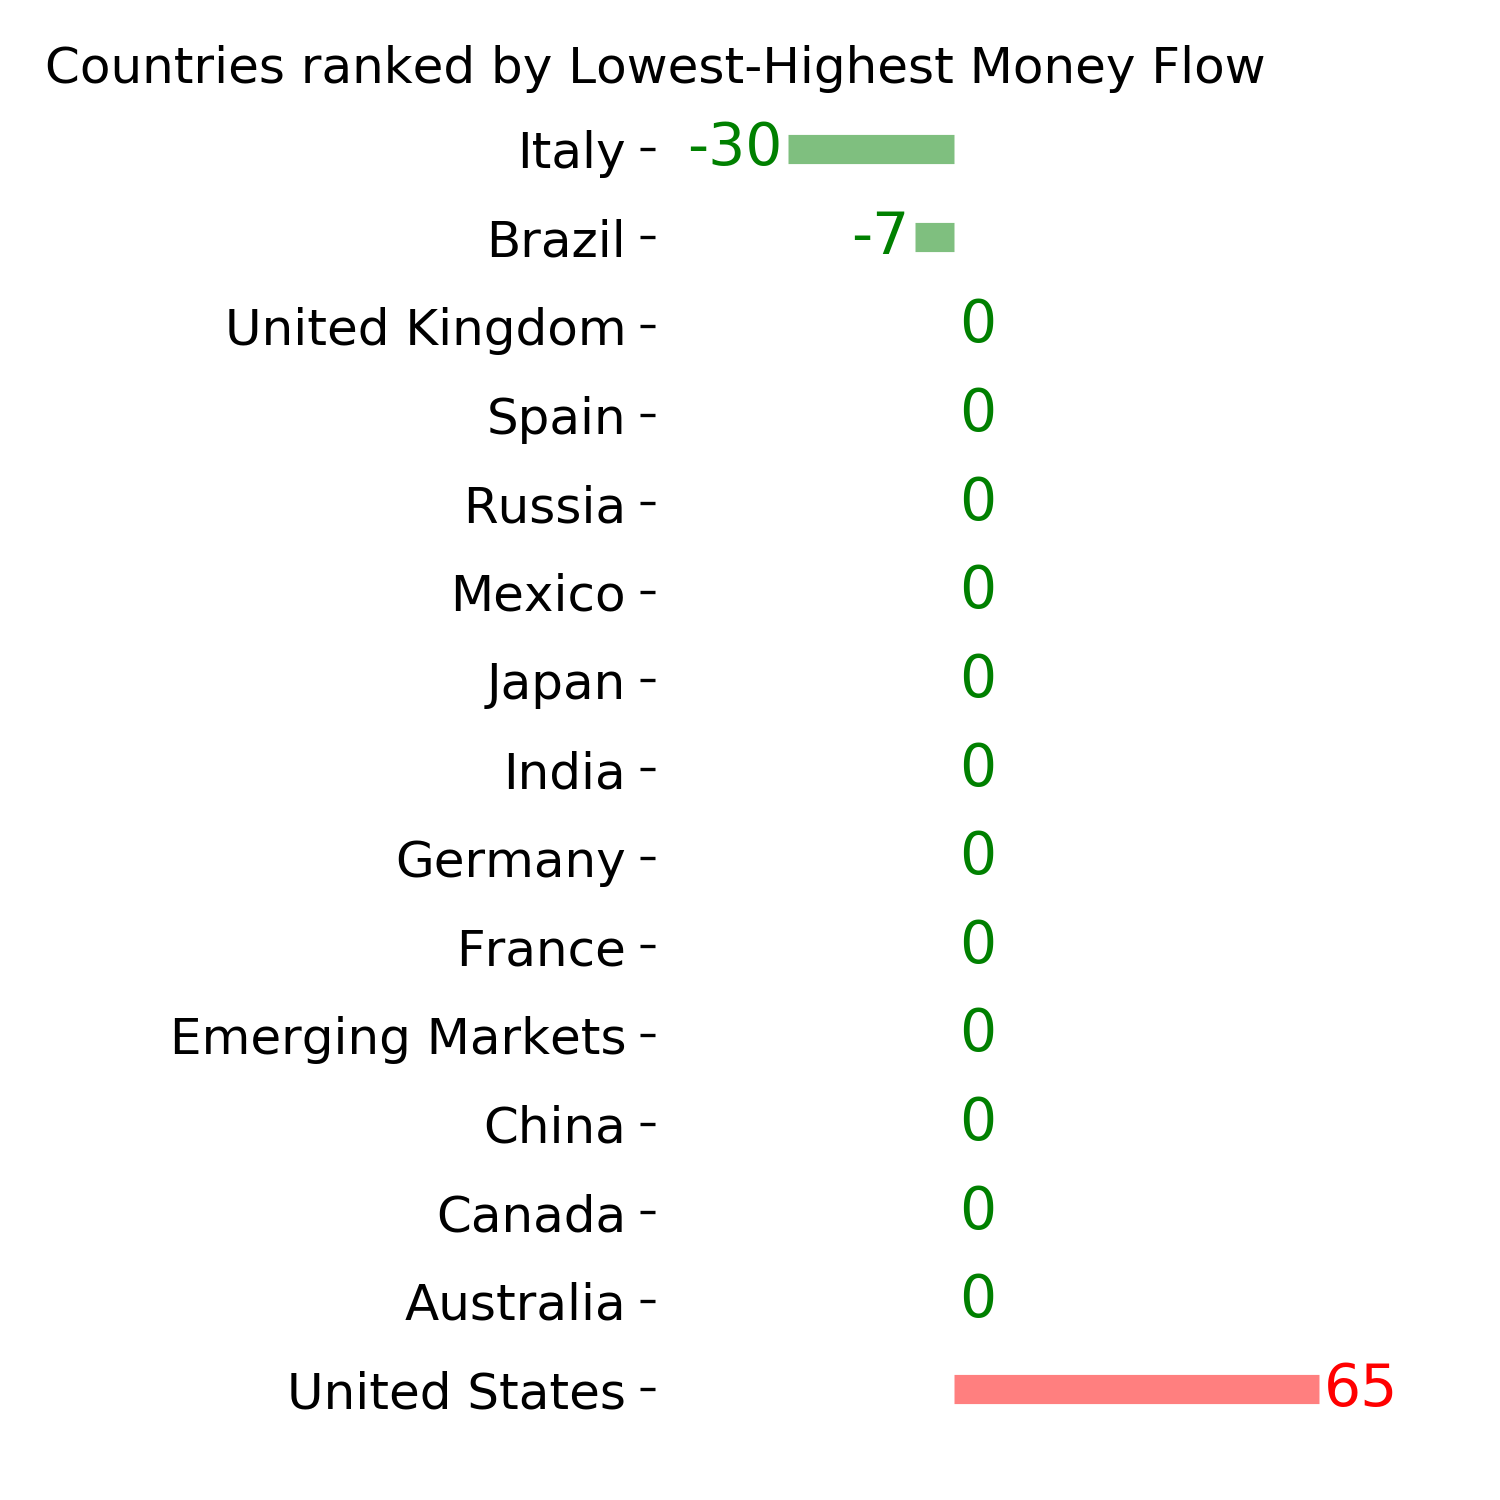
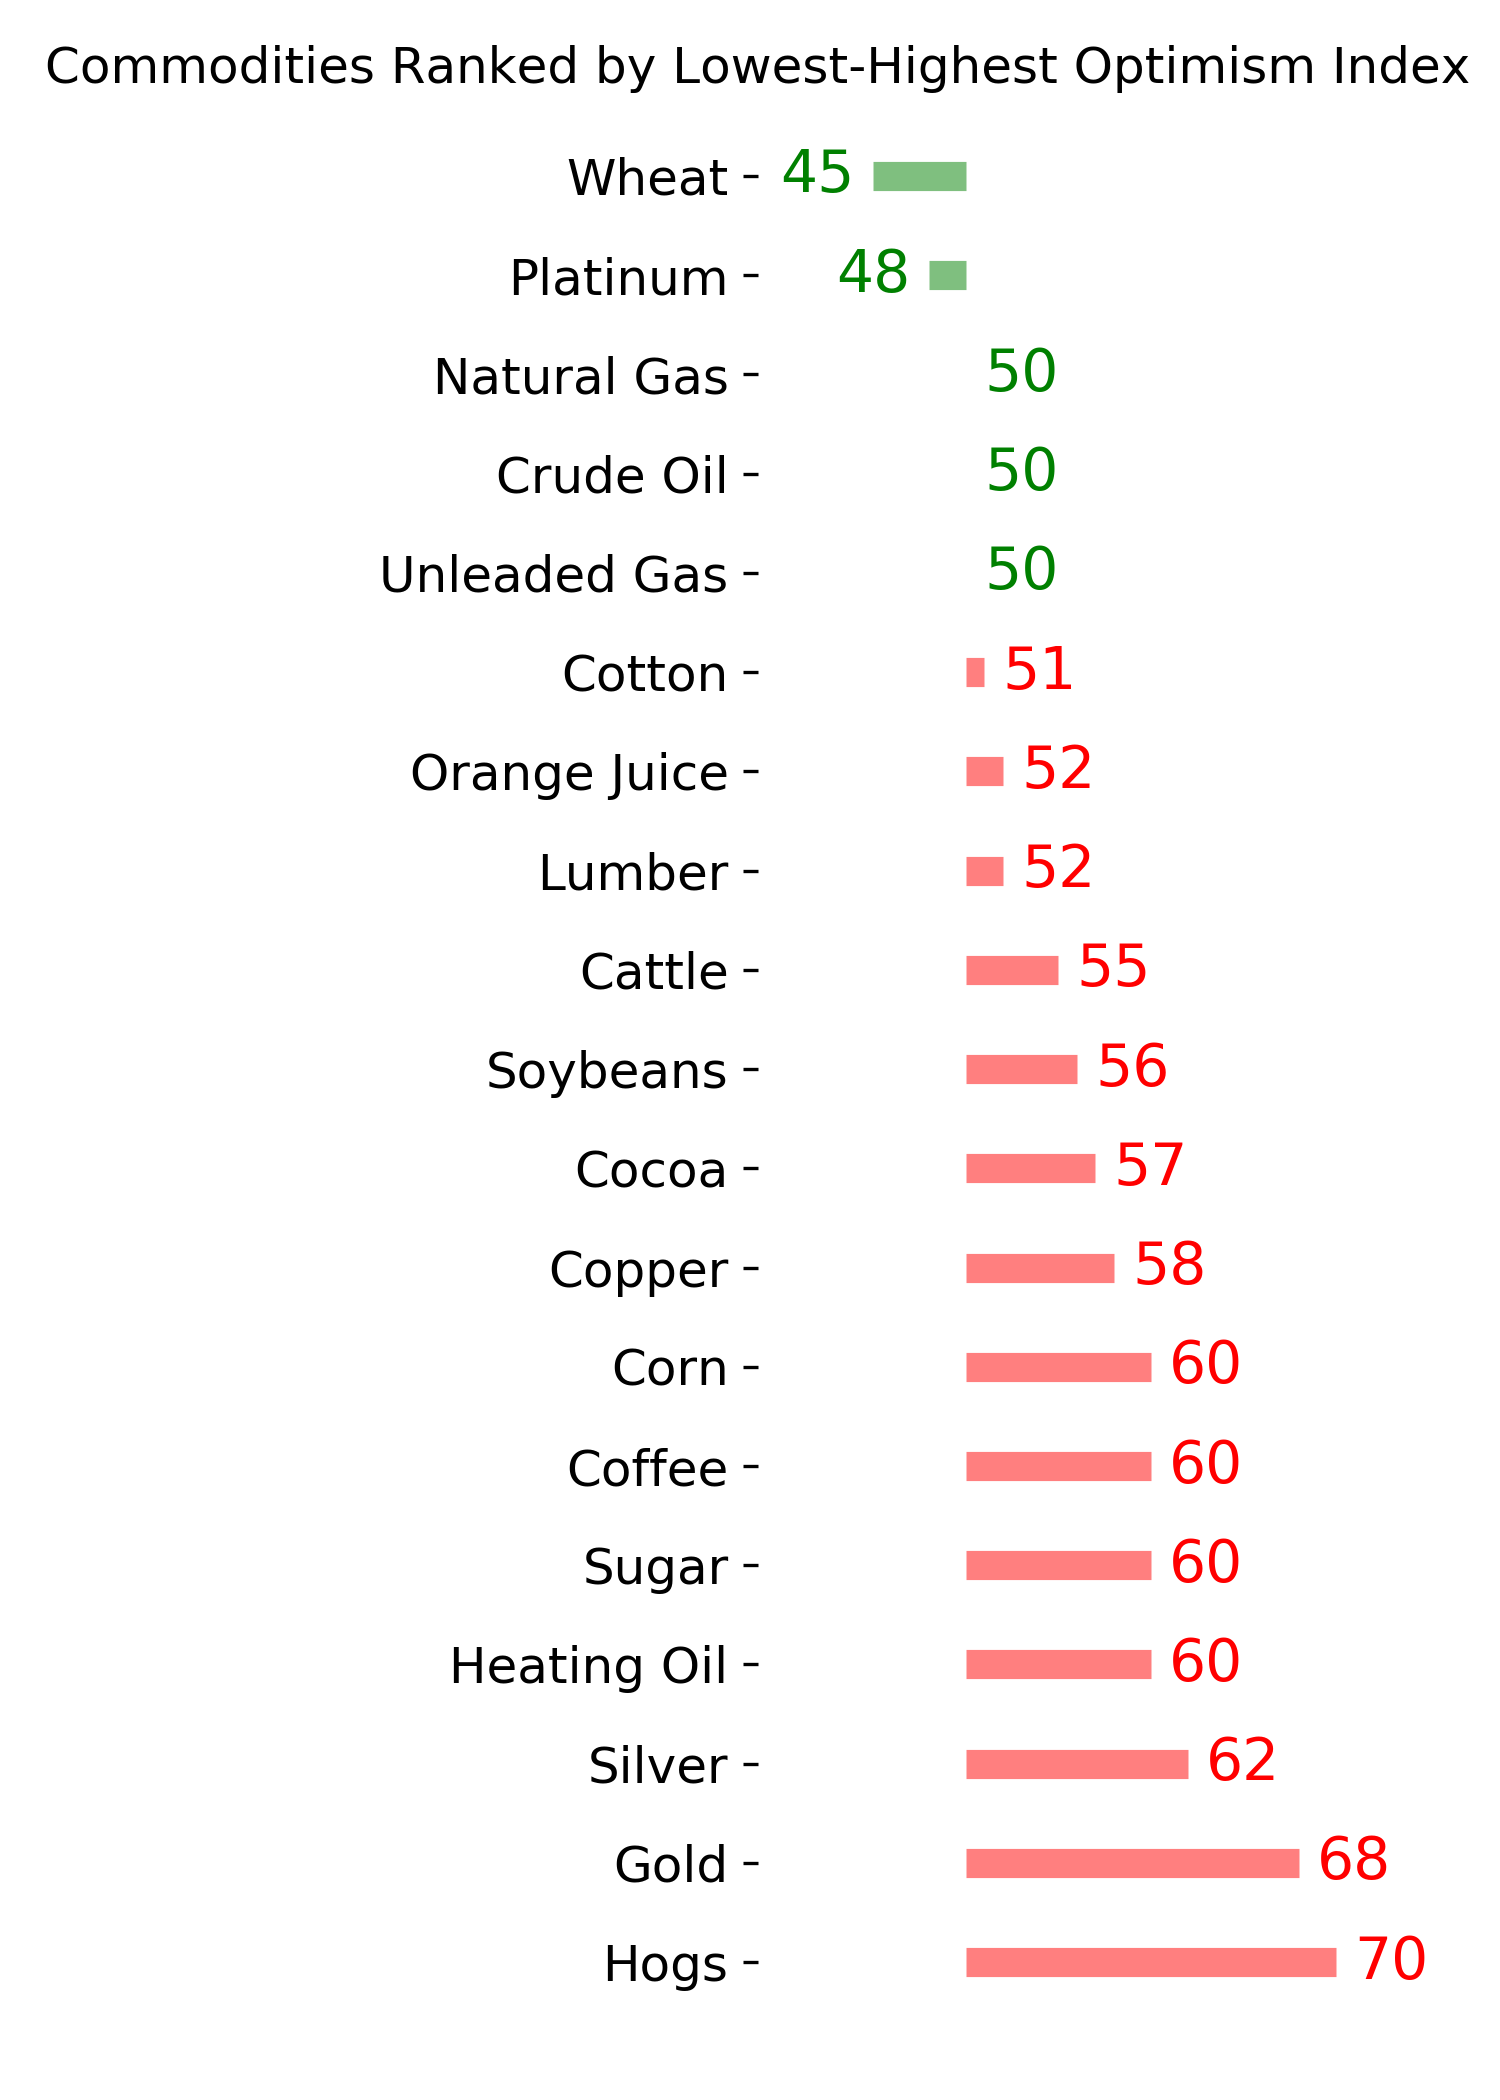
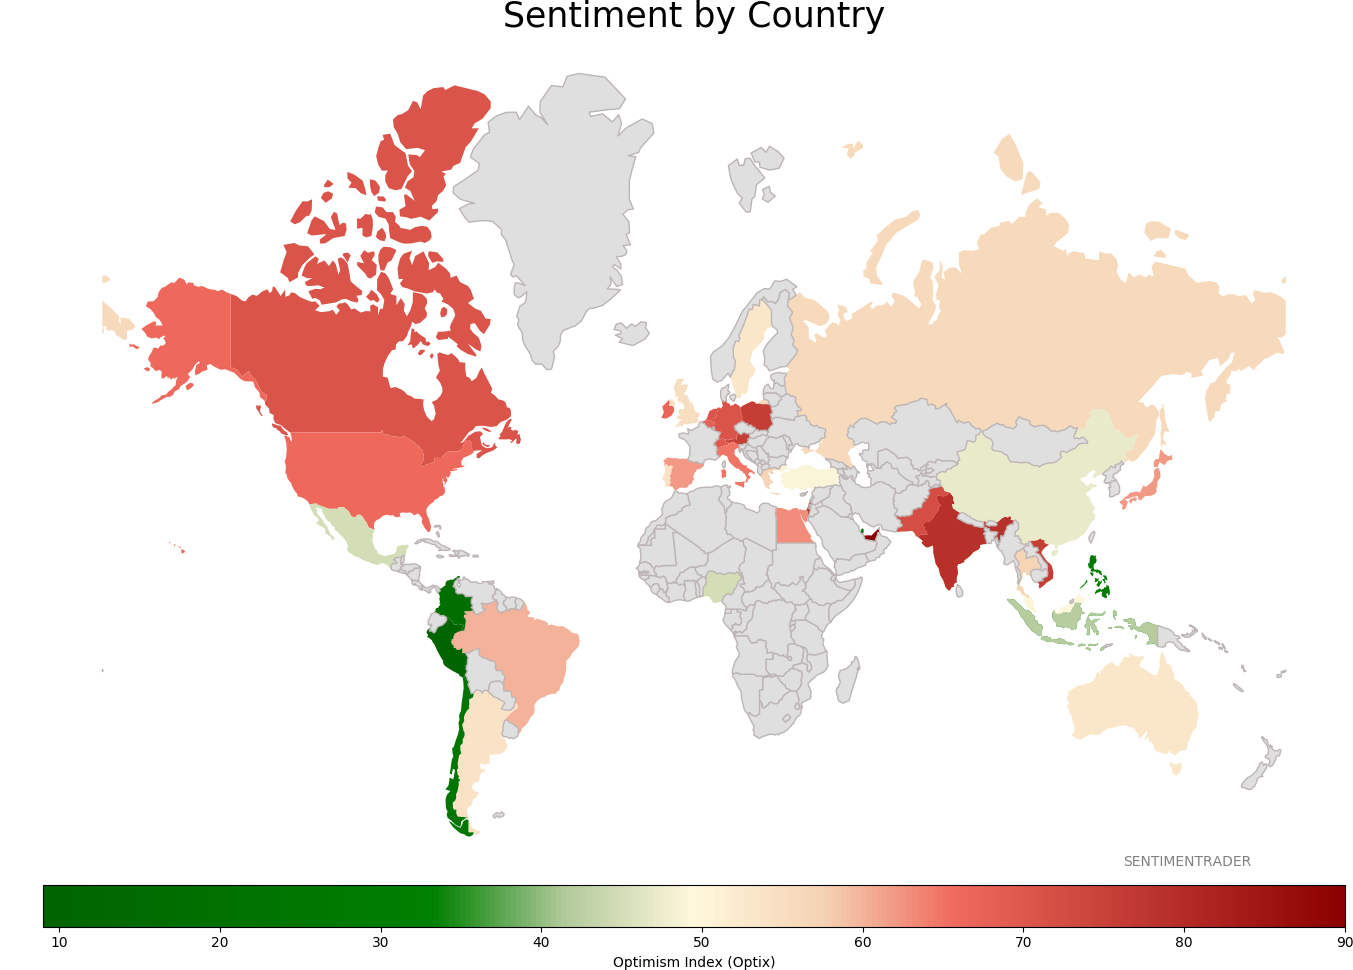
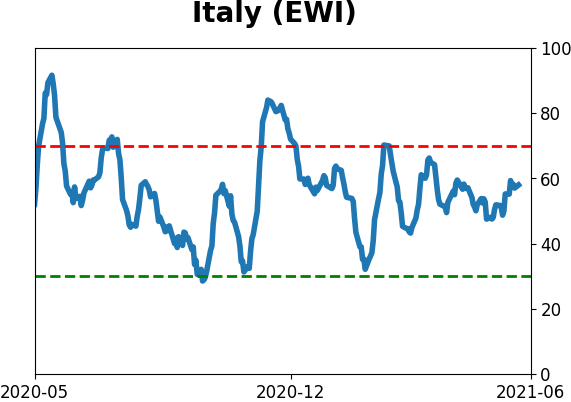
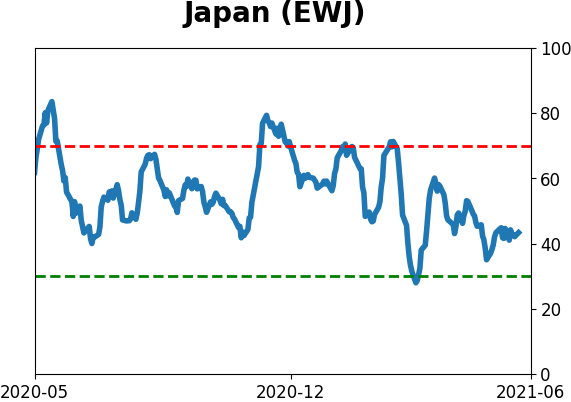
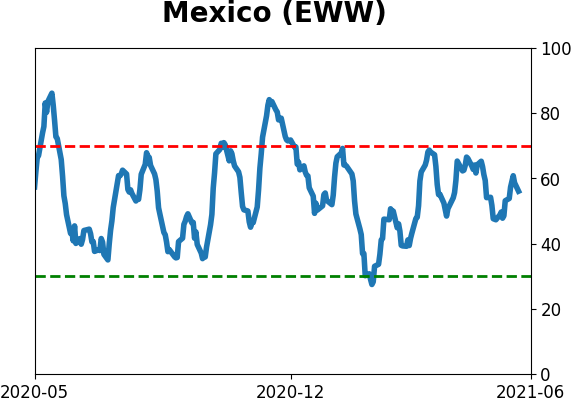
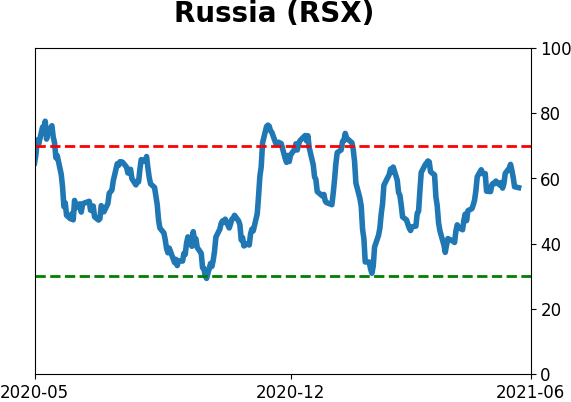
Sentiment Around The World
Optimism Index Thumbnails
|
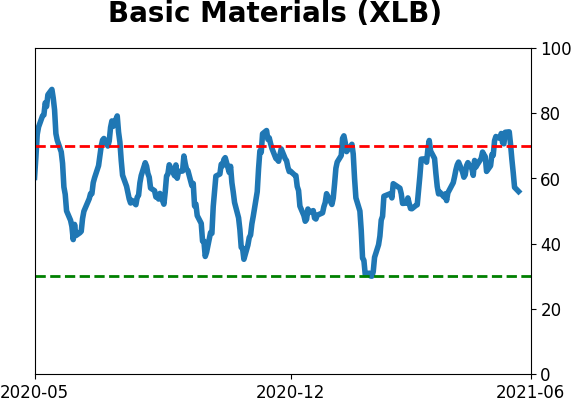
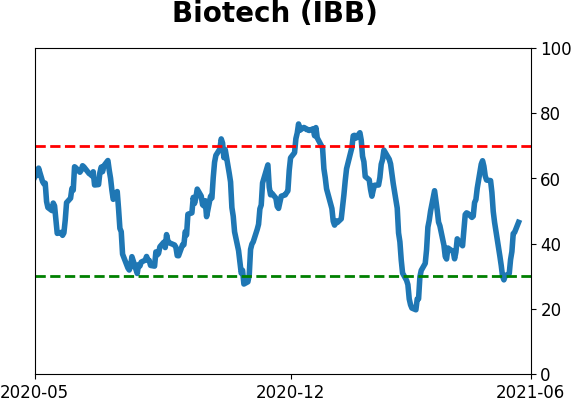
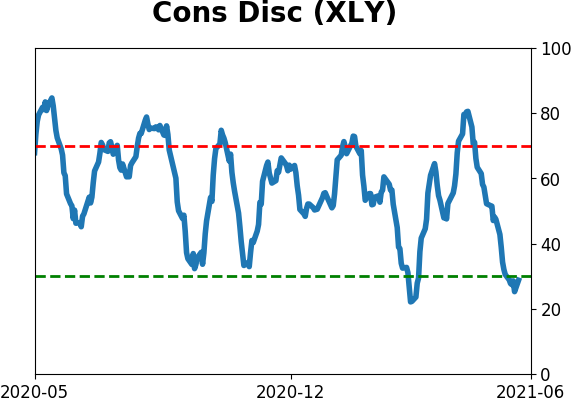
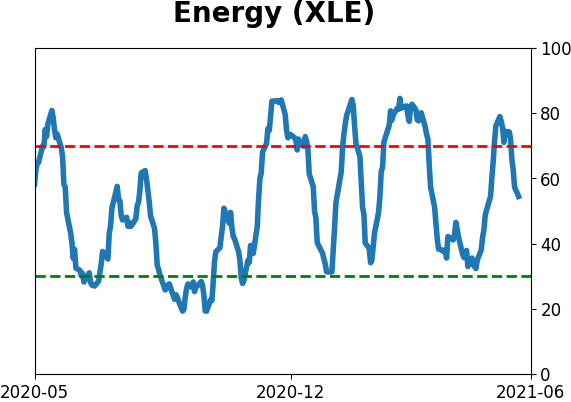
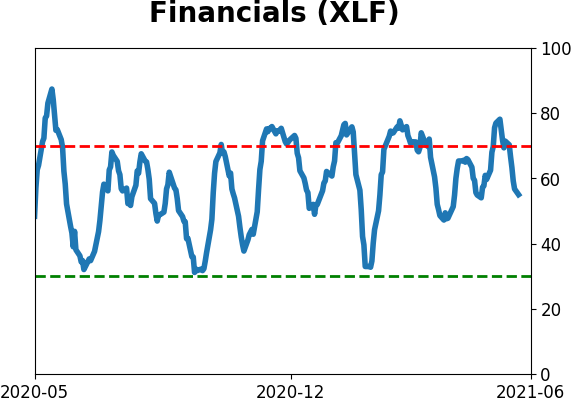
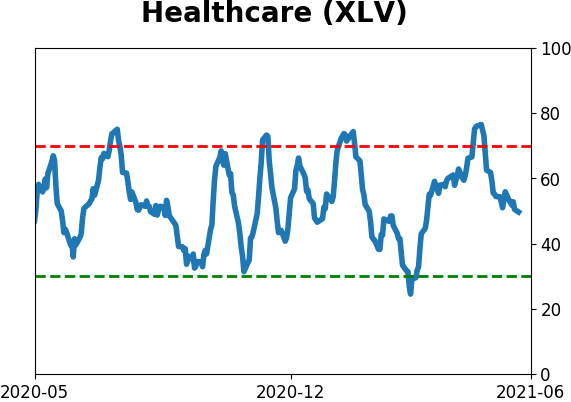
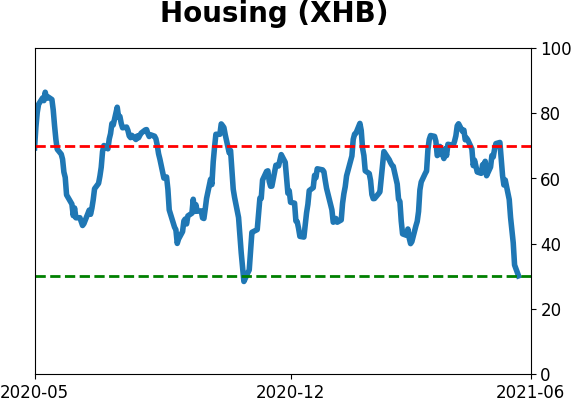
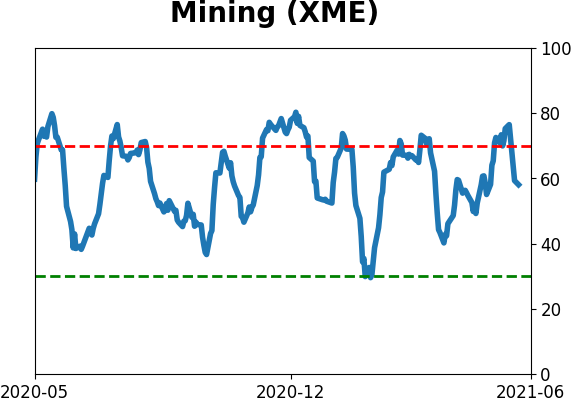
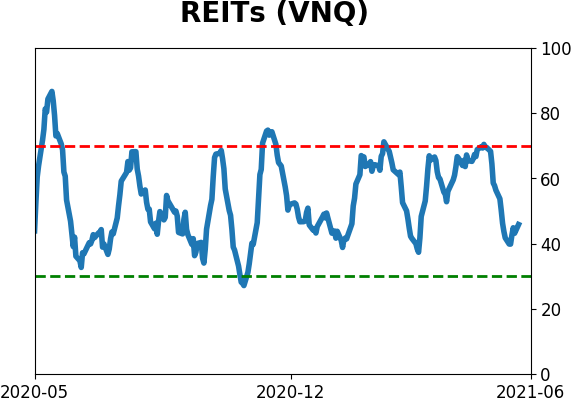
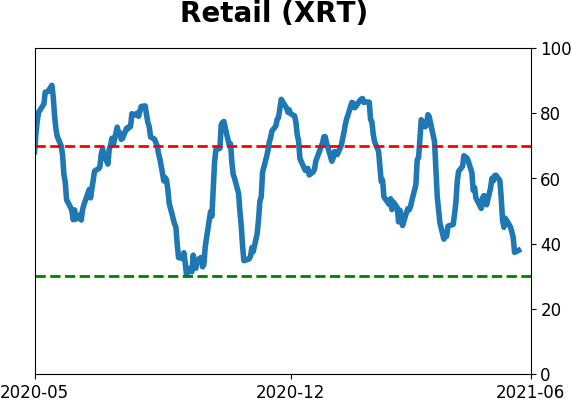
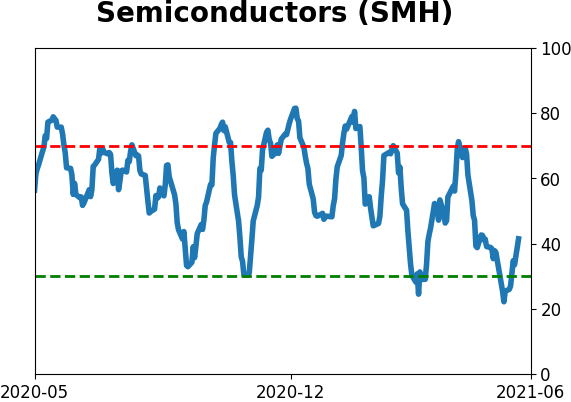
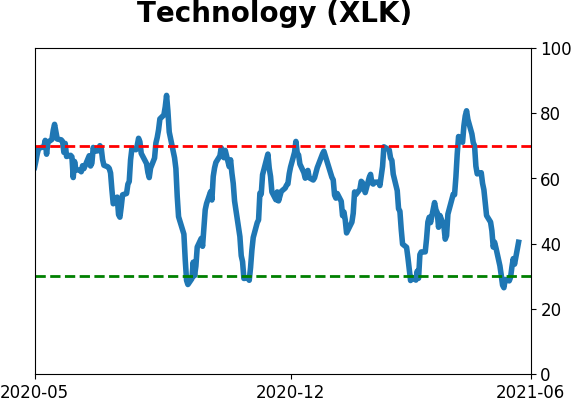
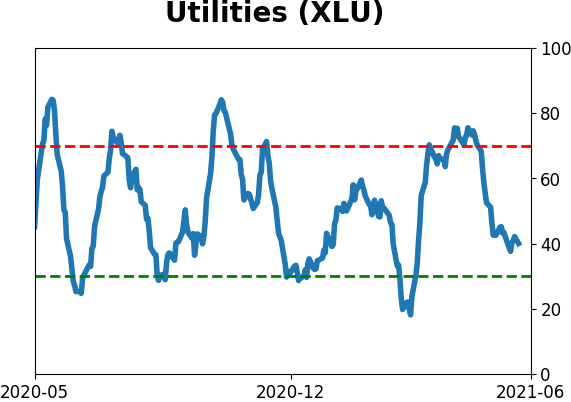
Sector ETF's - 10-Day Moving Average
|
|
|
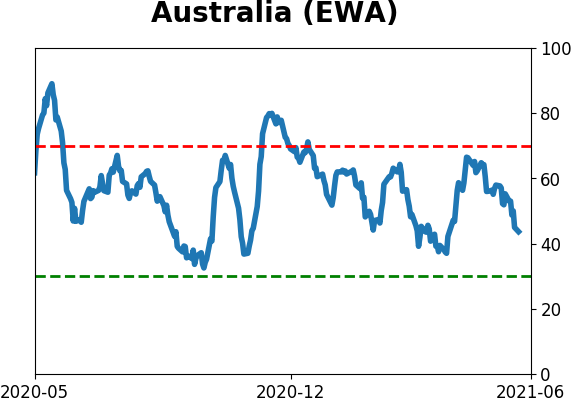
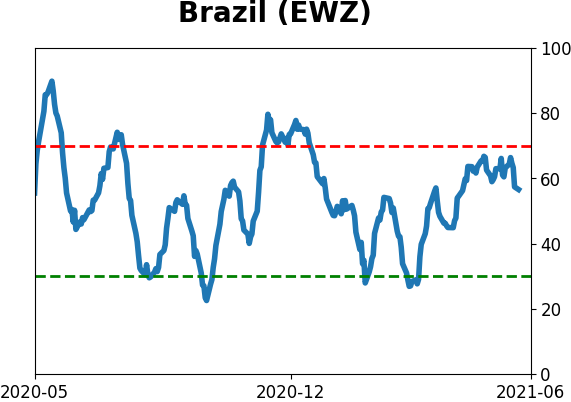
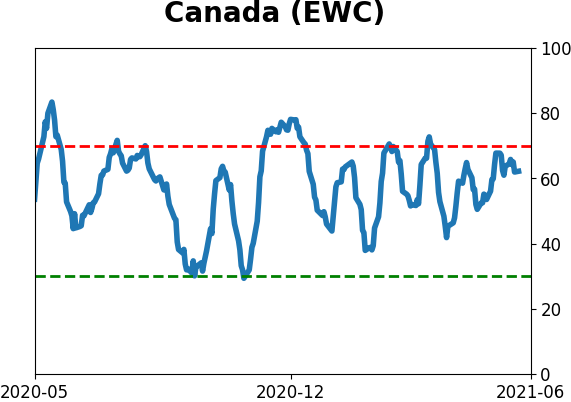
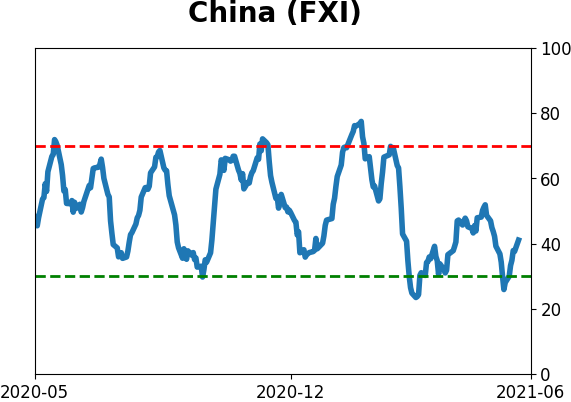
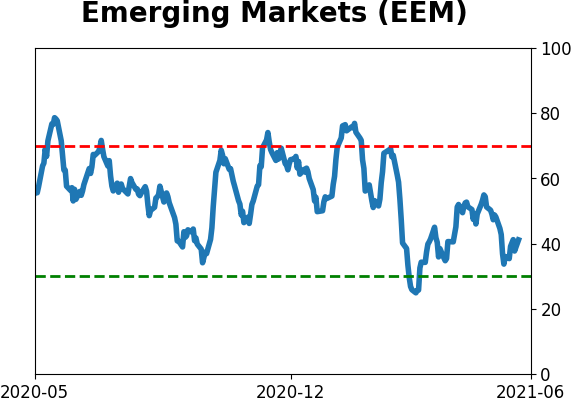
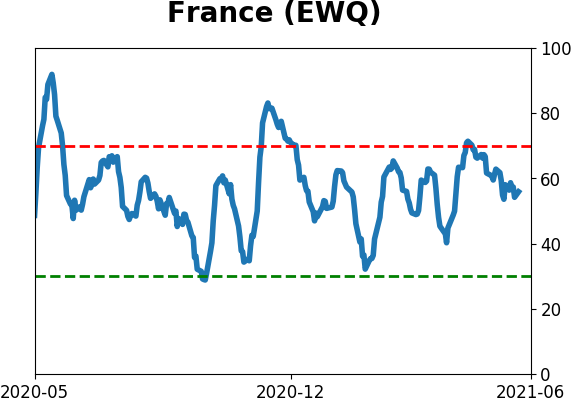
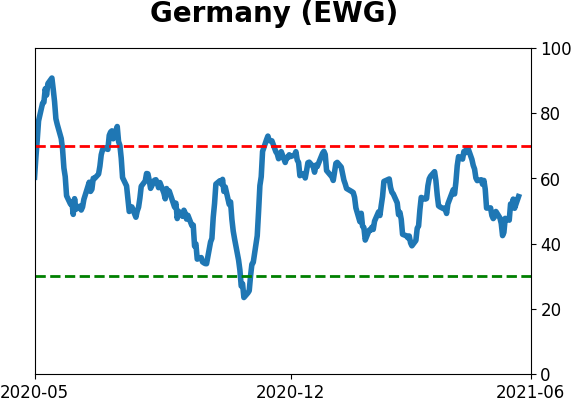
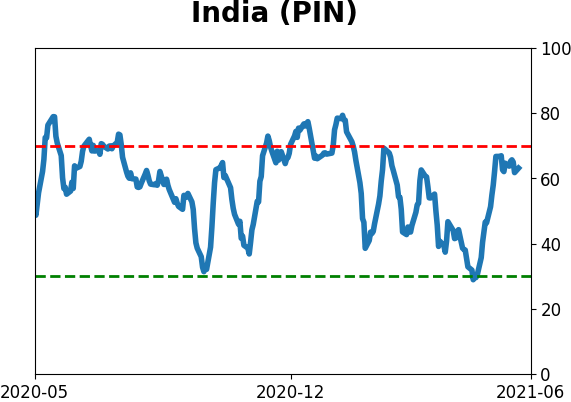
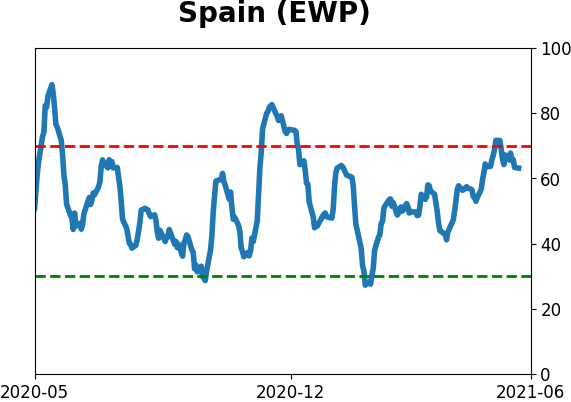
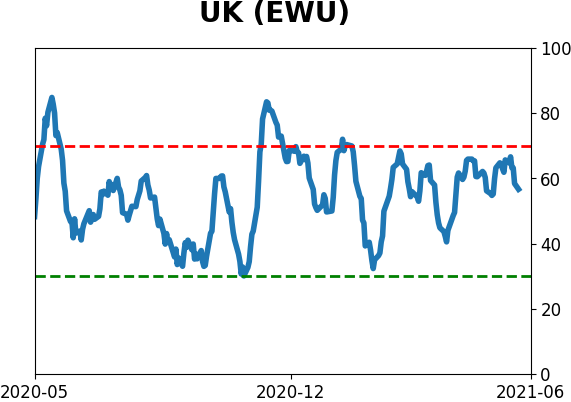
Country ETF's - 10-Day Moving Average
|
|
|
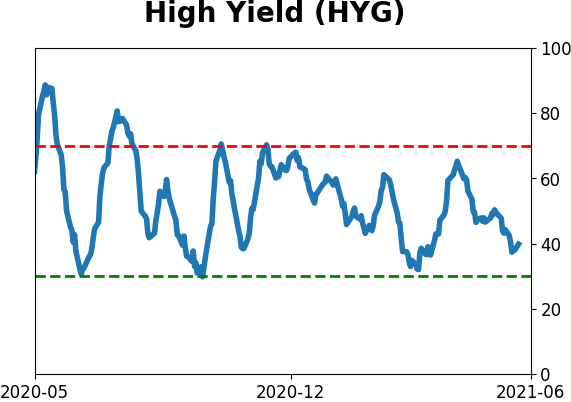
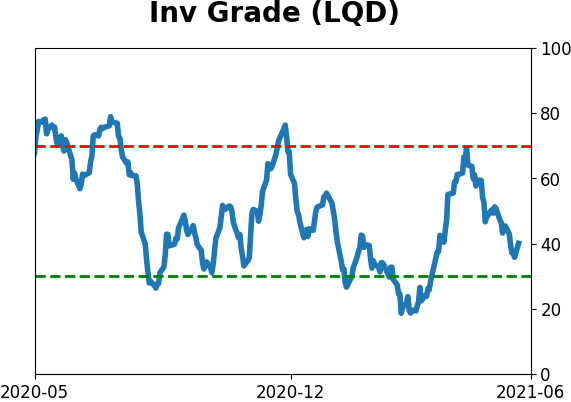
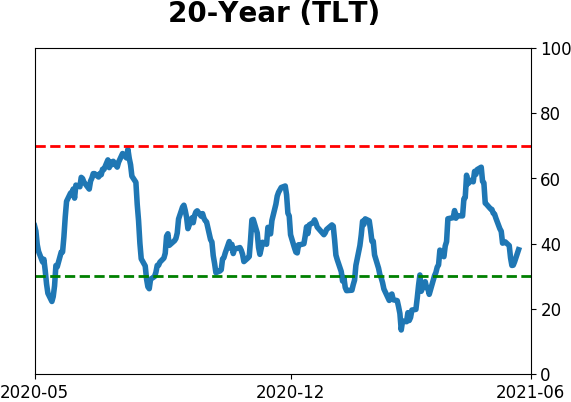
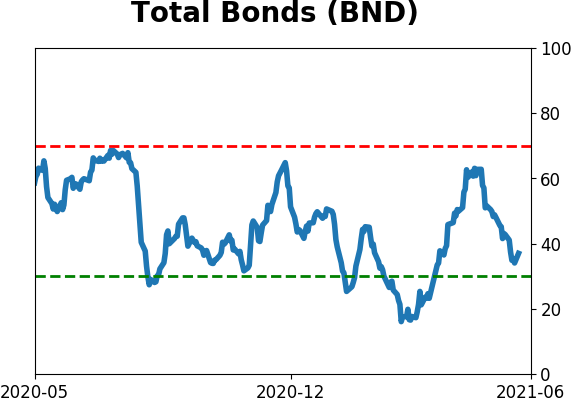
Bond ETF's - 10-Day Moving Average
|
|
|
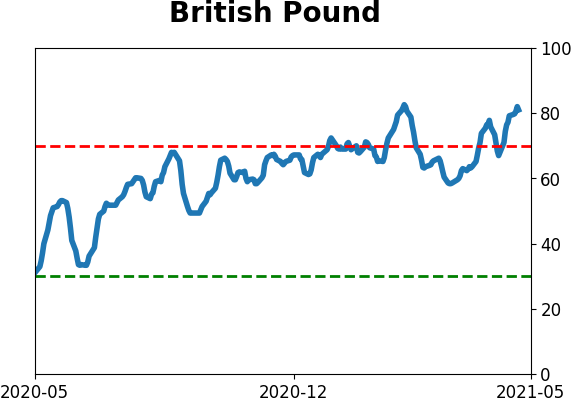
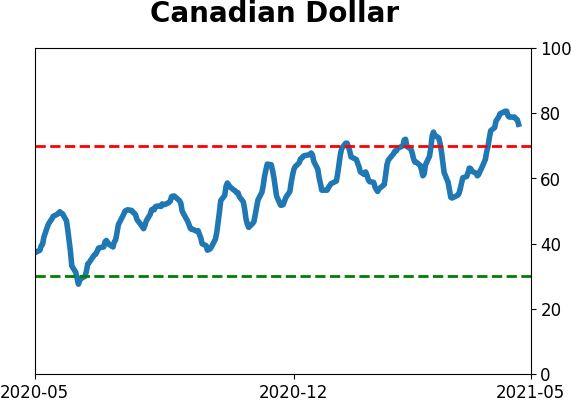
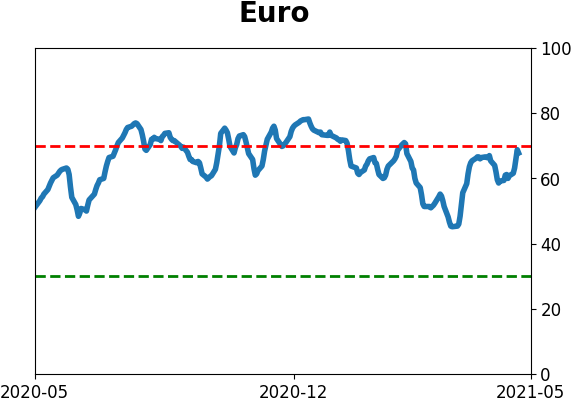
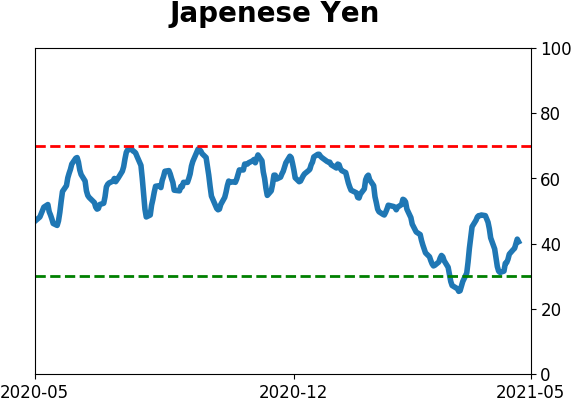
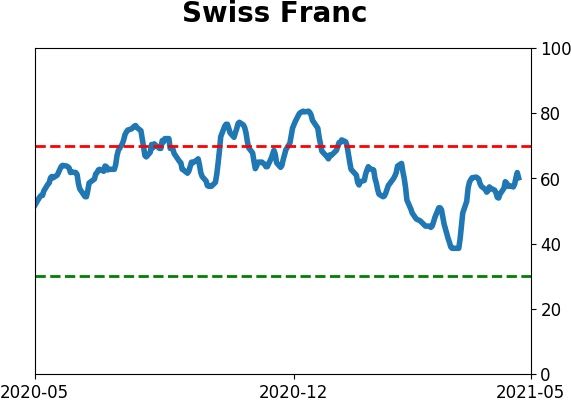
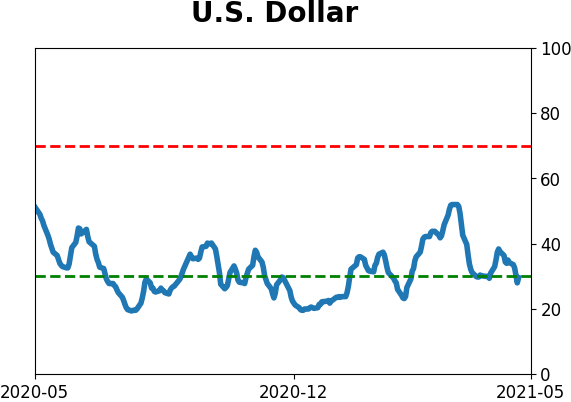
Currency ETF's - 5-Day Moving Average
|
|
|
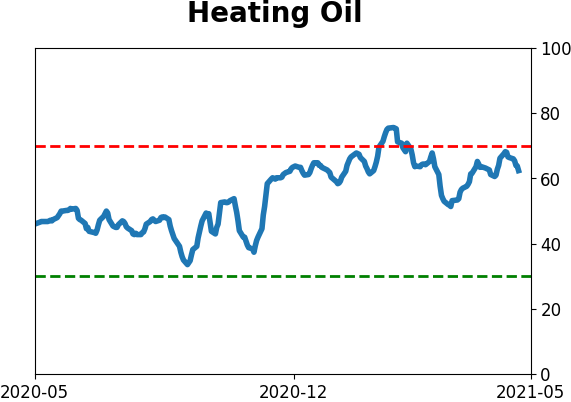
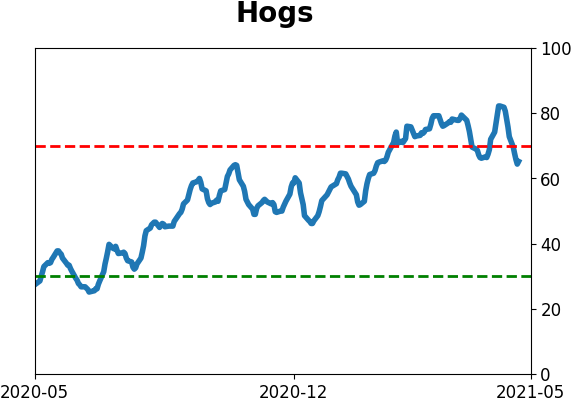
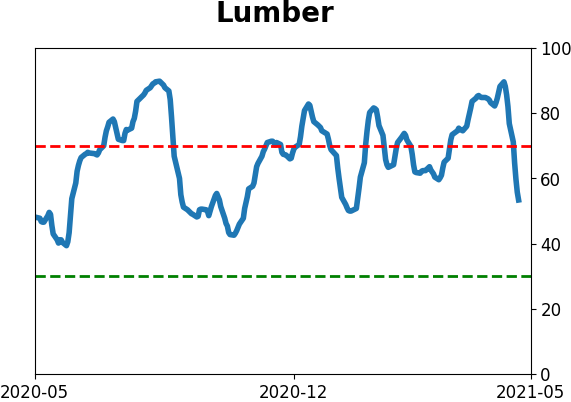
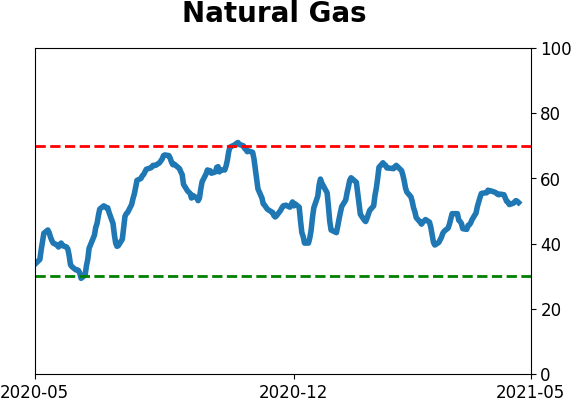
Commodity ETF's - 5-Day Moving Average
|
|