Headlines
|
|
Gold bugs finally follow through:
Gold mining stocks have a long and inglorious history of disappointing investors. Those folks are once again starting to believe, which is always a dangerous sentiment in this sector. But other times they've performed like this, with many new 52-week highs, and many fewer corrections and bear markets, they tended to keep rallying over the next few months.
|
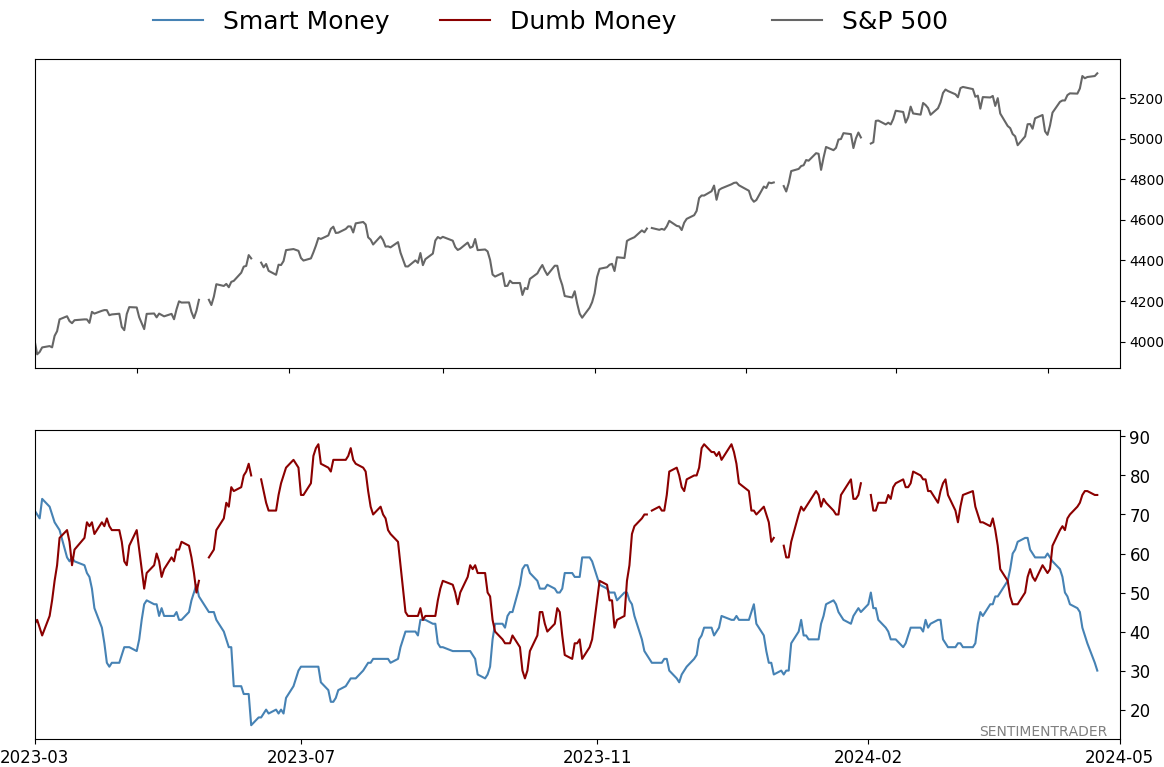
Smart / Dumb Money Confidence
|
Smart Money Confidence: 30%
Dumb Money Confidence: 75%
|
|
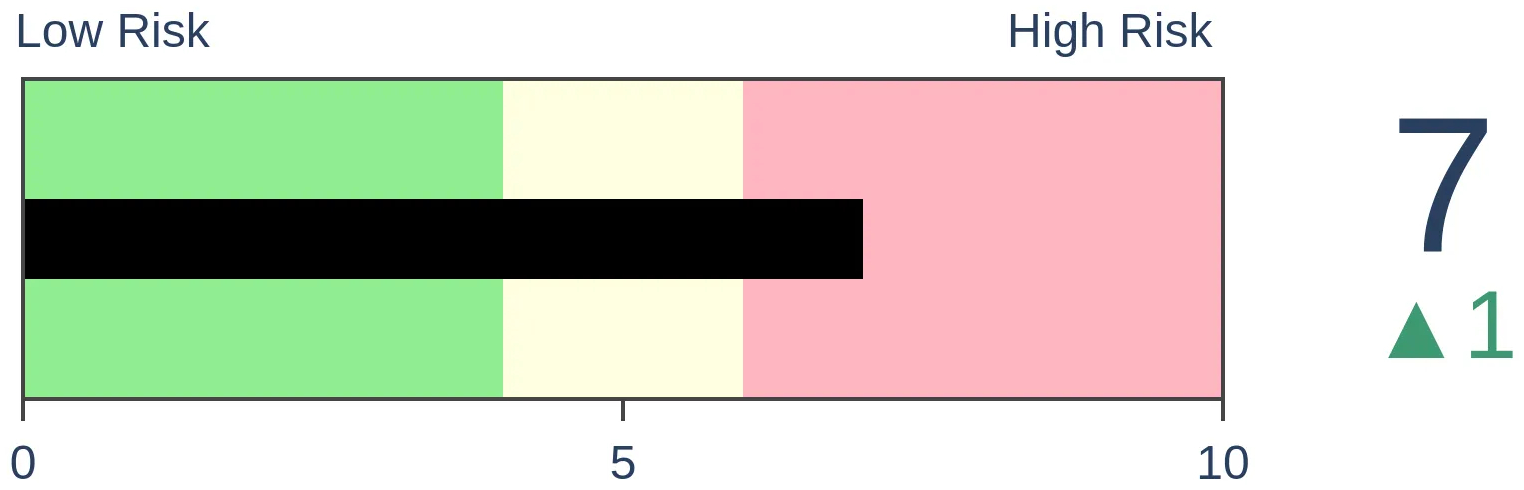
Risk Levels
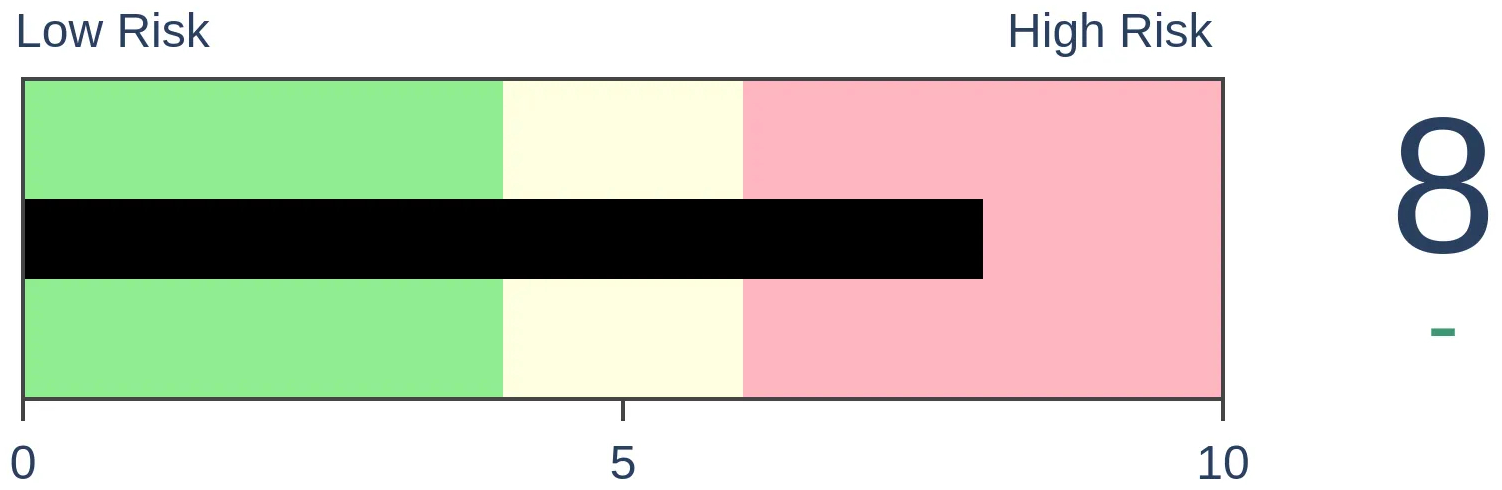
Stocks Short-Term
|
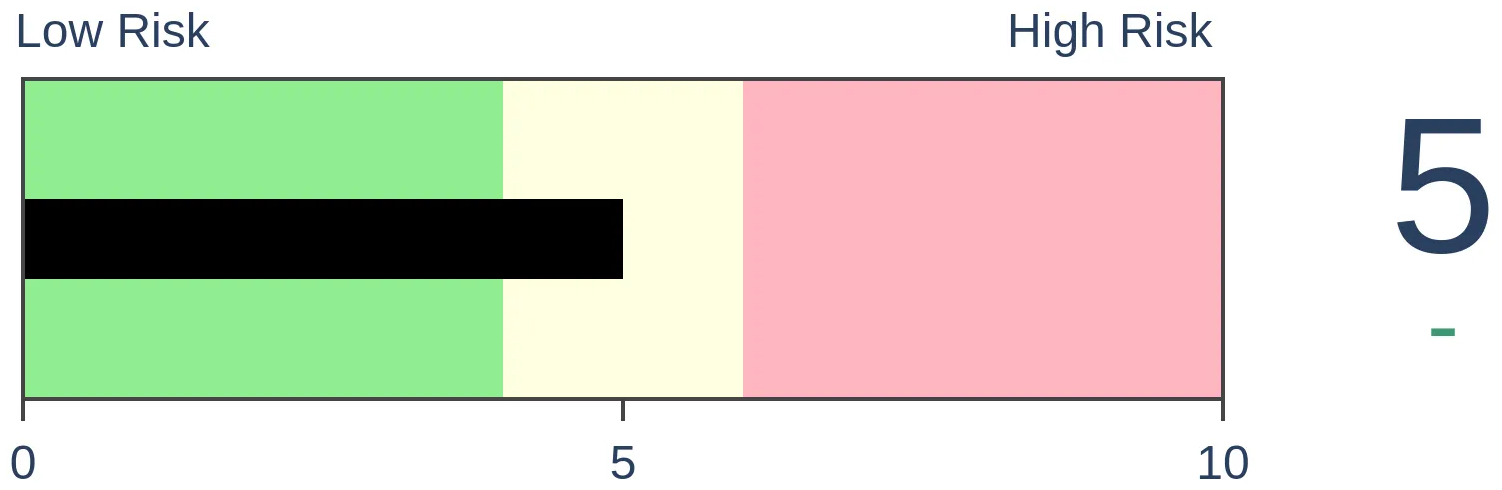
Stocks Medium-Term
|
|
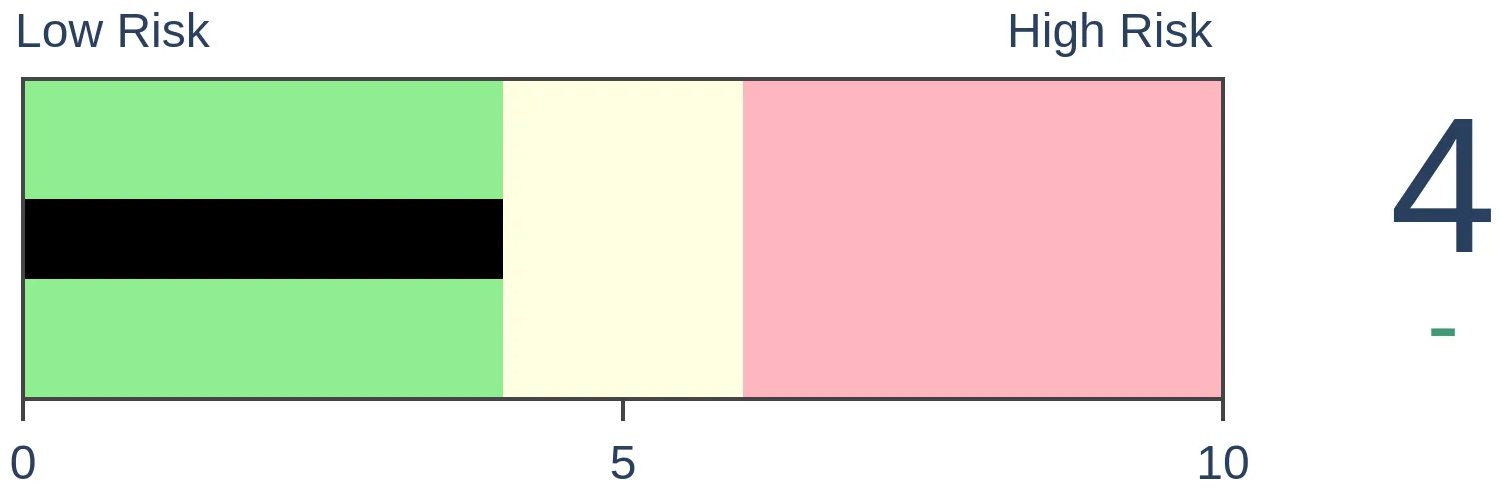
Bonds
|
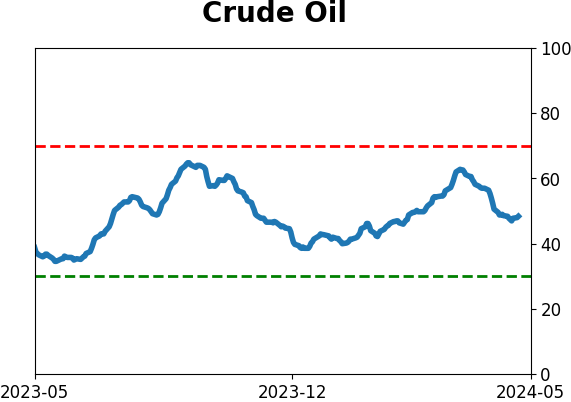
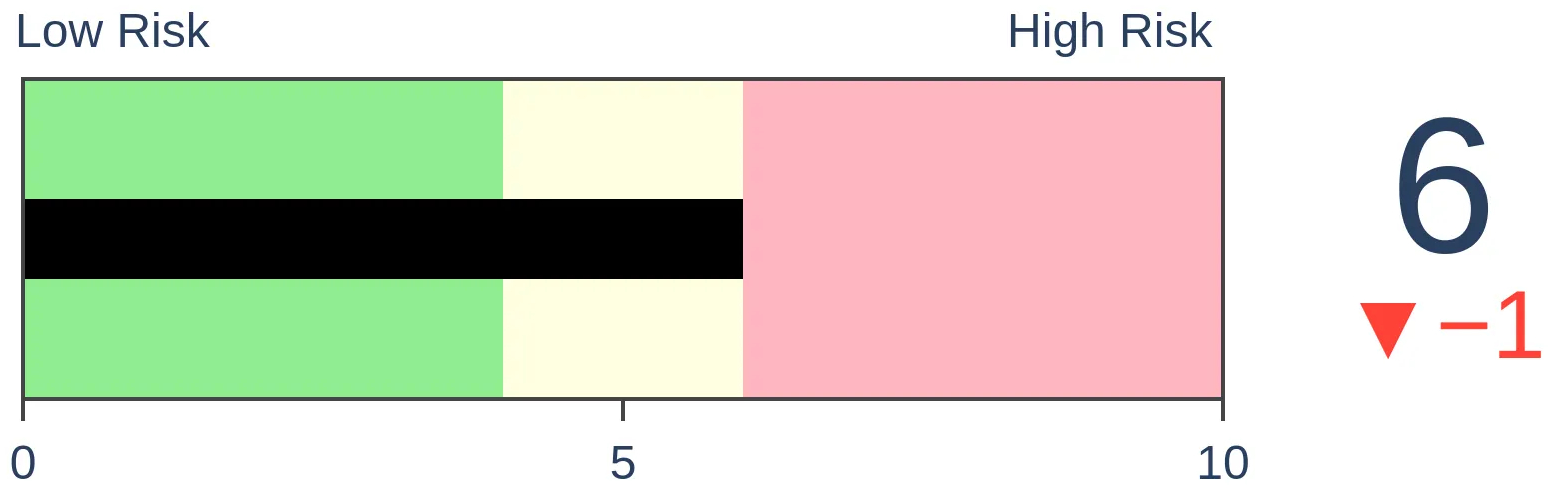
Crude Oil
|
|
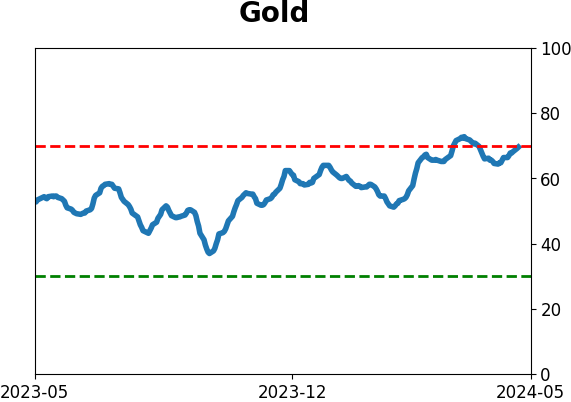
Gold
|
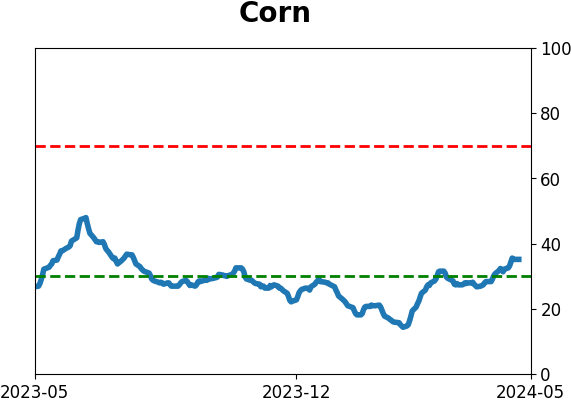
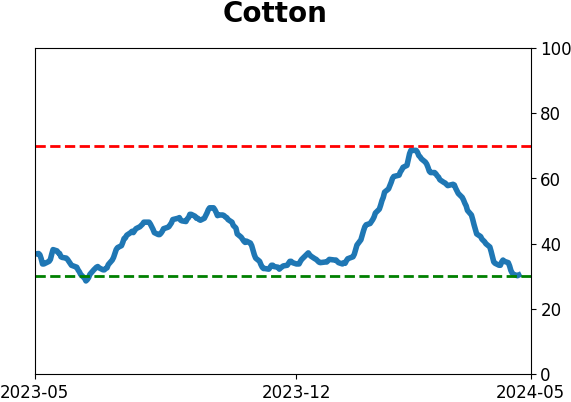
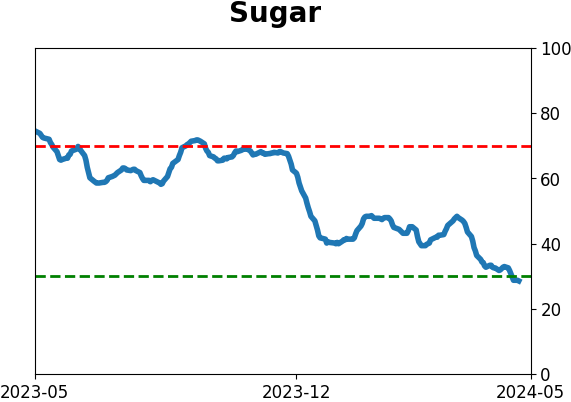
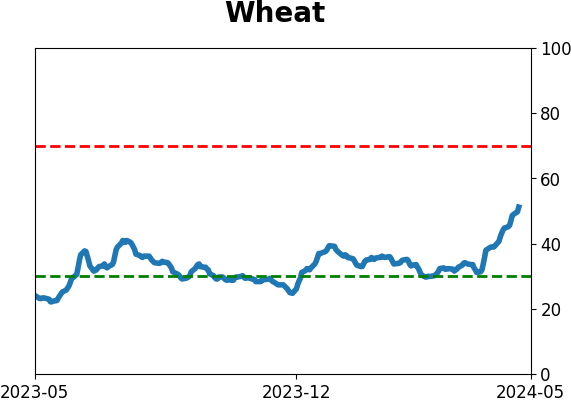
Agriculture

|
|
Research
By Jason Goepfert
BOTTOM LINE
Gold mining stocks have a long and inglorious history of disappointing investors. Those folks are once again starting to believe, which is always a dangerous sentiment in this sector. But other times they've performed like this, with many new 52-week highs, and many fewer corrections and bear markets, they tended to keep rallying over the next few months.
FORECAST / TIMEFRAME
None
|
Key points:
- More than 40% of gold mining stocks have reached 52-week highs
- Few of the stocks are now in corrections or bear markets, a stark change from a few months ago
- Similar cycles in this sector over the past 30 years had a good record of further gains over the next few months
Miners see more and more blue skies
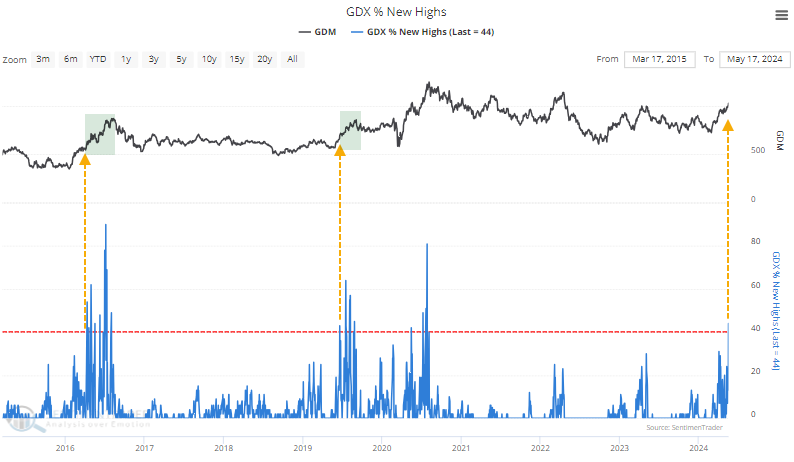
A little over a month ago, we examined the surge in gold mining stocks. About a third of them had reached 52-week highs, a concerted push with an inauspicious record in this sector. If buyers continued to show interest, it would tell us quite a bit about their longer-term prospects.
And interest they have shown. Miners dipped for a couple of weeks after that, but buyers saw that as an opportunity, which is rare for this particular sector. As a result, more than 40% of mining stocks hit a 52-week high last week. This was the first reading over 40% in over a year, and the last couple of instances marked the nascent stages of impressive rallies.
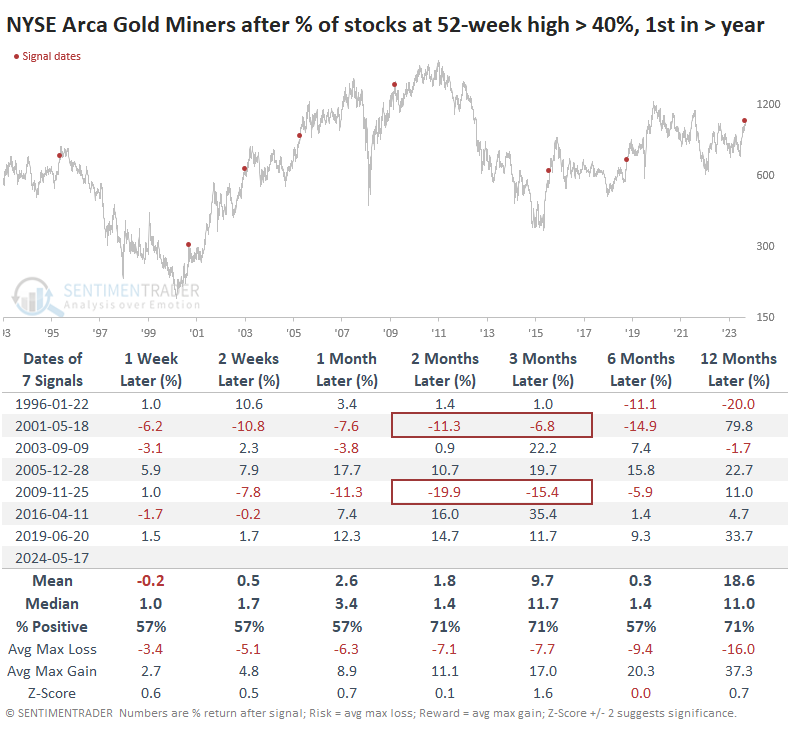
Over the past 30 years, the first time more than 40% of gold miners reached a 52-week high at the same time mostly preceded further gains in the NYSE Arca Gold Miners Index, though there were a couple of large failures with double-digit losses either two or three months later.
Fewer corrections and bear markets
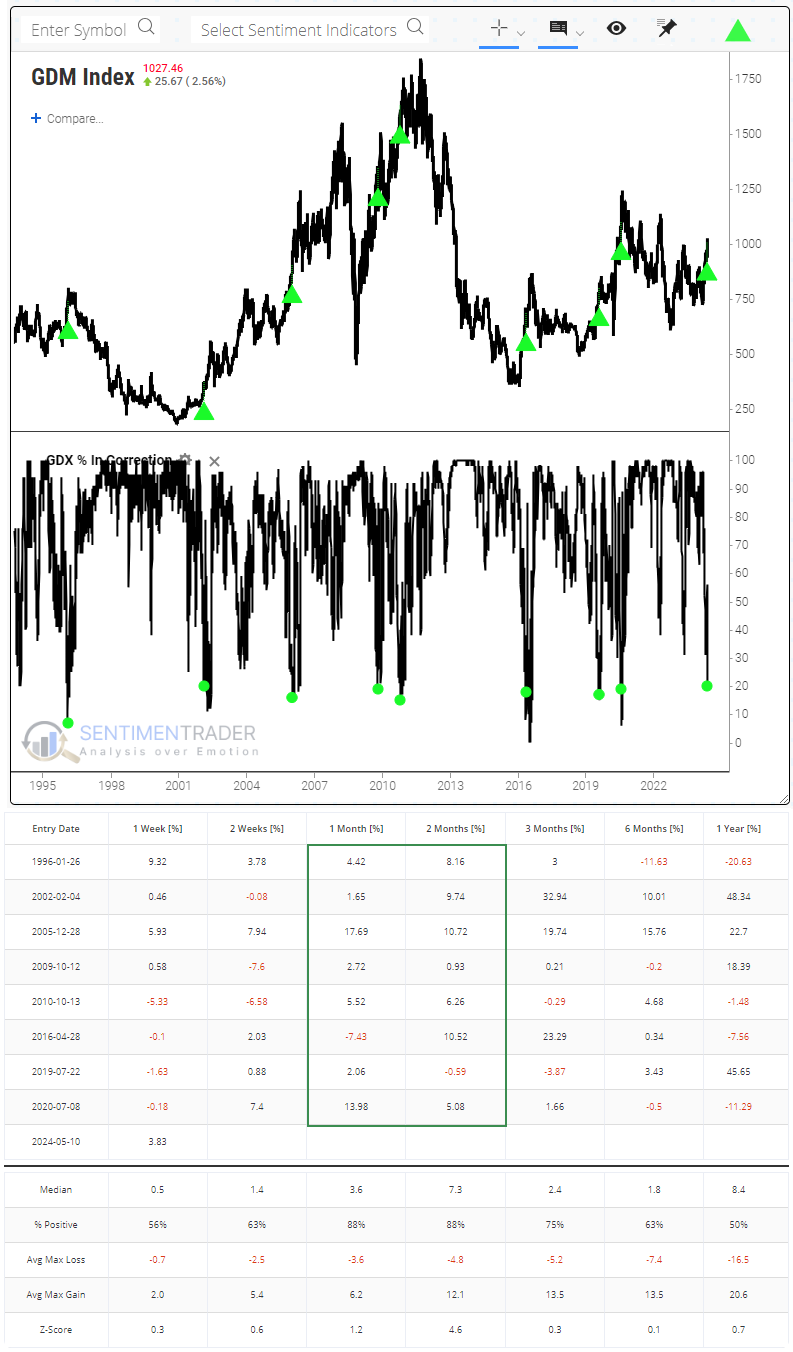
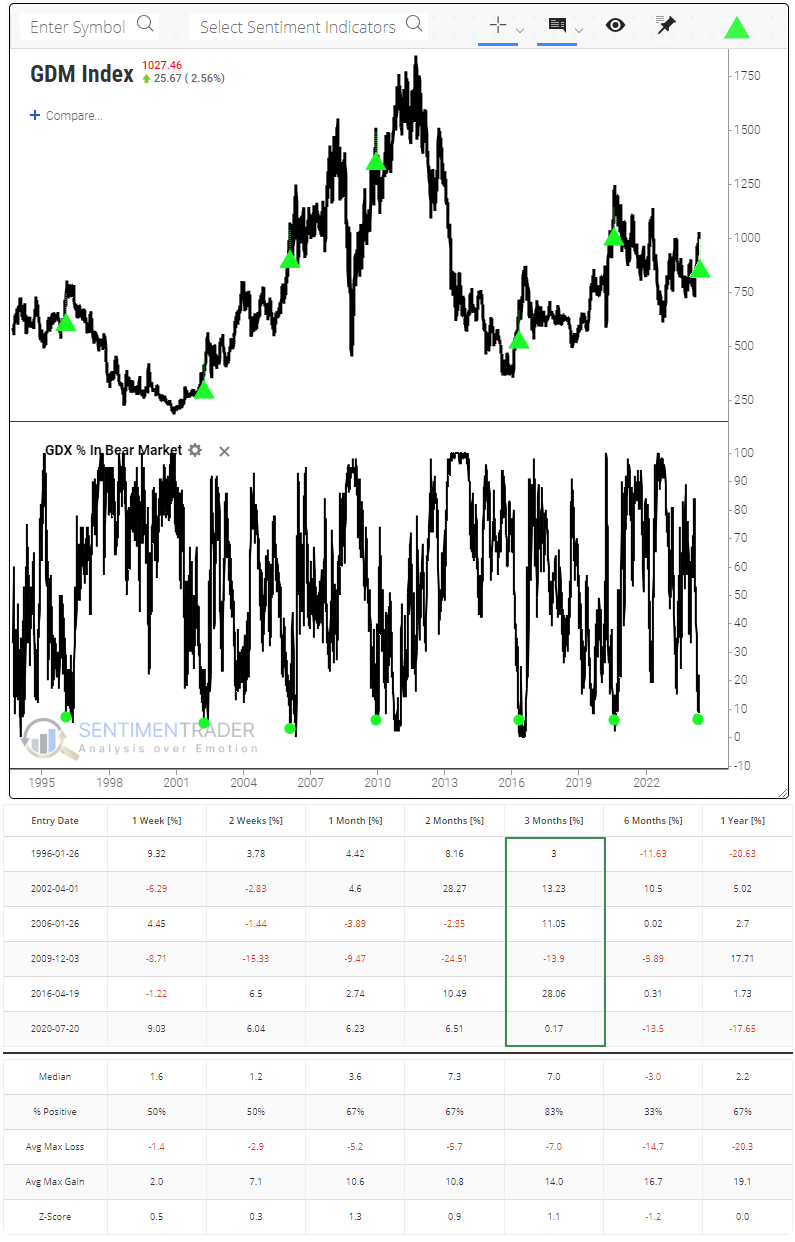
As a result of the rally and more stocks reaching new highs, it's logical to assume that fewer stocks are in corrections, which they are. After more than 90% of miners were in corrections (more than 10% from their last 52-week high) and then 20% or fewer of them were, the NYSE Arca Gold Miners index showed a gain either two or three months later every time.
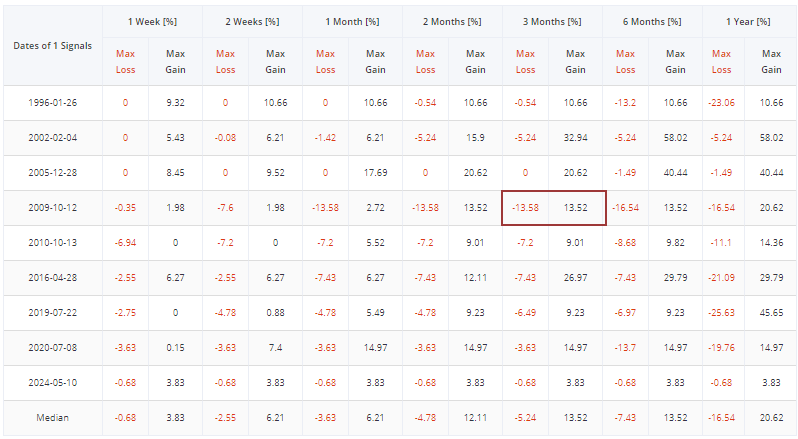
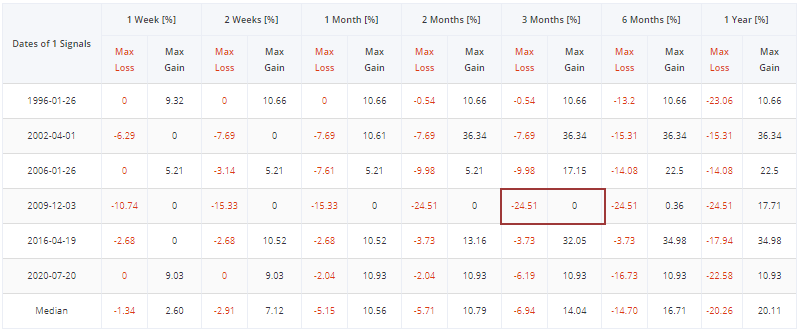
Even more impressive about these cycles is the favorable risk/reward ratio, which is hard to find with gold mining stocks, especially after showing positive momentum. The table of maximum gains and losses across time frames shows that only one signal (barely) witnessed a larger interim loss than gain over the next three months.
Not only are fewer of them in corrections, but even fewer are in bear markets (more than 20% off their 52-week high). This figure has cycled from above 80% to fewer than 8% for only the 7th time in 30 years. As we saw above, the next three months were mostly positive, with only one failure.
Similar to the previous study, the risk/reward heavily favored longs. Only the failed 2009 signal witnessed a horrible ratio. All the others strongly favored bulls over bears during the next three months.
What the research tells us...
Gold mining companies have a long and inglorious history of treating shareholder interests as secondary or tertiary interests. A few years ago, they made a lot of noise about changing their behavior and becoming better stewards of the capital entrusted to them. Investors have logically been highly skeptical of these statements, though they have mostly followed their promises.
Investors seem to be coming around to better corporate behavior, and record highs in some metals don't hurt. Mining stocks have performed exceedingly well in response. It's always hard to trust them, given their long history of rug-pulls once investors start to believe the bull case again. But when they cycle as they have over the past couple of months, their record over the past 30 years has been quite good and skews the case further toward the bulls.
Indicators at Extremes
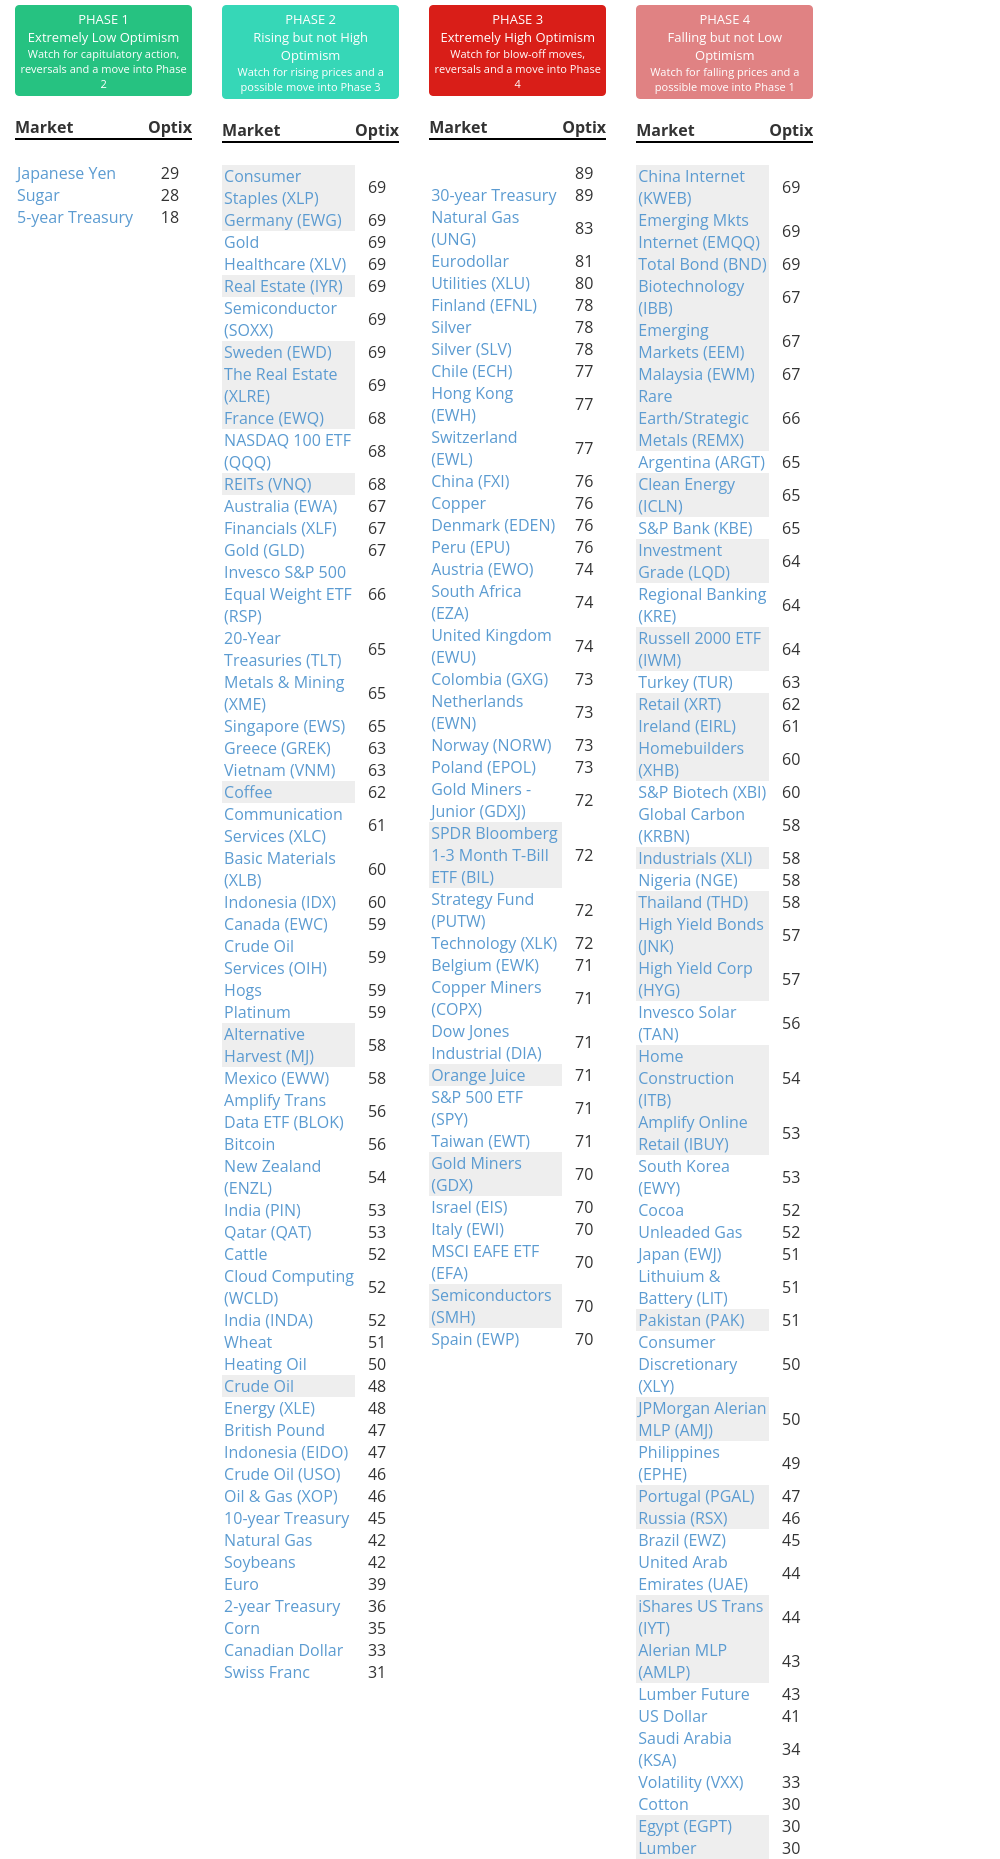
Phase Table
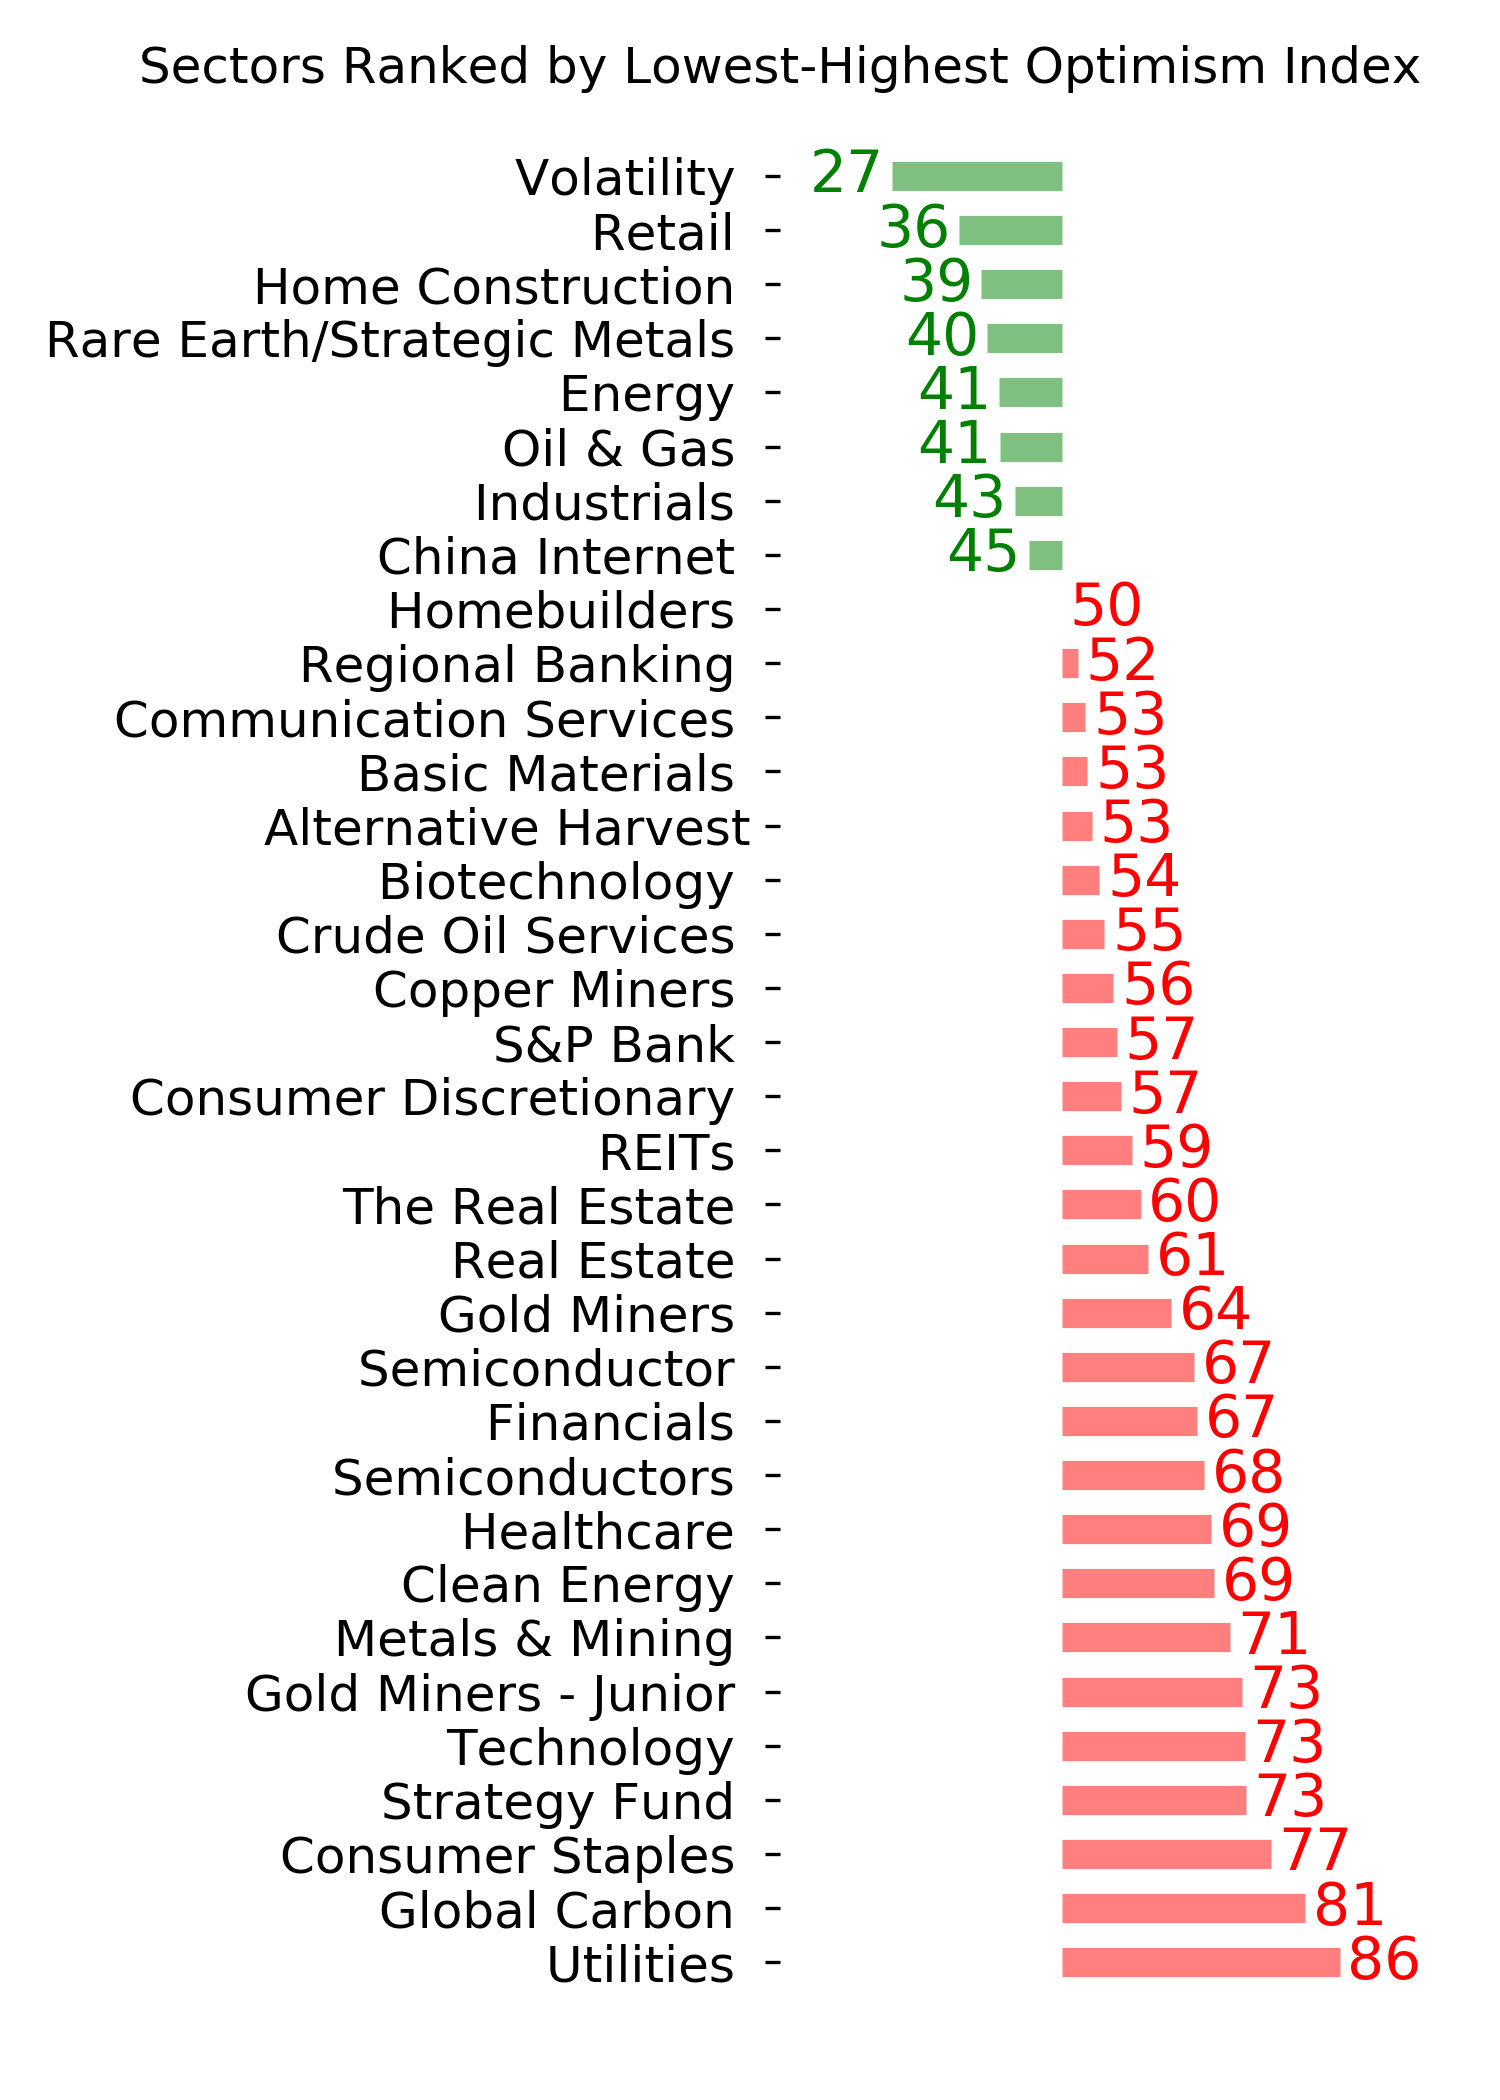
Ranks
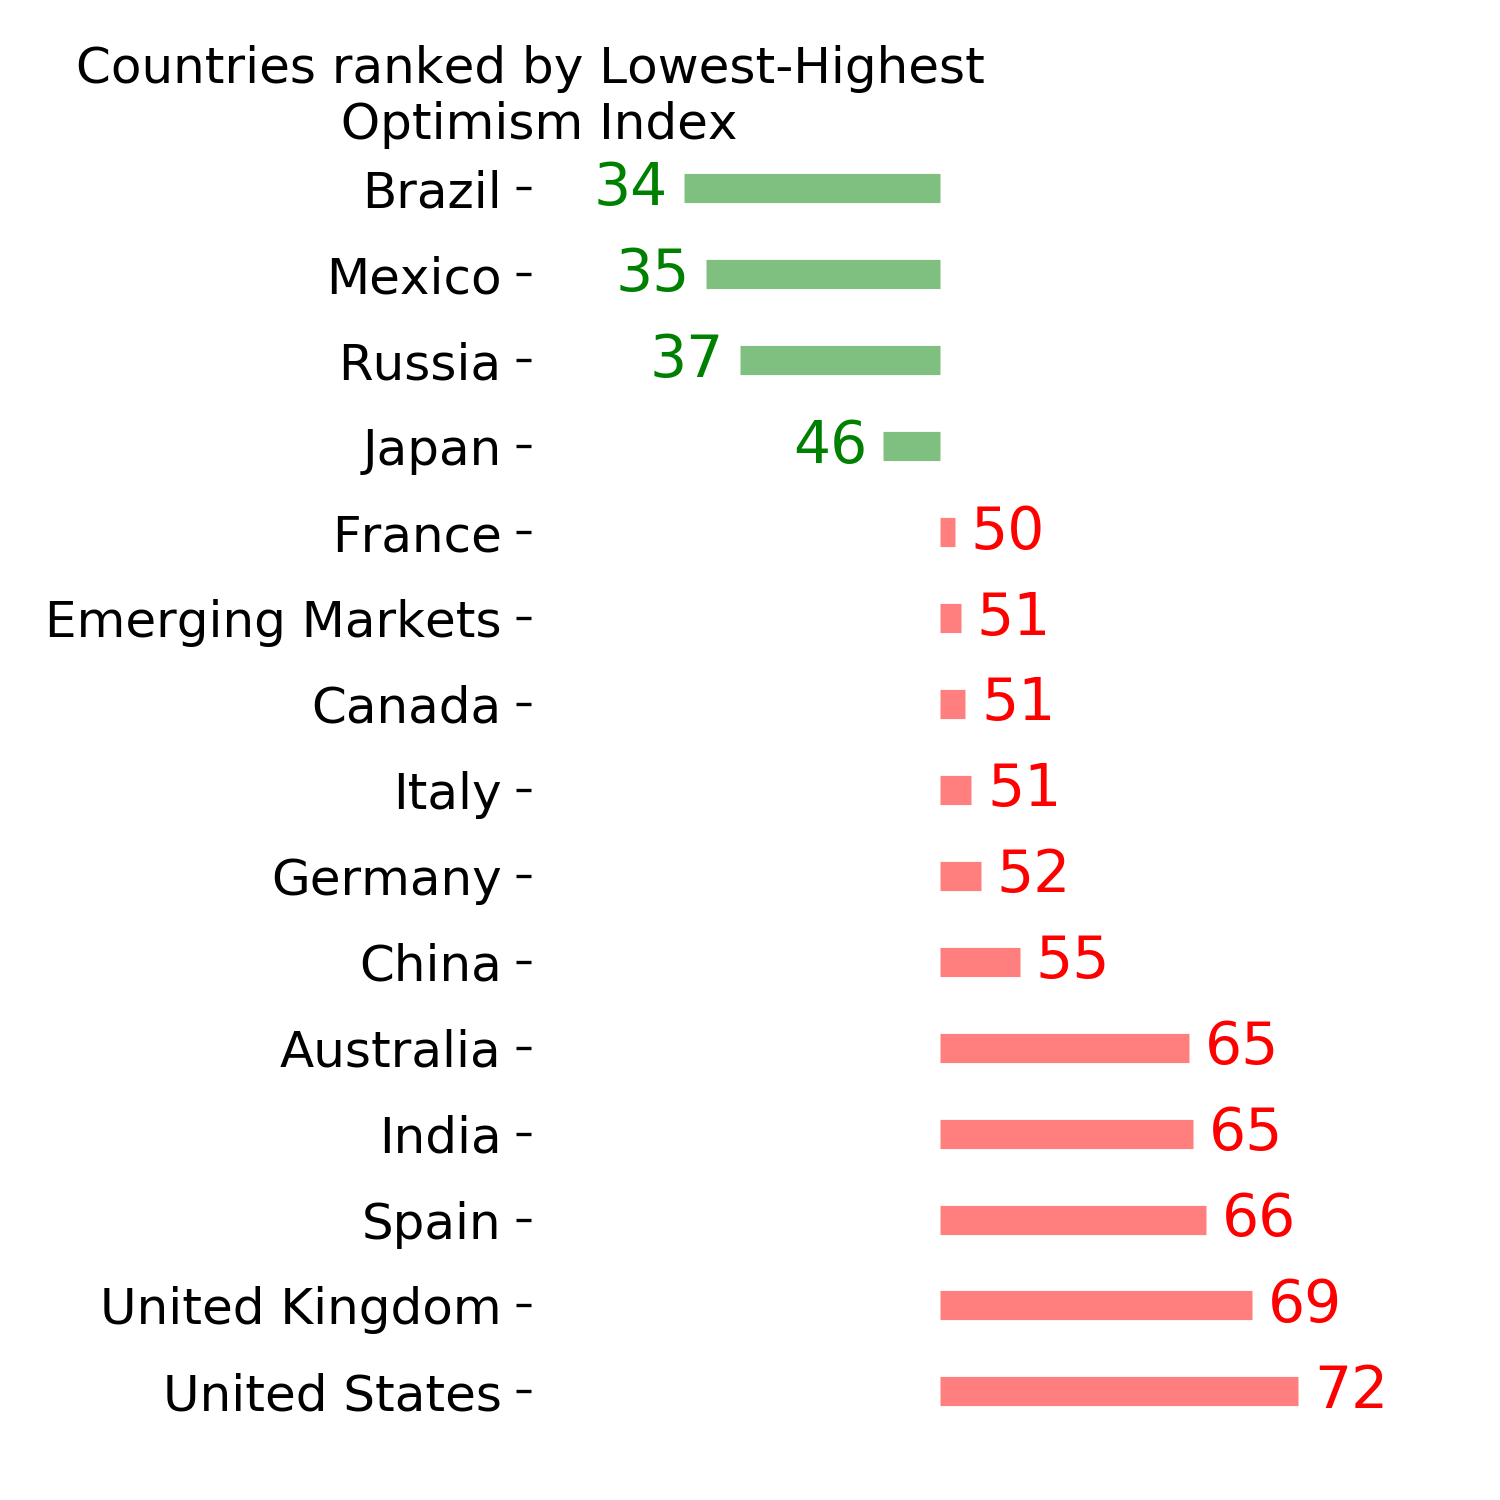
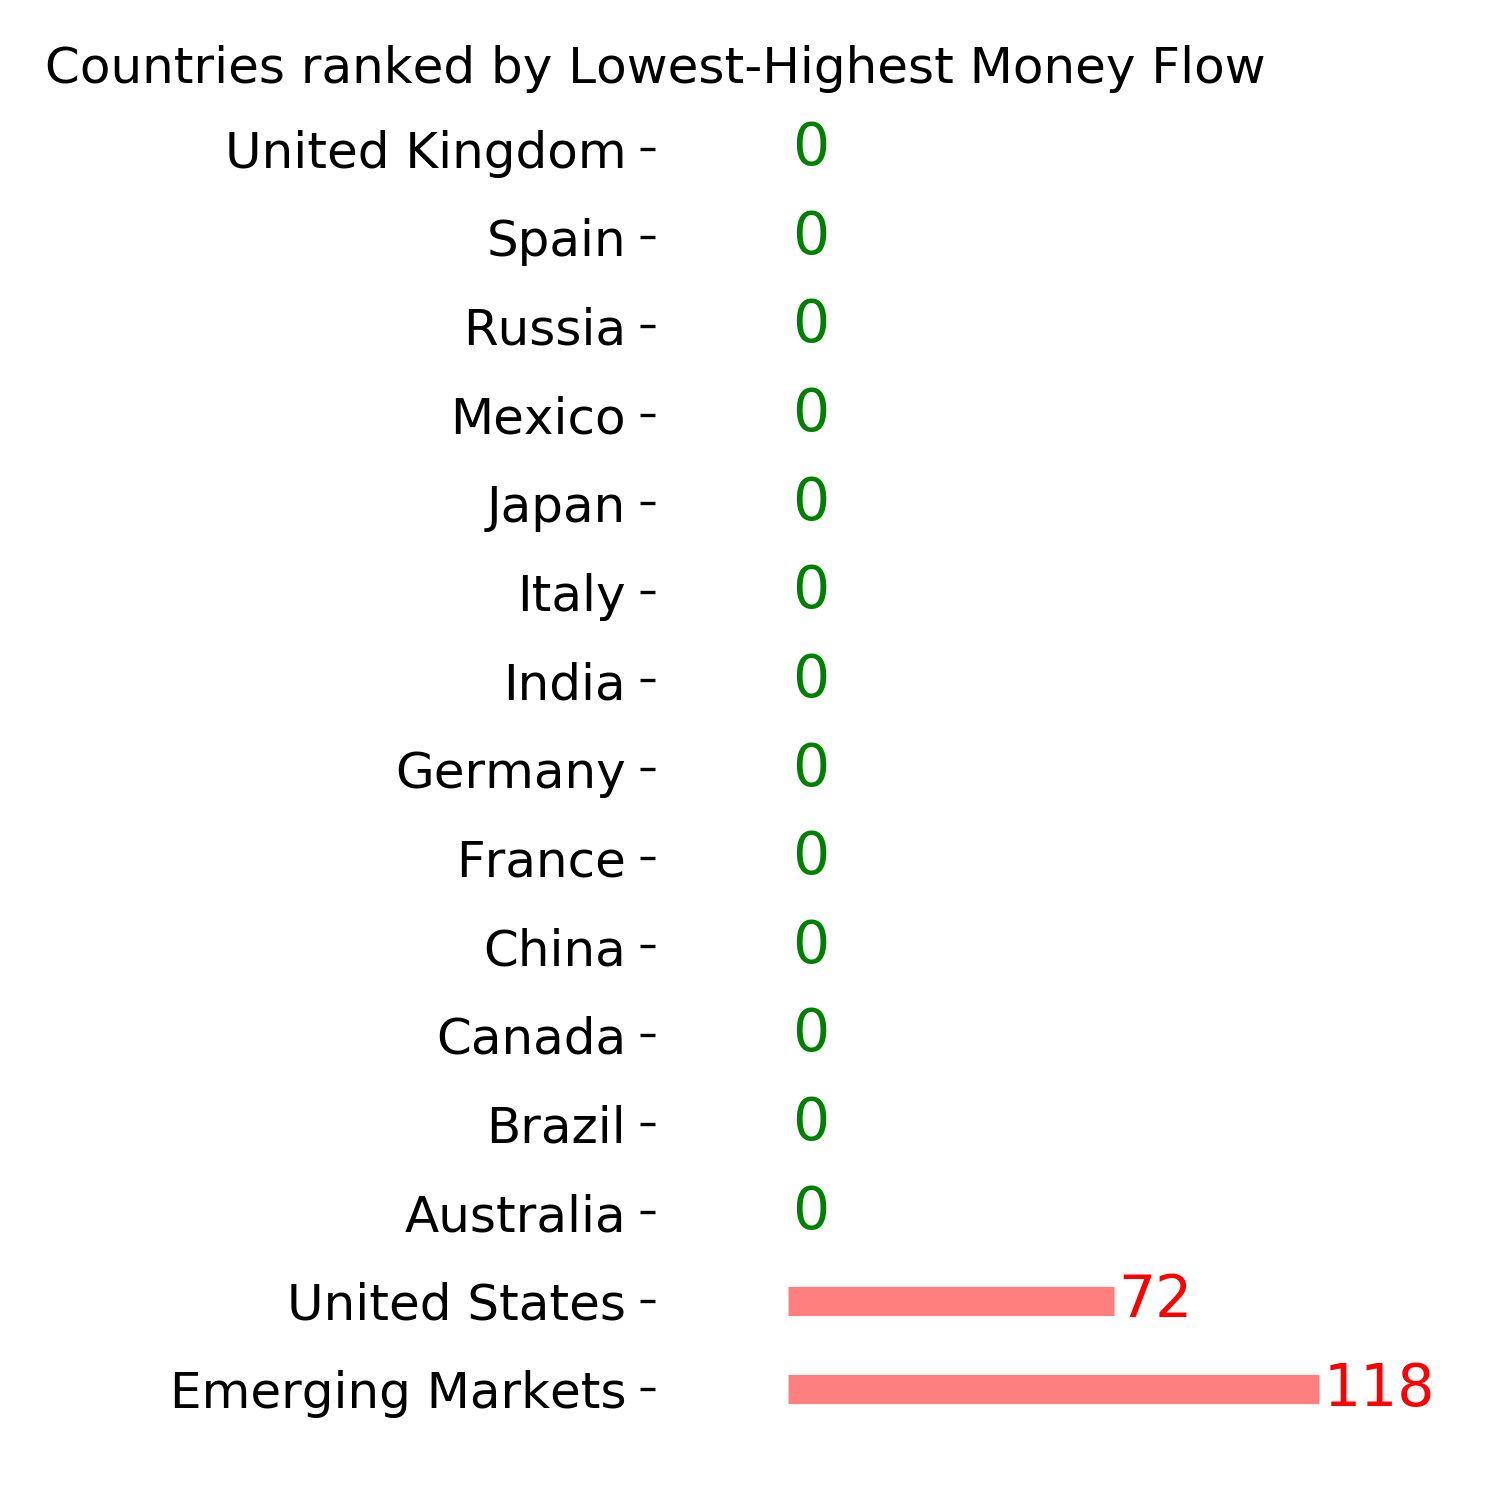
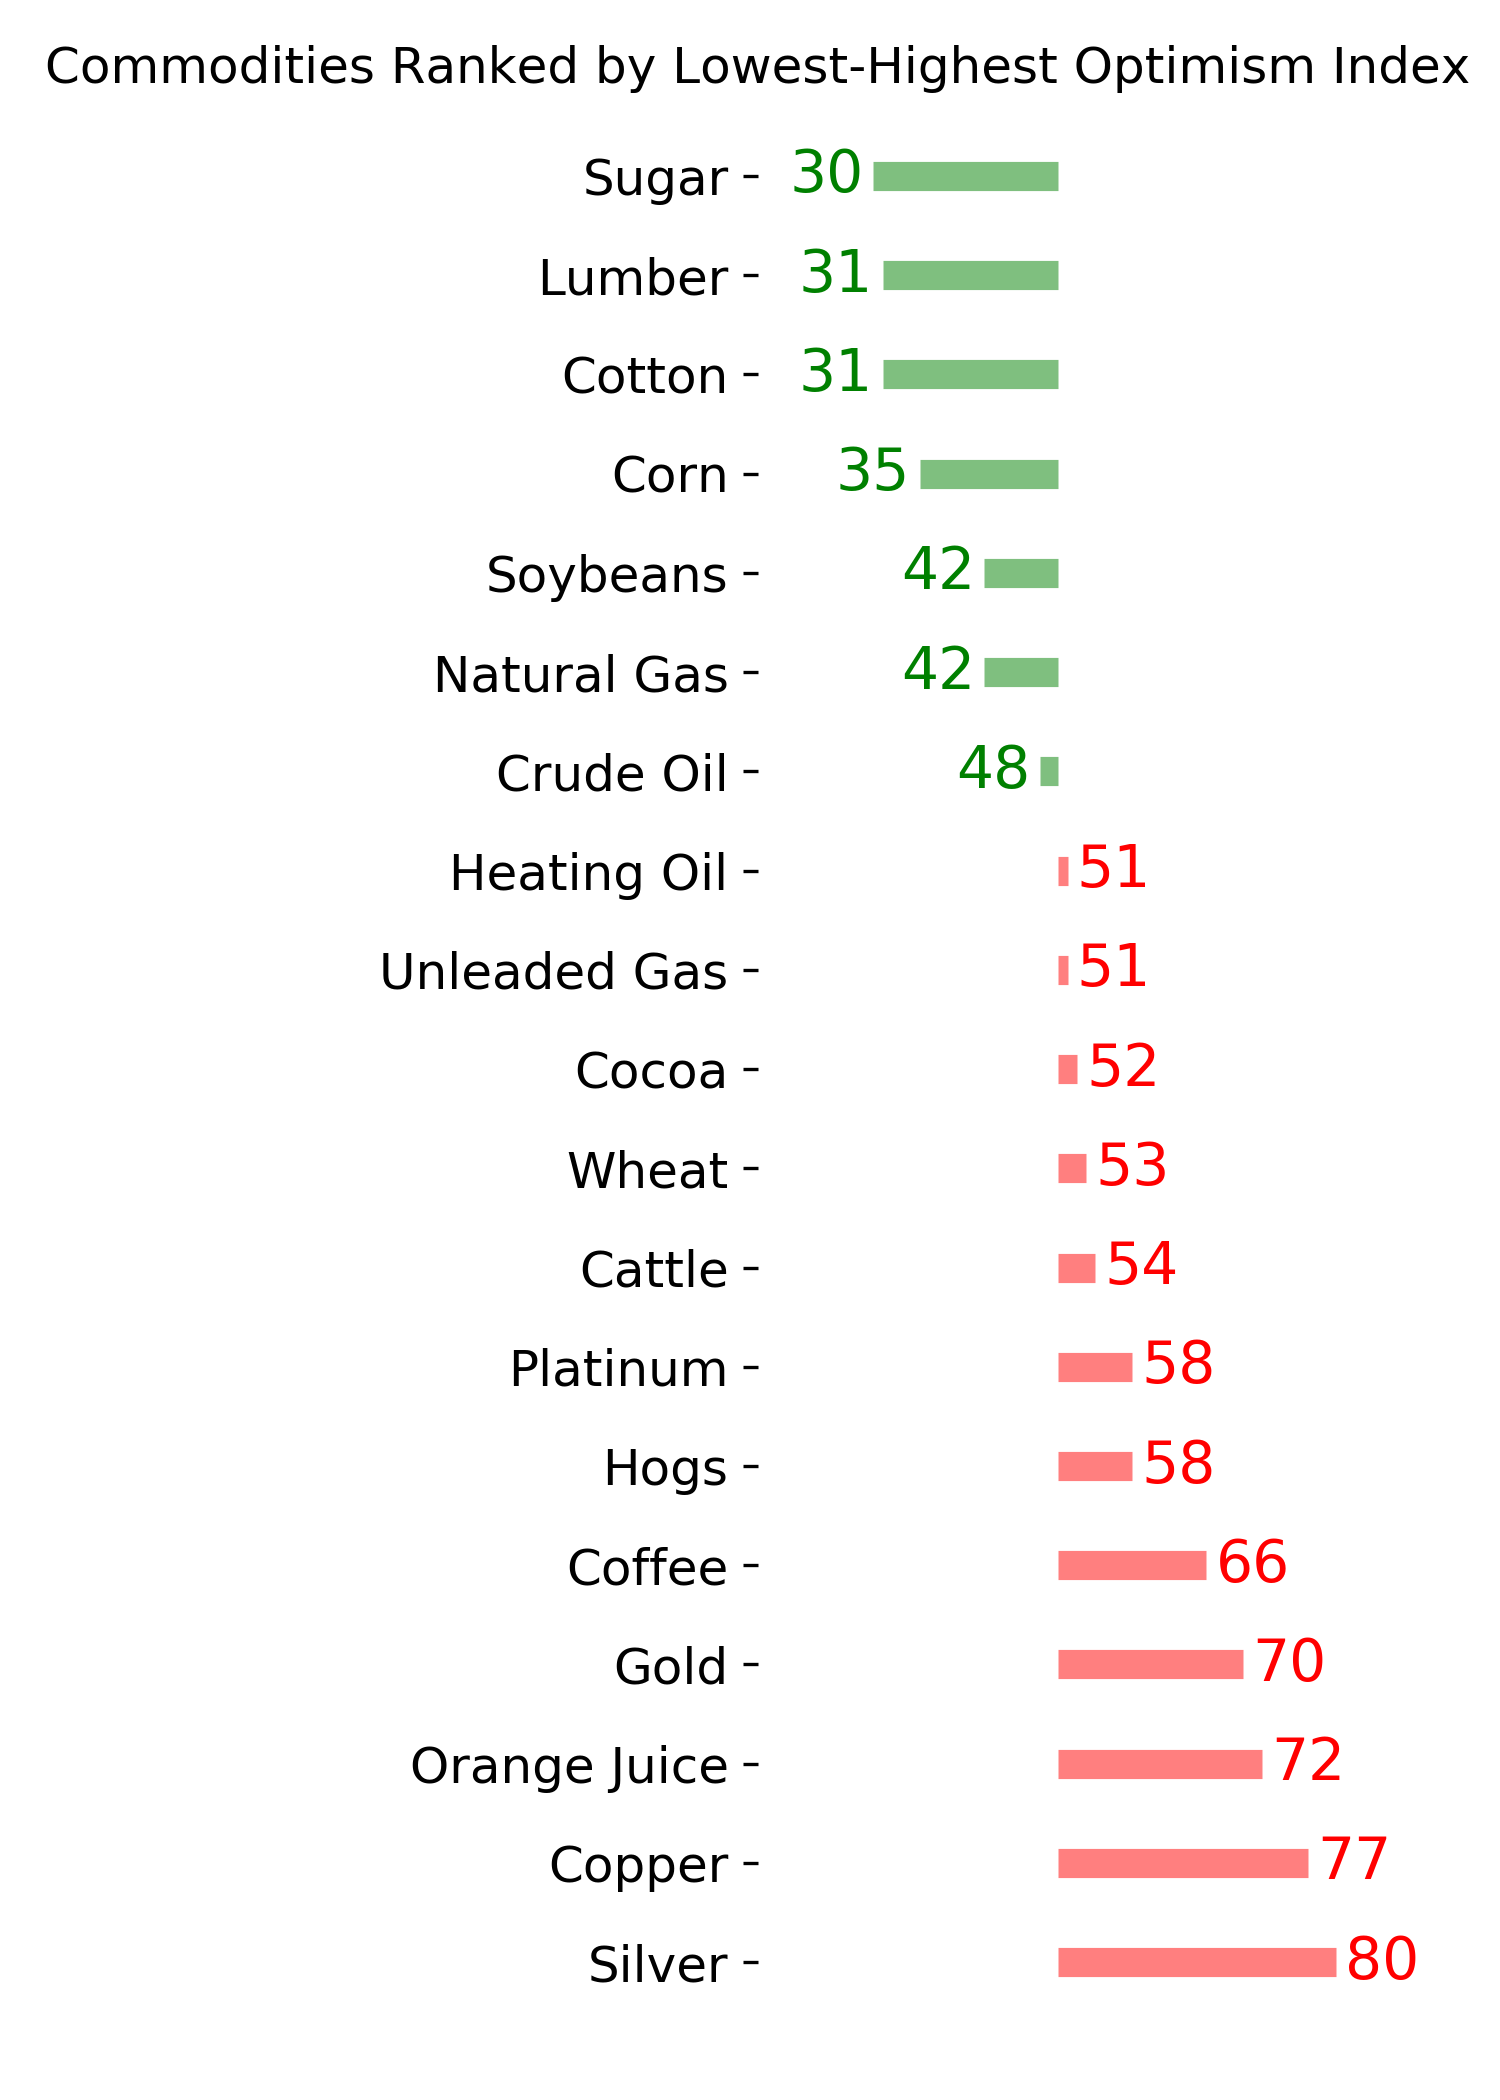
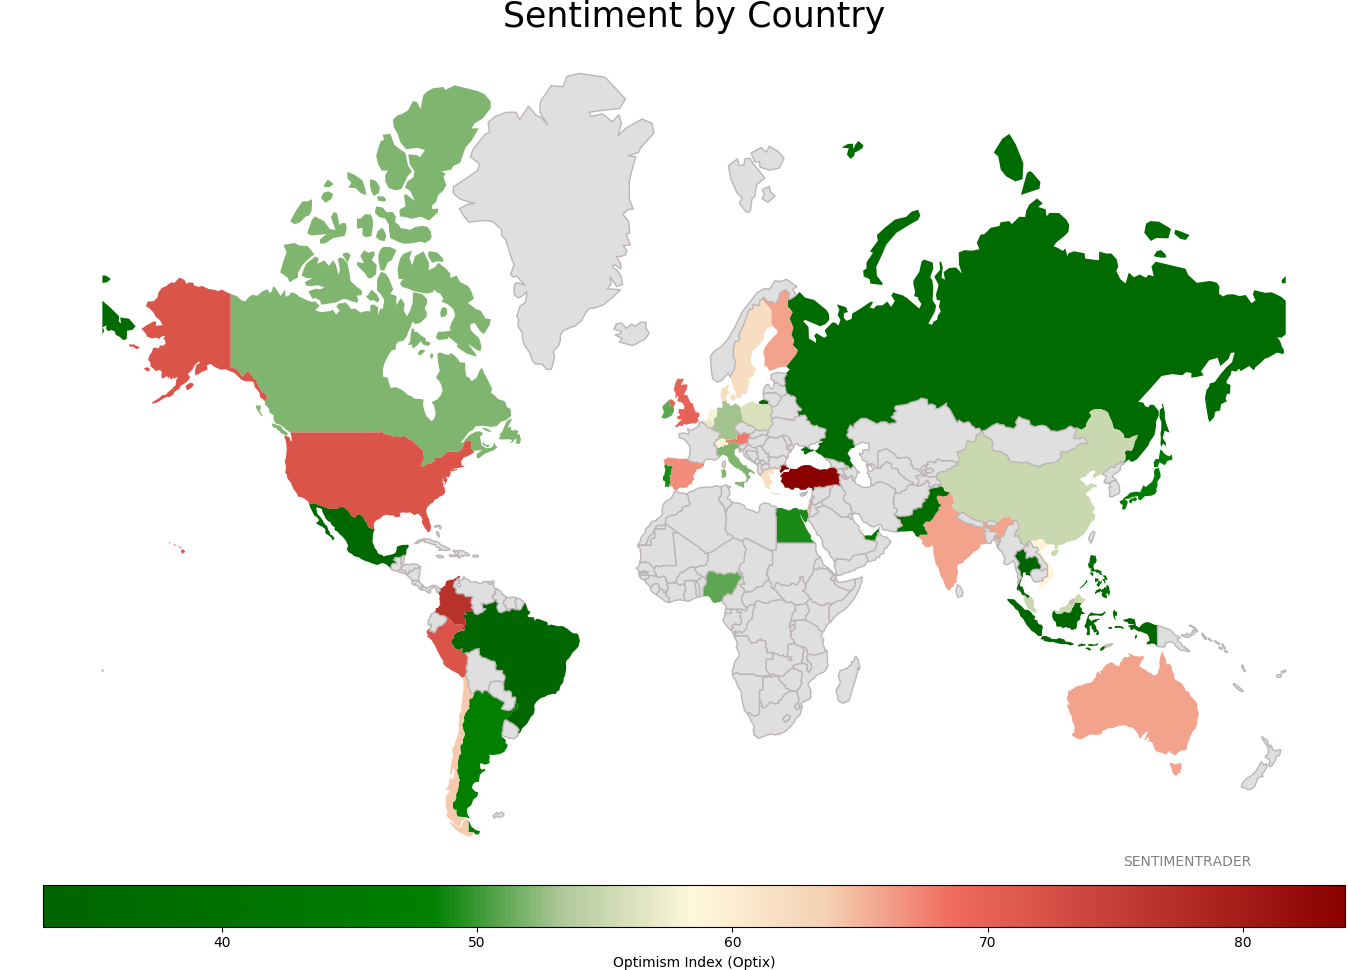
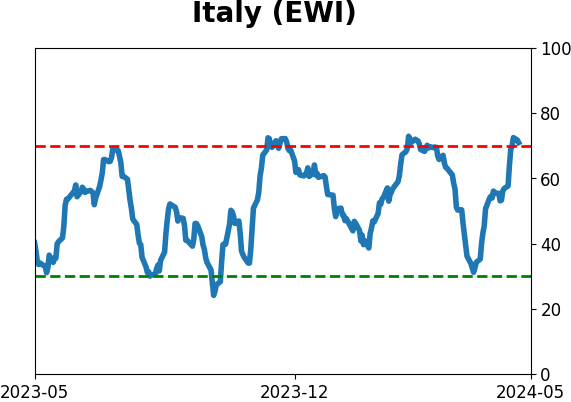
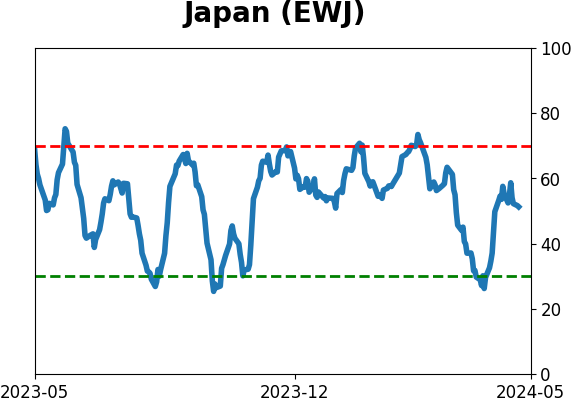
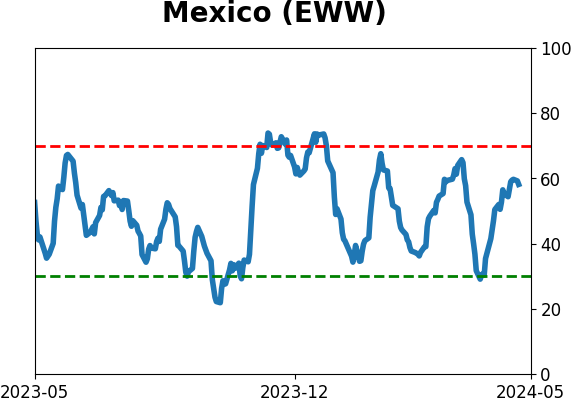
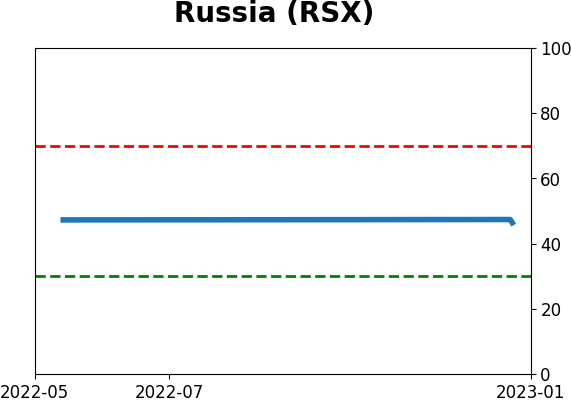
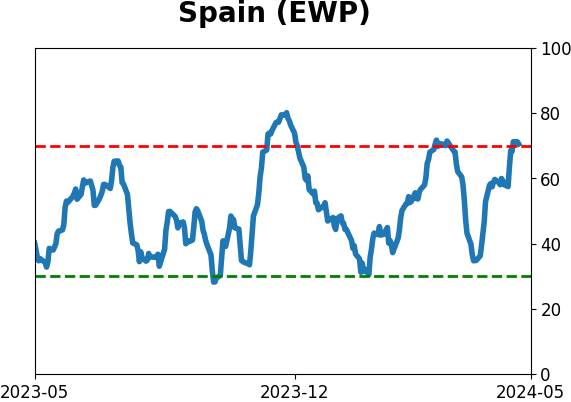
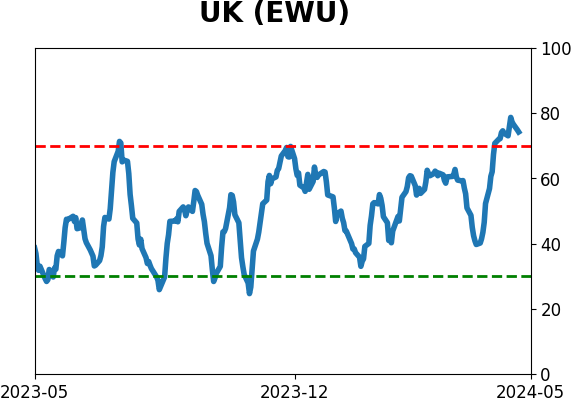
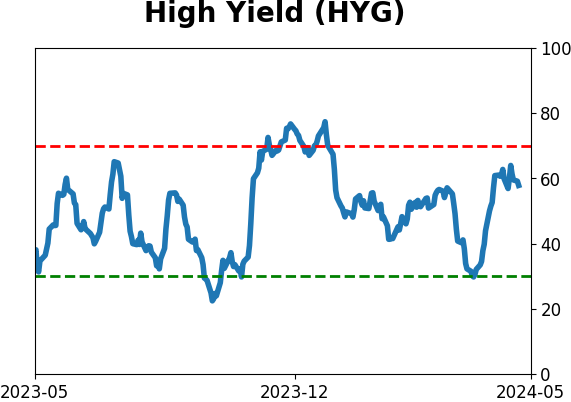
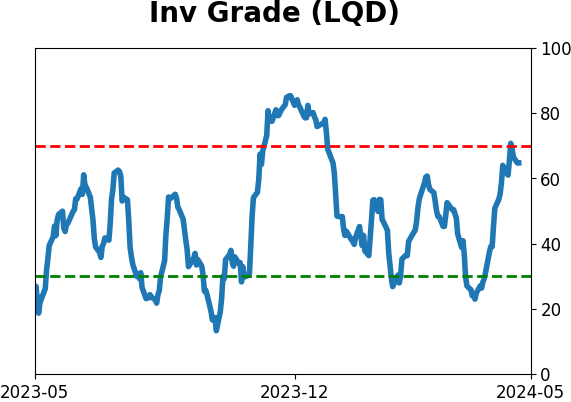
Sentiment Around The World
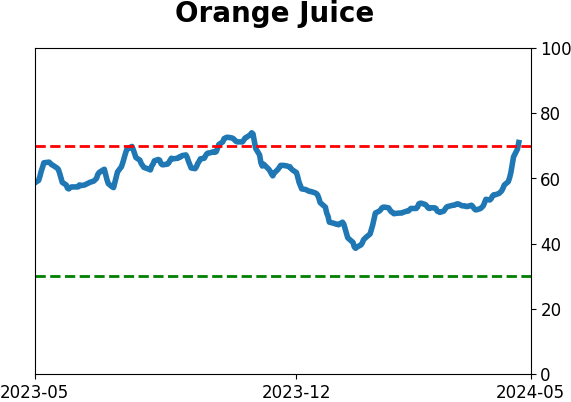
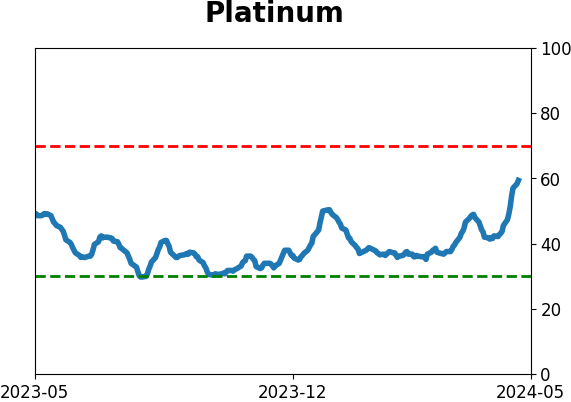
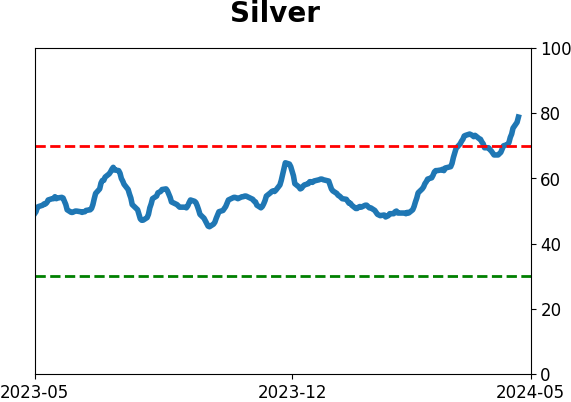
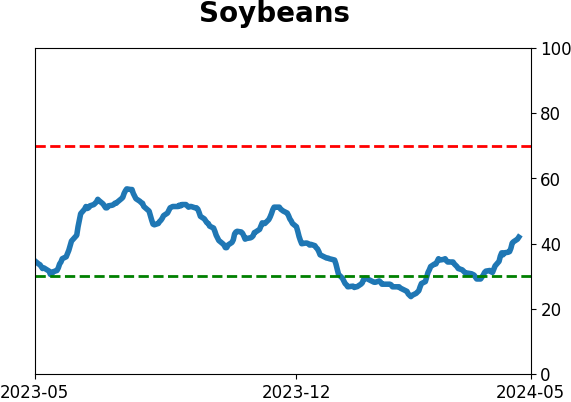
Optimism Index Thumbnails
|
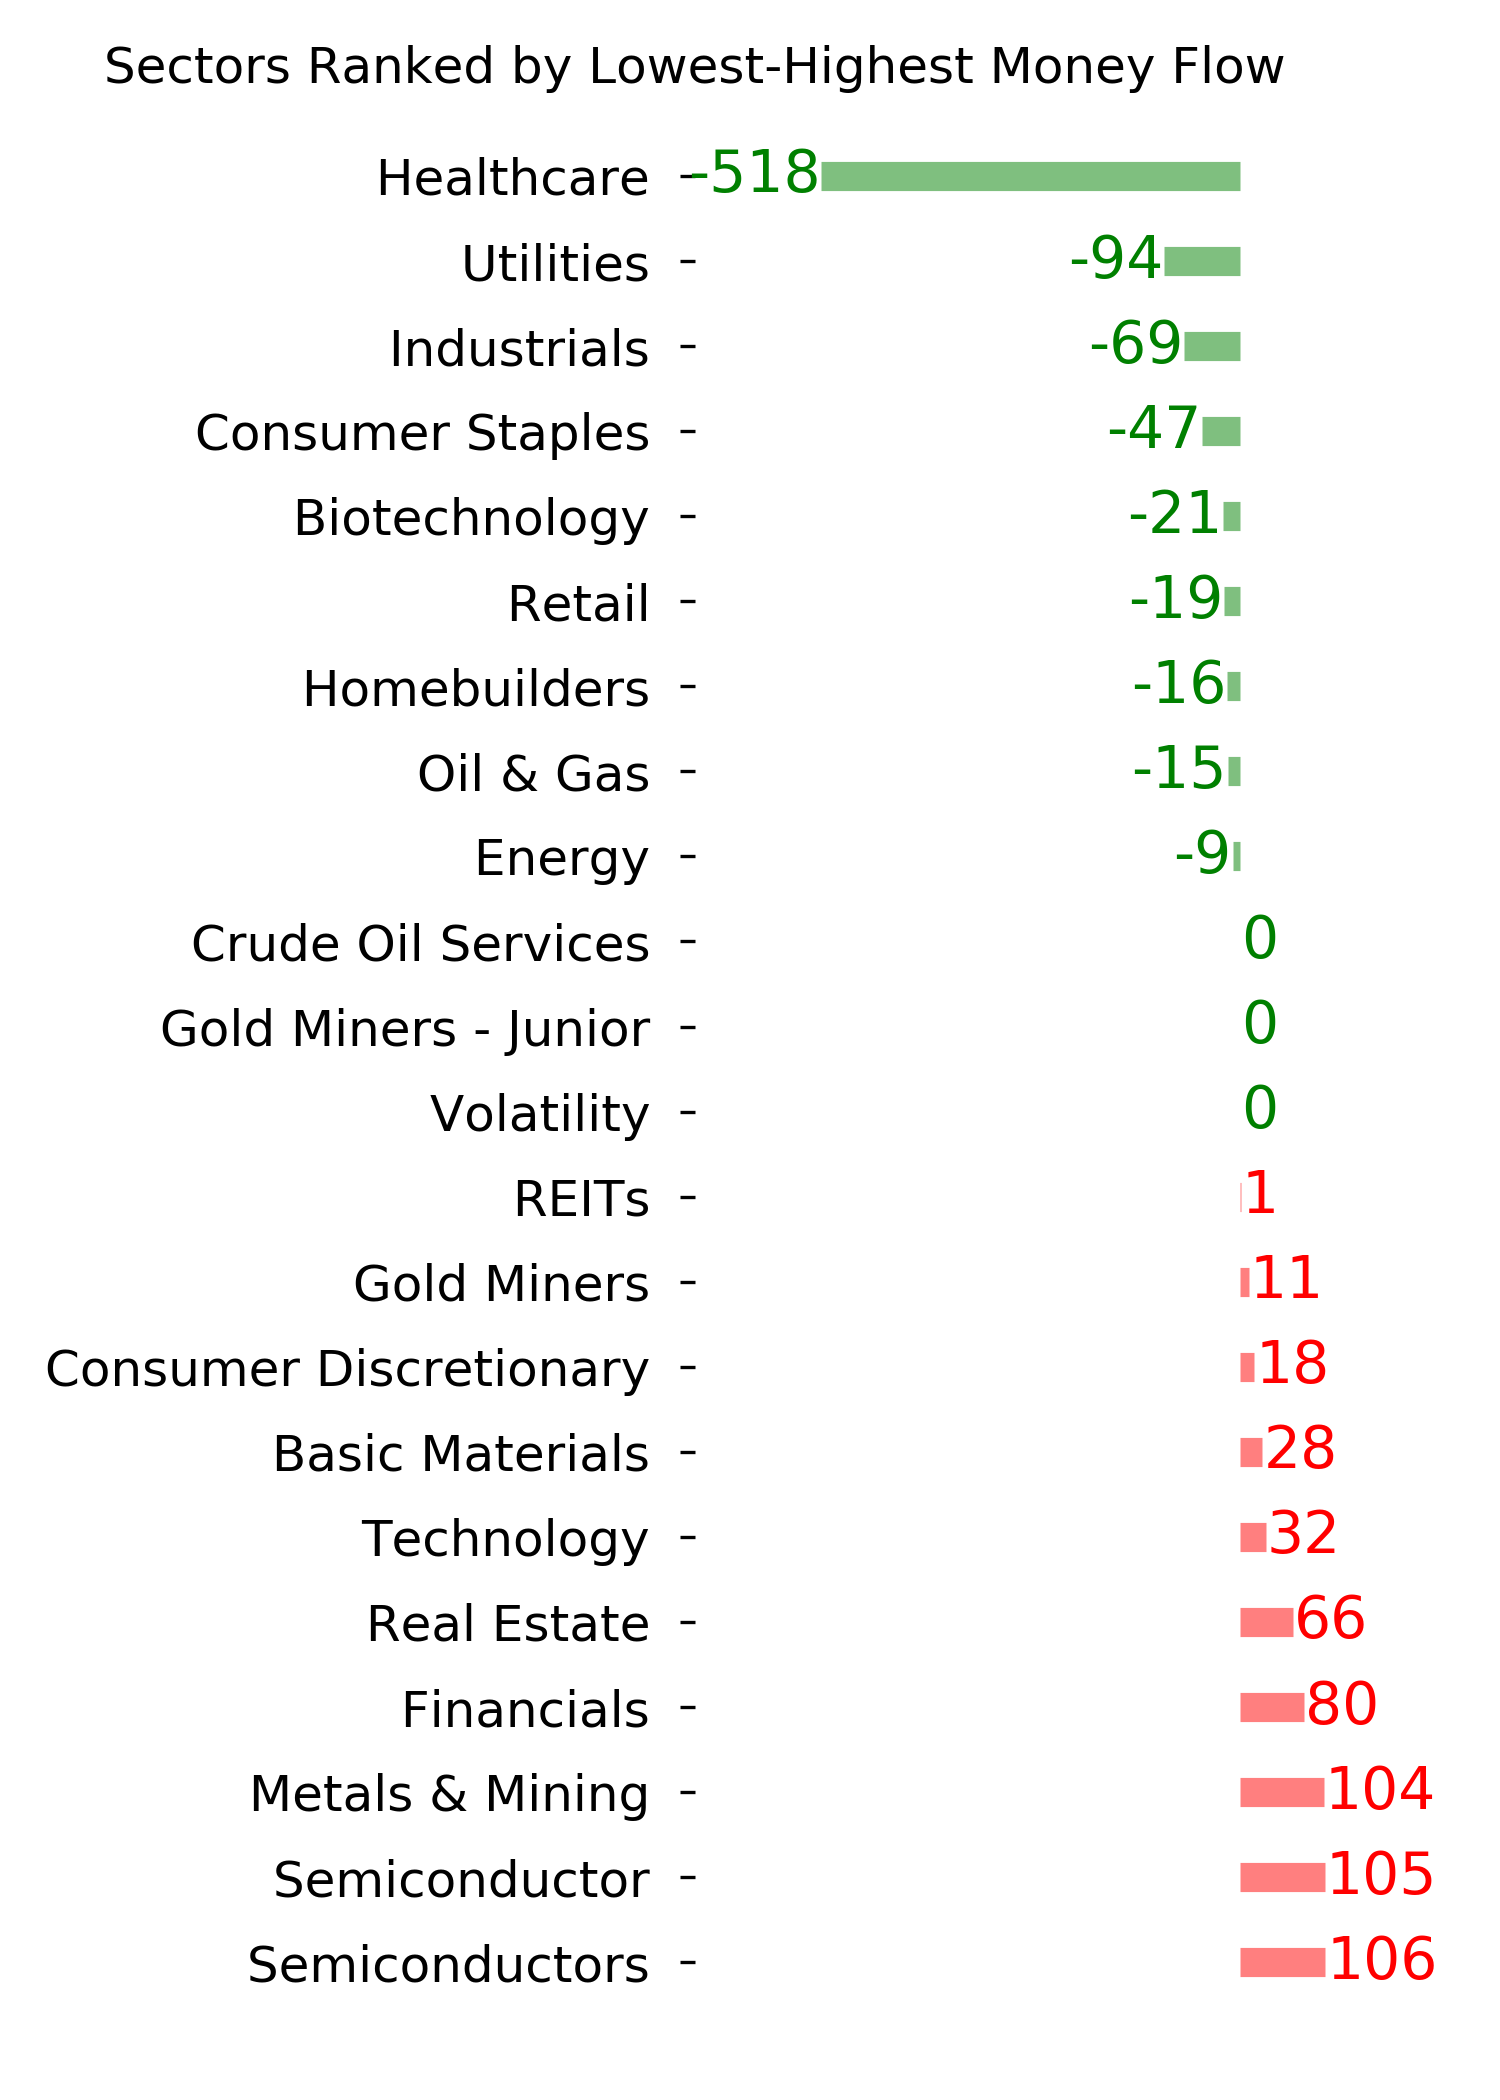
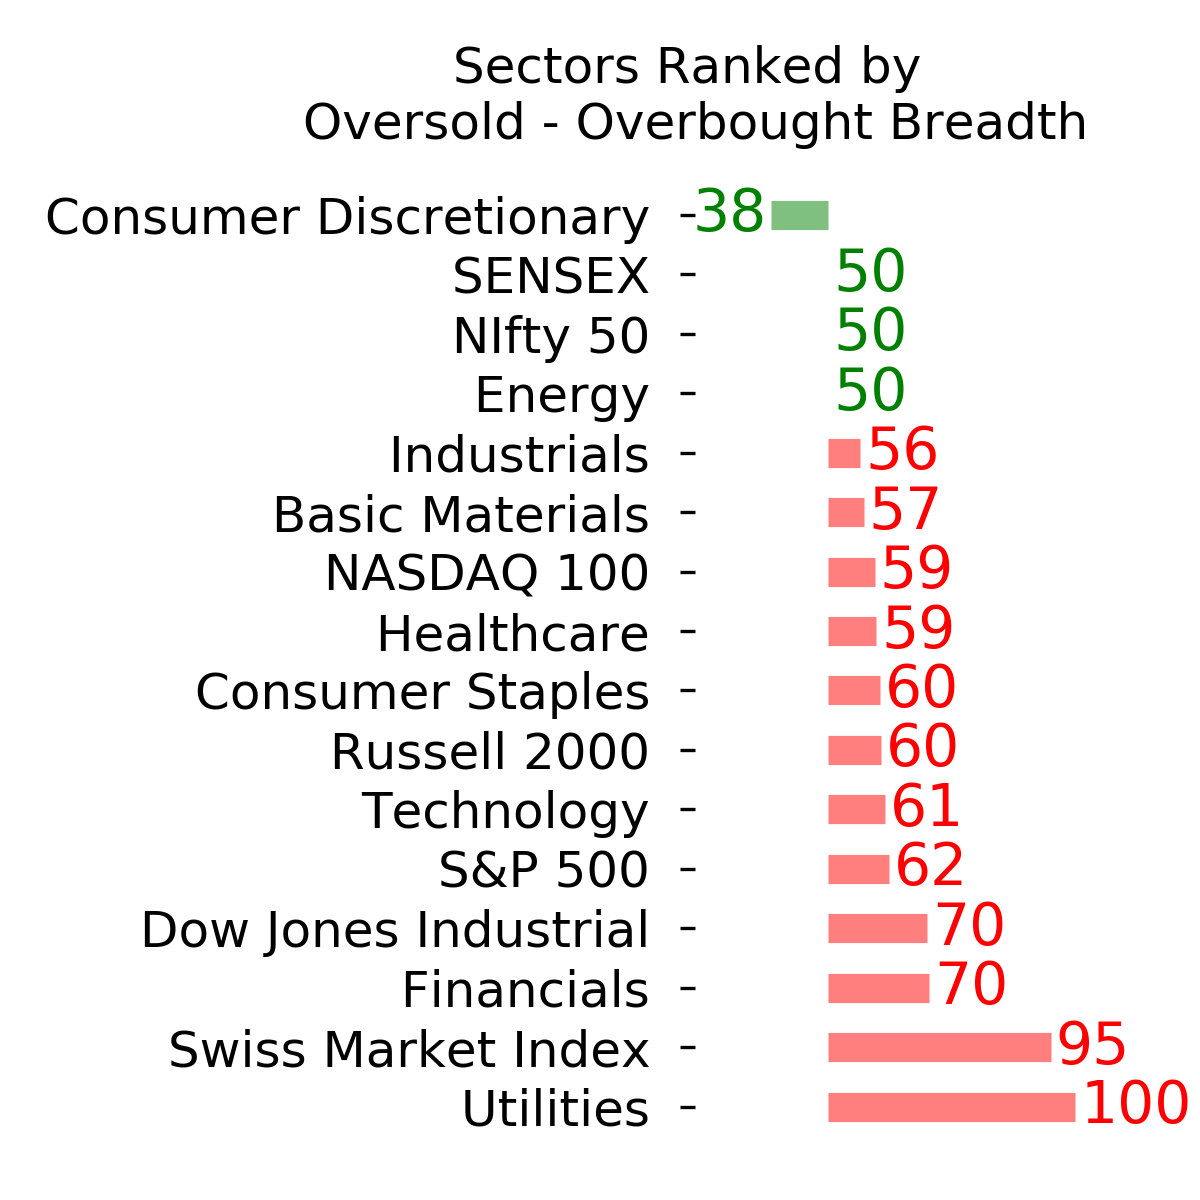
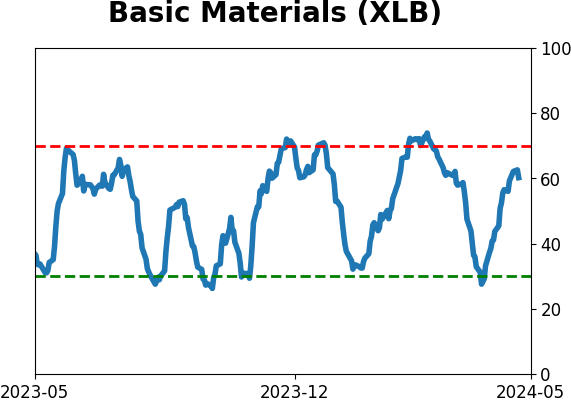
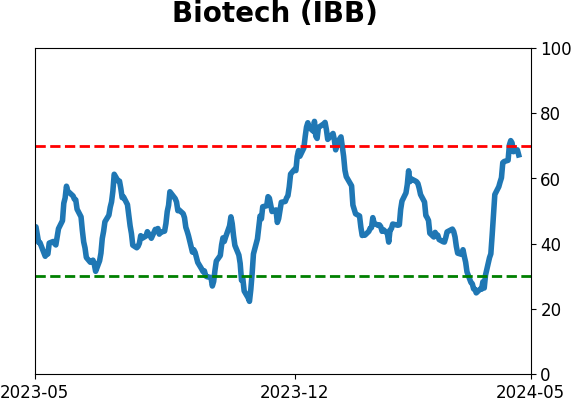
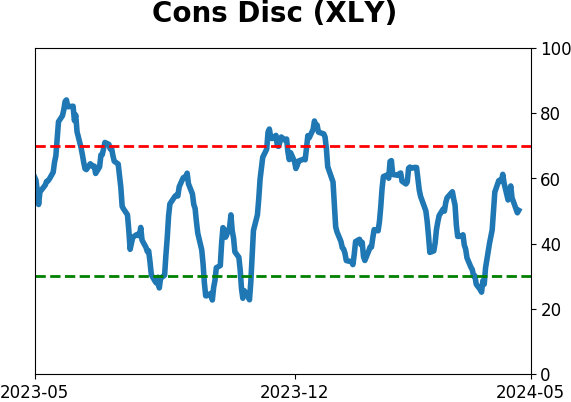
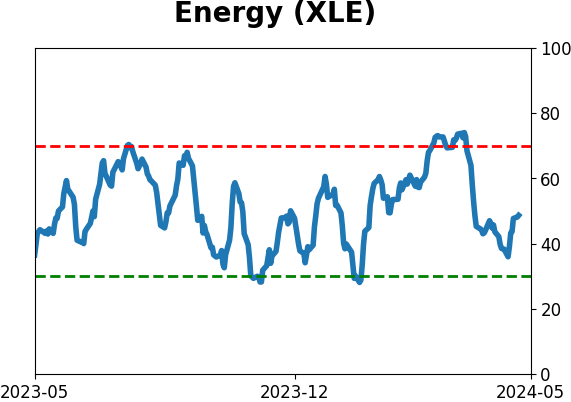
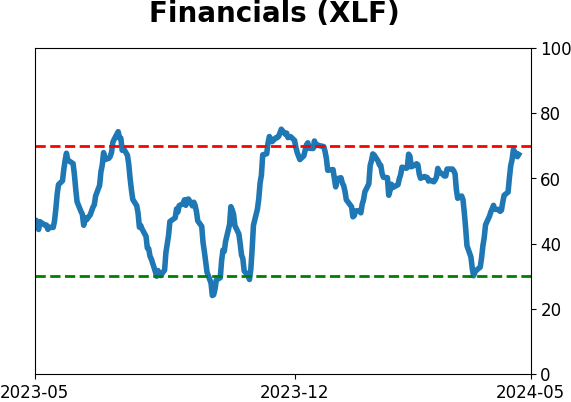
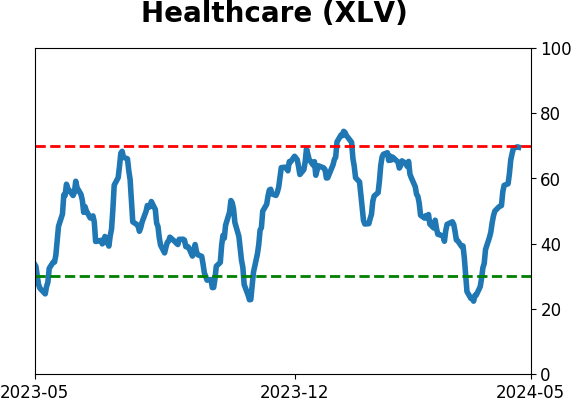
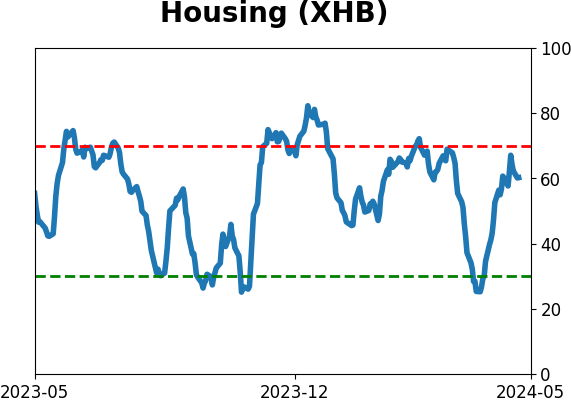
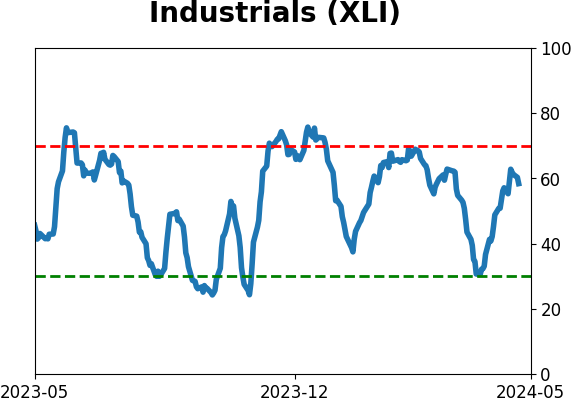
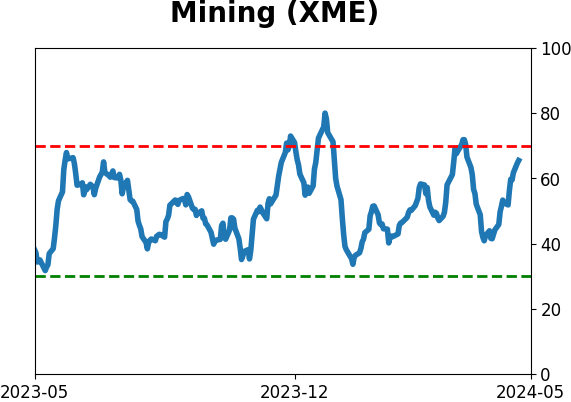
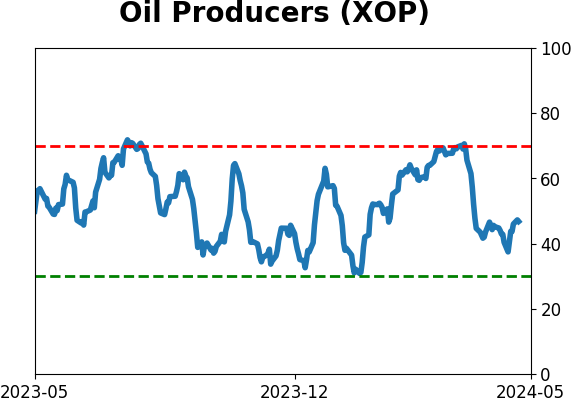
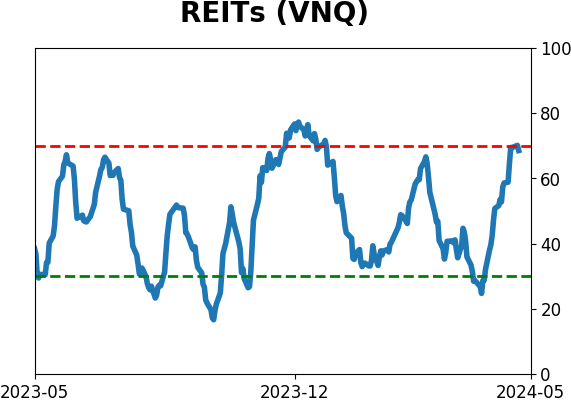
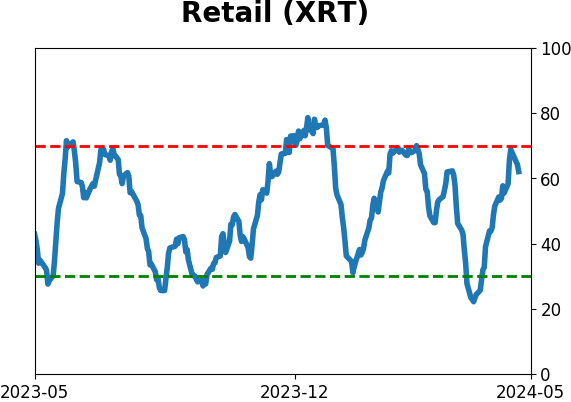
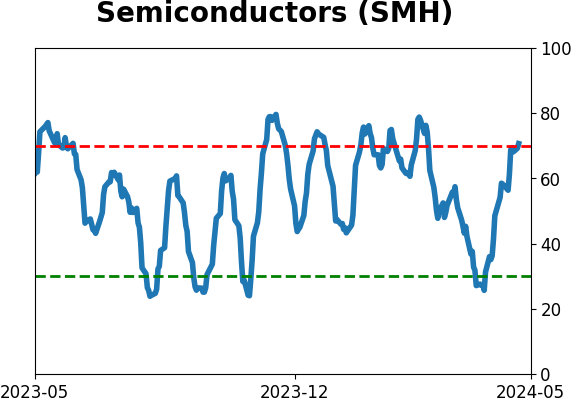
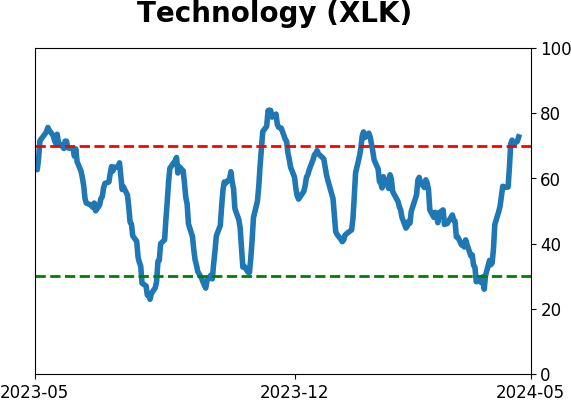
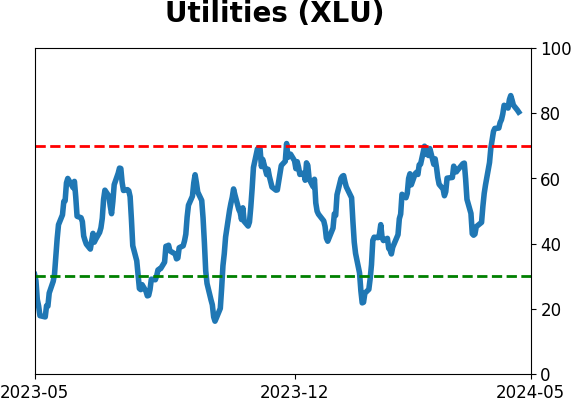
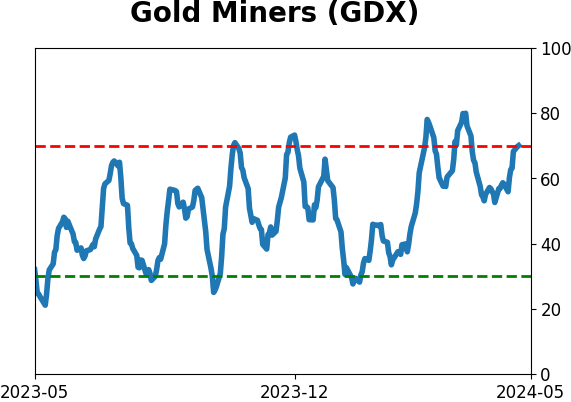
Sector ETF's - 10-Day Moving Average
|
|
|
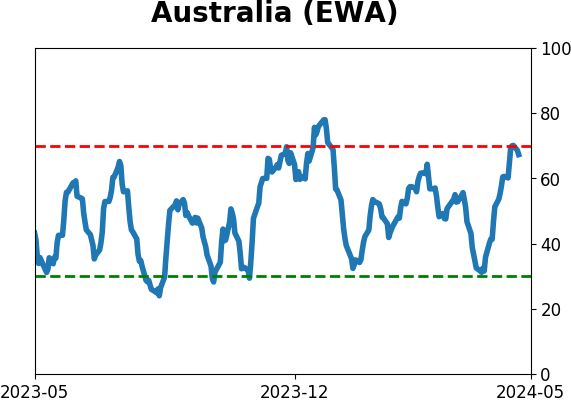
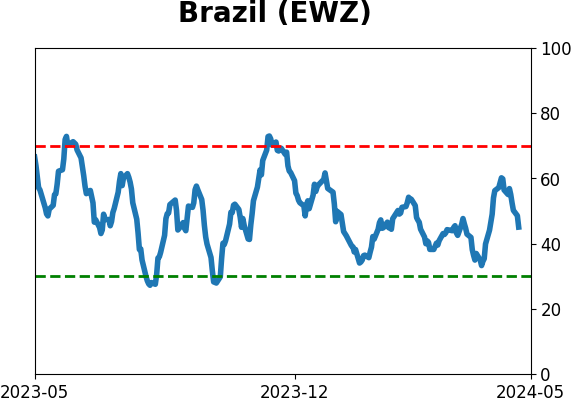
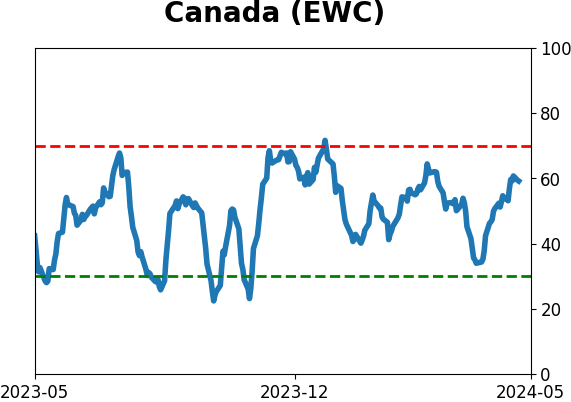
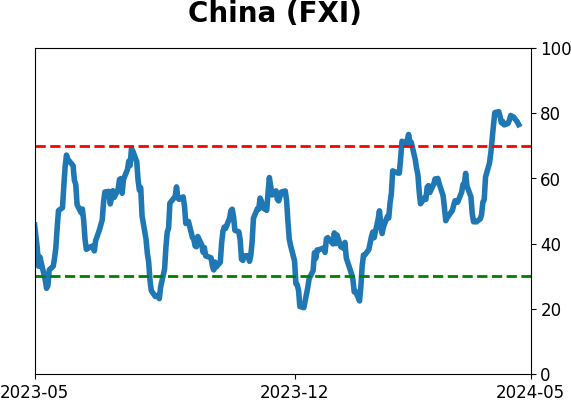
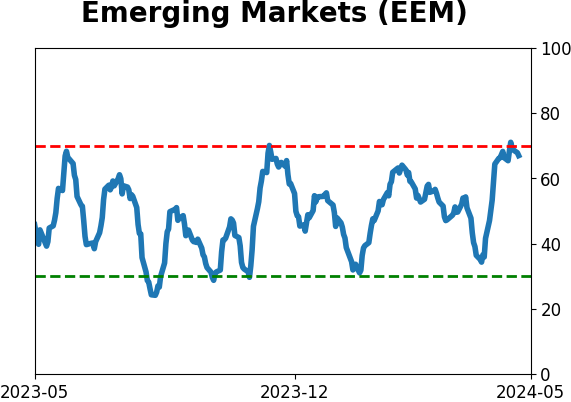
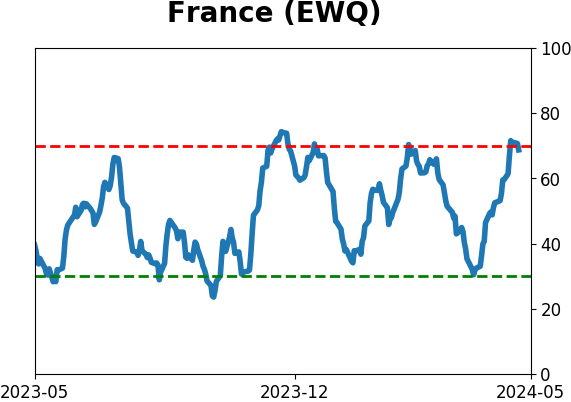
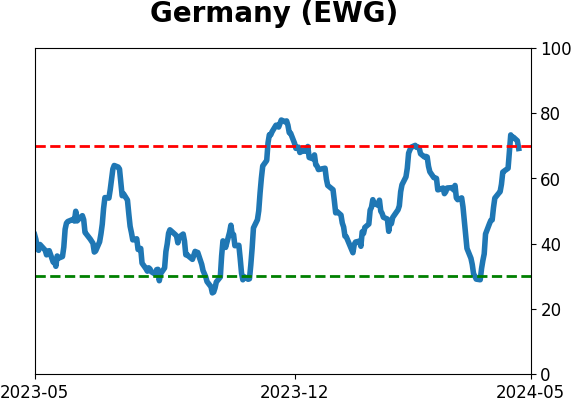
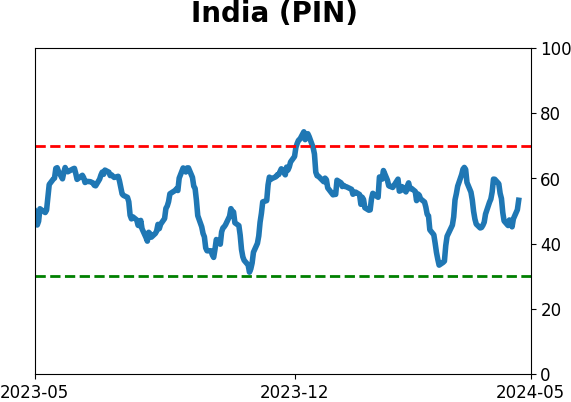
Country ETF's - 10-Day Moving Average
|
|
|
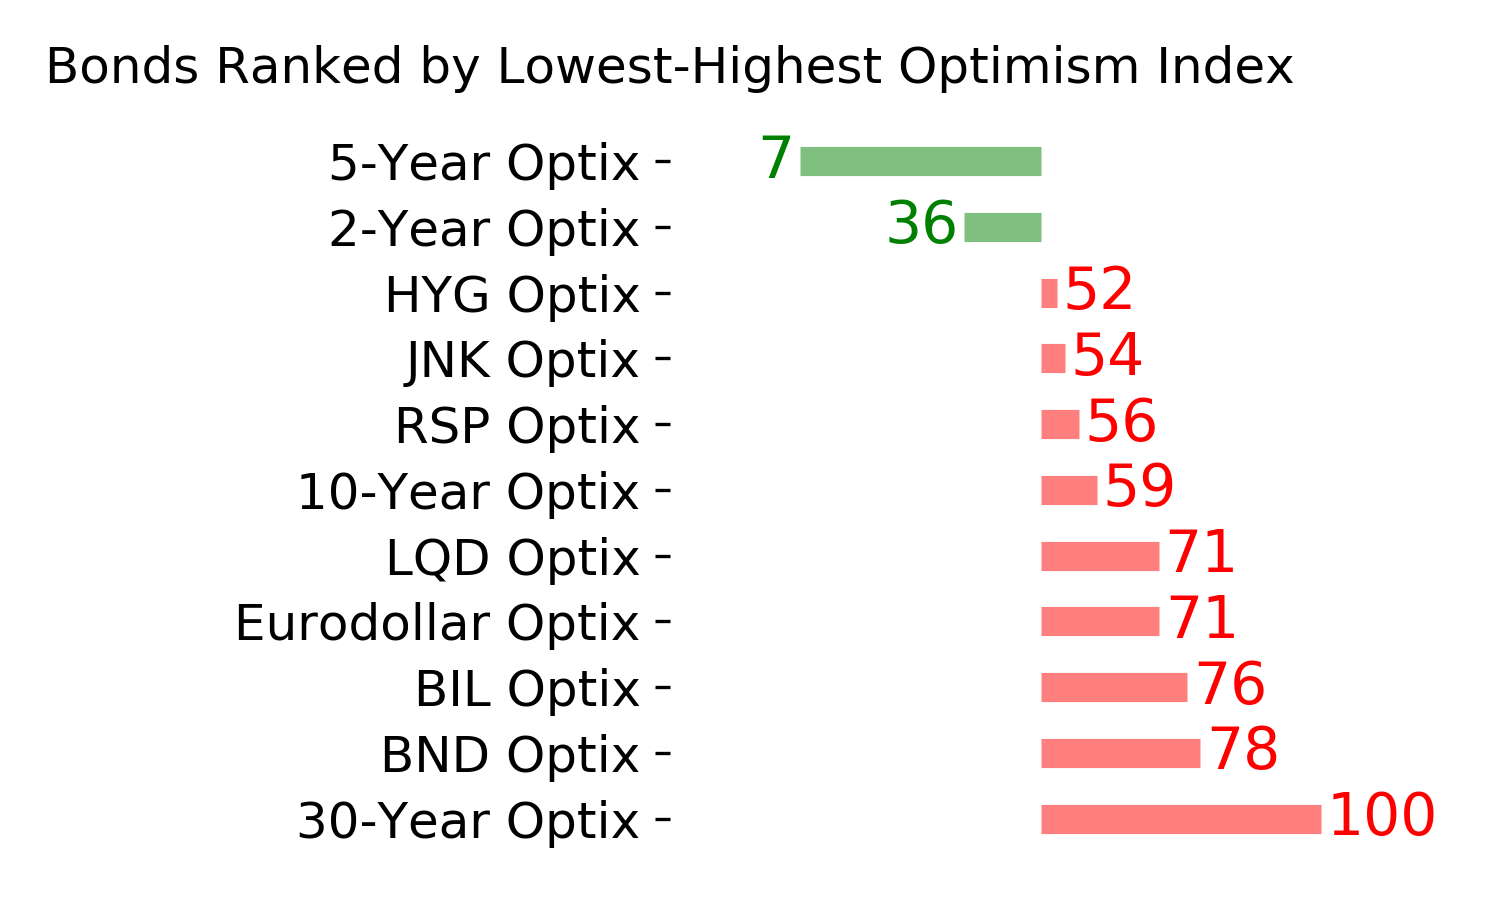
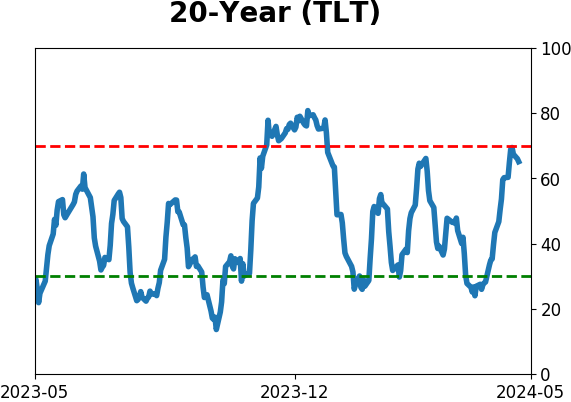
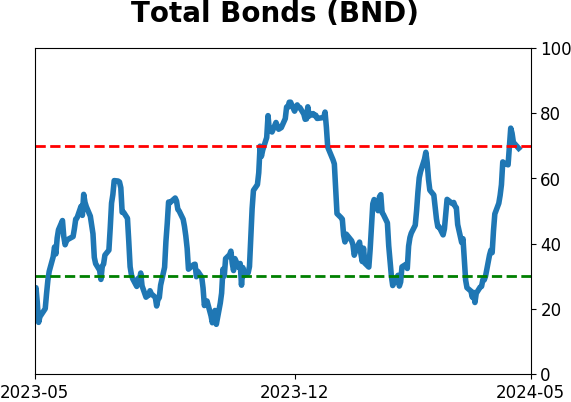
Bond ETF's - 10-Day Moving Average
|
|
|
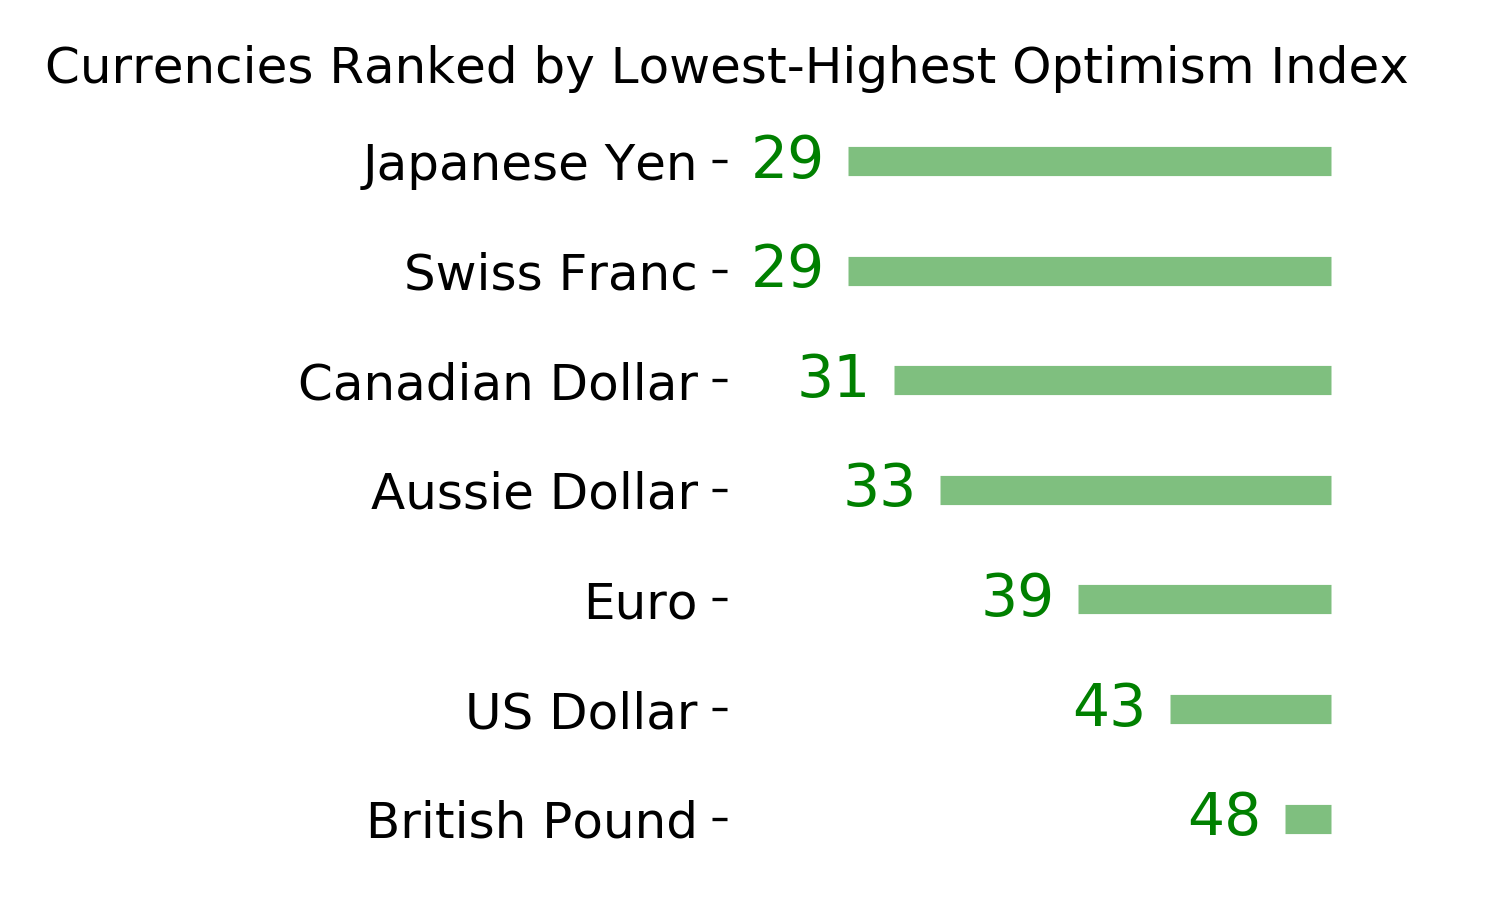
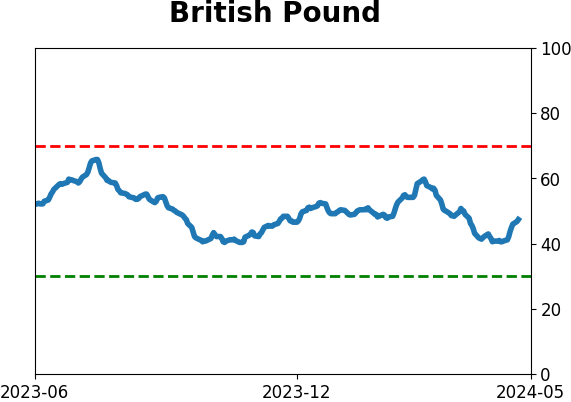
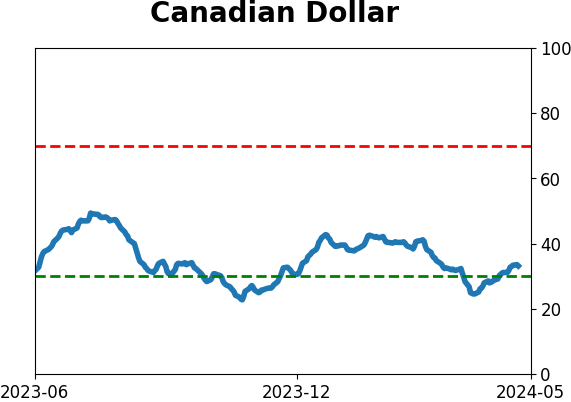
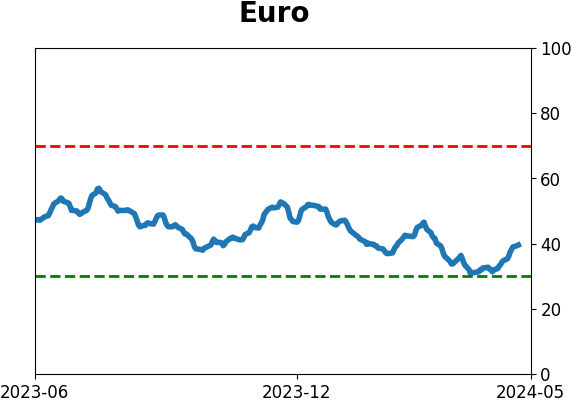
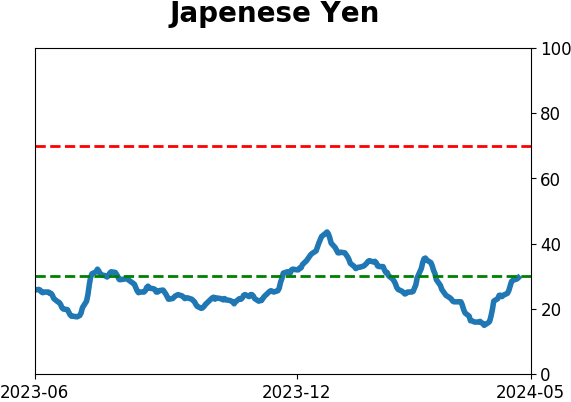
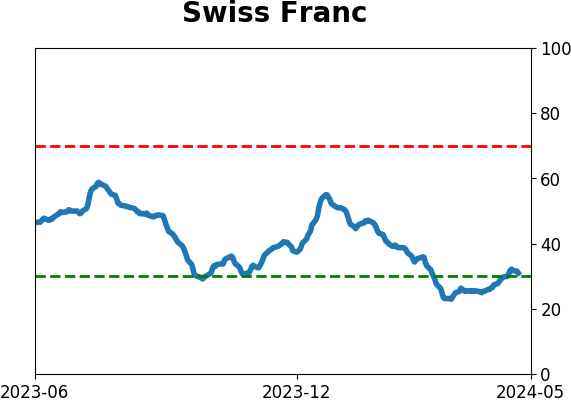
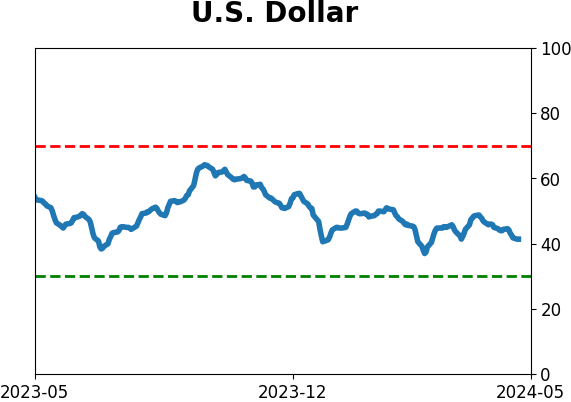
Currency ETF's - 5-Day Moving Average
|
|
|
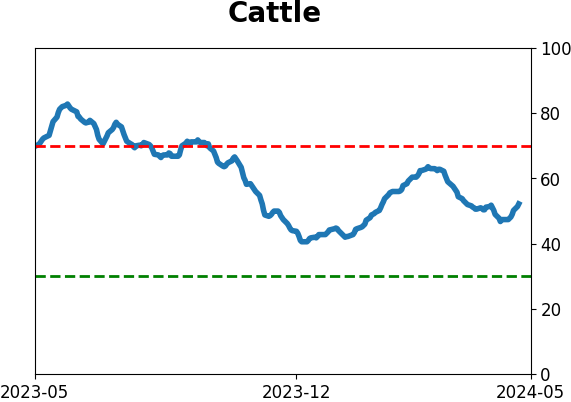
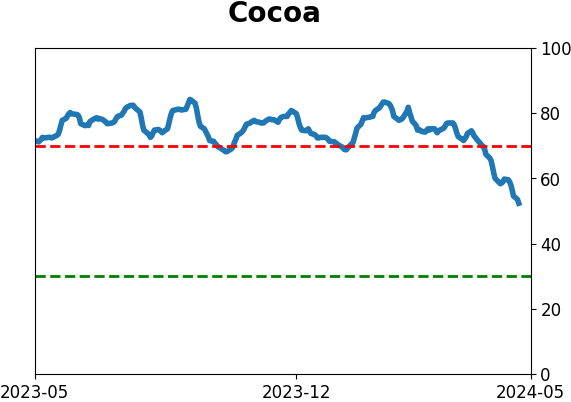
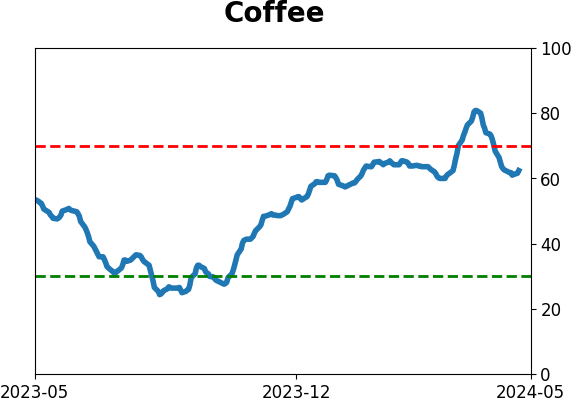
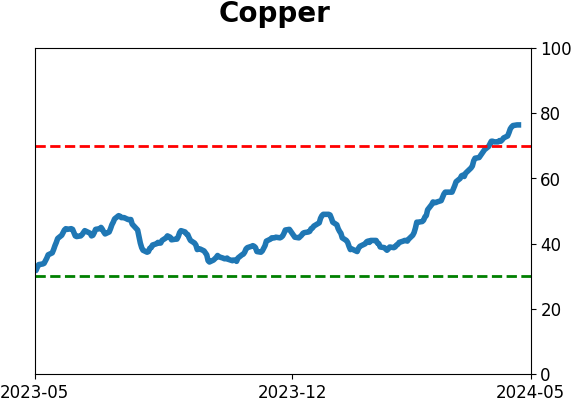
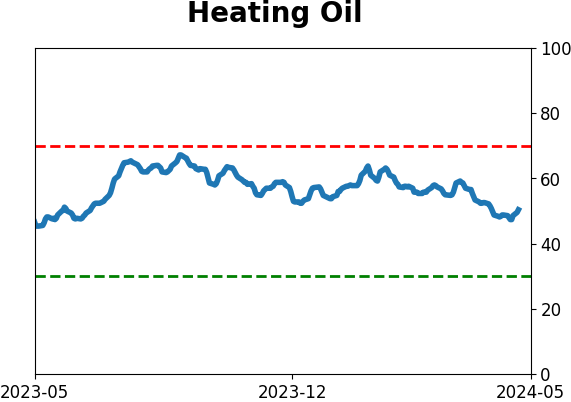
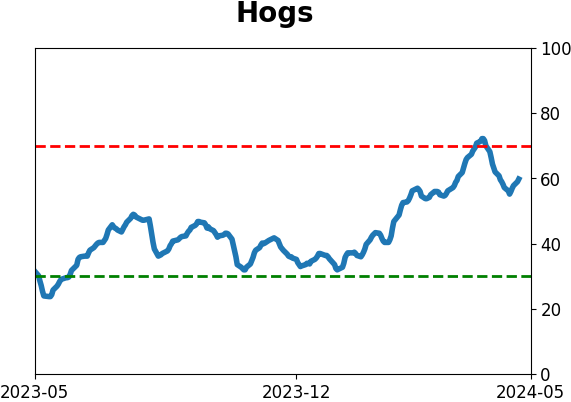
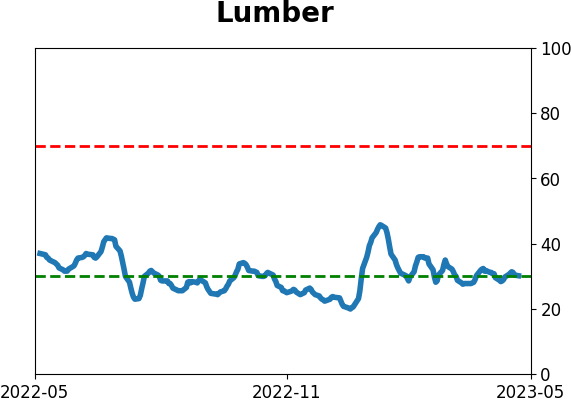
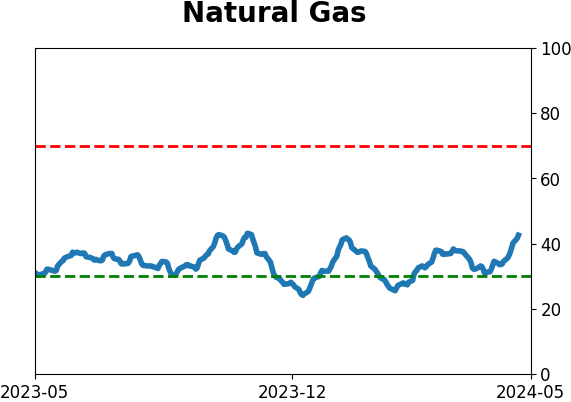
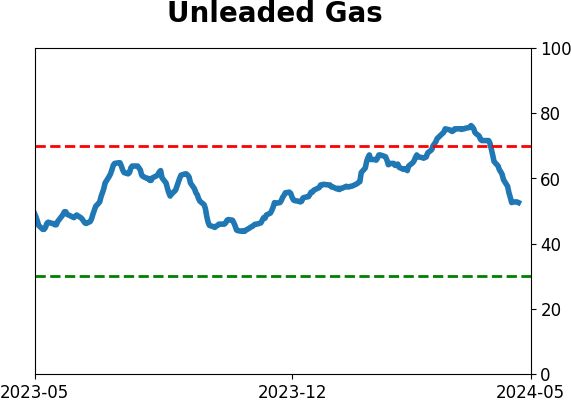
Commodity ETF's - 5-Day Moving Average
|
|