Headlines
|
|
Consumers and experts think the future will be better:
The latest surveys show that consumers are feeling a little bit better about their current conditions, while still being optimistic about the future. This is the kind of recovery seen around longer-term turning points. In the eurozone, experts are still showing pessimism about the present versus the future, to a near-record degree.
Recovery in 200-day average breadth shows long-term promise:
Over the past two months, a recovery in the percentage of S&P 500 stocks trading above their 200-day average looks like it did in 2009. It looks even more similar to other periods, though, with a mostly positive indication for long-term returns.
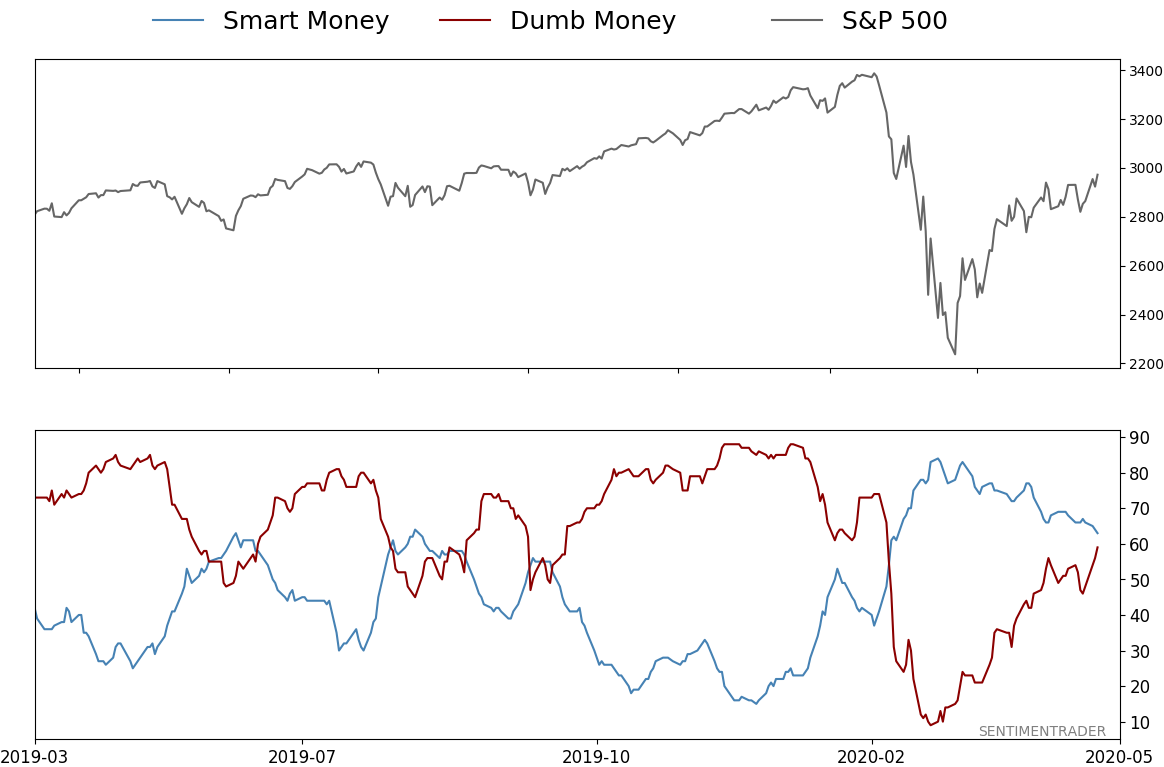
Everybody's bullish: Both Smart Money and Dumb Money Confidence are above 59%, a rare moment when it both are high - usually, they move much more in contra way to each other. Since 1999, there has only been one other day when both measures were at 59% or higher at the same time while the S&P 500 was still trading below its 200-day moving average. That was November 5, 2001, as stocks rallied following the 9/11 tragedy. Stocks continued higher for another month or so, then fell into the rest of the bear market.
|
Smart / Dumb Money Confidence
|
Smart Money Confidence: 63%
Dumb Money Confidence: 59%
|
|
Risk Levels
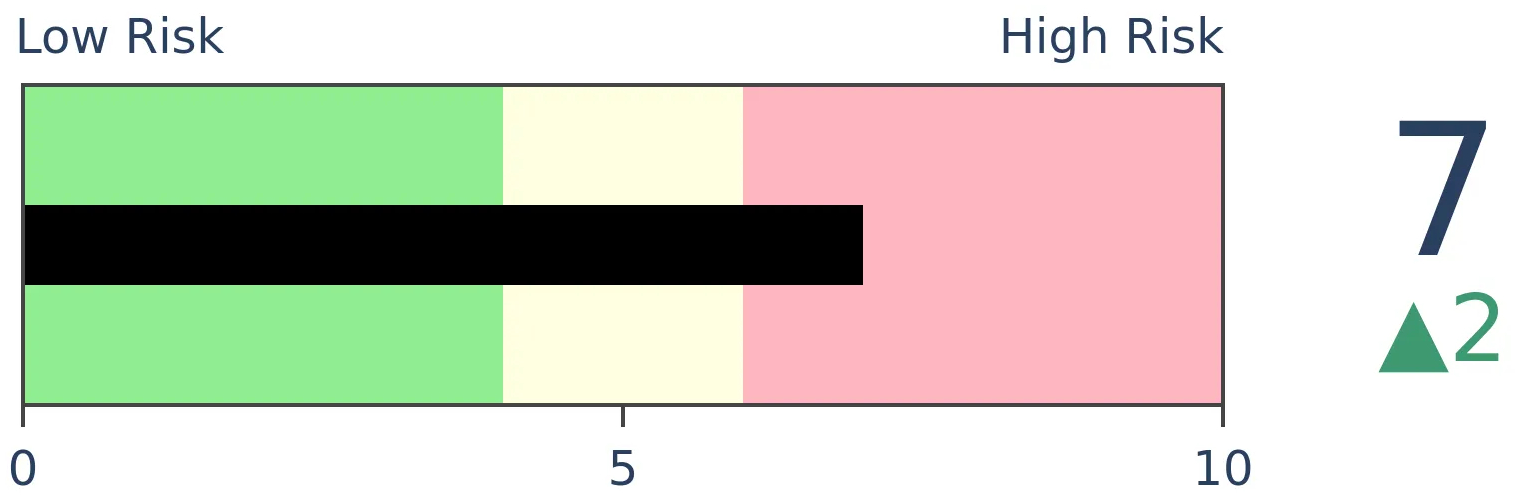
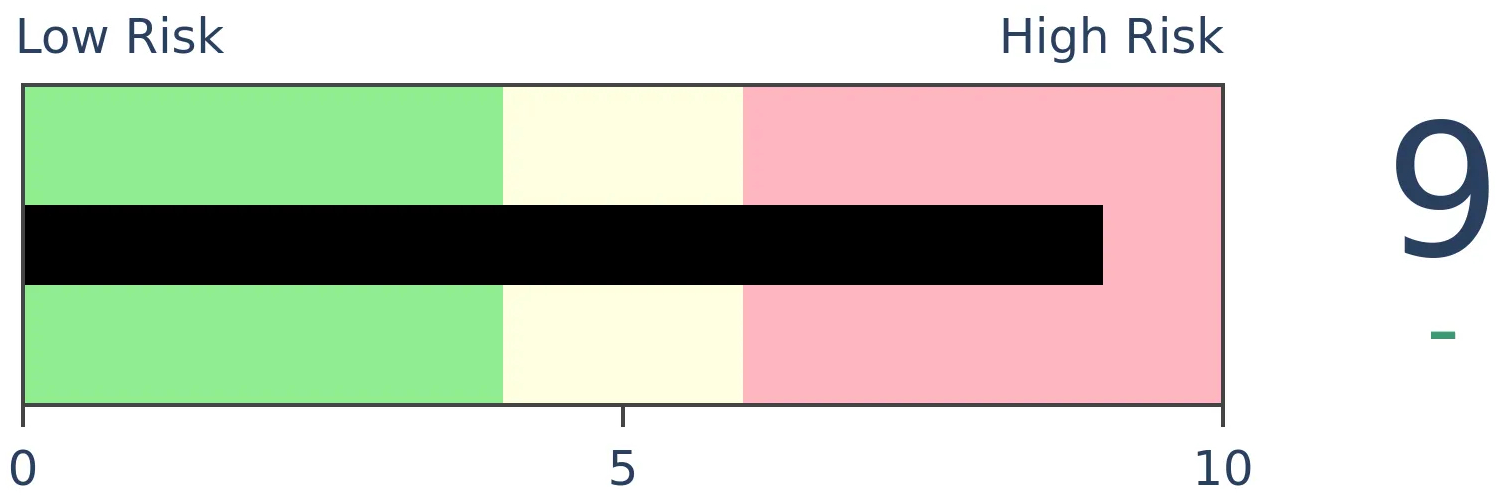
Stocks Short-Term
|
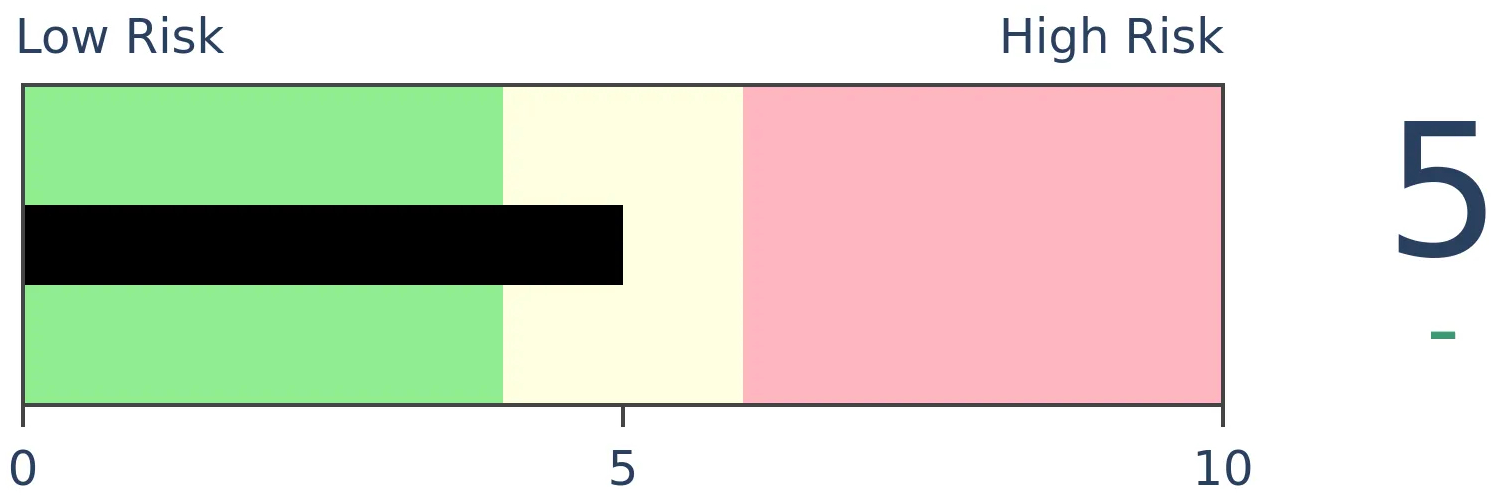
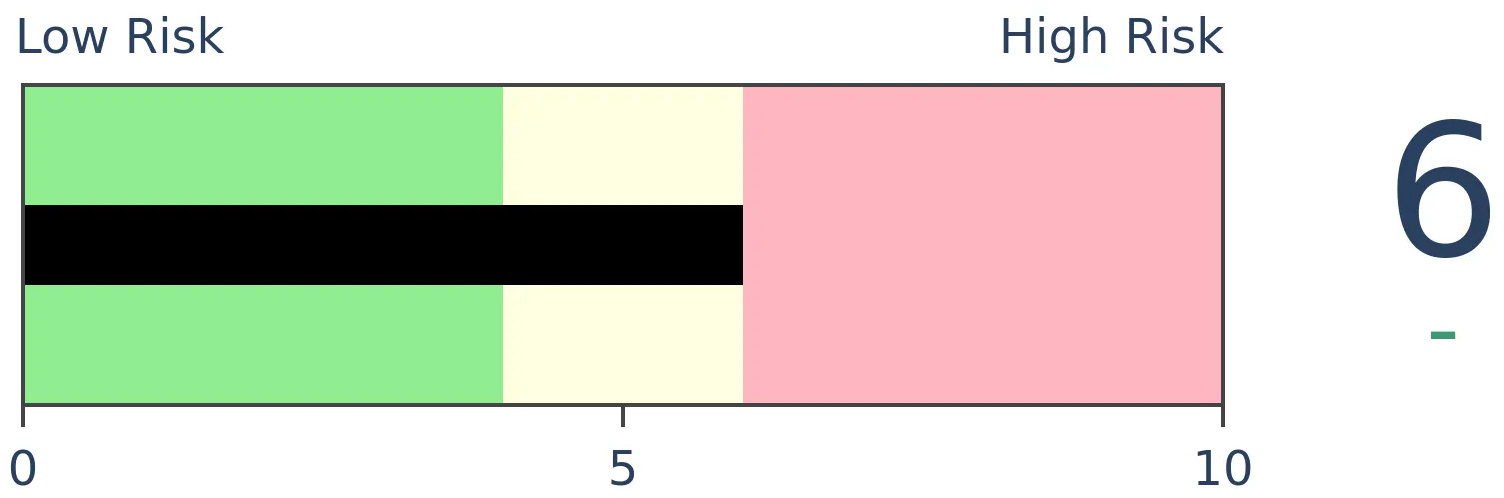
Stocks Medium-Term
|
|
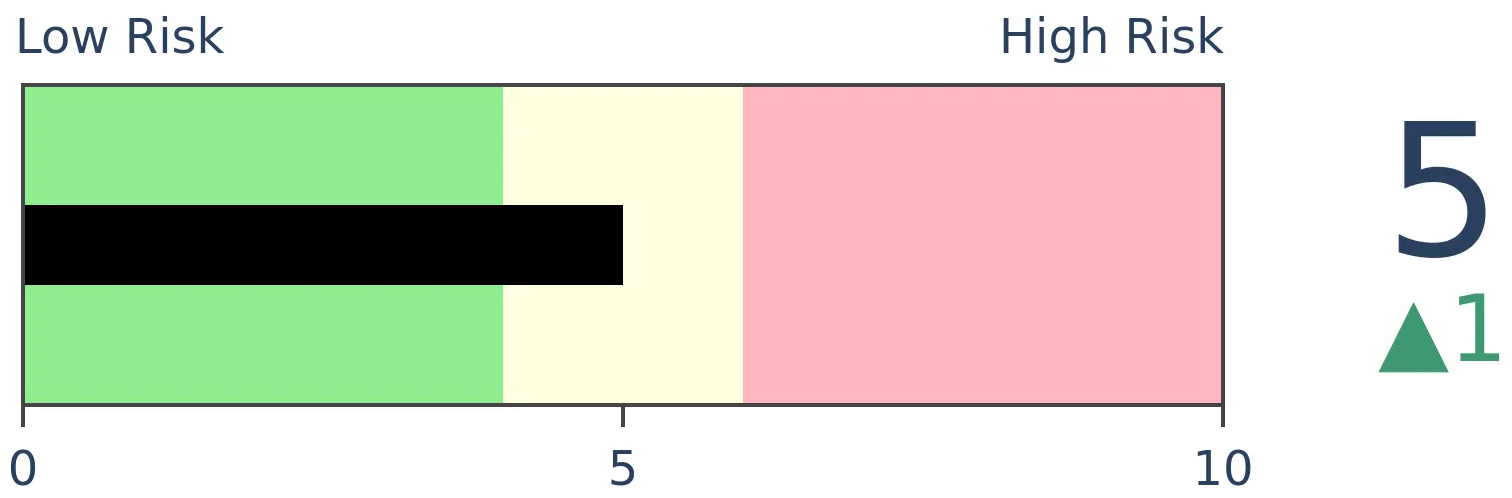
Bonds
|
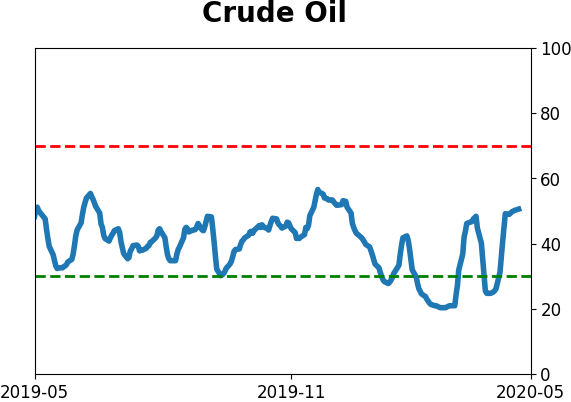
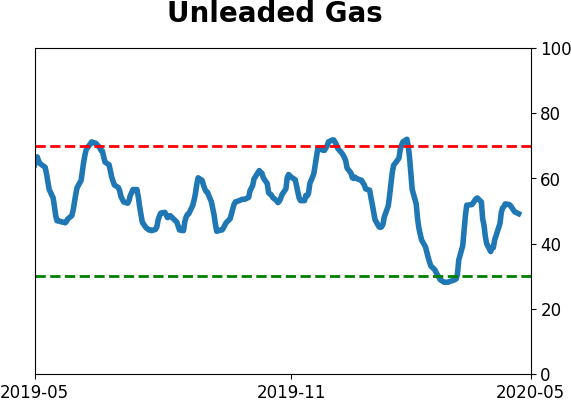
Crude Oil
|
|
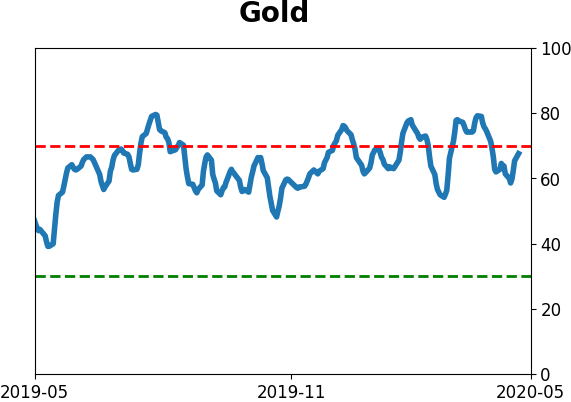
Gold

|
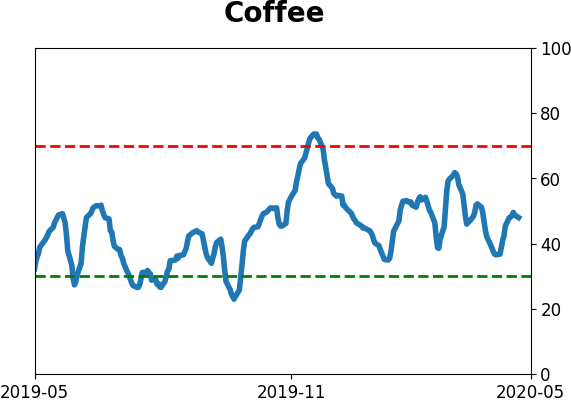
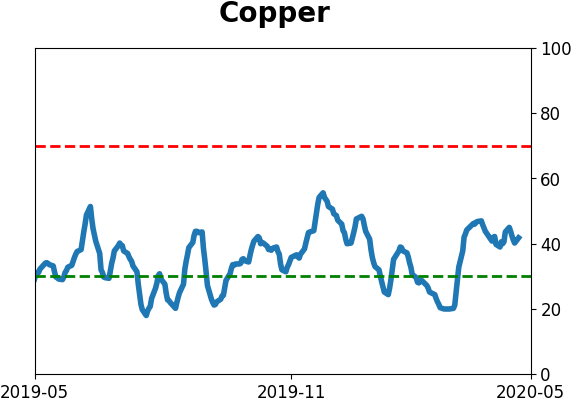
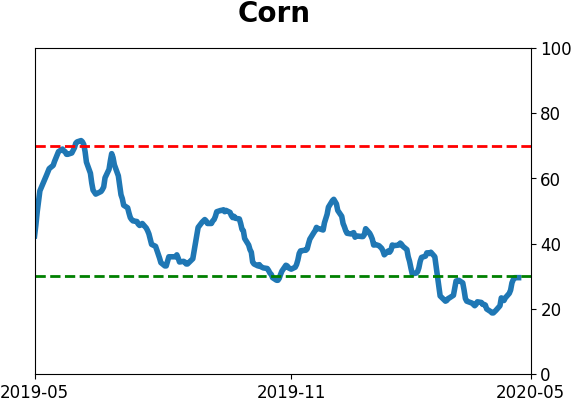
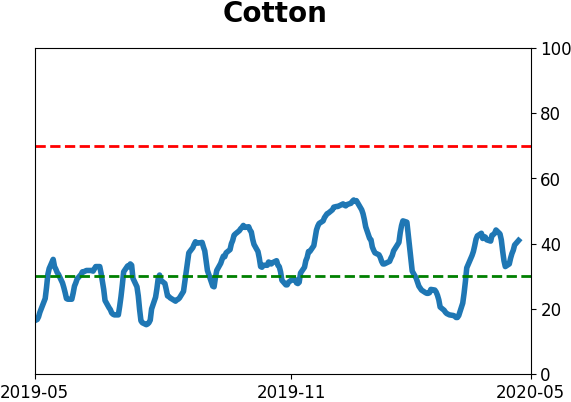
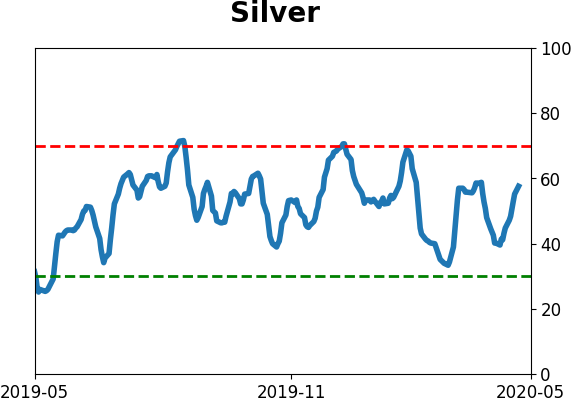
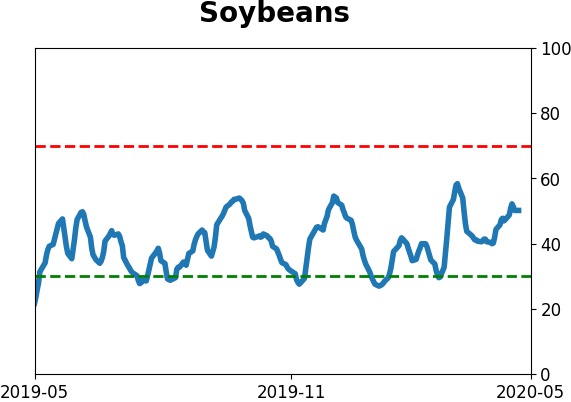
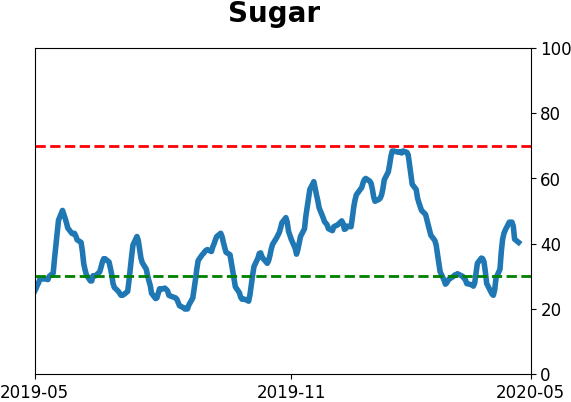
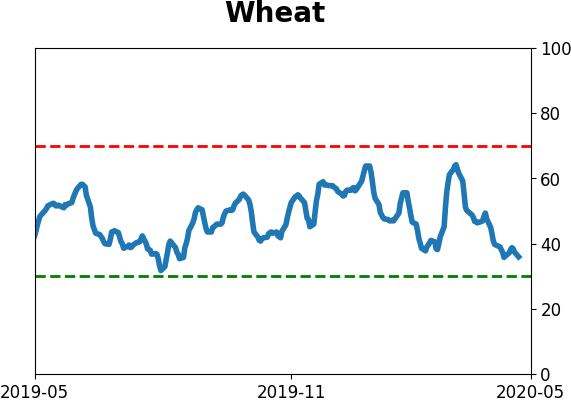
Agriculture
|
|
Research
BOTTOM LINE
The latest surveys show that consumers are feeling a little bit better about their current conditions, while still being optimistic about the future. This is the kind of recovery seen around longer-term turning points. In the eurozone, experts are still showing pessimism about the present versus the future, to a near-record degree.
FORECAST / TIMEFRAME
None
|
In March and April, the average consumer got hit hard. As a result, sentiment about their present conditions plunged, even though they remained hopeful about their futures.
With the recovery in stocks and re-opening of the economy, they're starting to feel better about now vs the future. This is similar to what happened during and after the financial crisis. In times of panic, peoples' time frames tend to shrink, with their immediate worries taking the forefront.
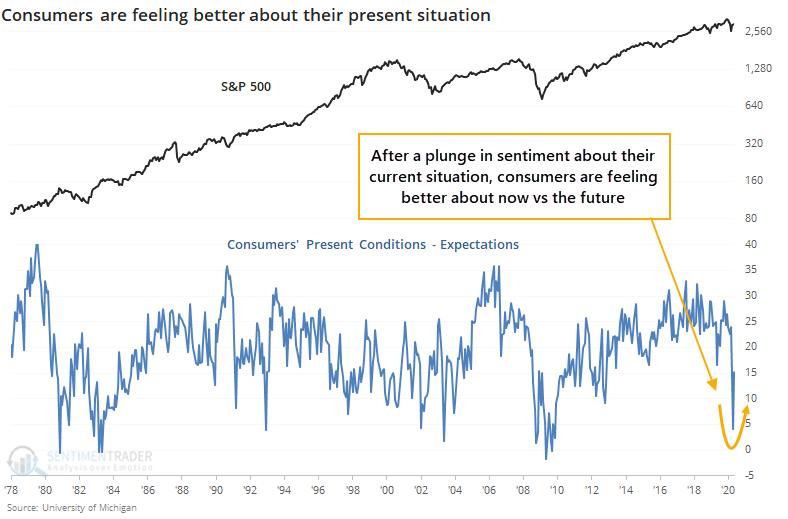
While the recovery is similar to the financial crisis, the issue is that there was a fakeout first. They started feeling better about the present versus the future by December 2008, which was not the end of the stock market slide.
There was a fakeout in 2002, too.
The drop in sentiment about current conditions wasn't (and isn't) just limited to consumers, or just those in the U.S. The ZEW organization's survey of experts in the financial industry shows a continued plunge in their evaluation of current conditions versus those they expect in the future.
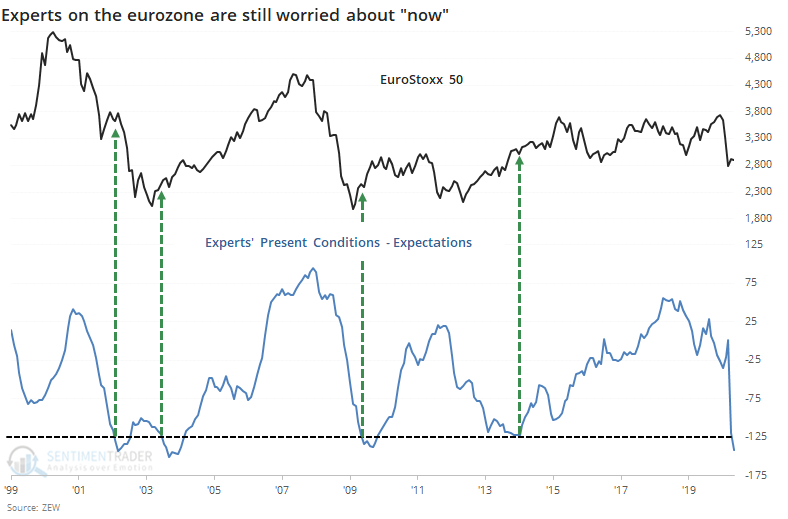
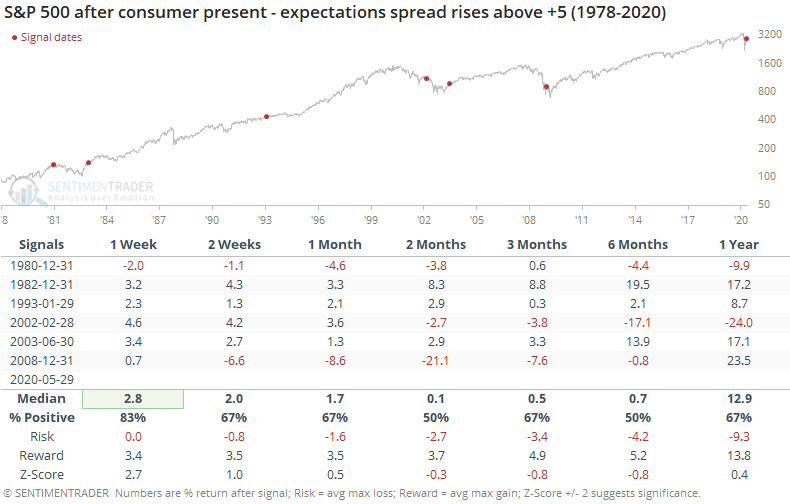
These professionals are still much more worried about the present as opposed to the future, and it's nearing a record spread. That has tended to occur soon after major turning points, with a major exception in 2002.
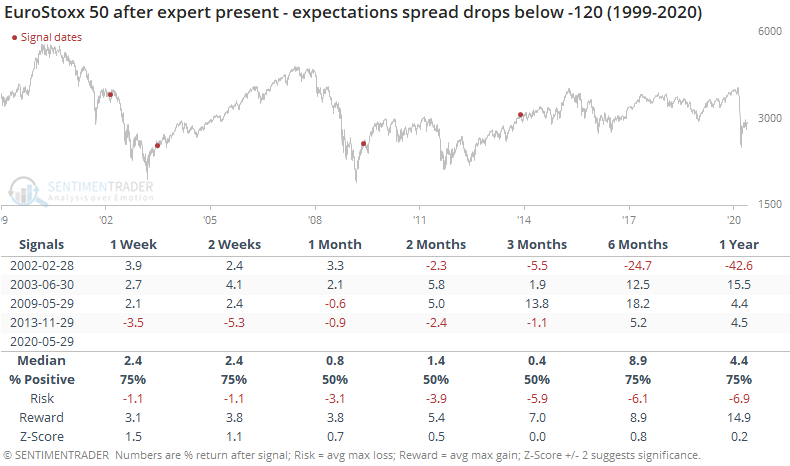
We can see how mixed the forward returns were, with all four of them showing losses or only moderate gains over the next 1-3 months, but then all but one showed good gains longer-term.
Depending on how this is framed in the media, we might think that consumers are too optimistic about the future, and stocks are doomed to fall. More likely, it's the opposite on a long-term time frame. By the time consumers (and experts, for that matter) get this despondent over their current conditions versus their expectations about the future, stocks have already priced in the worst.
BOTTOM LINE
Over the past two months, a recovery in the percentage of S&P 500 stocks trading above their 200-day average looks like it did in 2009. It looks even more similar to other periods, though, with a mostly positive indication for long-term returns.
FORECAST / TIMEFRAME
None
|
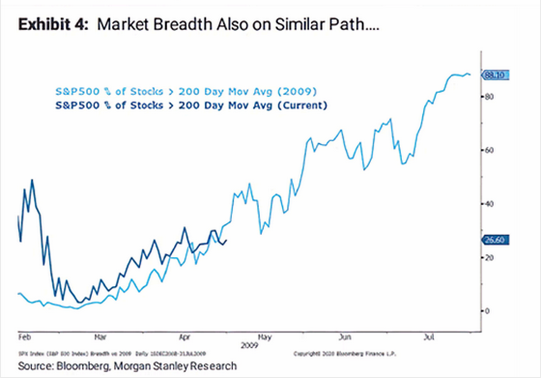
According to a major investment bank, stocks are trading just like they did during the recovery in 2009.
As noted on MarketWatch, Morgan Stanley shows that the percentage of stocks within the S&P 500 that are trading above their 200-day averages looks just like it did when they emerged out of the financial crisis.
In the decades that we've been looking at price analogs (how highly correlated a current period is to the path during other periods), they've proven to be modestly useful. When there is a very high correlation, with a decent sample size, it has helped more than hurt as a guide.
The main problem is that it's way too easy to cherry-pick examples based on whatever outlook the analyst wants to convey. That's why we use a transparent methodology, going back as far as history allows, and show every occurrence. Sometimes it suggests an edge; often it does not. It's good to know what doesn't work just as much as it's good to know what does.
If we use the same methodology we always do, then we can see if Morgan Stanley has a useful point. We'll go back to 1990 and look for every 40-day period that had the highest correlation to how the past 40 days have unfolded in terms of the percentage of stocks in the S&P trading above their 200-day moving averages.
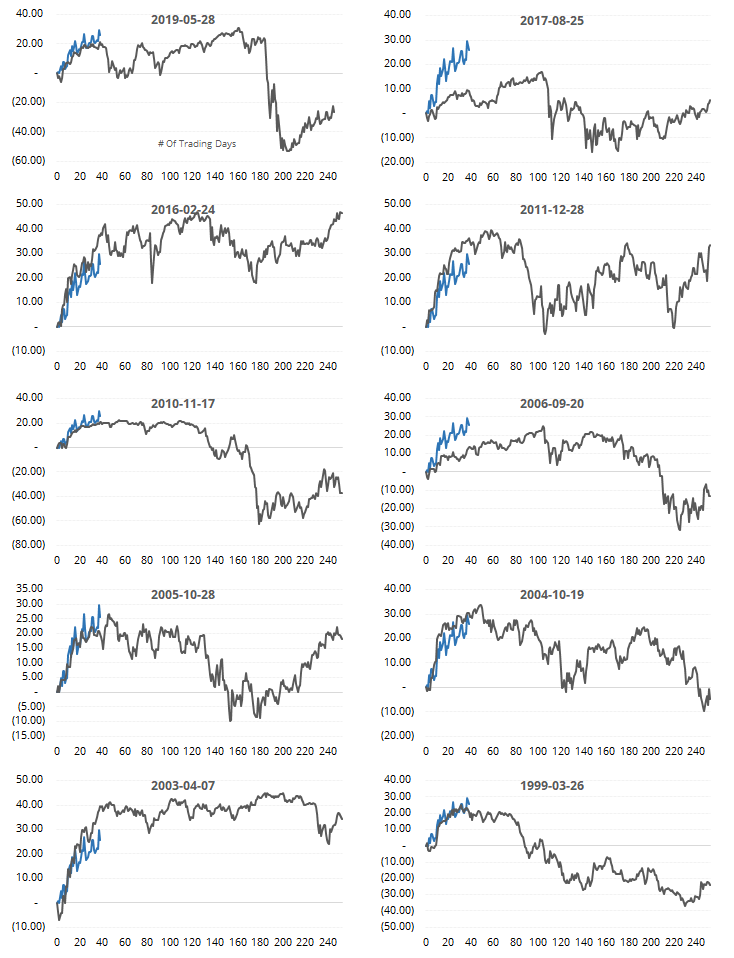
Interestingly, the initial recovery in 2009 doesn't even make the list - that's why we use a consistent methodology instead of trying to eyeball things. This is what we get:
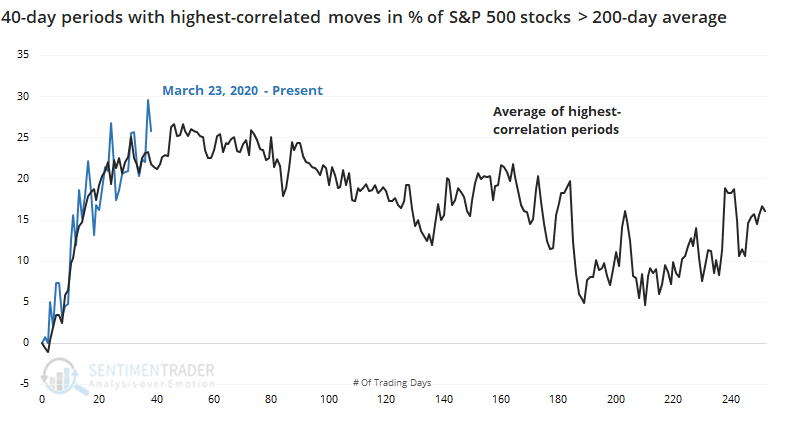
The top 15 highest-correlated periods all had a correlation higher than 0.90, which is extremely high.
From their average path seen in the chart above, clearly it's very close to what we've seen since the March 23 low. The biggest worry is that many of those also peaked right about now - that doesn't mean that the S&P 500 itself peaked, only that the percentage of stocks above their long-term averages did.
Here are the 10 most recent instances. Again, that's not the S&P 500 we're looking at, it's the percentage of stocks above their 200-day averages.
Okay, so what? Let's see what kind of impact that had on returns for the S&P going forward. These returns are from day 40 on onward, for the highest-correlated periods.
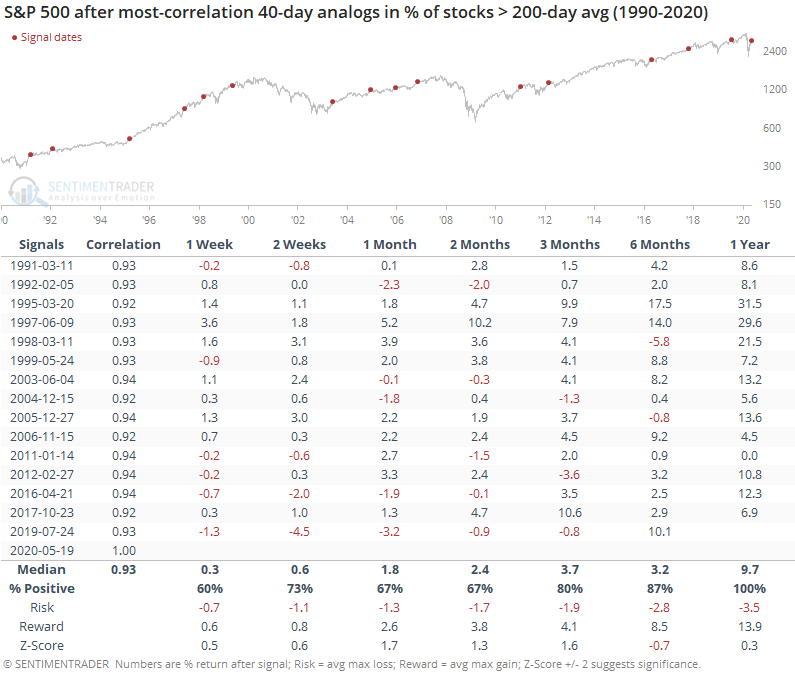
It was a decent sign, especially longer-term. The next 1-2 months were mostly positive, but not exceptionally so. There was a higher probability of seeing a positive return from 3-12 months later, with a perfect record a year later. The average return wasn't that great, about in line with random, but the risk/reward skew was healthy.
While it might not be the slam-dunk positive it was if we rely on the 2009 template, it does suggest a modest upside bias long-term.
Active Studies
| Time Frame | Bullish | Bearish | | Short-Term | 0 | 6 | | Medium-Term | 12 | 3 | | Long-Term | 37 | 3 |
|
Indicators at Extremes
Portfolio
| Position | Weight % | Added / Reduced | Date | | Stocks | 38.9 | Reduced 10% | 2020-05-13 | | Bonds | 0.0 | Reduced 6.7% | 2020-02-28 | | Commodities | 5.1 | Added 2.4%
| 2020-02-28 | | Precious Metals | 0.0 | Reduced 3.6% | 2020-02-28 | | Special Situations | 0.0 | Reduced 31.9% | 2020-03-17 | | Cash | 56.0 | | |
|
Updates (Changes made today are underlined)
In the first months of the year, we saw manic trading activity. From big jumps in specific stocks to historic highs in retail trading activity to record highs in household confidence to almost unbelievable confidence among options traders. All of that came amid a market where the average stock couldn't keep up with their indexes. There were signs of waning momentum in stocks underlying the major averages, which started triggering technical warning signs in late January. The kinds of extremes we saw in December and January typically take months to wear away, but the type of selling in March went a long way toward getting there. When we place the kind of moves we saw into March 23 into the context of coming off an all-time high, there has been a high probability of a multi-month rebound. After stocks bottomed on the 23rd, they enjoyed a historic buying thrust and retraced a larger amount of the decline than "just a bear market rally" tends to. While other signs are mixed that panic is subsiding, those thrusts are the most encouraging sign we've seen in years. Shorter-term, there have been some warning signs popping up and our studies have stopped showing as positively skewed returns. I reduced my exposure some in late April and was looking for a pattern of lower highs and lower lows to reduce it further. With weakness on May 12, our studies turned even more negative over the short- to medium-term so I reduced a bit more. Some short-term indicators are already nearing oversold so we may get a quick rebound but it is what it is. If we see a clear pattern of lower lows, I may reduce even further in the week(s) ahead. Long-term prospects look decent because of the thrusts we saw off the low, but I'm more comfortable in cash in the interim. I'd consider adding back if we see our indicators and studies start to skew to the upside again, or if price action turns clearly better, indicating my caution is wrong.
RETURN YTD: -7.6% 2019: 12.6%, 2018: 0.6%, 2017: 3.8%, 2016: 17.1%, 2015: 9.2%, 2014: 14.5%, 2013: 2.2%, 2012: 10.8%, 2011: 16.5%, 2010: 15.3%, 2009: 23.9%, 2008: 16.2%, 2007: 7.8%
|
|
Phase Table
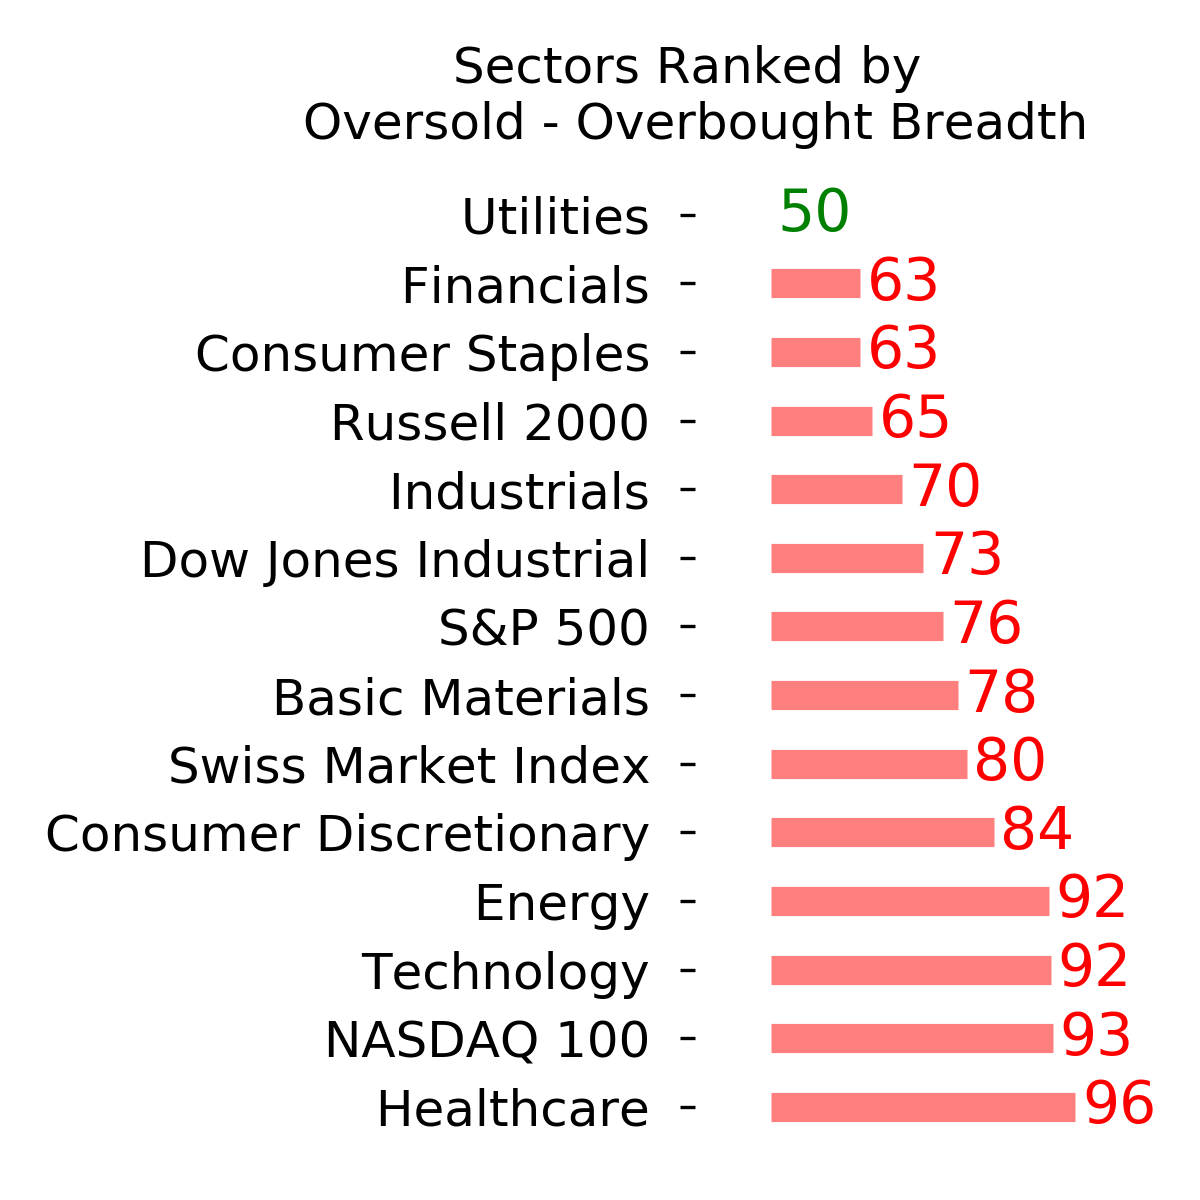
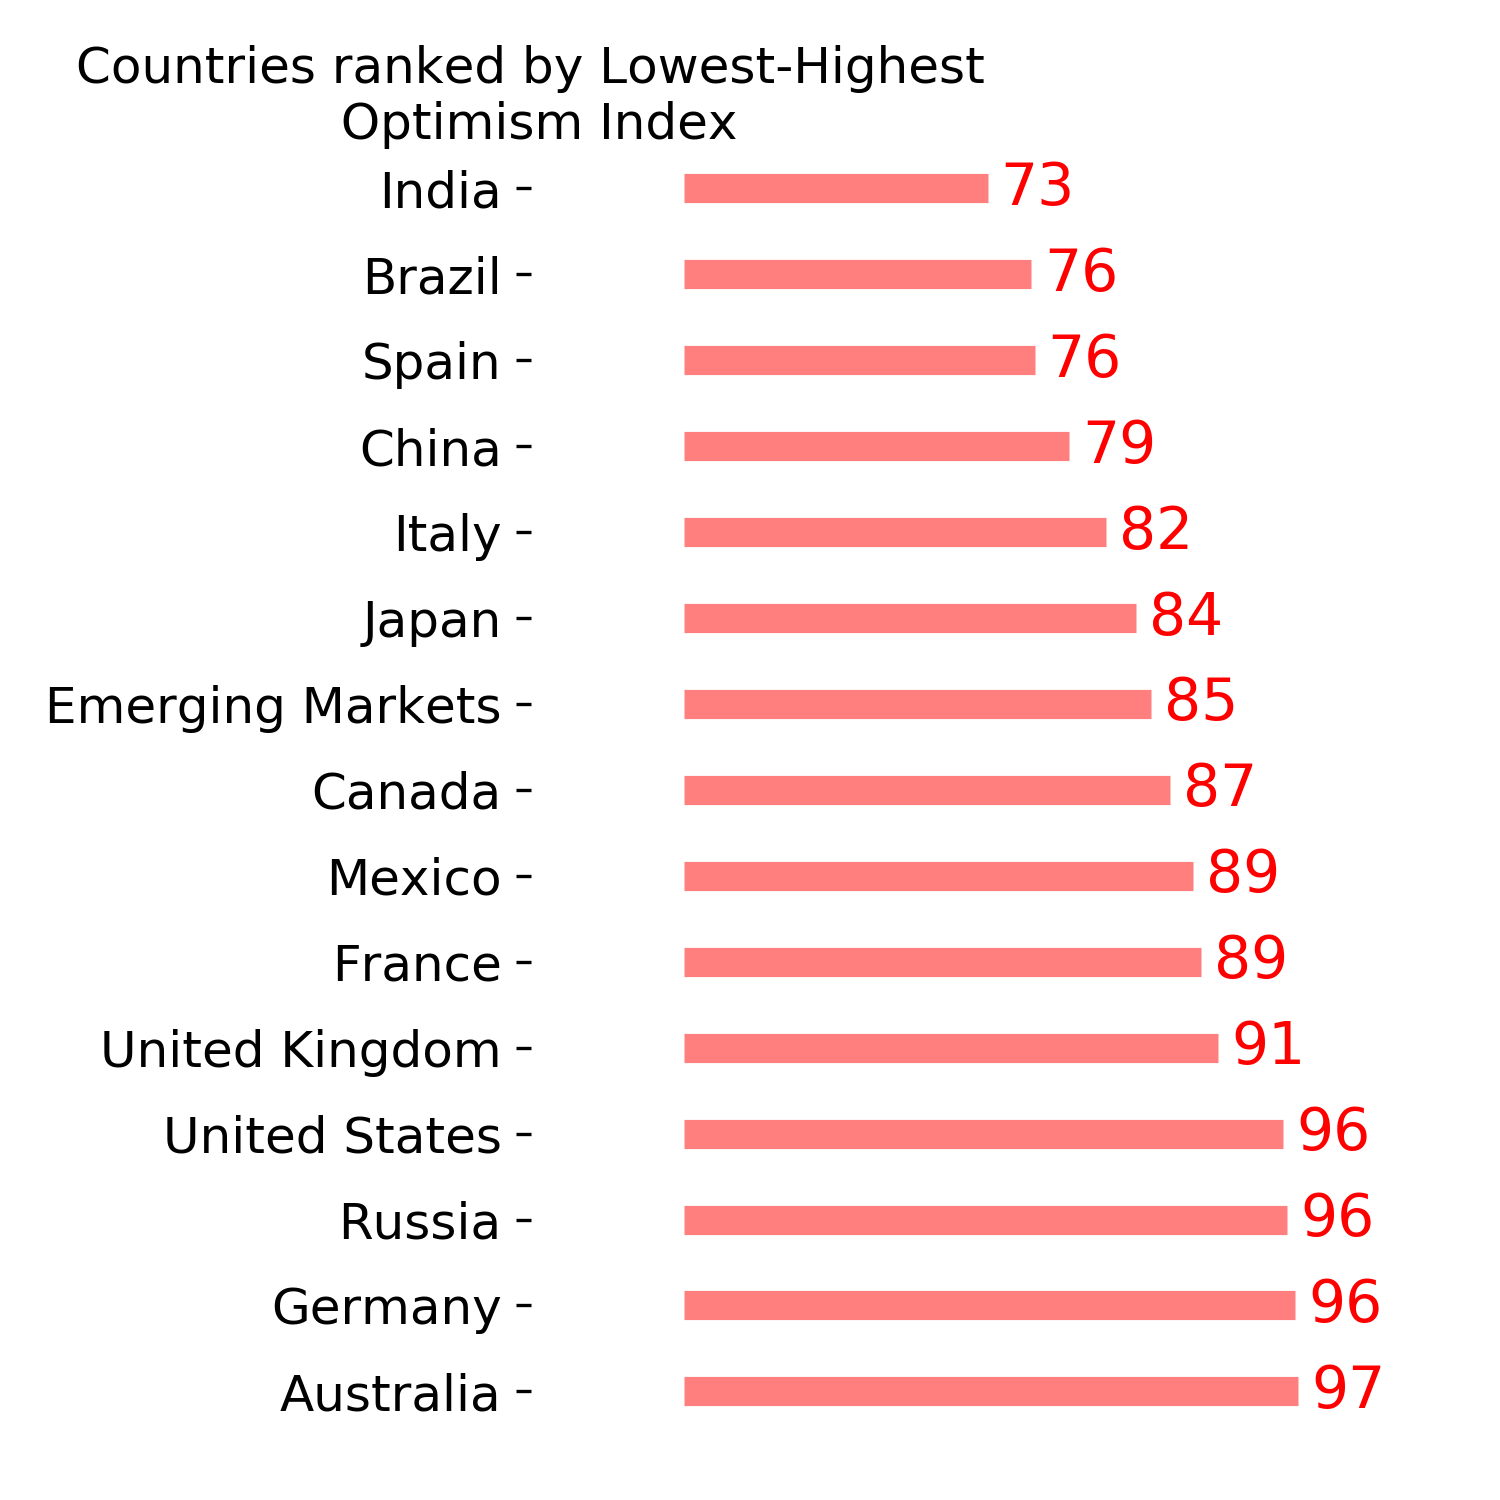
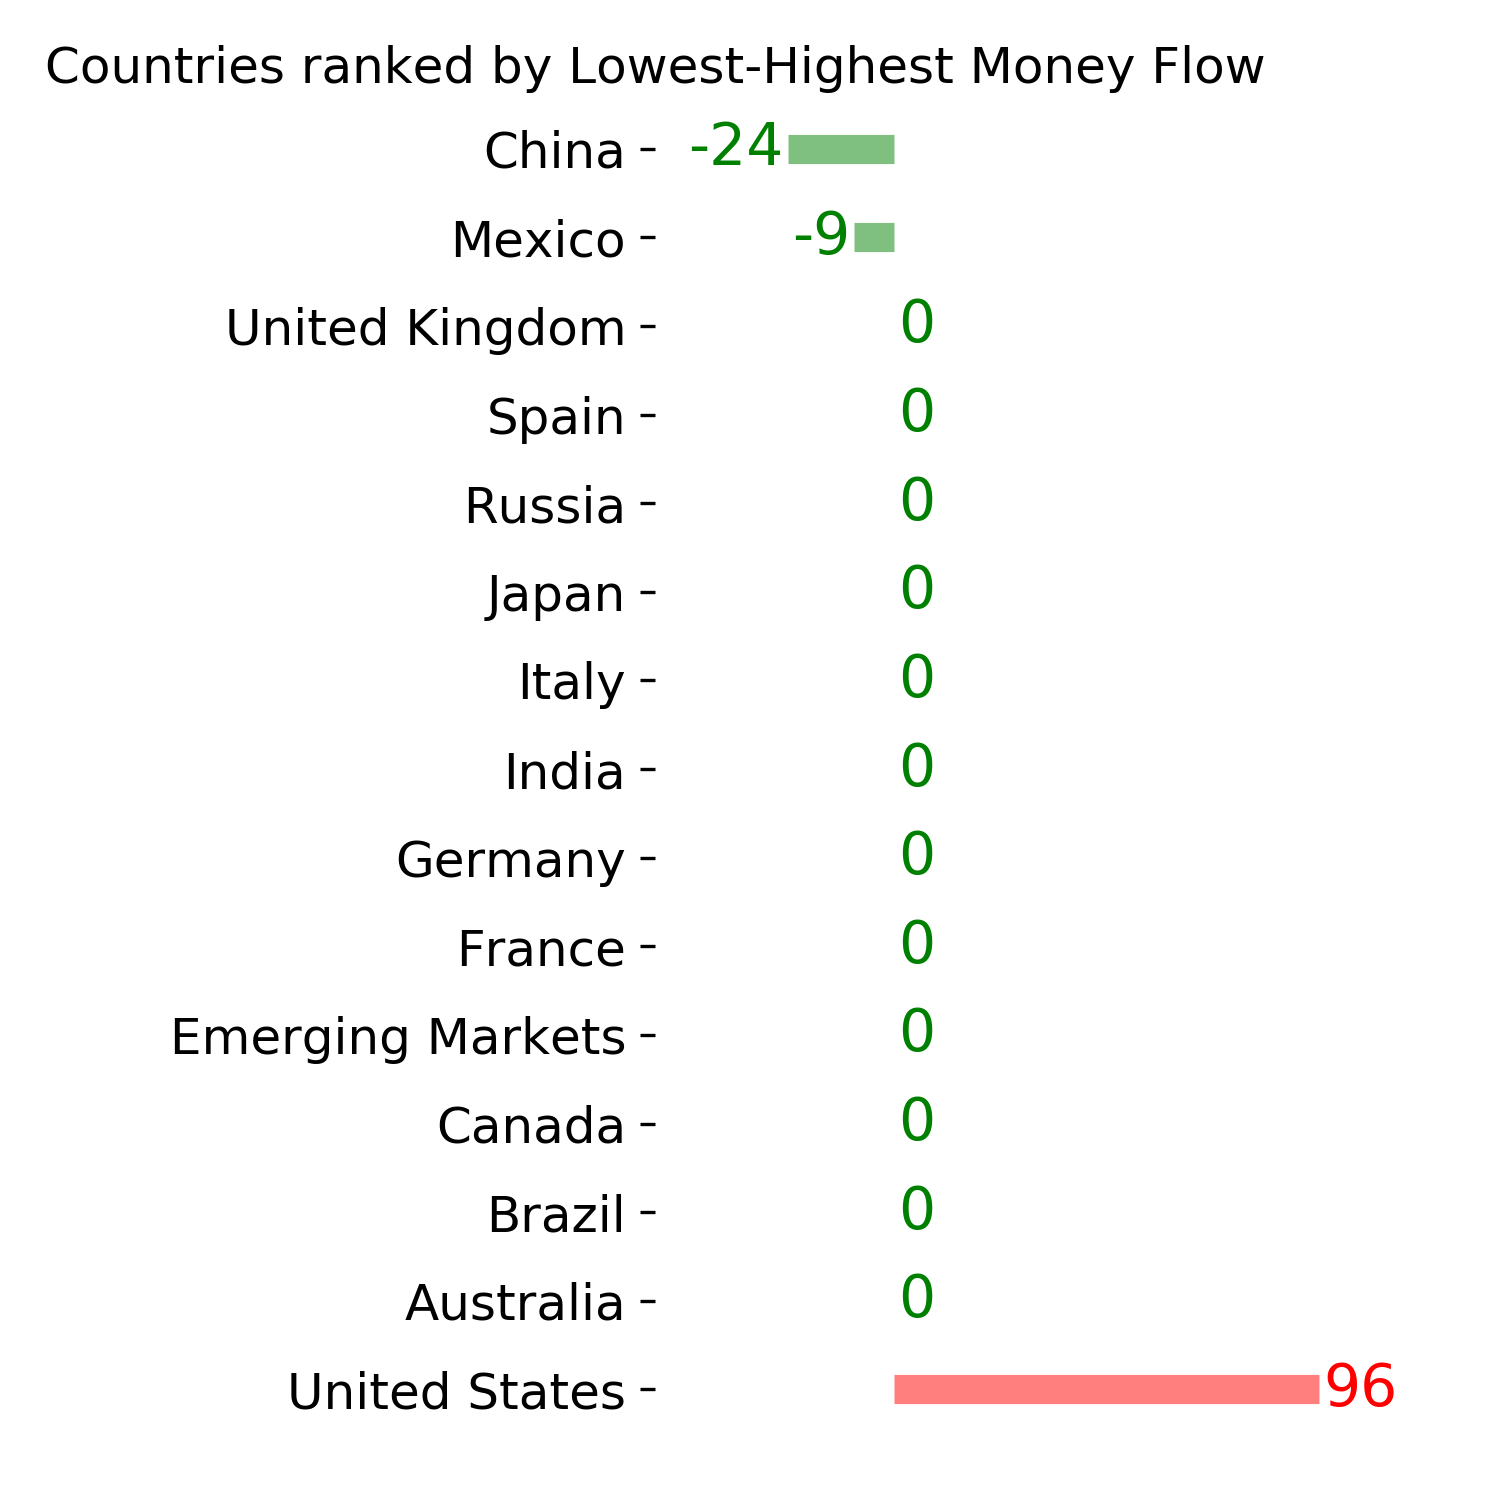
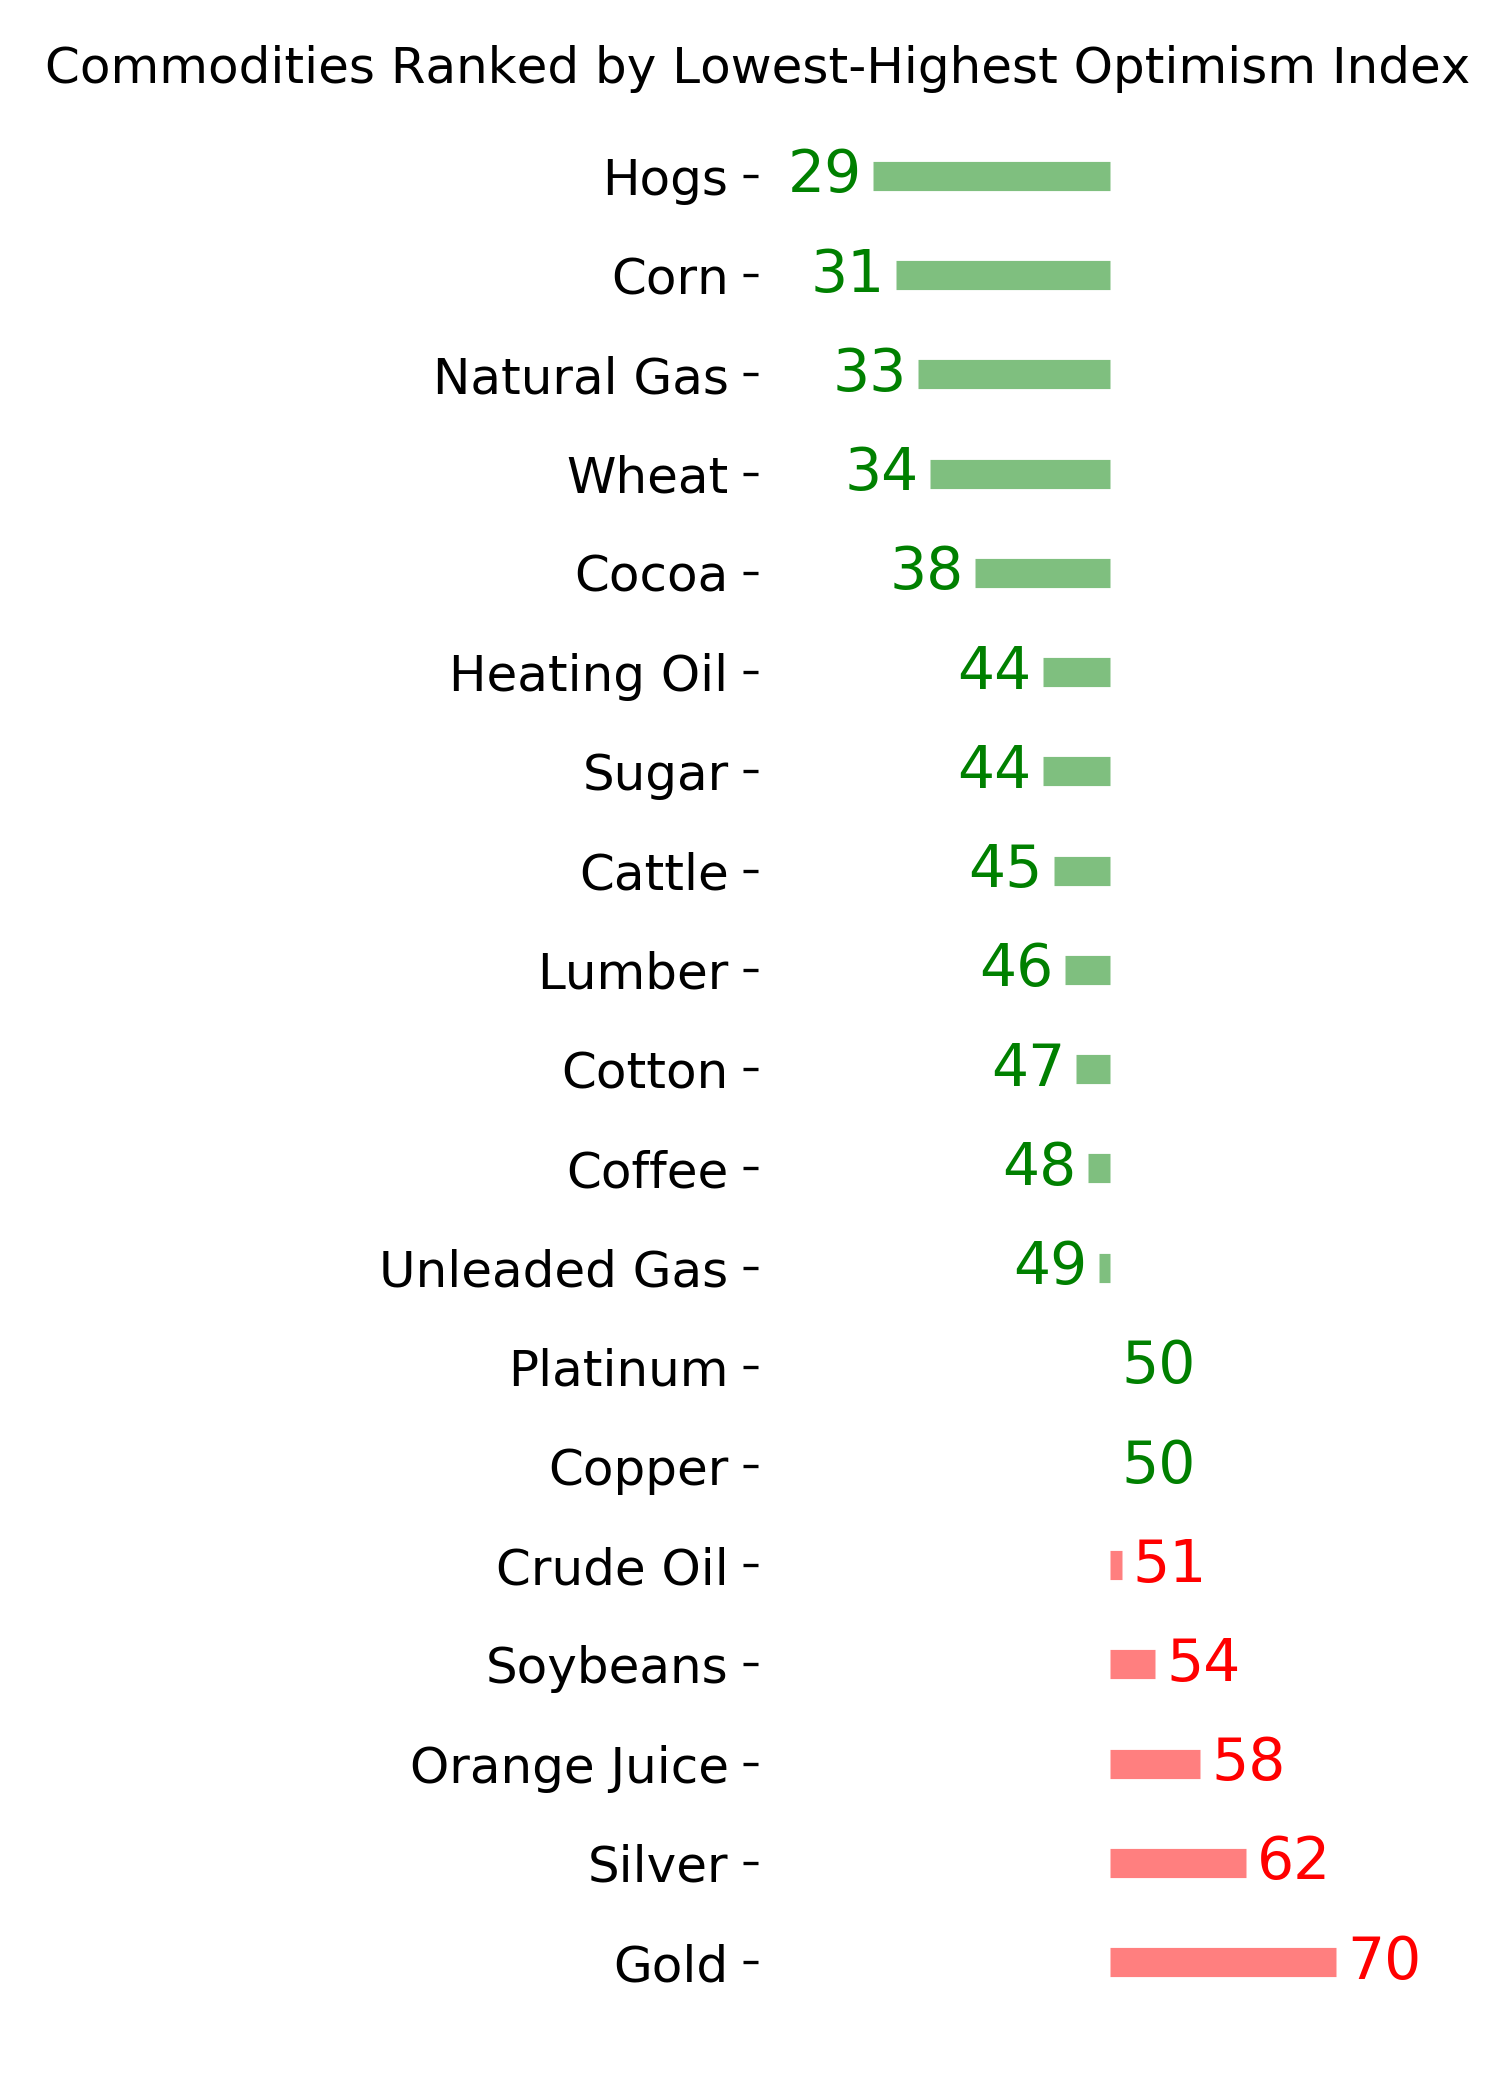
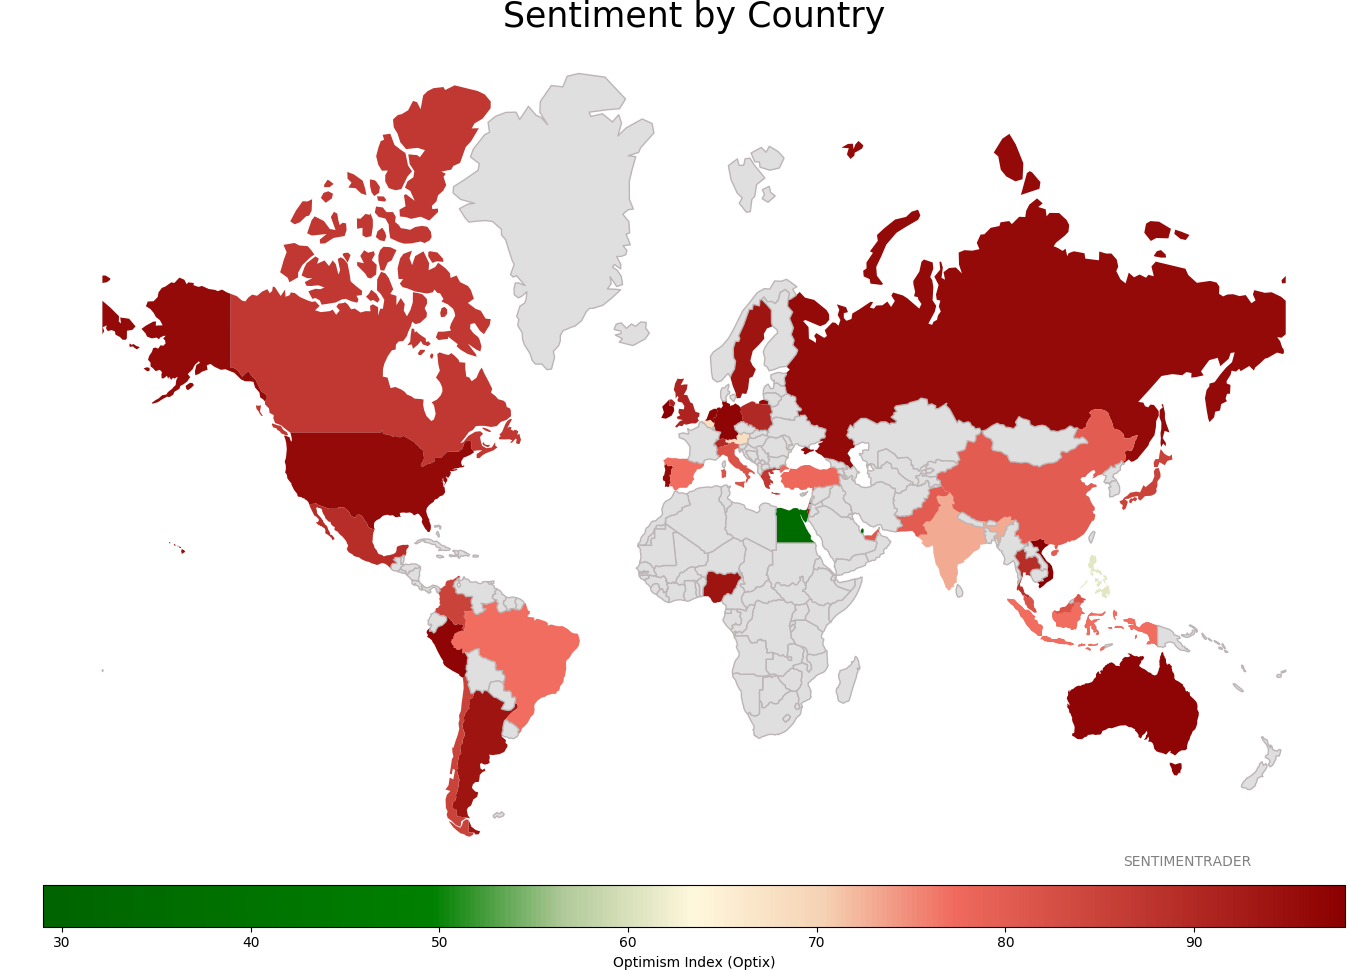
Ranks
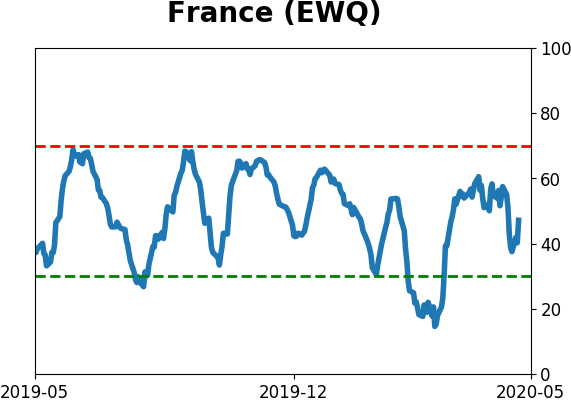
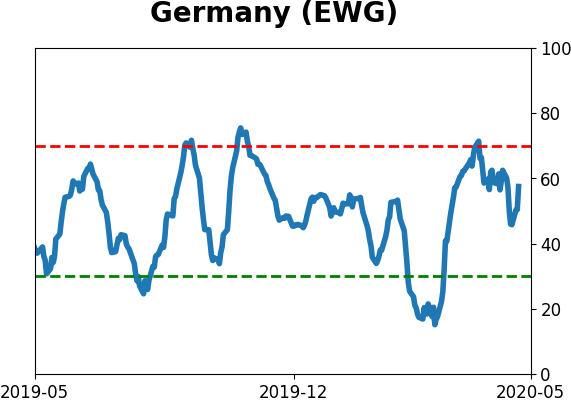
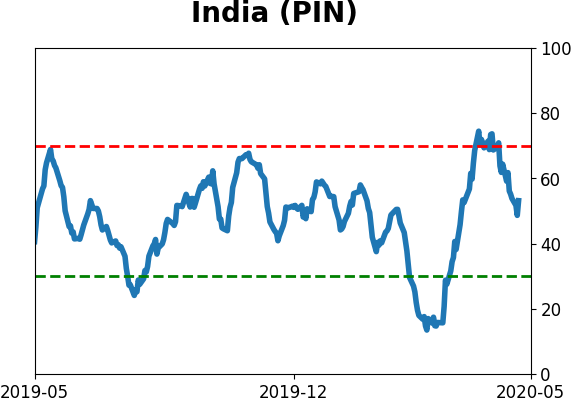
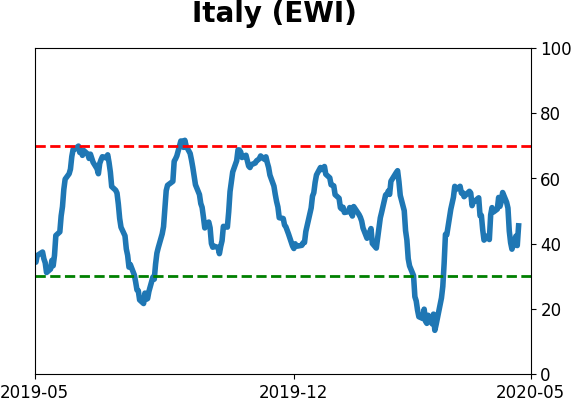
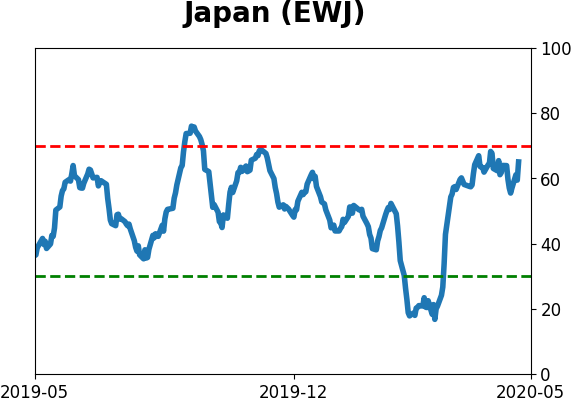
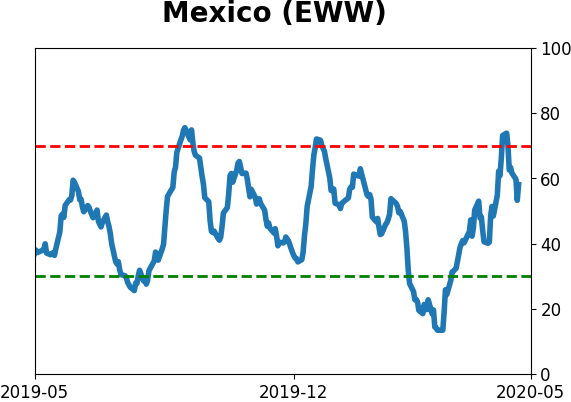
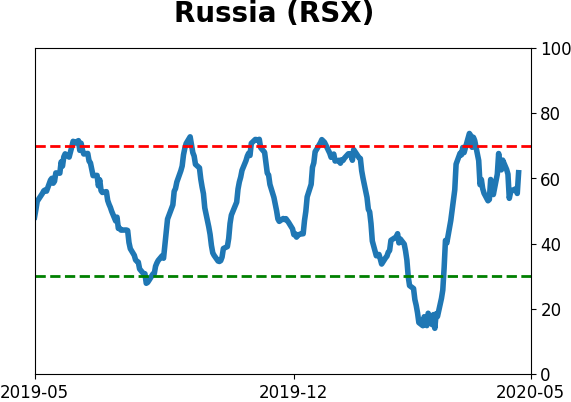
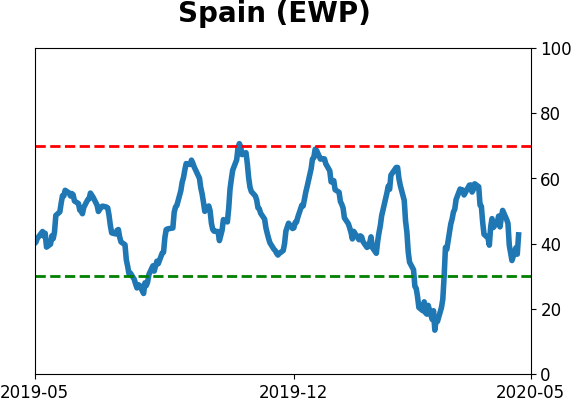
Sentiment Around The World
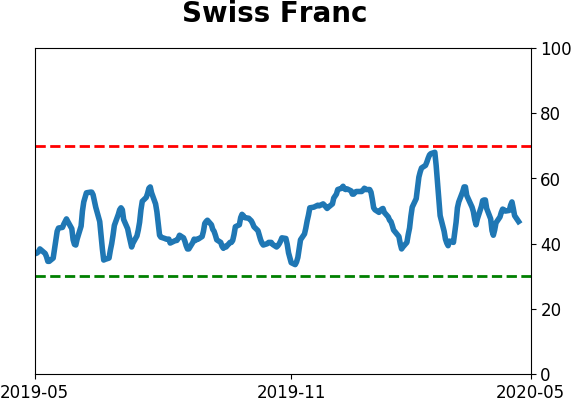
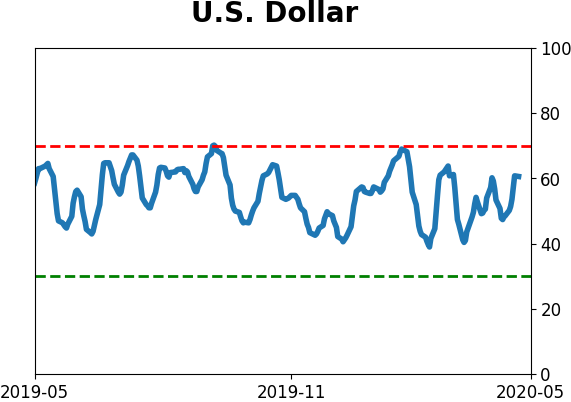
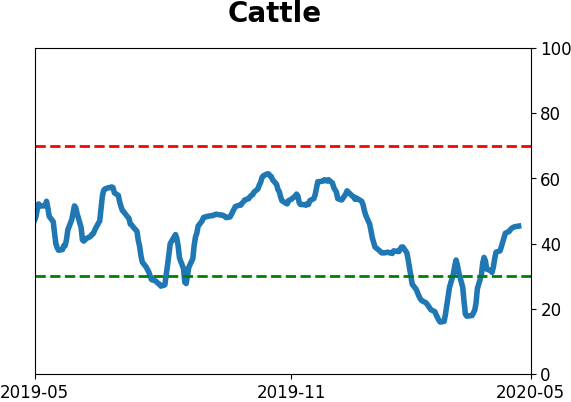
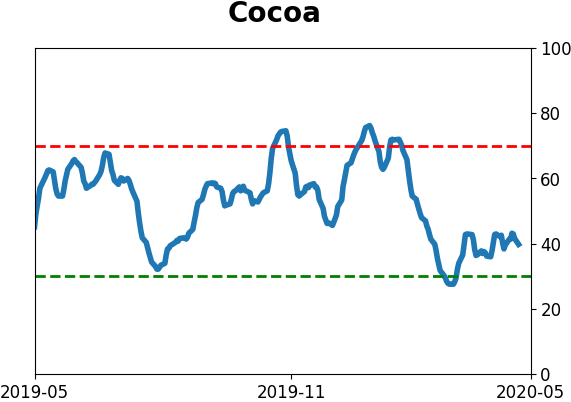
Optimism Index Thumbnails
|
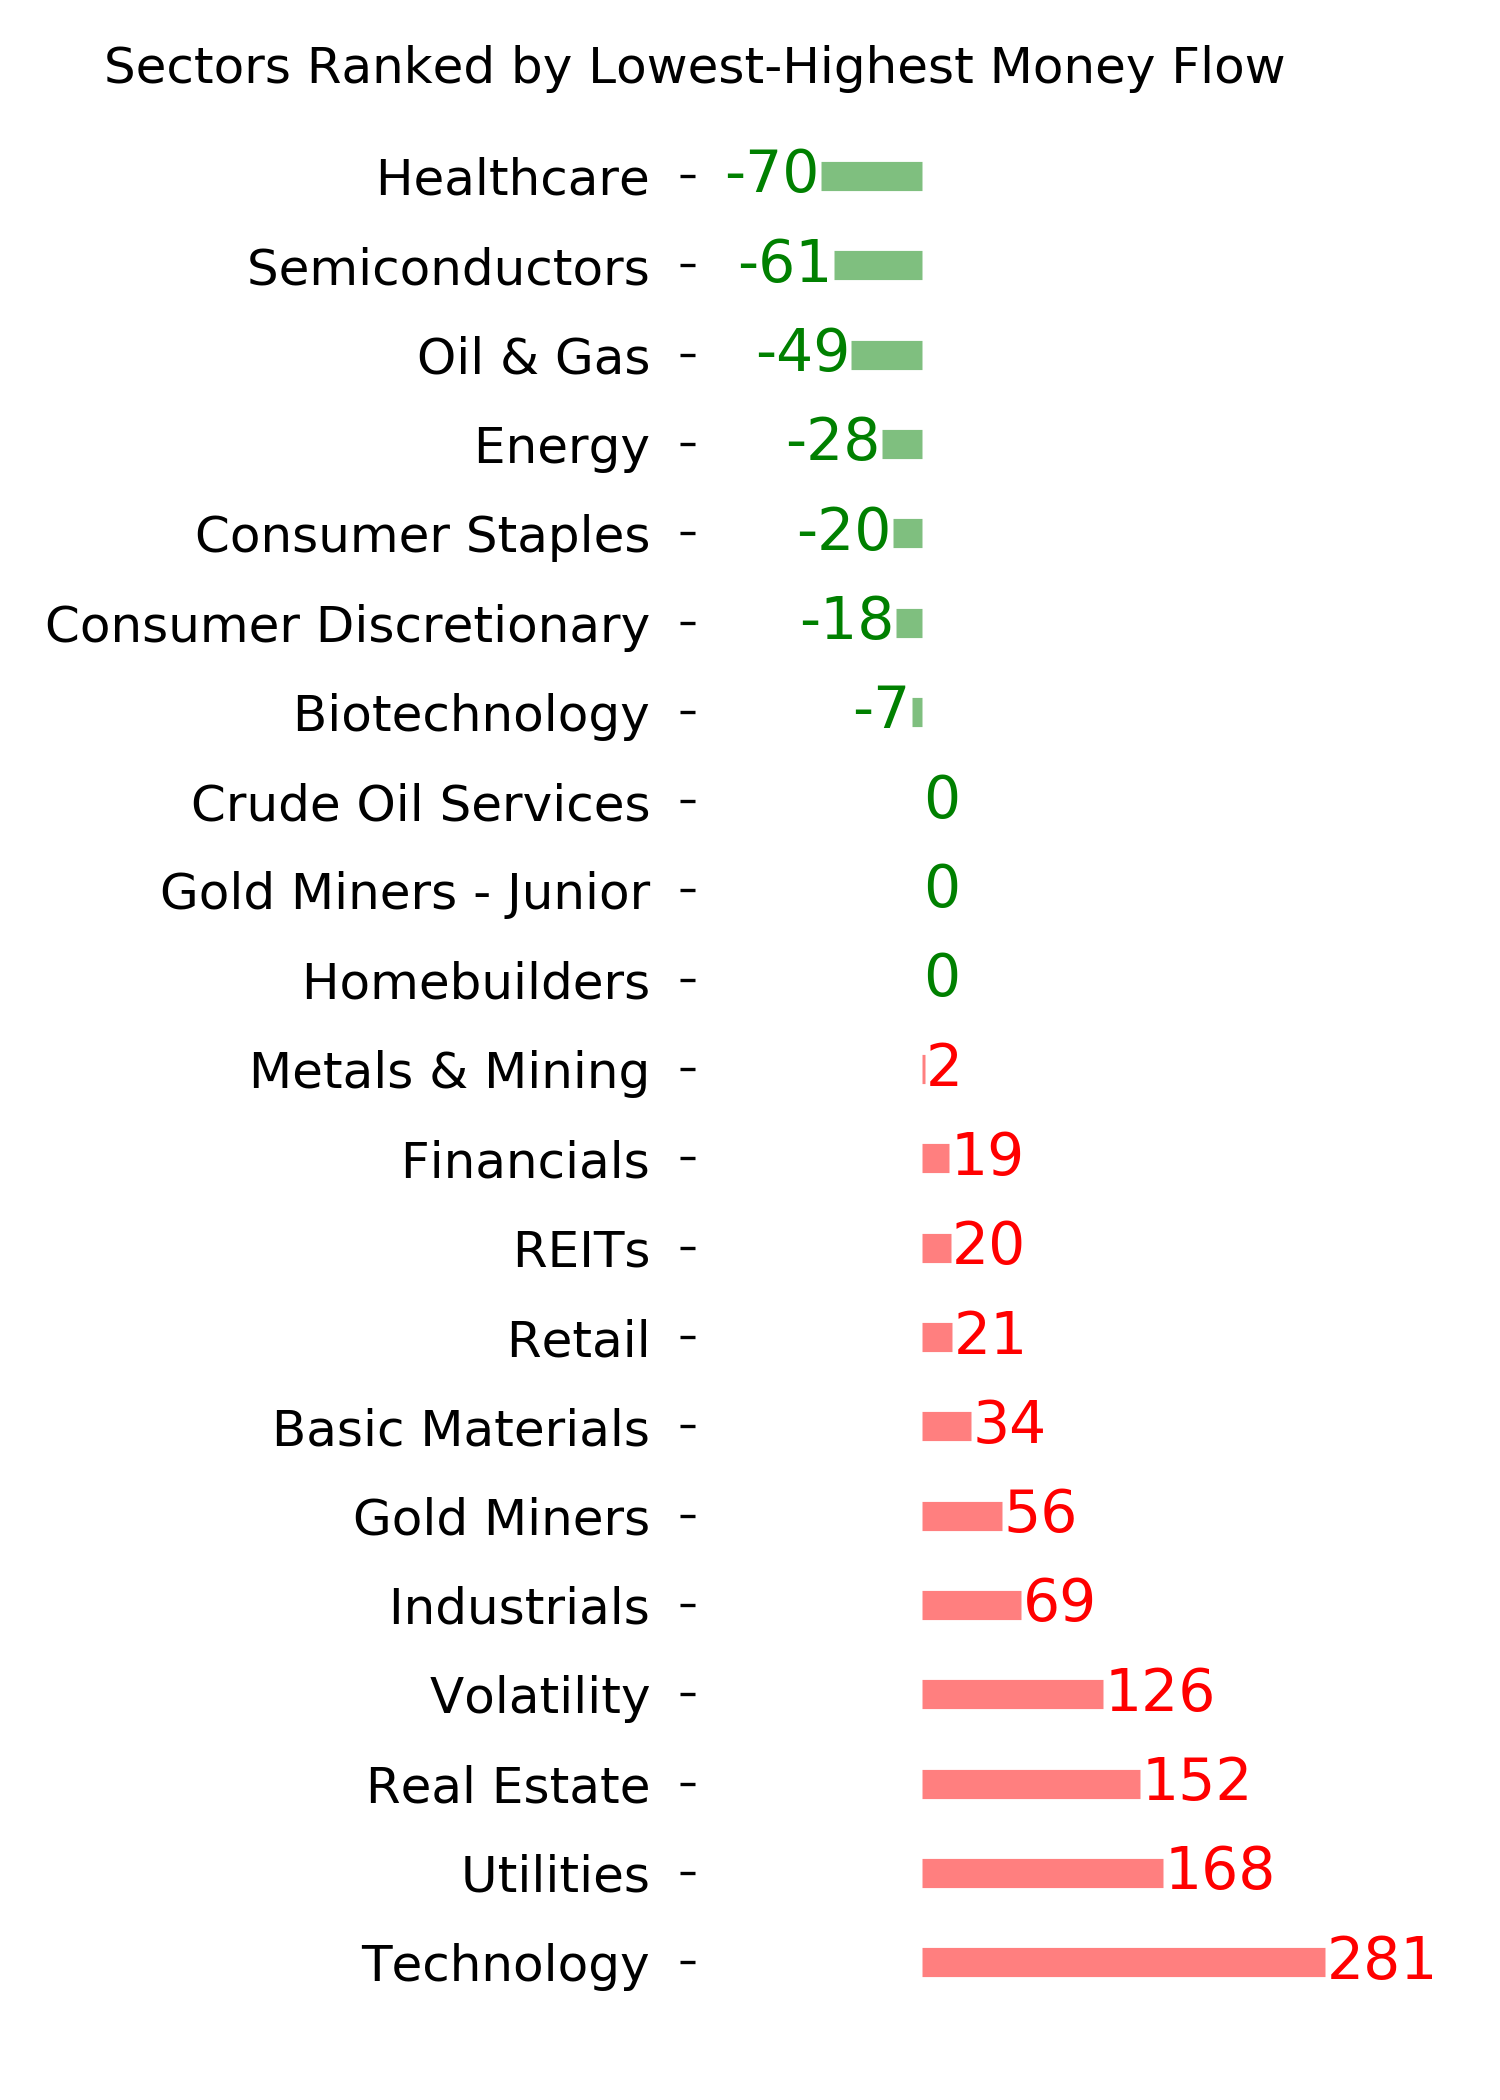
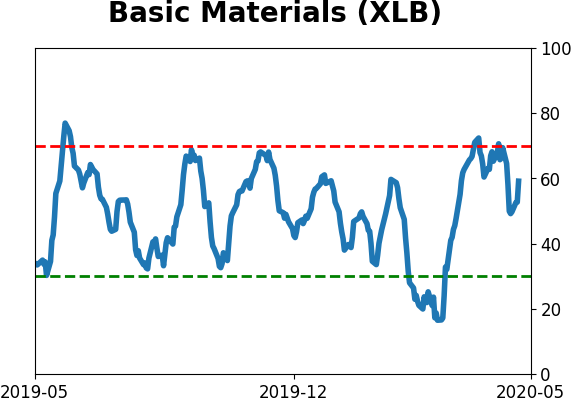
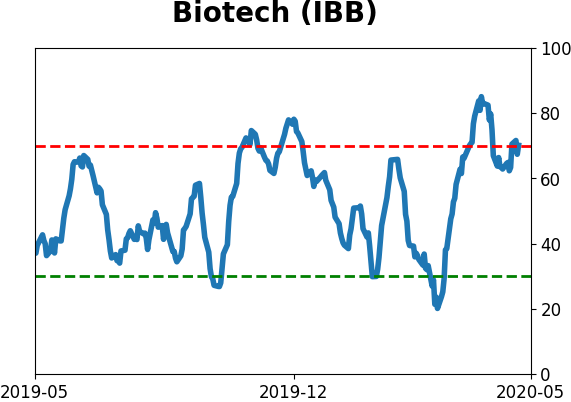
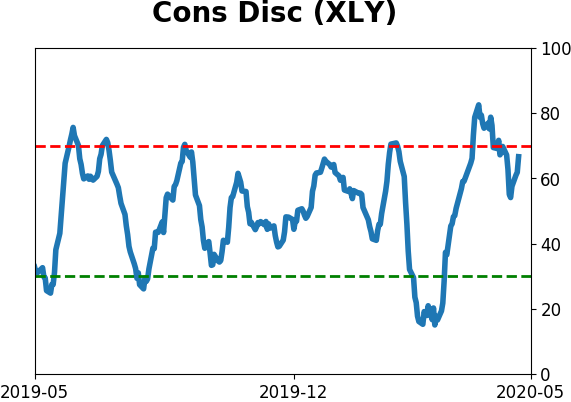
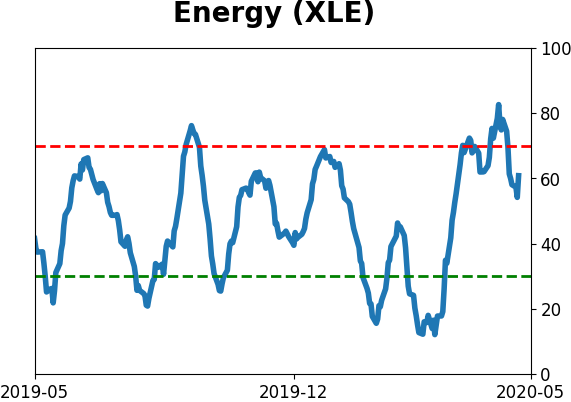
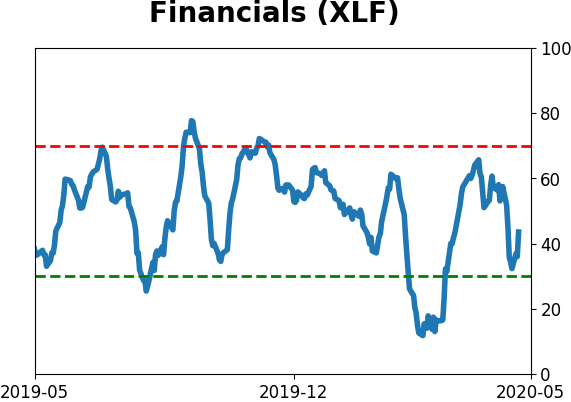
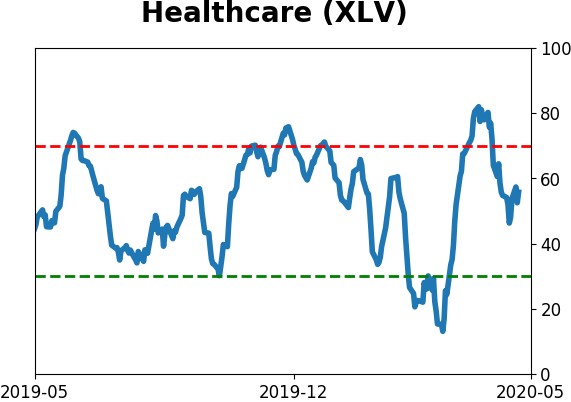
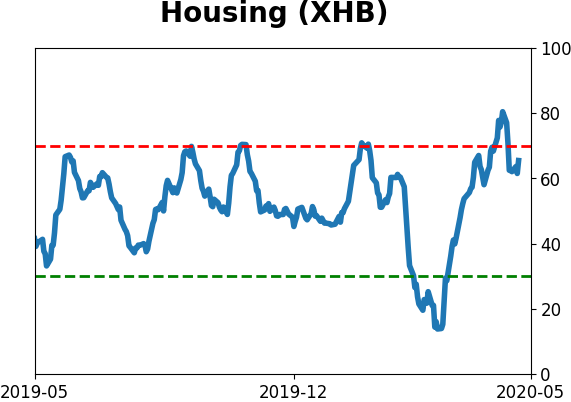
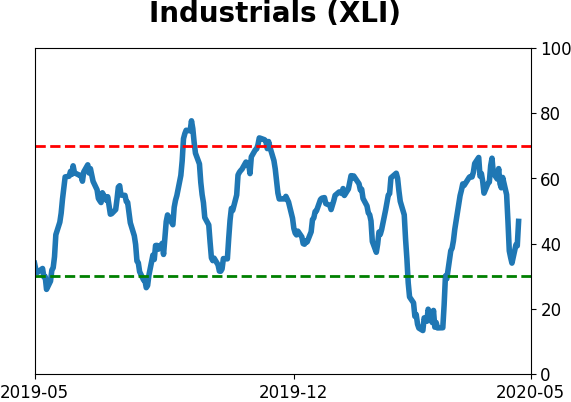
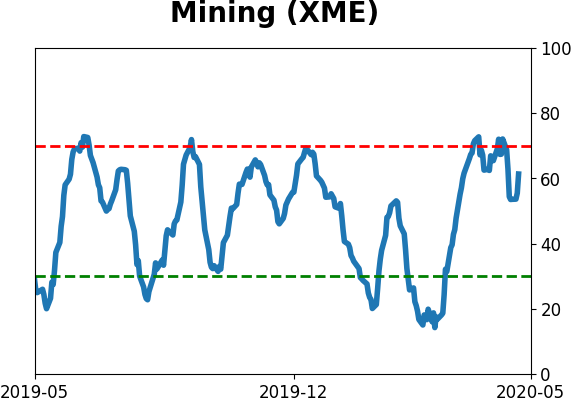
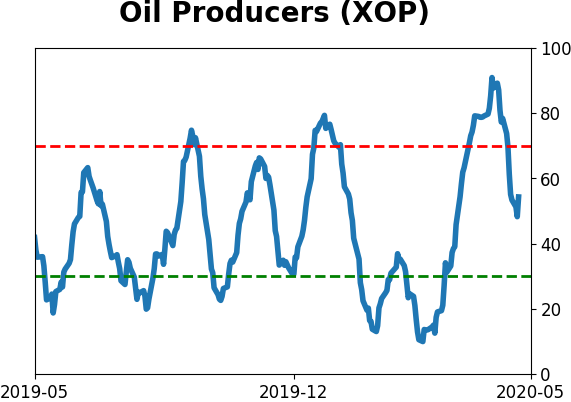
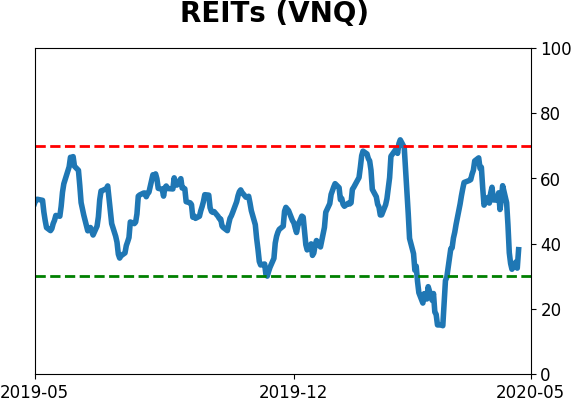
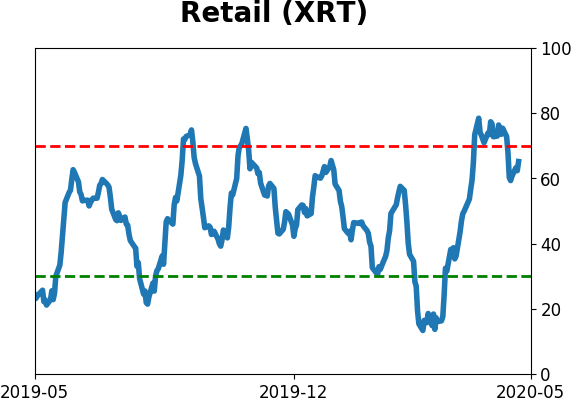
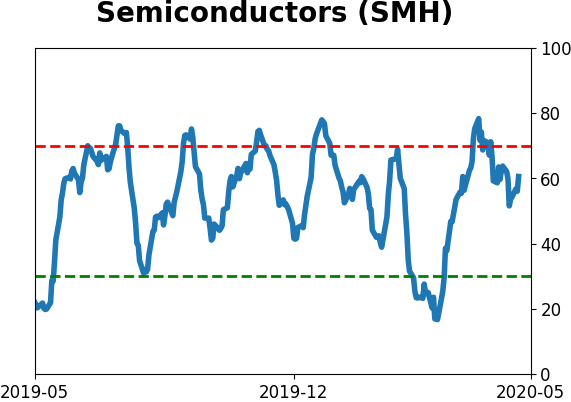
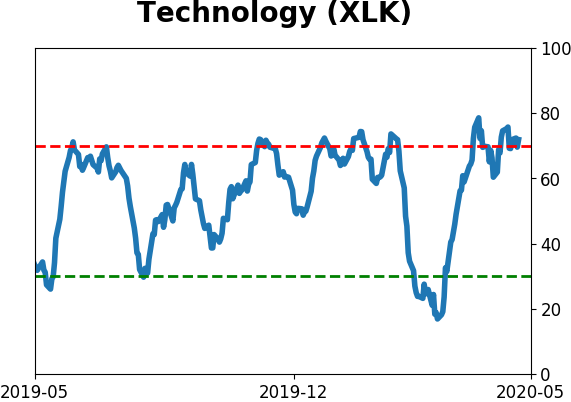
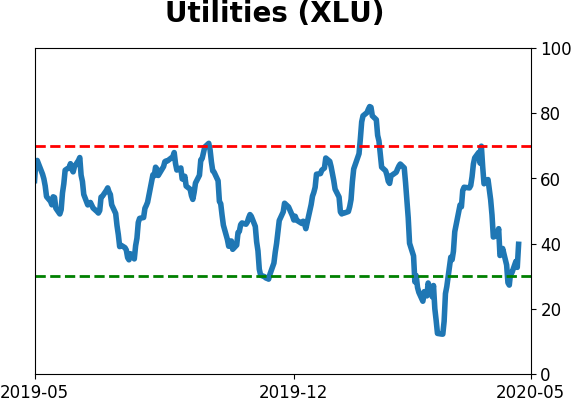
Sector ETF's - 10-Day Moving Average
|
|
|
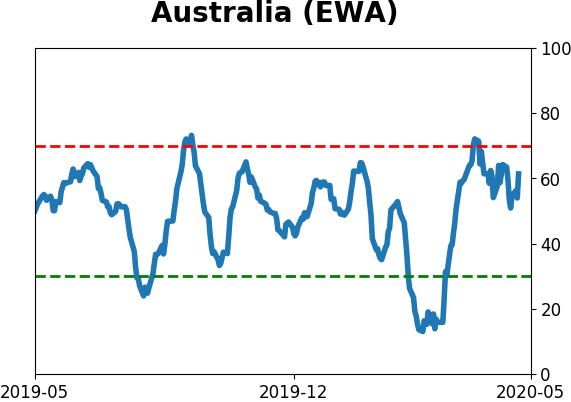
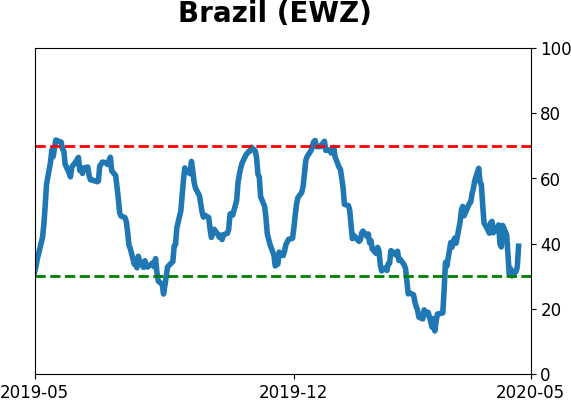
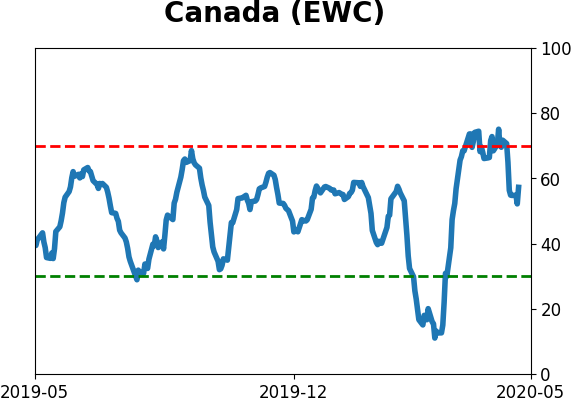
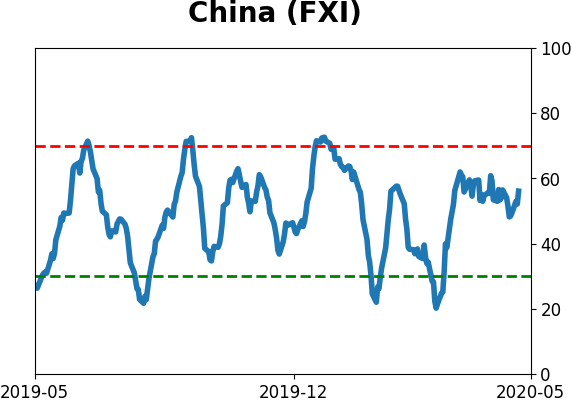
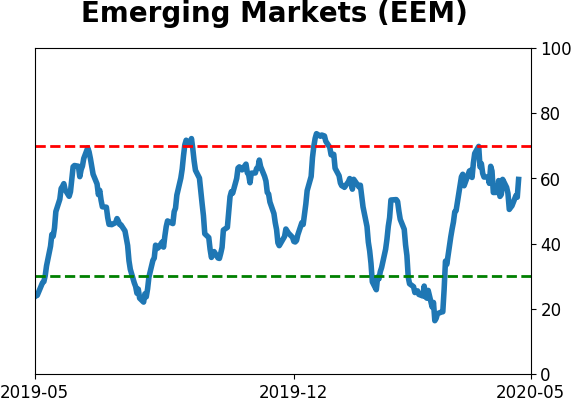
Country ETF's - 10-Day Moving Average
|
|
|
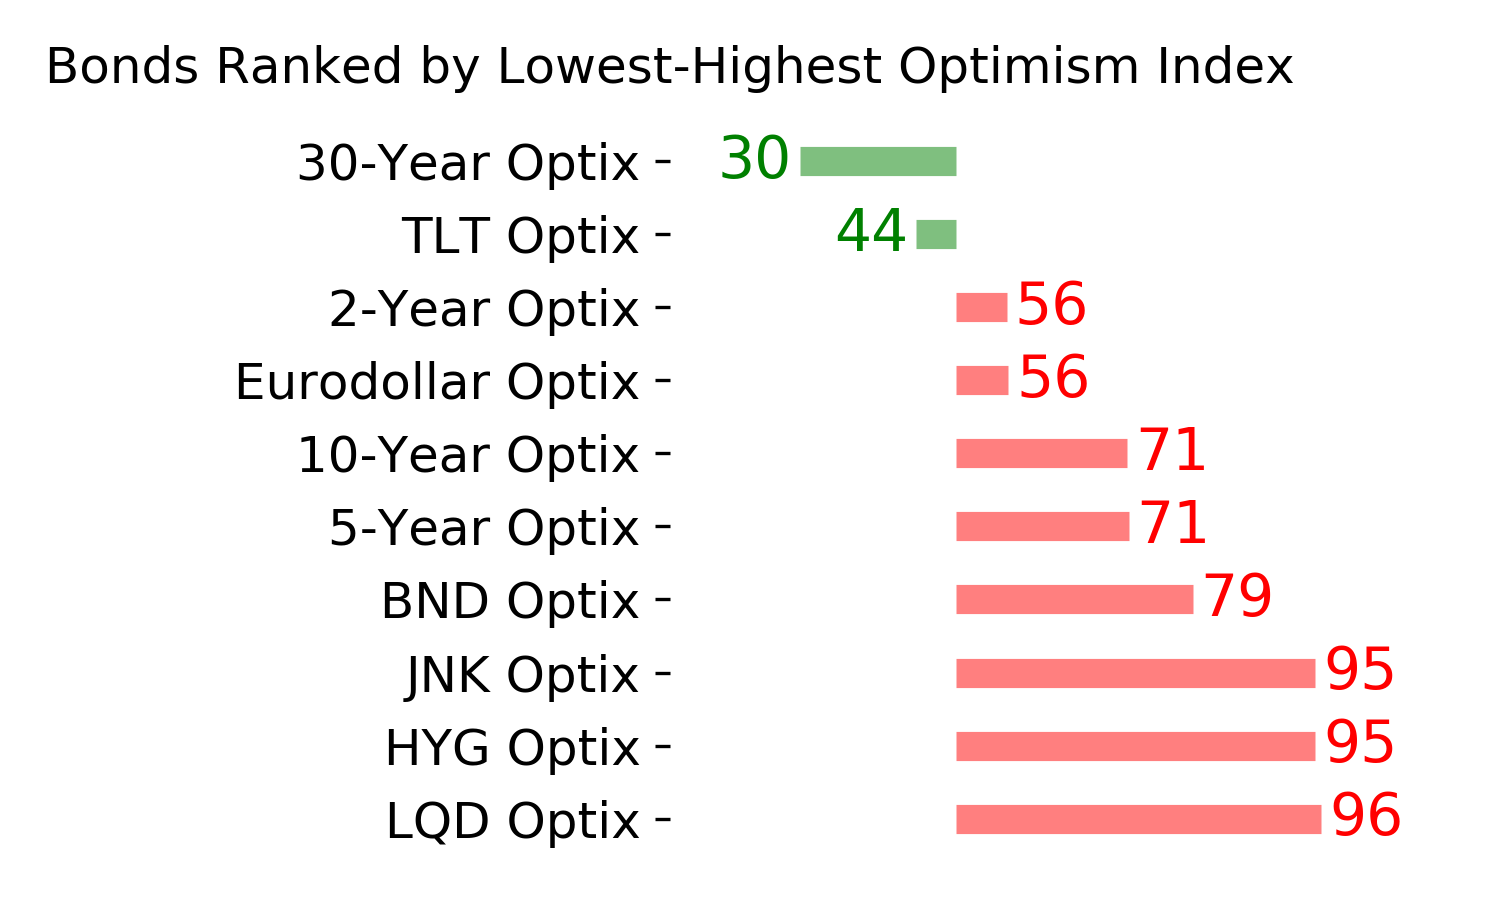
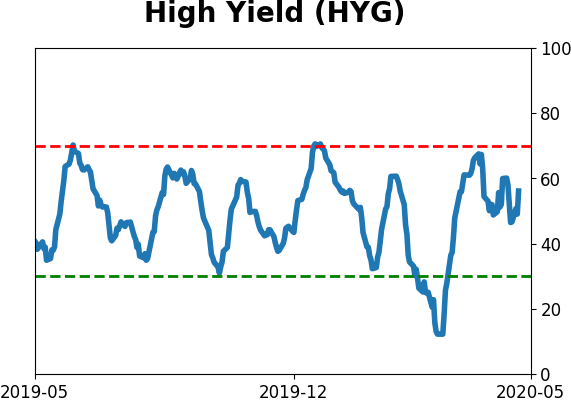
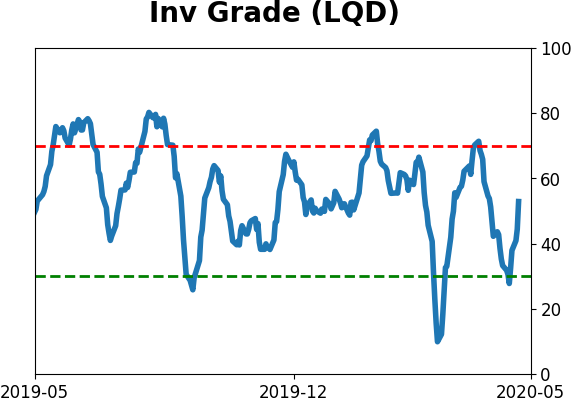
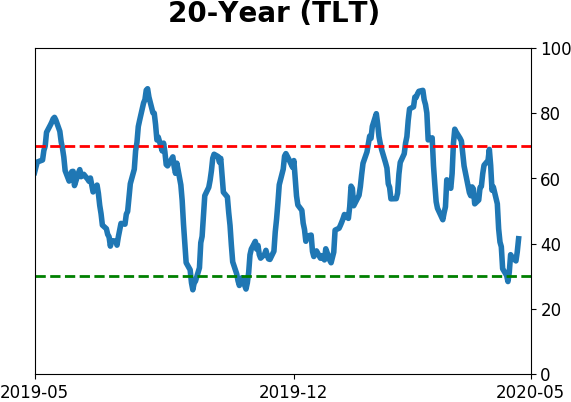
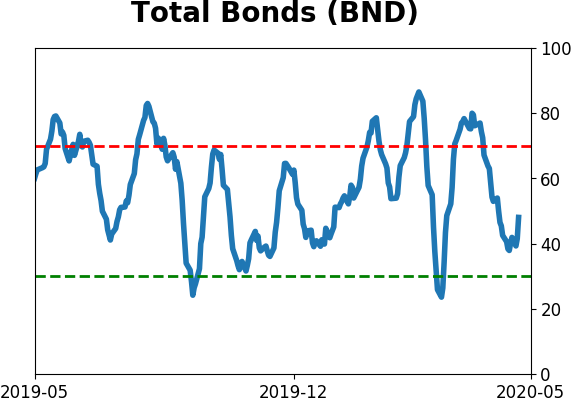
Bond ETF's - 10-Day Moving Average
|
|
|
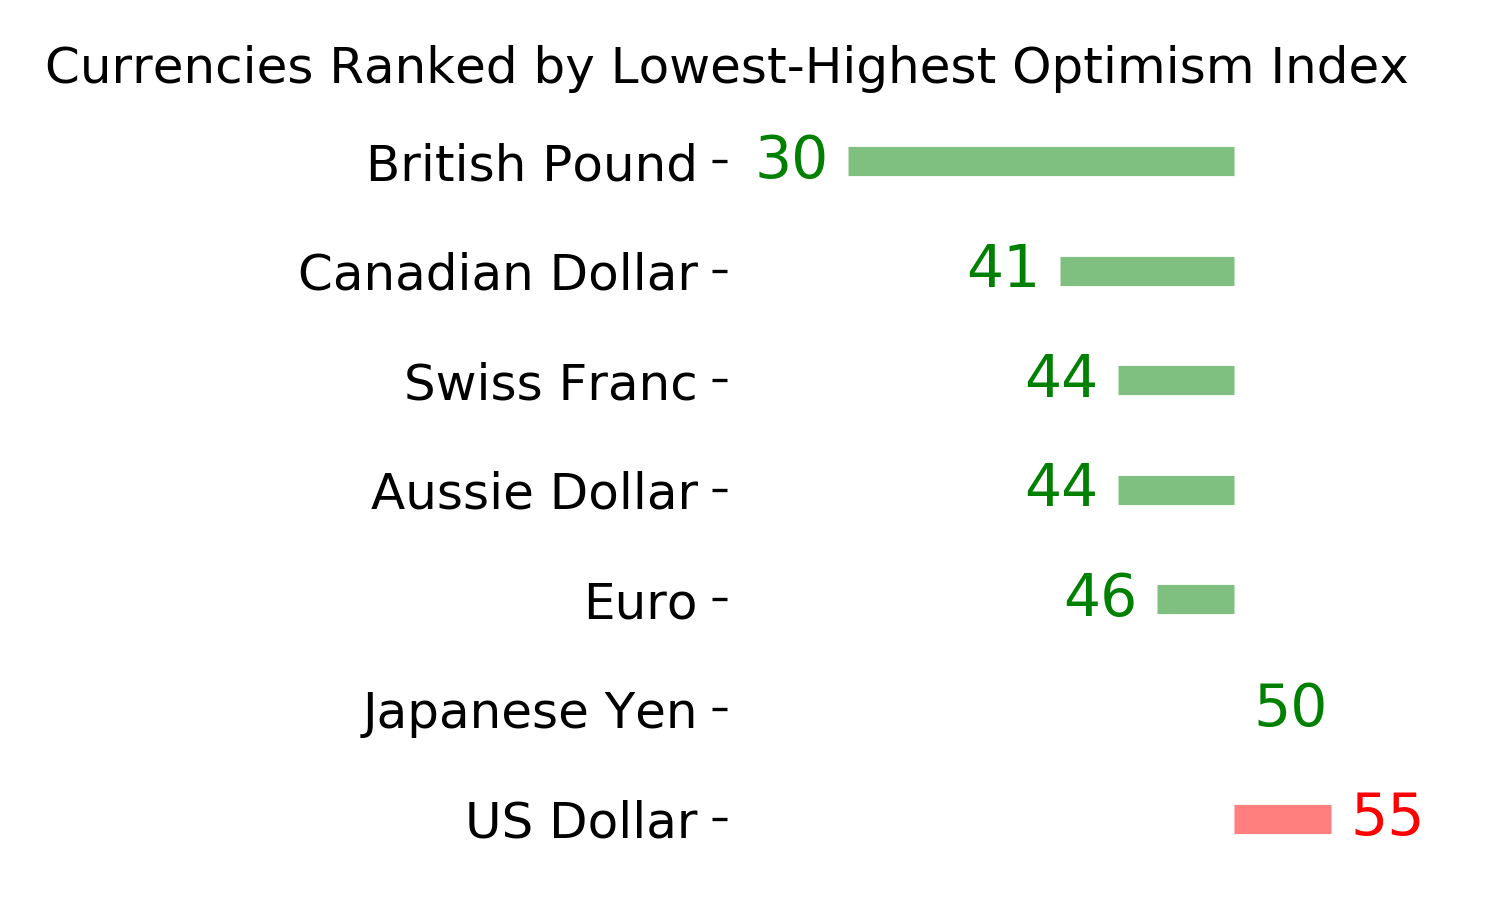
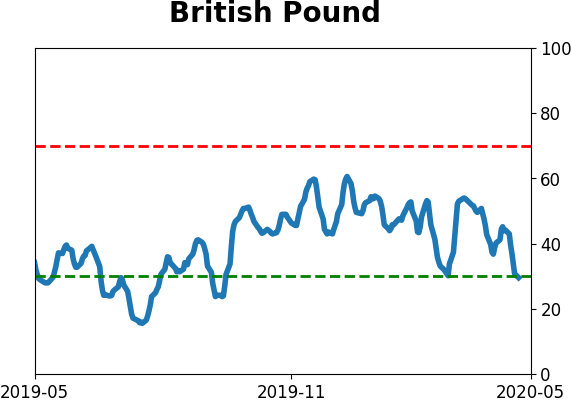
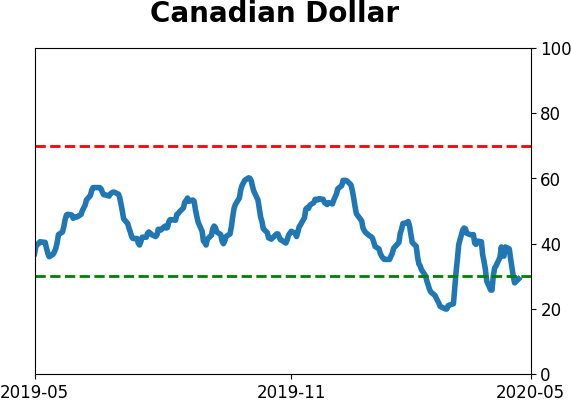
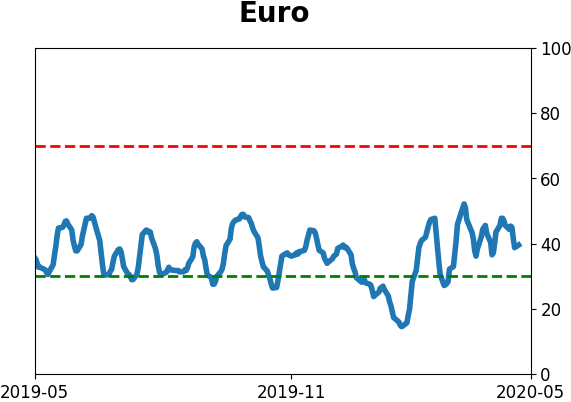
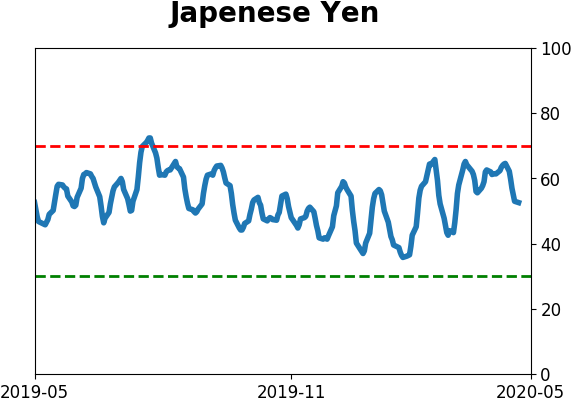
Currency ETF's - 5-Day Moving Average
|
|
|
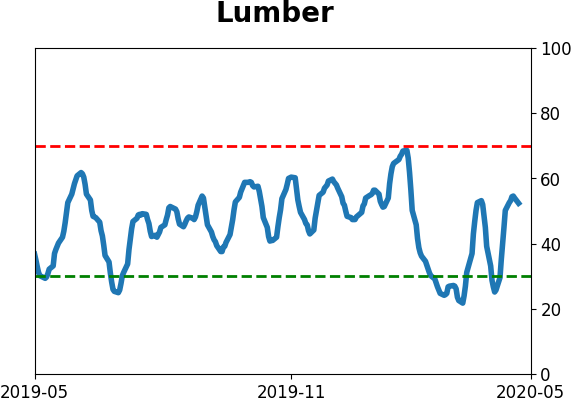
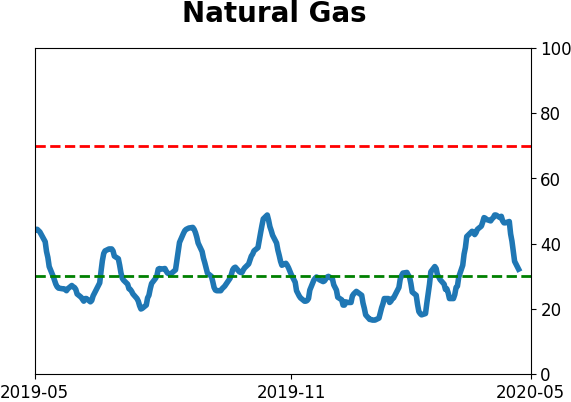
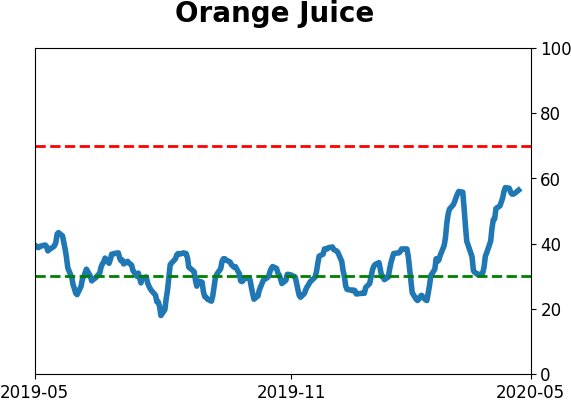
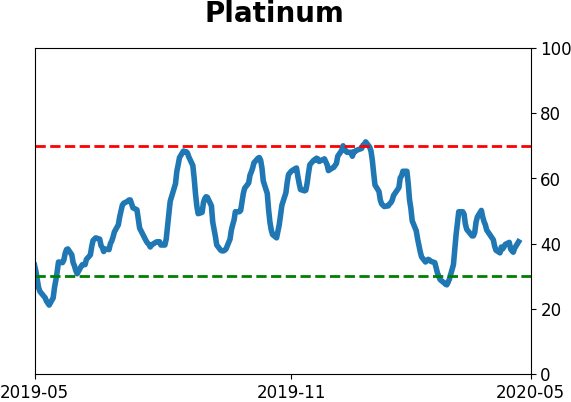
Commodity ETF's - 5-Day Moving Average
|
|