Headlines
|
|
Over 6 Months Without Even a 5% Haircut:
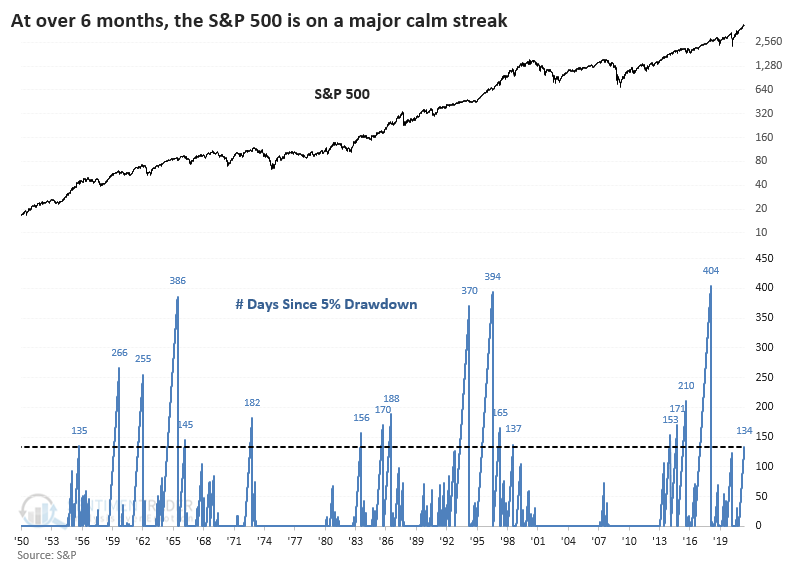
The S&P 500 has gone 134 trading days without even a 5% pullback from a high. That's among the longest streaks since 1928, and preceded choppy medium-term returns before momentum tended to resume.
Bottom Line:
See the Outlook & Allocations page for more details on these summaries STOCKS: Weak sell
The speculative frenzy in February is getting wrung out. Internal dynamics have mostly held up, with some recent exceptions. Most of our studies show a poor risk/reward over the short- to medium-term, with a more positive skew longer-term. BONDS: Hold
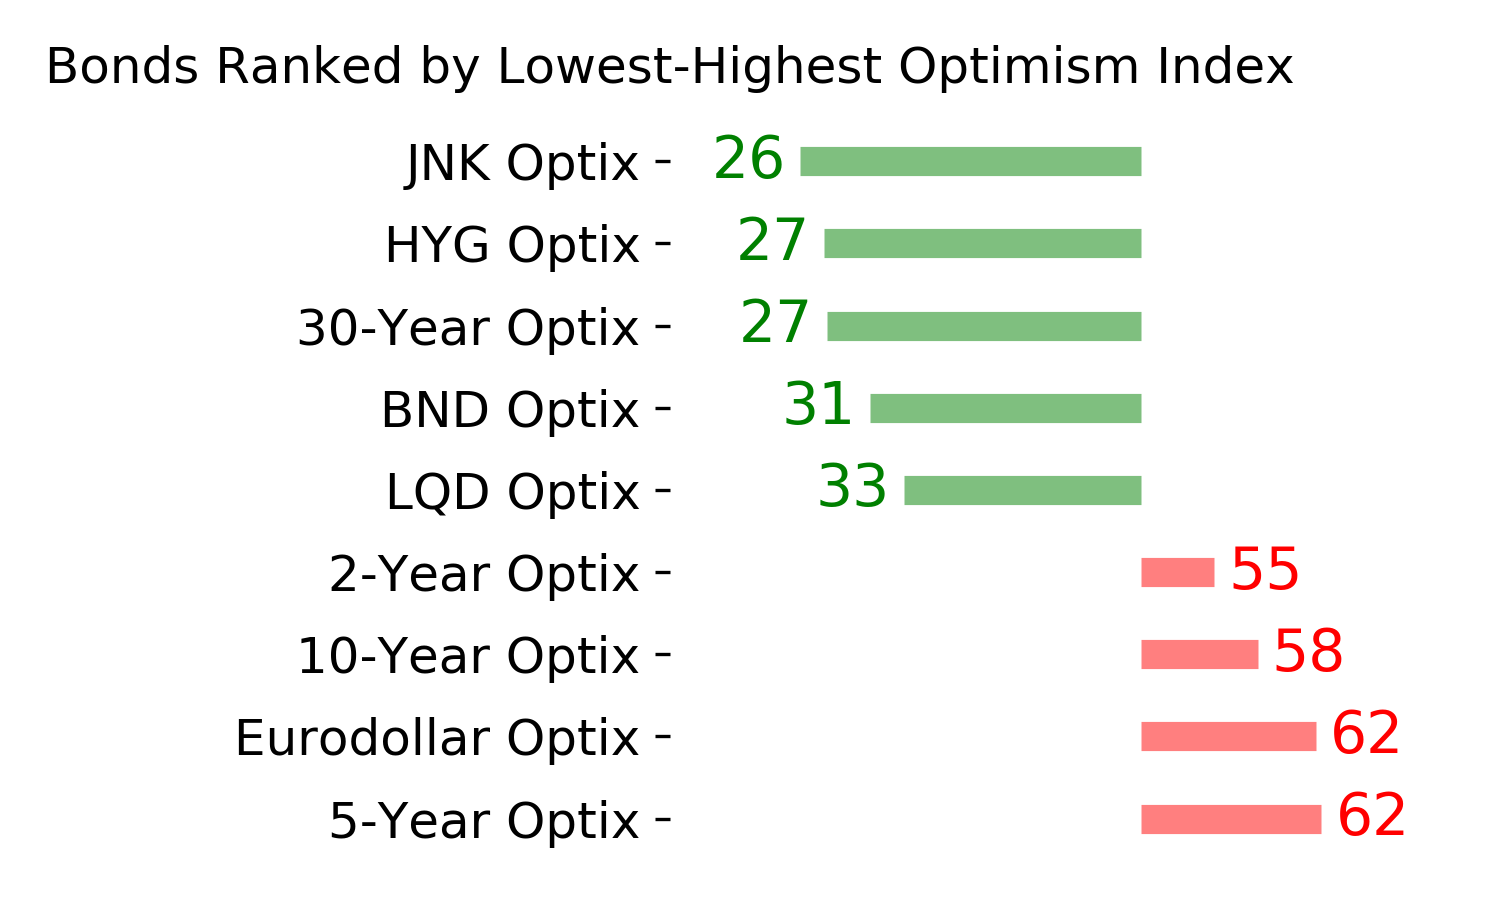
Various parts of the market got hit in March, with the lowest Bond Optimism Index we usually see during healthy environments. After a shaky couple of weeks, the broad bond market has modestly recovered. Not a big edge here either way. GOLD: Weak buy
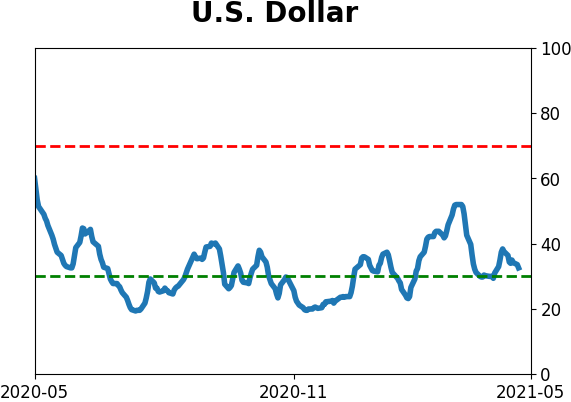
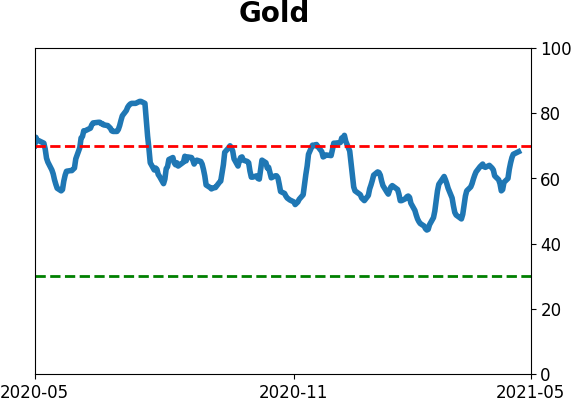
The dollar keeps failing on bulls' hopes that it's finally going to turn a corner, so that's been good for gold and miners. Studies from recent months remain in effect, with a modest positive bias.
|
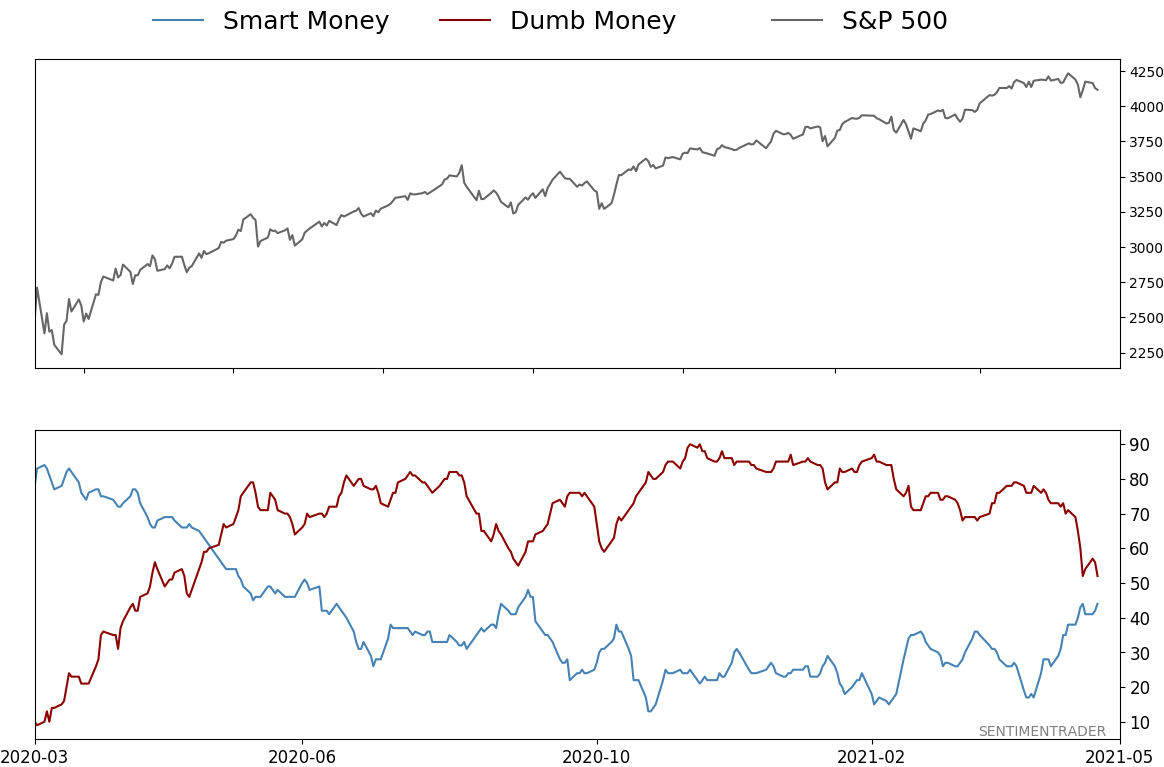
Smart / Dumb Money Confidence
|
Smart Money Confidence: 44%
Dumb Money Confidence: 52%
|
|
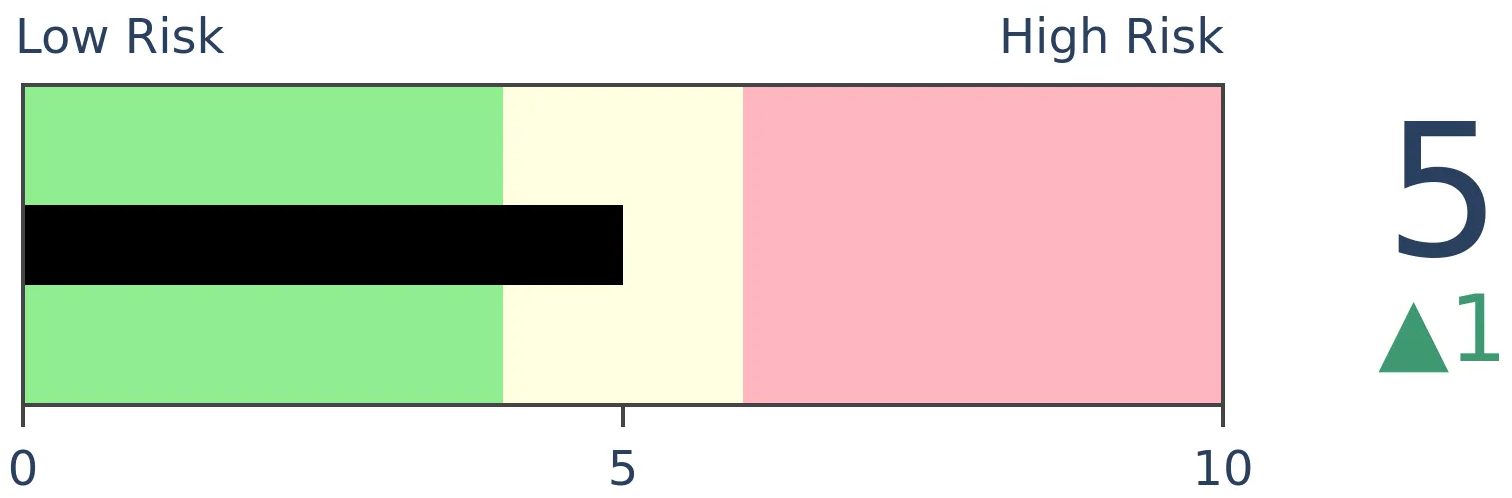
Risk Levels
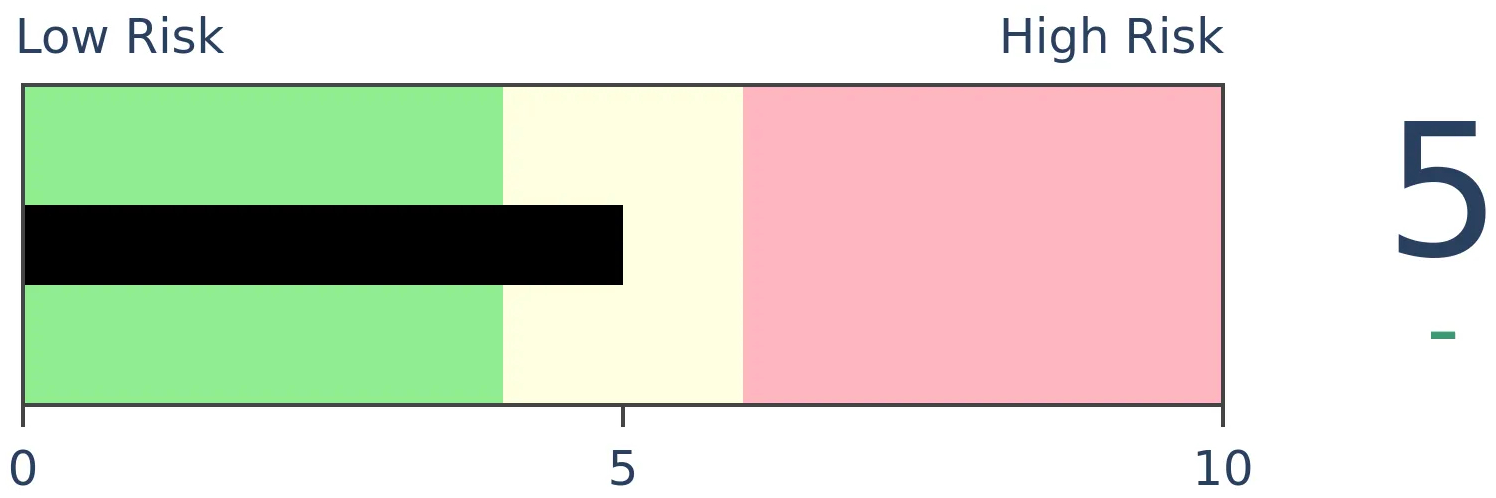
Stocks Short-Term
|
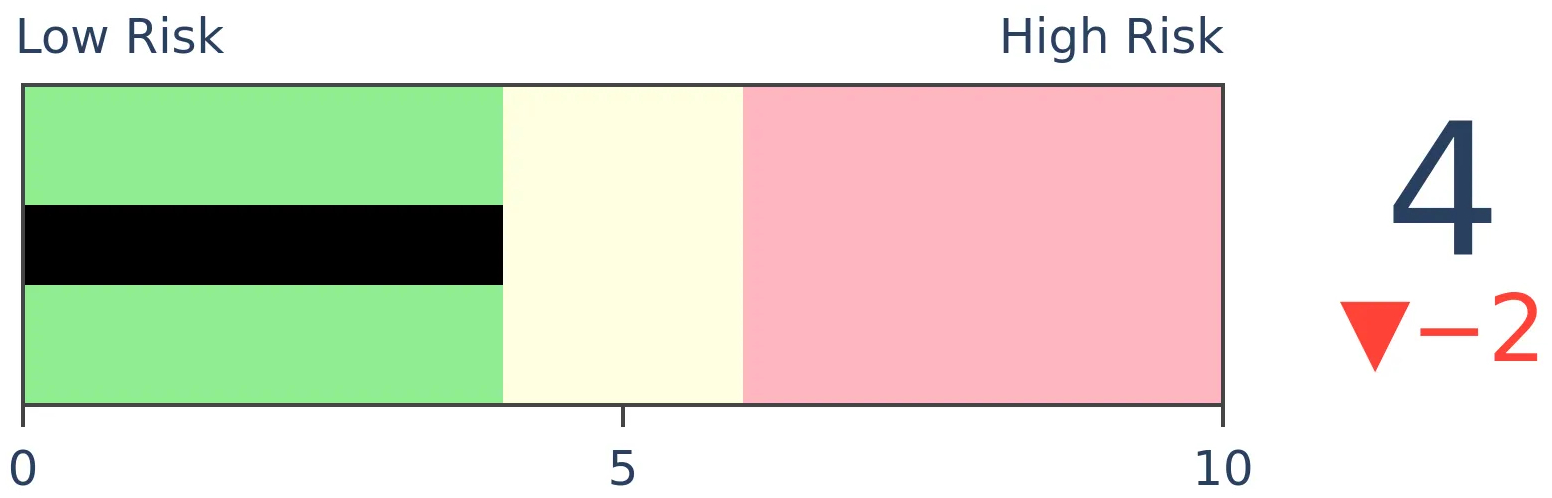
Stocks Medium-Term
|
|
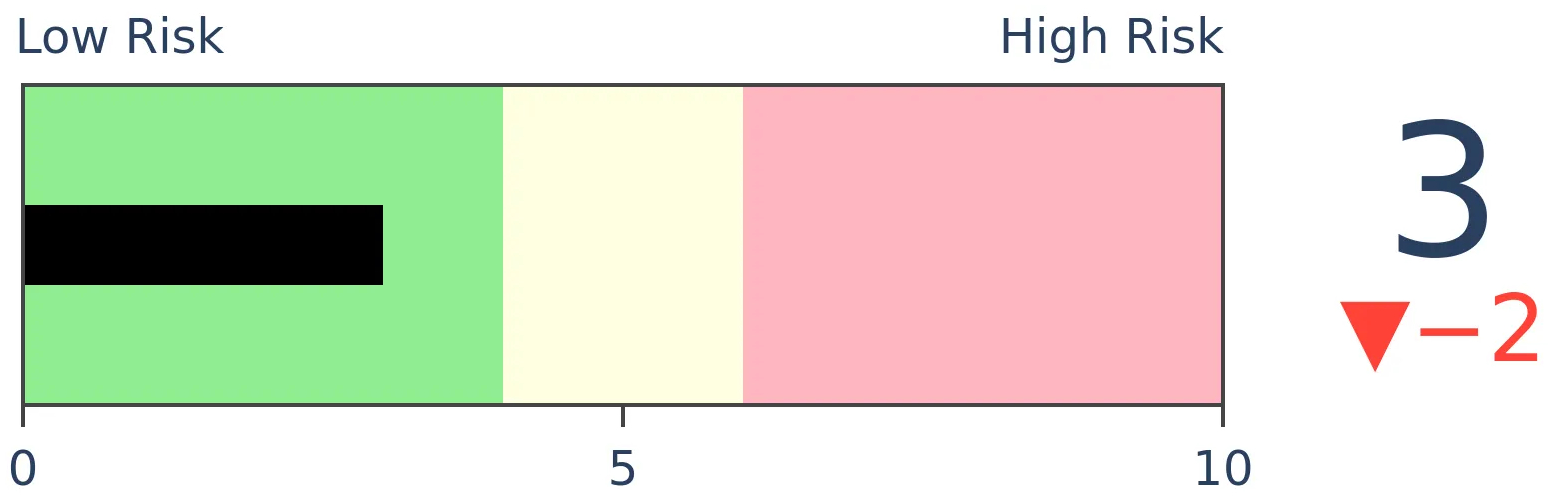
Bonds
|
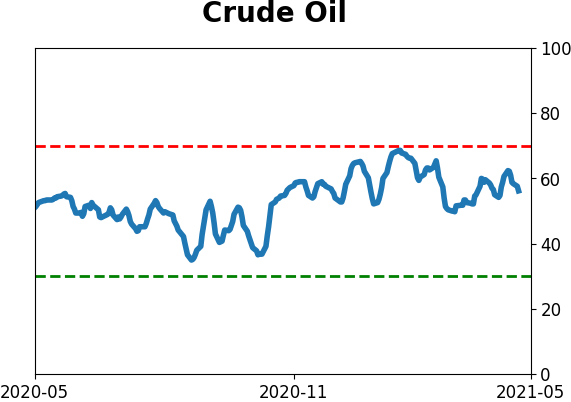
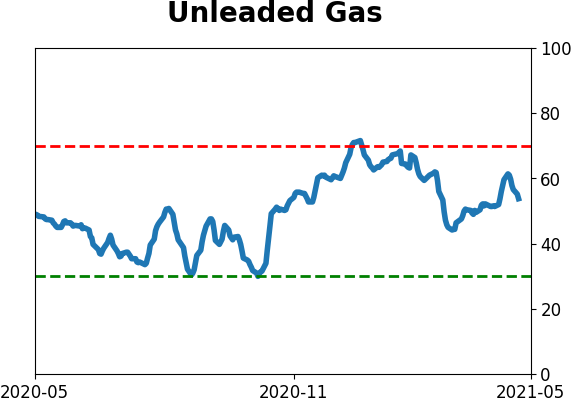
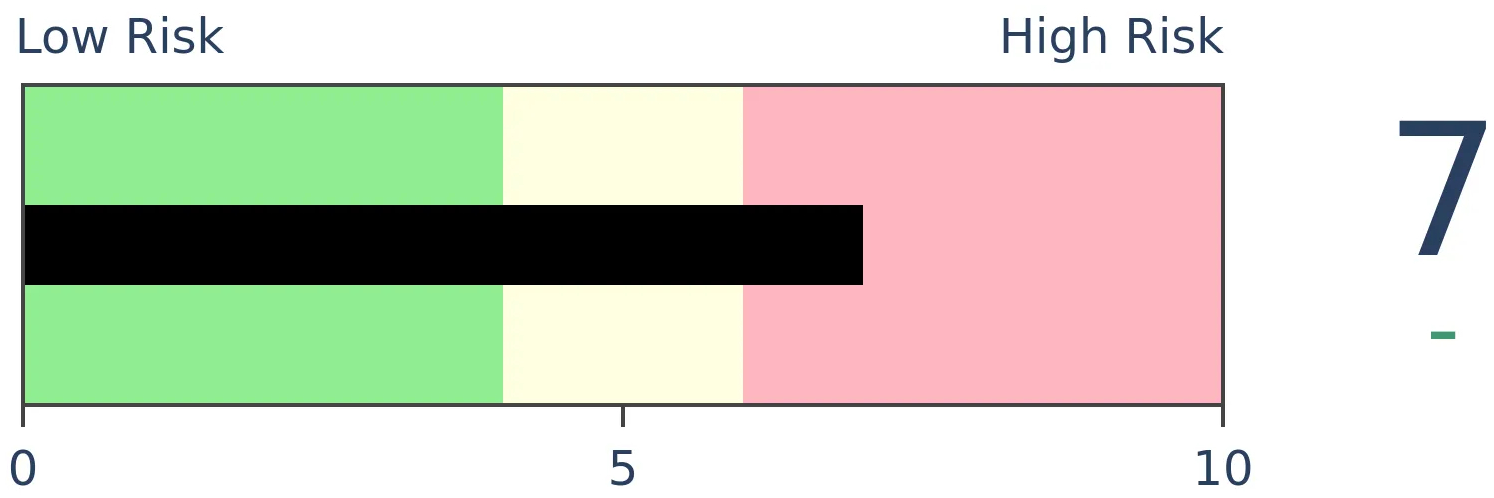
Crude Oil
|
|
Gold
|
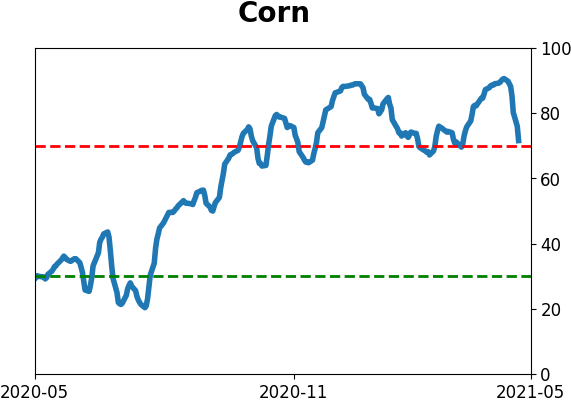
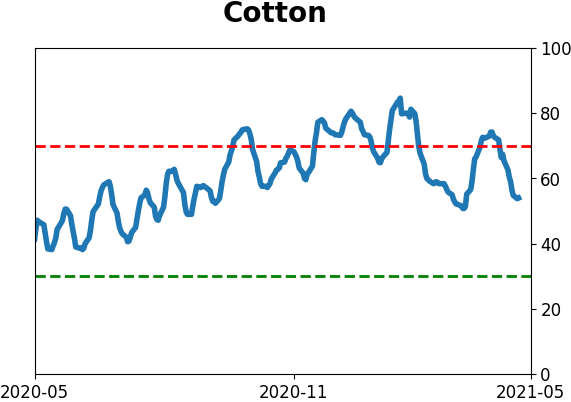
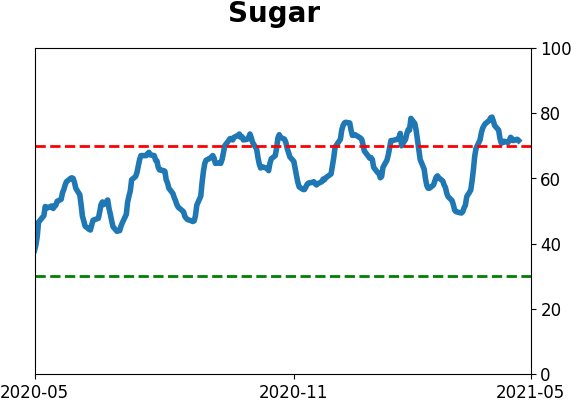
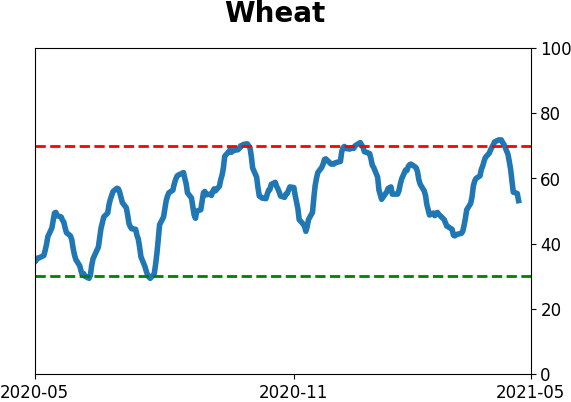
Agriculture

|
|
Research
BOTTOM LINE
The S&P 500 has gone 134 trading days without even a 5% pullback from a high. That's among the longest streaks since 1928, and preceded choppy medium-term returns before momentum tended to resume.
FORECAST / TIMEFRAME
None
|
The bears tried. They failed but seem to be making another run today.
After letting some air out of Tech stocks and some former highfliers, bulls have made a stand and kept the broader market steady. Once again, sellers failed to push the S&P 500 down even 5% from its peak. It got close last week but held above that threshold.
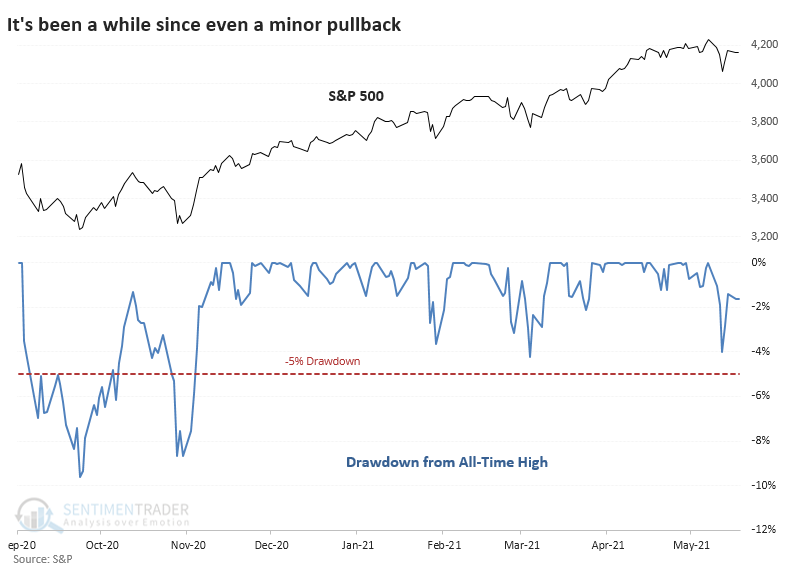
The index has now gone 134 trading days without a 5% pullback. That's the 18th-longest streak since 1928, and it would take only a few more days to push it into 15th place.
MOMENTUM CONTINUED...WITH A PAUSE
Once it got this extended, the S&P's returns over the next month were poor. Even up to 3 months later, its risk outweighed its reward. But as we've seen with so many momentum studies, when buyers have been so persistent, they didn't give up easily, and there were few large declines to speak of.
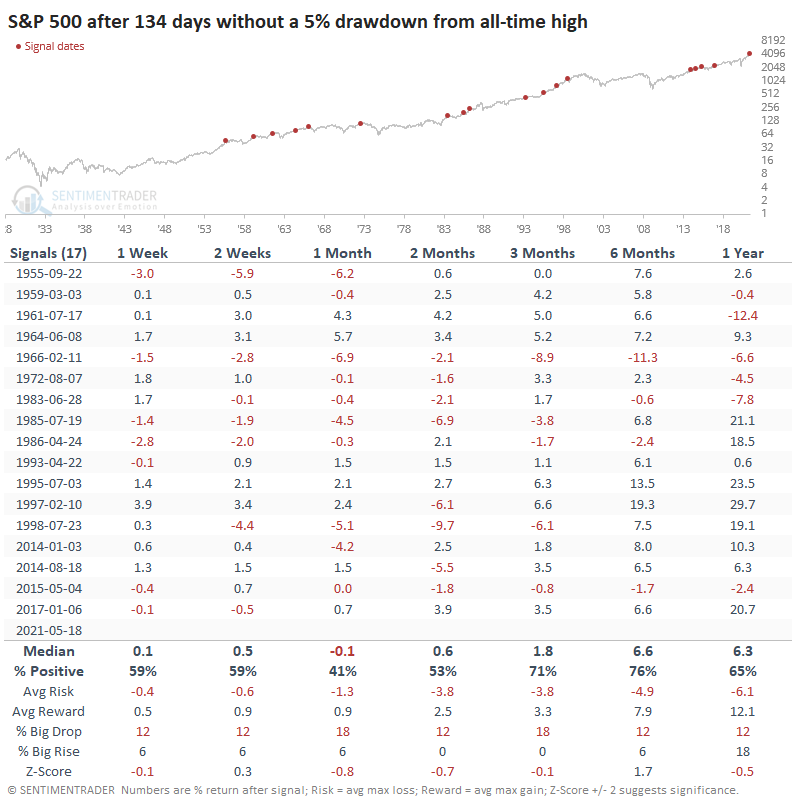
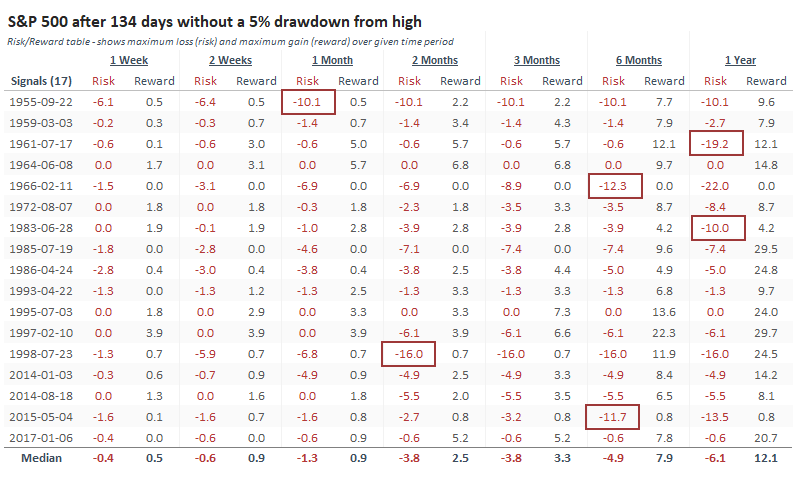
The Risk/Reward table highlights those signals when the index fell more than 10% from the signal date. Only 2 out of the 17 signals suffered that fate within the first 3 months. Within the next year, 6 of the 17 suffered at least a 10% drawdown, though only 1 extended to 20%.
An interesting wrinkle with our current situation is that Technology stocks have already fallen by more than 5% from their peak and remain so.
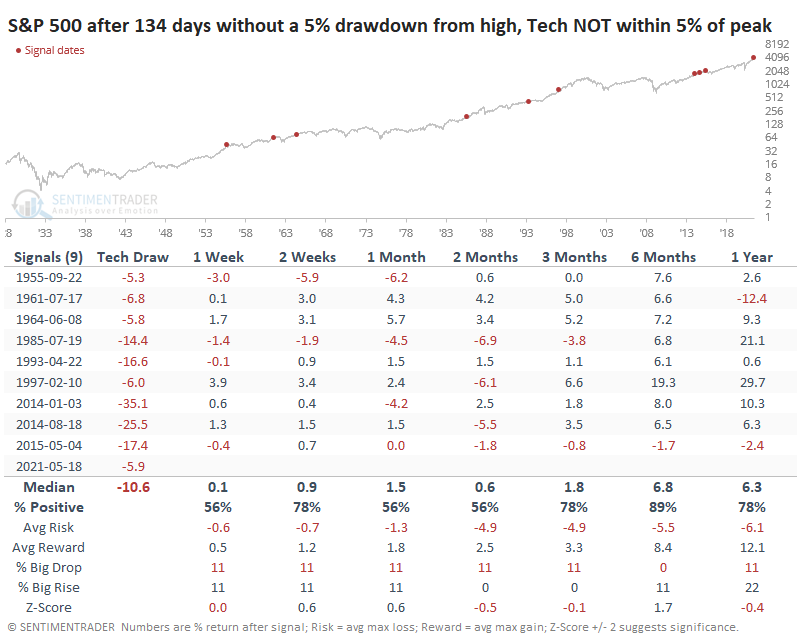
When Tech was leading the S&P to the downside, it didn't make things worse - if anything, returns were a bit better. It still wasn't a great sign over the medium-term, but over the next 6 months, there was only a single small loss.
We've seen time and again in recent weeks (and months) that momentum like we've witnessed so far in 2021 has a habit of preceding choppy medium-term conditions. Such intense buying interest typically doesn't just dry up for long, however, and 6-12 month returns tend to be above average.
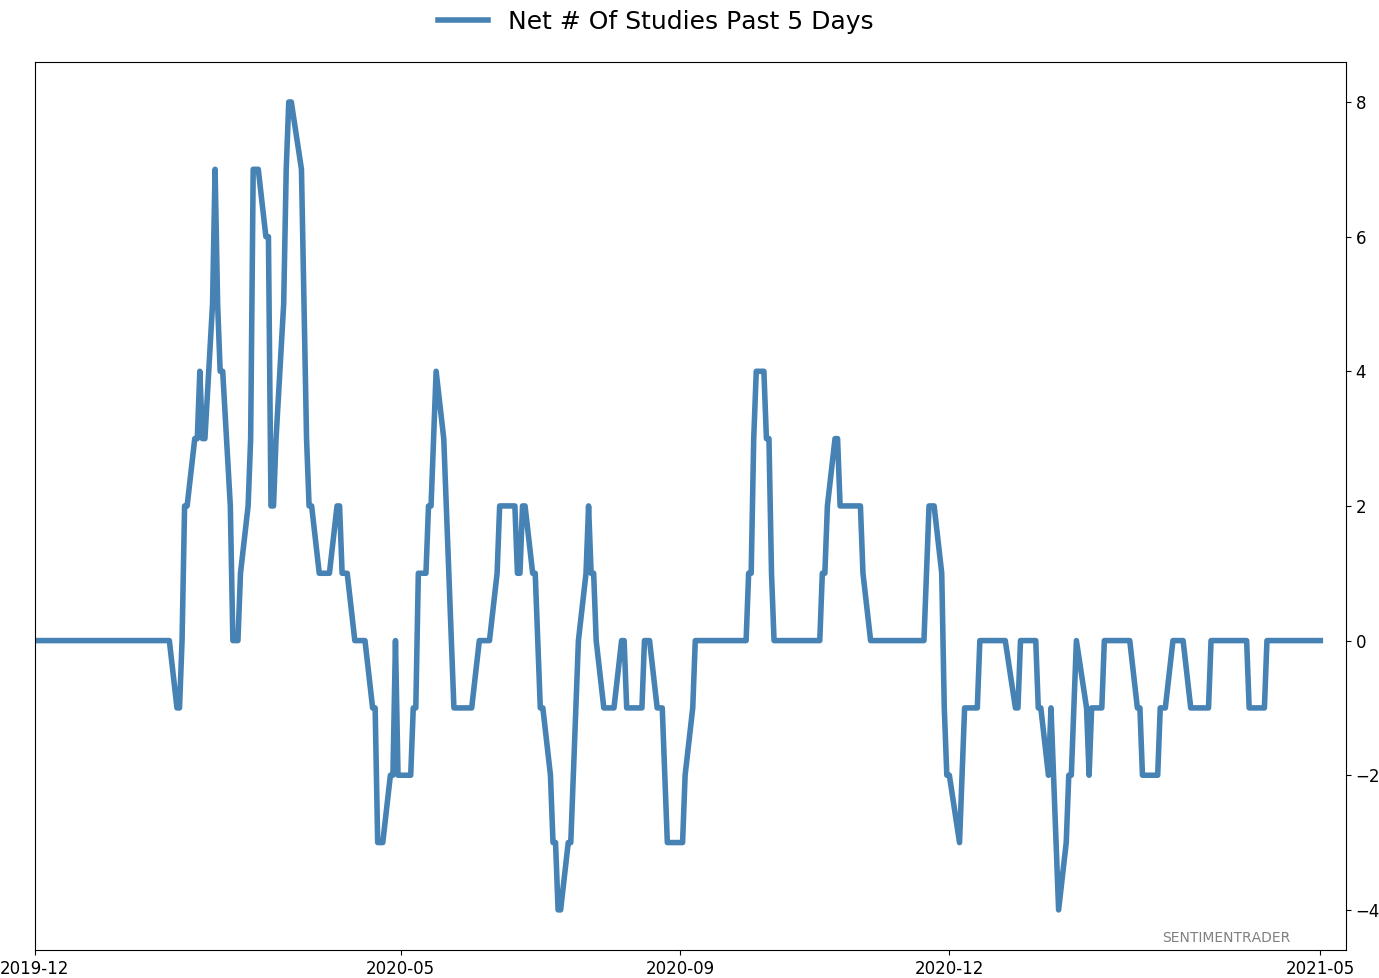
Active Studies
| Time Frame | Bullish | Bearish | | Short-Term | 0 | 0 | | Medium-Term | 1 | 11 | | Long-Term | 11 | 4 |
|
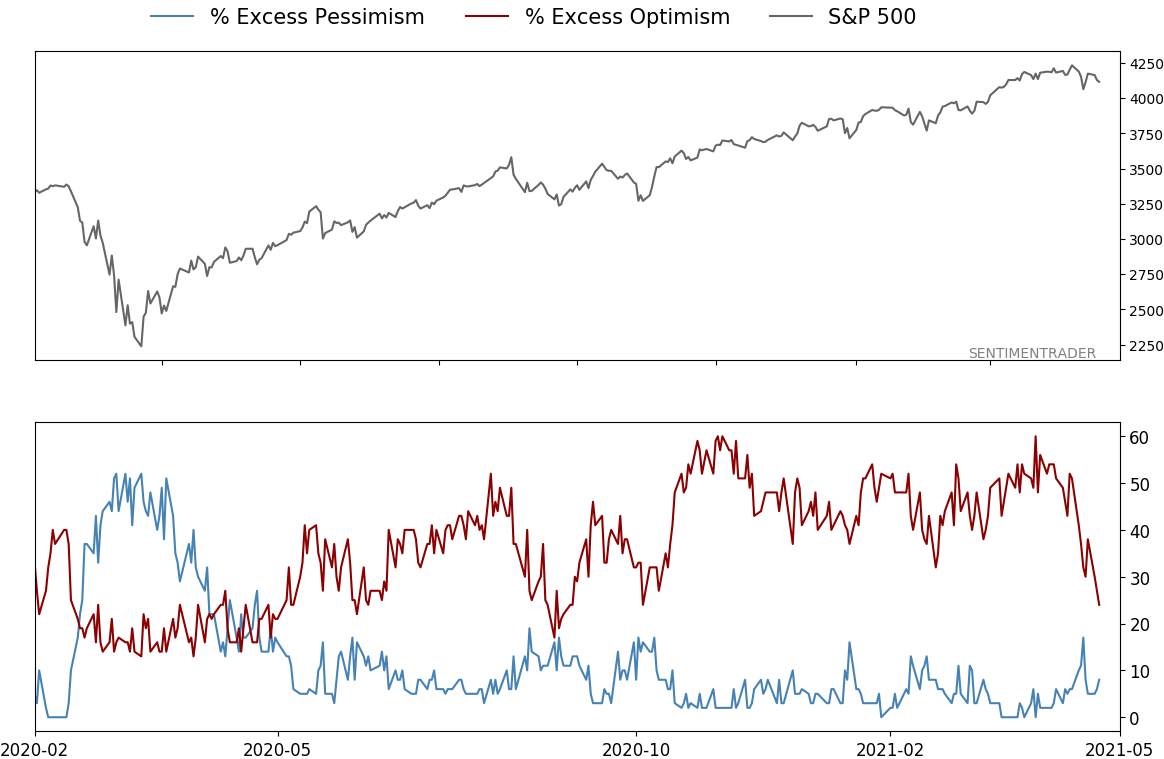
Indicators at Extremes
Portfolio
| Position | Description | Weight % | Added / Reduced | Date | | Stocks | RSP | 4.1 | Added 4.1% | 2021-05-19 | | Bonds | 23.9% BND, 6.9% SCHP | 30.8 | Reduced 7.1% | 2021-05-19 | | Commodities | GCC | 2.5 | Reduced 2.1%
| 2020-09-04 | | Precious Metals | GDX | 5.6 | Reduced 4.2% | 2021-05-19 | | Special Situations | 4.3% XLE, 2.2% PSCE | 7.2 | Reduced 5.6% | 2021-04-22 | | Cash | | 49.8 | | |
|
Updates (Changes made today are underlined)
Much of our momentum and trend work has remained positive for several months, with some scattered exceptions. Almost all sentiment-related work has shown a poor risk/reward ratio for stocks, especially as speculation drove to record highs in exuberance in February. Much of that has worn off, and most of our models are back toward neutral levels. There isn't much to be excited about here. The same goes for bonds and even gold. It has been performing well lately and is back above long-term trend lines. The issue is that it has a poor record of holding onto gains when attempting a long-term trend change like this, so we'll take a wait-and-see approach. RETURN YTD: 9.0% 2020: 8.1%, 2019: 12.6%, 2018: 0.6%, 2017: 3.8%, 2016: 17.1%, 2015: 9.2%, 2014: 14.5%, 2013: 2.2%, 2012: 10.8%, 2011: 16.5%, 2010: 15.3%, 2009: 23.9%, 2008: 16.2%, 2007: 7.8%
|
|
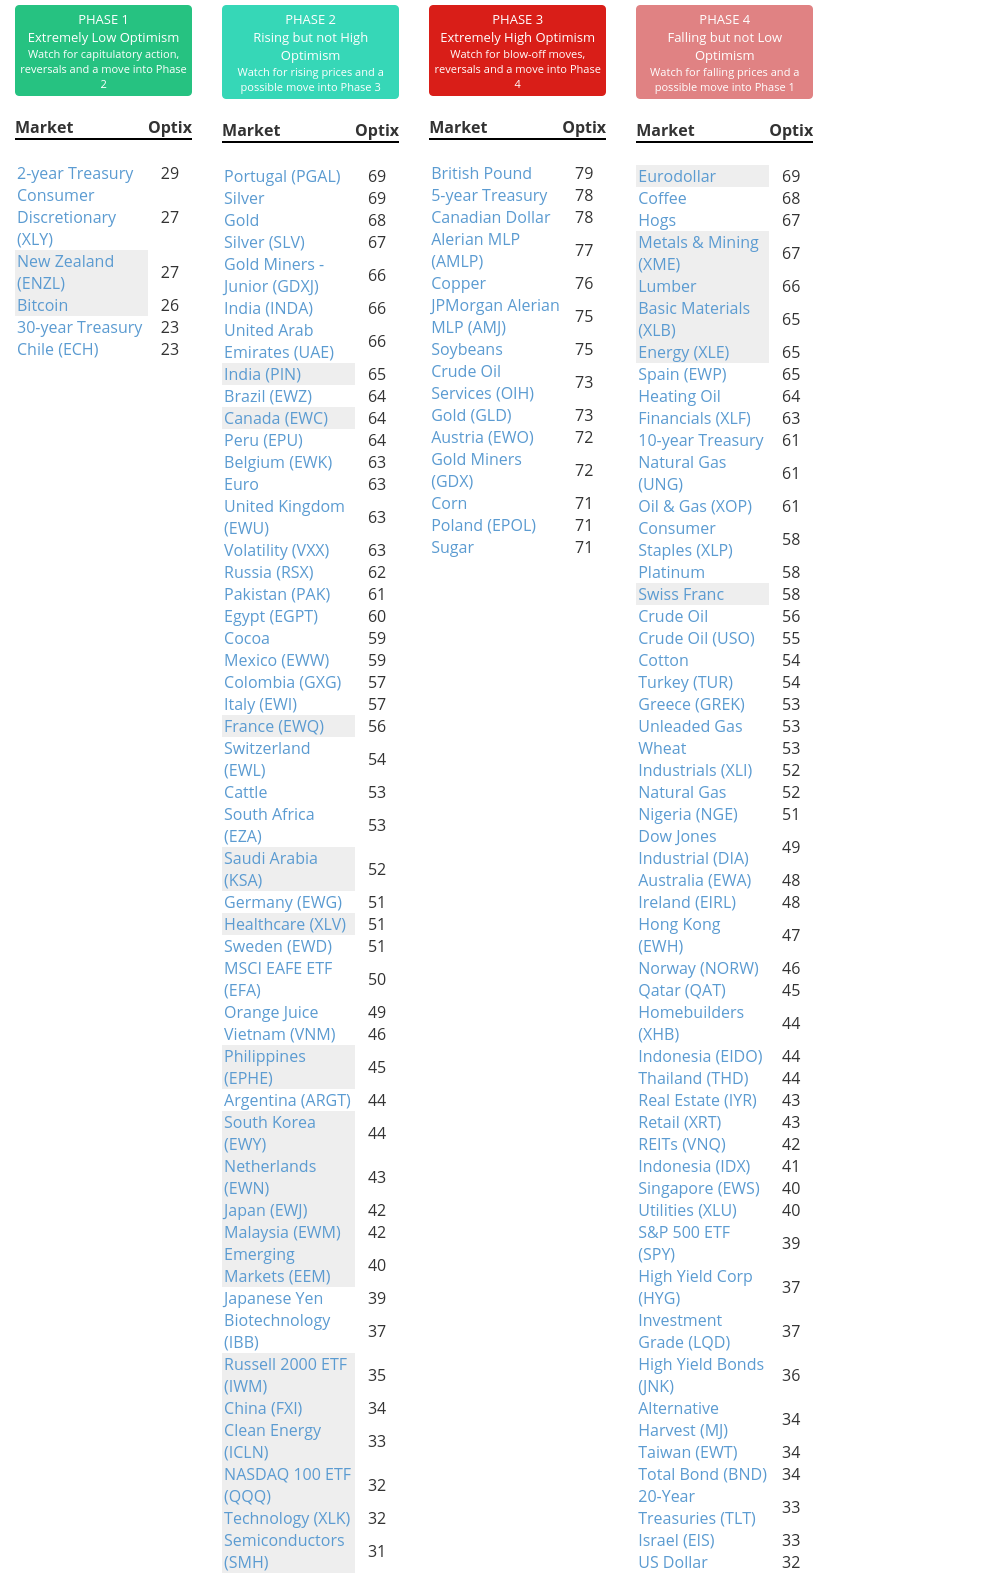
Phase Table
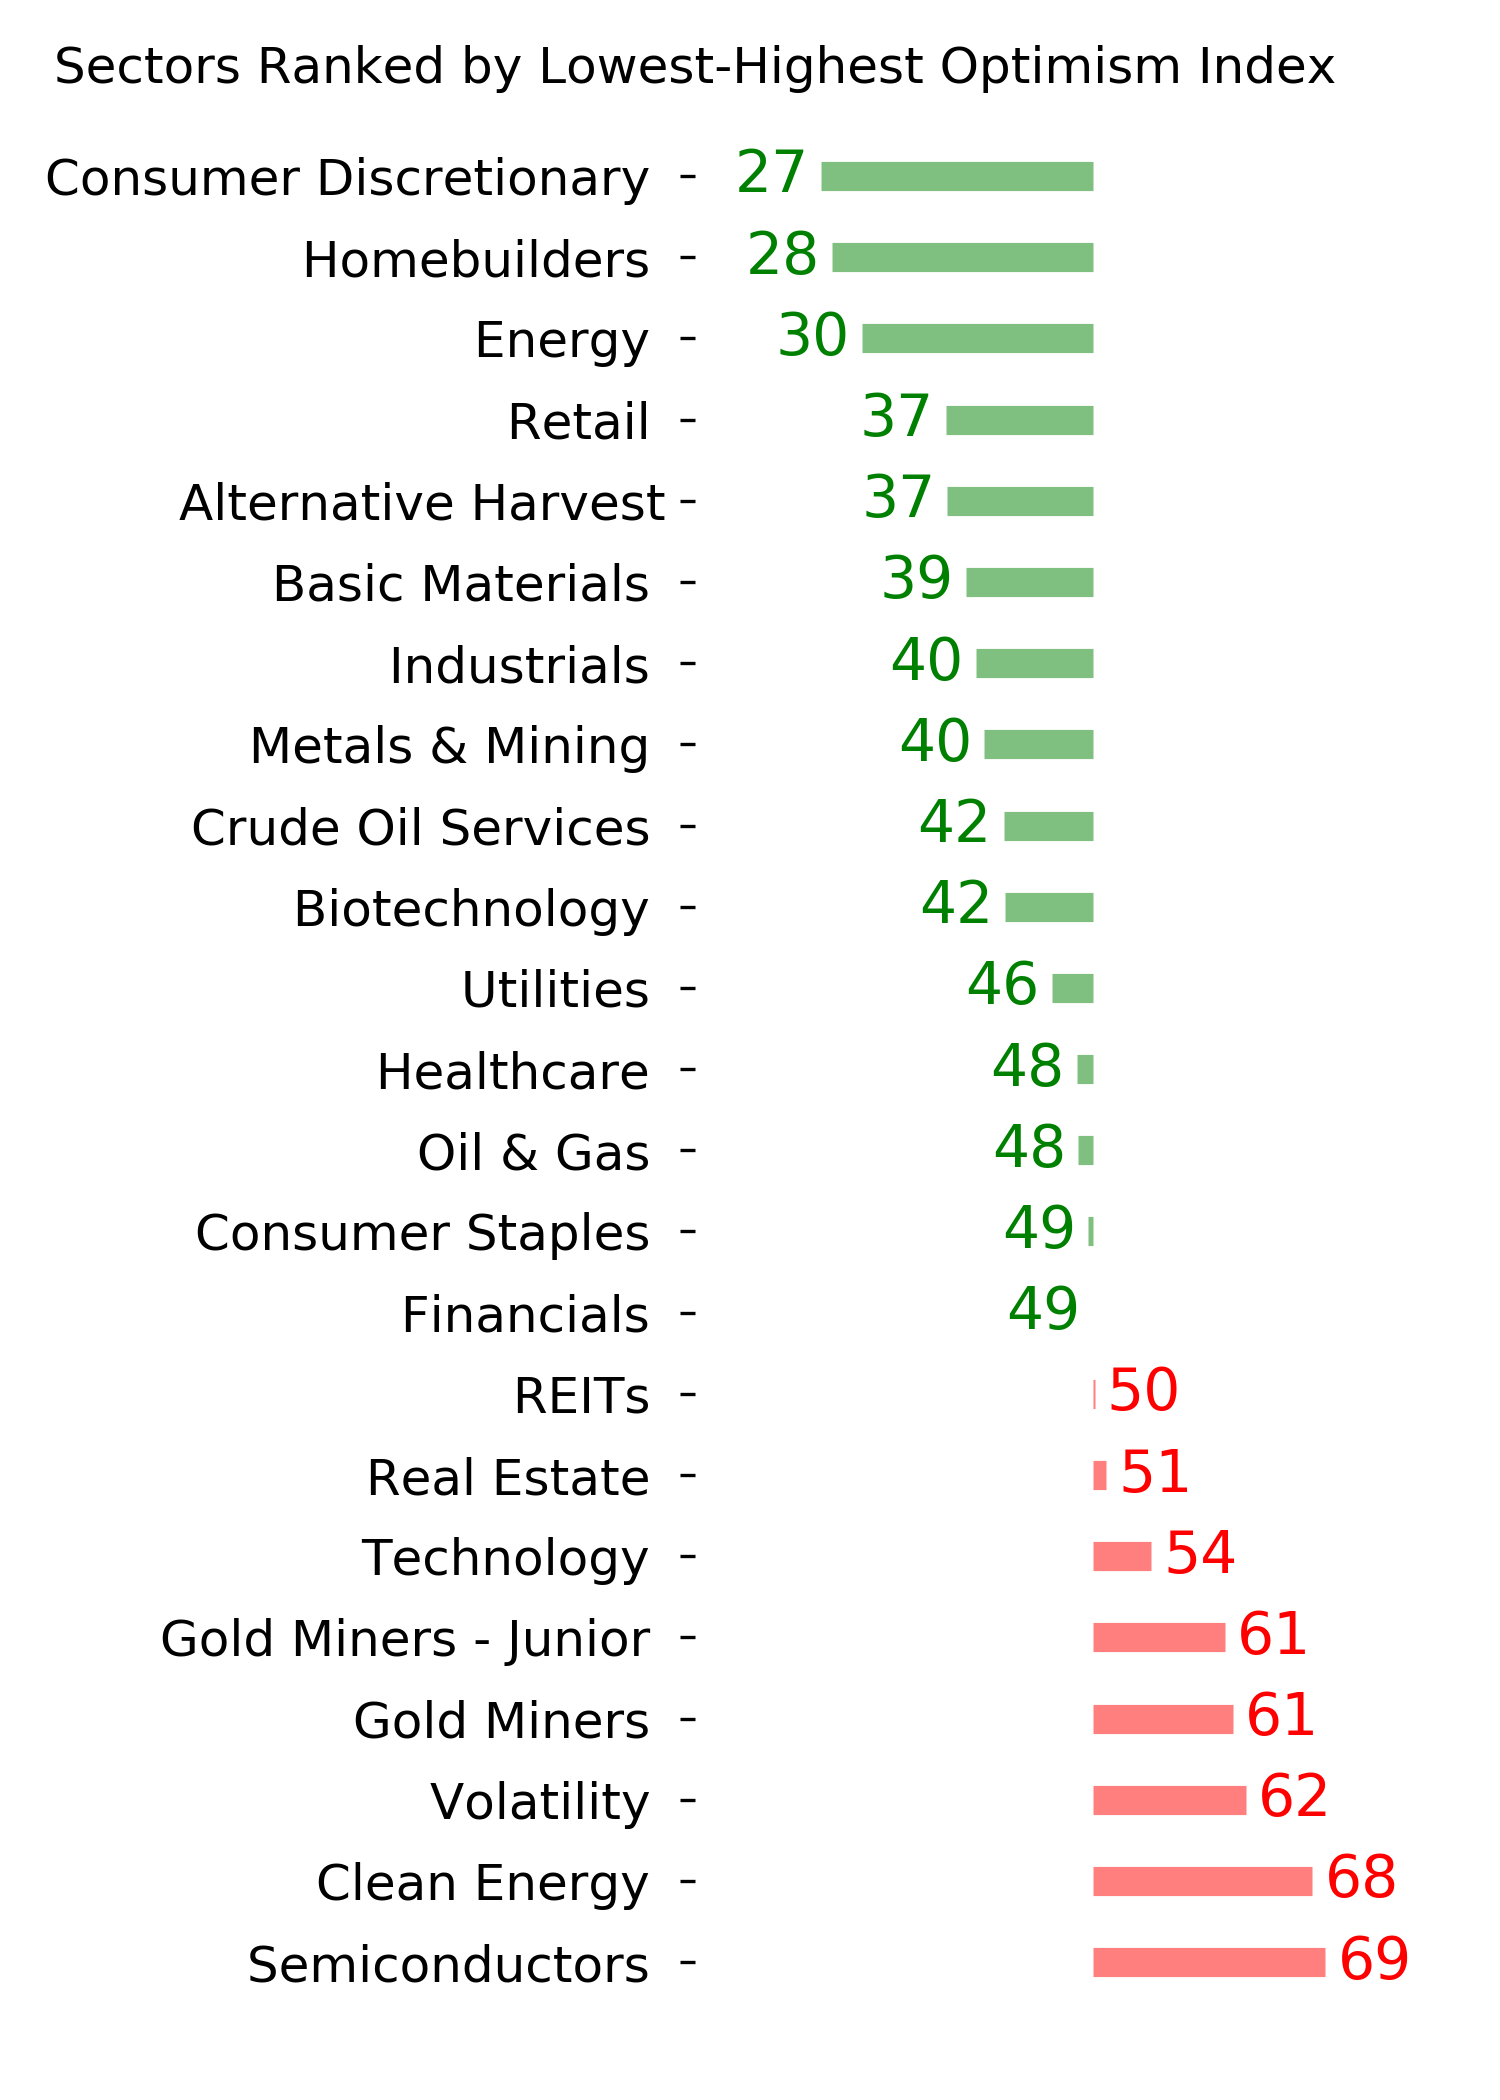
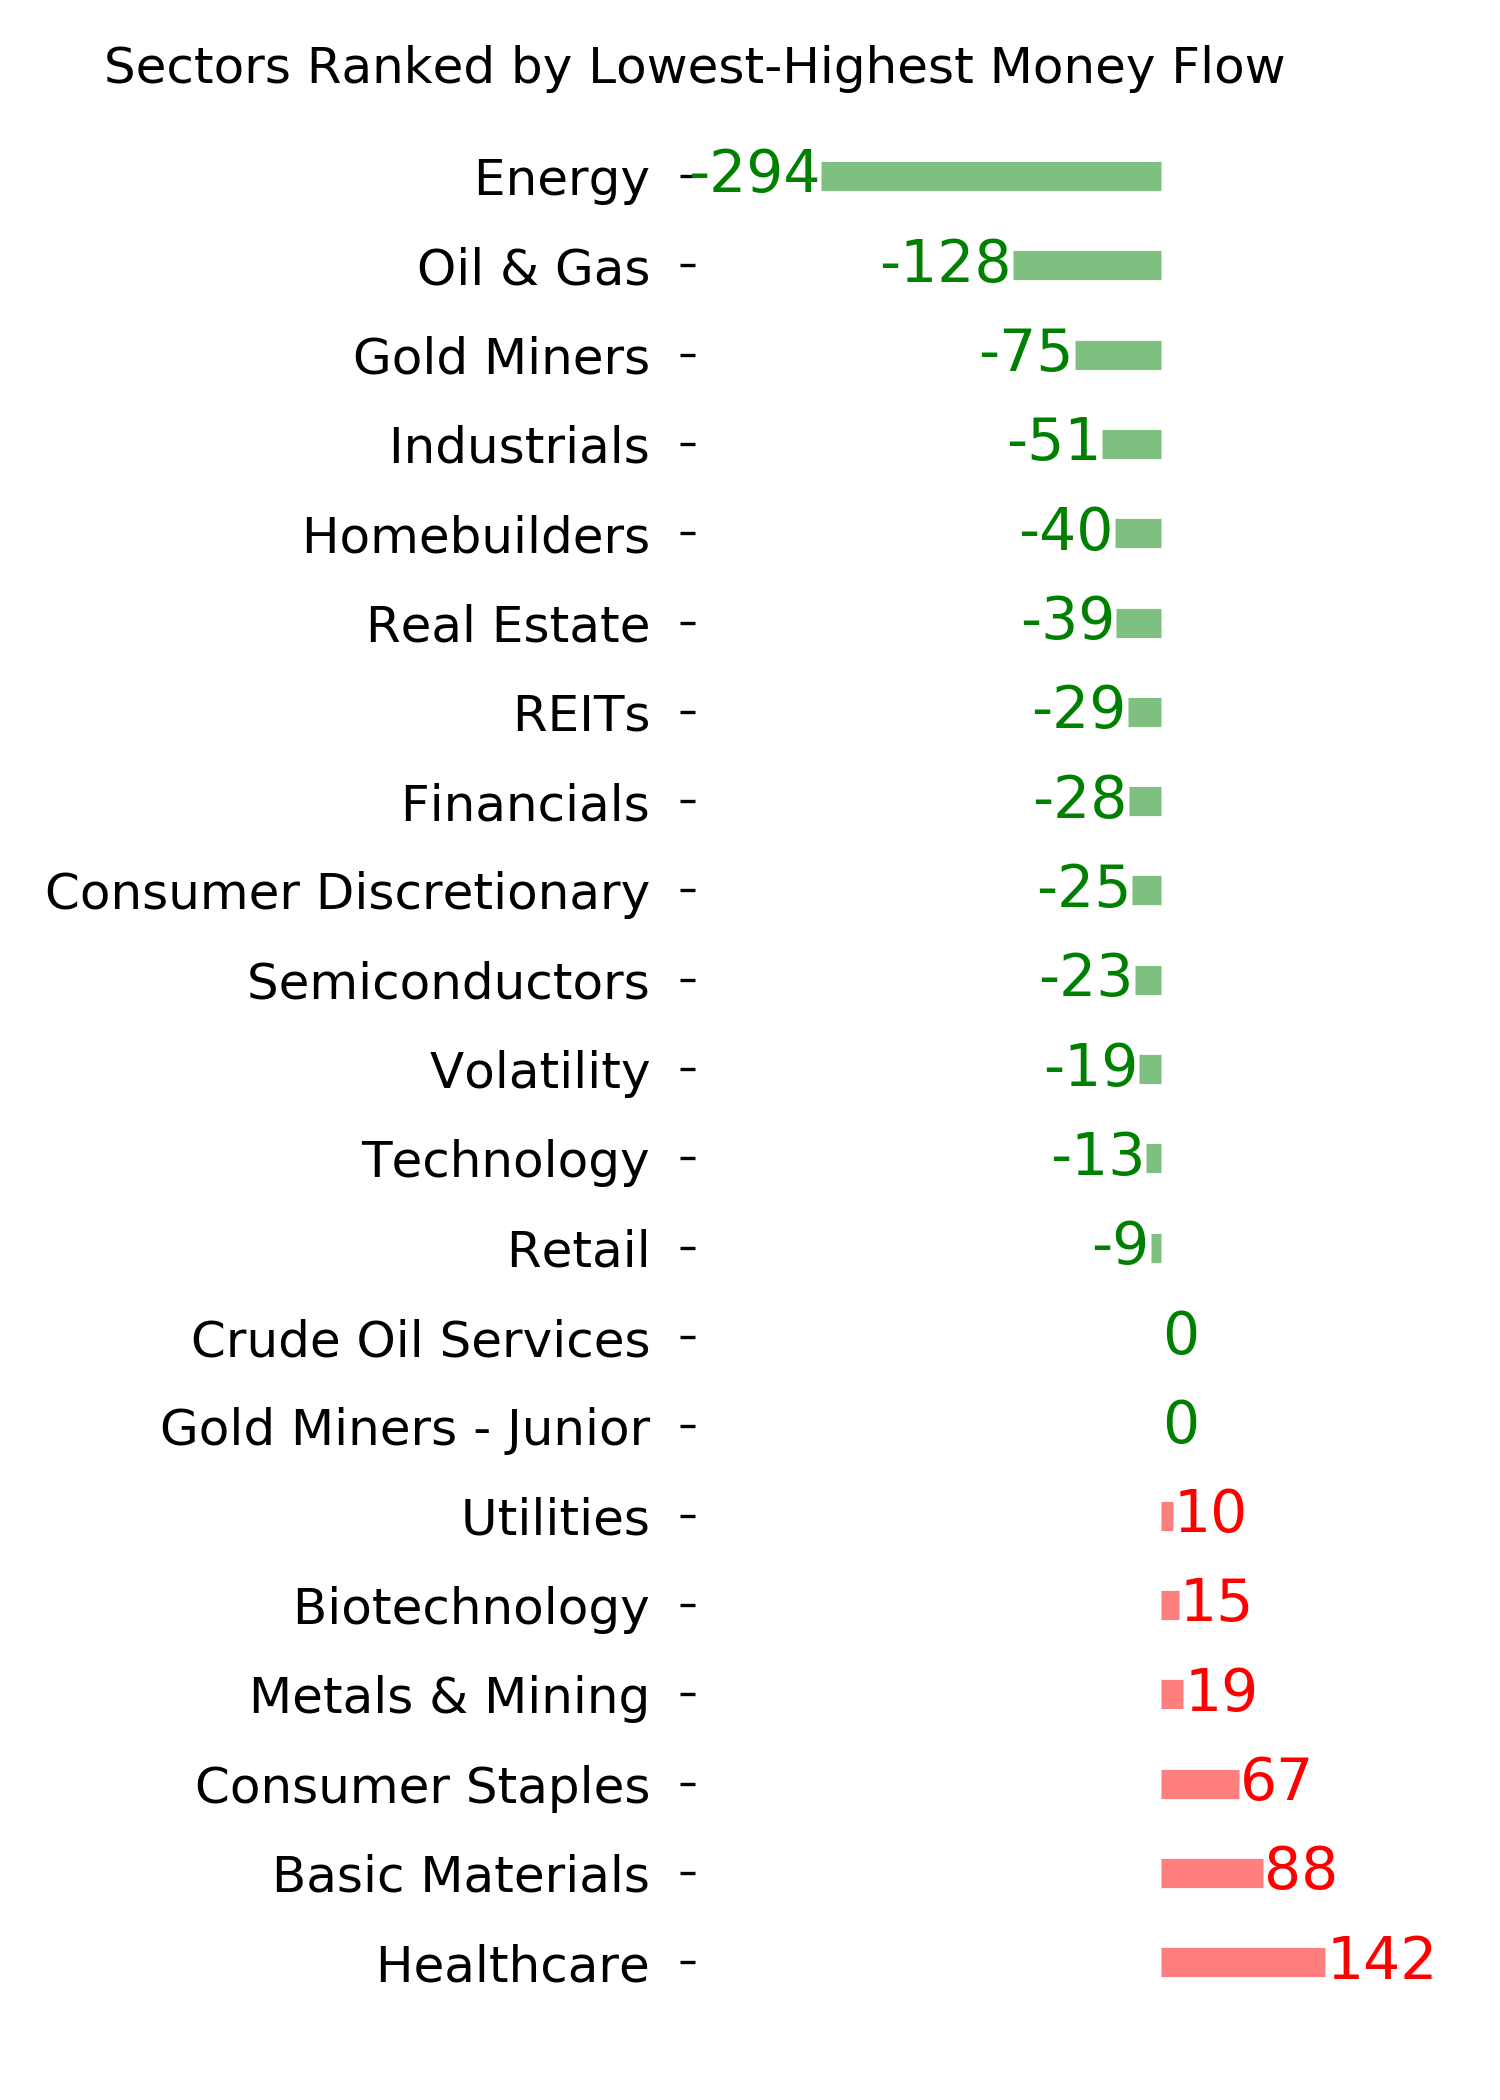
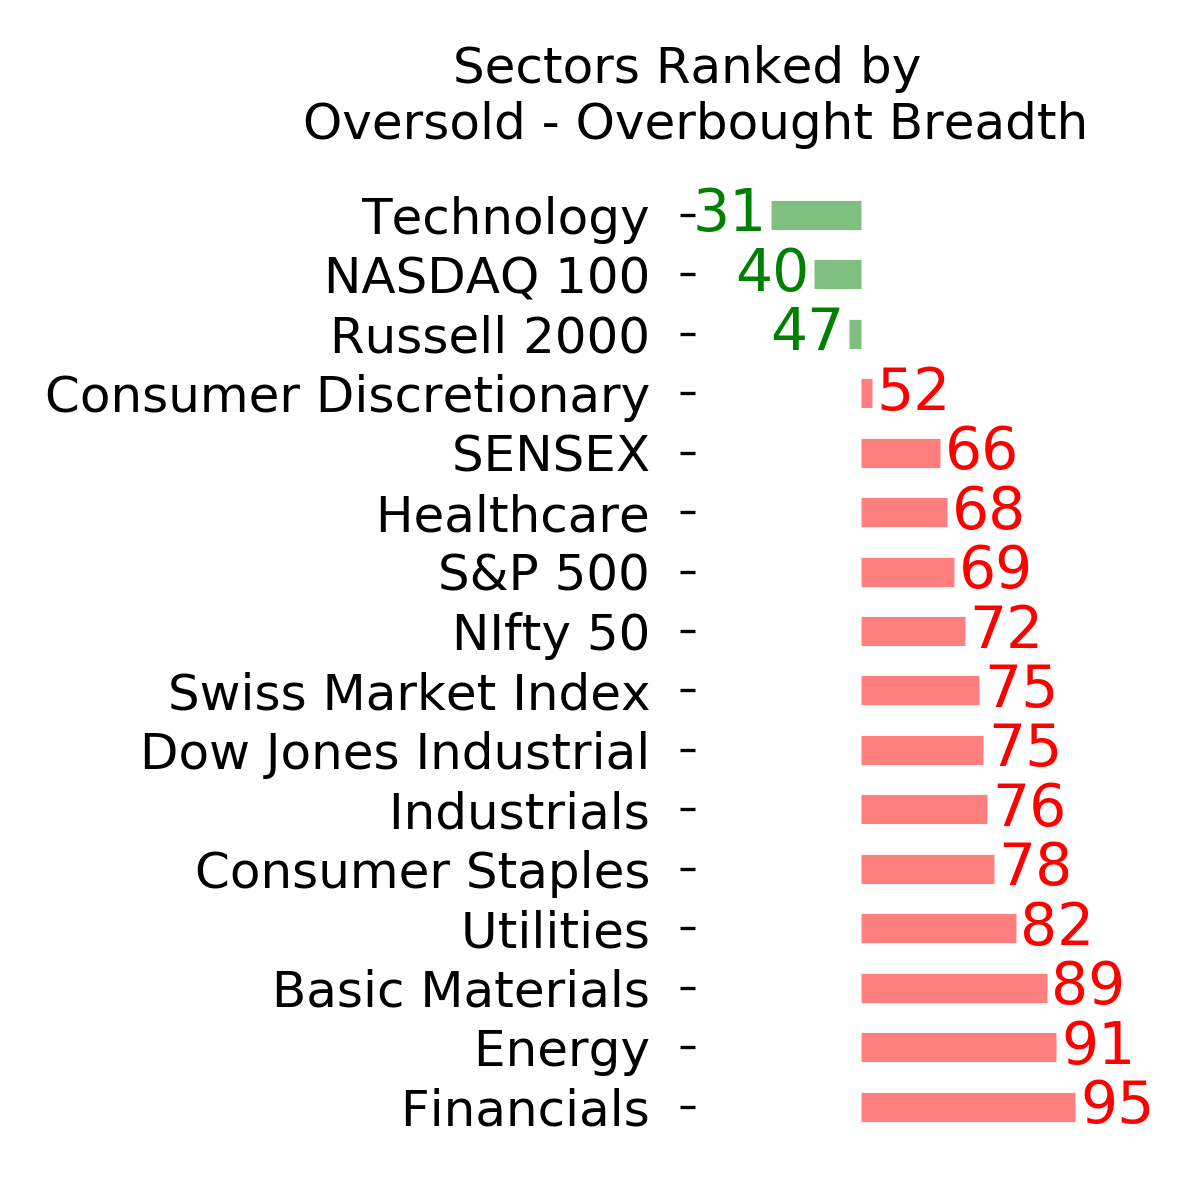
Ranks
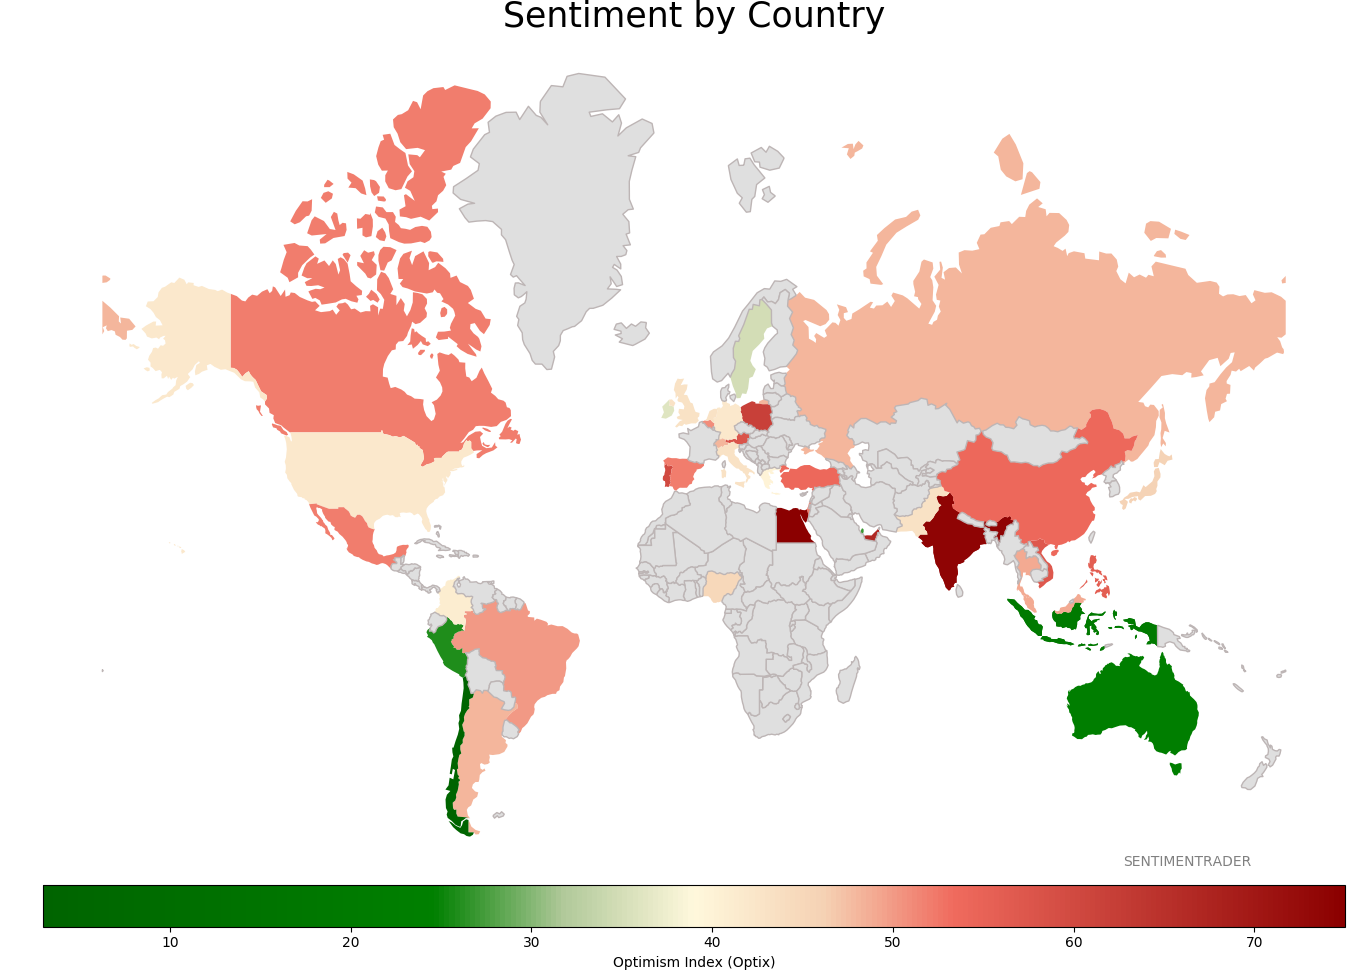
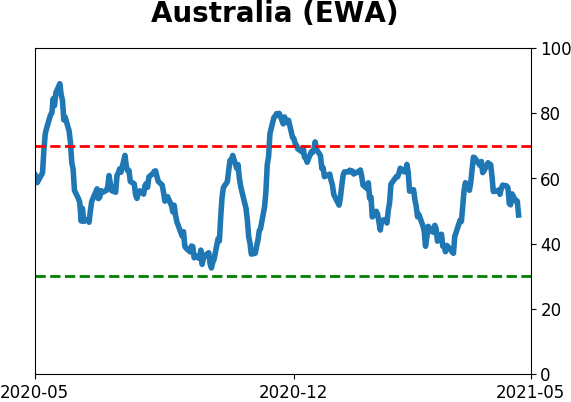
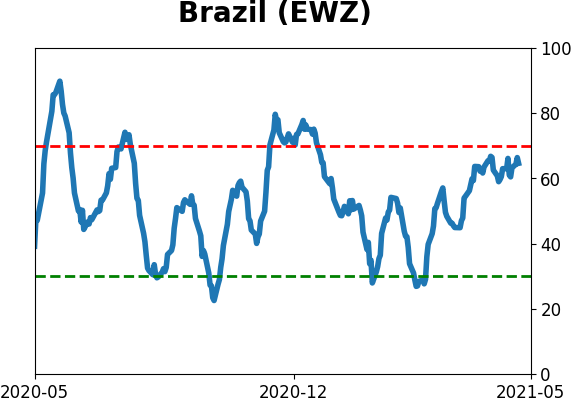
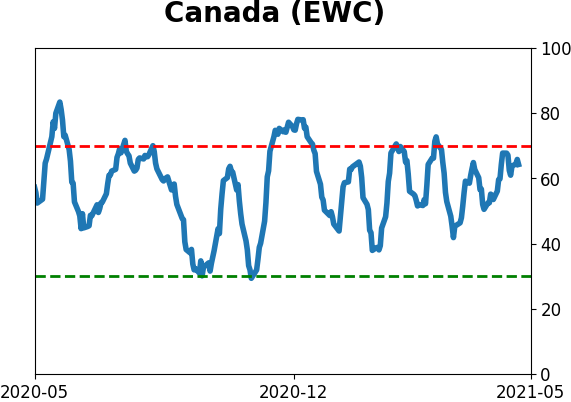
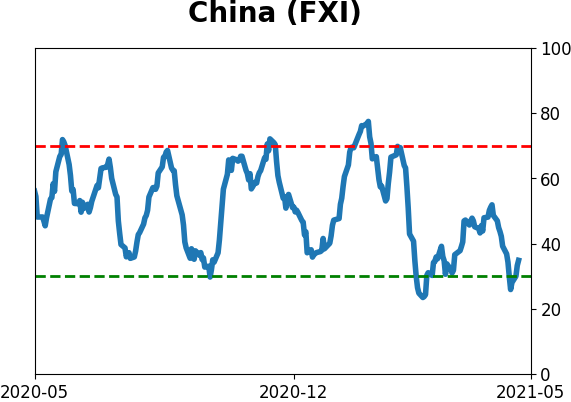
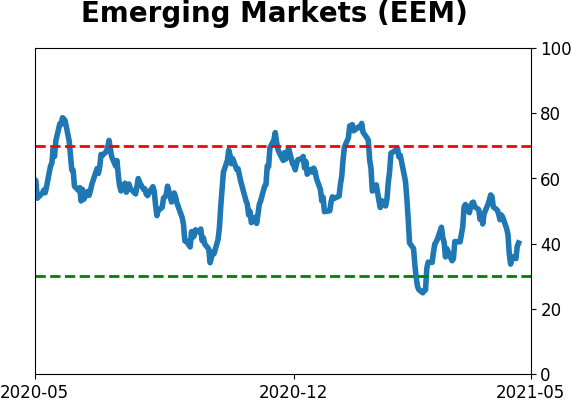
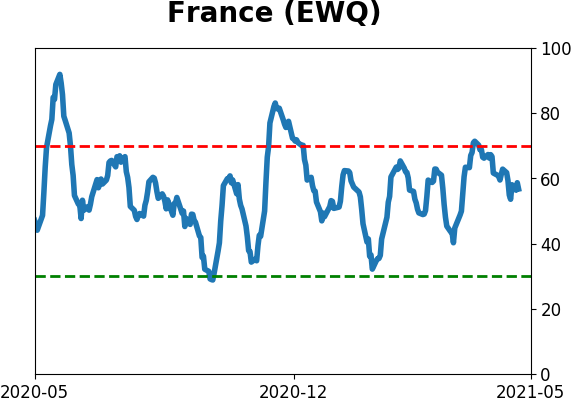
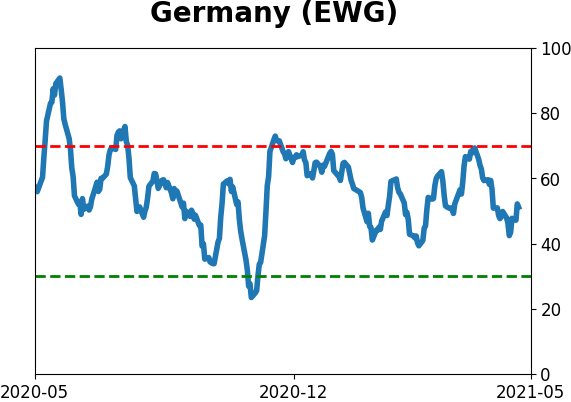
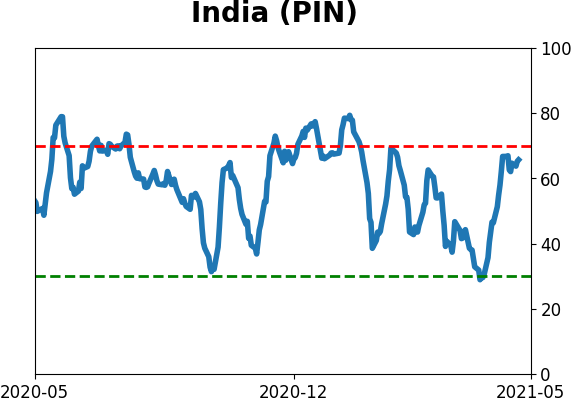
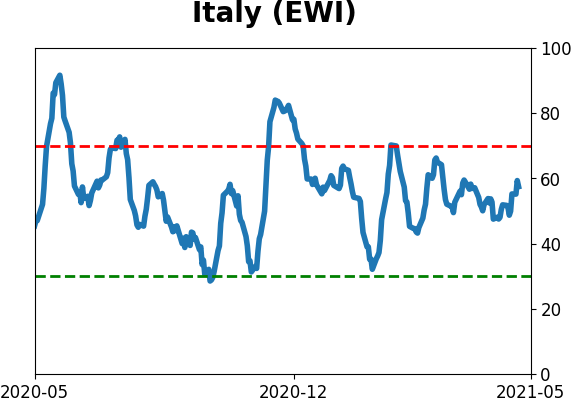
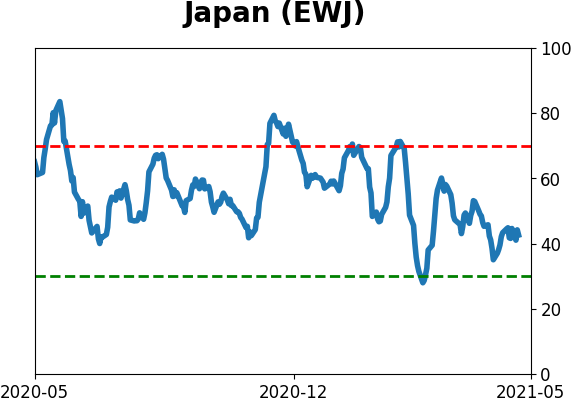
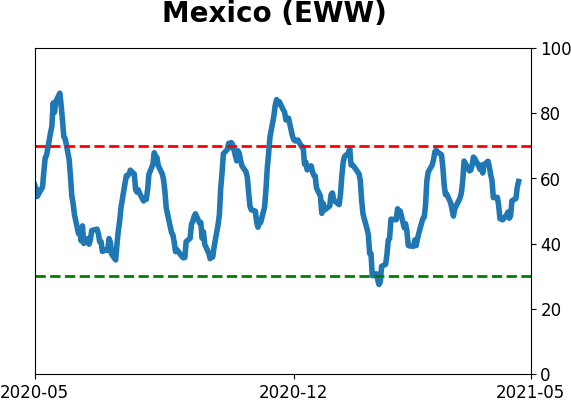
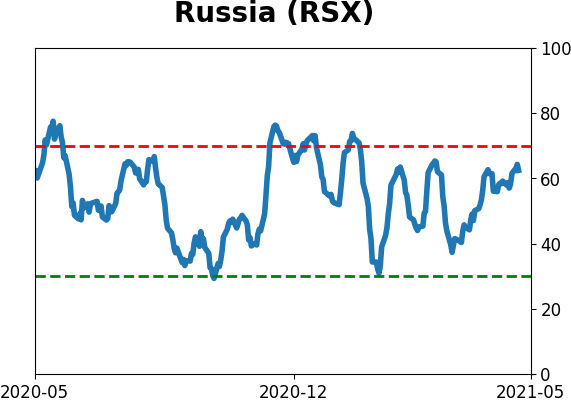
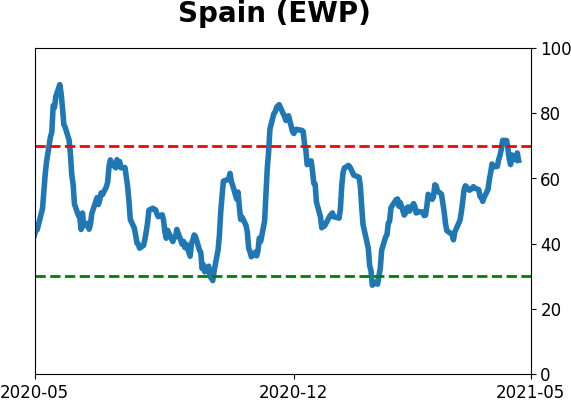
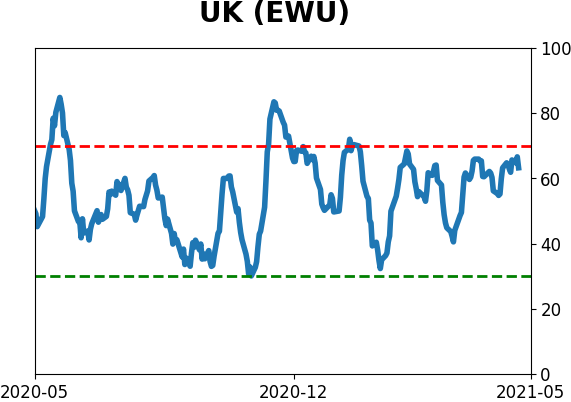
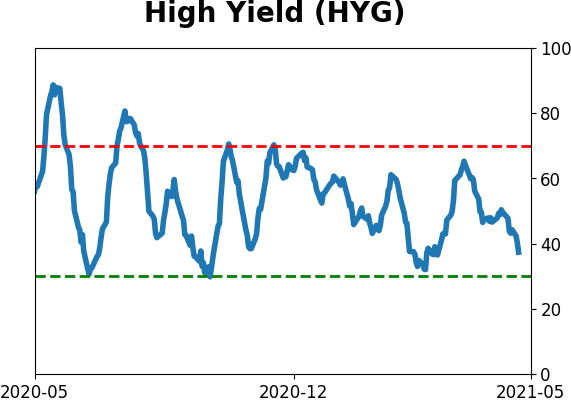
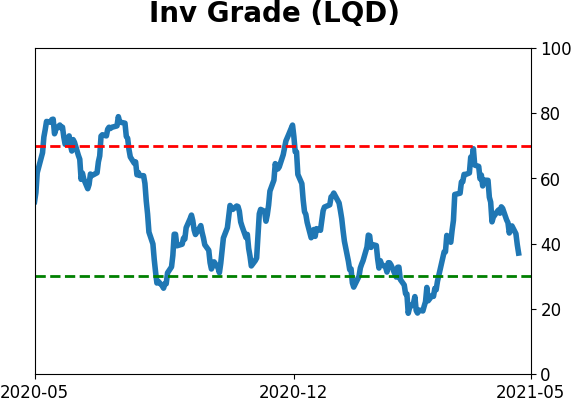
Sentiment Around The World
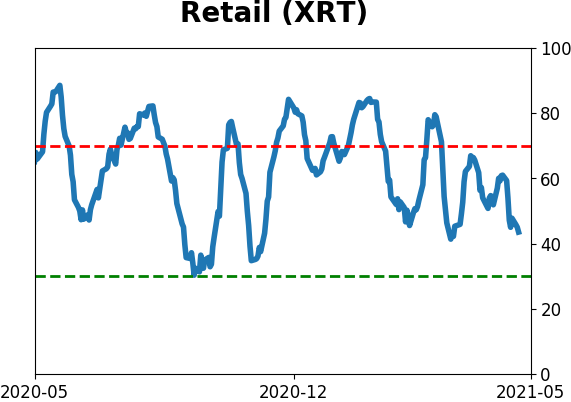
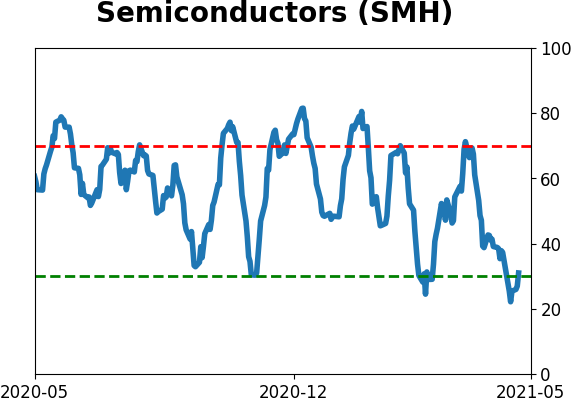
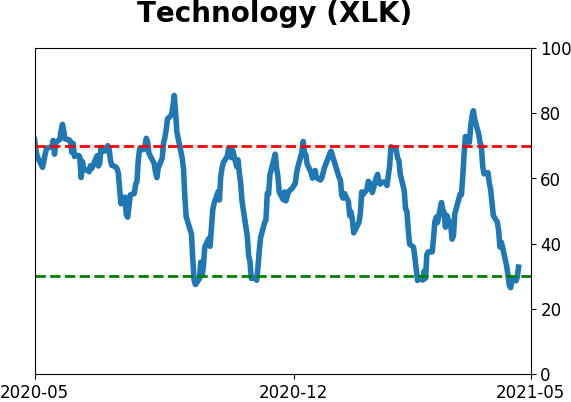
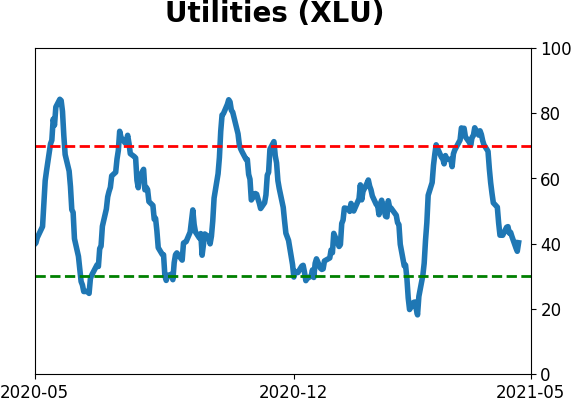
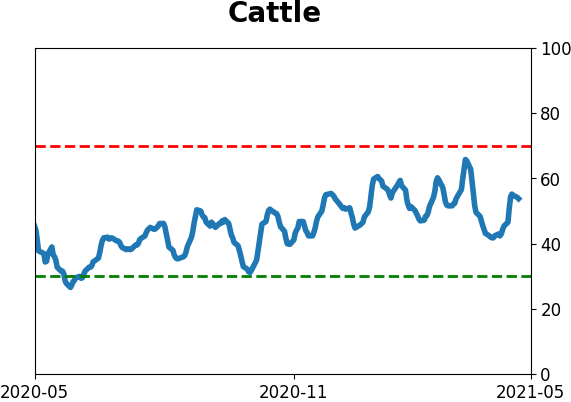
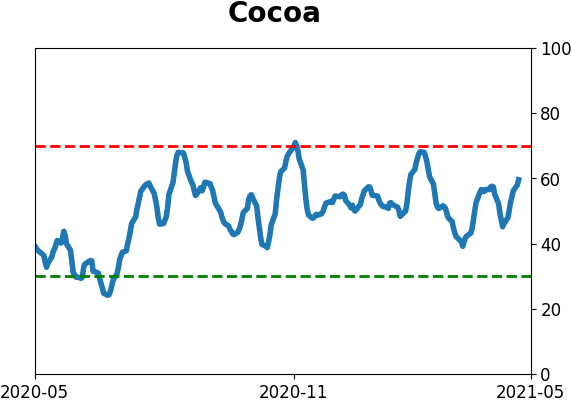
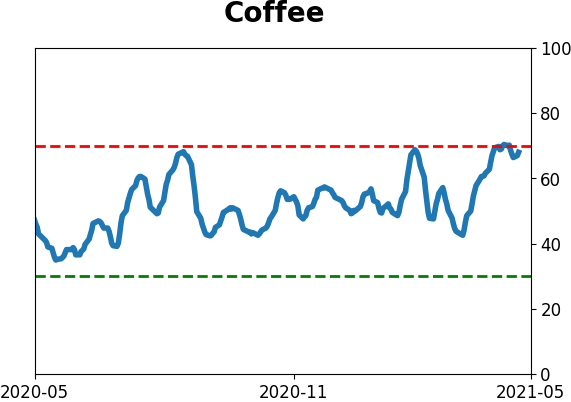
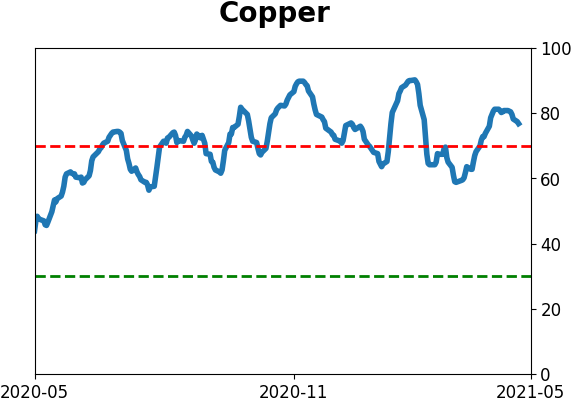
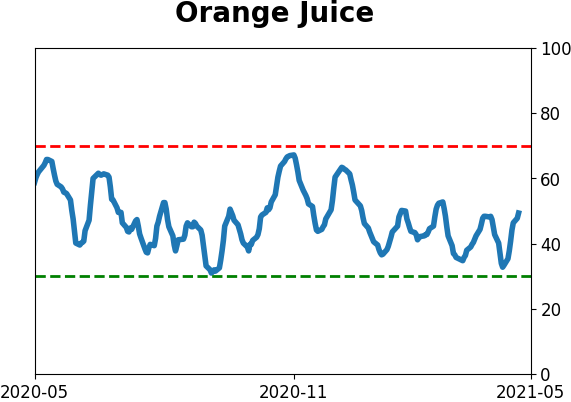
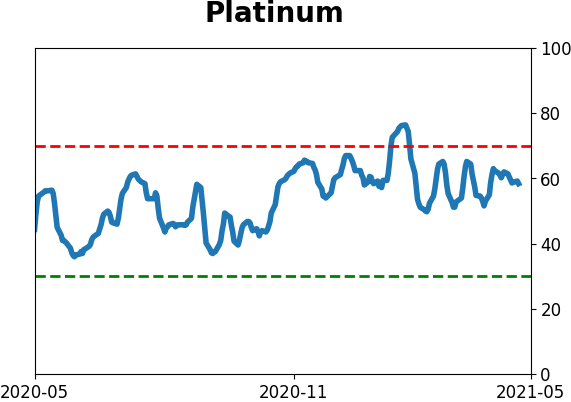
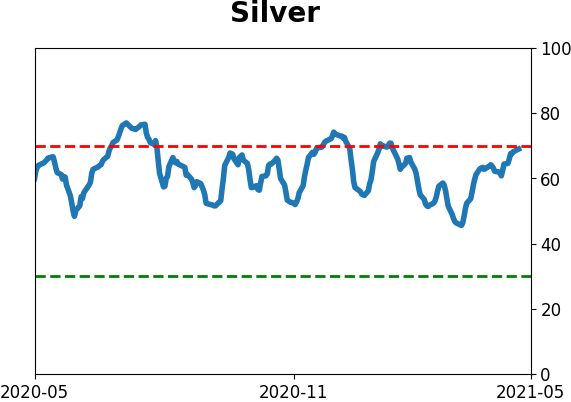
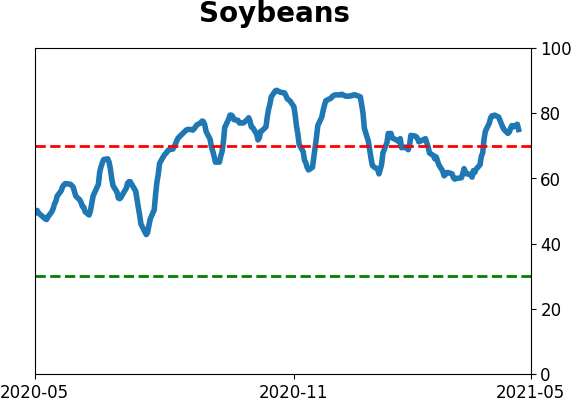
Optimism Index Thumbnails
|
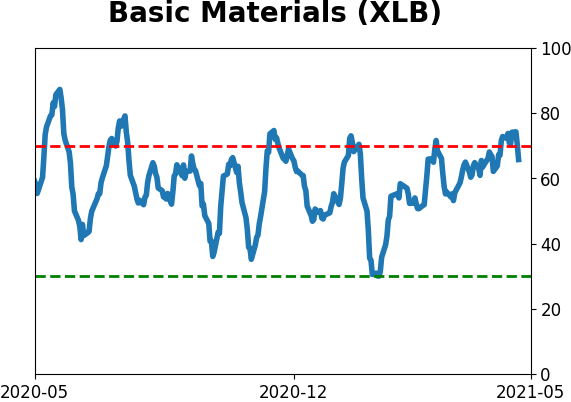
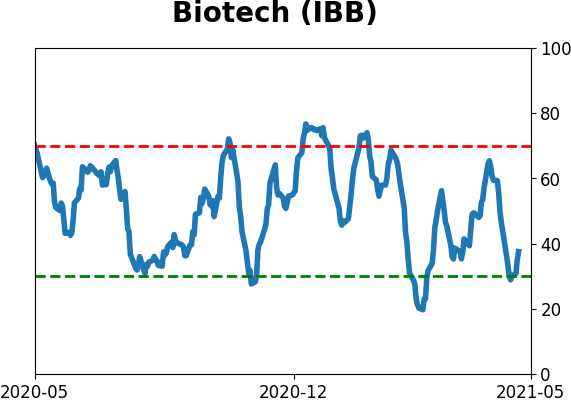
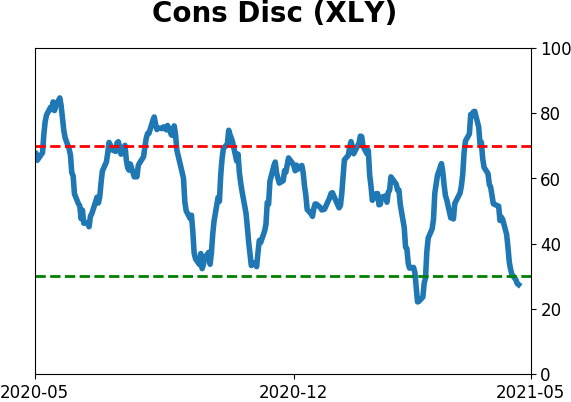
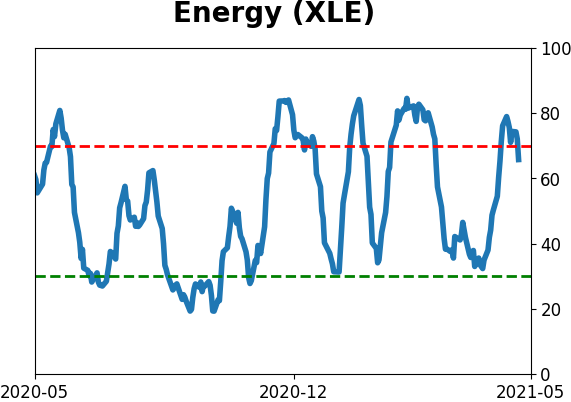
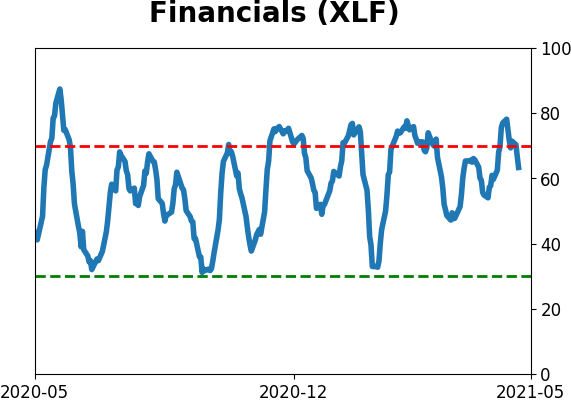
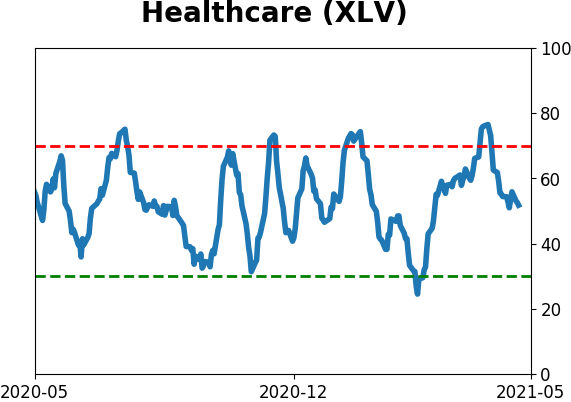
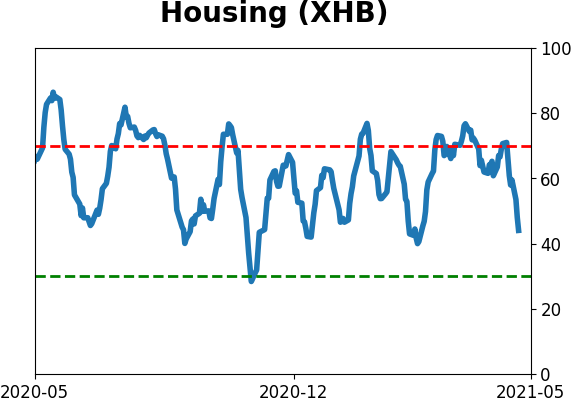
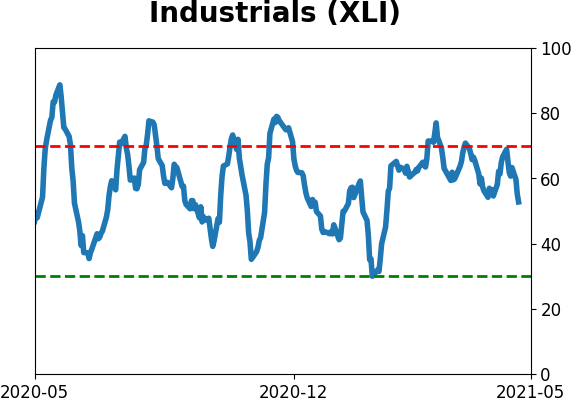
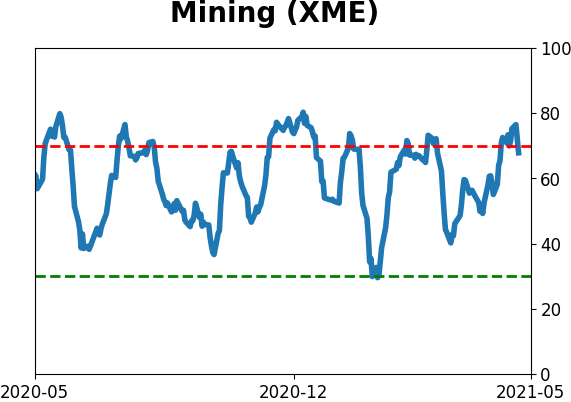
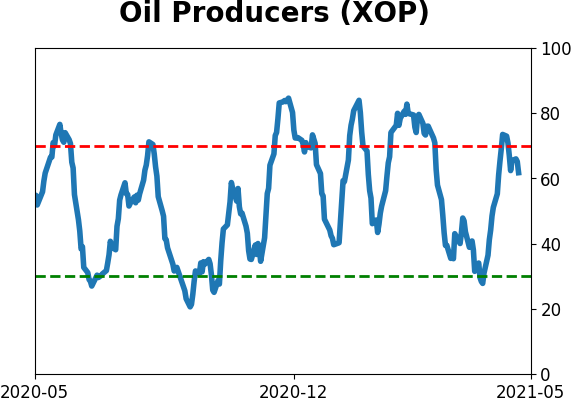
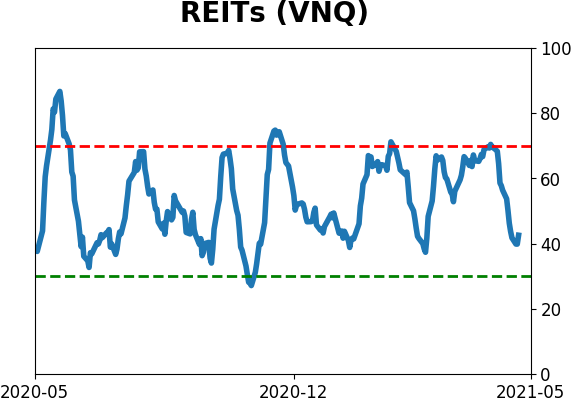
Sector ETF's - 10-Day Moving Average
|
|
|
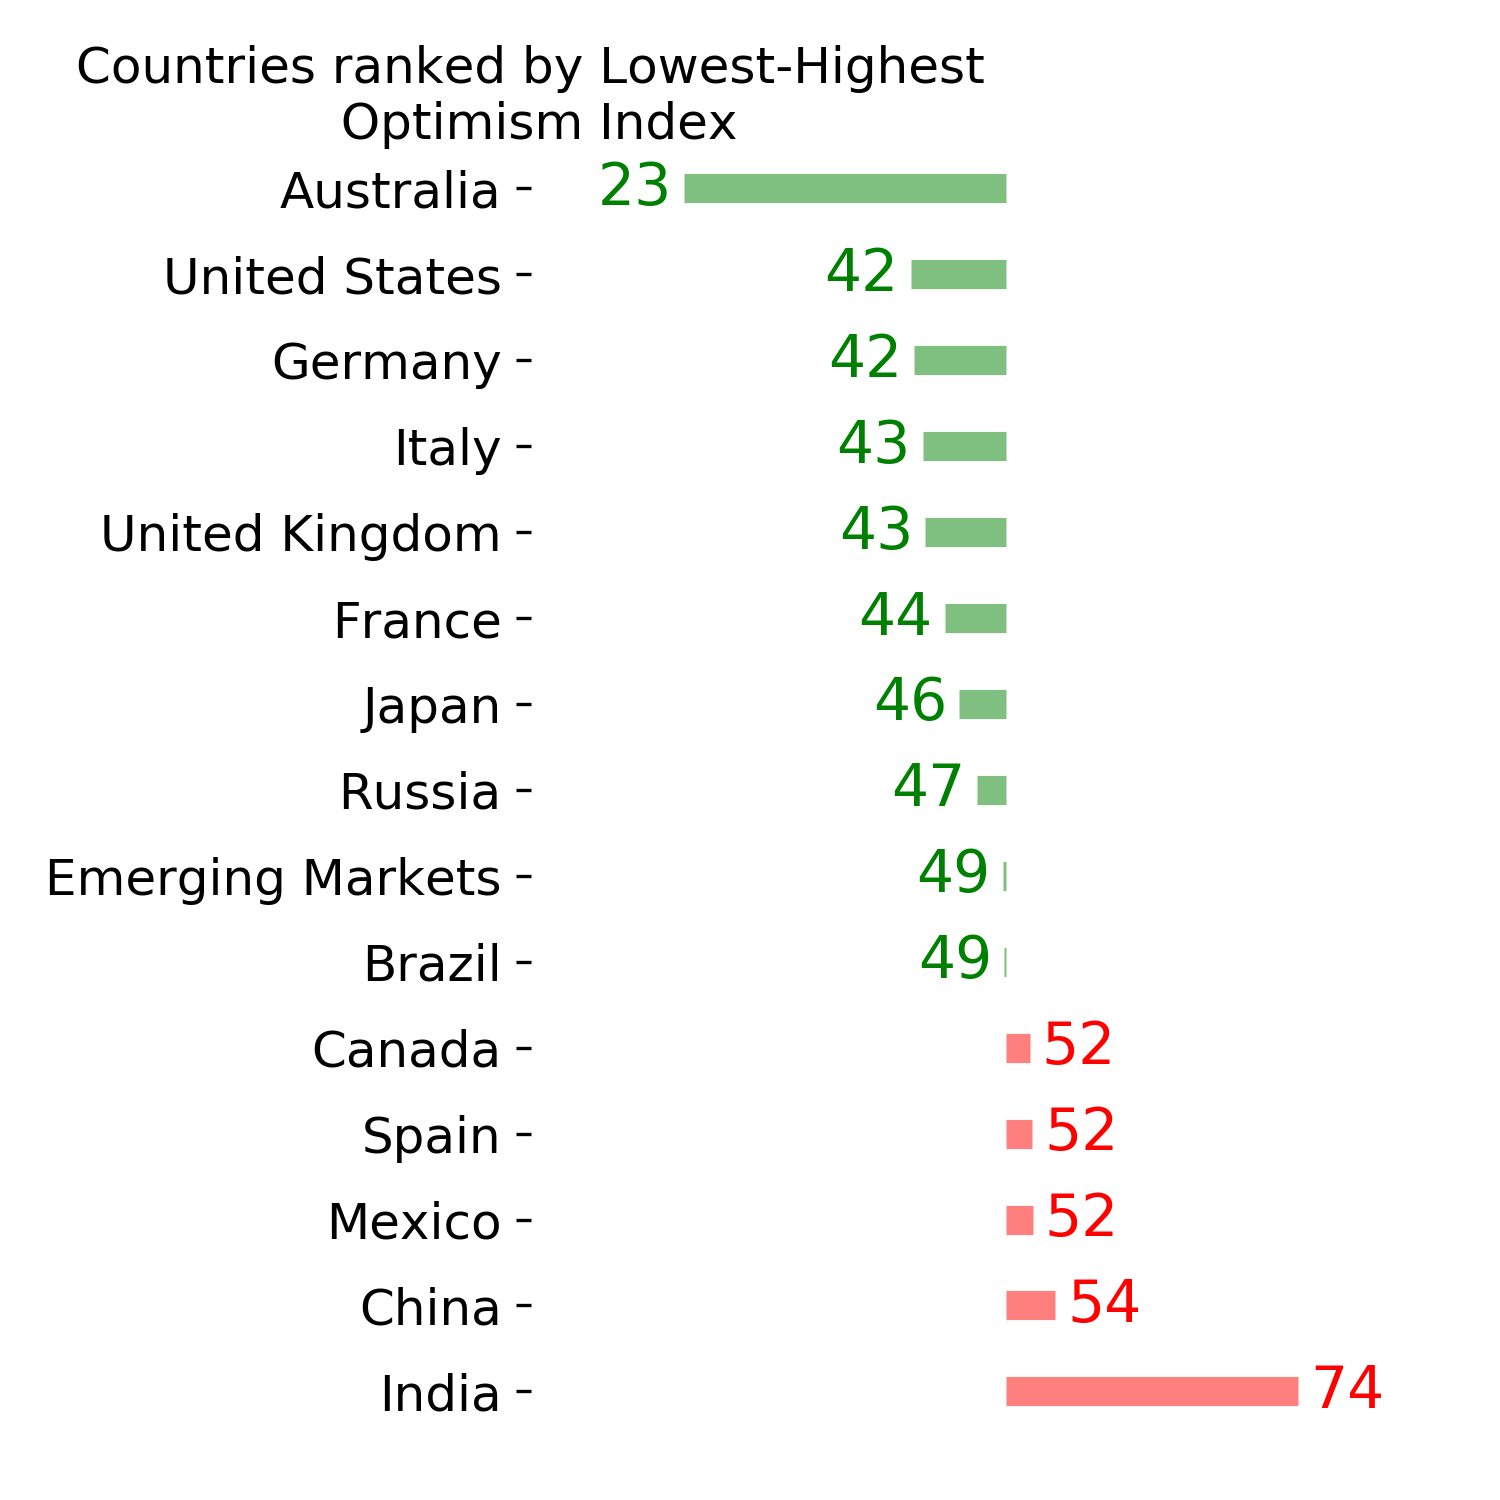
Country ETF's - 10-Day Moving Average
|
|
|
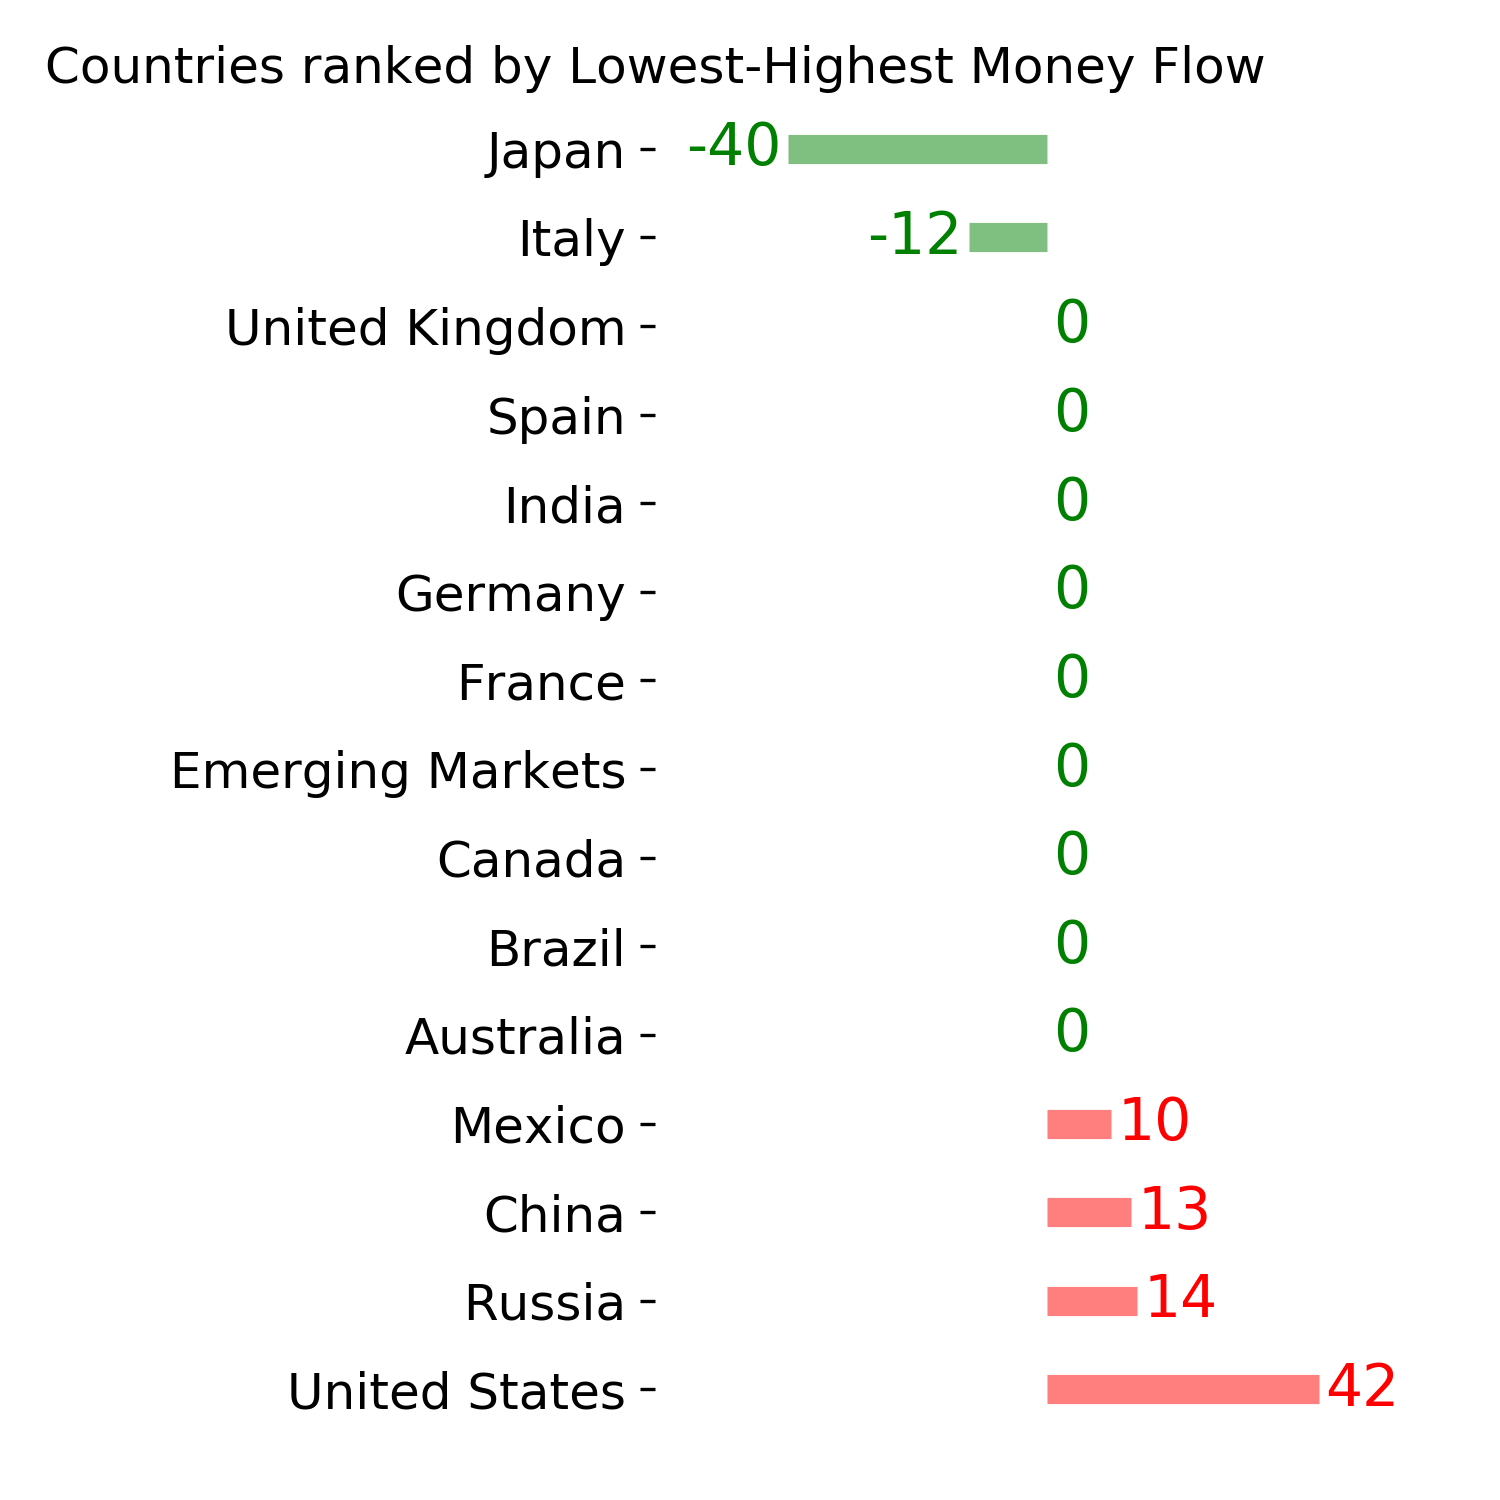
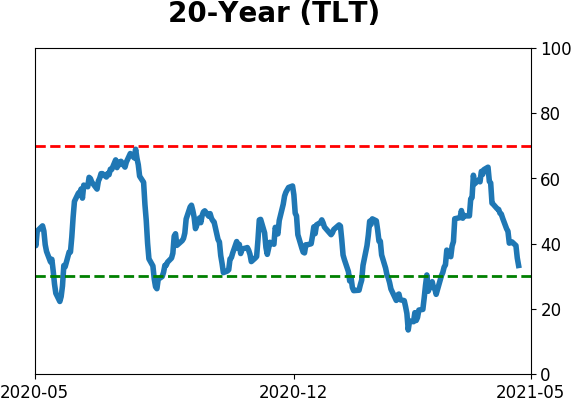
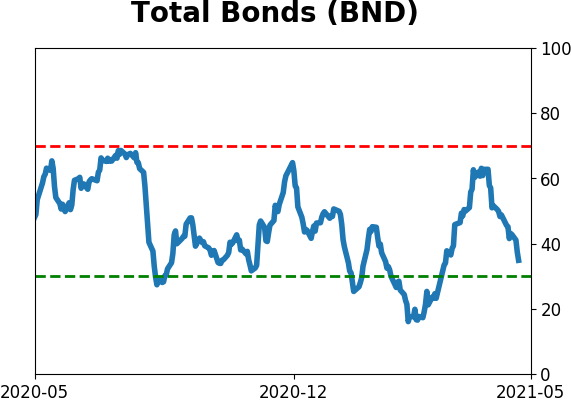
Bond ETF's - 10-Day Moving Average
|
|
|
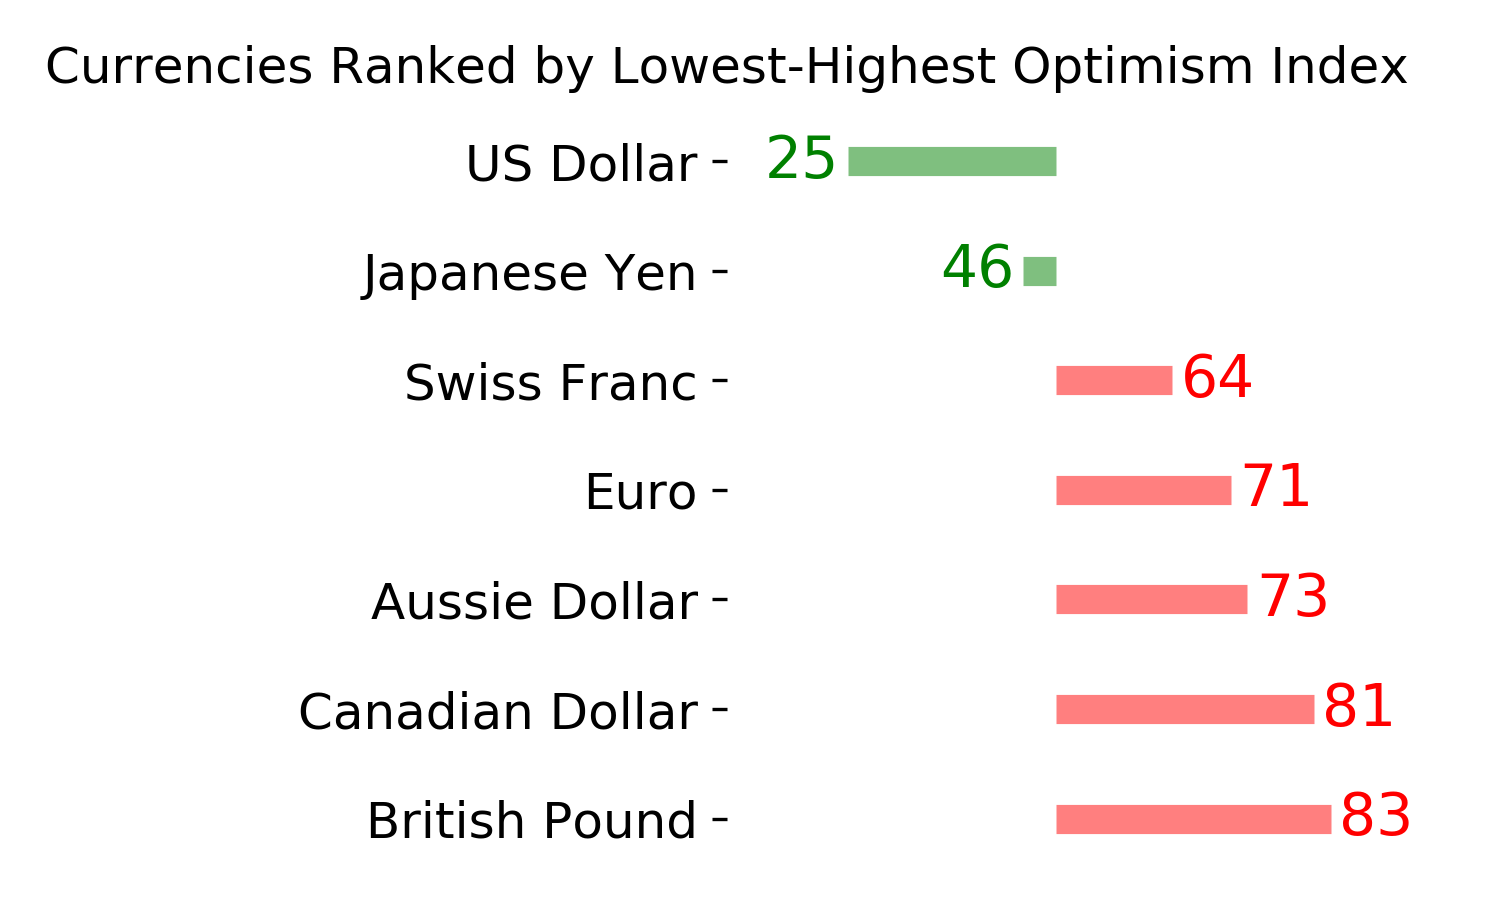
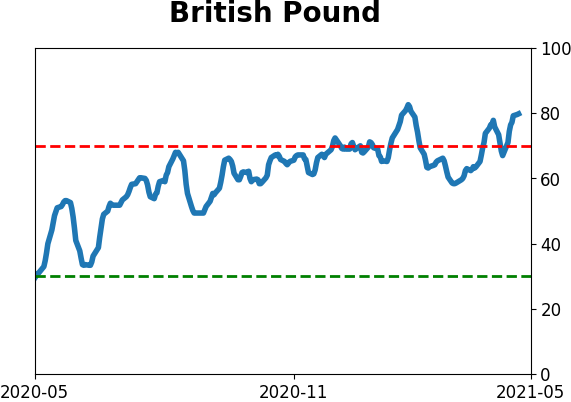
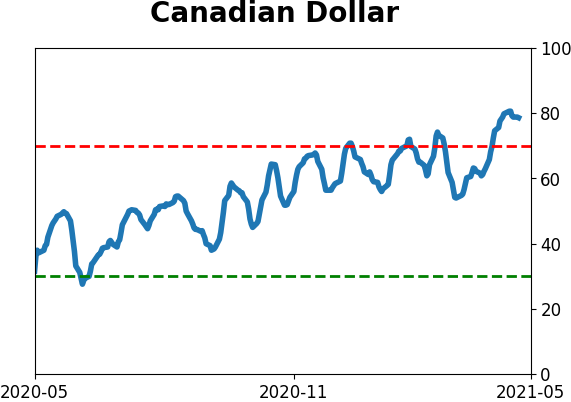
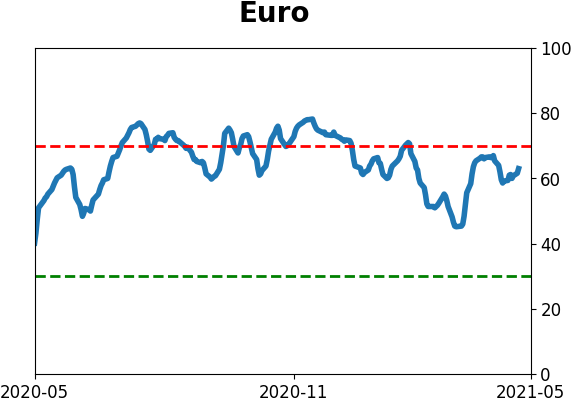
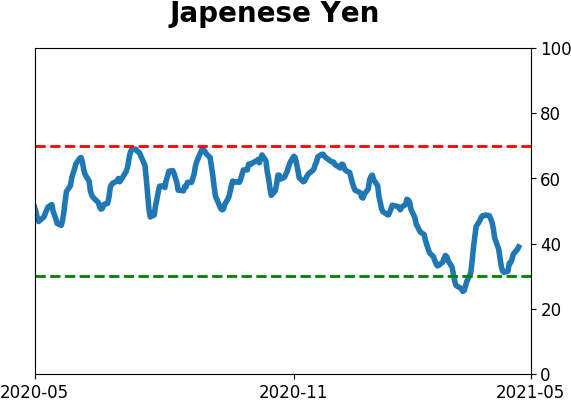
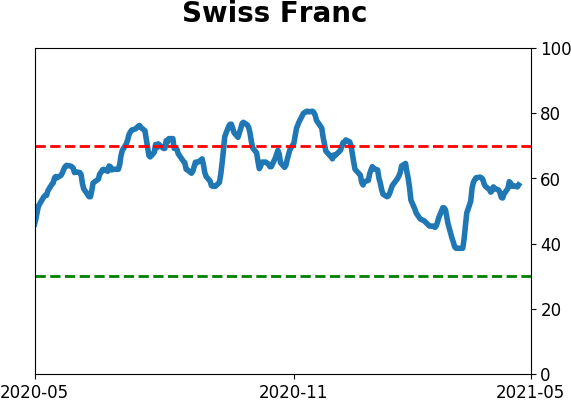
Currency ETF's - 5-Day Moving Average
|
|
|
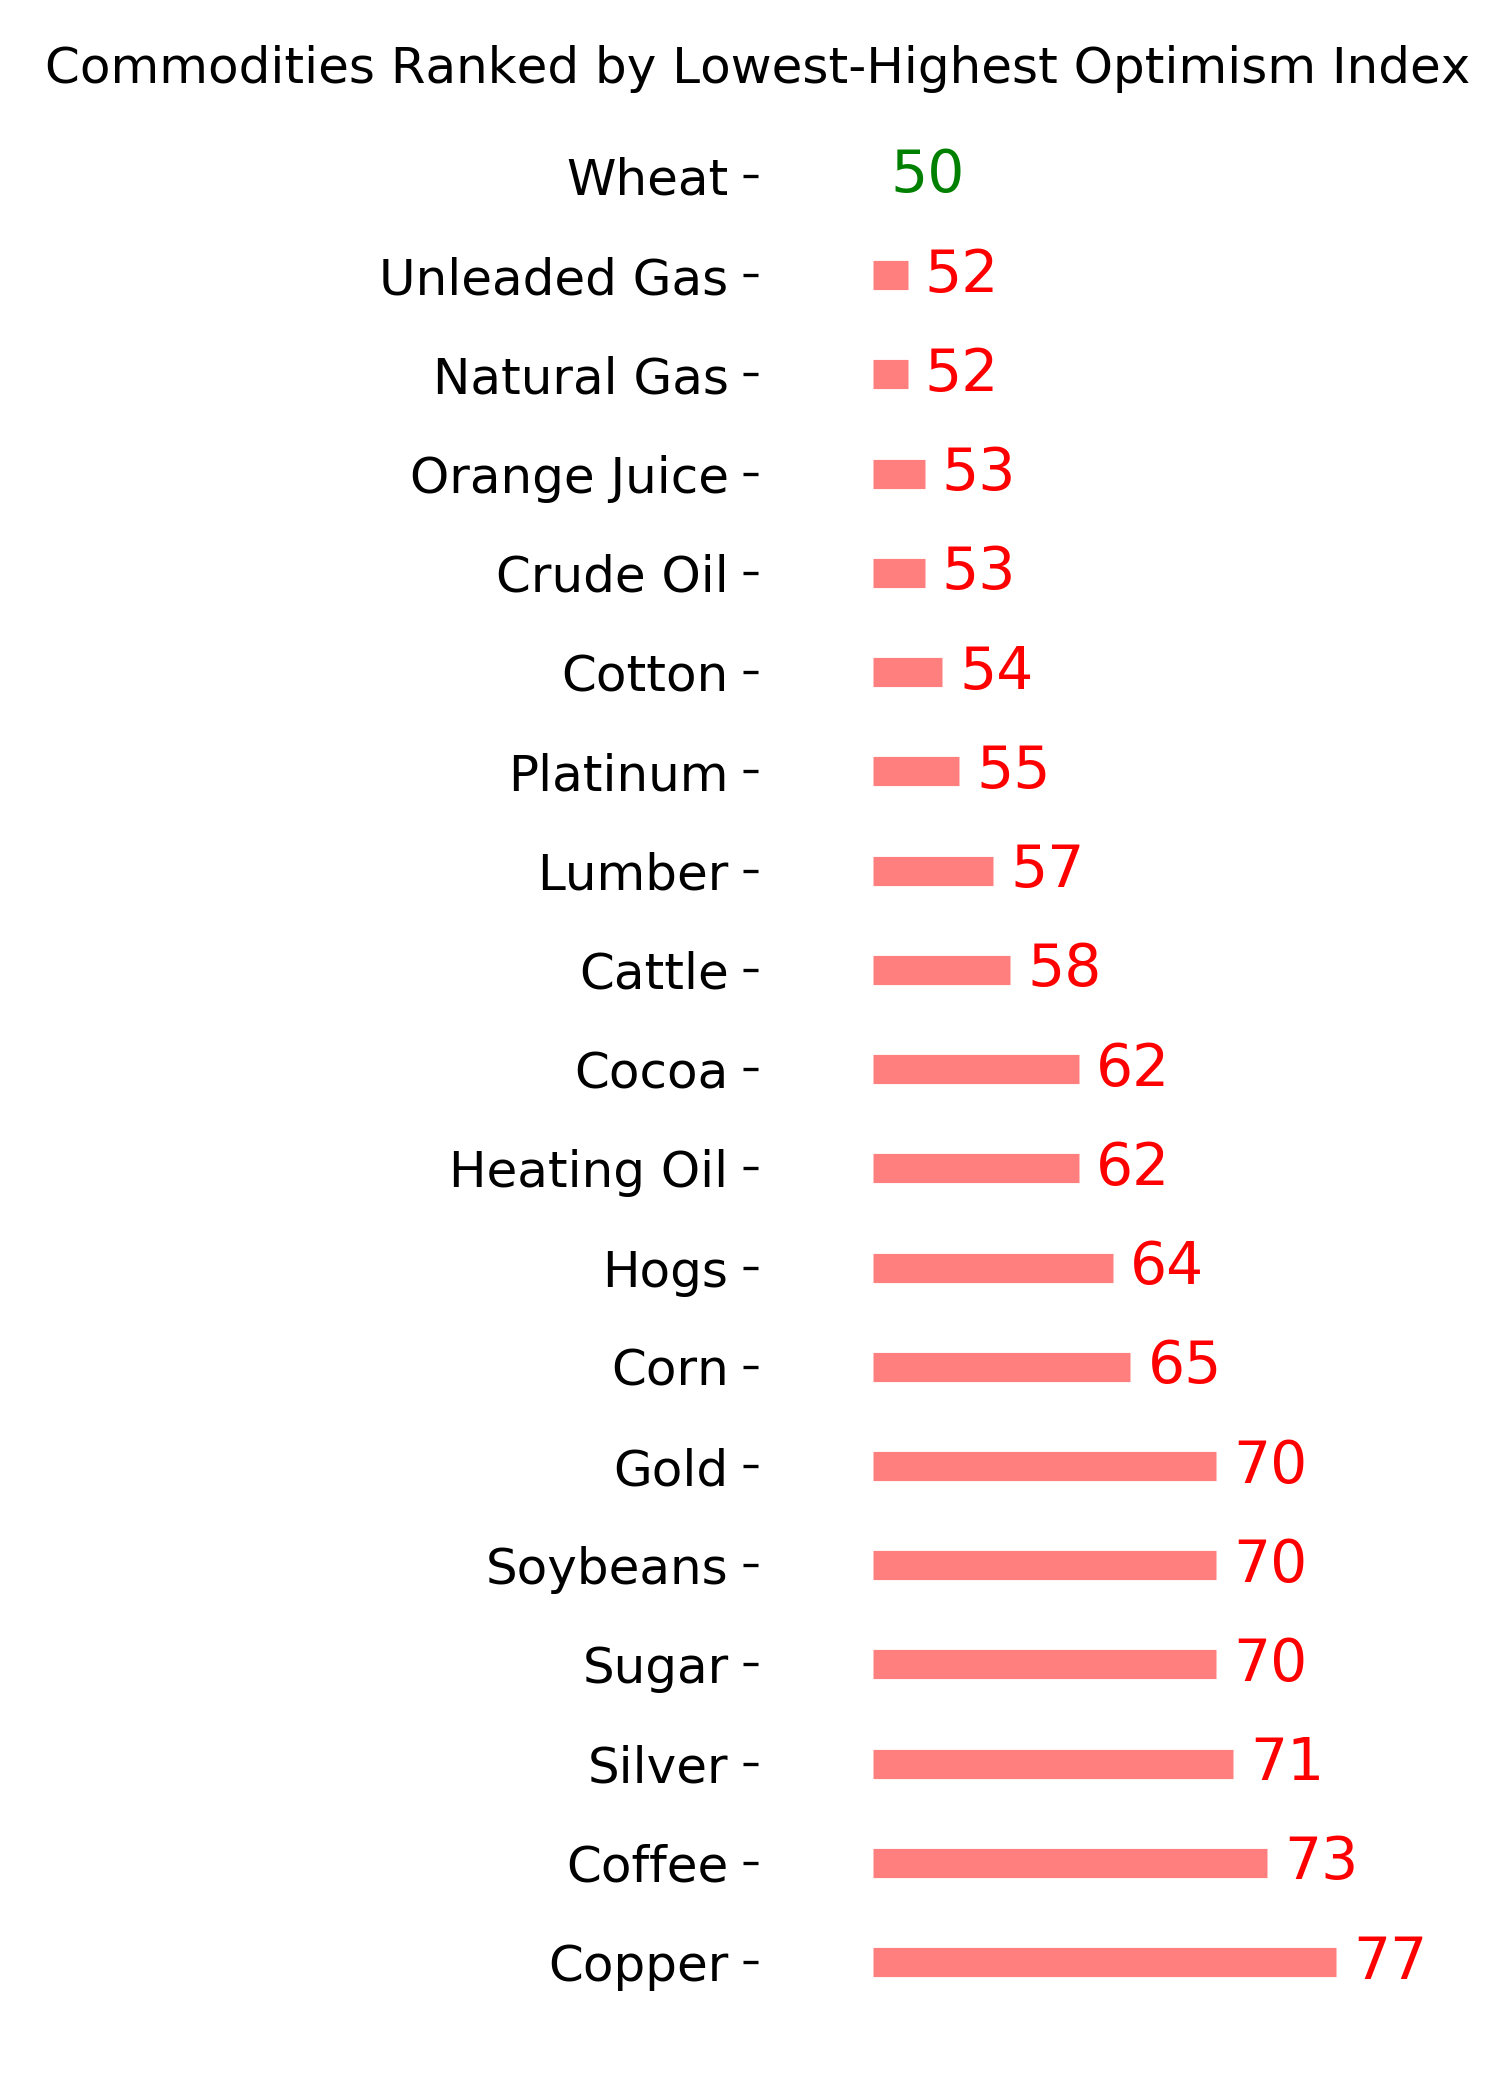
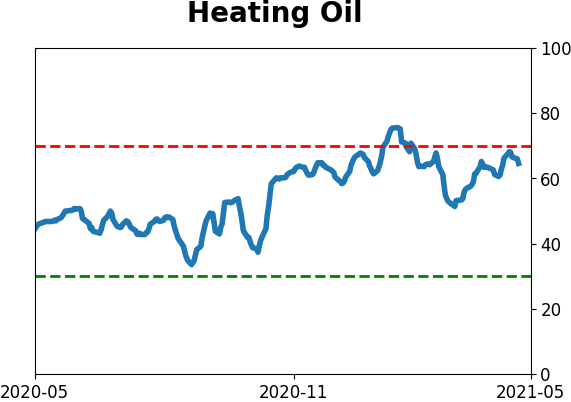
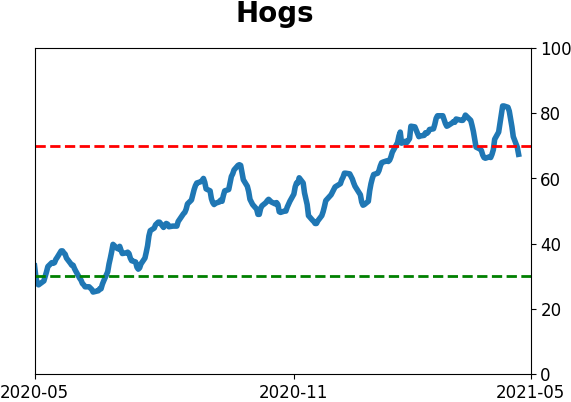
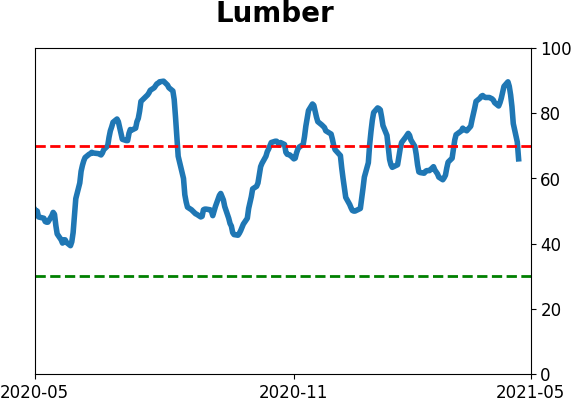
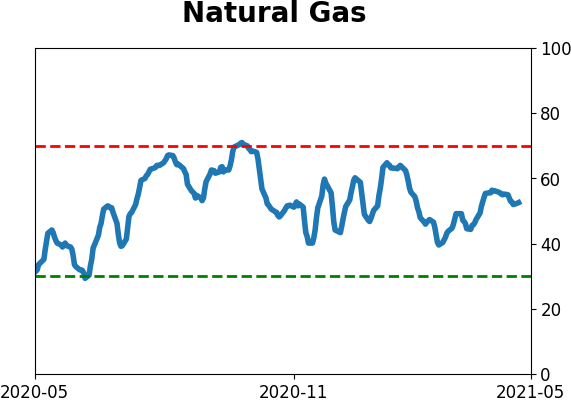
Commodity ETF's - 5-Day Moving Average
|
|