Headlines
|
|
Small options traders establish record bullish bets:
Last week, the smallest of options traders decided to become very aggressive with bets on a further market rally. To a record degree, they positioned themselves for higher prices by buying calls and selling puts, much more than selling calls and buying puts.
Bullish percent index shows growing sell signals:
In April, there was a surge in buy signals in point & figure charts among stocks in the S&P 500. In the broader NYSE, though, there has been significant deterioration and now fewer than 40% of securities are on buy signals. The recent jump in stocks will reverse some of that damage, but it's enough to detract a bit from April's buy signals.
A true trend day: Stocks rocketed right from the open and didn't give much back. The NYSE TICK hit a record high, meaning the most-ever stocks trading on an uptick minus those on a downtick. And it never fell below -500 at any point during the day (using Bloomberg data). Of the few other times that buyers were this persistent, the S&P fell back over the next 2-4 weeks each time, but of course, the sample size is tiny. The dates were 2001-01-03, 2001-12-21, 2003-07-02, and 2020-05-08. Relaxing the parameters some saw less of a downside edge over the next couple of weeks, so it was not very robust.
|
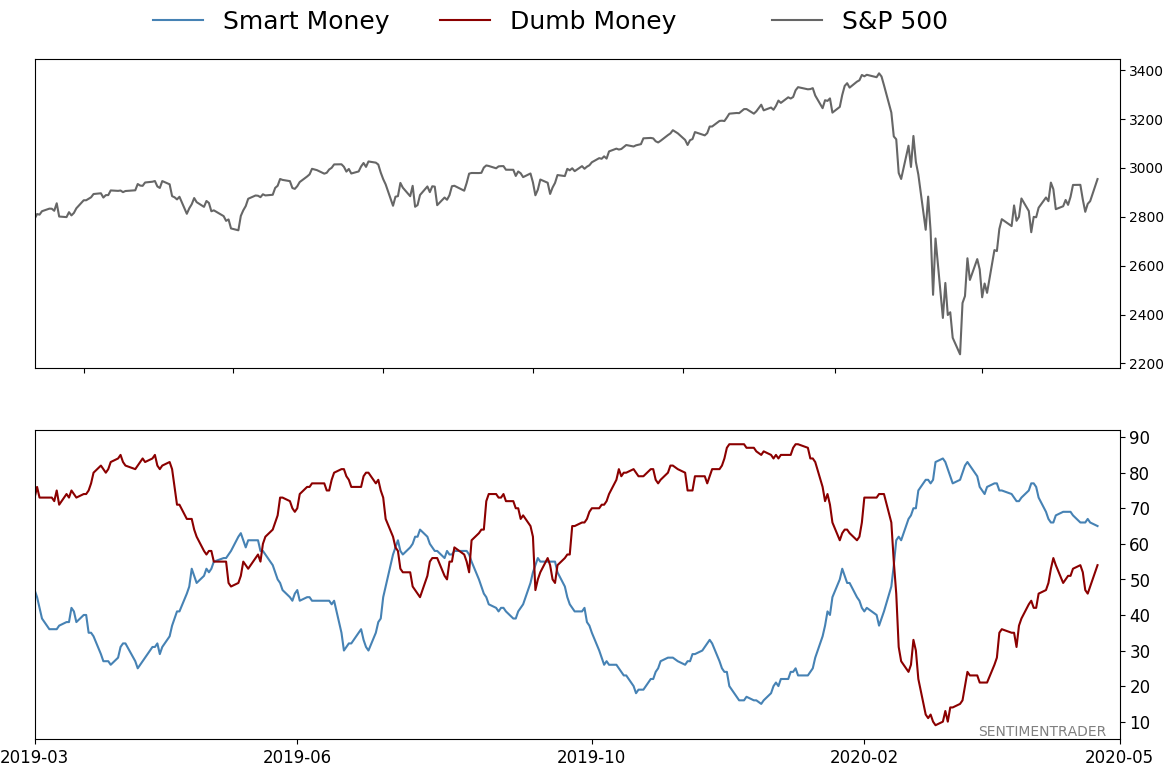
Smart / Dumb Money Confidence
|
Smart Money Confidence: 65%
Dumb Money Confidence: 54%
|
|
Risk Levels
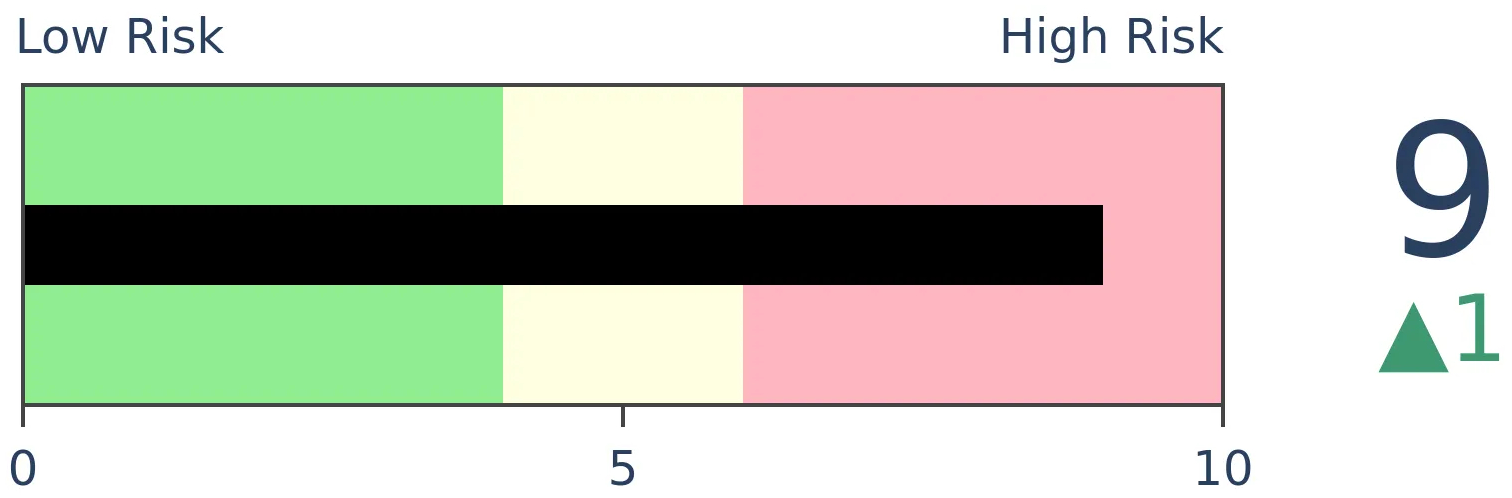
Stocks Short-Term
|
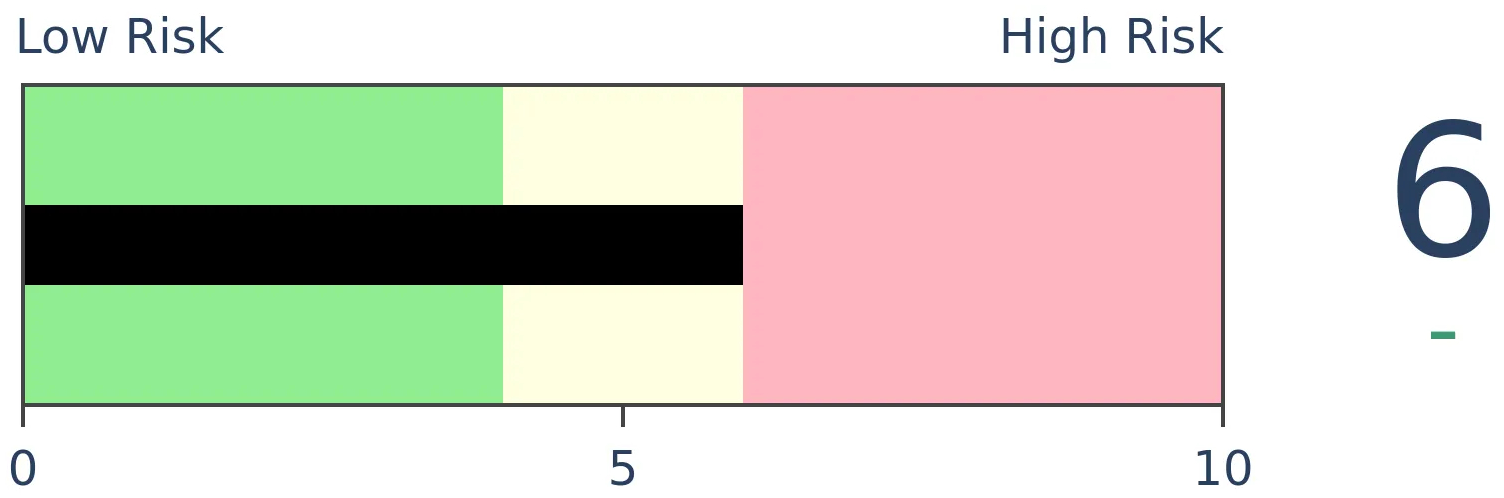
Stocks Medium-Term
|
|
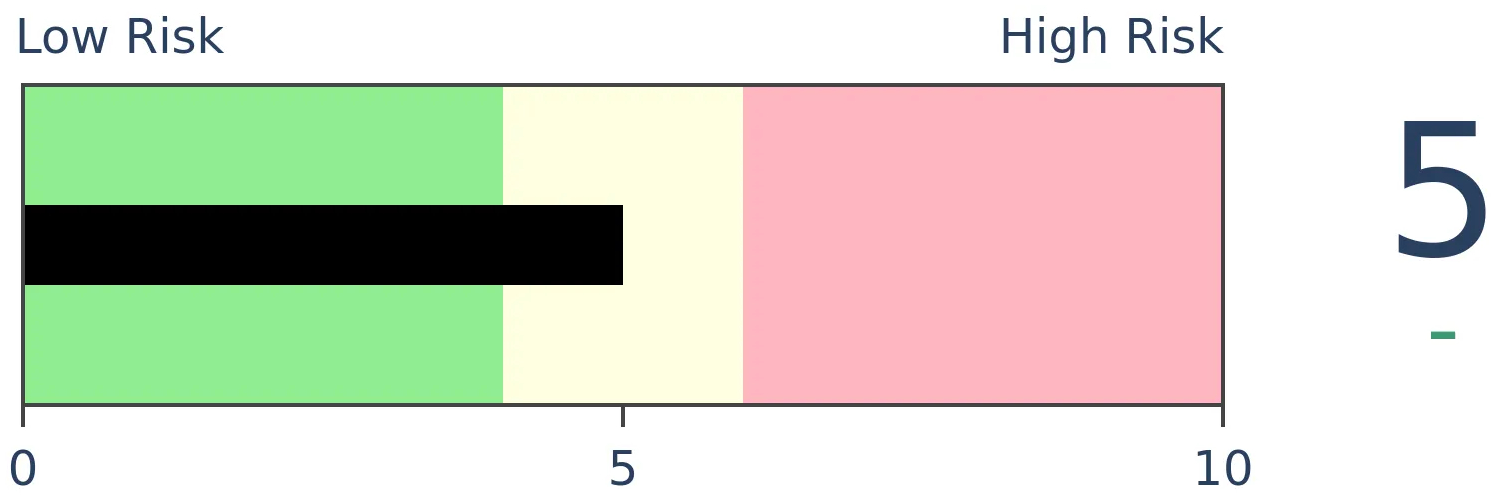
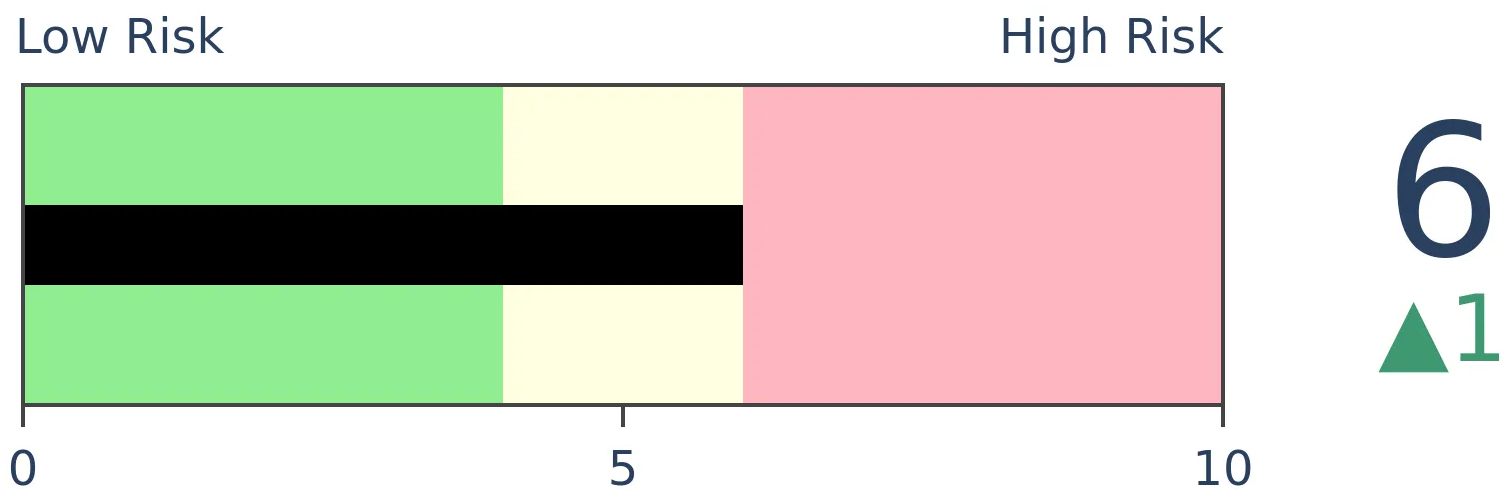
Bonds
|
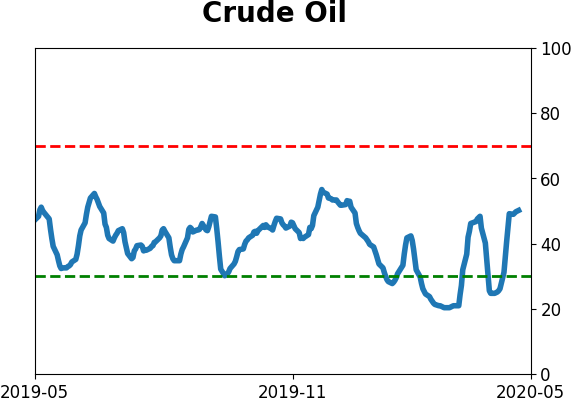
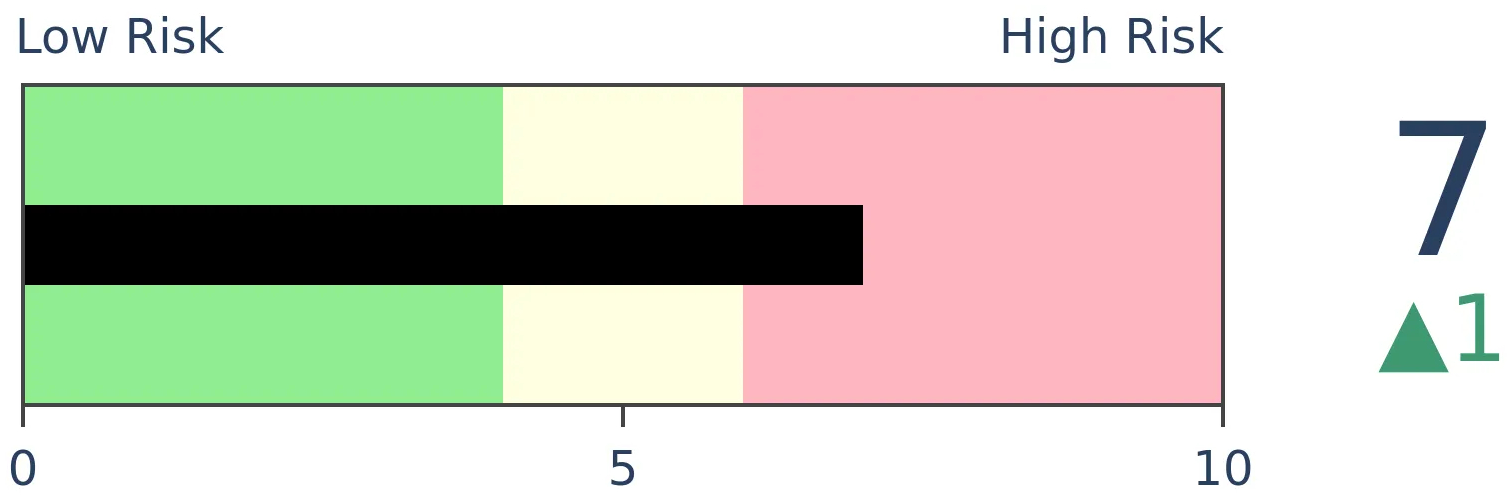
Crude Oil
|
|
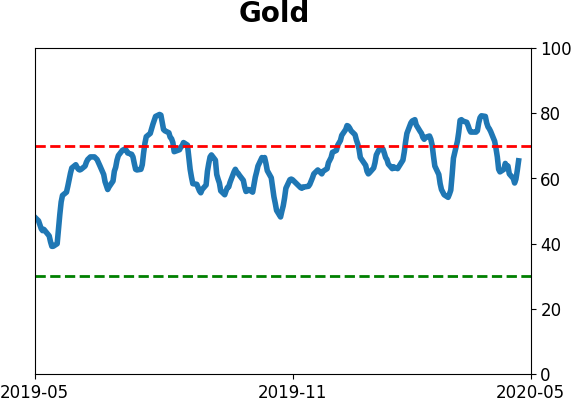
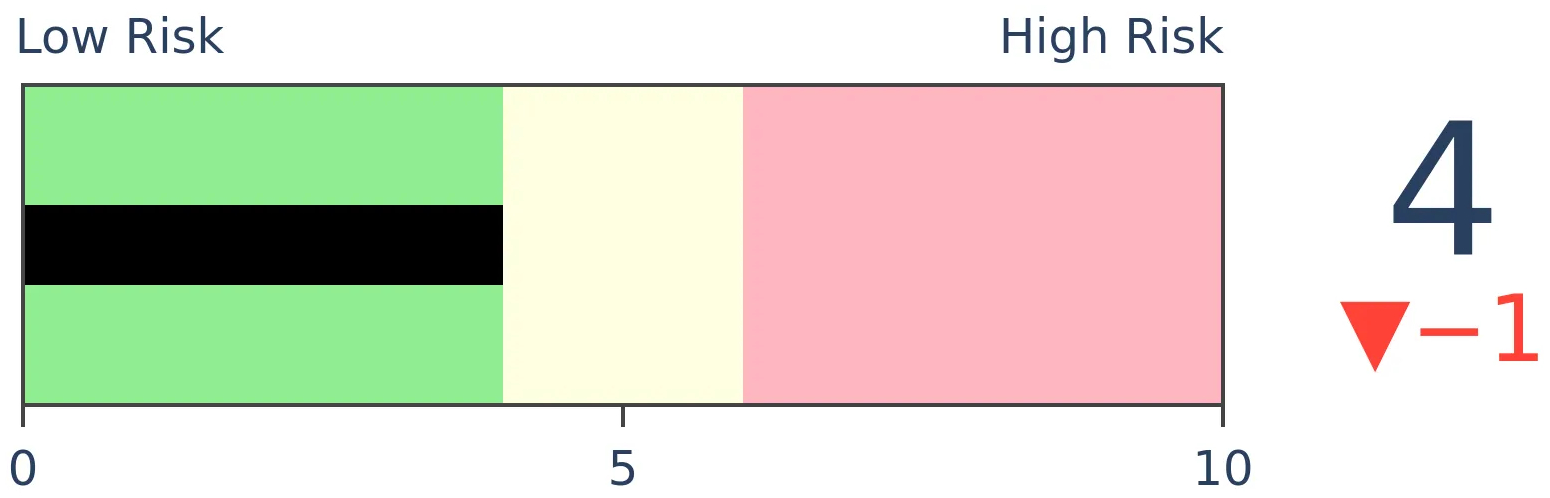
Gold
|
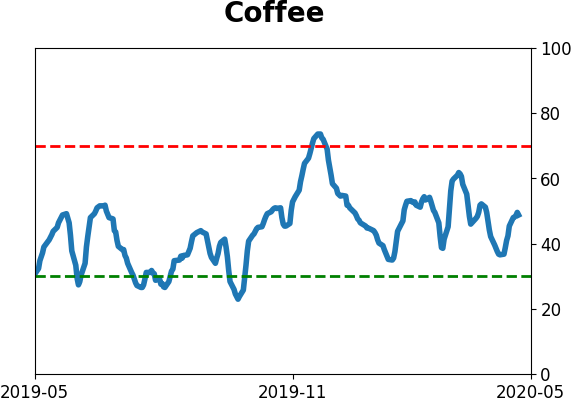
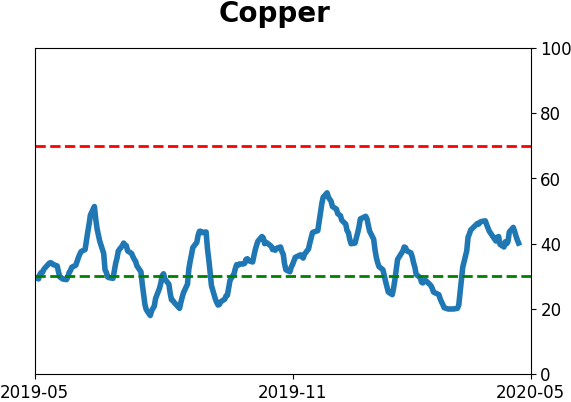
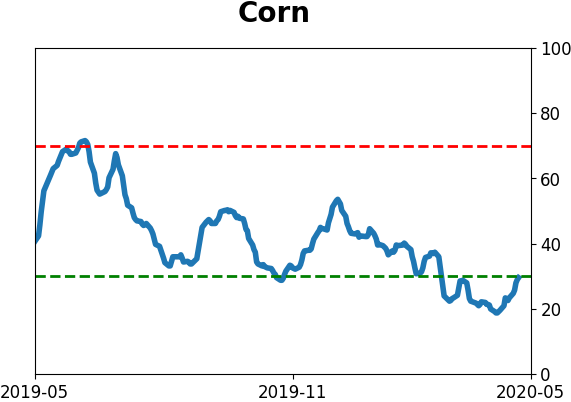
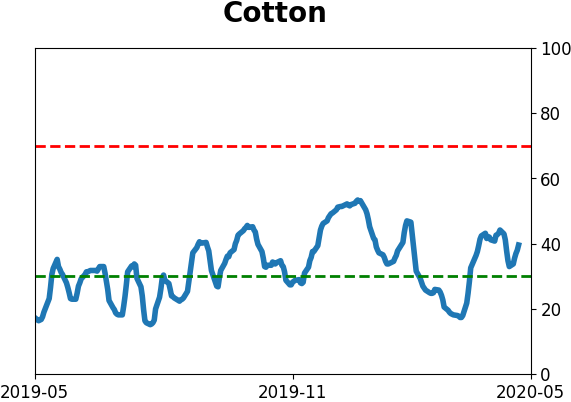
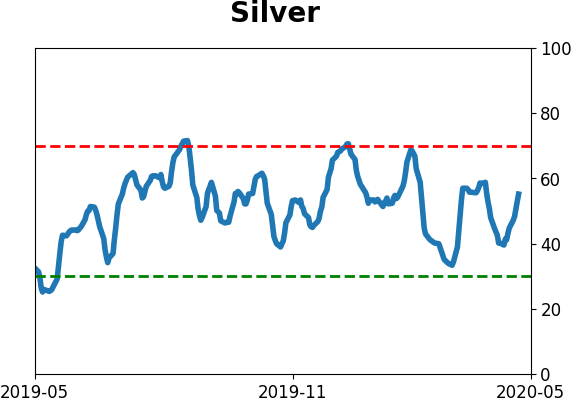
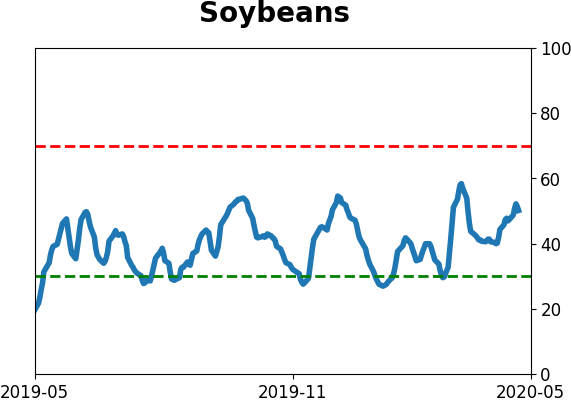
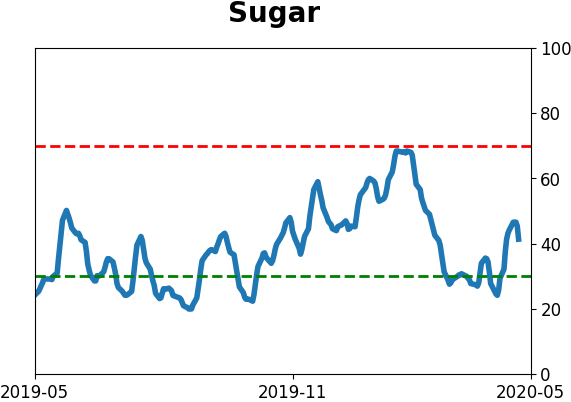
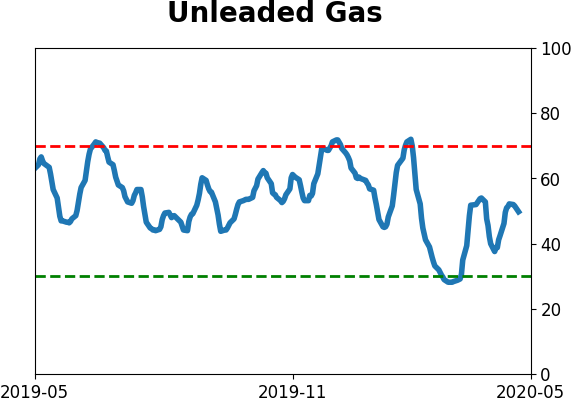
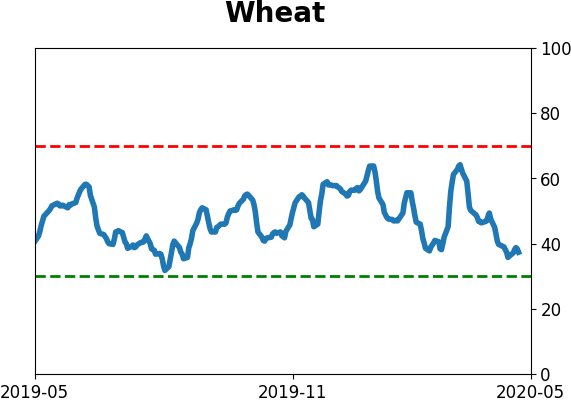
Agriculture
|
|
Research
BOTTOM LINE
Last week, the smallest of options traders decided to become very aggressive with bets on a further market rally. To a record degree, they positioned themselves for higher prices by buying calls and selling puts, much more than selling calls and buying puts.
FORECAST / TIMEFRAME
None
|
We've been noting in recent weeks that many sentiment indicators are mixed after recovering from extreme pessimism off the March low and the subsequent chop in prices.
The rally has been extremely front-end loaded, with a handful of stocks driving the rally. The lack of continued participation among many stocks has helped some longer-term measures, including surveys like AAII, remain in pessimistic territory. Others, usually shorter-term, are showing more optimism.
As a result, aggregate models like Dumb Money Confidence are stuck in neutral.
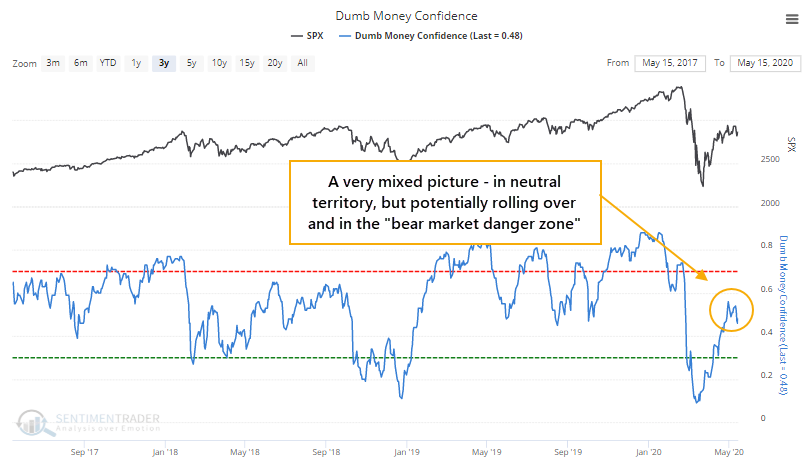
Sentiment is most reliable at extremes, and there is no clear one at the moment. It can also be used in a trend-following way, as we typically want to side with whichever way sentiment is heading. The tricky part about that now is sentiment is around the general level that often precedes trouble during bear markets. Maybe we're in a new bull market, but that isn't clear, either.
Another issue is just how extreme some of the shorter-term indicators are. When we look at a group of traders who tend to be wrong at emotional extremes, the warning sign is clear.
Last week, the smallest of options traders, those with trades for 10 contracts or fewer at a time, opened a new record of net bullish positions.
- Bullish options positions: Buying calls and selling puts to open
- Bearish options positions: Selling calls and buying puts to open
When we net out the bullish and bearish positions, we can see those small traders set a new record last week. There is no data we follow that is more worrying than this.
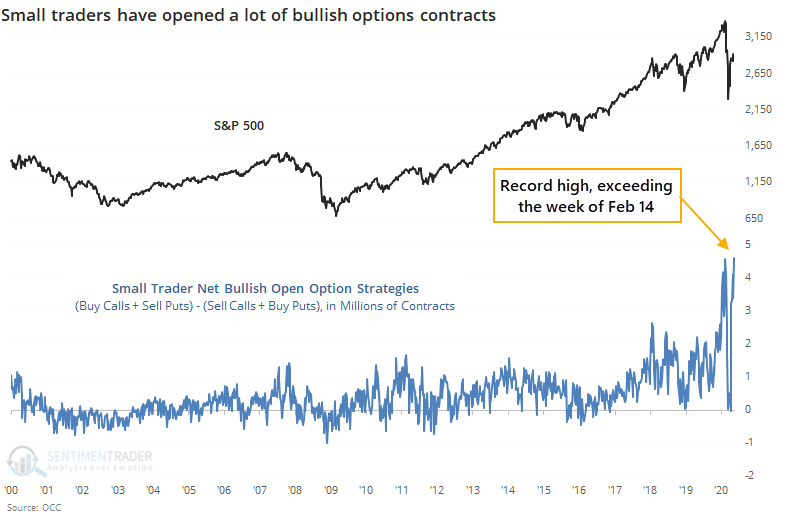
The prior record was February 14, about the peak of the bull market. There have been some very wide swings in 2020 as volume exploded, and a relatively high spread in 2014 (compared to prior years) didn't lead to anything more than a few weeks of choppiness, but big extremes in this data have consistently led to poor market returns.
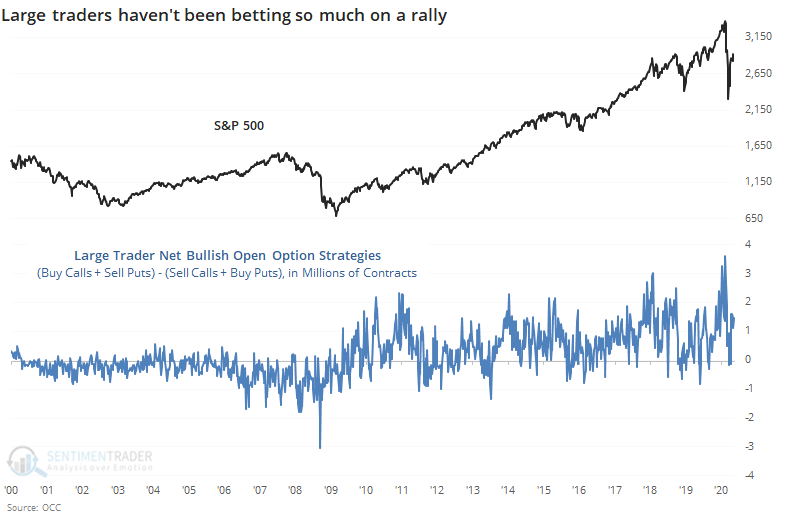
At the same time, very large traders, those with trades of 50 or more contracts at a time, are more subdued.
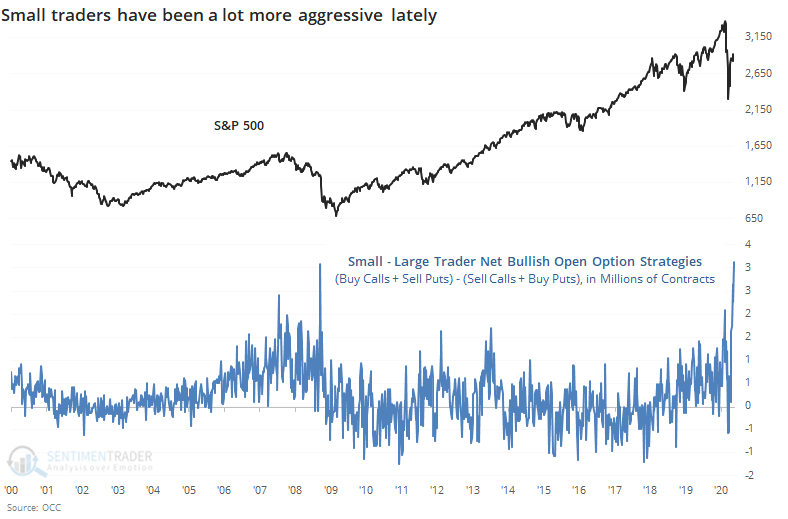
That means the spread between small trader and large trader net bullish positions has also hit a record high. It has soared over the last couple of weeks like it did in 2008.
In terms of actual money at risk, small traders established more than $1.5 billion of net bullish strategies more than large traders last week. That's off the record high but still extremely large.
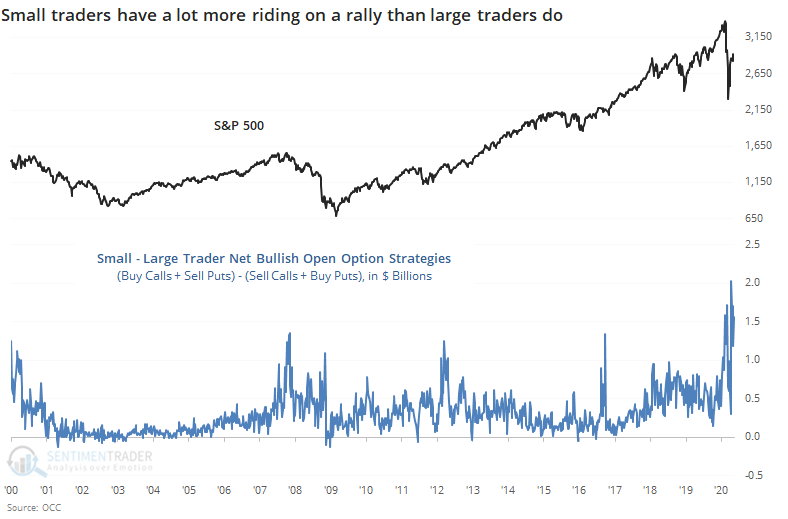
With many indicators, we can only infer who's sentiment is being reflected, and what they might be doing about it. With options data, we have a much better idea of who is doing exactly what, and with real money. That's why we tend to give them more weight when they reach a compelling extreme.
Because of that, the data from last week is disturbing, because it clearly shows that the smallest of traders, who tend to be the most consistently ill-positioned at extremes, have gone aggressively long, in a leveraged fashion. This has a strong tendency to lead to lower prices over the short- to medium-term.
BOTTOM LINE
In April, there was a surge in buy signals in point & figure charts among stocks in the S&P 500. In the broader NYSE, though, there has been significant deterioration and now fewer than 40% of securities are on buy signals. The recent jump in stocks will reverse some of that damage, but it's enough to detract a bit from April's buy signals.
FORECAST / TIMEFRAME
None
|
A little over a month ago, we saw that a somewhat obscure technical measure of the market's health had generated an overwhelming number of buy signals. According to a weekend post by Art Hogan, that has since pulled back significantly and suggests some trouble under the surface. Monday's surge will reverse some of that, but it doesn't change the fact that it had eroded significantly already.
When we've seen a huge number of buy signals from the Bullish Percent Index (BPI) before, it equated with major lows. The biggest caveats were that the sample size was tiny, and wasn't very robust - relaxing the parameters a little gave us more signals, but they weren't very impressive.
If we branch out from the S&P 500 and look at the percentage of securities on the whole NYSE that are currently on buy signals, then it has similarly collapsed, going from above 70% a few weeks ago to less than 40% as of Friday.
When we've seen this kind of cycle before, it preceded mixed returns over the medium-term.
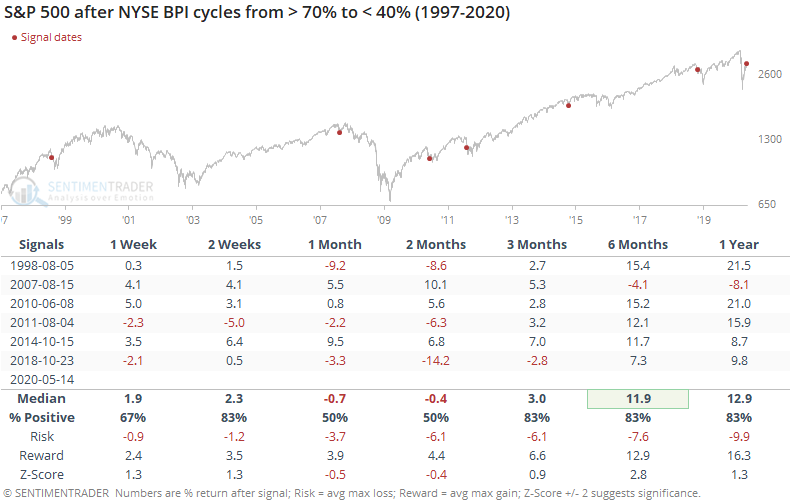
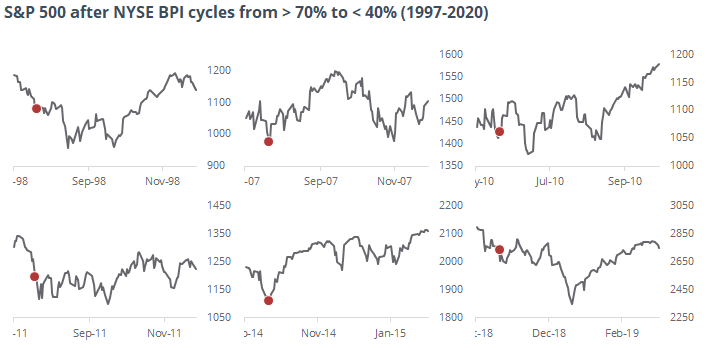
There were two times when stocks bottomed almost immediately and showed excellent gains over the next couple of months, in August 2007 and October 2014. The former soon petered, though, and rolled over into the financial crisis. The latter took a lot longer, but also gave back its gains.
Below, we can see that generally, the S&P 500's price action was choppy at best.
We don't follow the BPI on the site, but Mr. Hogan's post generated quite a few questions, and it was worth following up on the post from April. There isn't enough there to consider it a negative in the Active Studies, but it is a minor suggestion that the positive thrust from March and April has run into some issues and isn't quite as positive as it suggested a six weeks ago, even with some positive price action in recent days.
Active Studies
| Time Frame | Bullish | Bearish | | Short-Term | 0 | 6 | | Medium-Term | 12 | 3 | | Long-Term | 37 | 3 |
|
Indicators at Extremes
Portfolio
| Position | Weight % | Added / Reduced | Date | | Stocks | 38.9 | Reduced 10% | 2020-05-13 | | Bonds | 0.0 | Reduced 6.7% | 2020-02-28 | | Commodities | 5.1 | Added 2.4%
| 2020-02-28 | | Precious Metals | 0.0 | Reduced 3.6% | 2020-02-28 | | Special Situations | 0.0 | Reduced 31.9% | 2020-03-17 | | Cash | 56.0 | | |
|
Updates (Changes made today are underlined)
In the first months of the year, we saw manic trading activity. From big jumps in specific stocks to historic highs in retail trading activity to record highs in household confidence to almost unbelievable confidence among options traders. All of that came amid a market where the average stock couldn't keep up with their indexes. There were signs of waning momentum in stocks underlying the major averages, which started triggering technical warning signs in late January. The kinds of extremes we saw in December and January typically take months to wear away, but the type of selling in March went a long way toward getting there. When we place the kind of moves we saw into March 23 into the context of coming off an all-time high, there has been a high probability of a multi-month rebound. After stocks bottomed on the 23rd, they enjoyed a historic buying thrust and retraced a larger amount of the decline than "just a bear market rally" tends to. While other signs are mixed that panic is subsiding, those thrusts are the most encouraging sign we've seen in years. Shorter-term, there have been some warning signs popping up and our studies have stopped showing as positively skewed returns. I reduced my exposure some in late April and was looking for a pattern of lower highs and lower lows to reduce it further. With weakness on May 12, our studies turned even more negative over the short- to medium-term so I reduced a bit more. Some short-term indicators are already nearing oversold so we may get a quick rebound but it is what it is. If we see a clear pattern of lower lows, I may reduce even further in the week(s) ahead. Long-term prospects look decent because of the thrusts we saw off the low, but I'm more comfortable in cash in the interim. I'd consider adding back if we see our indicators and studies start to skew to the upside again, or if price action turns clearly better, indicating my caution is wrong.
RETURN YTD: -7.9% 2019: 12.6%, 2018: 0.6%, 2017: 3.8%, 2016: 17.1%, 2015: 9.2%, 2014: 14.5%, 2013: 2.2%, 2012: 10.8%, 2011: 16.5%, 2010: 15.3%, 2009: 23.9%, 2008: 16.2%, 2007: 7.8%
|
|
Phase Table
Ranks
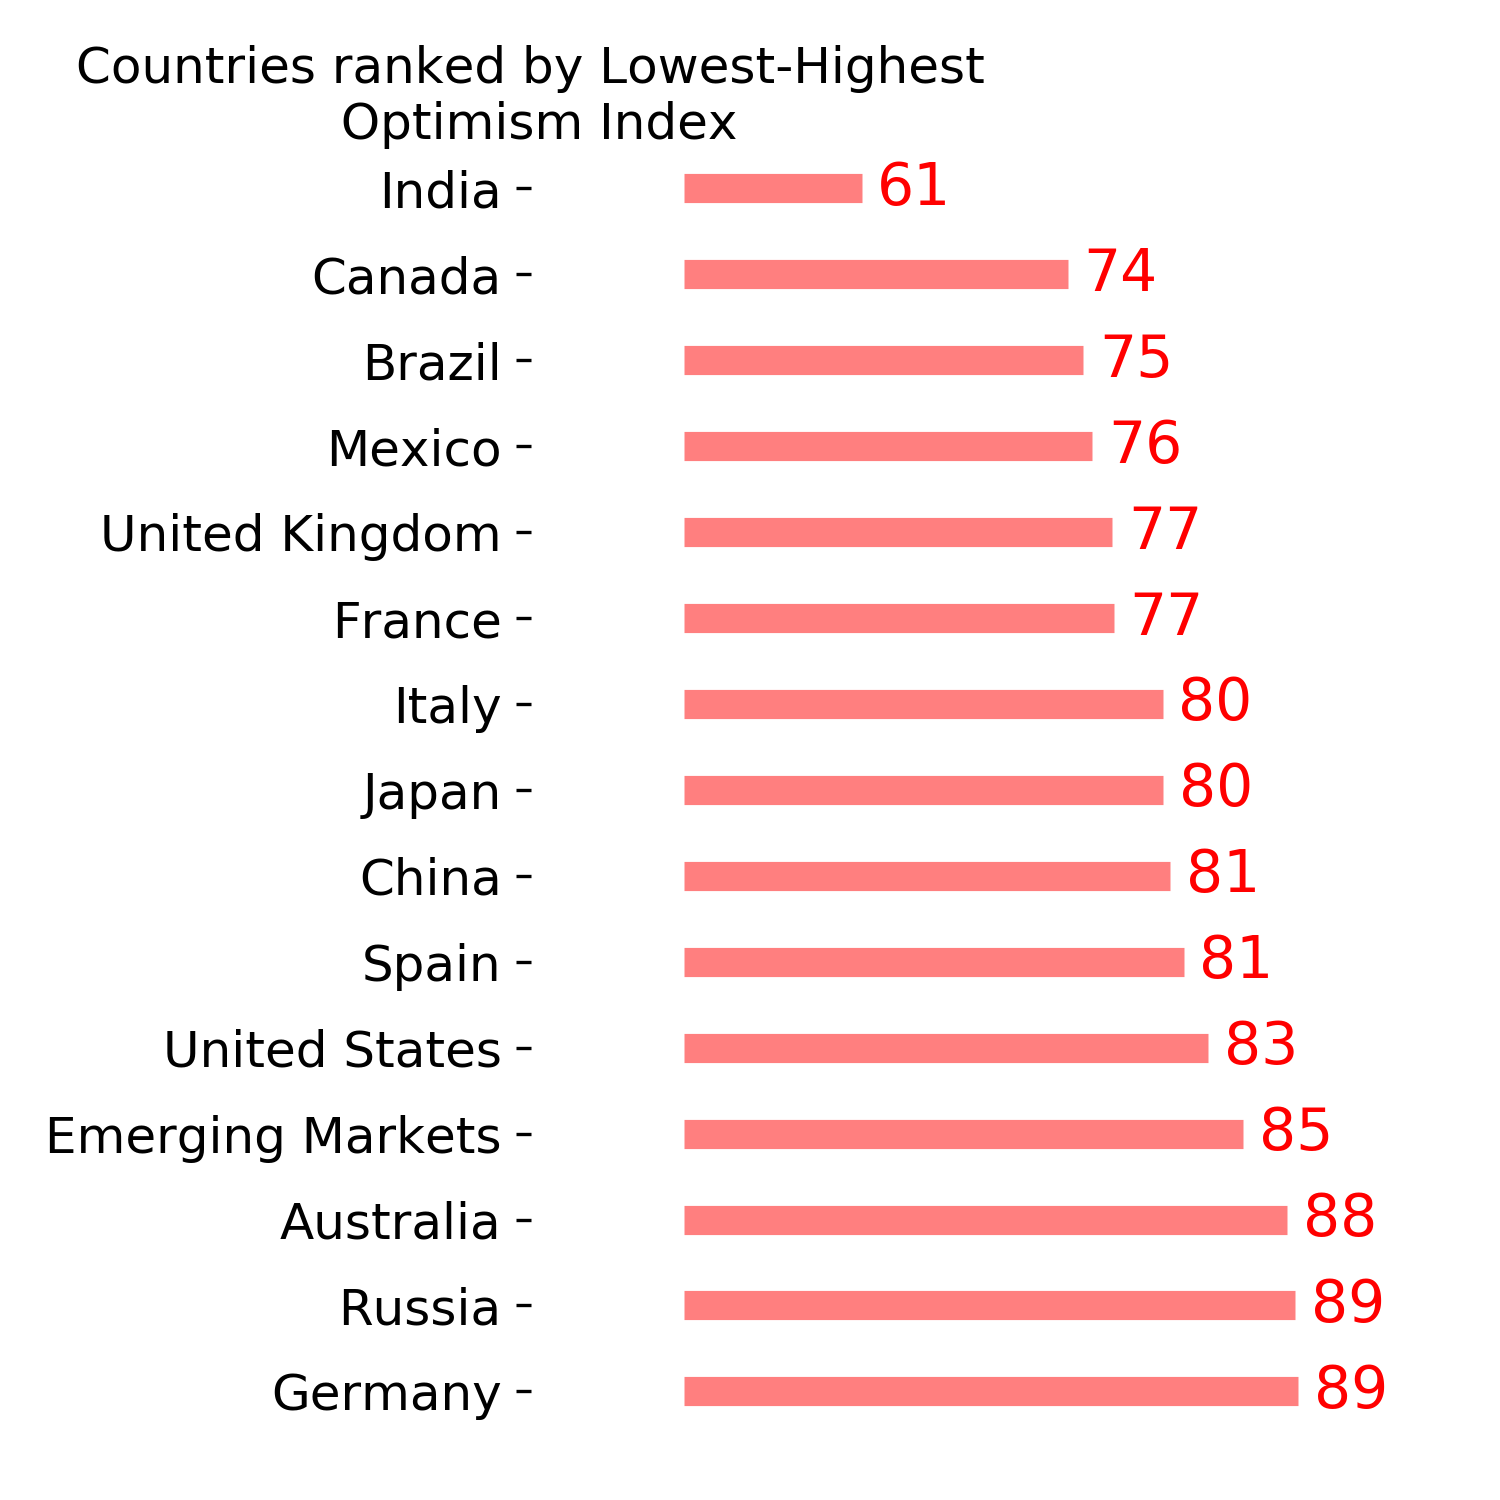
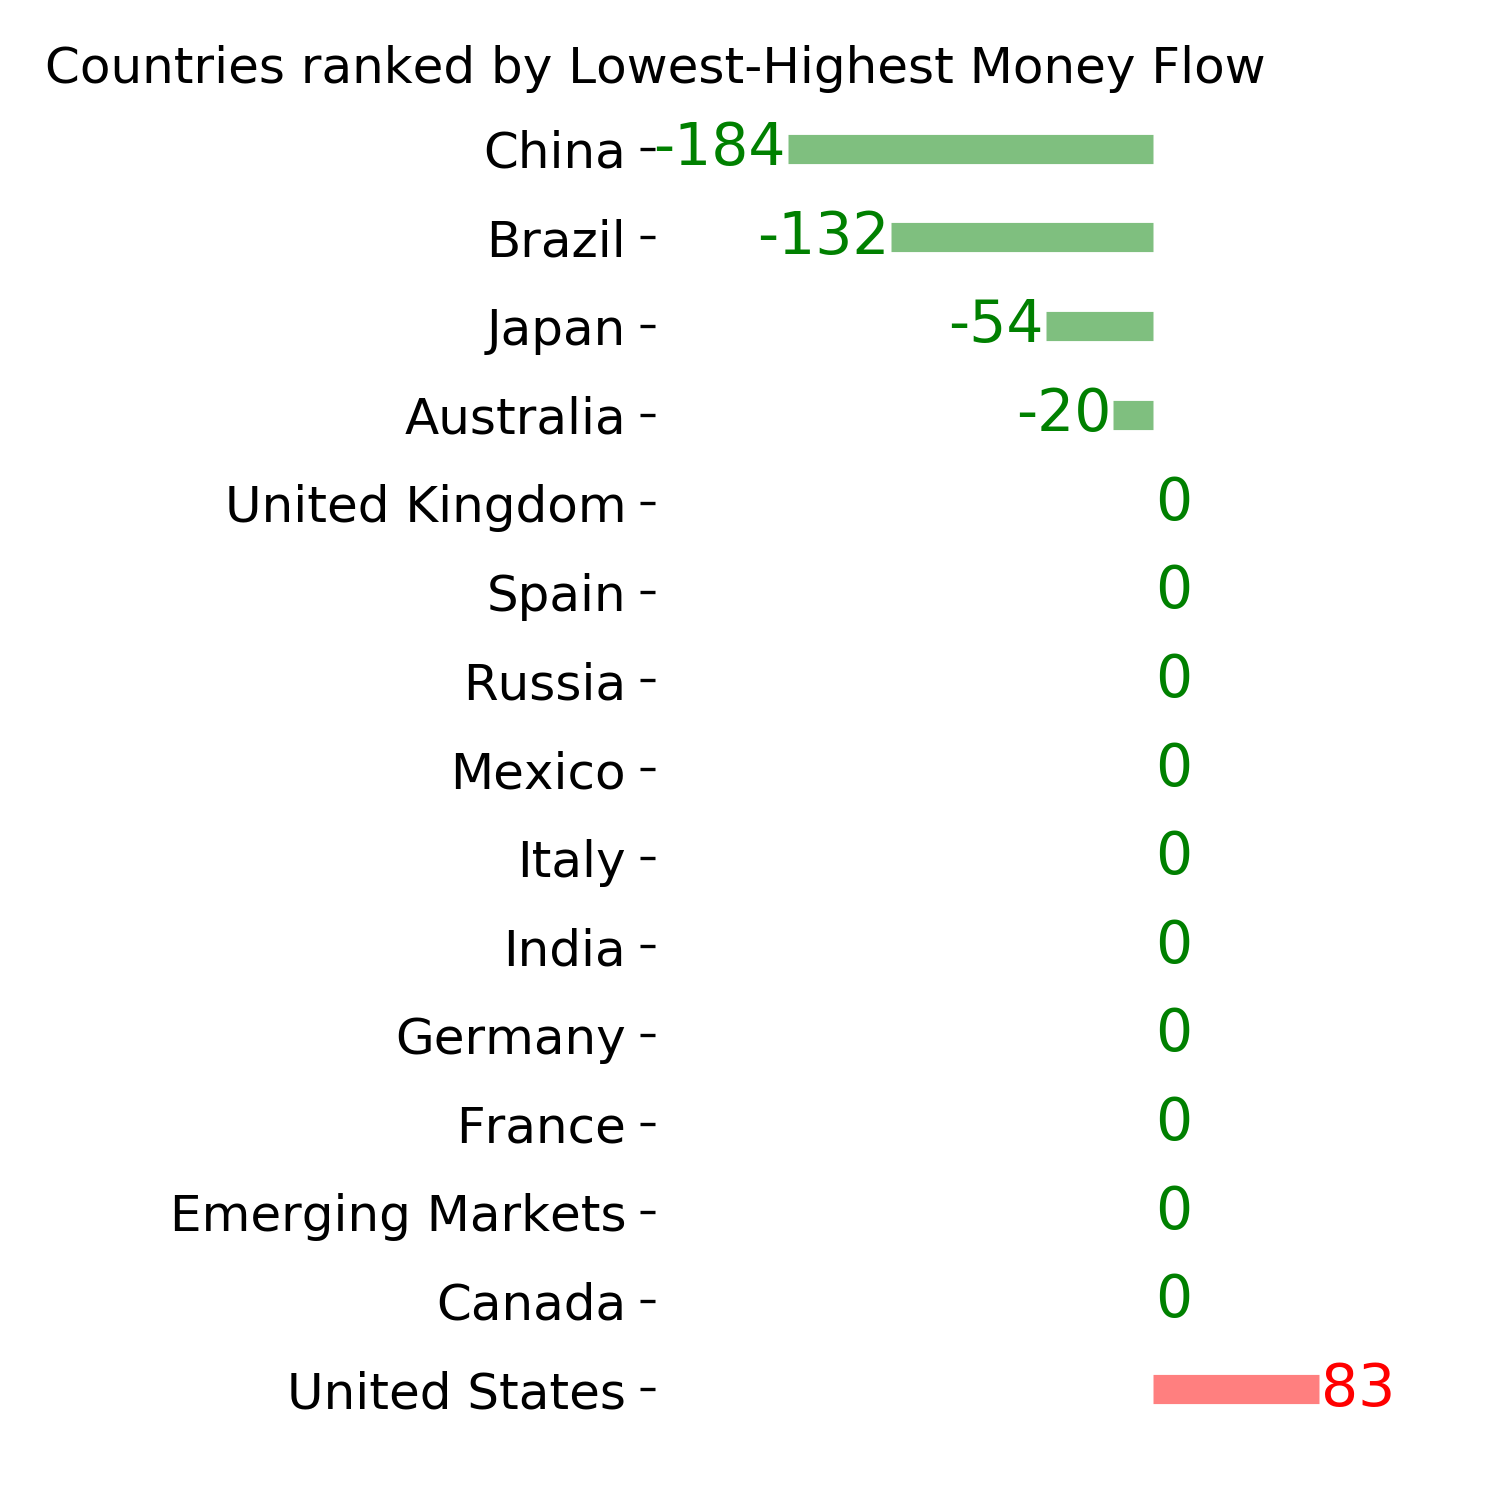
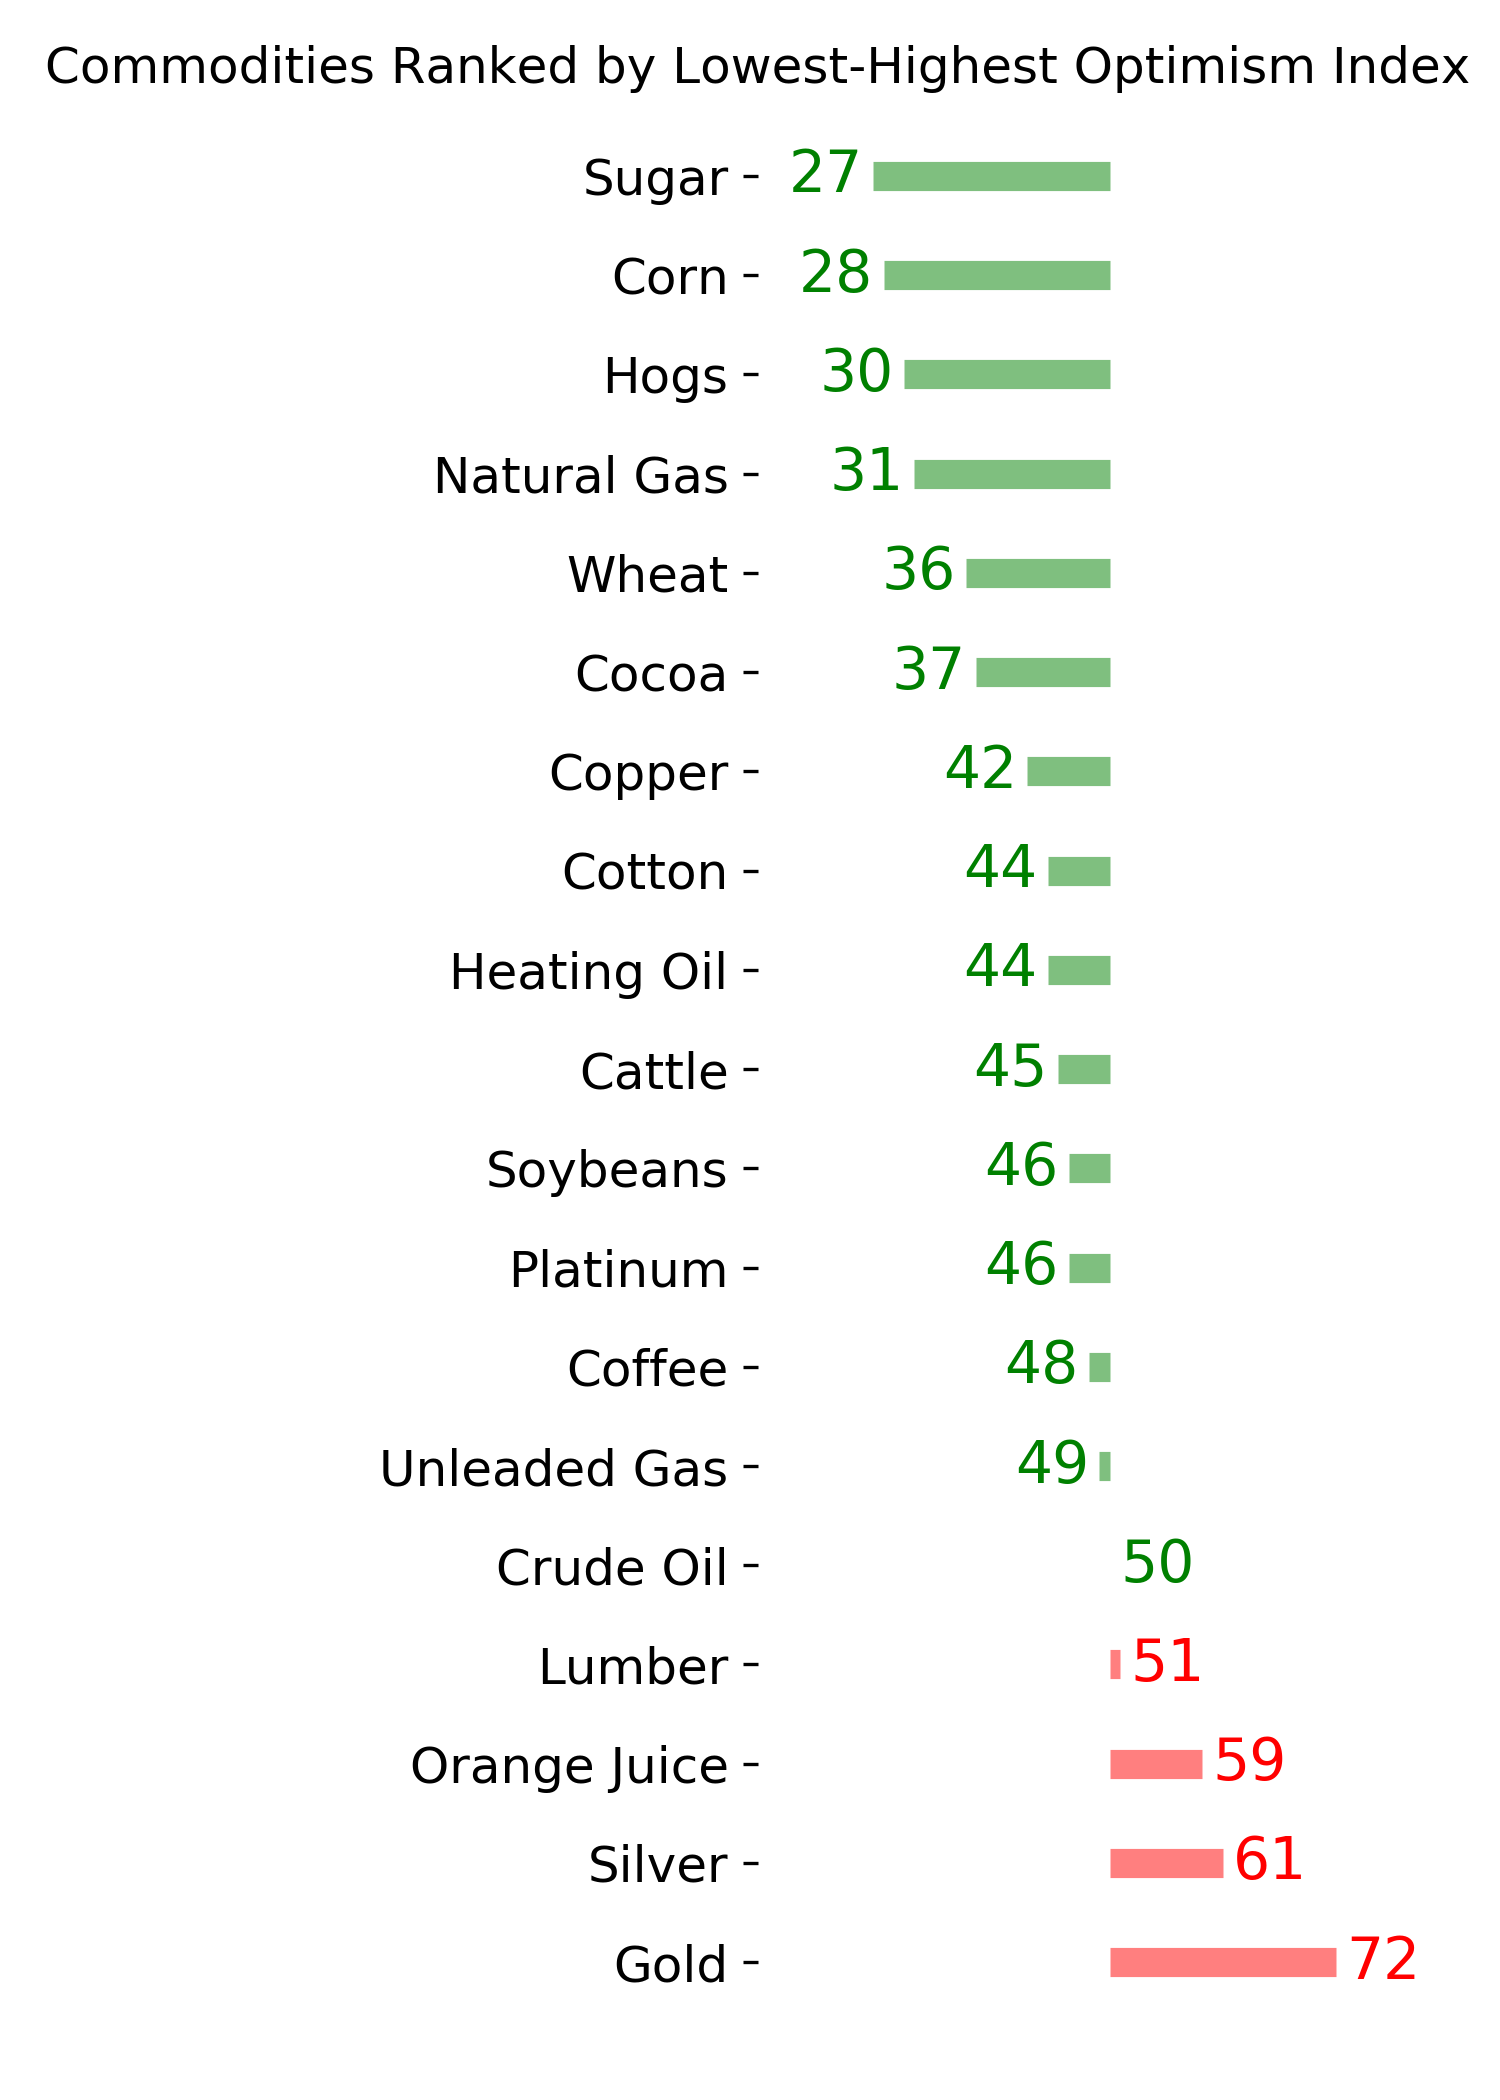
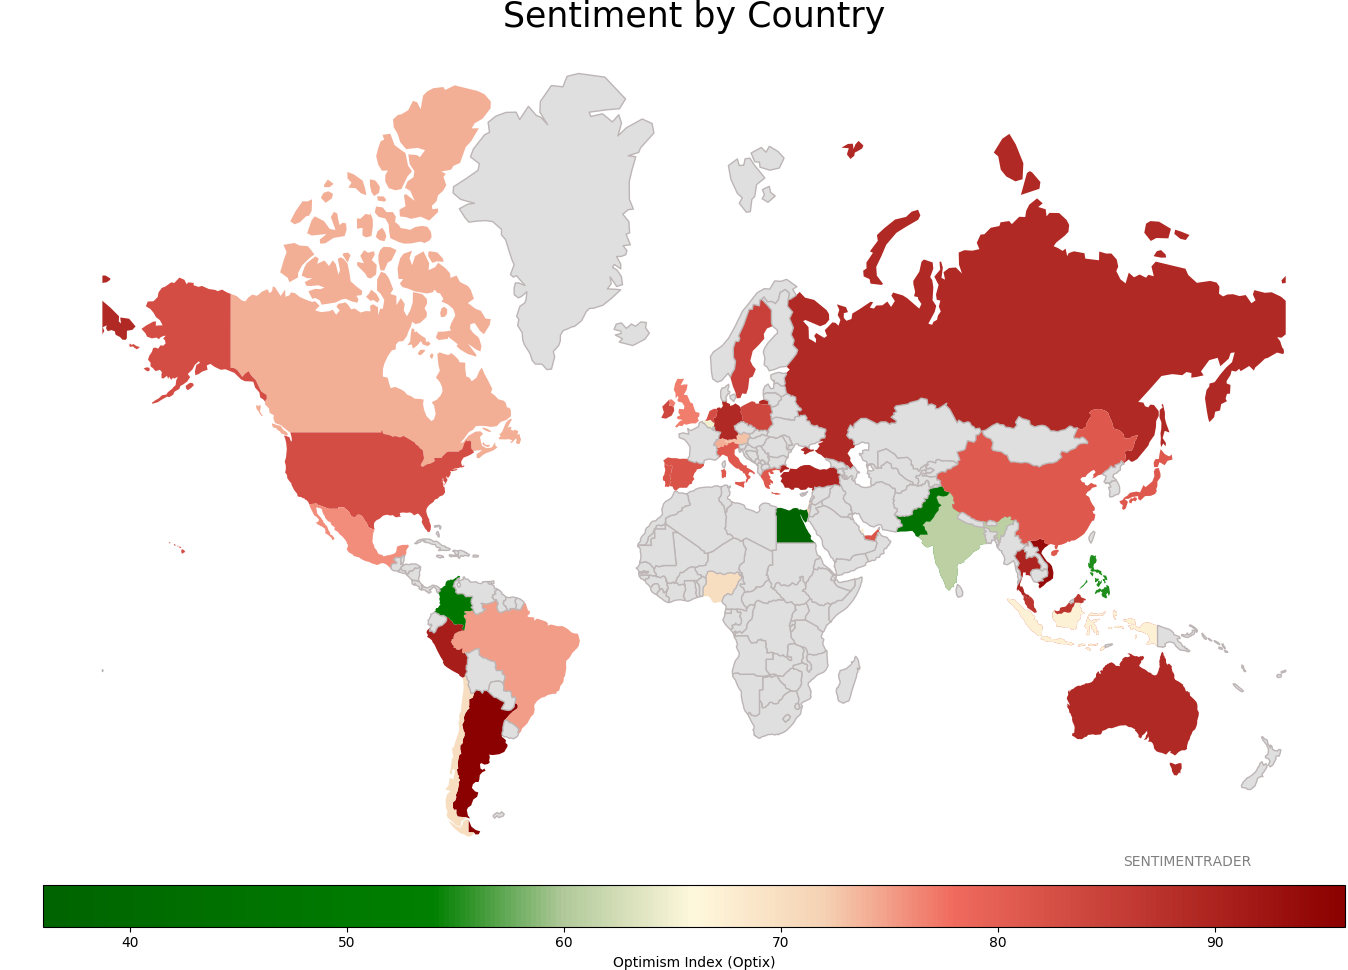
Sentiment Around The World
Optimism Index Thumbnails
|
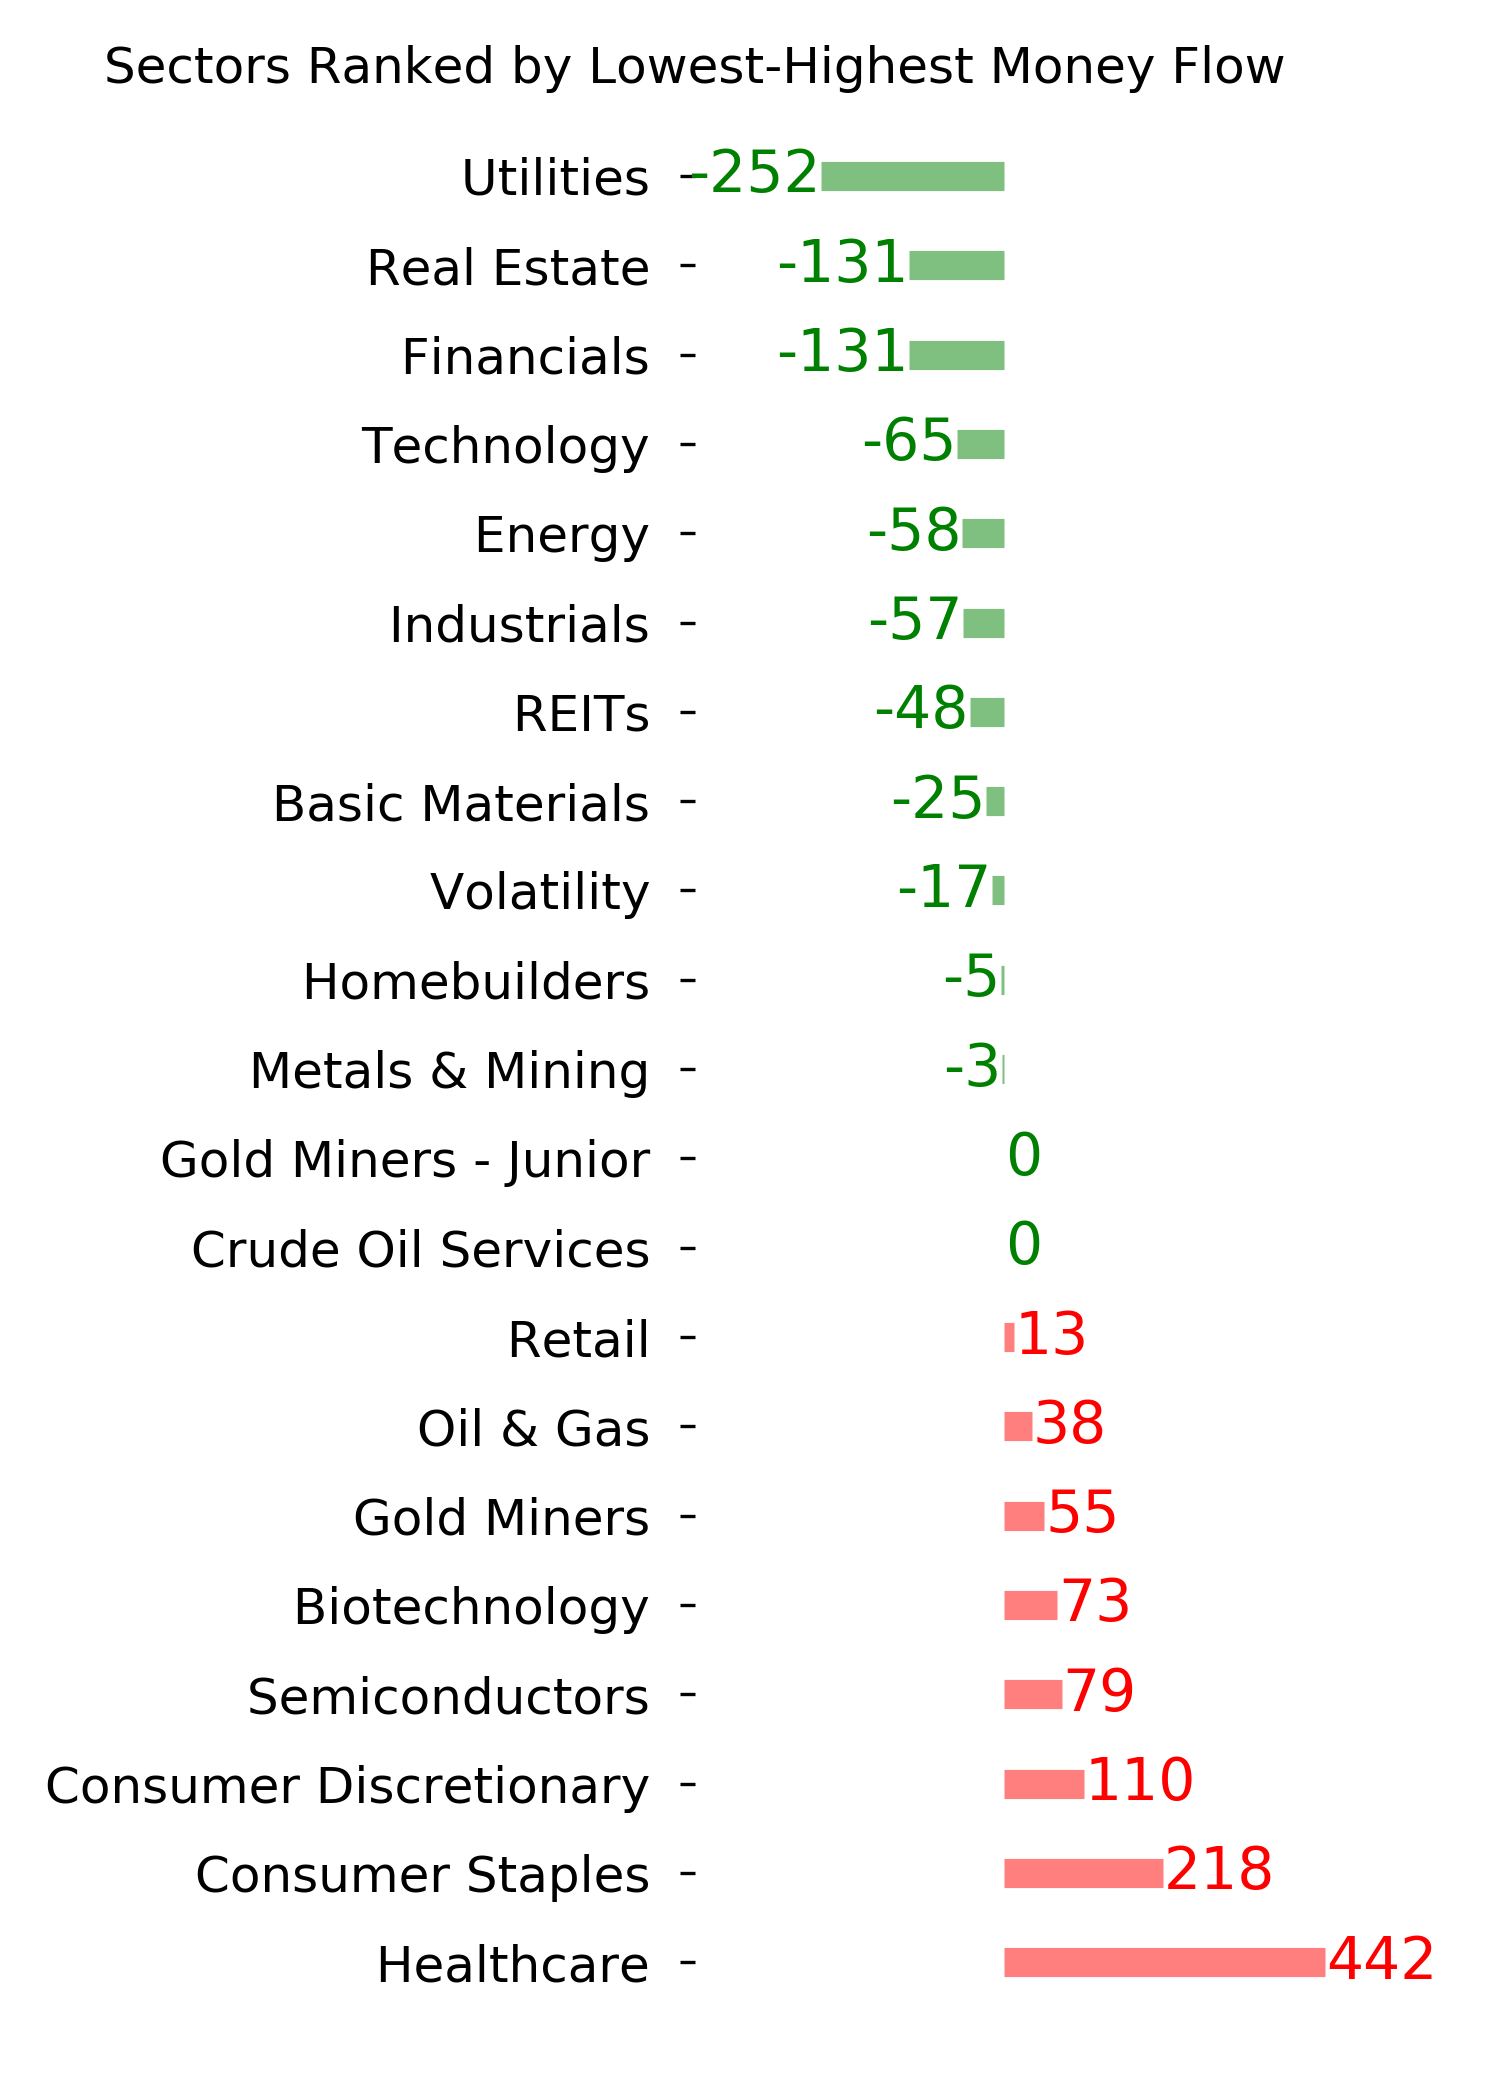
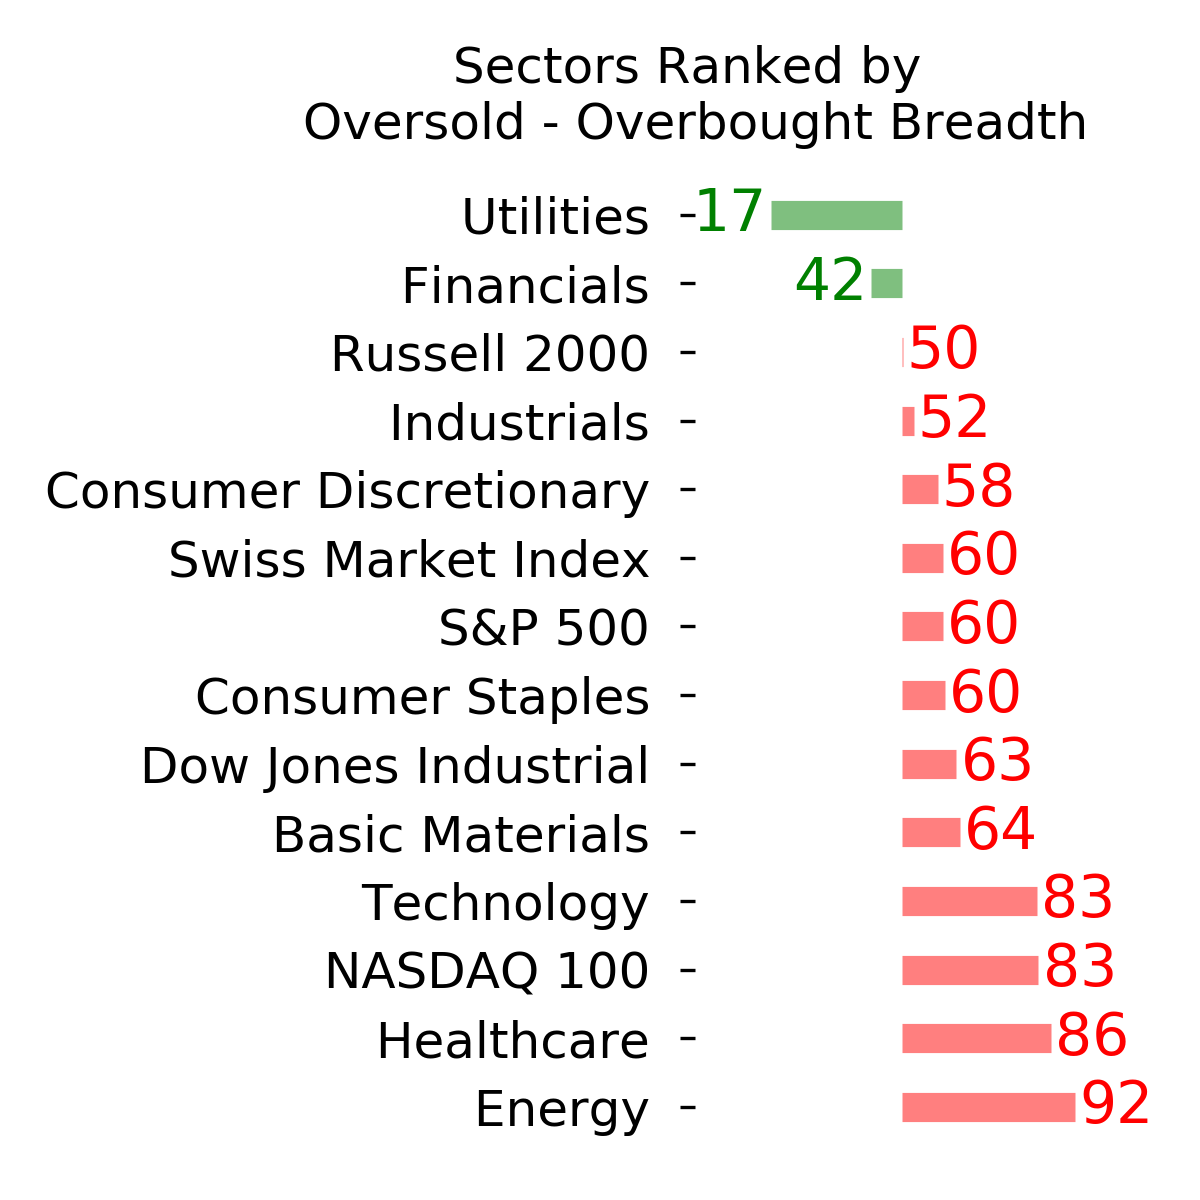
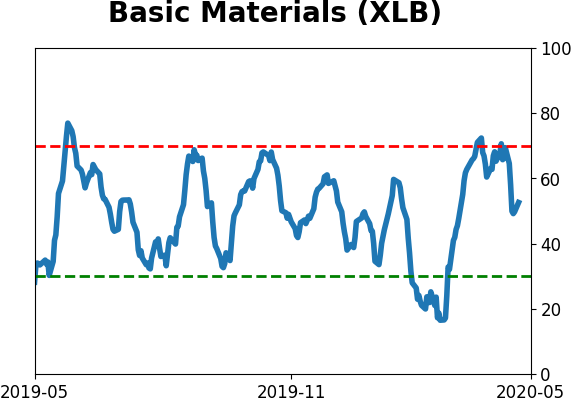
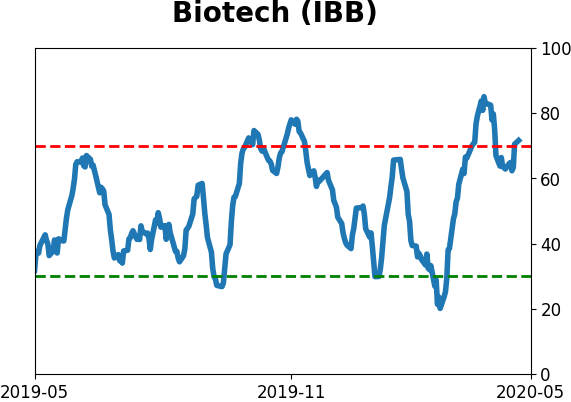
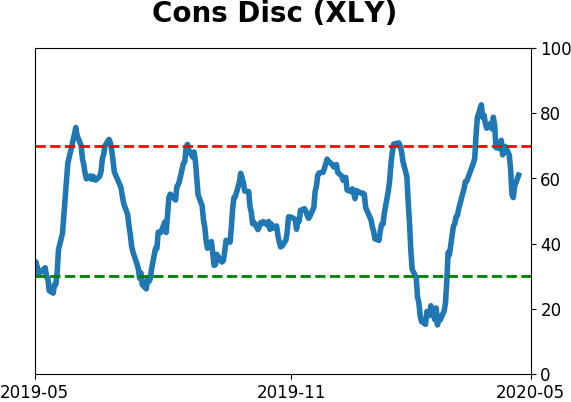
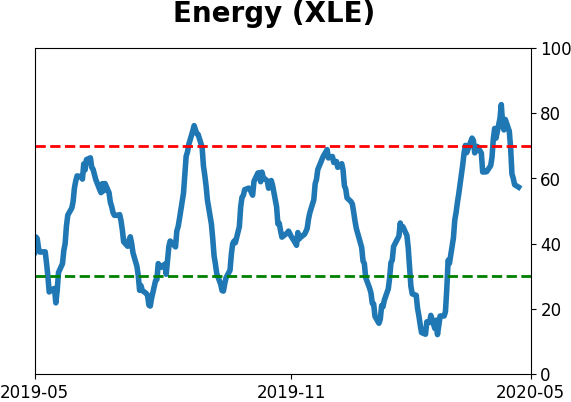
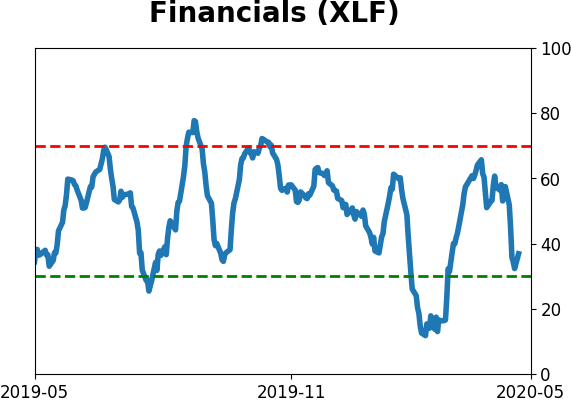
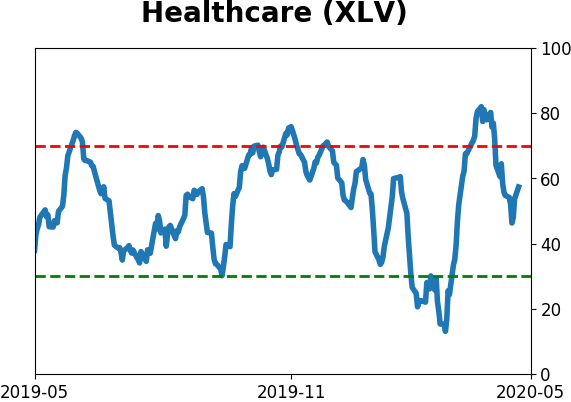
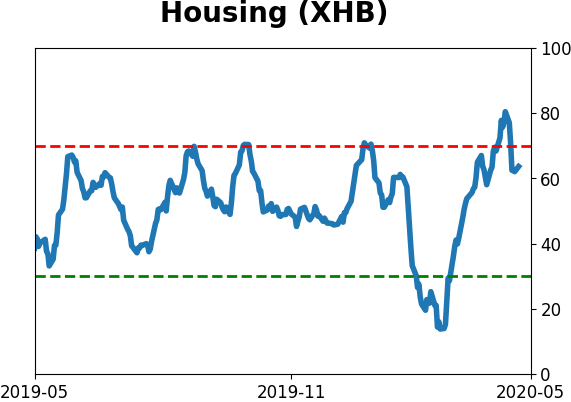
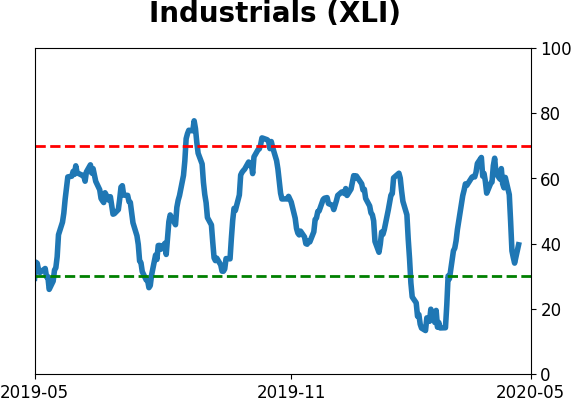
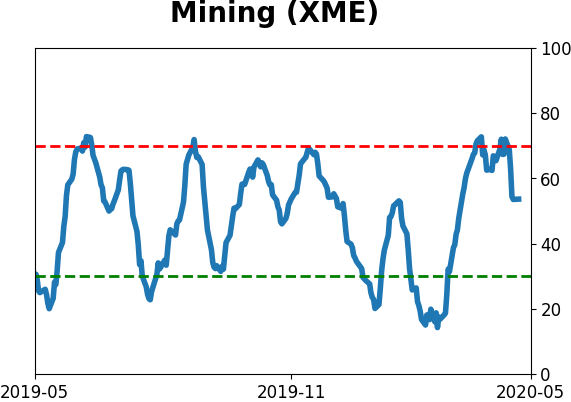
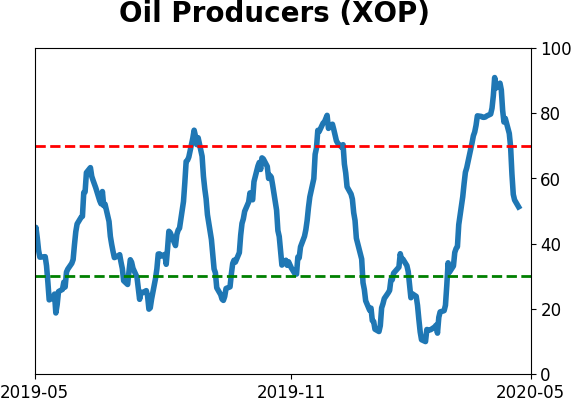
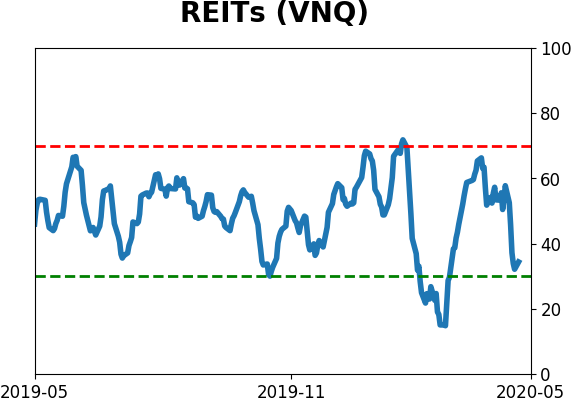
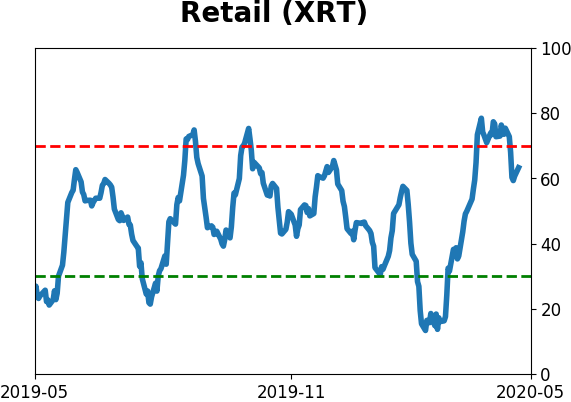
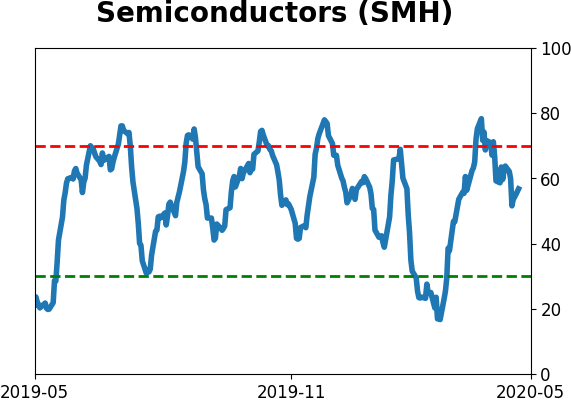
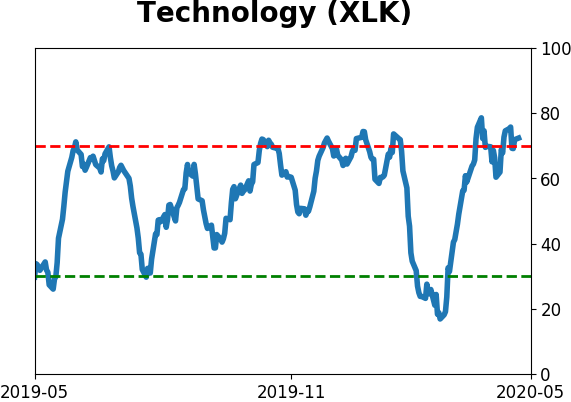
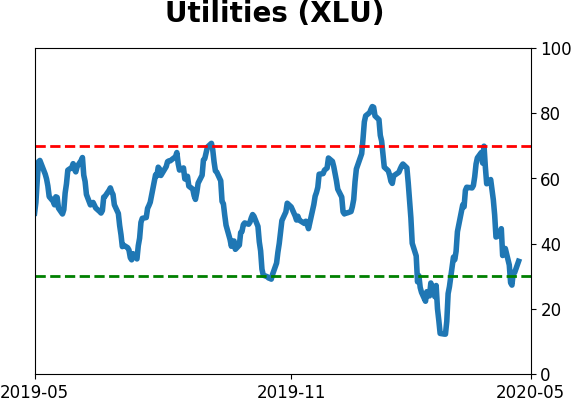
Sector ETF's - 10-Day Moving Average
|
|
|
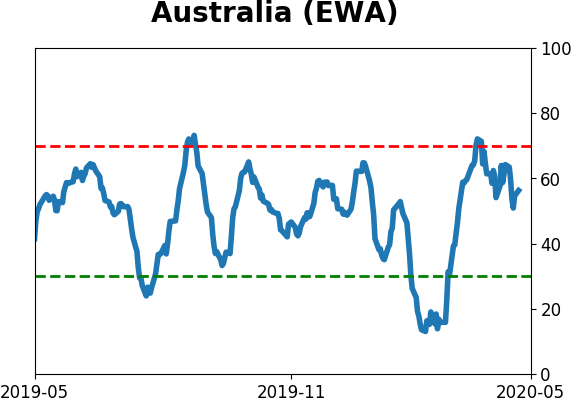
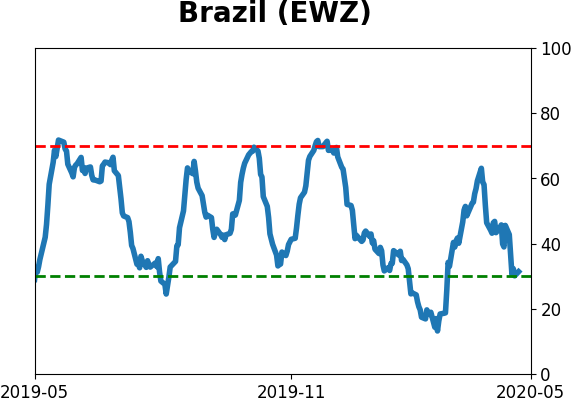
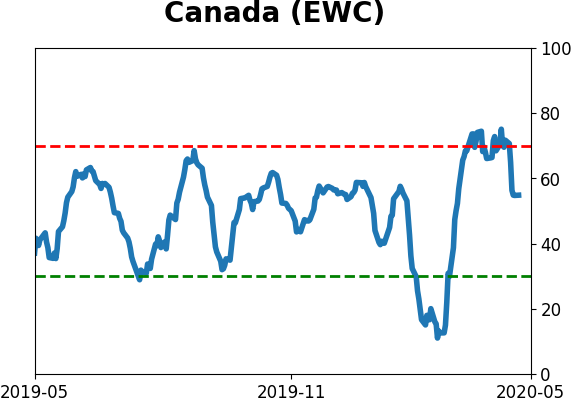
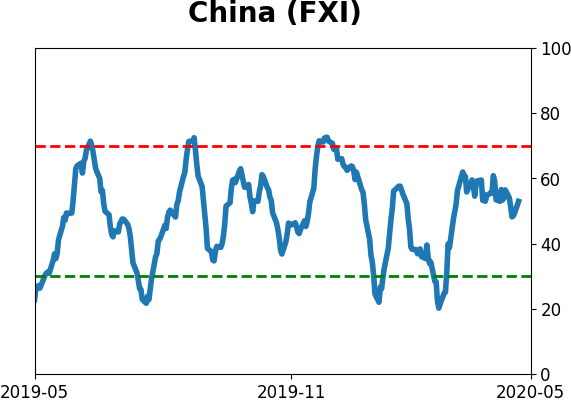
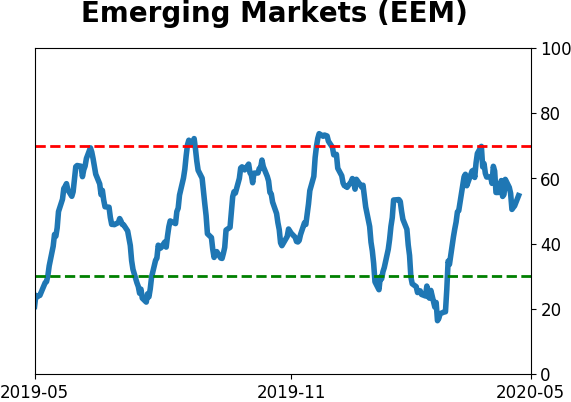
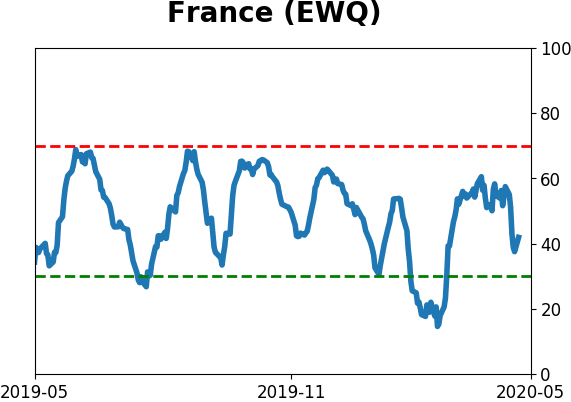
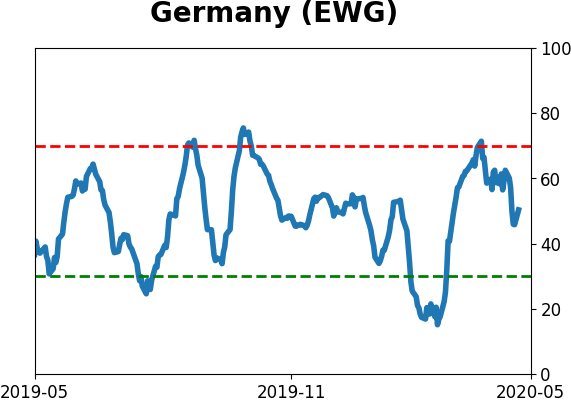
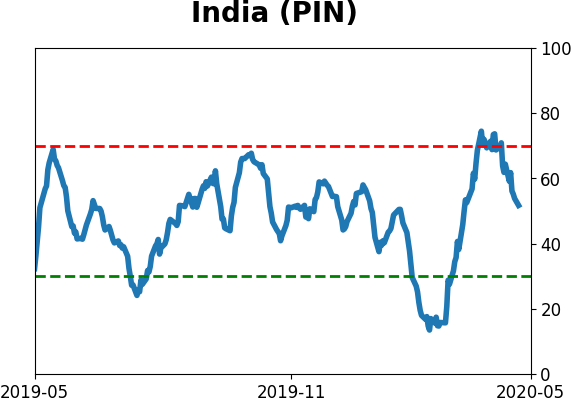
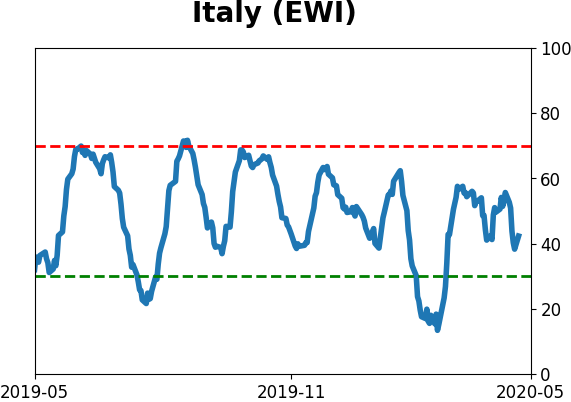
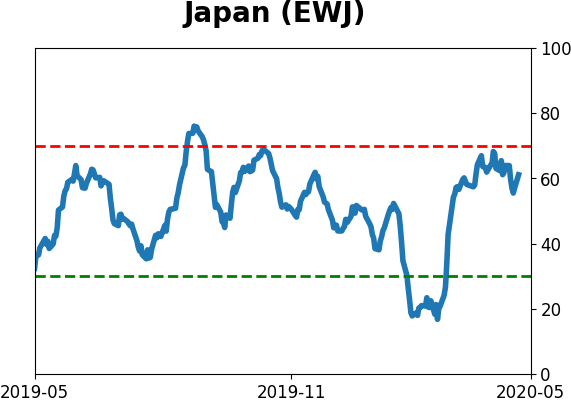
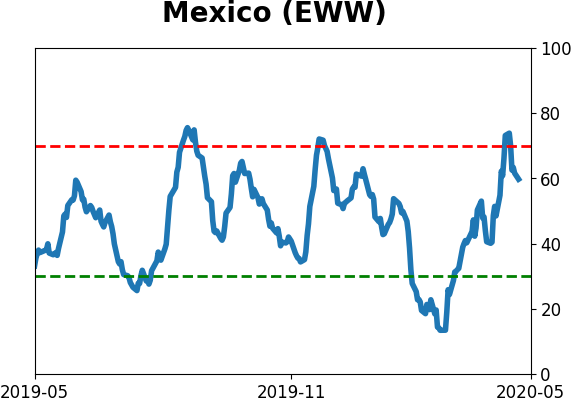
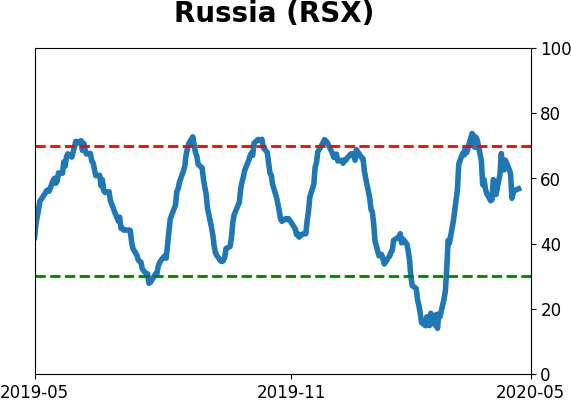
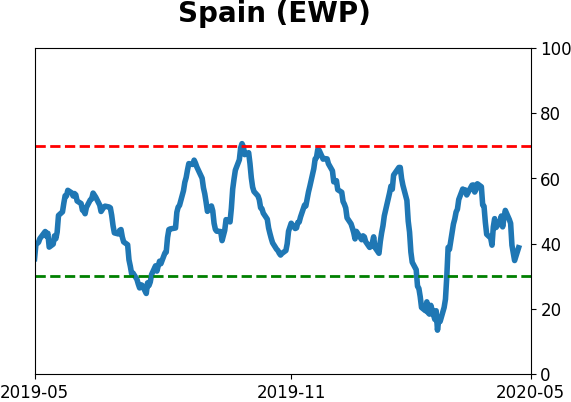
Country ETF's - 10-Day Moving Average
|
|
|
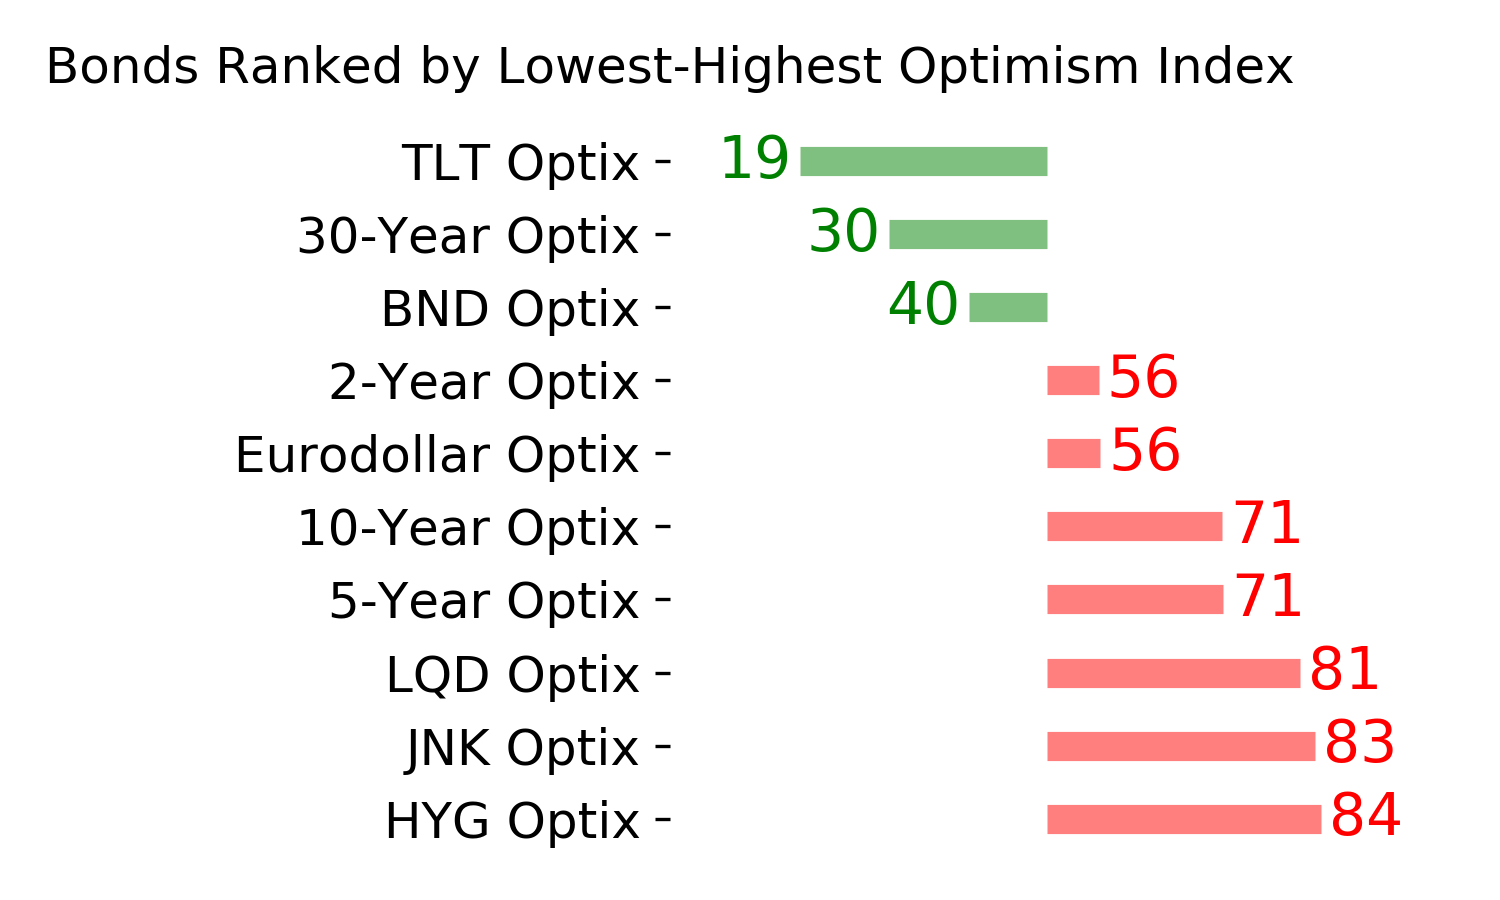
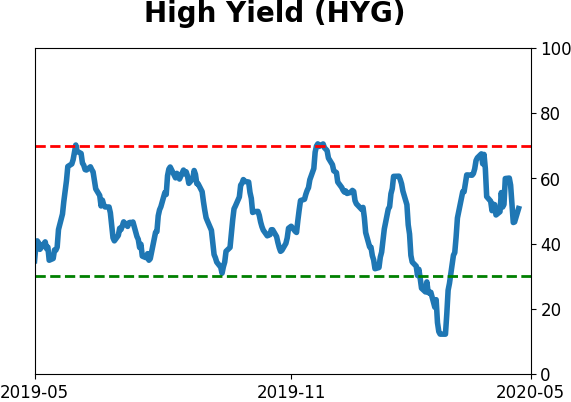
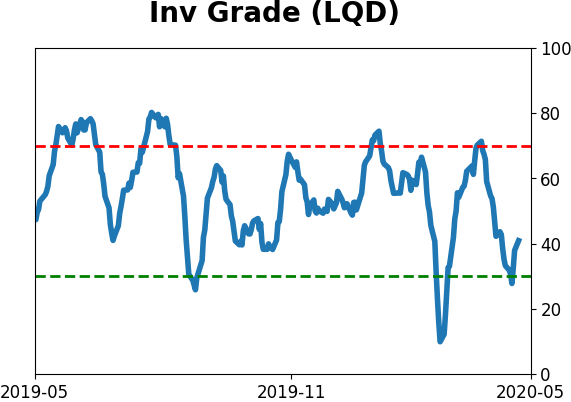
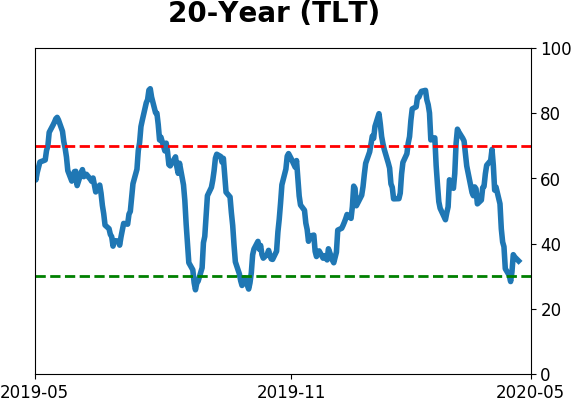
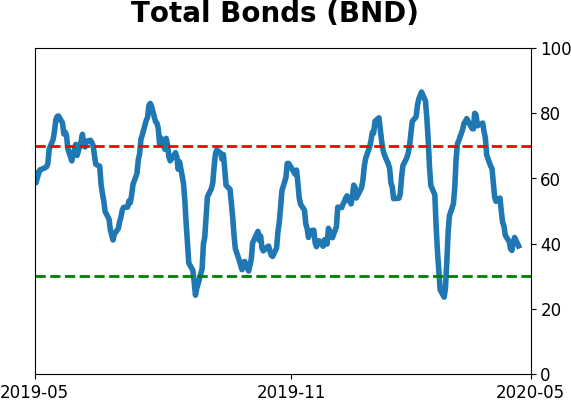
Bond ETF's - 10-Day Moving Average
|
|
|
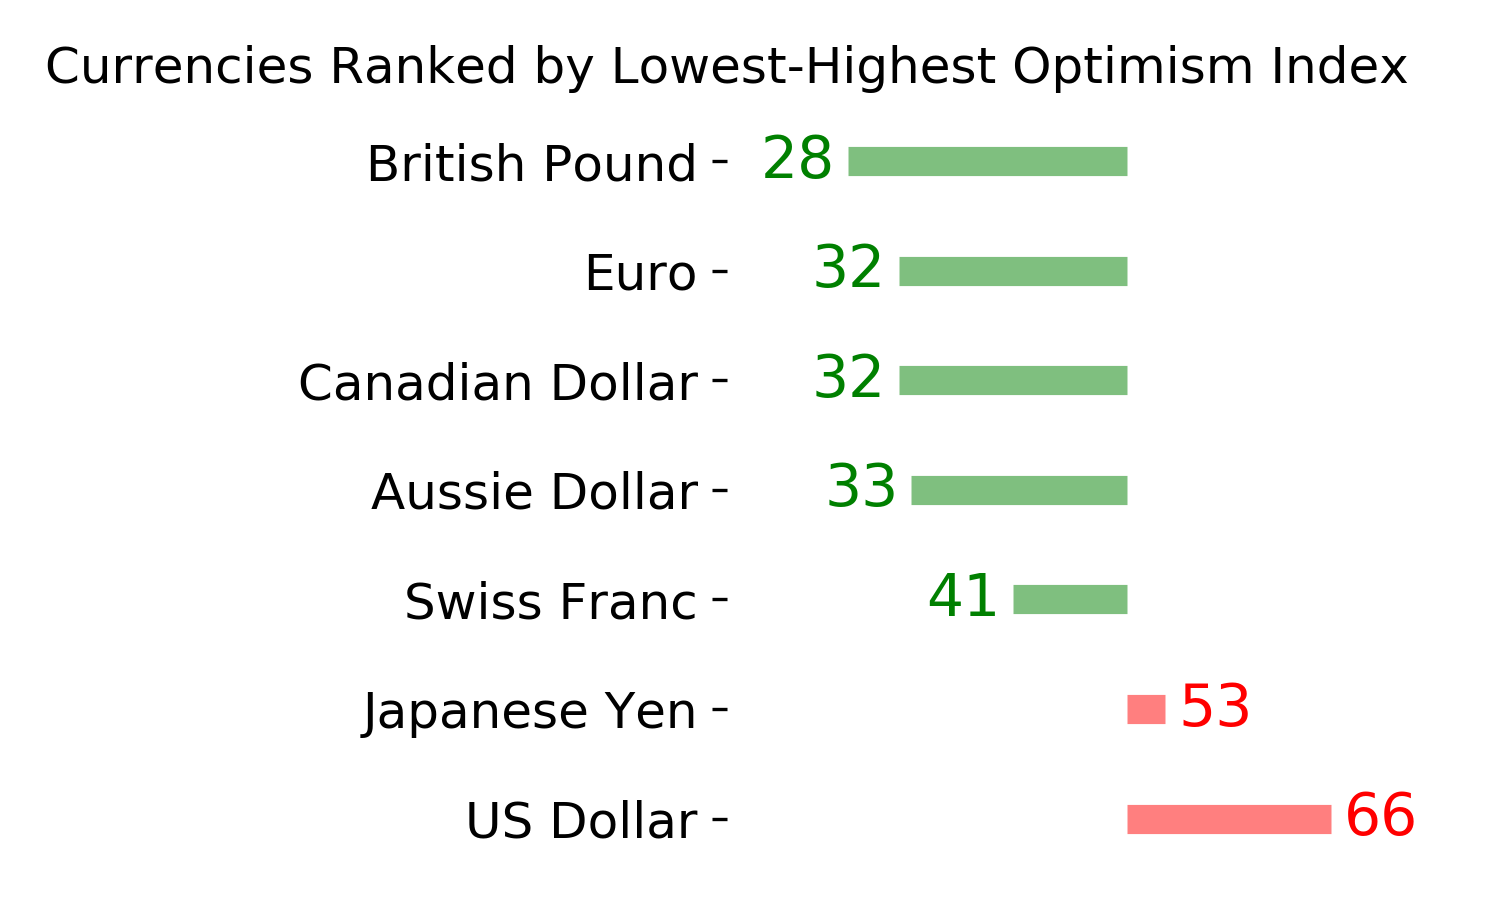
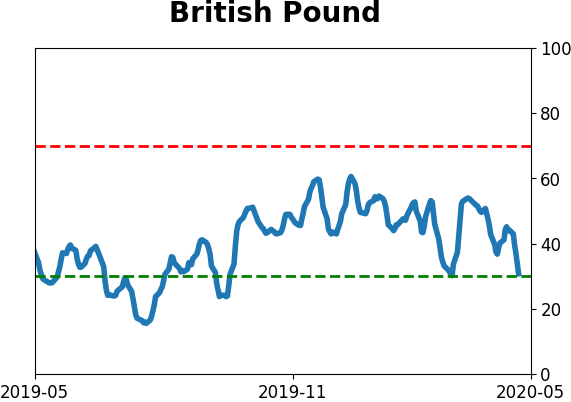
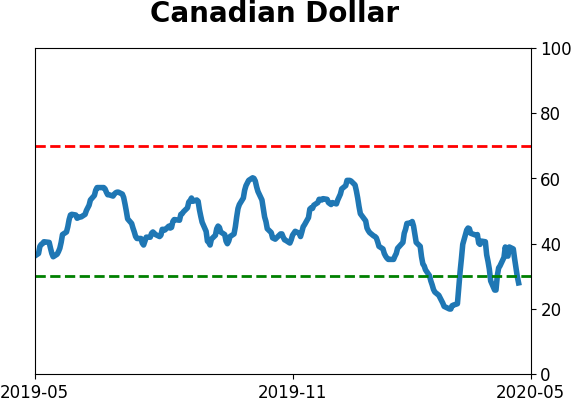
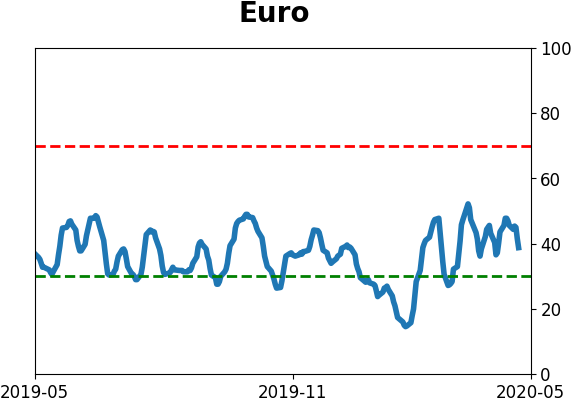
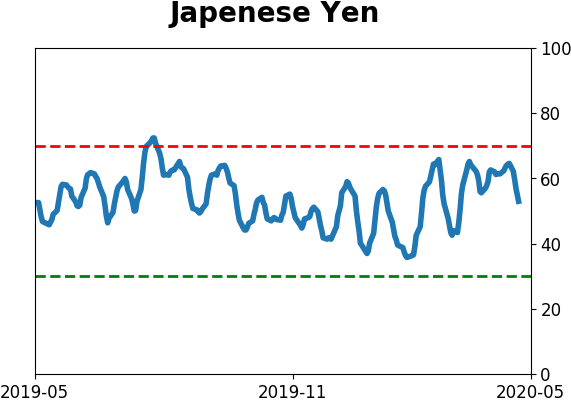
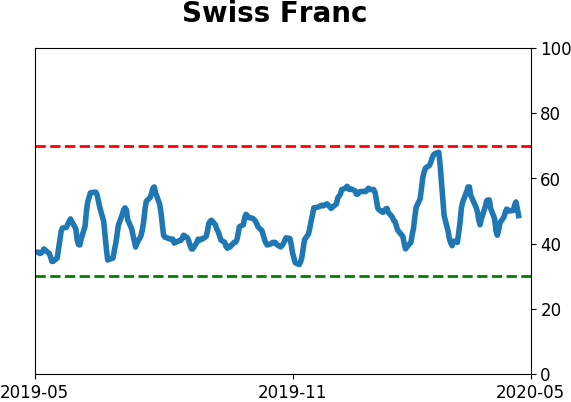
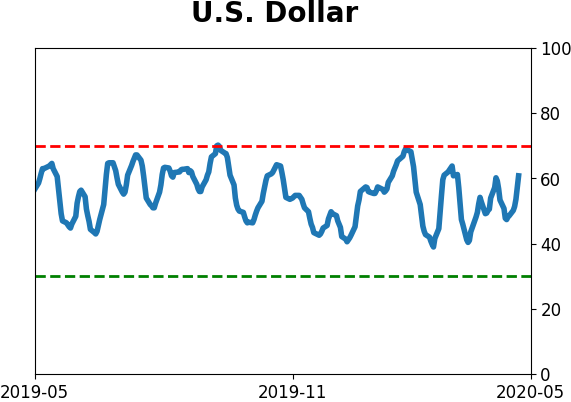
Currency ETF's - 5-Day Moving Average
|
|
|
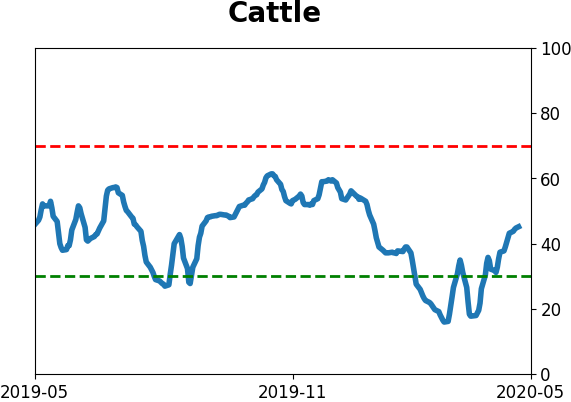
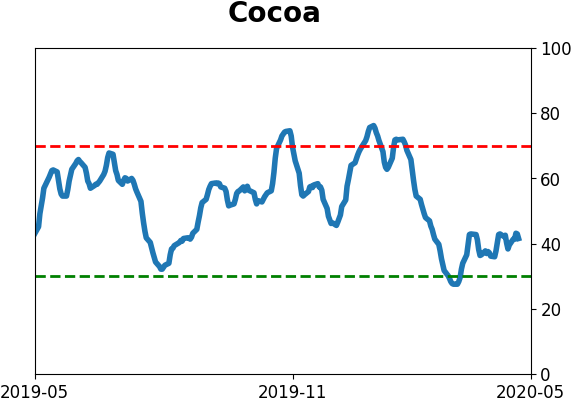
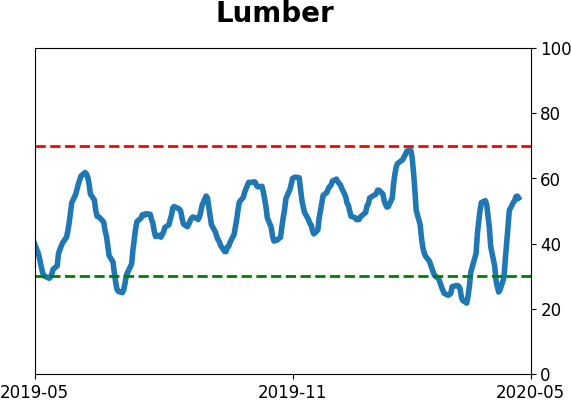
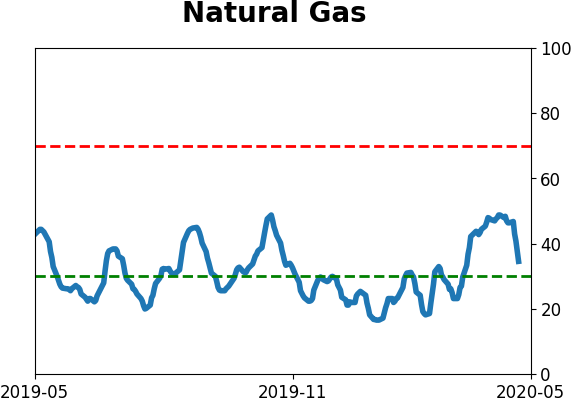
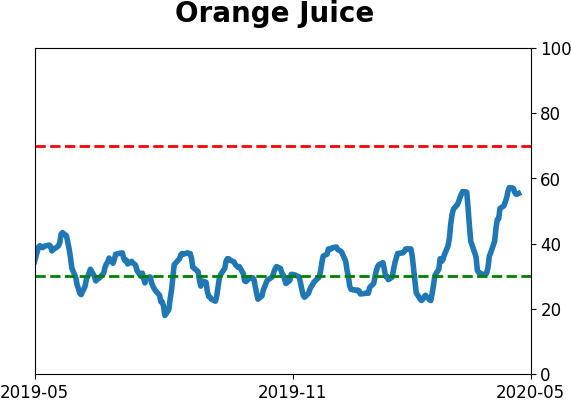
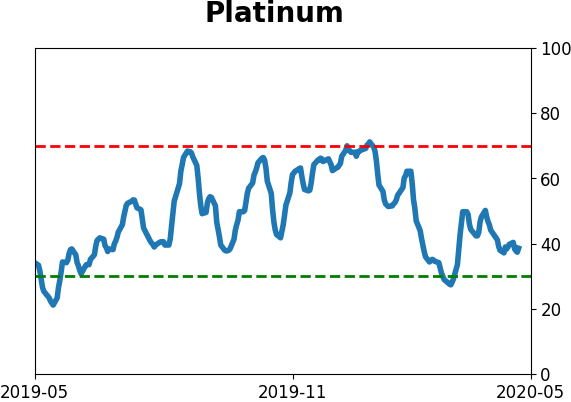
Commodity ETF's - 5-Day Moving Average
|
|