Headlines
|
|
What negative interest rates might mean for stocks and the dollar:
The prospects of negative interest rates in the United States is growing, with some futures contracts already pricing in the possibility. While it is sometimes framed as a sign that economic growth has collapsed and markets are heading to oblivion, the experience in other countries showed rallies in stock markets and drops in their currencies when rates first turned negative.
Secondary surge suggests companies are "feeding the ducks":
As stock prices recover amid the most uncertain corporate environment in generations, companies are scrambling to offer secondary or add-on shares. This is often taken as a sign of frothy sentiment and additional supply, both negatives for prices. It hasn't been that clear of a negative, though.
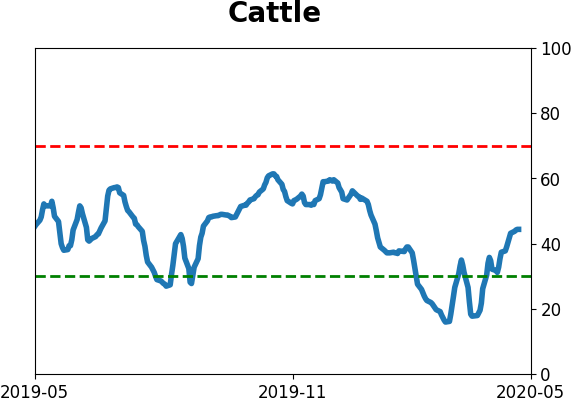
The latest Commitments of Traders report was released, covering positions through Tuesday: The 3-Year Min/Max Screen shows that "smart money" hedgers have moved to a multi-year long position in corn. They're now holding more than 10% of the open interest net long, which has preceded an average return of +11.2% six months later according to the Backtest Engine. They're still holding off on some other contracts, though, so their aggregate agriculture positions are only modest. Perhaps most notably, they're still holding or even adding to a massive net long position in the major equity index futures. This is similar to the early 2019 rally when they were getting more long as stocks rose, which is counter to their typical behavior.
|
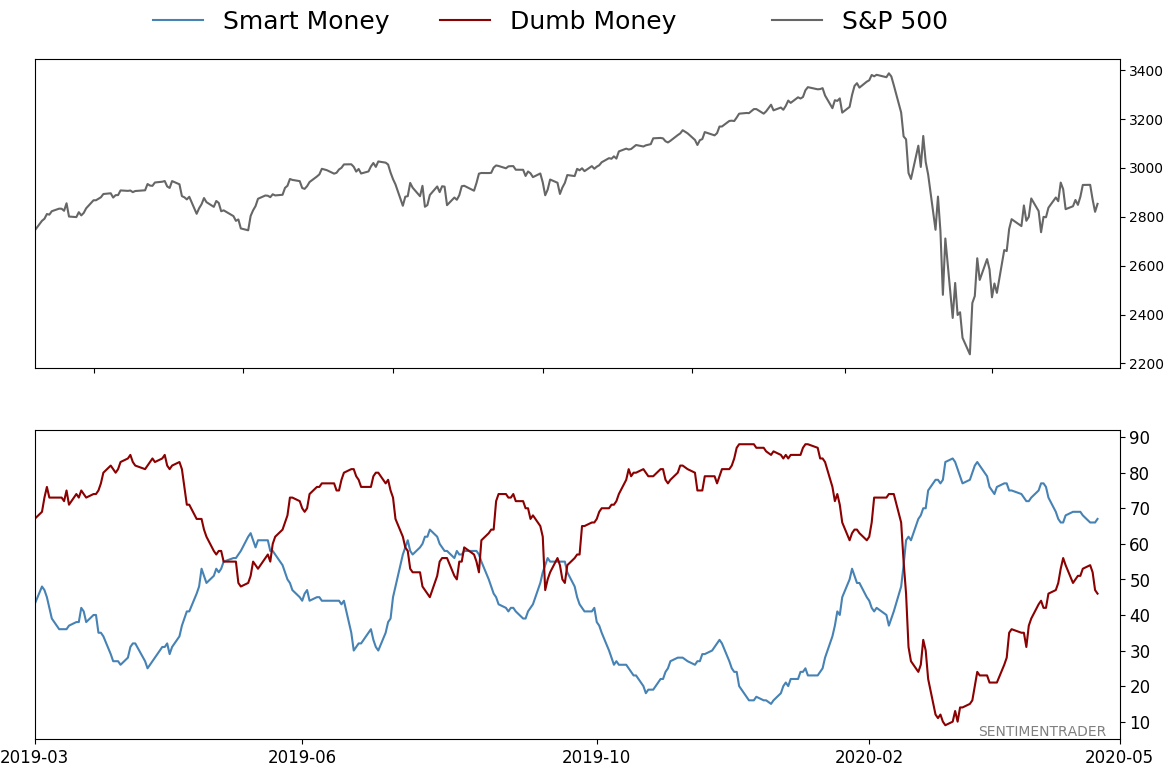
Smart / Dumb Money Confidence
|
Smart Money Confidence: 67%
Dumb Money Confidence: 46%
|
|
Risk Levels
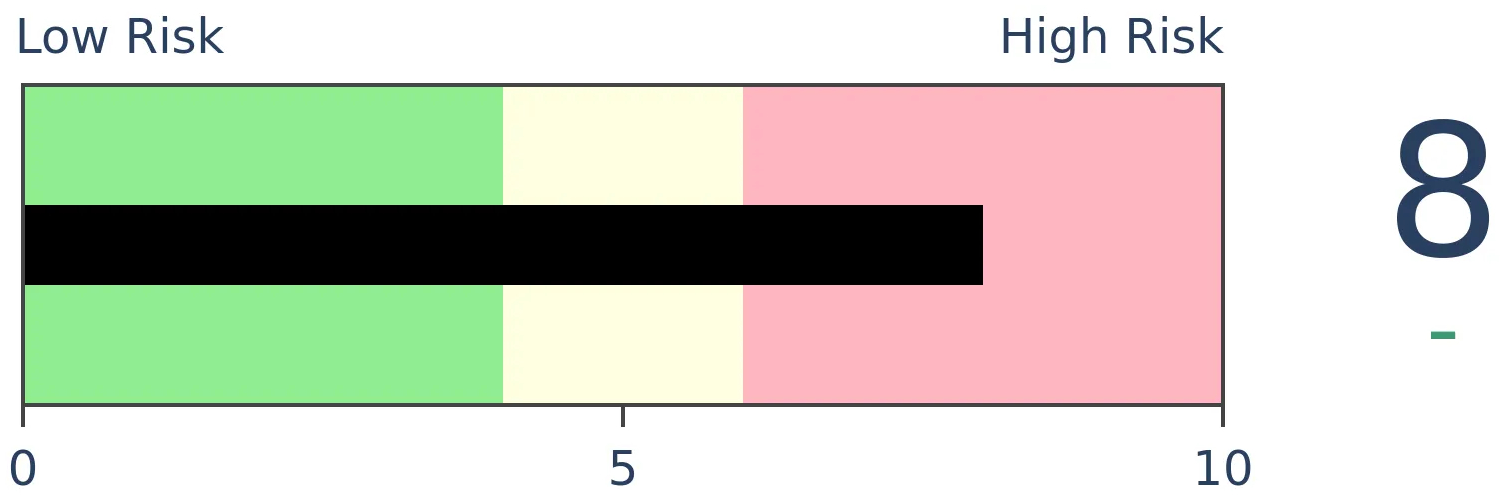
Stocks Short-Term
|
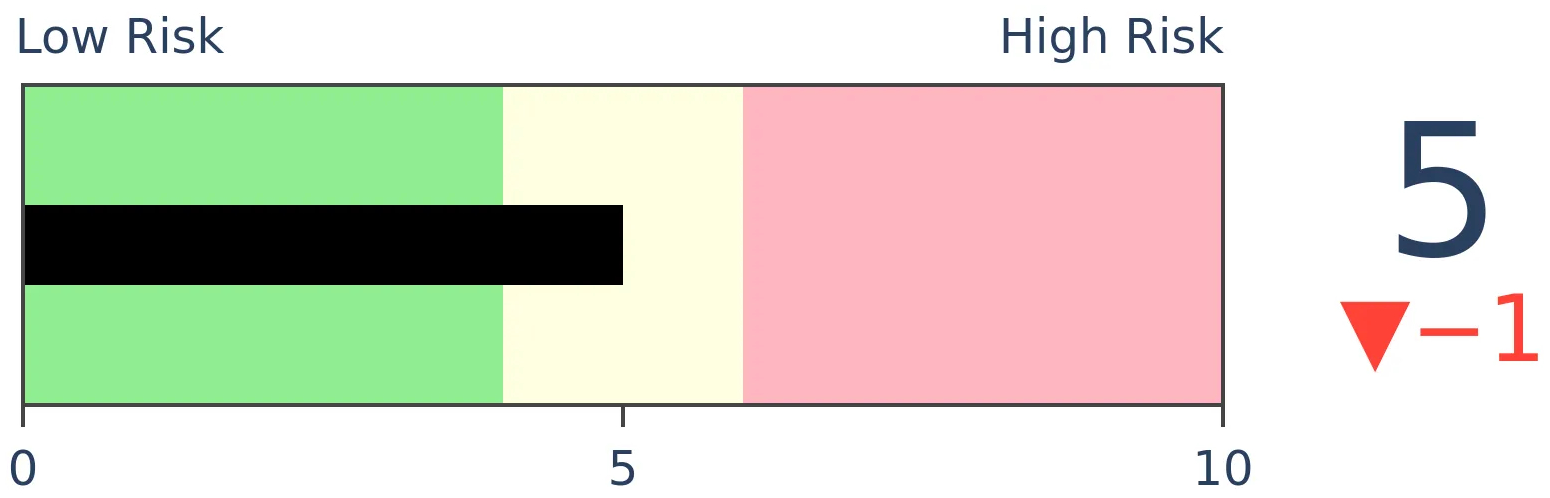
Stocks Medium-Term

|
|
Bonds
|
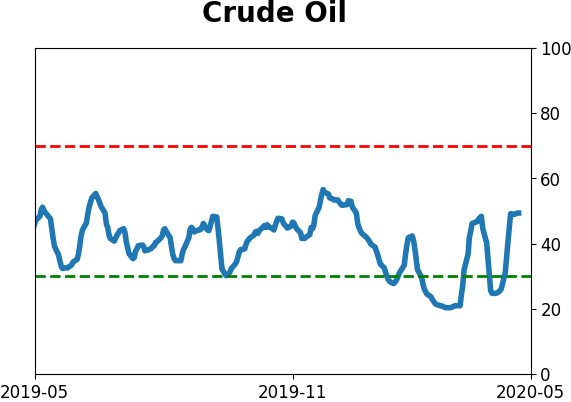
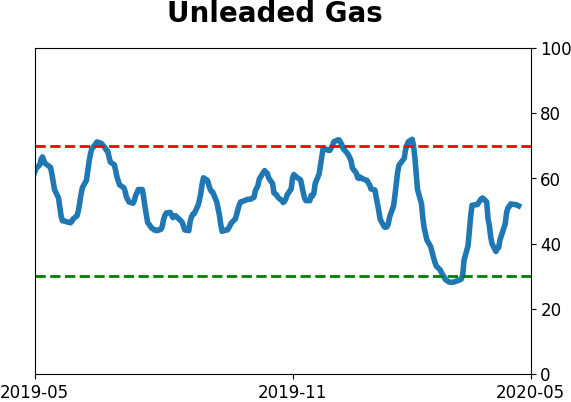
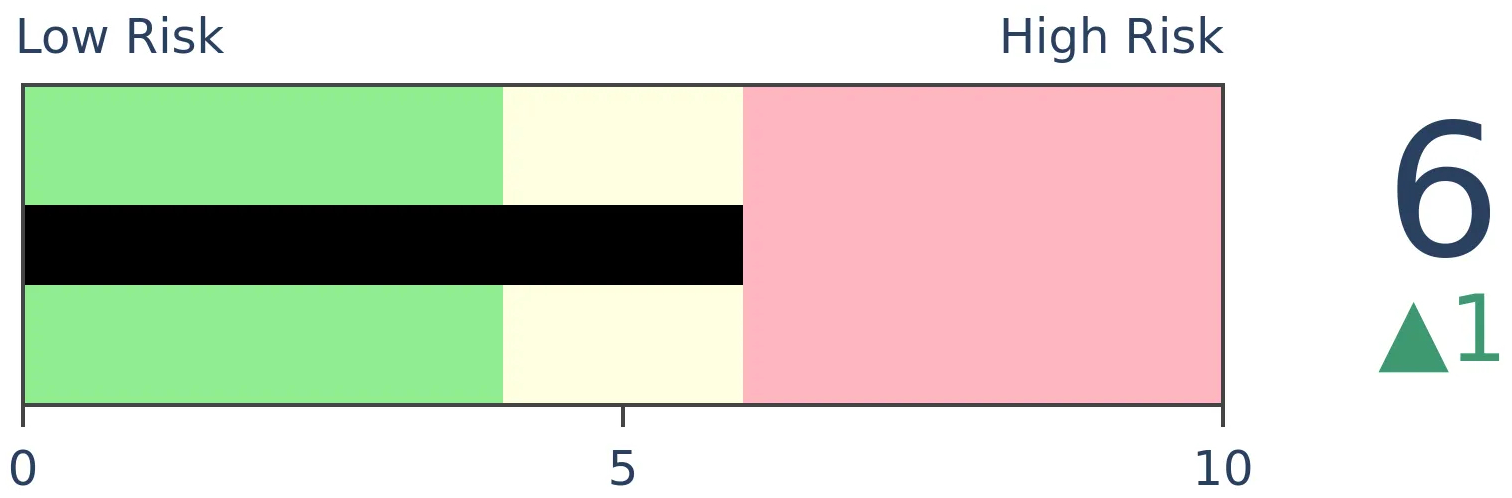
Crude Oil
|
|
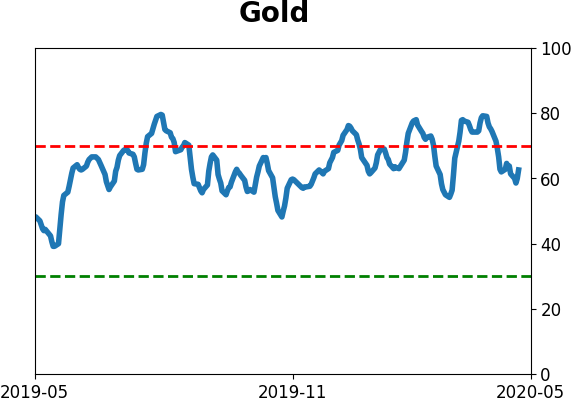
Gold

|
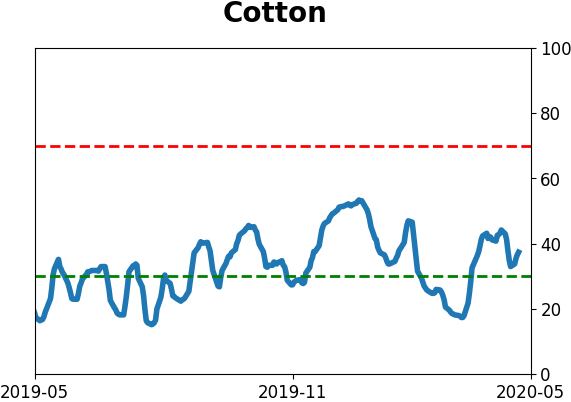
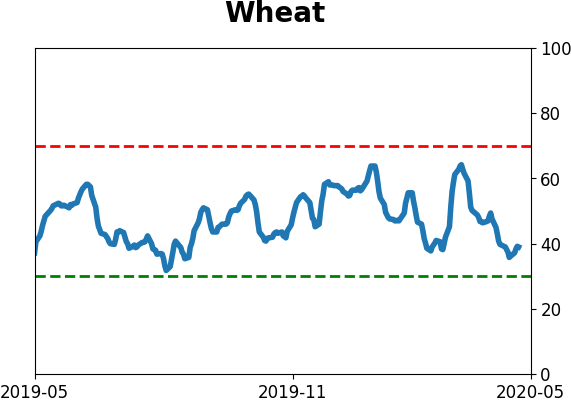
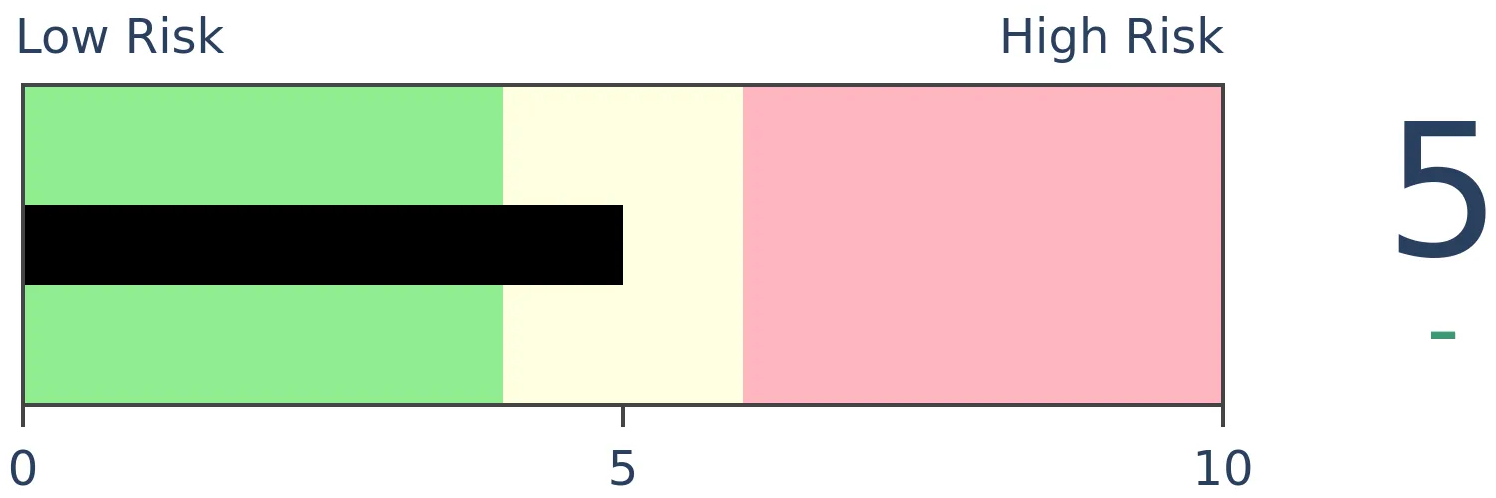
Agriculture
|
|
Research
BOTTOM LINE
The prospects of negative interest rates in the United States is growing, with some futures contracts already pricing in the possibility. While it is sometimes framed as a sign that economic growth has collapsed and markets are heading to oblivion, the experience in other countries showed rallies in stock markets and drops in their currencies when rates first turned negative.
FORECAST / TIMEFRAME
None
|
Despite the big recovery in stocks and bonds, many are still doubting the long-term economic outlook in the U.S. That has raised the possibility of negative interest rates, something previously considered inconceivable.
Markets are already pricing in the potential, with various Fed Funds futures contracts flirting with below-zero yields. The primary market-based rate of longer-term expectations, the 10-year yield, is hovering near all-time lows but remains above zero for now.
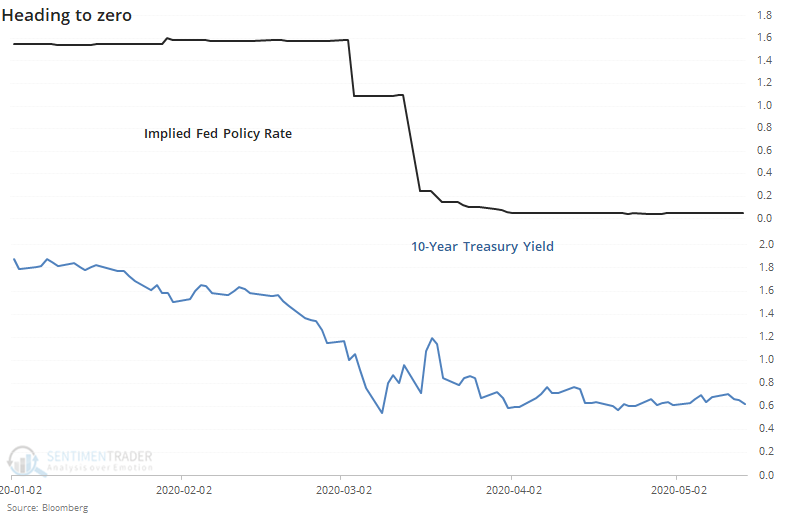
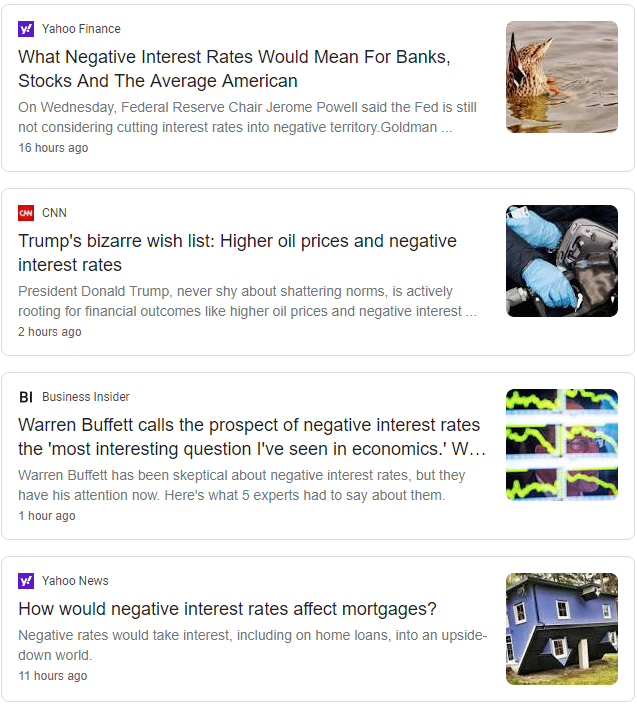
The prospect is not out of the question, and it's getting increasing attention in the media.
The U.S. wouldn't be the first or only member of the zero-rate club; several countries have already experienced it. This gets a little tricky depending on what we mean by "interest rate" because not all countries operate in the same way. So, we'll go with the yield on sovereign 10-year notes, as it shows market-based long-term expectations of economic growth better than central bank policies might.
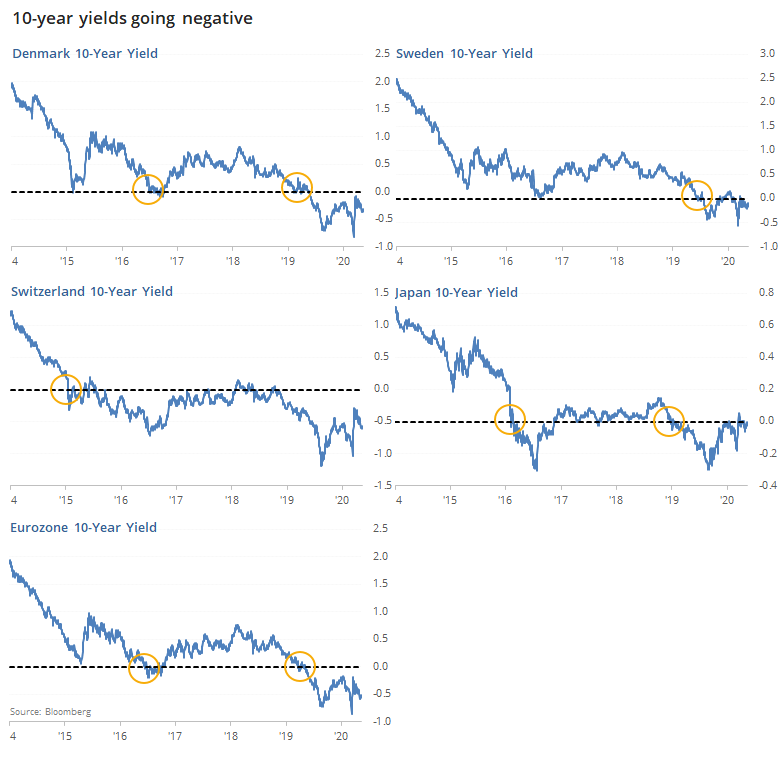
Interestingly, when rates first went negative (or did so after a prolonged stretch back above zero), the major stock indexes in those countries didn't seem to suffer much, at least in U.S. dollar terms.
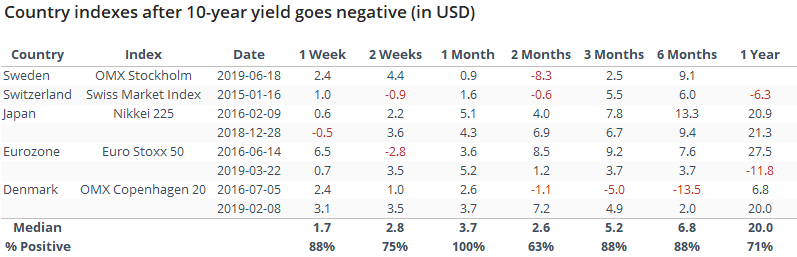
In the month following inverted interest rates, the stock indexes rallied every time, with impressive gains. Even over the next 3-6 months, there was only a single loss, though it was a large one after stocks in Denmark suffered a failed rally in 2016.
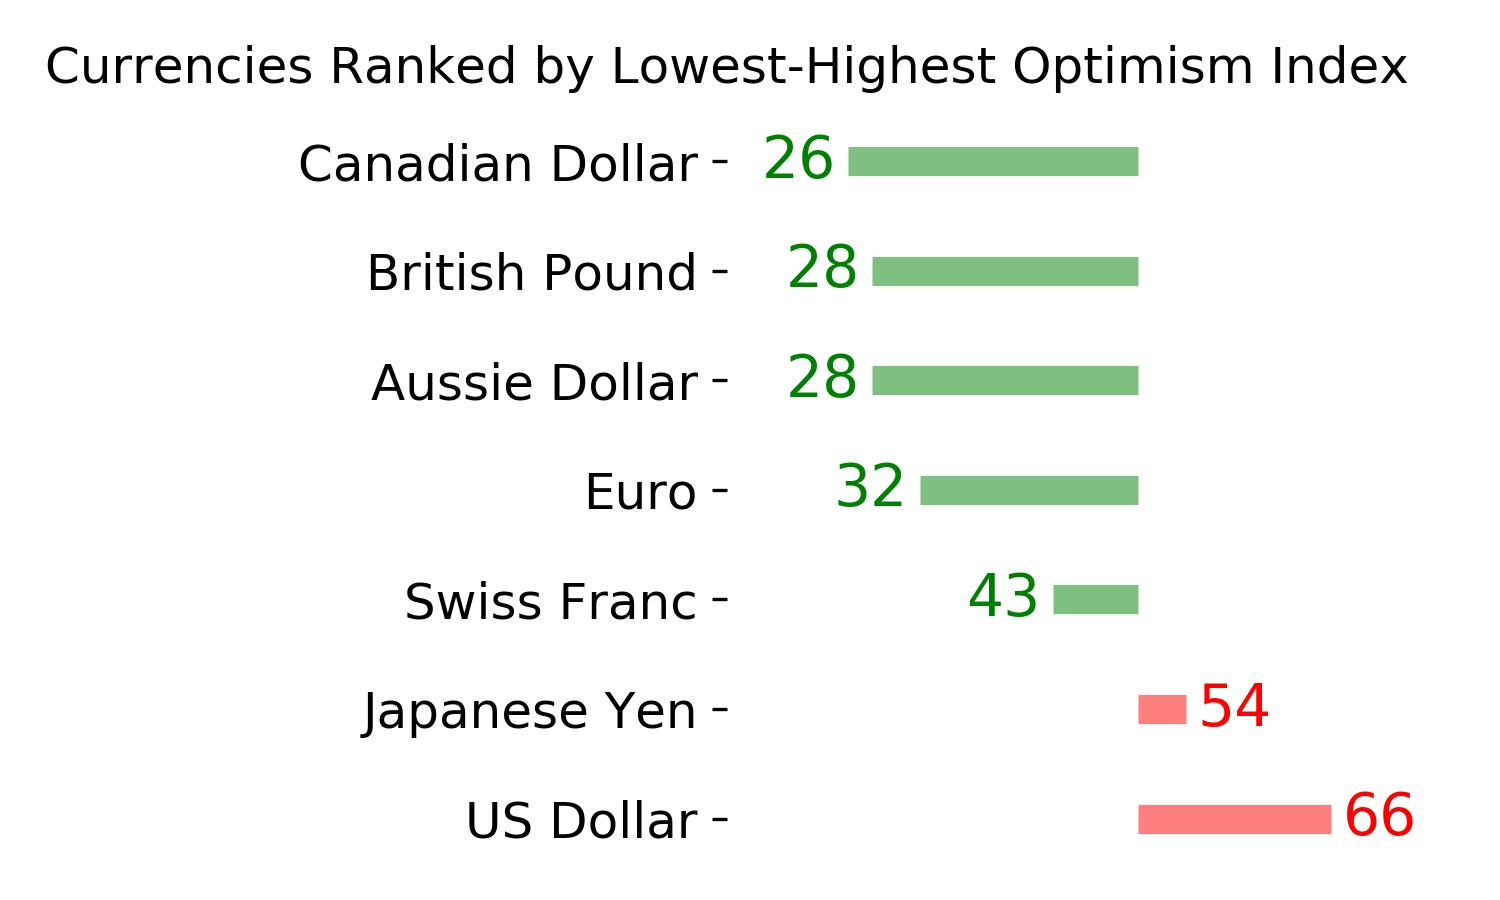
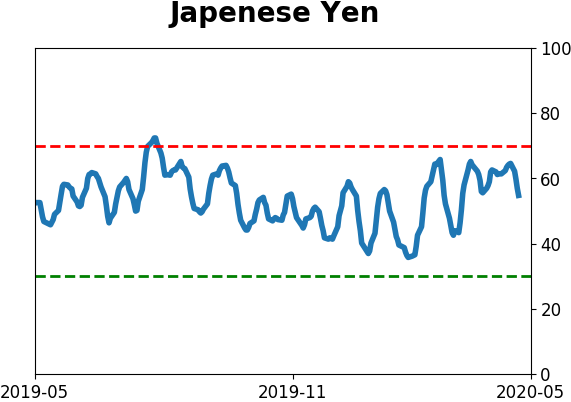
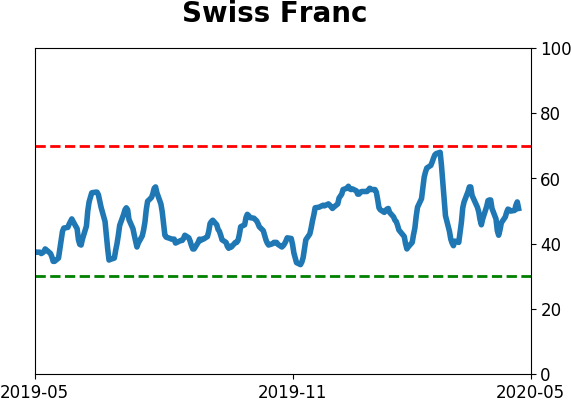
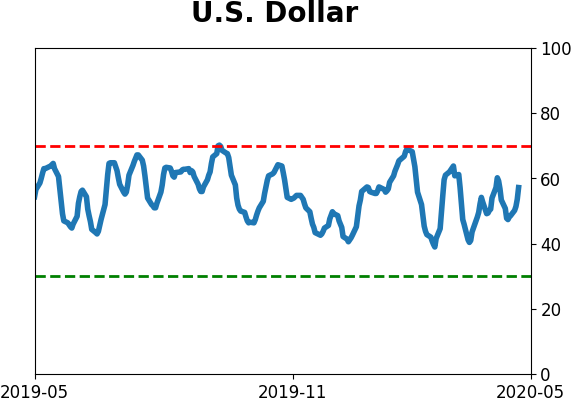
Their currencies were another matter.
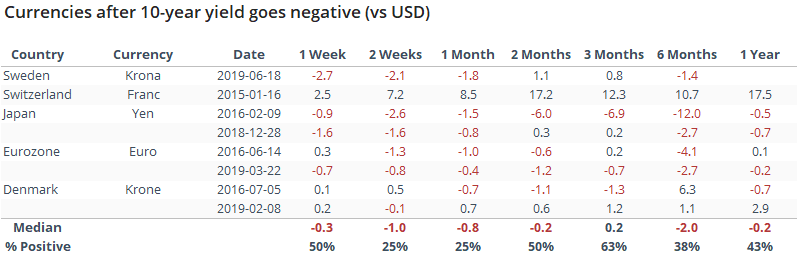
These all use the U.S. dollar as the cross-currency, so maybe it's just a reflection of overall strength in the buck. Still, there was a pattern of weakness with the only real exception being the Swiss Franc in early 2015.
While it's easy to succumb to stories of destruction when markets do unprecedented things, it's not always a negative. Most of the time, it's not. That includes those times of severe tumult that make investors willing to pay governments to borrow money.
BOTTOM LINE
As stock prices recover amid the most uncertain corporate environment in generations, companies are scrambling to offer secondary or add-on shares. This is often taken as a sign of frothy sentiment and additional supply, both negatives for prices. It hasn't been that clear of a negative, though.
FORECAST / TIMEFRAME
None
|
The economy is cratering, corporate outlooks are the most uncertain in generations, and yet stocks have rallied hard. That's a perfect recipe for companies to issue more shares. They get cheap capital in a friendly environment.
As Bloomberg notes:
“When you’re a CFO or a board director of a company in a capital intensive industry, you raise money so that you don’t lose your job. That’s 100% the right thing to do now.”
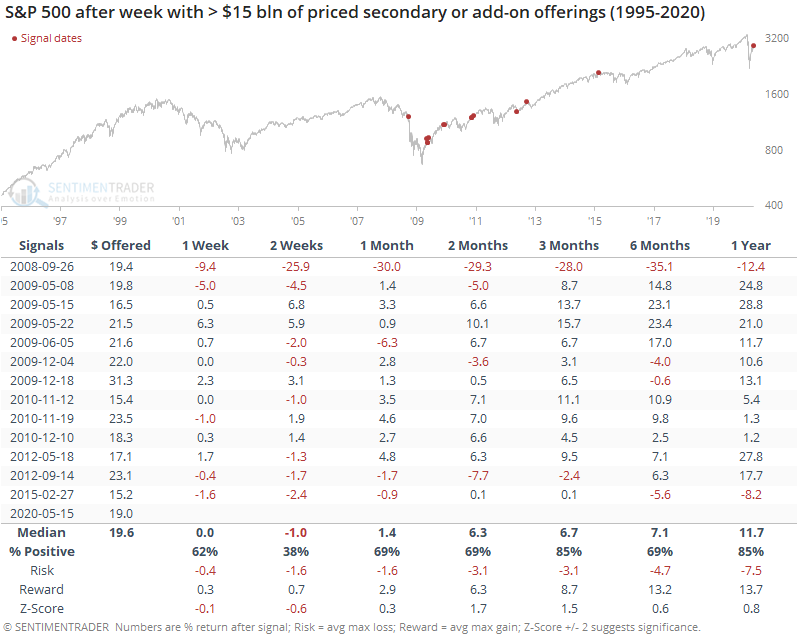
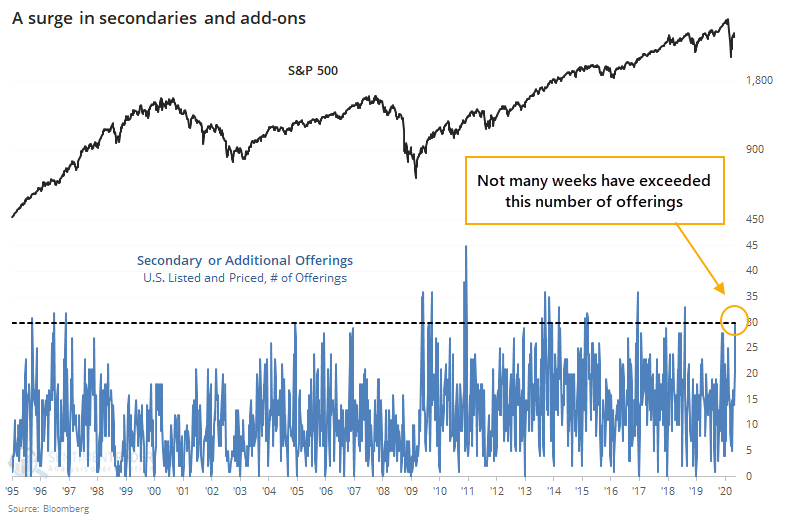
There is no doubt they're taking advantage and "feeding the ducks while they're quacking." This week alone, there has been nearly $20 billion of secondary or additional offerings priced among U.S. listed companies, and that's not including the full week yet.
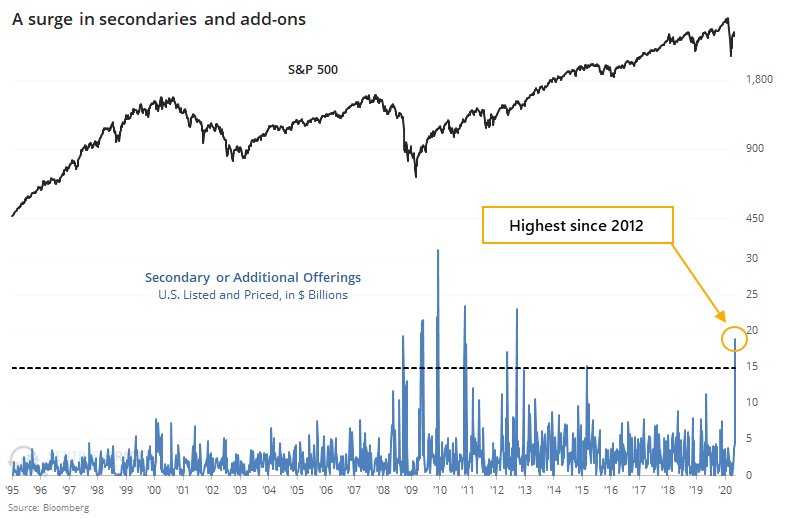
When there is a jump in secondary or add-on offerings, it triggers a yellow flag among market watchers. It suggests that sentiment is perhaps too welcoming, in addition to the increased supply of shares.
If we look at whether giant weekly spikes in these offerings led to poor market returns, that theory is hard to support. There was consistent weakness over the next couple of weeks, even though most of these occurred during a roaring bull market. But after that first couple of weeks, returns were good.
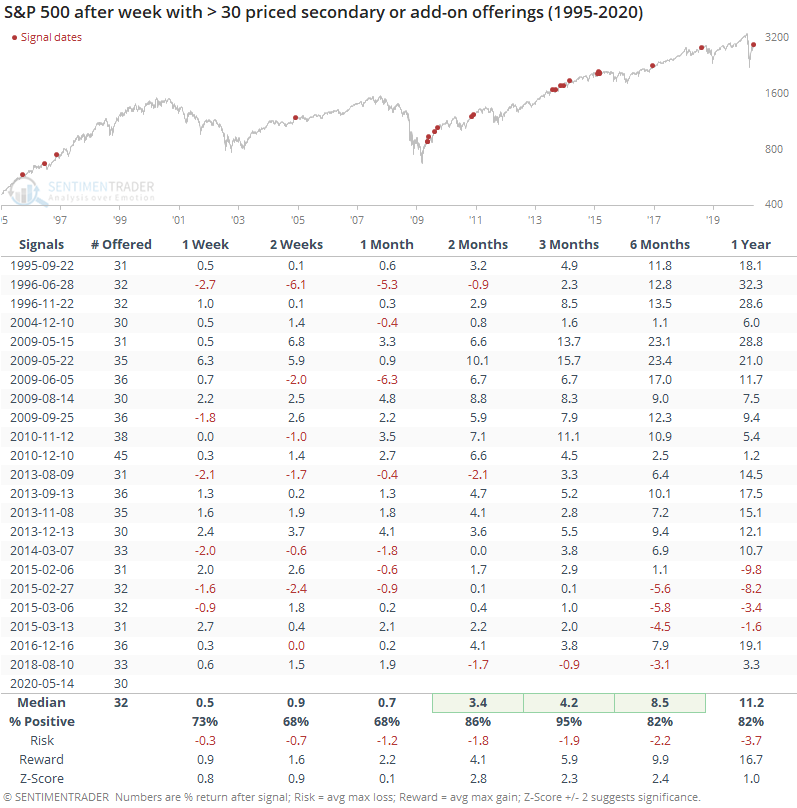
In terms of the number of offerings, it's been relatively spread out, so it's not one giant company that accounts for the big spike in the dollar amount.
When we look at the data this way, it's even less clear that this is a potential bearish catalyst. Returns over the medium-term were excellent, with rare losses.
This data can be variable depending on what criteria are used:
- Exactly what counts as an add-on?
- Do we include announced issues, or only those that were priced and trading?
- Is there a certain size of issue that qualifies?
- Is it only U.S.-based companies, or anything that's listed domestically?
- Over what time frame?
Because of those issues, other sources could come to different conclusions.
If we lengthen the time frame and look at monthly jumps in secondaries and add-ons, this month will like equal or exceed the summer of 2009 and late fall 2010, both times when markets were thawing after bouts of pessimism. Neither one proved to be negative indicators for the broader stock market's returns in the months ahead.
This is one of those things where a bearish argument makes a lot of sense, and it might be possible to torture the data in some way to make it confirm that suspicion. From the data we use, though, an objective look doesn't seem to support it as a negative influence at all.
Active Studies
| Time Frame | Bullish | Bearish | | Short-Term | 0 | 6 | | Medium-Term | 12 | 3 | | Long-Term | 37 | 3 |
|
Indicators at Extremes
Portfolio
| Position | Weight % | Added / Reduced | Date | | Stocks | 38.9 | Reduced 10% | 2020-05-13 | | Bonds | 0.0 | Reduced 6.7% | 2020-02-28 | | Commodities | 5.1 | Added 2.4%
| 2020-02-28 | | Precious Metals | 0.0 | Reduced 3.6% | 2020-02-28 | | Special Situations | 0.0 | Reduced 31.9% | 2020-03-17 | | Cash | 56.0 | | |
|
Updates (Changes made today are underlined)
In the first months of the year, we saw manic trading activity. From big jumps in specific stocks to historic highs in retail trading activity to record highs in household confidence to almost unbelievable confidence among options traders. All of that came amid a market where the average stock couldn't keep up with their indexes. There were signs of waning momentum in stocks underlying the major averages, which started triggering technical warning signs in late January. The kinds of extremes we saw in December and January typically take months to wear away, but the type of selling in March went a long way toward getting there. When we place the kind of moves we saw into March 23 into the context of coming off an all-time high, there has been a high probability of a multi-month rebound. After stocks bottomed on the 23rd, they enjoyed a historic buying thrust and retraced a larger amount of the decline than "just a bear market rally" tends to. While other signs are mixed that panic is subsiding, those thrusts are the most encouraging sign we've seen in years. Shorter-term, there have been some warning signs popping up and our studies have stopped showing as positively skewed returns. I reduced my exposure some in late April and was looking for a pattern of lower highs and lower lows to reduce it further. With weakness on May 12, our studies turned even more negative over the short- to medium-term so I reduced a bit more. Some short-term indicators are already nearing oversold so we may get a quick rebound but it is what it is. If we see a clear pattern of lower lows, I may reduce even further in the week(s) ahead. Long-term prospects look decent because of the thrusts we saw off the low, but I'm more comfortable in cash in the interim. I'd consider adding back if we see our indicators and studies start to skew to the upside again, or if price action turns clearly better, indicating my caution is wrong.
RETURN YTD: -9.3% 2019: 12.6%, 2018: 0.6%, 2017: 3.8%, 2016: 17.1%, 2015: 9.2%, 2014: 14.5%, 2013: 2.2%, 2012: 10.8%, 2011: 16.5%, 2010: 15.3%, 2009: 23.9%, 2008: 16.2%, 2007: 7.8%
|
|
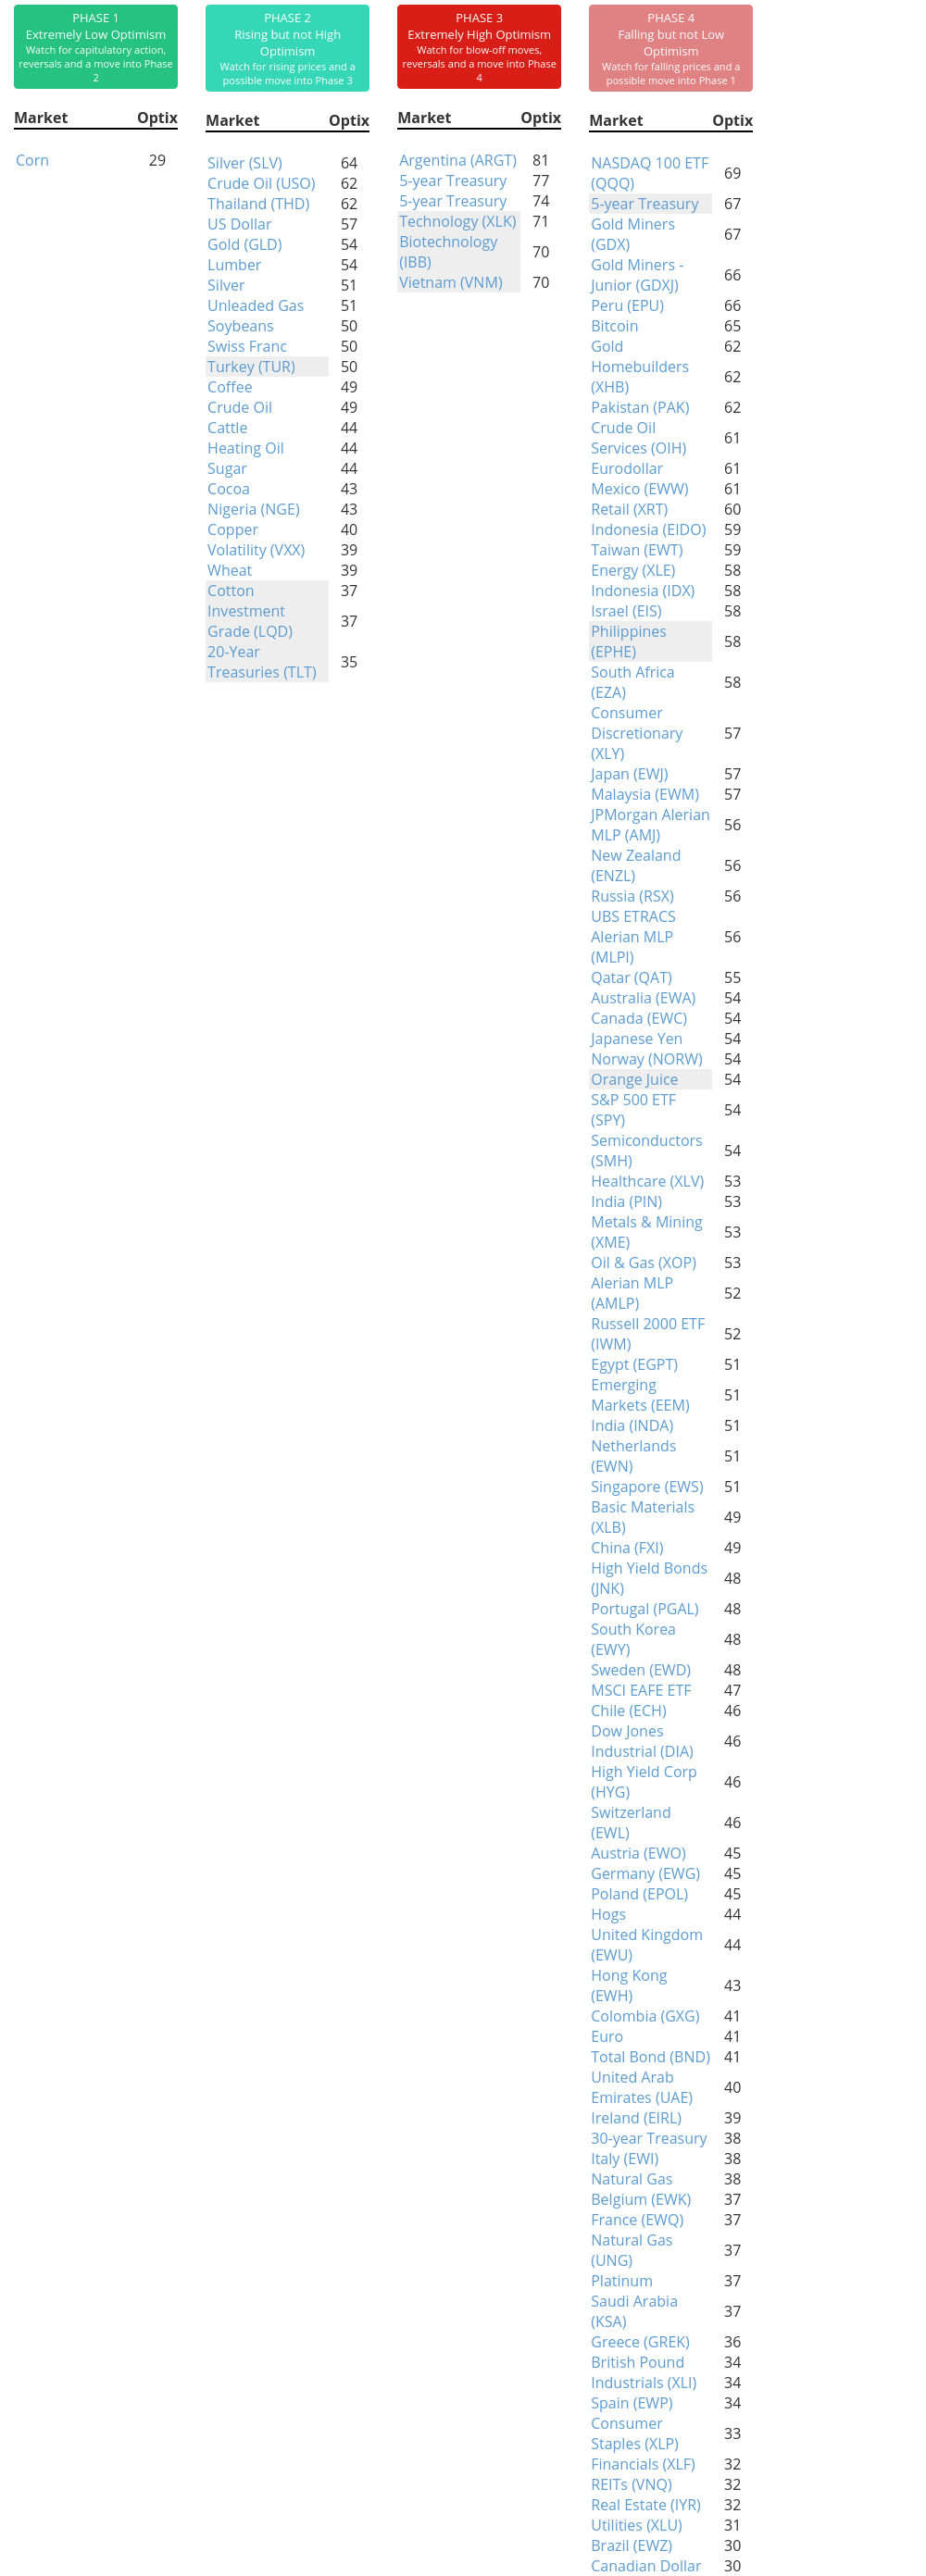
Phase Table
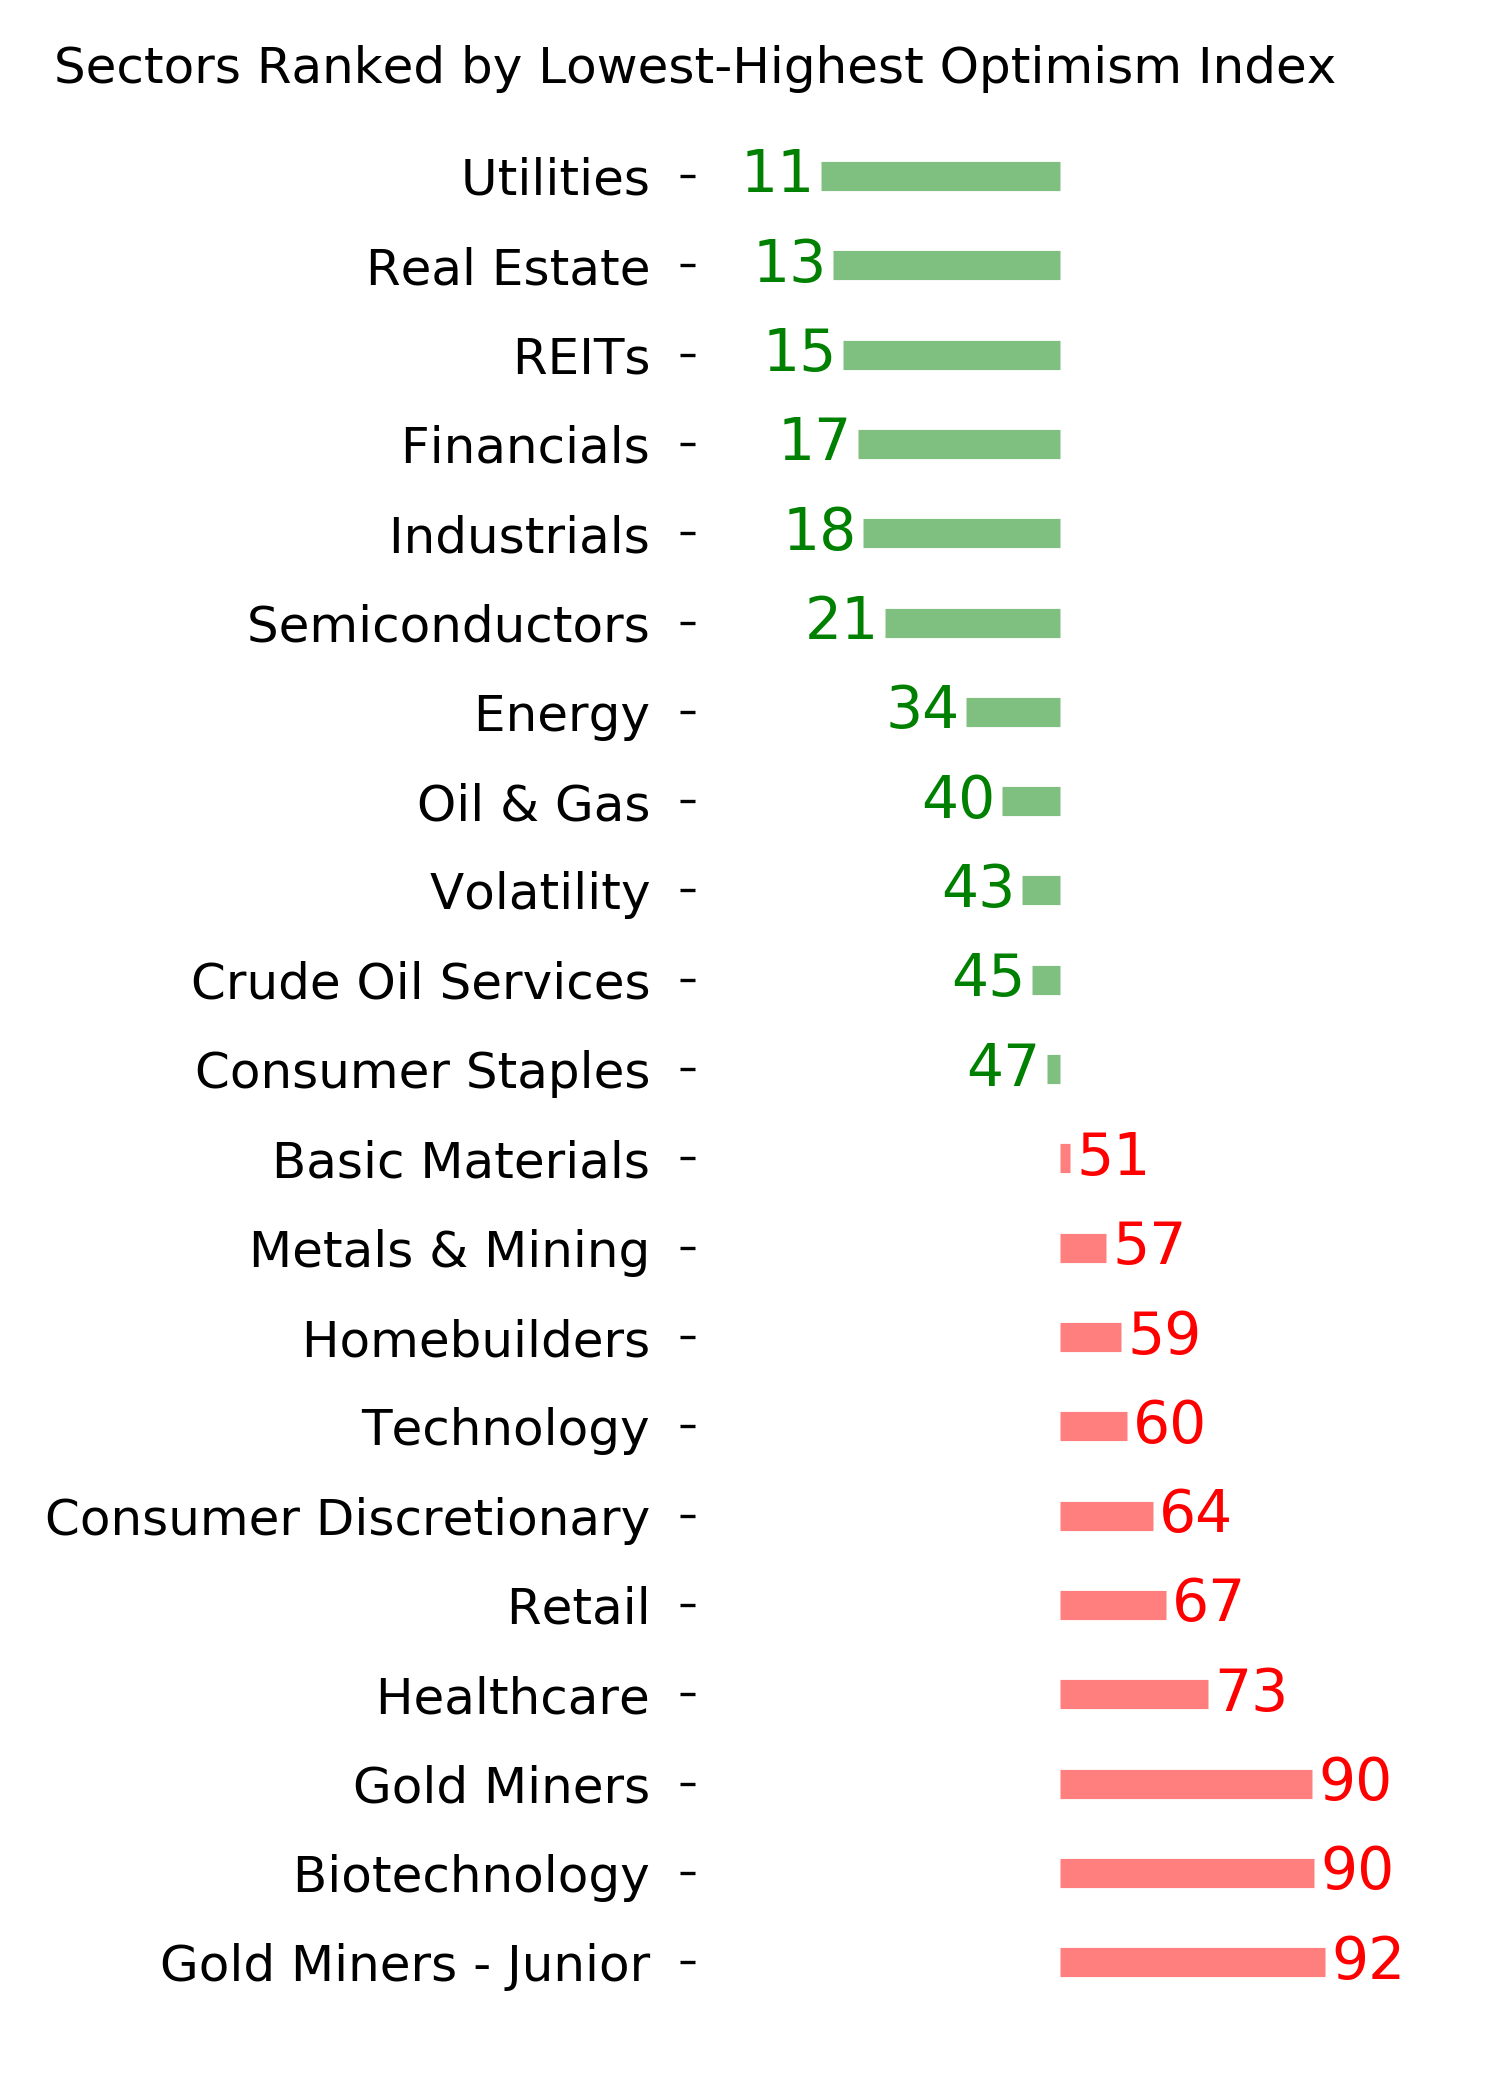
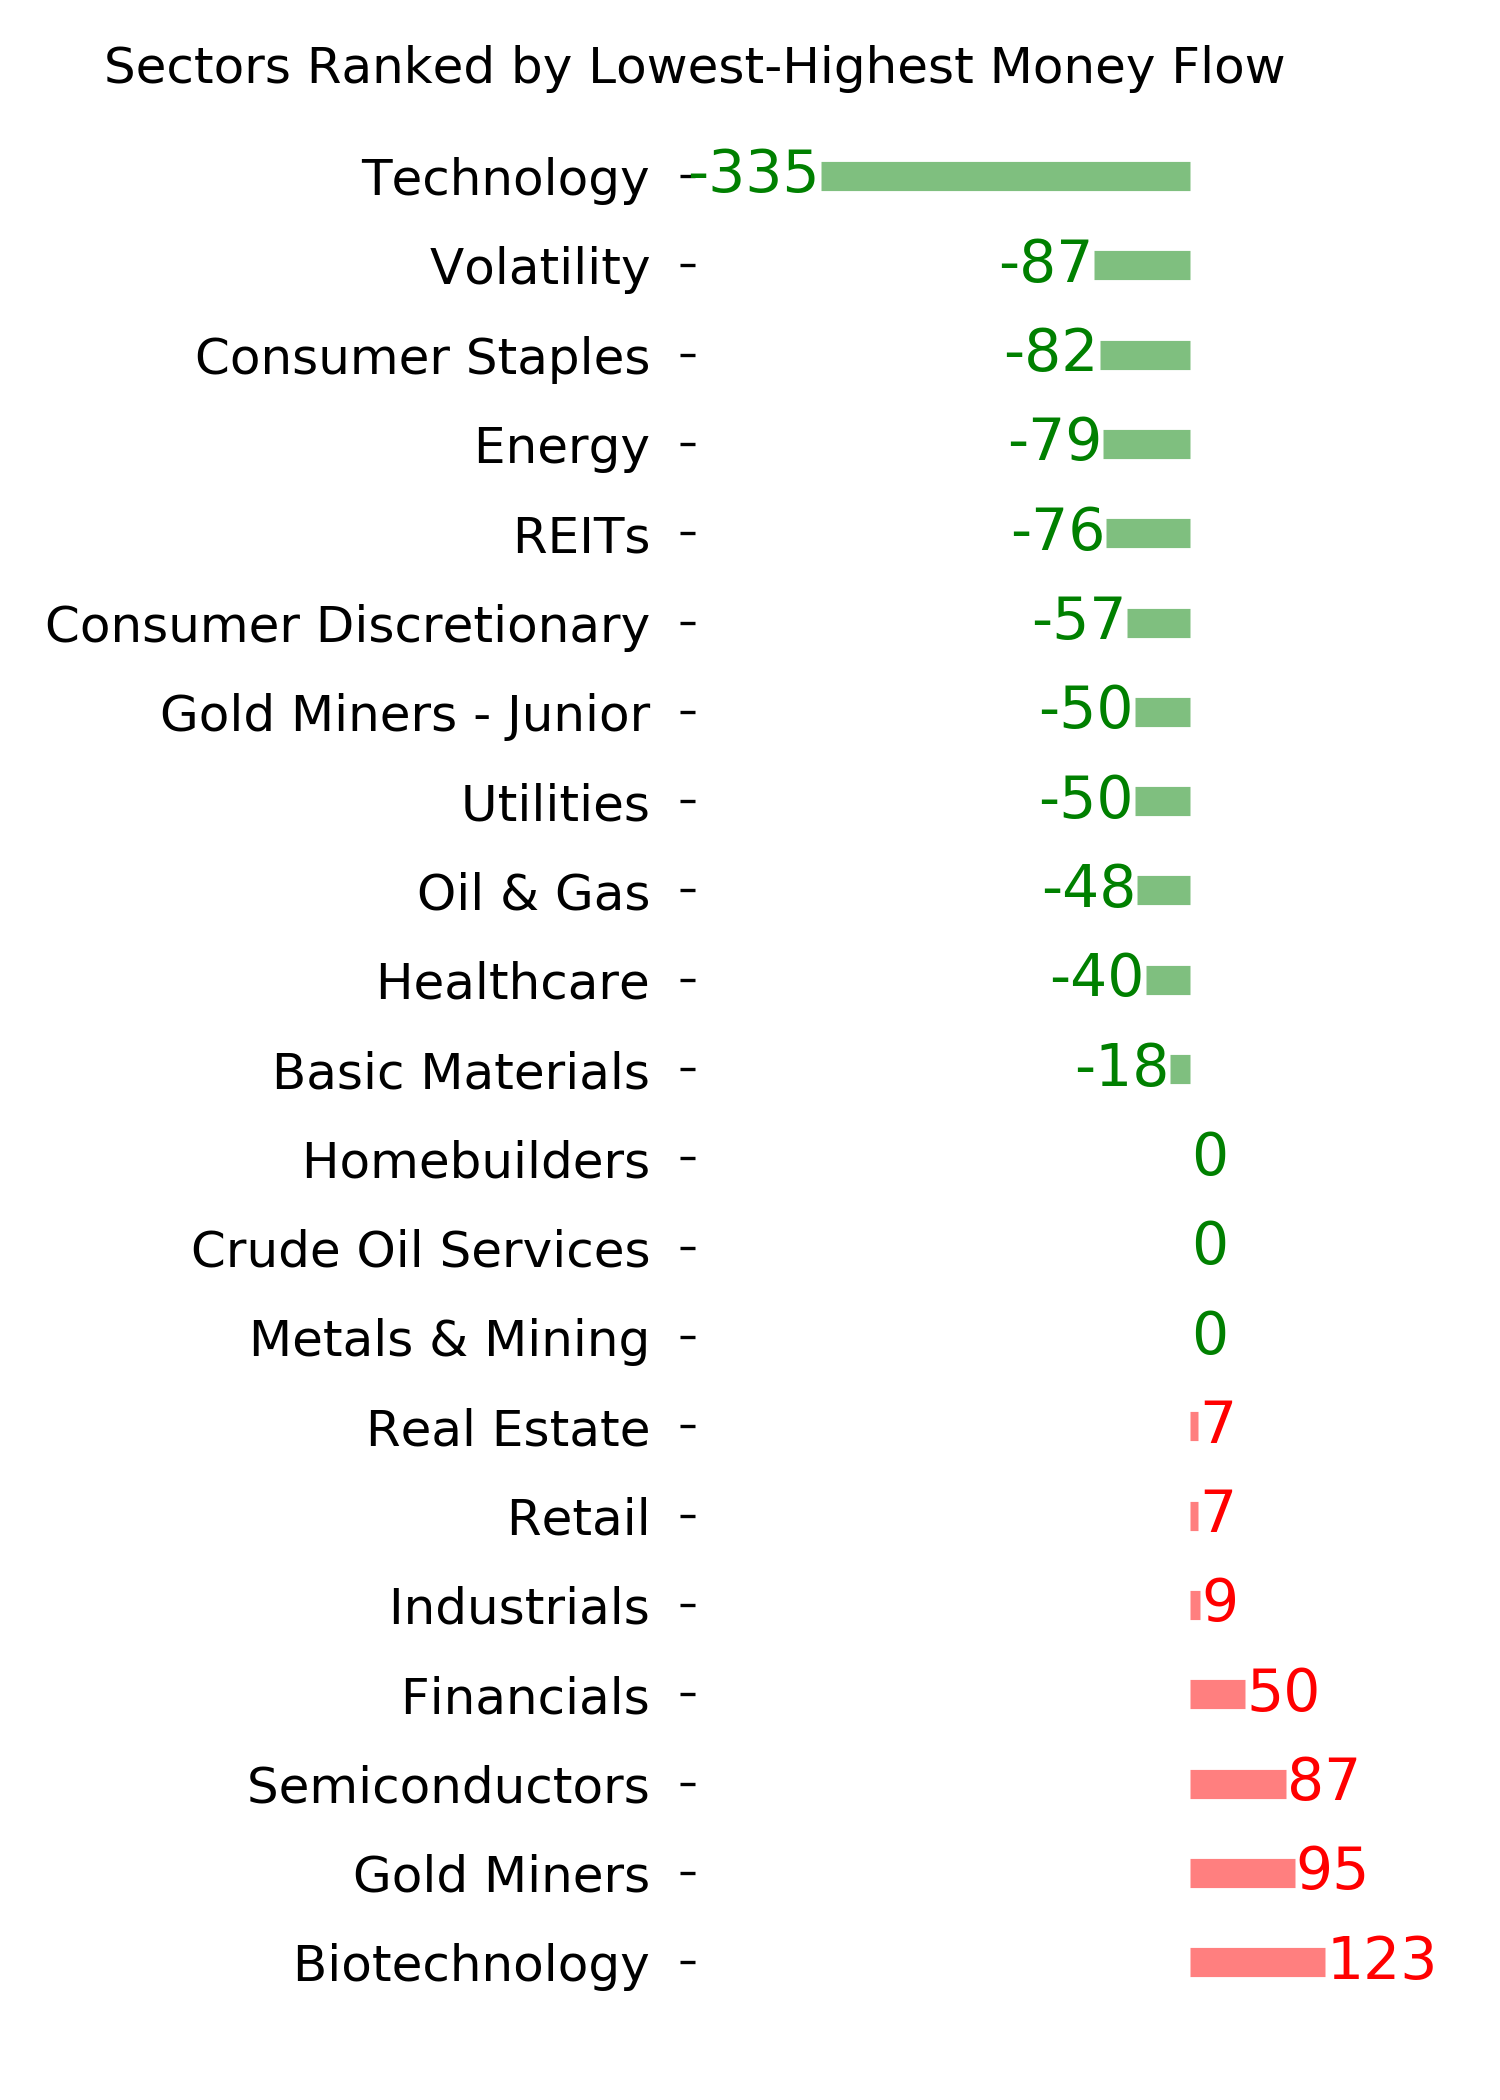
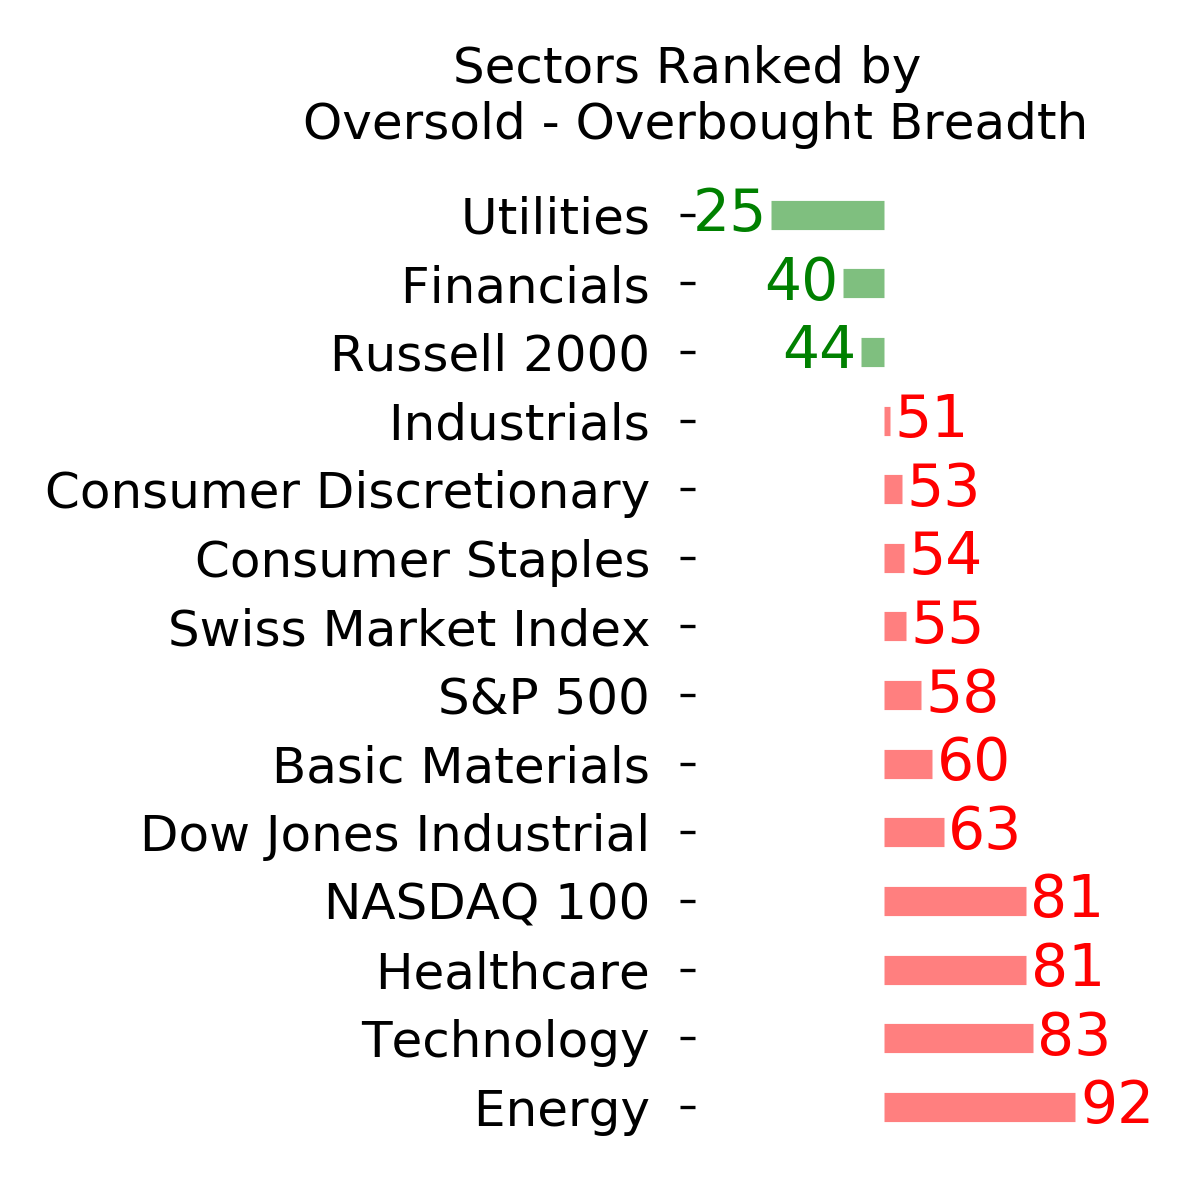
Ranks
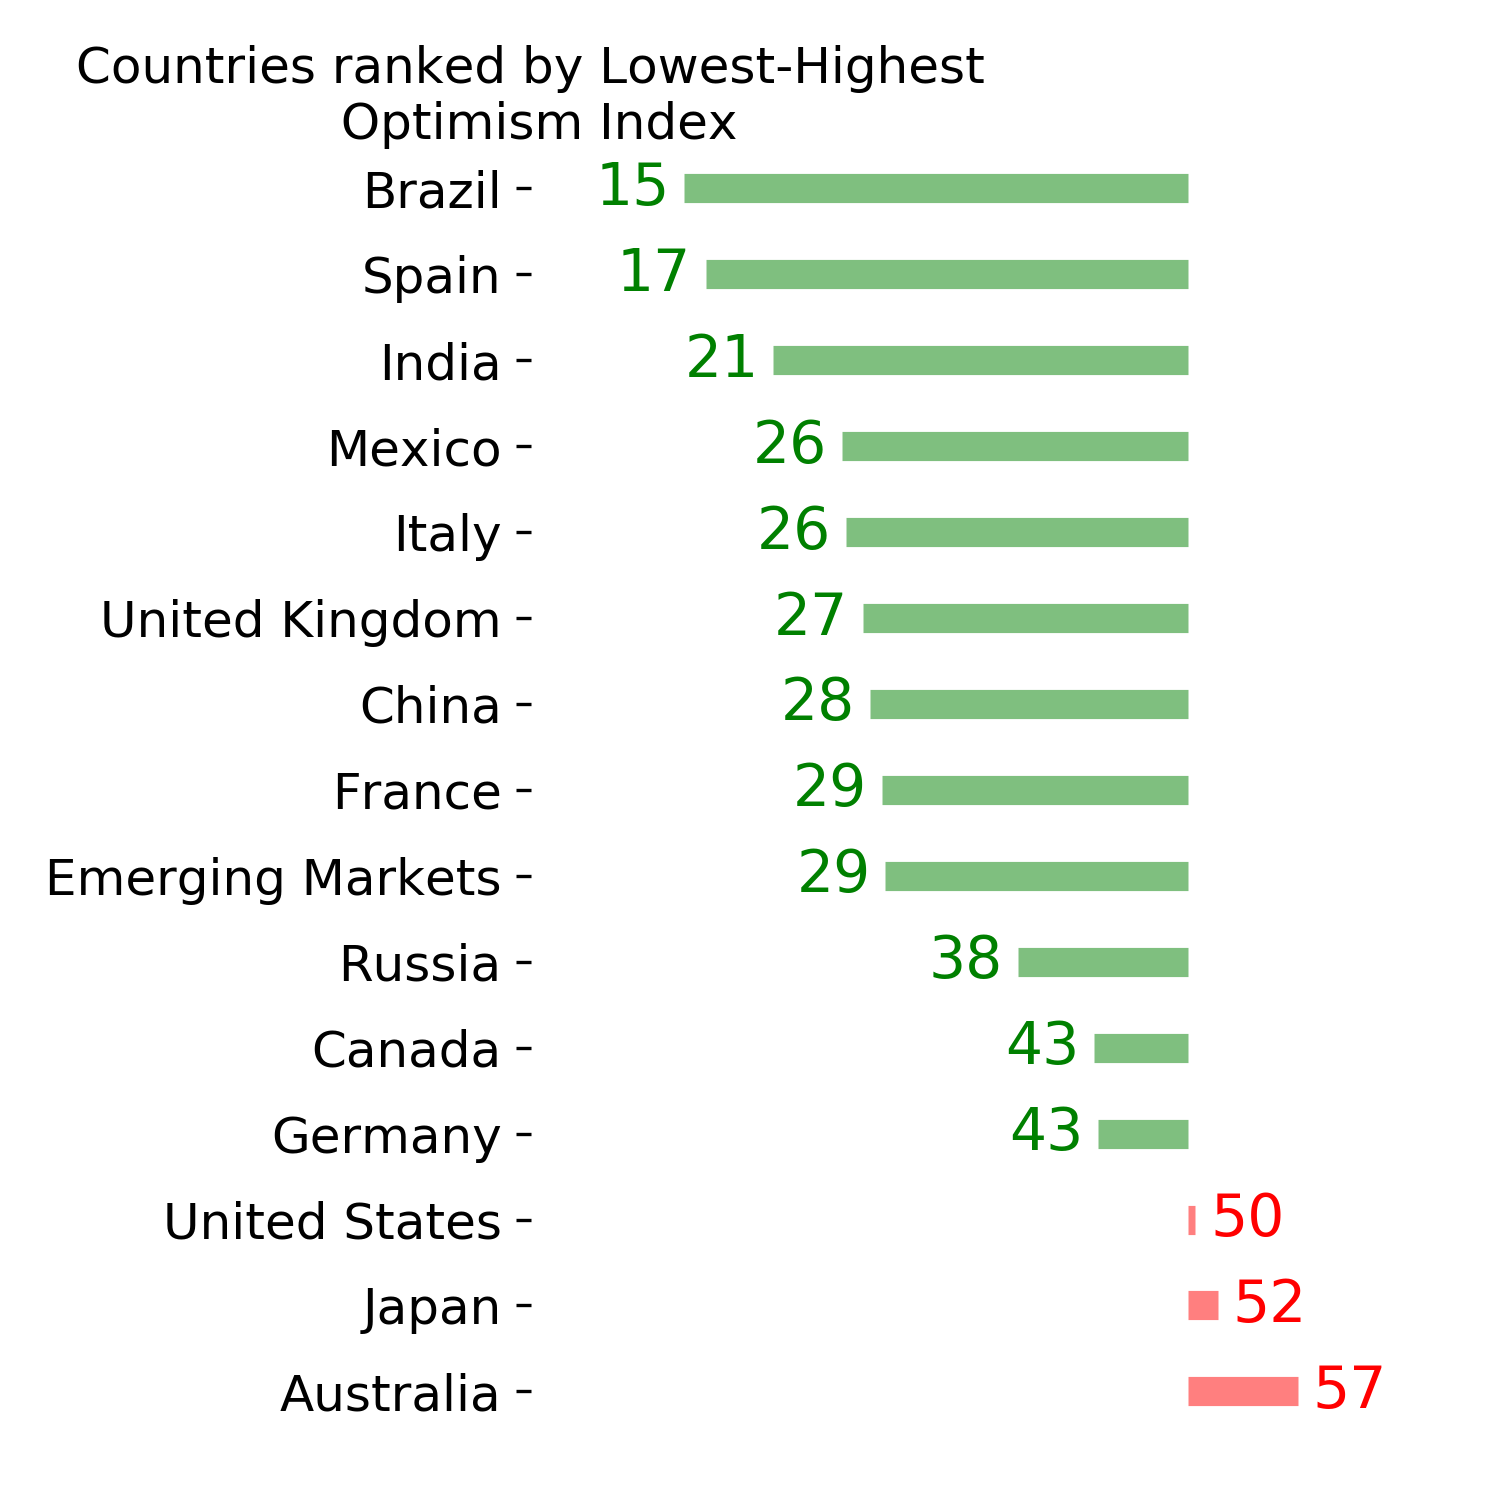
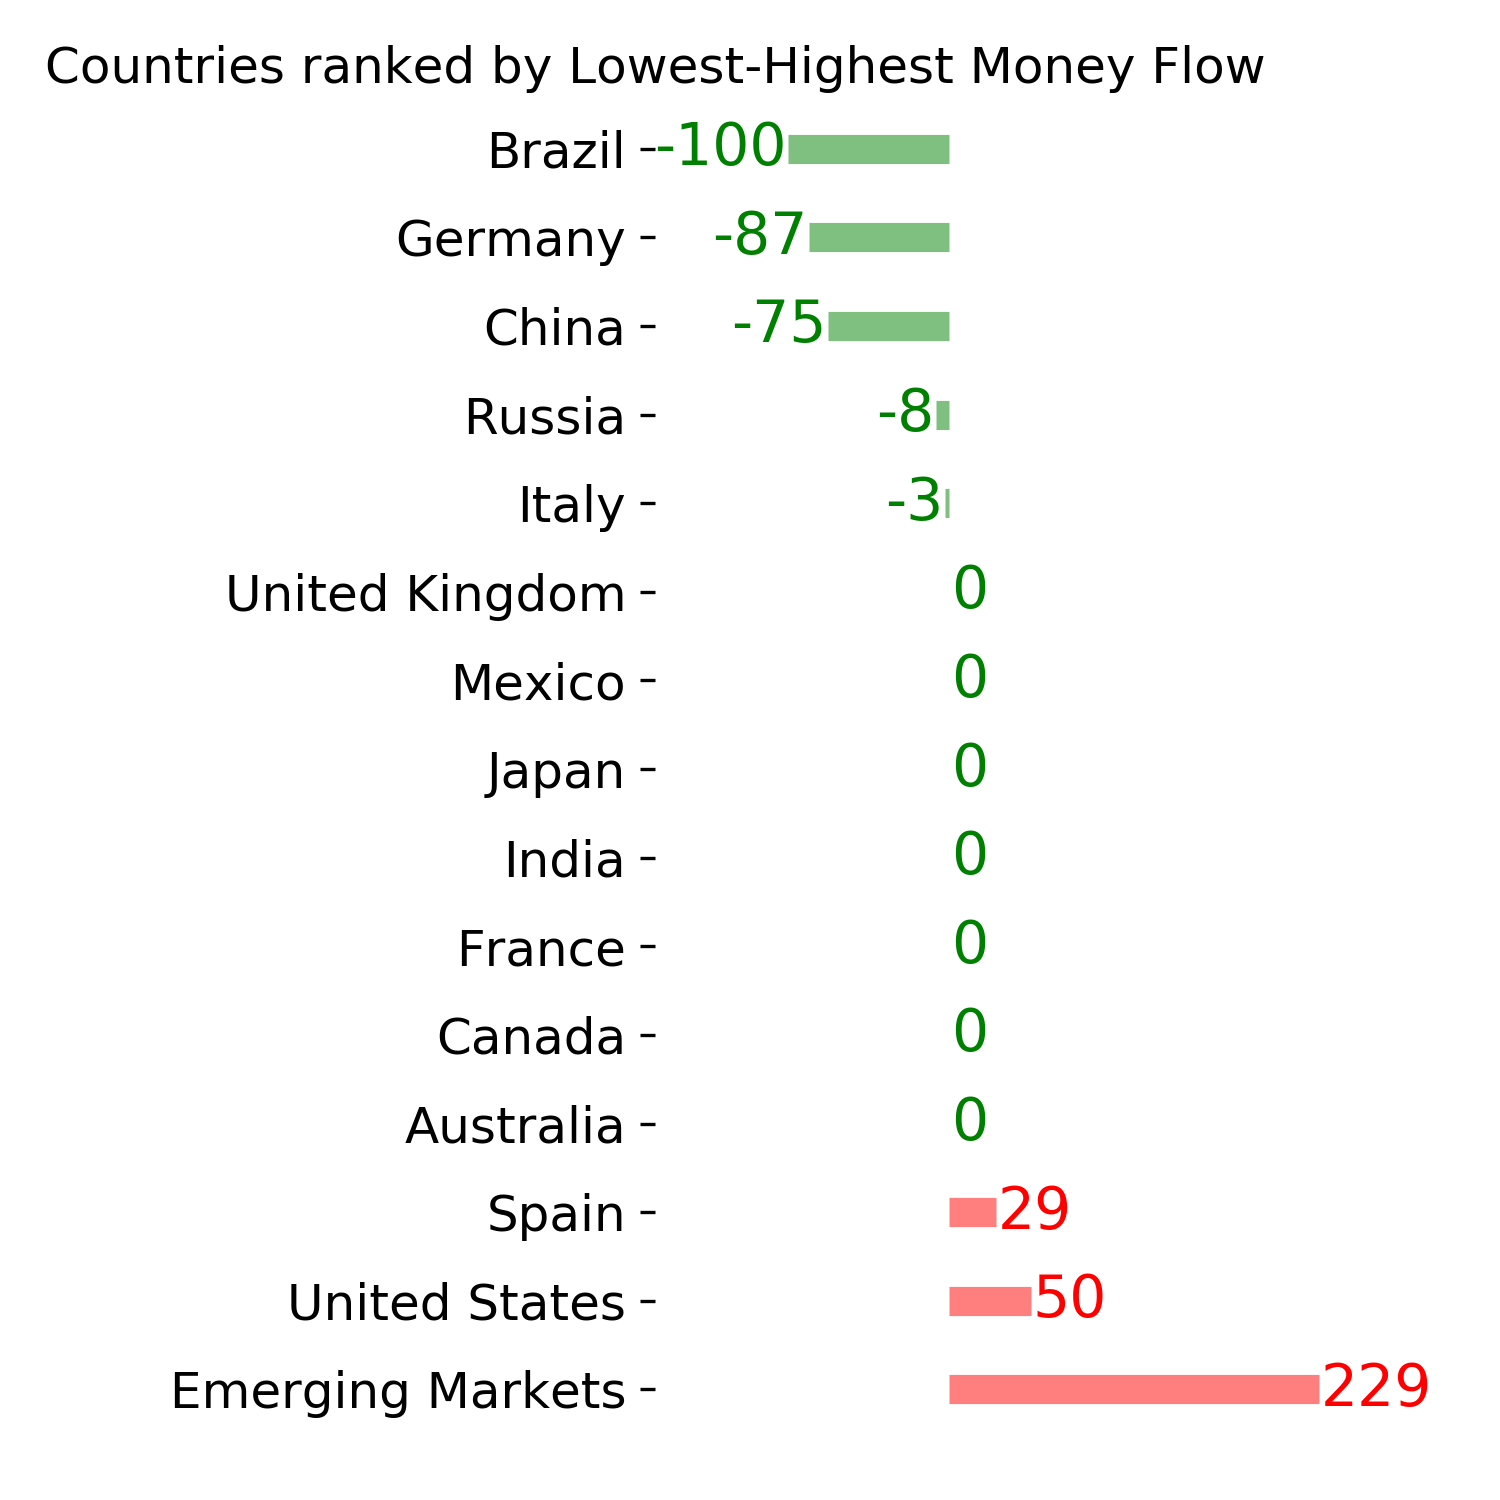
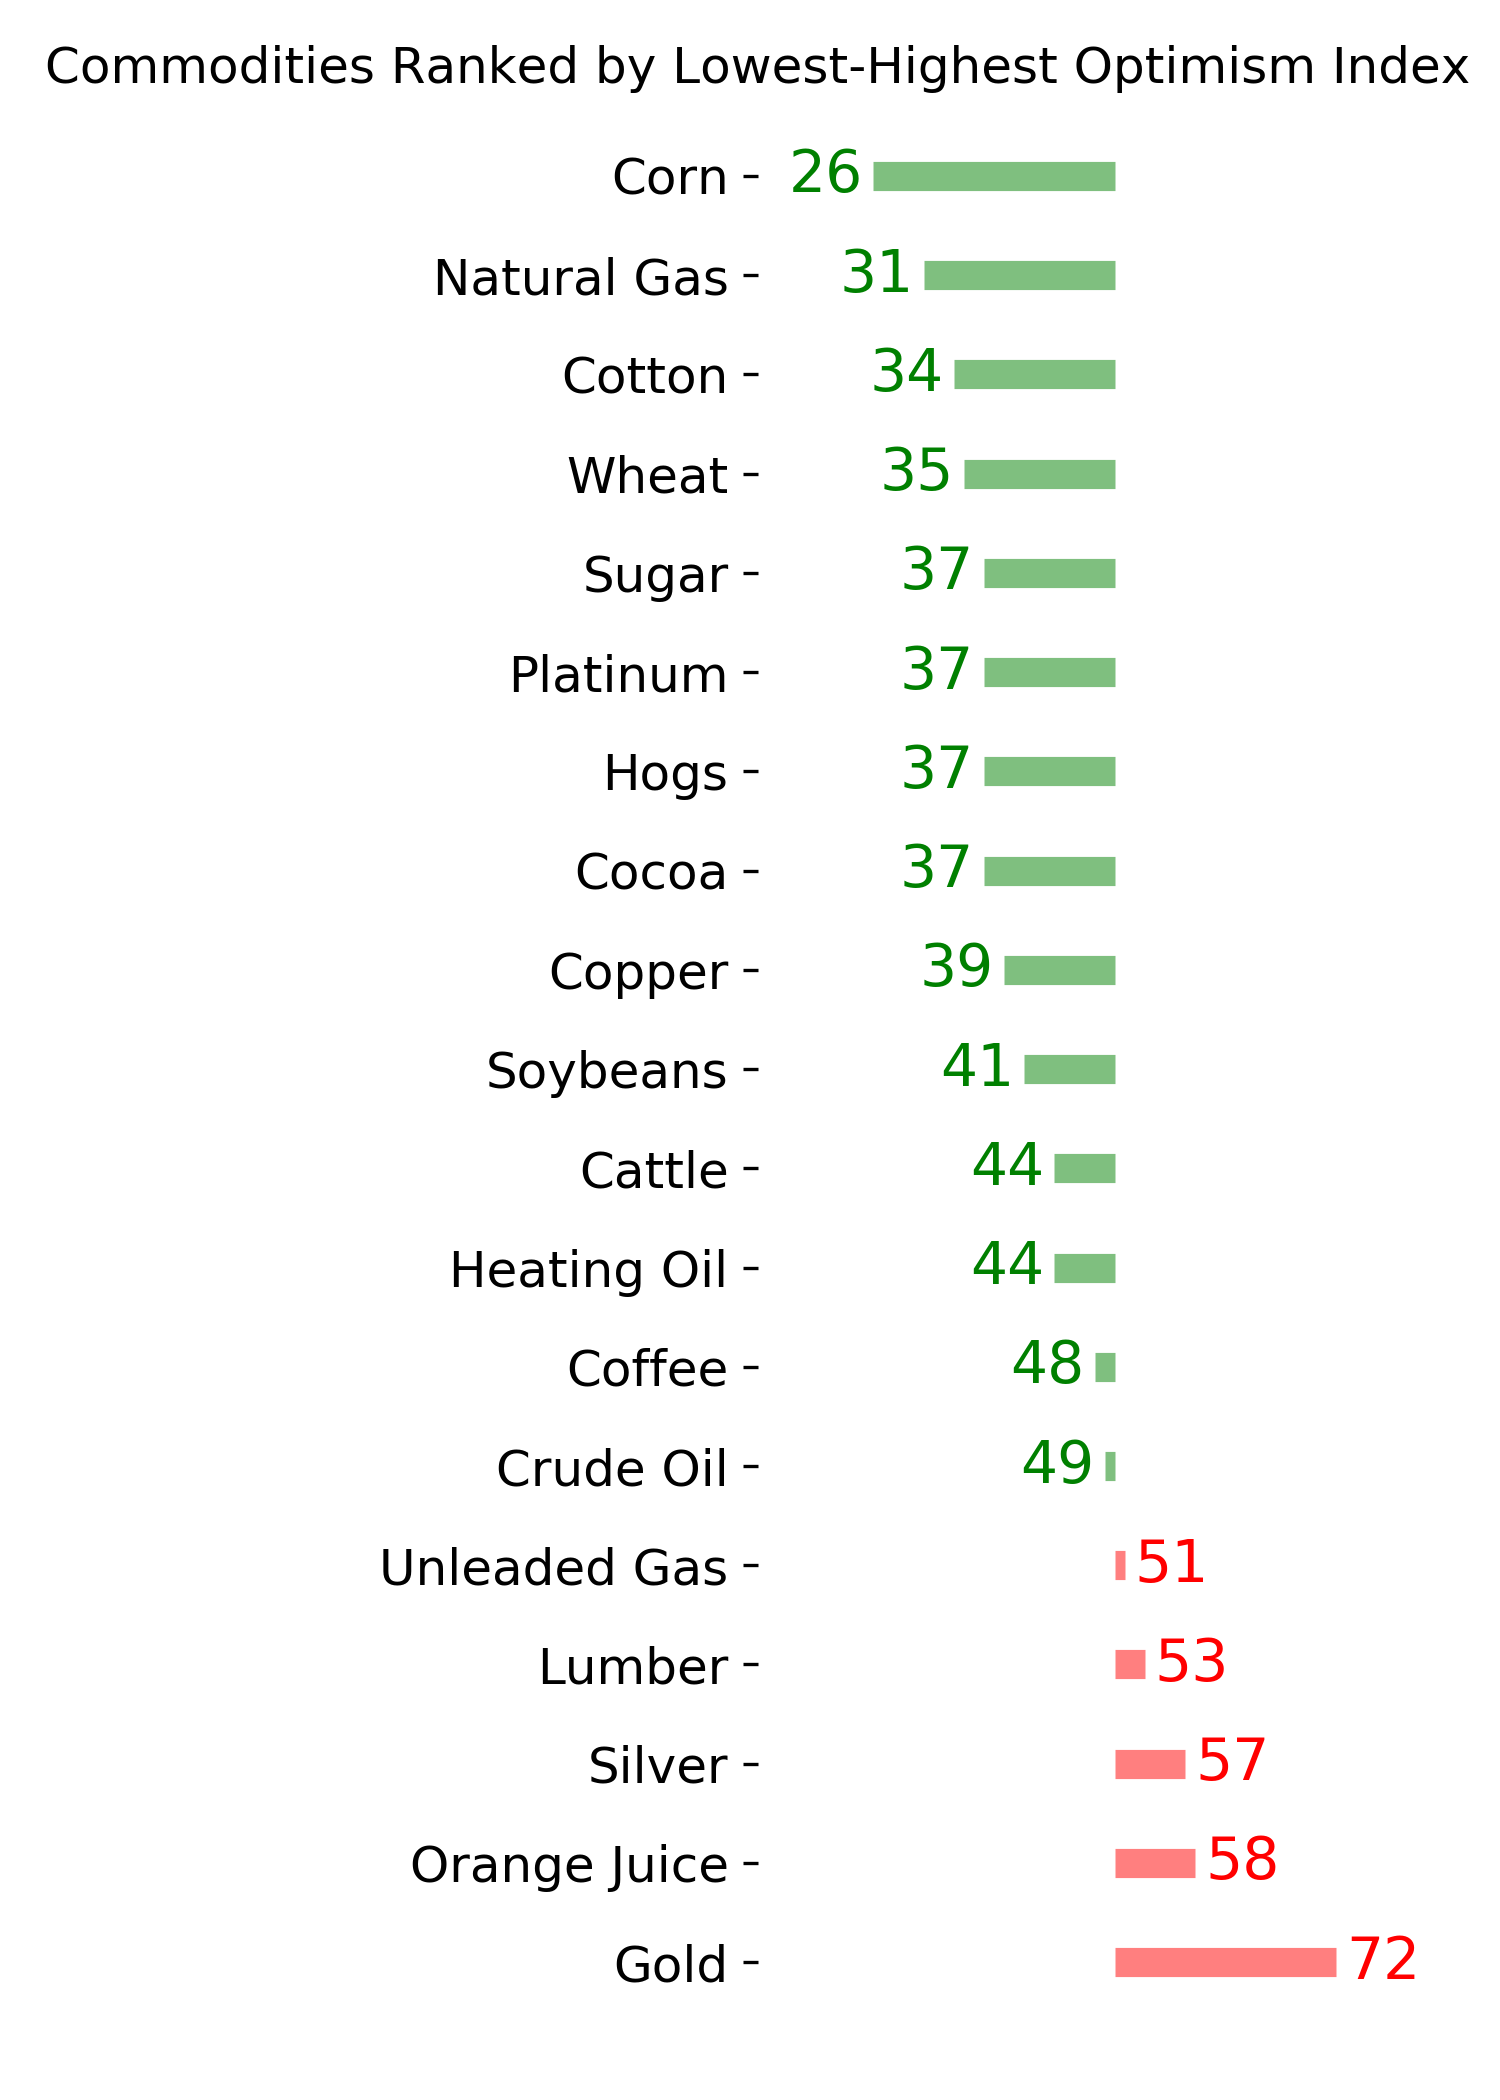
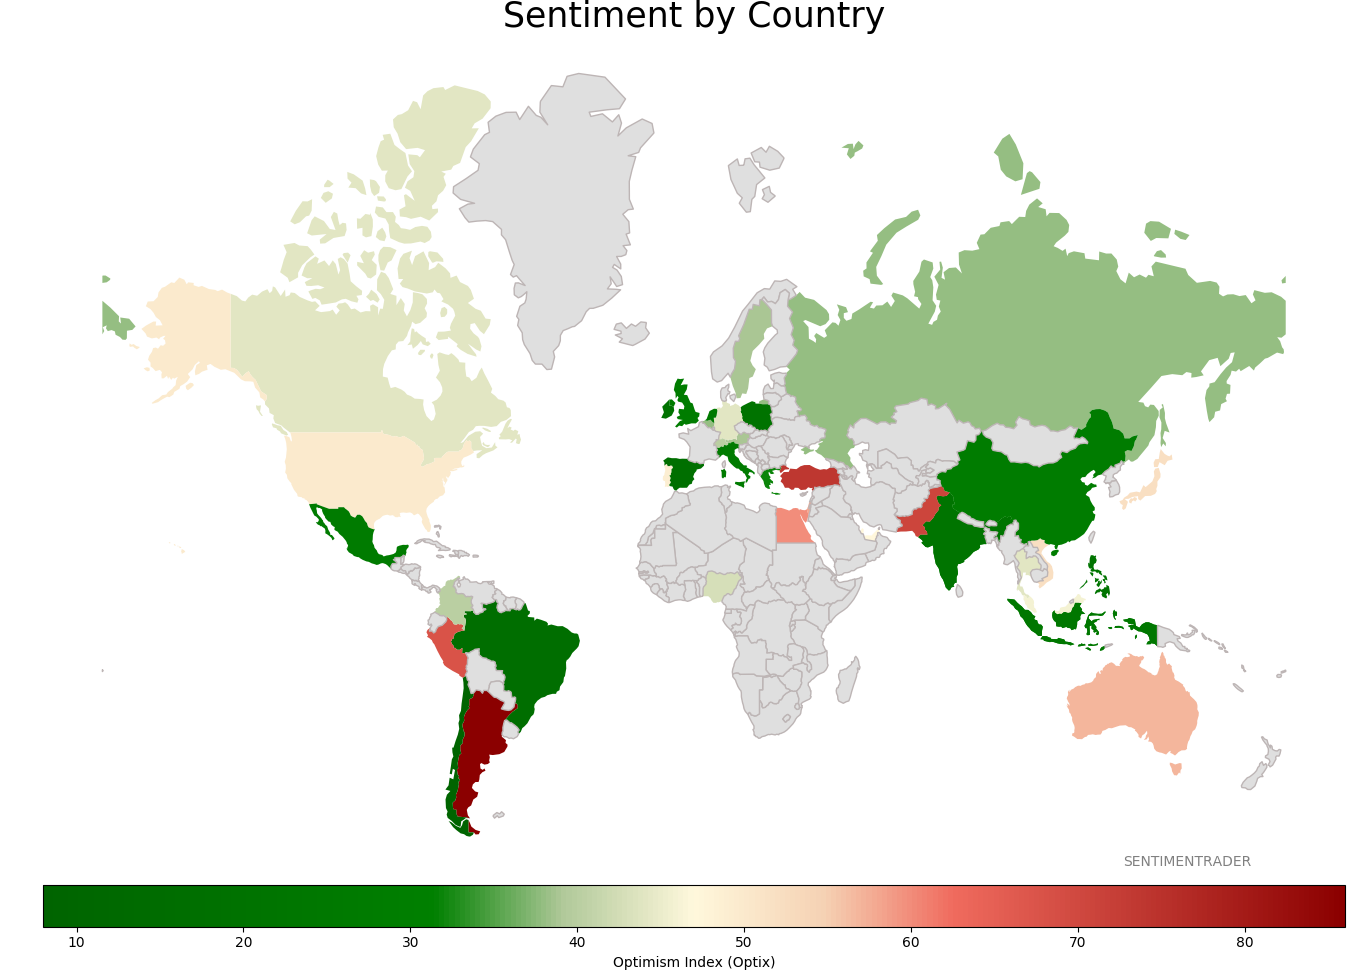
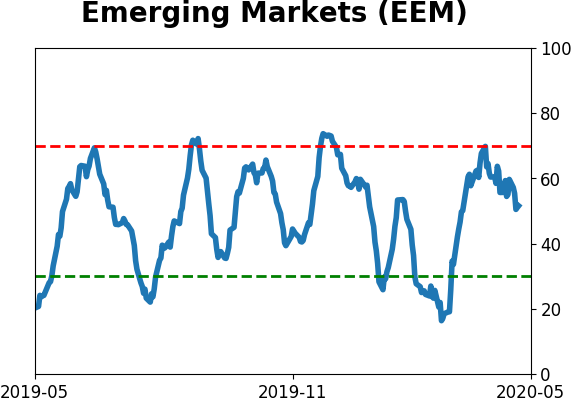
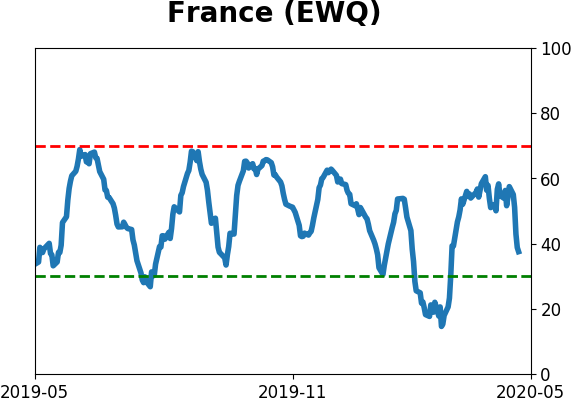
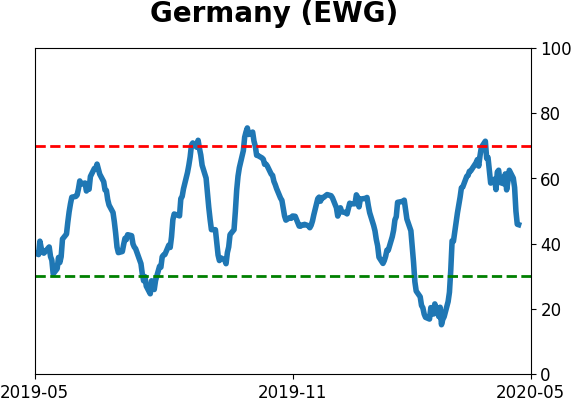
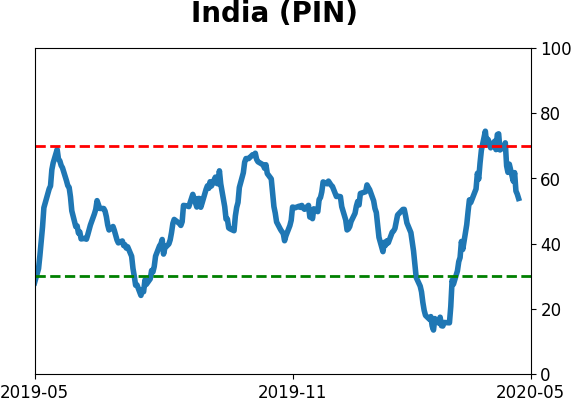
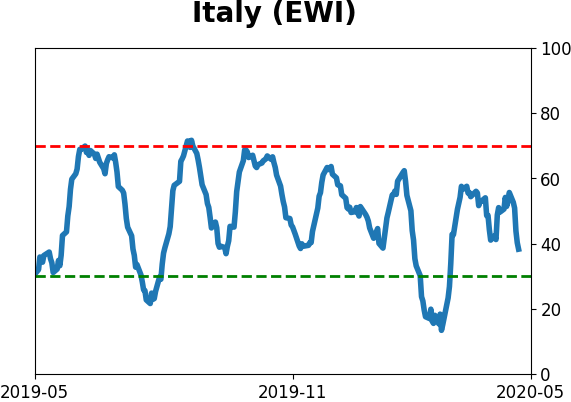
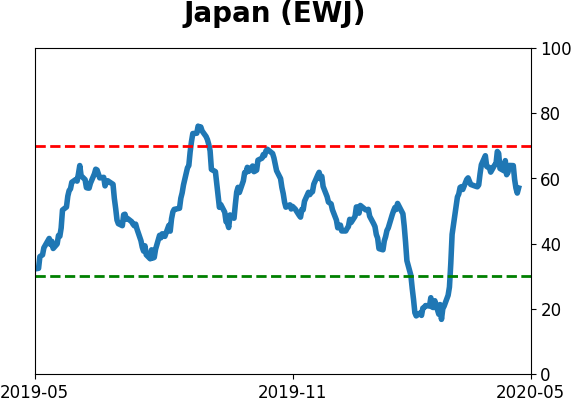
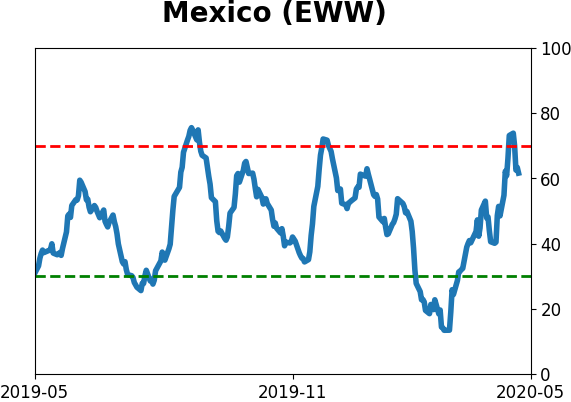
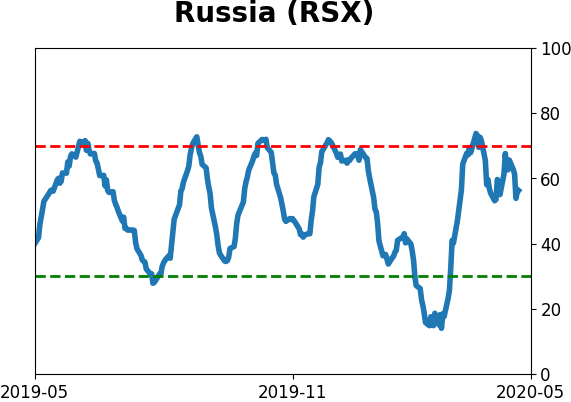
Sentiment Around The World
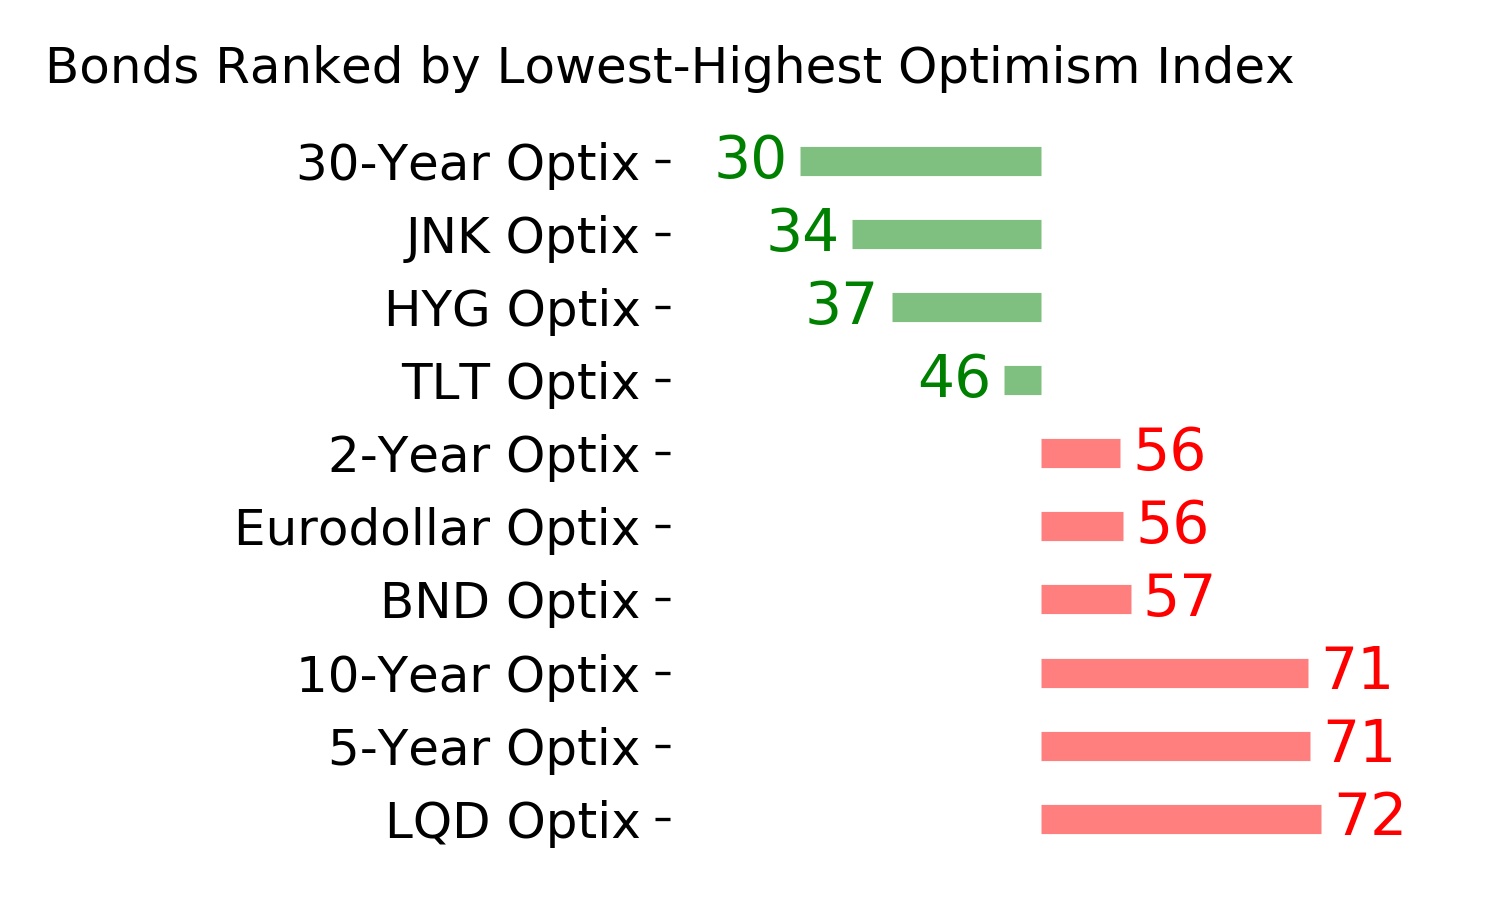
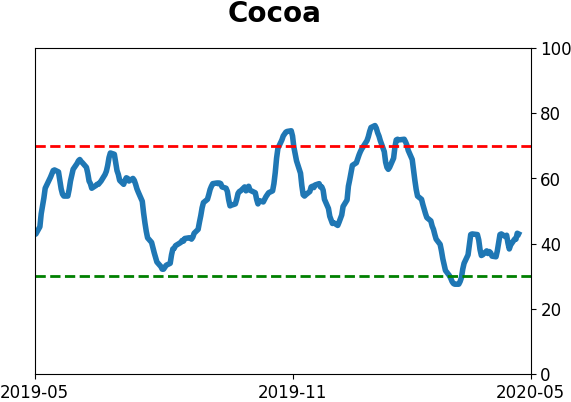
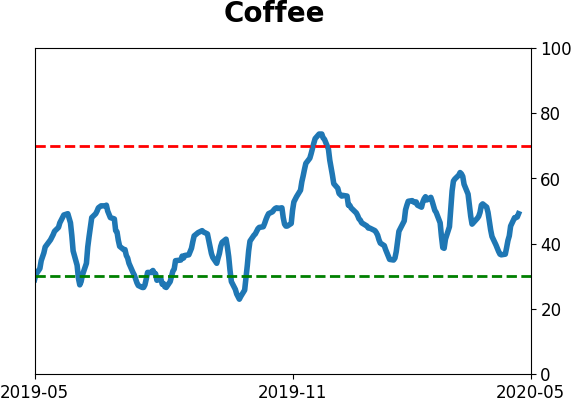
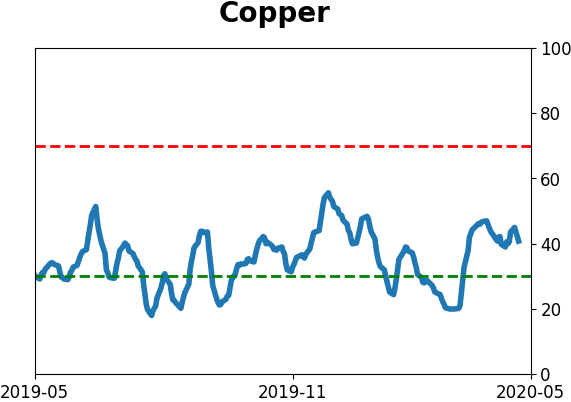
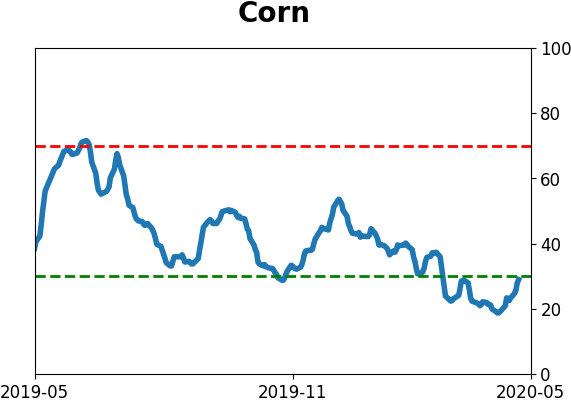
Optimism Index Thumbnails
|
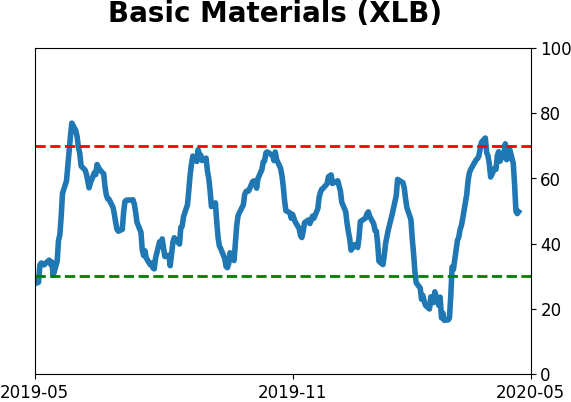
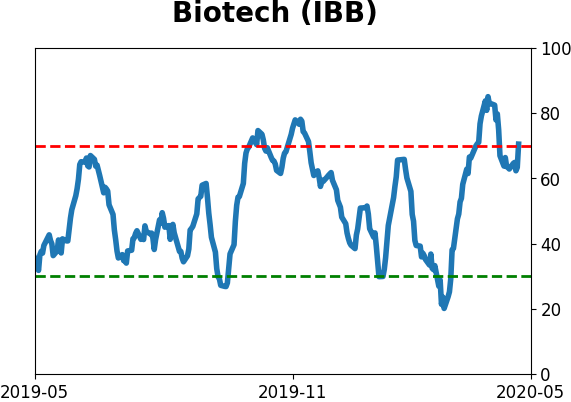
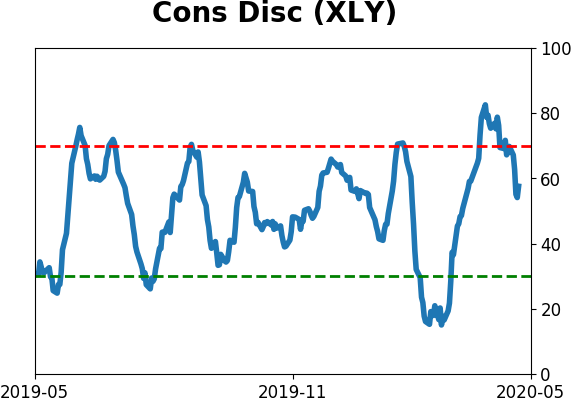
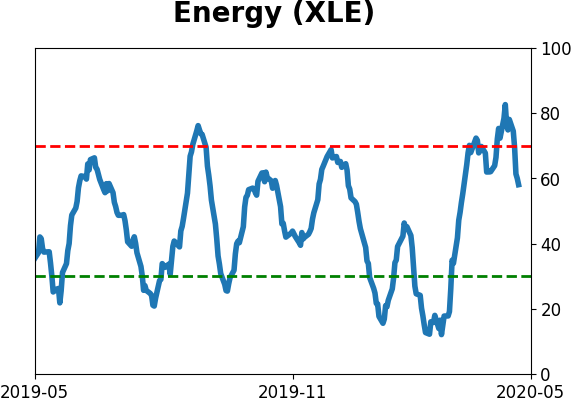
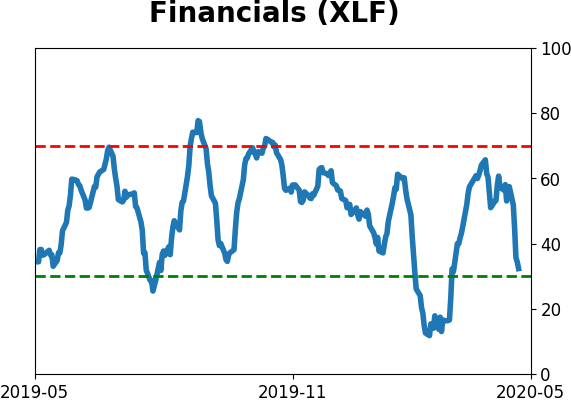
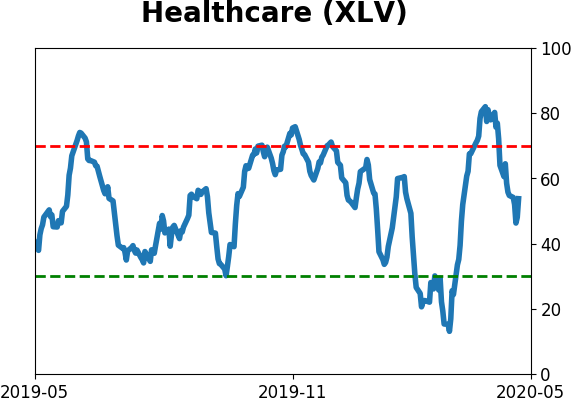
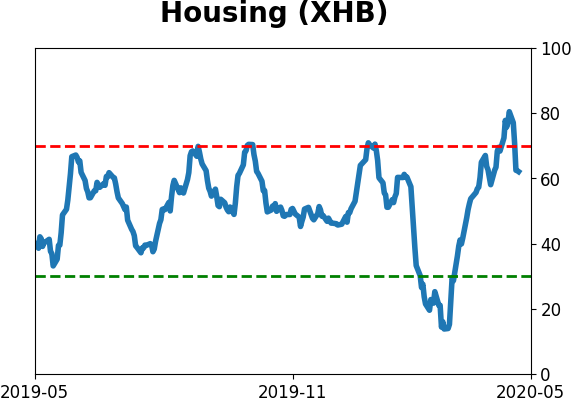
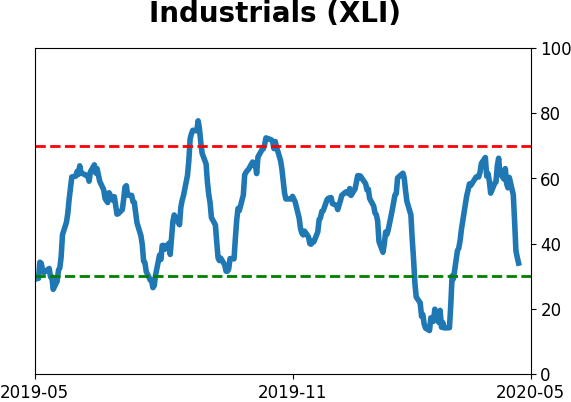
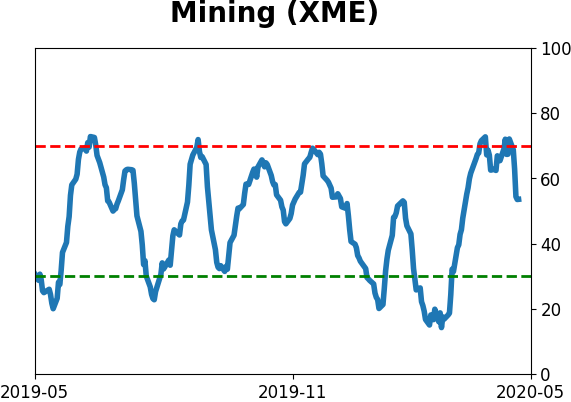
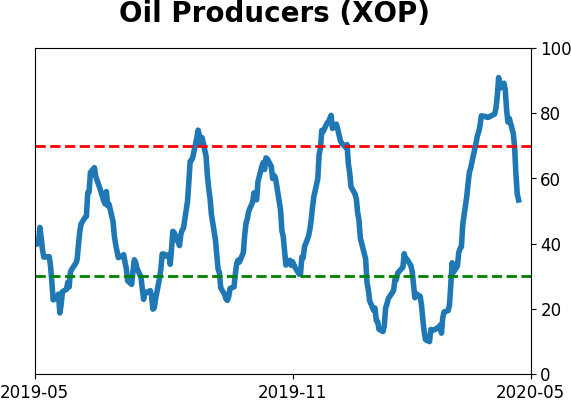
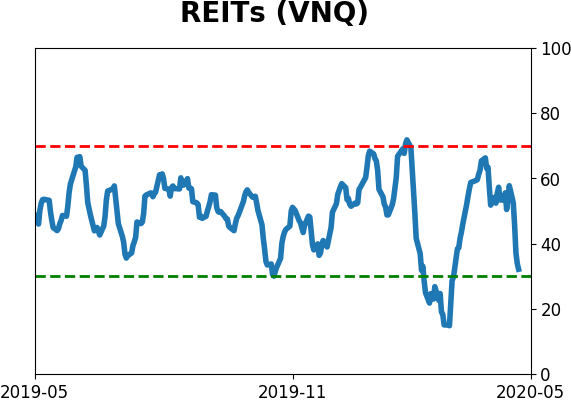
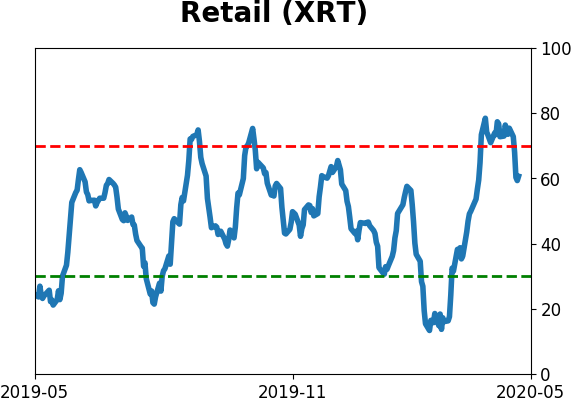
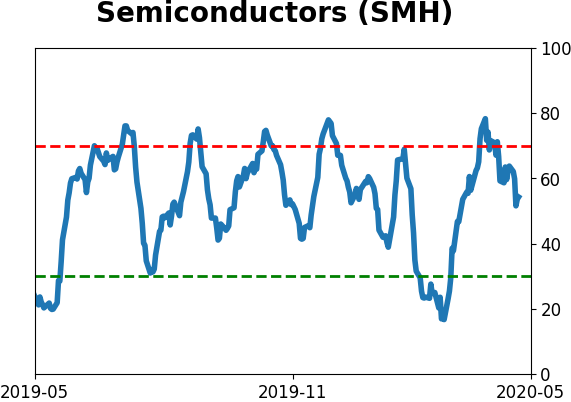
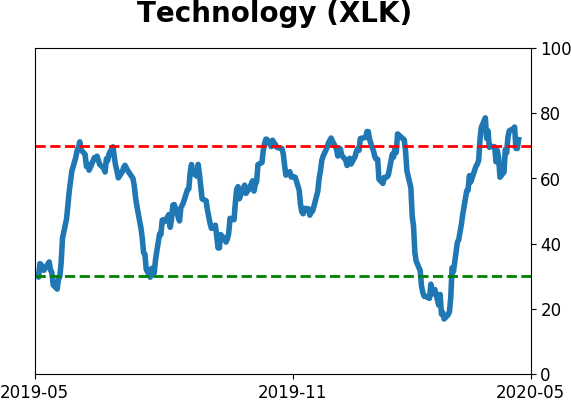
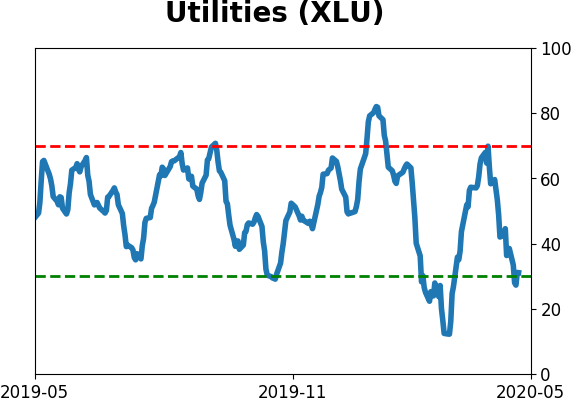
Sector ETF's - 10-Day Moving Average
|
|
|
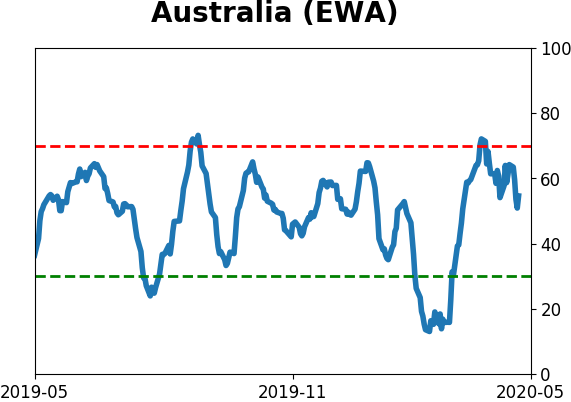
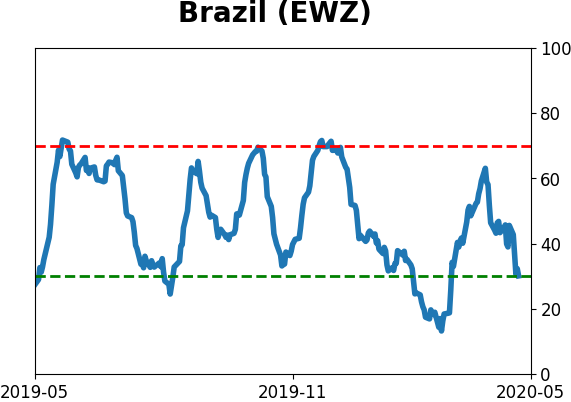
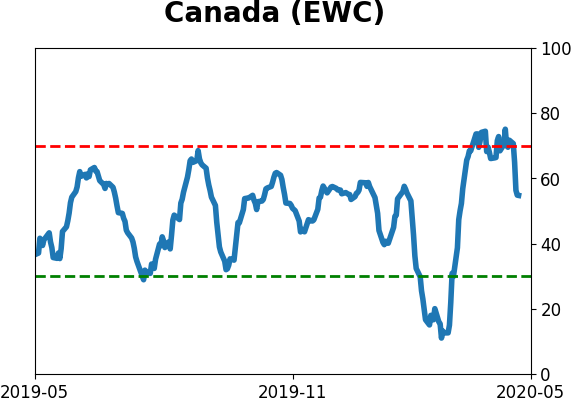
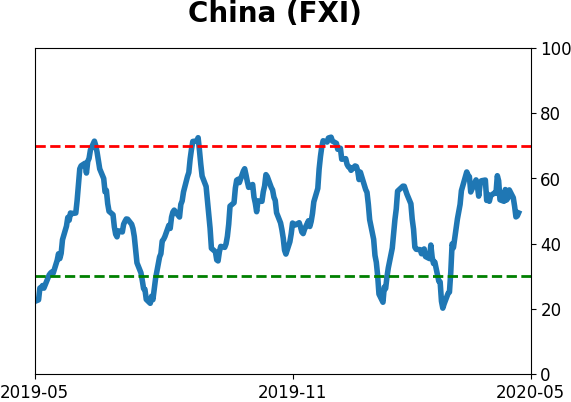
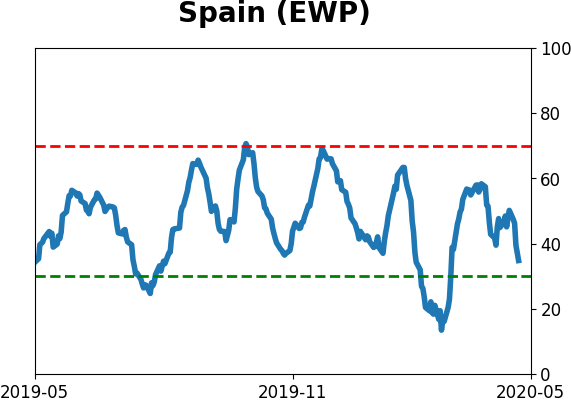
Country ETF's - 10-Day Moving Average
|
|
|
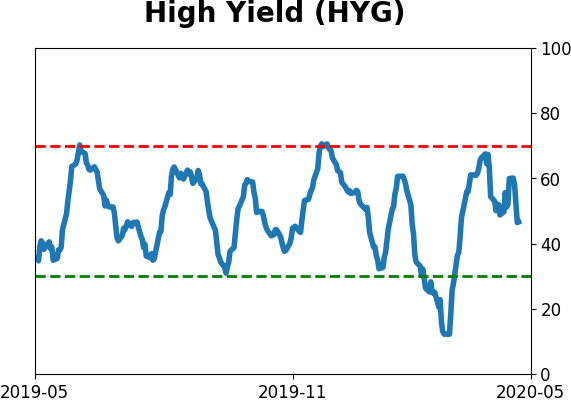
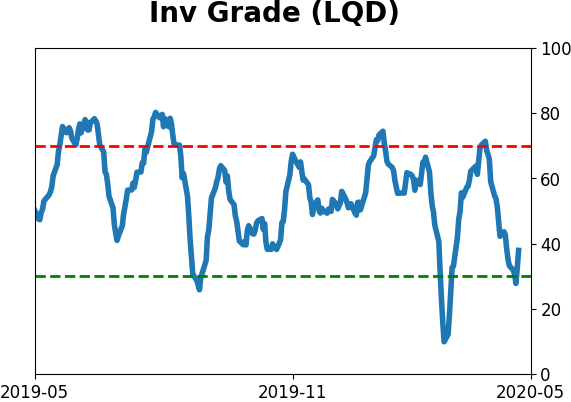
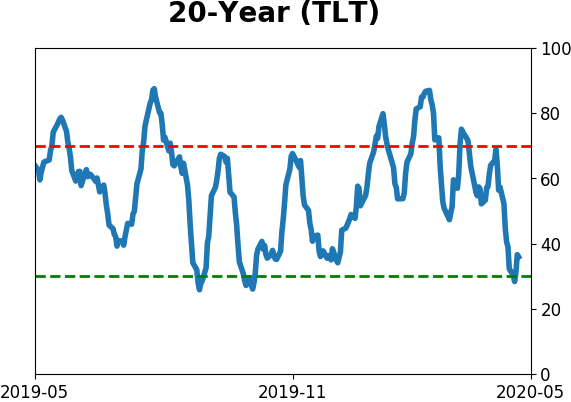
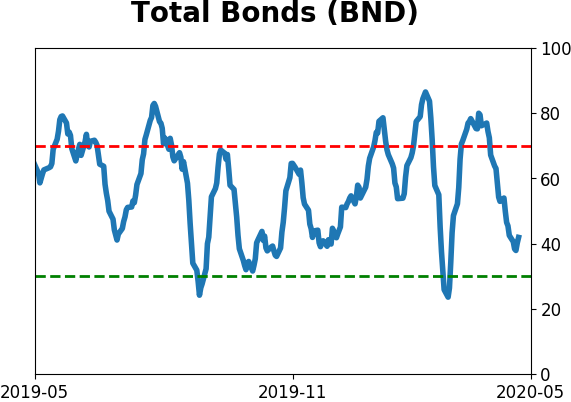
Bond ETF's - 10-Day Moving Average
|
|
|
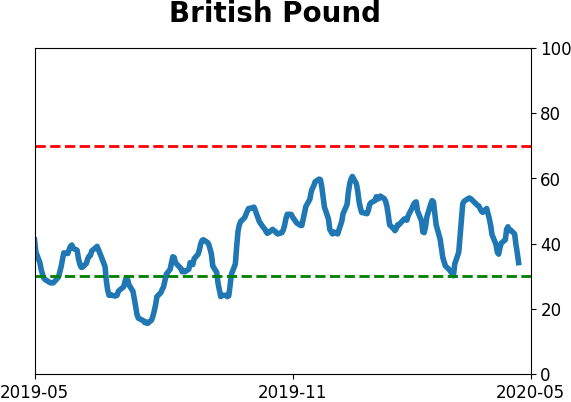
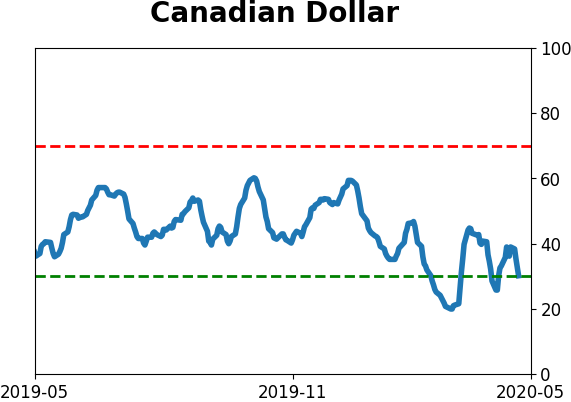
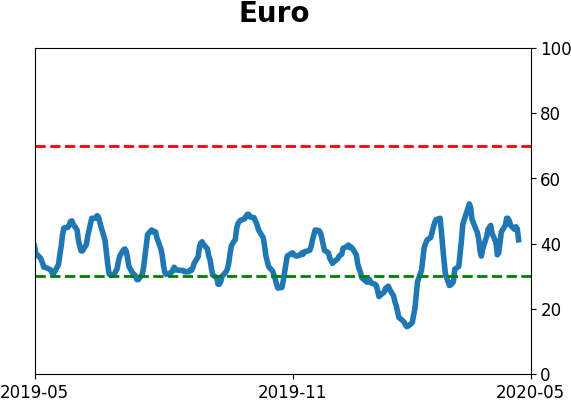
Currency ETF's - 5-Day Moving Average
|
|
|
Commodity ETF's - 5-Day Moving Average
|
|