Daily Report : Weekly Wrap for May 14 - A Remarkable Start But Tech and Small-Cap Struggles

| View/Print a PDF version of this Report |
Headlines
|
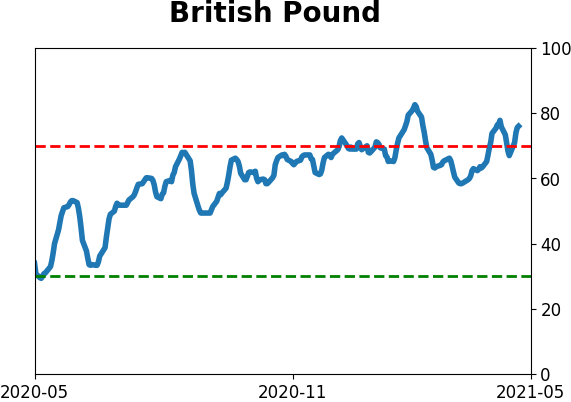
Weekly Wrap for May 14 - A Remarkable Start But Tech and Small-Cap Struggles: This week, we saw some weakness after one of the most remarkable starts to a year since 1896. Technology and small-cap stocks fell to multi-month lows relative to the S&P 500, as defensive sectors have perked up. The latest Commitments of Traders report was released, covering positions through Tuesday: The 3-Year Min/Max Screen shows that "smart money" commercial hedgers established only one new multi-year extreme in positioning this week, a short in the British pound. The Backtest Engine shows that over the past 10 years, anytime hedgers held more than 28% of open interest net short, the pound rose over the next 2 months after only 2 out of 15 weeks, and both of those gains were for less than 1%. Over the next 6 months, it lost ground every time. There were no real moves of note in other contracts, as they either continued existing extremes or slightly reduced positions. Bottom Line: See the Outlook & Allocations page for more details on these summaries STOCKS: Weak sell BONDS: Hold GOLD: Weak buy |
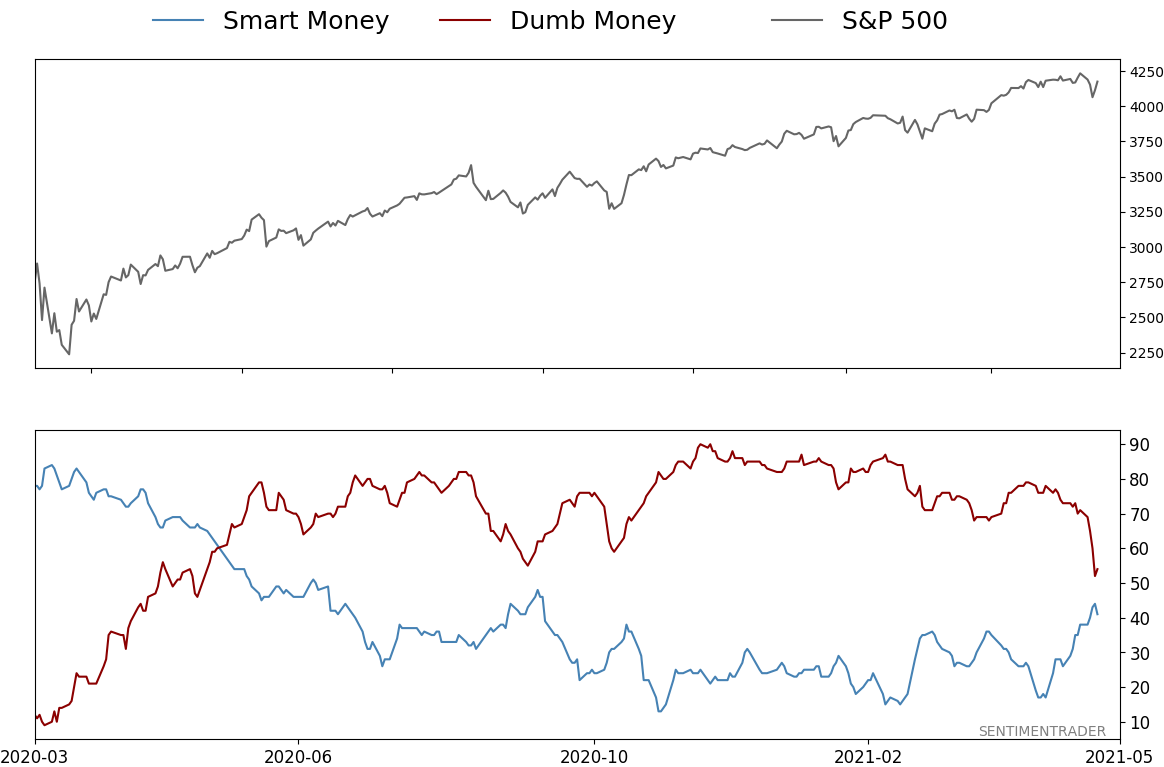
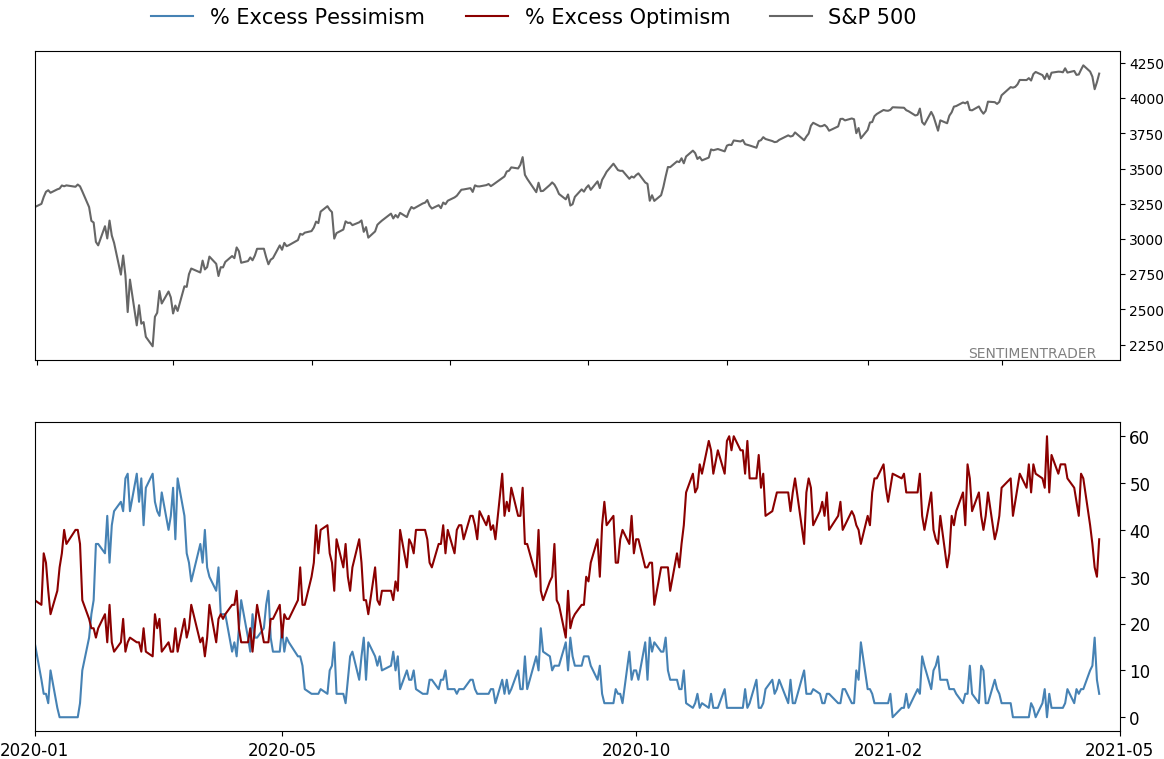
Smart / Dumb Money Confidence
|
|
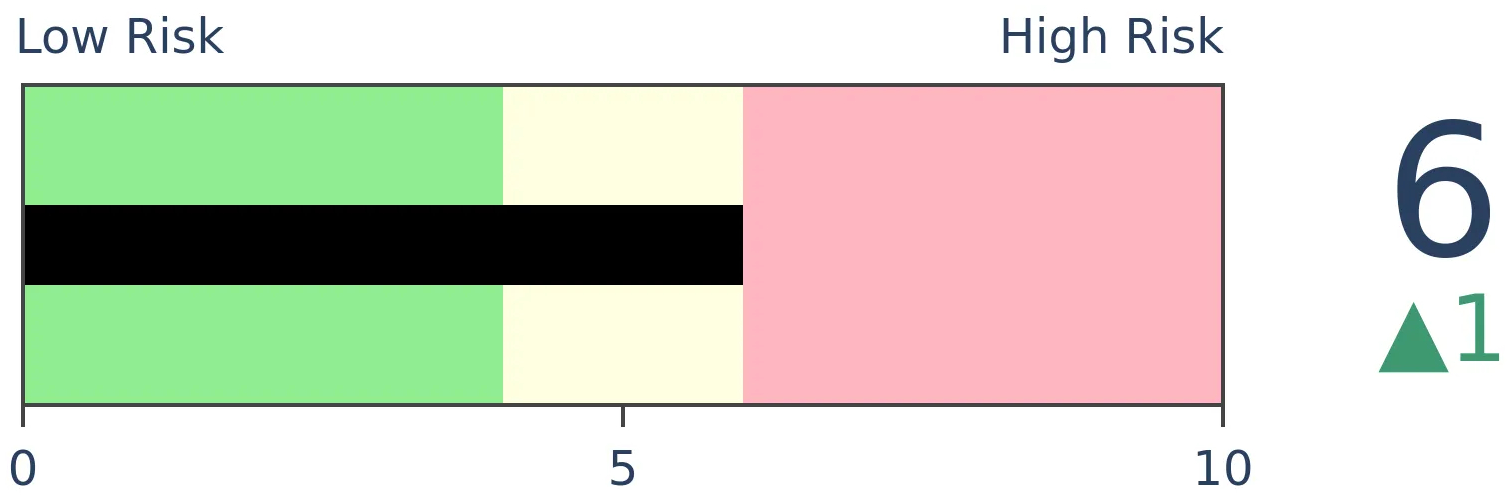
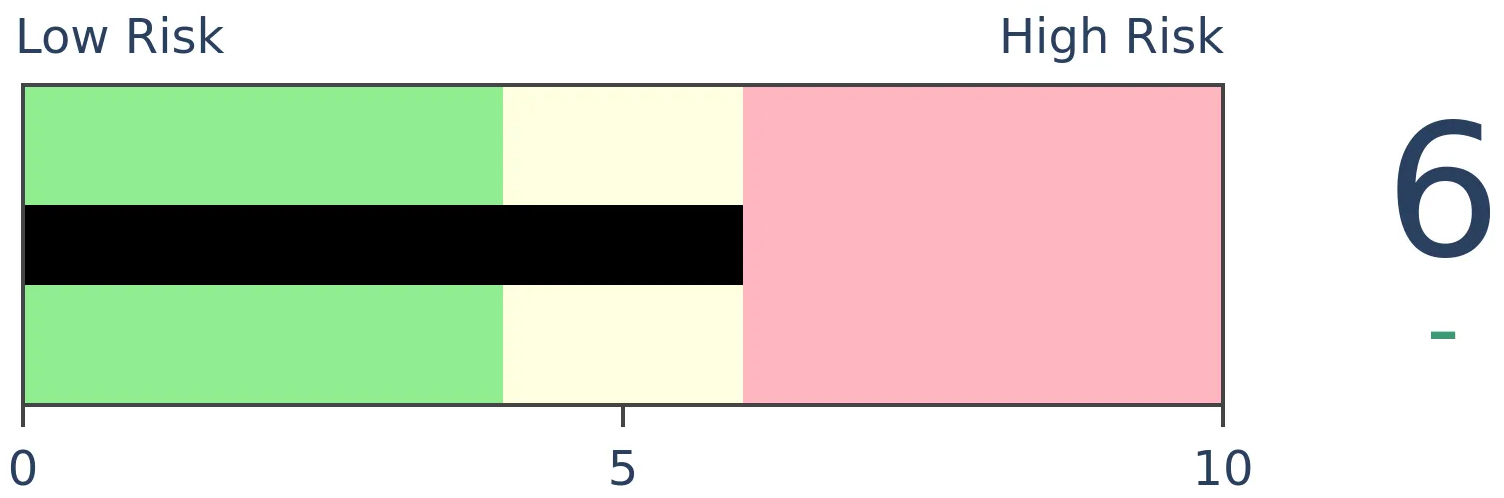
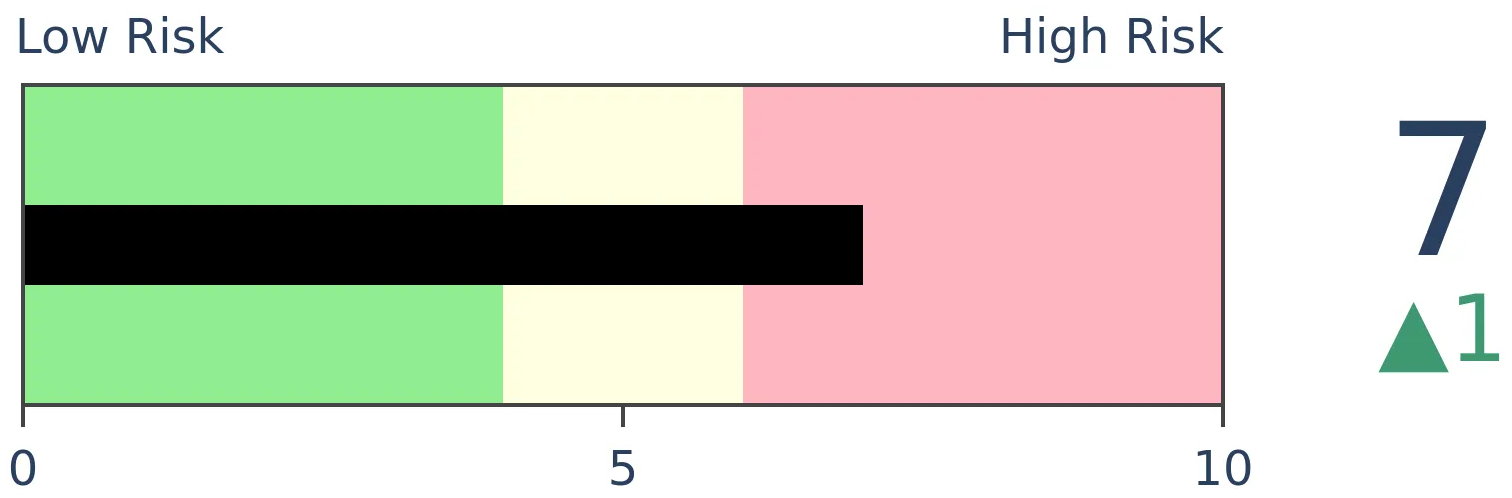
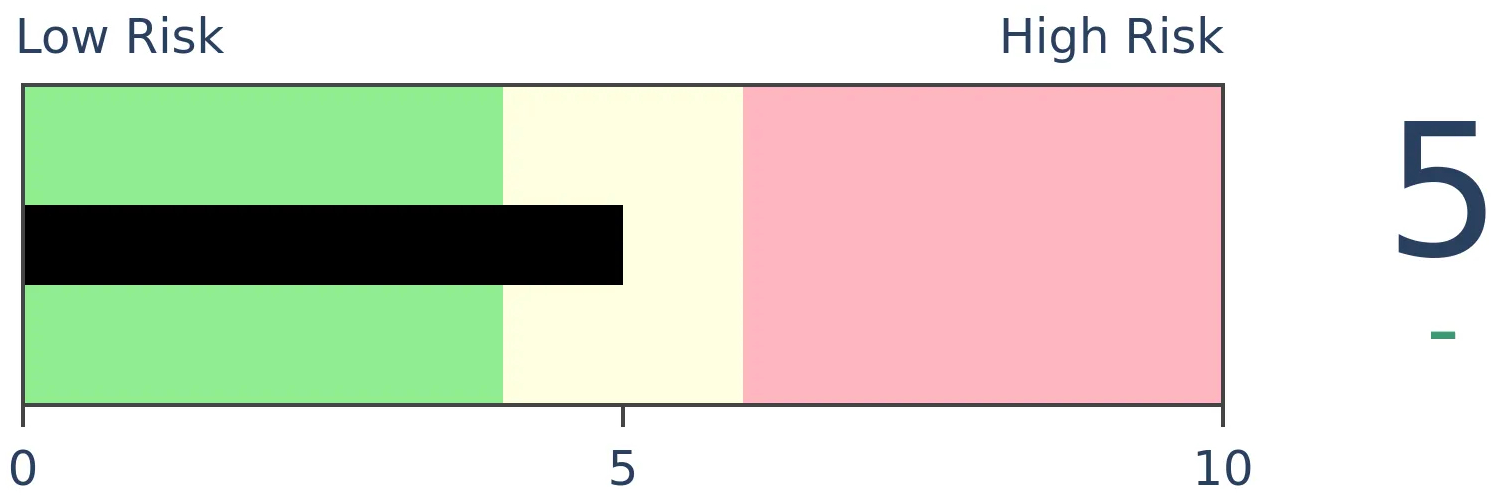
Risk Levels
|

|

|
Research
Weekly Wrap for May 14 - A Remarkable Start But Tech and Small-Cap StrugglesBOTTOM LINEThis week, we saw some weakness after one of the most remarkable starts to a year since 1896. Technology and small-cap stocks fell to multi-month lows relative to the S&P 500, as defensive sectors have perked up. FORECAST / TIMEFRAME |
The goal of the Weekly Wrap is to summarize our recent research. Some of it includes premium content (underlined links), but we're highlighting the key focus of the research for all. Sometimes there is a lot to digest, with this summary meant to highlight the highest conviction ideas we discussed. Tags will show any symbols and time frames related to the research.
| STOCKS | ||
 |  | |
Despite some tumult under the surface and weakness in tech stocks and other speculative areas and a shaky start to the week, the Dow Industrials Average has held up its reputation as a stalwart.
The venerable index has been consistently strong enough to score 24 record closing highs this year alone. Through trading day #87, this is tied for the 6th-best year since 1896.
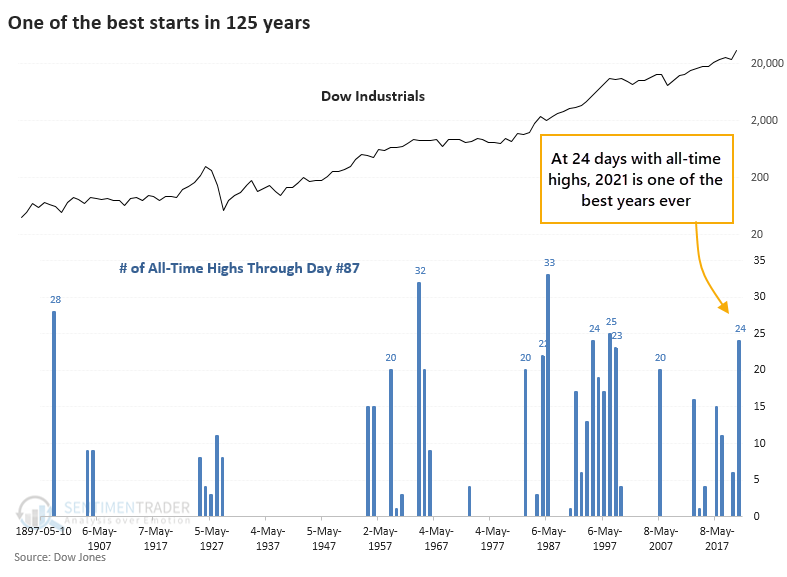
It was a bit of a struggle for the Dow to hold its momentum in the shorter-term, and even medium-term returns were mixed. Granted, relying on price action from 1899 - the year humans had just invented the paperclip - might be a stretch.
Looking at the average price path from those years, we can see the struggles once the year reached its current point.
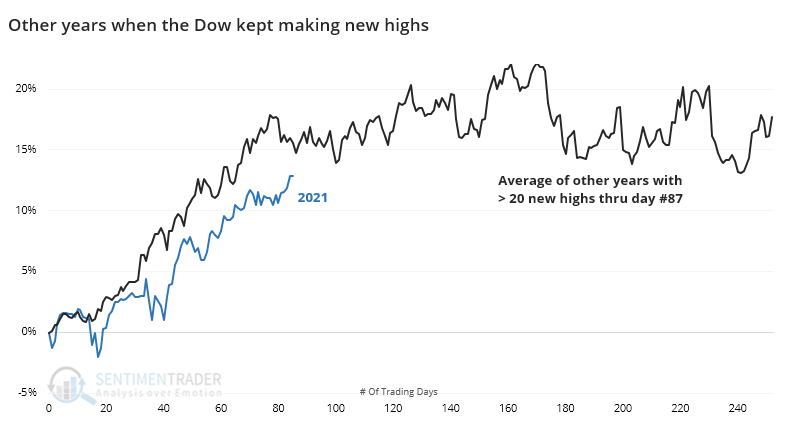
We tend to place more weight on recent occurrences, and the only two that are fresh in investors' memories are 2007 and 2013, both of which saw further gains during May, then a stumble into June before recovering with okay gains the rest of the year.
LOTS OF NEW HIGHS AND REVERSALS
On Friday, nearly a third of stocks in the S&P 500 managed to hit a 52-week high on that day alone. Then it skyrocketed to a stunning 78-year high on Monday.
Even Friday's reading was so high that it was matched by only 7 other days in more than 20 years. The Backtest Engine shows how the index performed after the others.
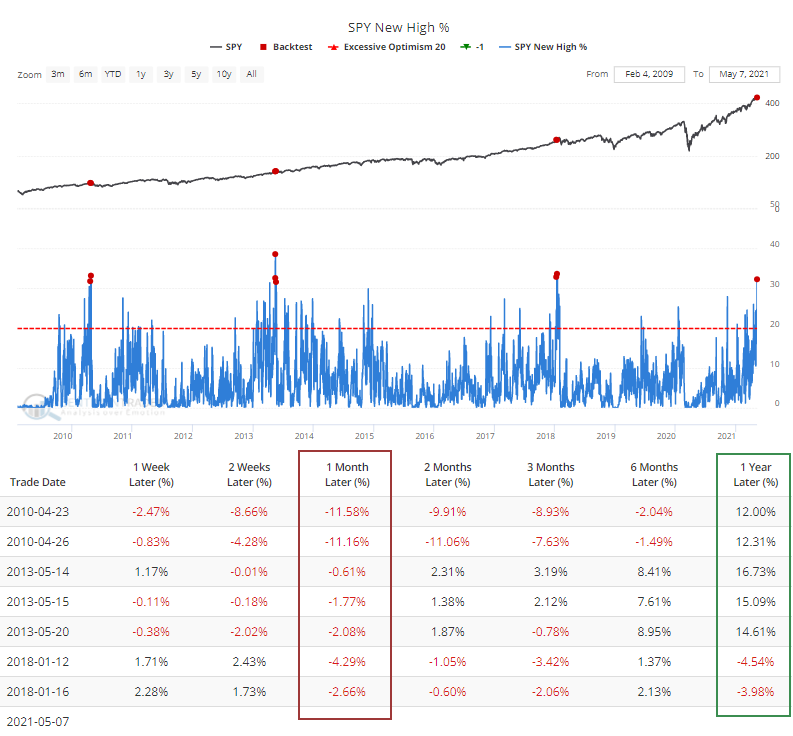
Every one of the sessions preceded a loss over the next month, but those losses were front-loaded, and over the next 6-12 months, stocks rebounded.
Dating back to 1928, this is among the months with the greatest participation ever, and that's before Monday's remarkable session. Monday was odd in many respects, not the least being another surge in stocks setting 52-week highs. More than 44% of S&P members notched a high in the morning, the most since 1943.
The burst of gains and push to new highs early on Monday was reversed during the session, causing a spike in the number of stocks suffering a buying climax. This is triggered when a stock hits a 52-week high then reverses to close below the prior day's close, potentially a sign of exhaustion among buyers.
The Backtest Engine shows that this is the 6th-largest number of climaxes in a single day since the inception of SPY.
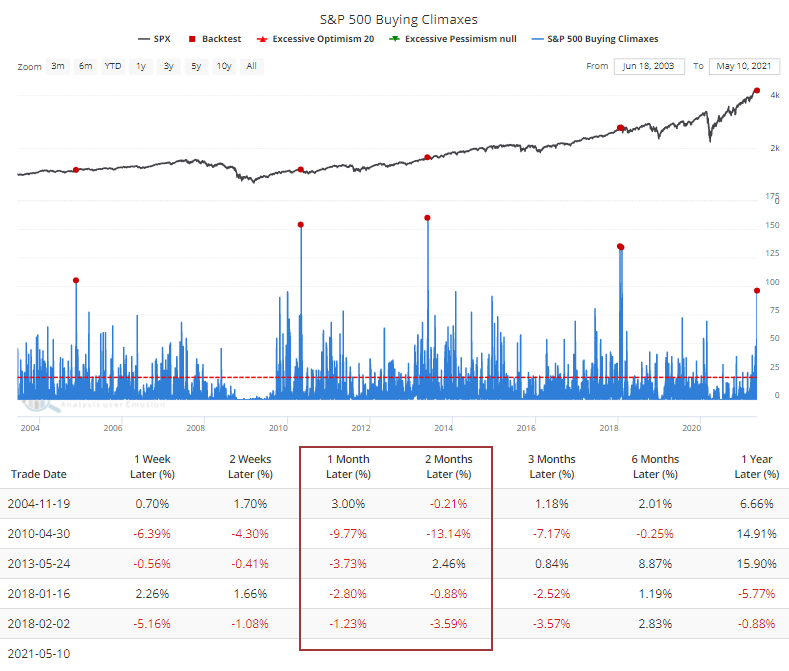
Every time more than 95 stocks suffered a buying climax, the S&P 500 showed a loss over the next 1-2 months. Again, though, there were few losses over the next 6-12 months, and they were relatively small.
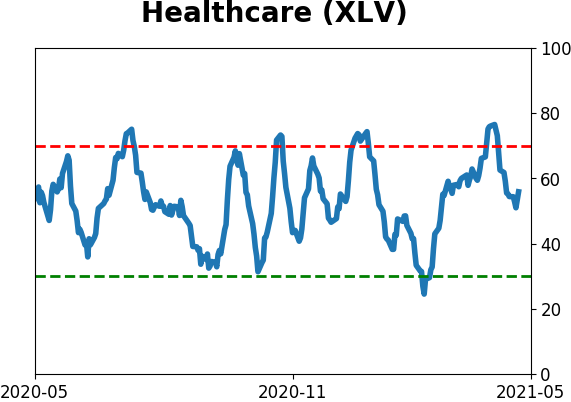
DEFENSIVE STOCKS SOUND A WARNING
Dean noted that the defensive sector composite model issued a new risk-off warning alert on the close of trading on Tuesday. Historically, it's not uncommon to see a signal after the market has been consolidating, which has been the case. The model is a secondary risk management tool and is not a component of the TCTM Risk Warning Model.
It seeks to identify periods when traditionally defensive sectors are outperforming the broad market as the S&P 500 maintains a level near its 252-day high. Typically, defensive sectors lag during bull market phases. Therefore, we should heed the market message when the sectors begin to outperform.
The composite includes 4 measures of defensive stocks outperforming the S&P 500 index. If 2 or more of them are outperforming the S&P, it gives a risk-off signal.
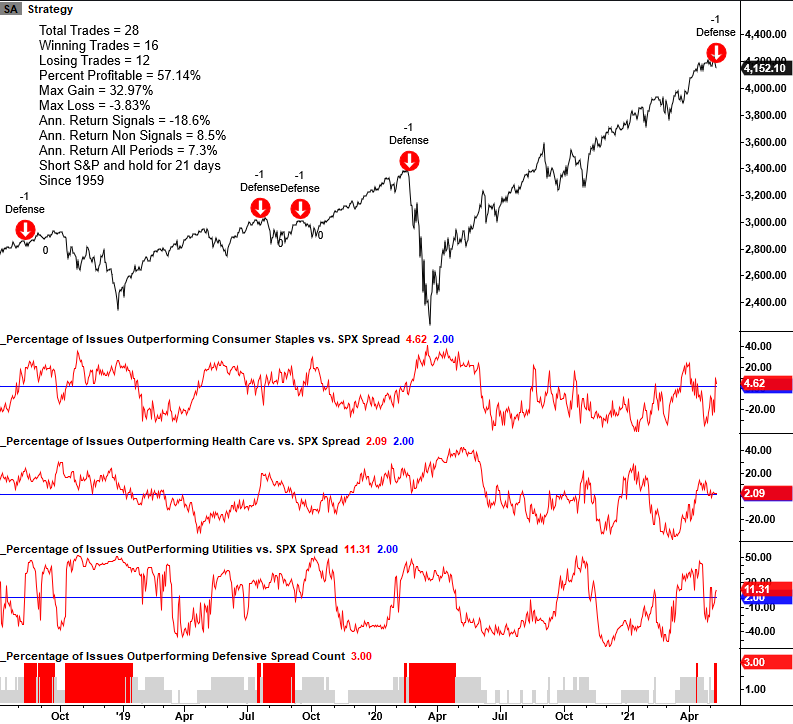
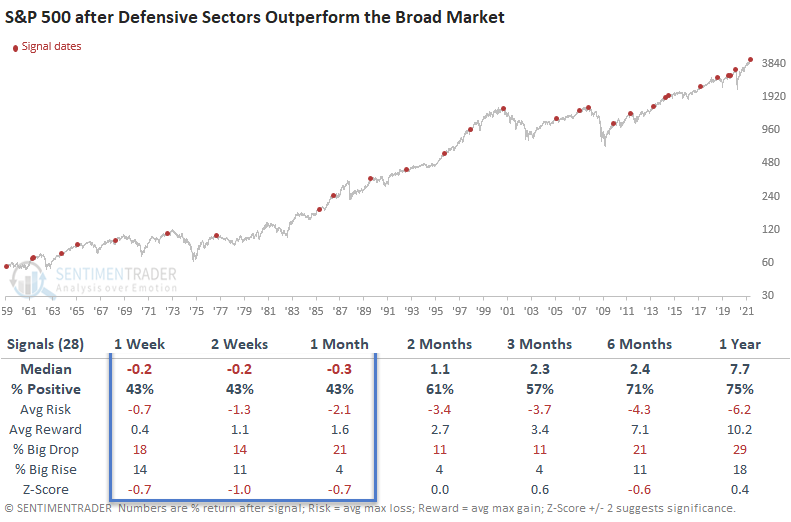
After other signals, returns were weak over the next 1-4 weeks.
CREDIT SPREADS - TOO MUCH OF A GOOD THING?
We keep reading about how the economy is heating up and the implication is that this is good for the stock market going forward. But the stock market is a discounting mechanism. As a result, much impending "Good Economic News" may already be priced in.
In that vein, Jay considered the message from credit spreads.
In times of economic uncertainty, the yield on lower-rated bonds tends to soar relative to high-rated ones. On the flip side, when the economy is humming along, the spread between low-grade and high-grade yields tends to narrow.
When the BBB-AAA Credit Spread narrows:
- The headline story usually reads, "narrowing credit spreads suggest a strong economy in months ahead"
- Then everyone cheers and makes the mistake of assuming that this will translate into big gains for the stock market
- The problem is that history suggests otherwise; the stock market has usually already priced in whatever the headline is suggesting
The BBB-AAA Corporate Yield Bond Spread indicator found on the site recently read 0.63 (meaning that the yield on BBB bonds minus the yield on AAA bonds = 0.63). The chart below from our Backtest Engine highlights all days when this spread was below 0.64.
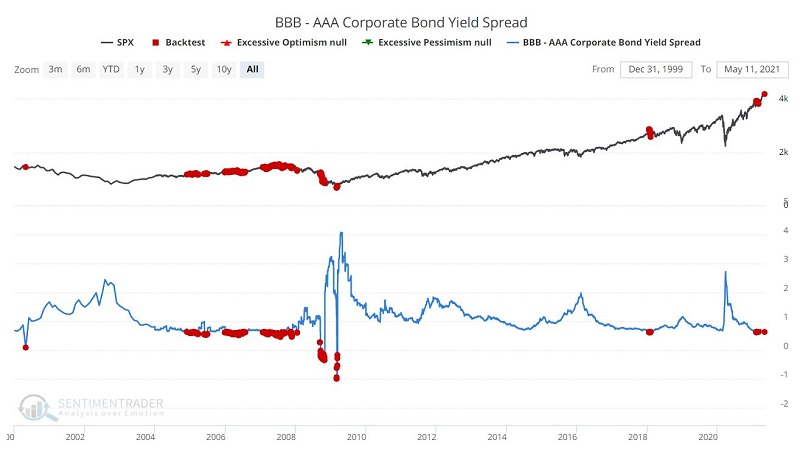
The table below displays the performance of the S&P 500 Index following the days marked in red on the chart above.
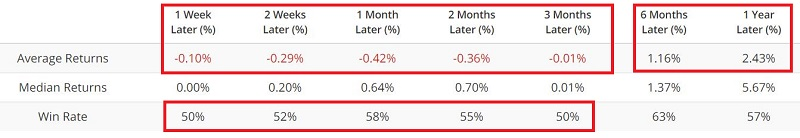
The results are NOT overwhelmingly bearish for stocks per se, HOWEVER, they are uniformly well below average. This is not a precision market timing tool. It is intended more to cause investors to consider an "attitude adjustment" regarding expectations in the future.
SOME SIGNS OF SUPPORT
Jay looked at the Leading Economic Index as a factor in future stock returns.
In the long run, the stock market's performance is tethered to that of the overall economy. If there is economic growth on the horizon, the stock market will move to higher ground in anticipation. If a slowdown, a recession, or worse appears to be in the offing, the stock market will invariably react badly.
The Leading Economic Indicators index compiled by and released monthly by The Conference Board does a pretty job of foreshadowing impending economic growth and contraction. As it turns out, it can also help handicap the likelihood of a stock market advance.
We will use an exponential moving average to identify the trend and compare the latest monthly reading to the 11-month exponential moving average.
- If the current reading is ABOVE the 11-month EMA, then the economy is considered to be trending UP
- If the current reading is BELOW the 11-month EMA, then the economy is considered to be trending DOWN
The chart below displays the cumulative price performance for the S&P 500 Index since 1959 during only those months when the LEI was in an established uptrend (i.e., ABOVE it's 11-month EMA) at the end of the previous month.
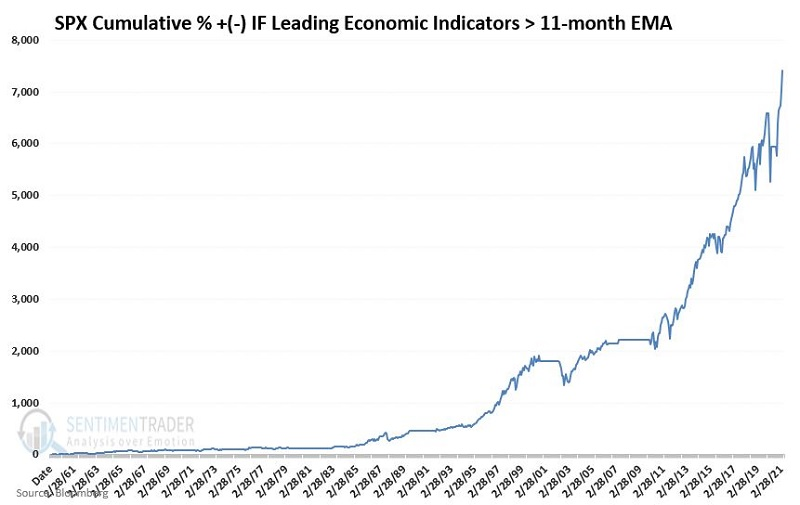
It vastly outperformed those months when the LEI was below average - providing some support for bulls here, as the indicator is still above its average.
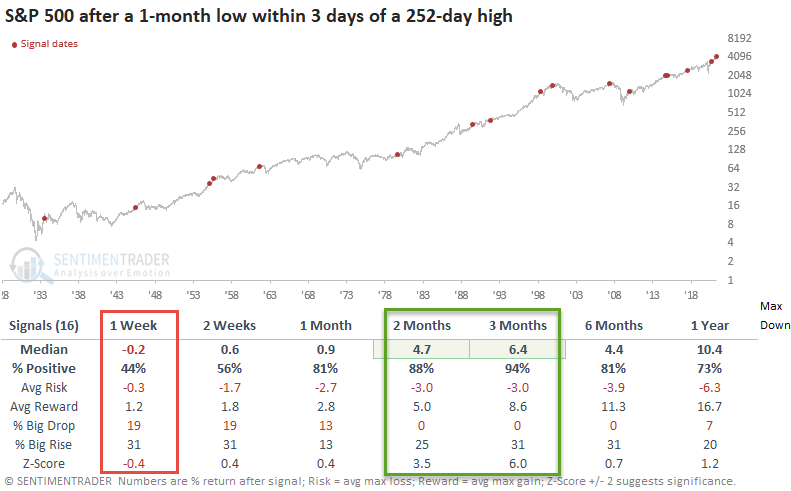
There is another potential sign of support, this time on a technical basis. The S&P 500 fell to a 1-month low within only a few days of hitting a 1-year high.
The results suggest some follow-through to the downside in the near term. The last column contains the max drawdown in the first 42 days. Based on the historical average, the market could drop another 3%. However, history favors buying the dip as the 2-3 month timeframe results look solid.
STOCKS AND SECTORS - VALUE OUTPERFORMING
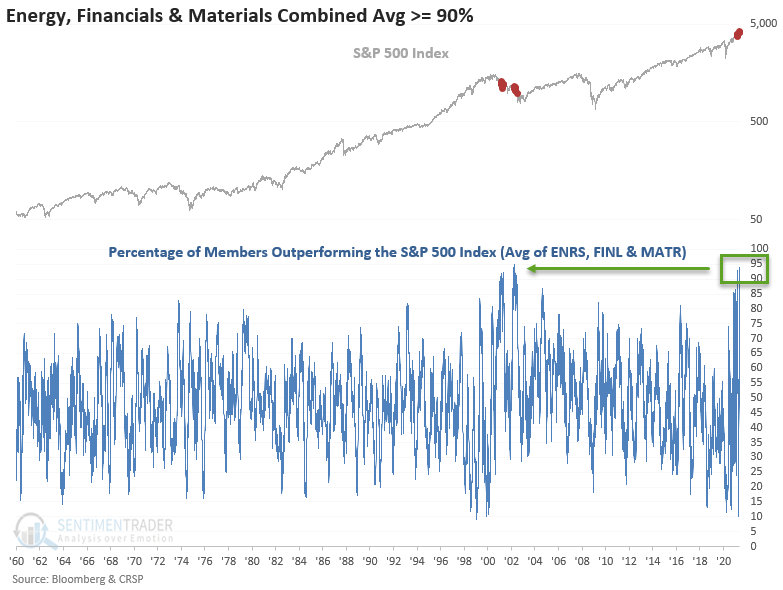
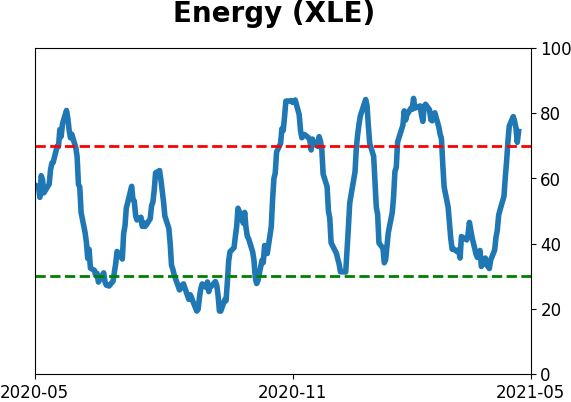
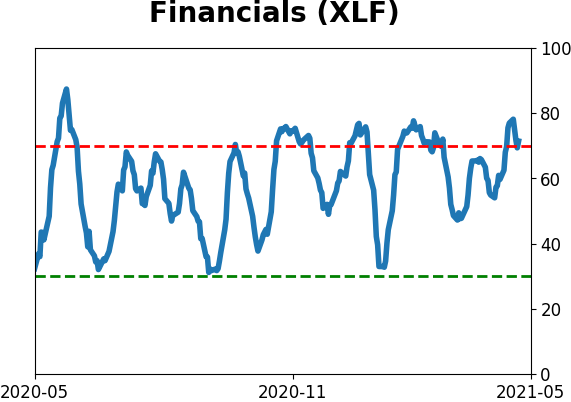
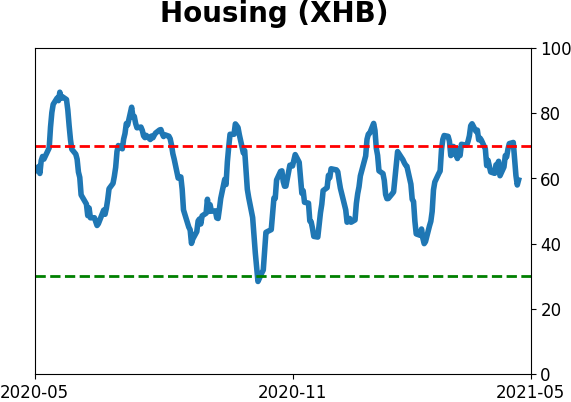
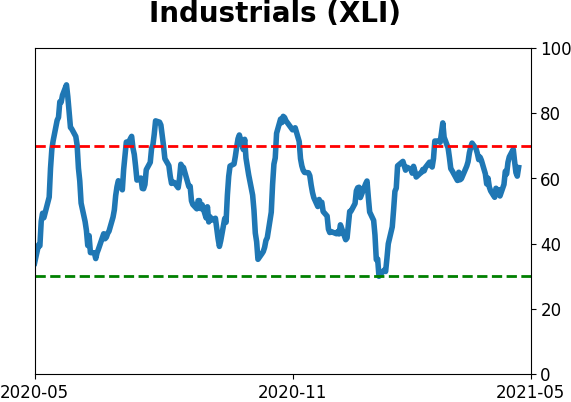
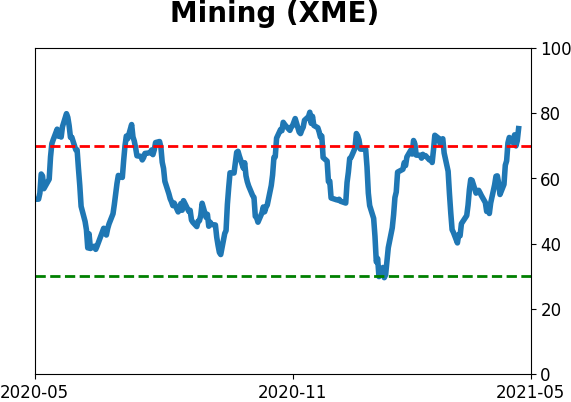
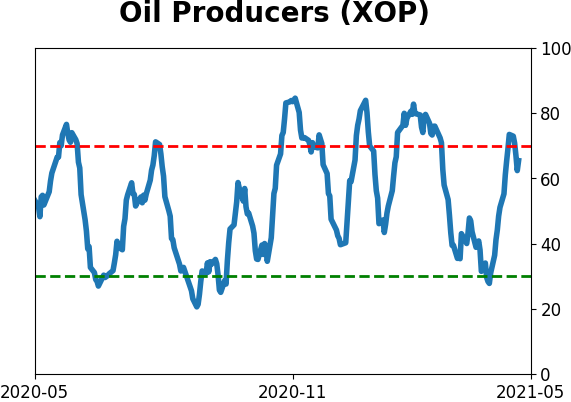
Dean noted that a near-record number of Energy, Financial, and Material stocks are outperforming the S&P 500.
The combined average of those sector members outperforming the S&P 500 on a rolling 1-month basis crossed above 94% on Monday, a level last breached in April 2002. The combined average has now crossed above 90% multiple times in the last few months.
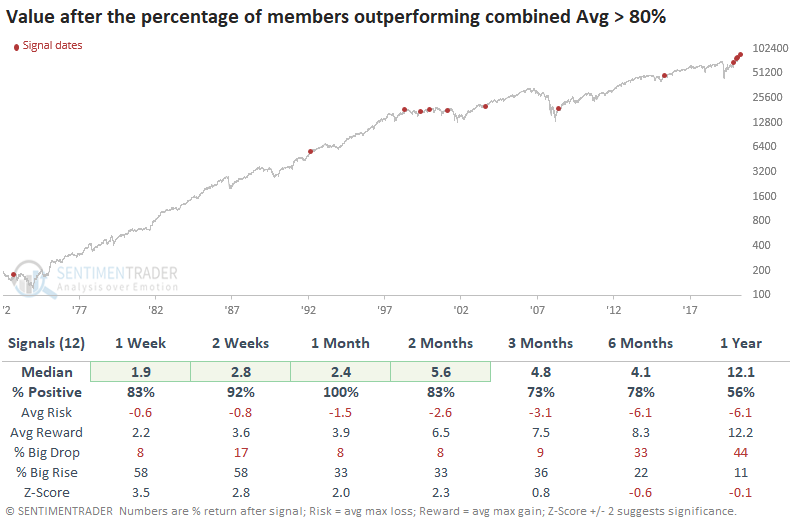
When we lower the threshold to 80% and assess what happens with value and growth stocks, Value returns look solid in the 1-13 week timeframe. The 1-year timeframe looks soft due to the 1999-2002 period.
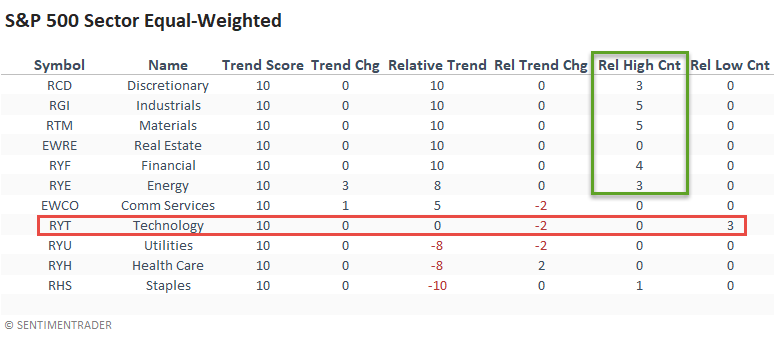
Dean updated a look at absolute and relative trends among ETFs.
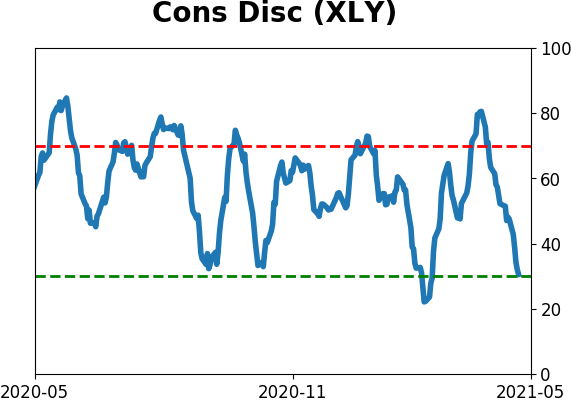
The value/cyclical groups continue to exhibit robust relative trend scores. Financials industrials, materials, and energy dominated the relative high count last week, especially the materials sector, as it scored a new high on all five trading days. Technology and consumer discretionary showed some deterioration with relative lows on 3/5 trading days.
The equal-weighted relative trend score and high count indicators confirm the cap-weighted strength in the value/cyclical groups. The consumer discretionary sector remains strong and continues to diverge from the cap-weighted version. AMZN is still weighing on the XLY ETF. The technology trend score dropped, and it registered three new relative lows last week.
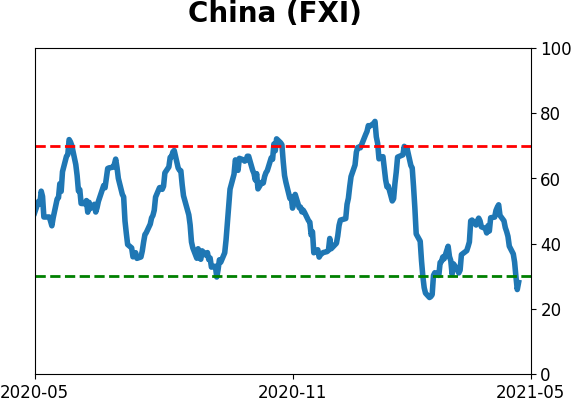
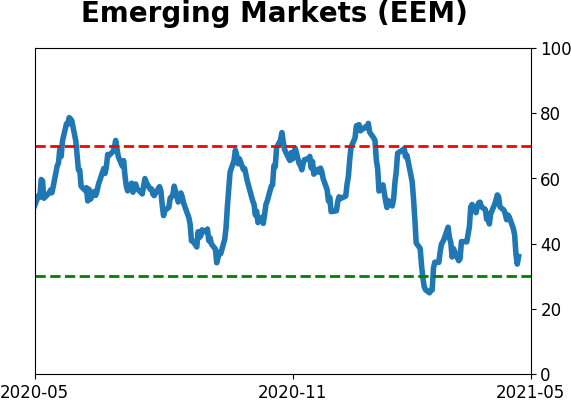
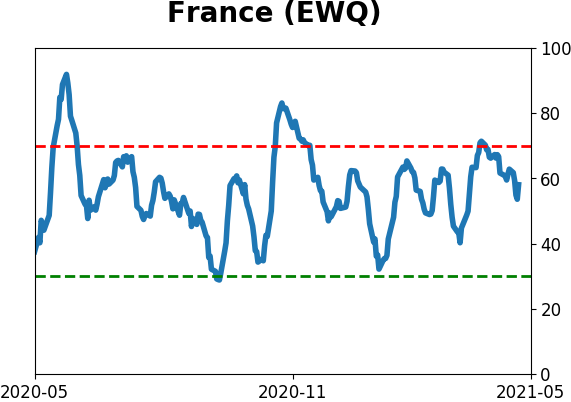
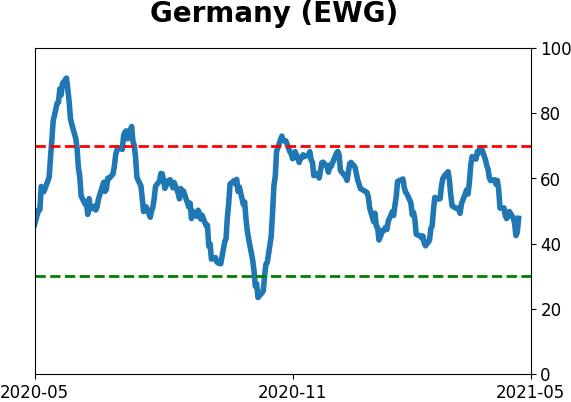
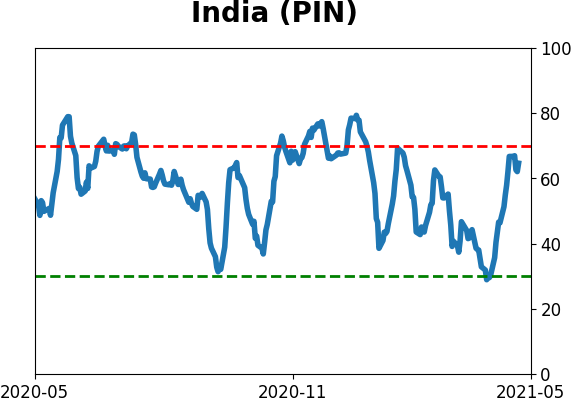
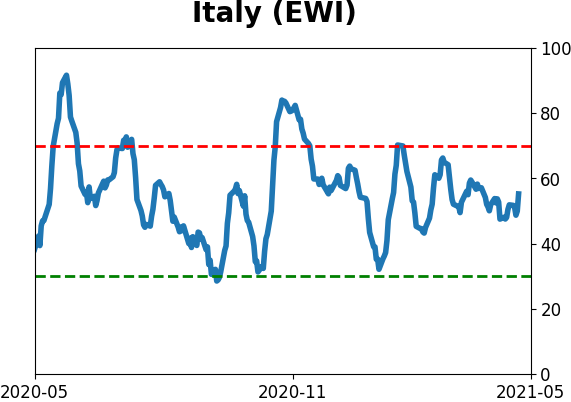
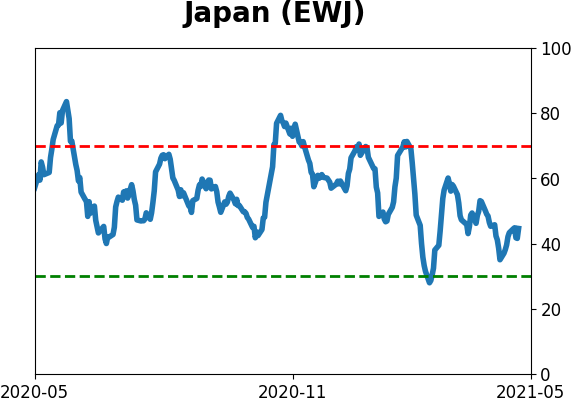
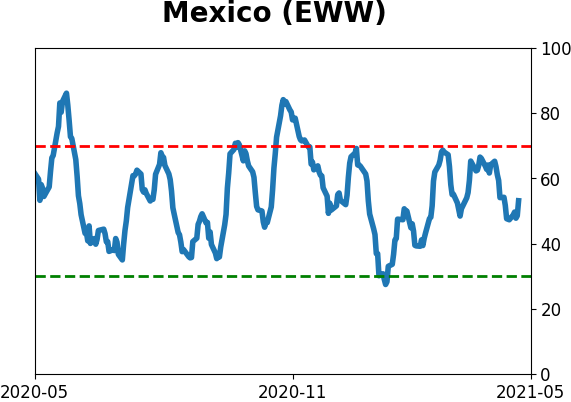
The international/country ETFs reversed higher from the previous week with several noticeable improvements, especially in Europe. China continues to exhibit weak trends and registered five consecutive relative lows last week.
STOCKS AND SECTORS - TECH HITS A RELATIVE LOW
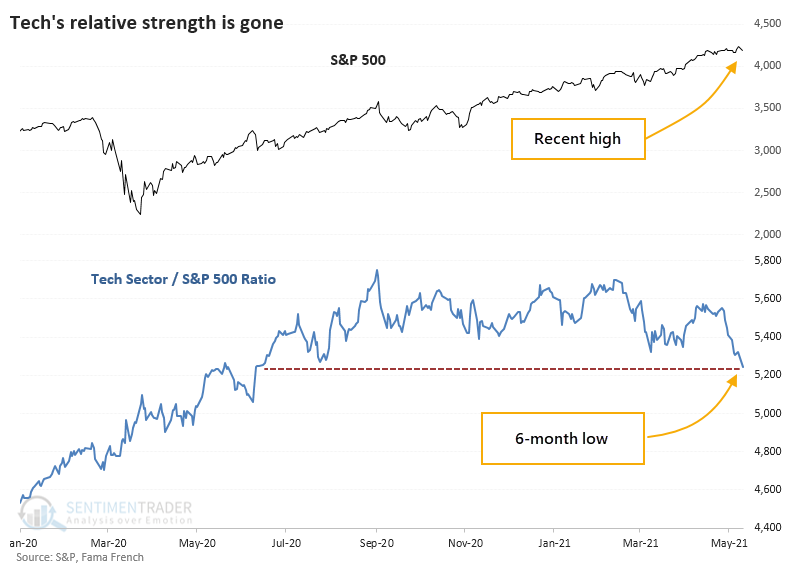
Tech was in the driver's seat for much of the past year. After an option-fueled blowoff in February, those stocks have treaded water, at best, while other parts of the market recover enough to trigger a nearly 80-year extreme in new highs.
This relative weakness in tech stocks has been enough to push the ratio between them and broader indexes nearly to the lowest level in a year. This does not often happen when indexes like the S&P 500 were sitting at all-time highs a few short days ago.
Whenever the S&P 500 had been at a 52-week high, then within 3 days, the ratio of Tech to the S&P fell to a 6-month low, the S&P showed weak short-term returns, but it didn't have much of a consistent impact beyond that. It was a considerably worse sign for the Technology sector, though.
The tendency for Tech to show weaker returns means that the ratio of Tech to the S&P showed a consistently negative bias.
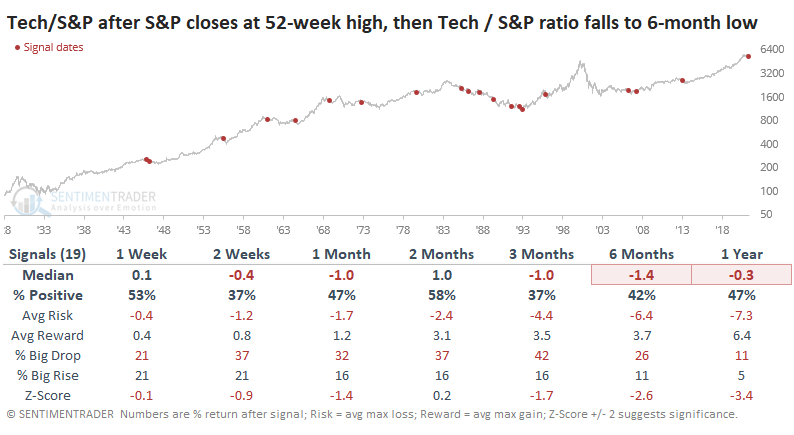
Across almost all time frames, the ratio was negative, significantly over the medium- to long-term. Over the past 30 years, there were only 2 exceptions when Tech managed to turn itself around from relative weakness and become a leader again. The others all failed.
The quick and severe drop during the week hit Discretionary and Tech stocks especially hard. Tech stocks have been getting much of the attention, and earlier this week, more than 40% of stocks in the Nasdaq 100 plunged below their volatility bands.
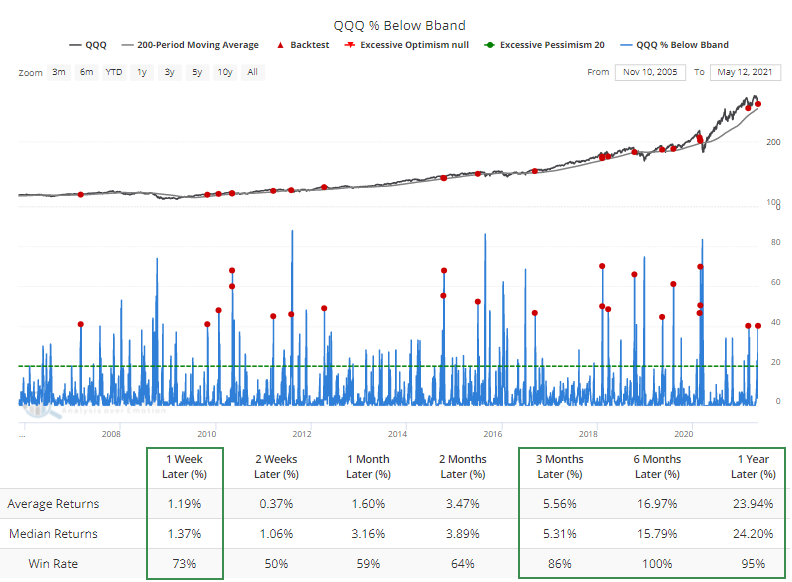
After other signals, the Backtest Engine shows that there wasn't as pronounced a tendency for a quick bounce, but medium- to long-term returns were stronger. Over the next 6 months, there were no losses, and QQQ's average return was a robust 16%.
If we look at each occurrence, we can see that it typically didn't pay to buy this first dip. Almost always, QQQ either failed with a much lower low or at least tested the initial panic low in the days ahead. When QQQ bounced immediately, it typically failed. The most sustainable rallies happened after maybe a small bounce over several days, then a test of the initial low a week or two later.
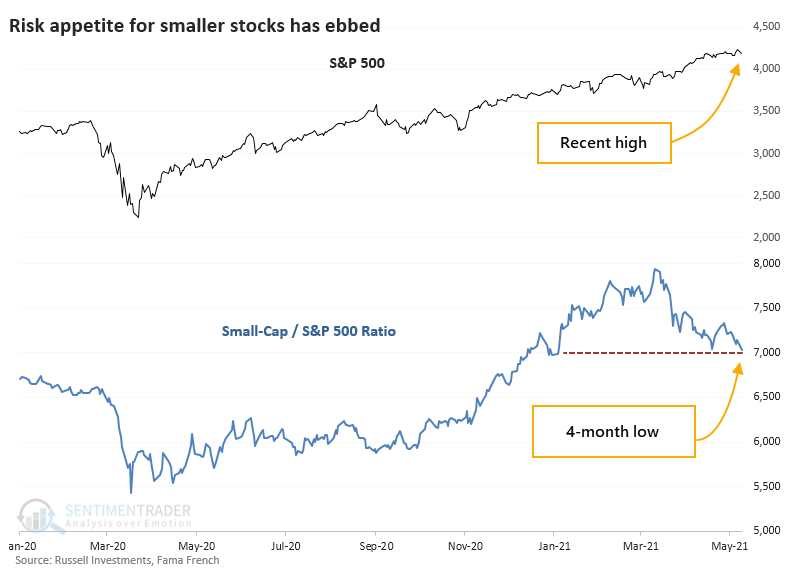
STOCKS AND SECTORS - SMALL-CAPS HIT A RELATIVE LOW, TOO
Another area of risk appetite, Small-Cap stocks, have struggled right along with them. While not as extreme, a ratio of Small-Cap stocks to the S&P has just dropped to a 4-month low.
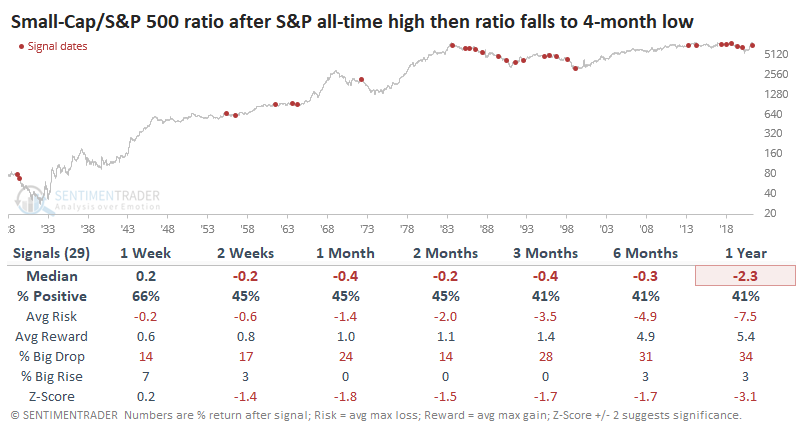
Other times when the S&P was recently at a 52-week high, then the ratio of Small-Cap stocks to the S&P plunged to at least a 4-month low, it preceded returns about in line with random for the S&P. Its returns were mediocre over the short- to medium-term with risk that was higher than reward up to 3 months later.
Like we saw with Tech stocks, this relative weakness in Small-Caps suggested that the trend would continue. The ratio between the two kept sinking in the months ahead.
STOCKS AND SECTORS - CHINESE STOCKS ARE COILED
Dean noted that the Shanghai Composite (SHCOMP) has entered a low volatility consolidation phase that would suggest a future breakout swing trade opportunity.
The Bollinger Band Breakout system seeks to identify a low volatility consolidation phase that sets up a future breakout swing trade. When the spread between Bollinger Bands is less than 3.5%, and within 10 trading days, the Shanghai breaks out, which way it breaks had a big impact on forward returns.
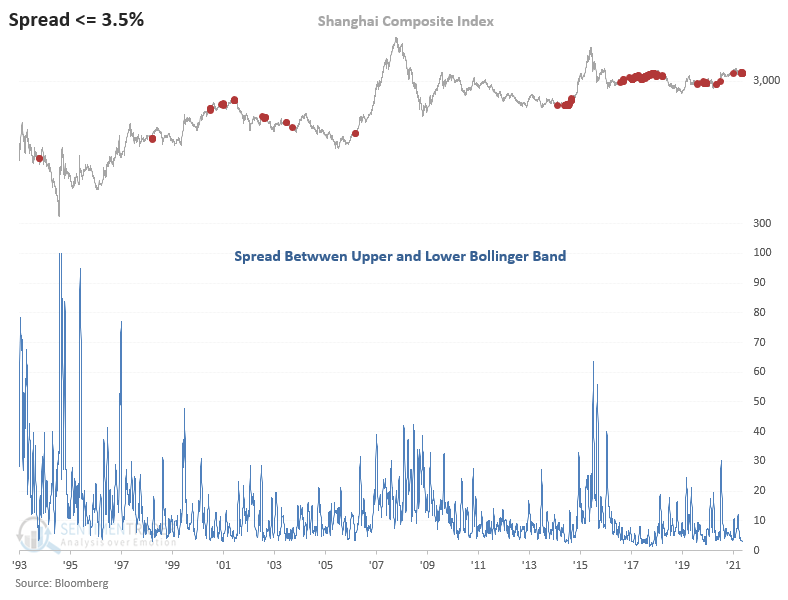
After an upside break, three months later the Shanghai averaged a return of +3.2% and was positive 71% of the time. After a downside break, it averaged a return of -2.6% and was positive only 38% of the time.
| BONDS | ||
 | ||
As you can see in the chart below (courtesy ProfitSource by HUBB), ticker TLT (iShares 20+ Year Treasury Bond ETF) has declined significantly in the past 13+ months. Given the established downtrend and inflation now confirmed to be rising, most investors steer clear of the long treasury bond. And seemingly for a good reason.
However, this very scenario - "When everybody knows" to avoid a certain situation - often sets the stage for a contrarian opportunity. Jay looked at a way to trade a potential rebound while using a limited capital outlay.
There is an important "line in the sand" level for TLT at roughly $133-134 as it revisits prior troughs. In the chart below, we can also see that 30-year bonds have entered a seasonally favorable time of year.
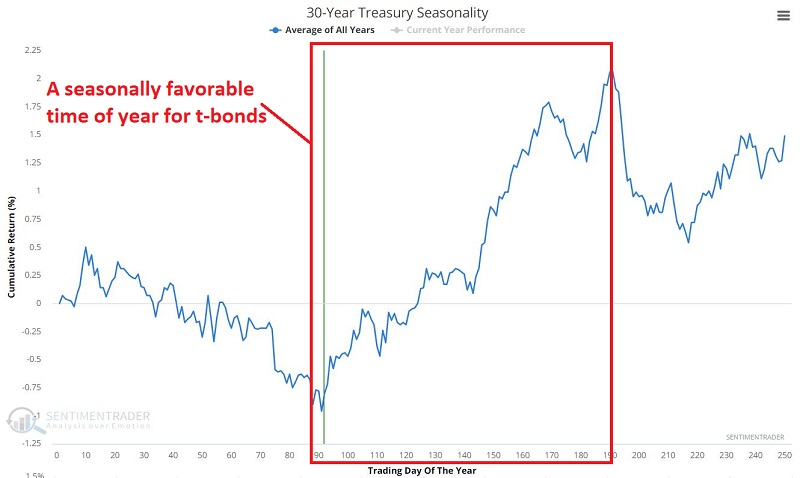
It is fair and important to note that this seasonally favorable period has mostly been carved out during a long-term bull market for bonds. Likewise, there is never any guarantee that a given seasonal trend will play out as expected this time around.
Still, a trader with a speculative bent might find this to be an interesting contrarian bet. The most straightforward approach would be to buy 100 shares of TLT. However, at its current price, this would require a commitment of over $13,600. For a speculative bet, it is ideally better to commit and risk far less.
One example alternative would be to buy two September 2021 TLT 137 strike price calls @ $4.08.
The screenshot below (courtesy of www.Optionsanalysis.com) displays the particulars.
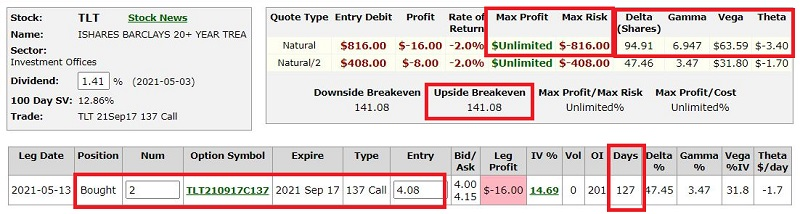
The Sep137 call has a delta of 47.45, so buying 2 calls gives us a net delta of 94.91, much like a position holding long 95 shares of ticker TLT at a fraction of the cost. The total cost to enter this trade is $816 versus $13,600 to buy 100 shares of TLT. This also represents the maximum risk on the trade.
The Breakeven Price at the time of September expiration is $141.08, which equals the strike price of 137 plus the premium paid of $4.08. It has 127 days left until expiration.
The implications are pretty straightforward:
- If TLT DOES rally, this position can generate substantial profits
- If TLT DOES NOT rally, this position will absolutely, positively lose money
- Regardless of how far TLT falls if it does decline, this trade can lose no more than $816
That's not to say it is a slam-dunk trade. The trend is clearly down, and Elliott Wave analysis has a downside target. Jay also gives an options trade idea if one would prefer to bet on that scenario instead.
| COMMODITIES | ||
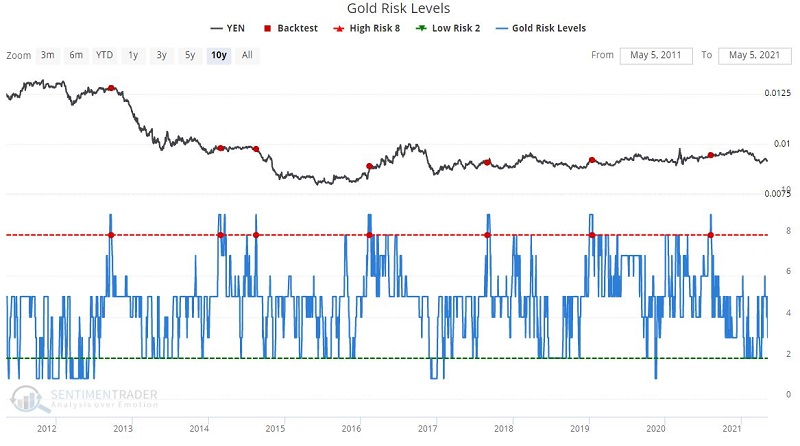
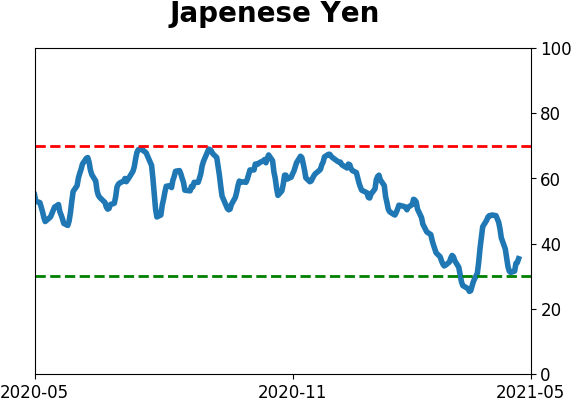
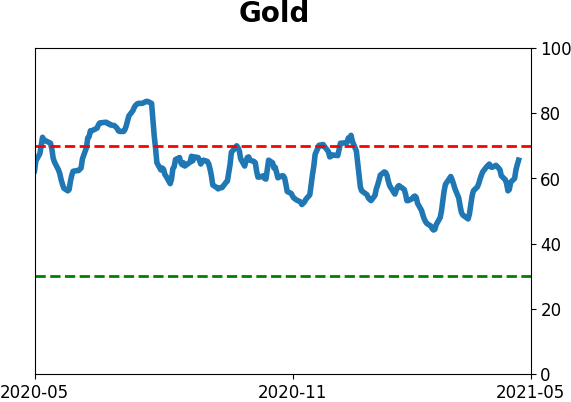
Jay looked at using our Risk Level on gold as a guide to the Japanese yen.
If a user runs a backtest on the gold risk level but substitutes the yen as the traded market, they can sense how sentiment on one market impacts the other.
This specific test looks for the Gold Risk Level to cross from above to below 8 for the first time in the past 60 days. Clicking "Run Backtest" will launch the test and analyze the Yen's performance in the 1 to 12 months.
The chart below displays the handful of signals - 7 in total, all of which occurred within the last 10 years - using a red dot.
The table below displays the Summary of Japanese Yen performance results. Note the minuscule or non-existent Win Rates for 1-month, 2-months, and 1-year periods.
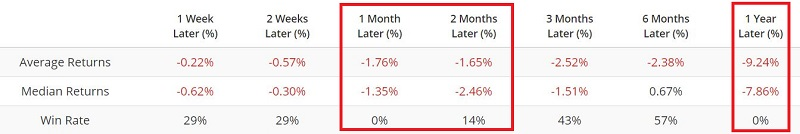
A reversal in Gold Risk Levels from a high level strongly suggests potentially unfavorable price action in the year ahead for the Japanese Yen. This isn't immediately actionable - the Risk Level on gold is still rising and not yet at an extreme - but users can save a Backtest as a Favorite and get notified when the test activates in the future.
Active Studies
|
|
|
|
|
|
Indicators at Extremes
|
|
|
Portfolio
|
|
|
|
Phase Table
|
|
|

Ranks
|
|
|
|
|
|
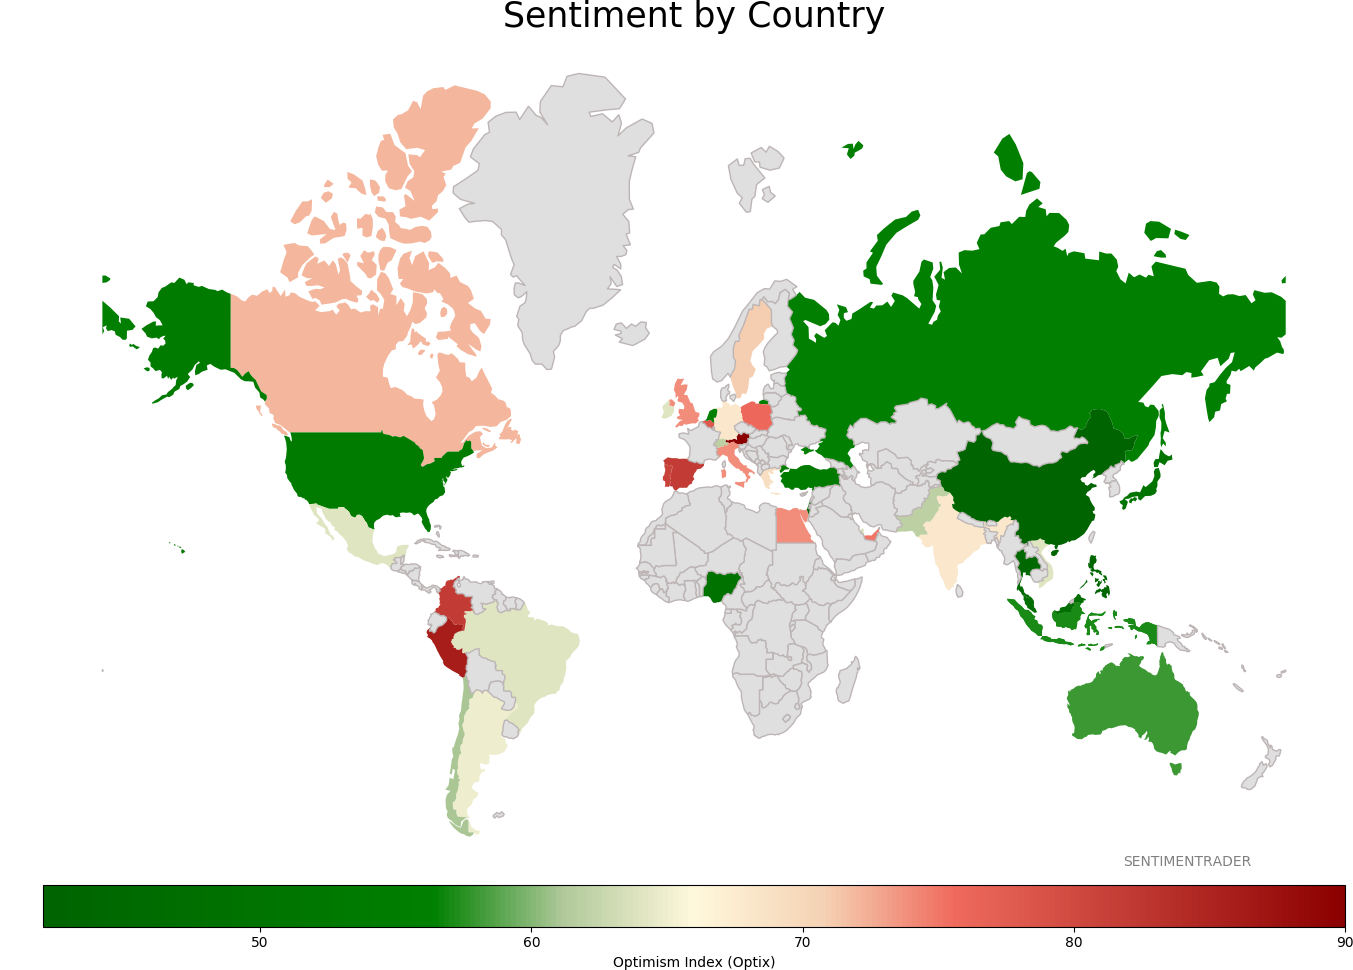
Sentiment Around The World
|
|
|
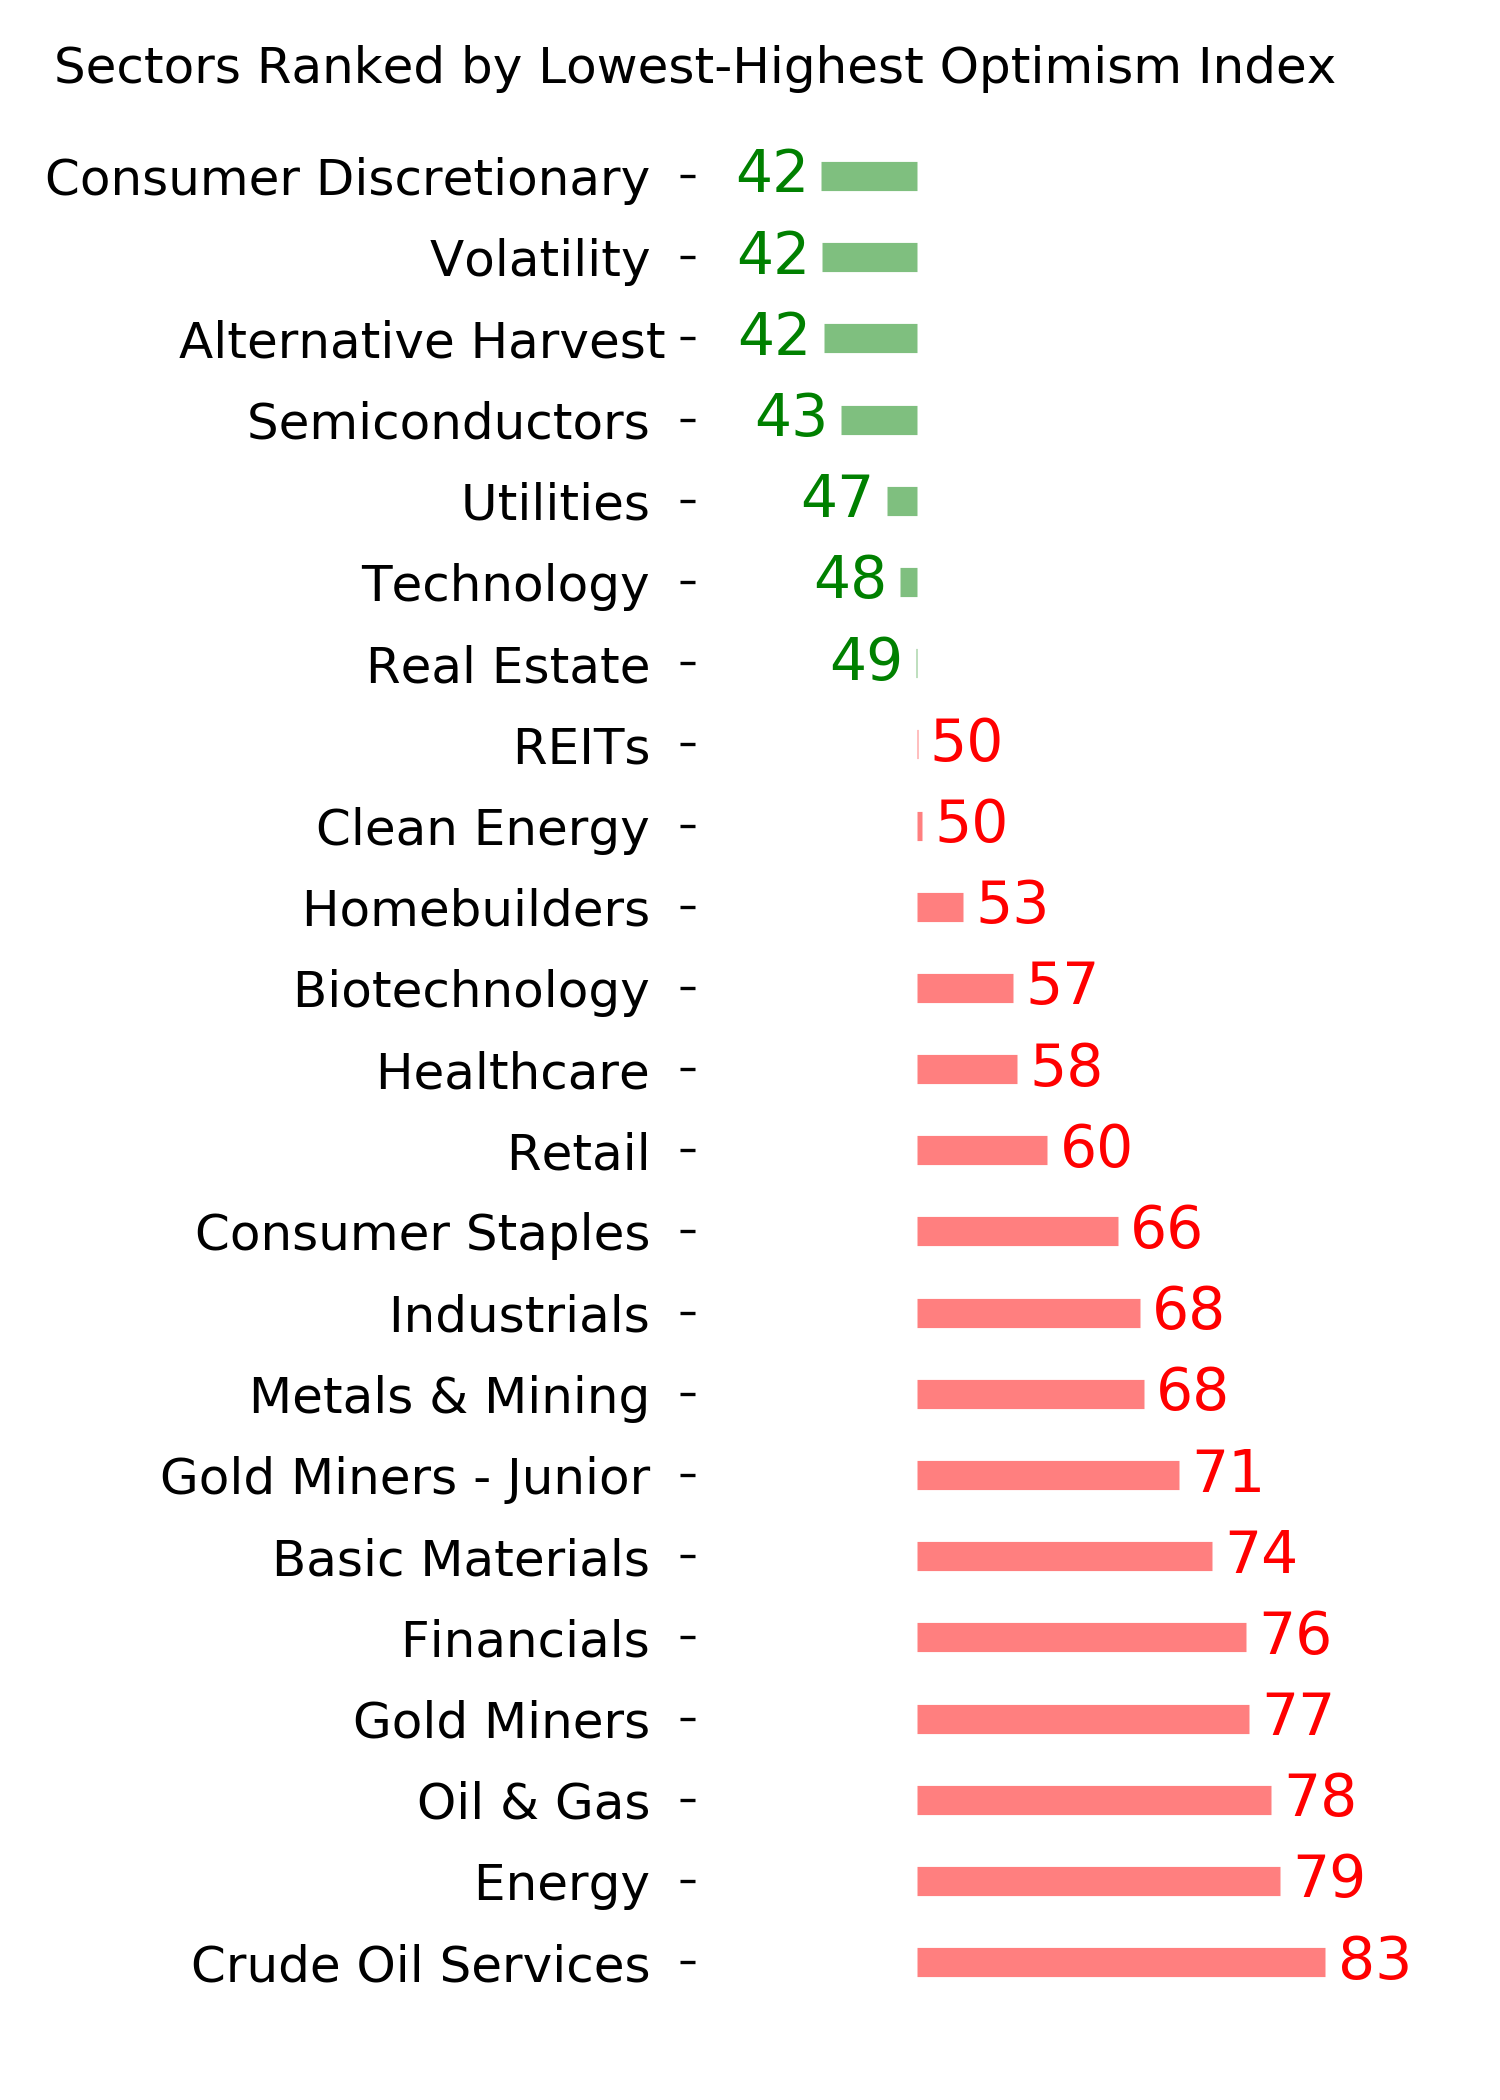
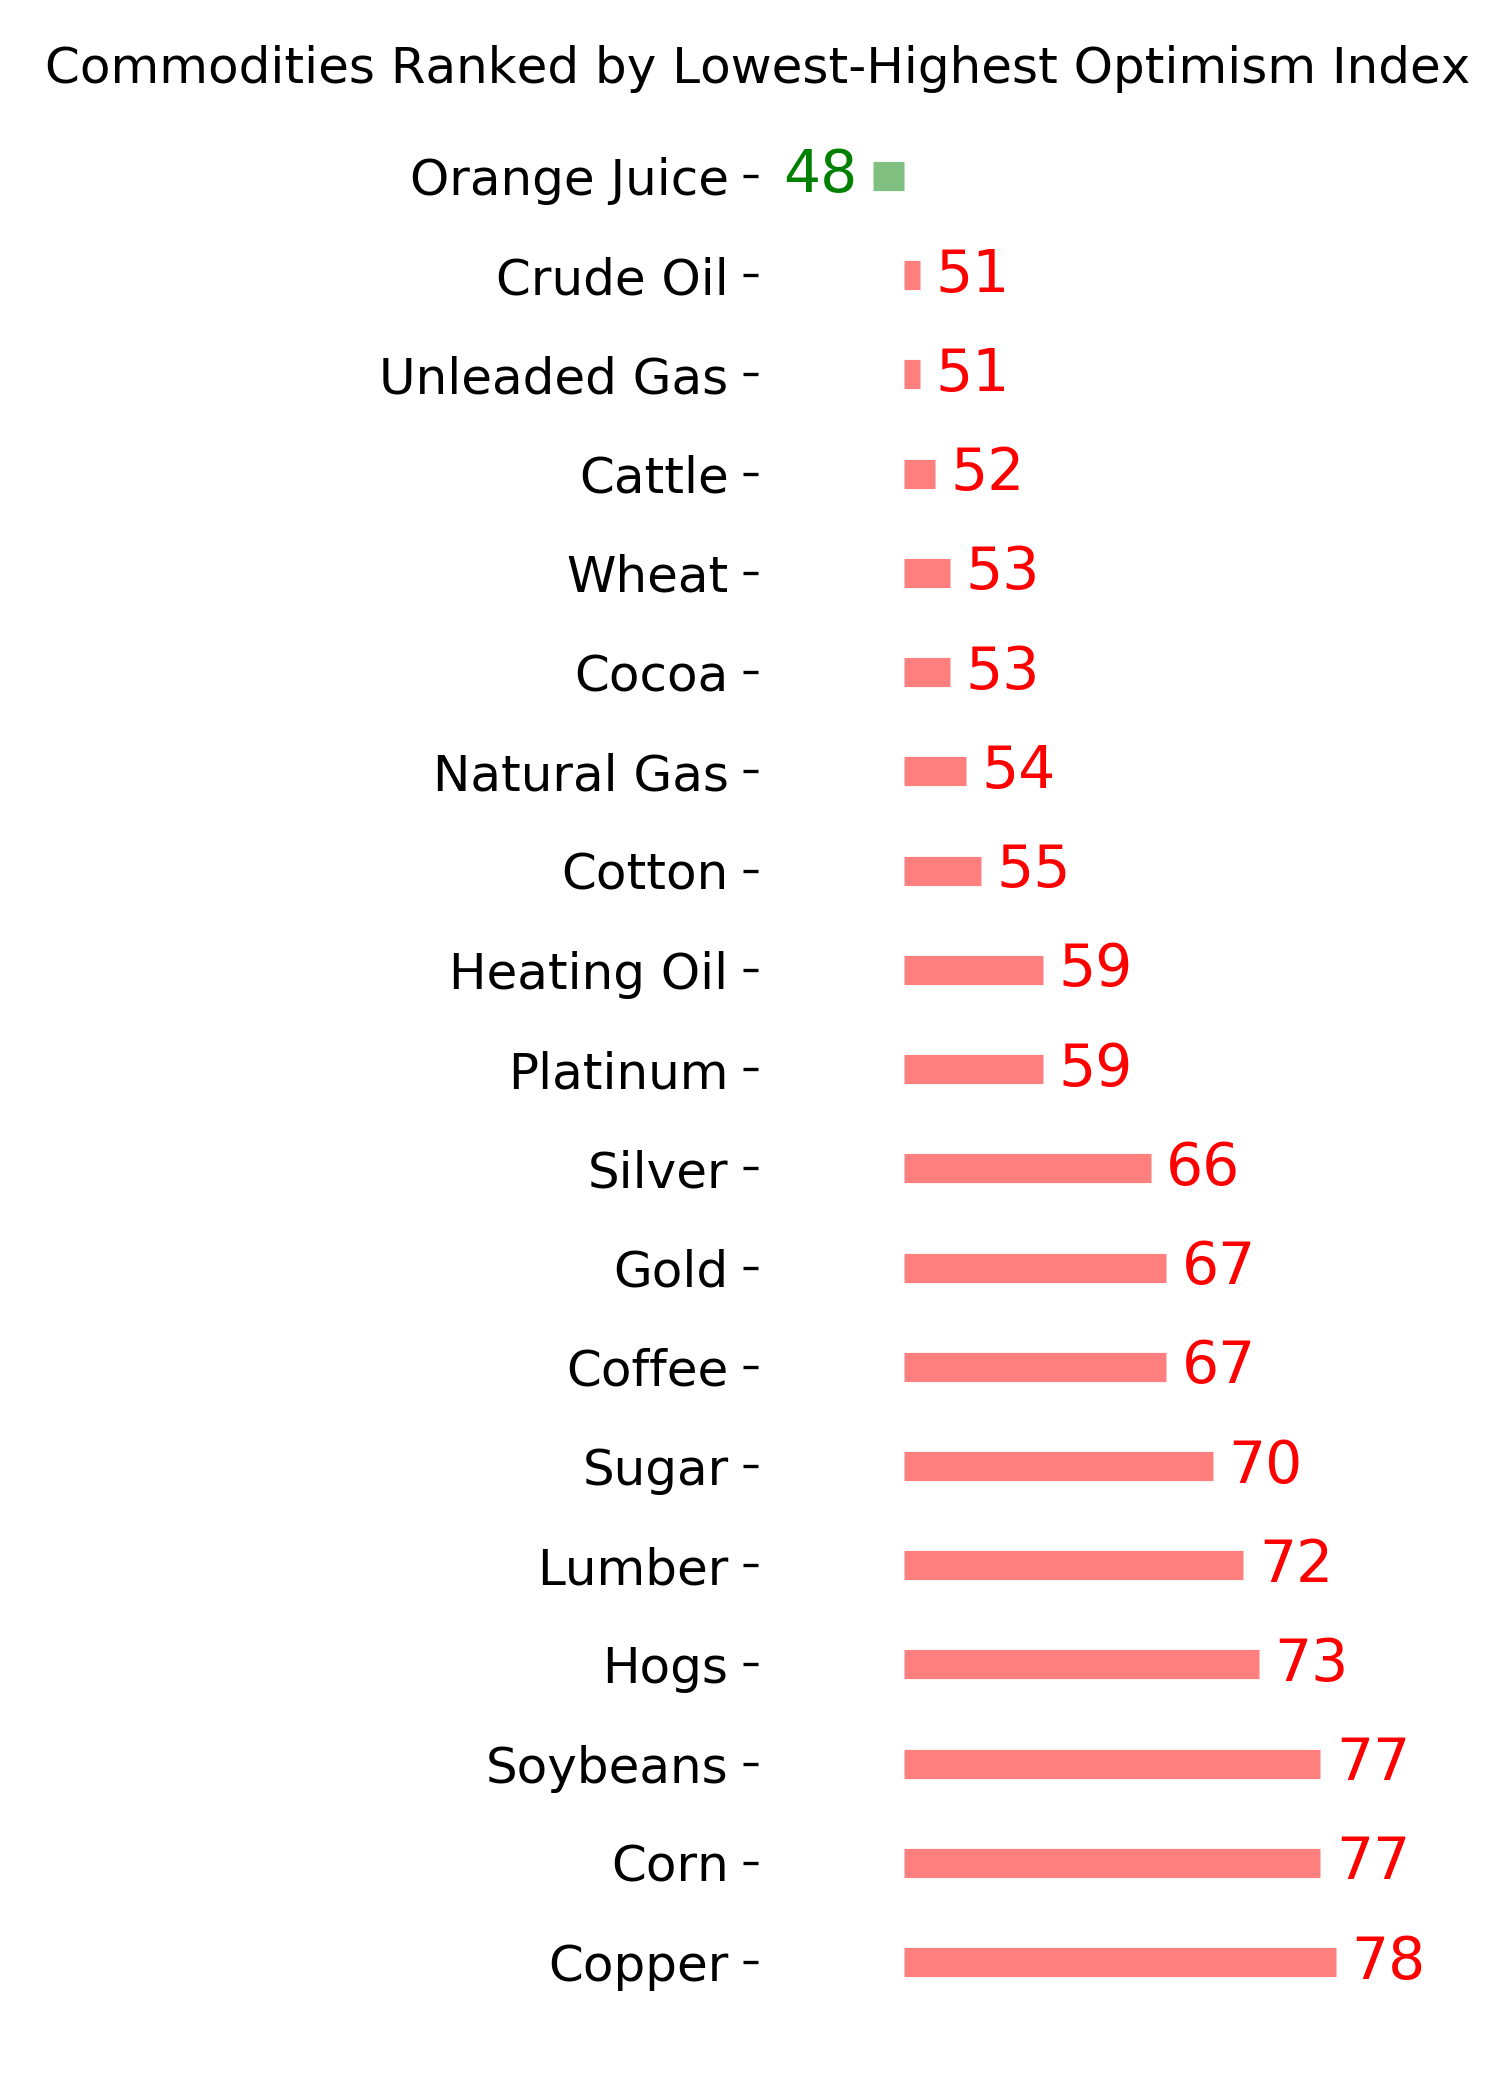
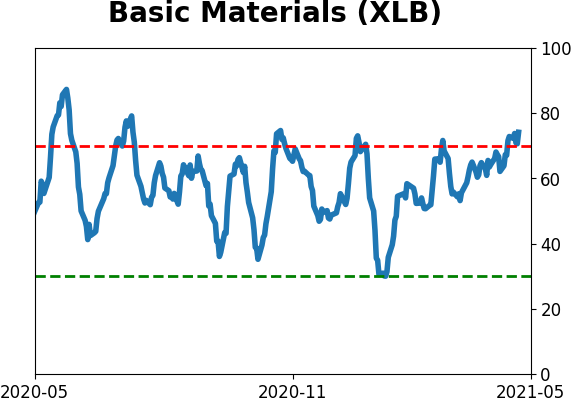
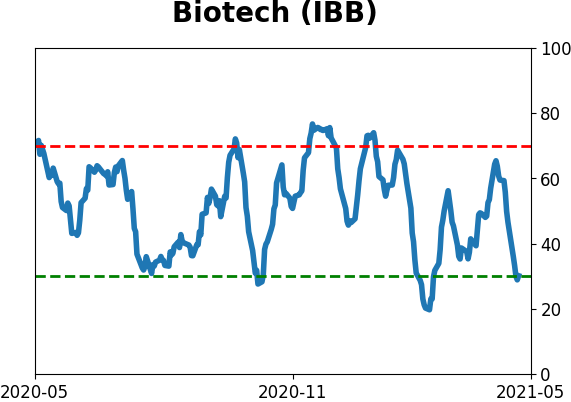
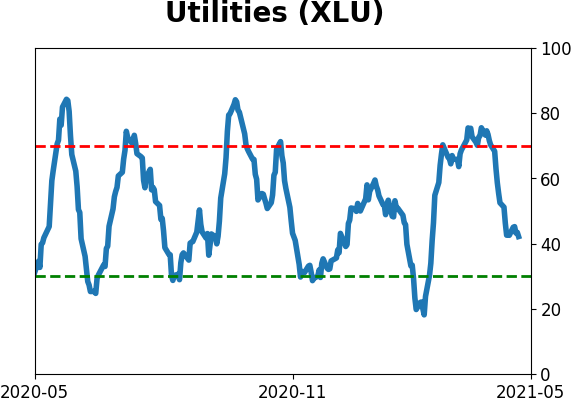
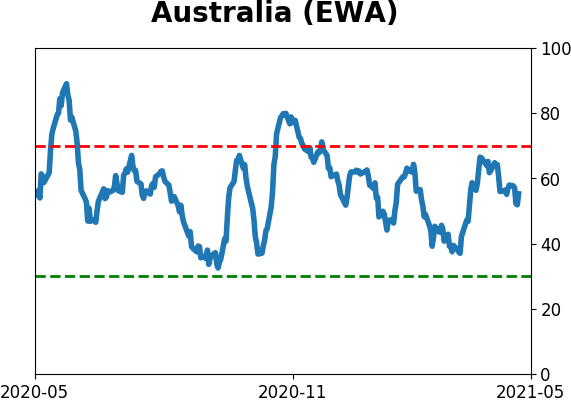
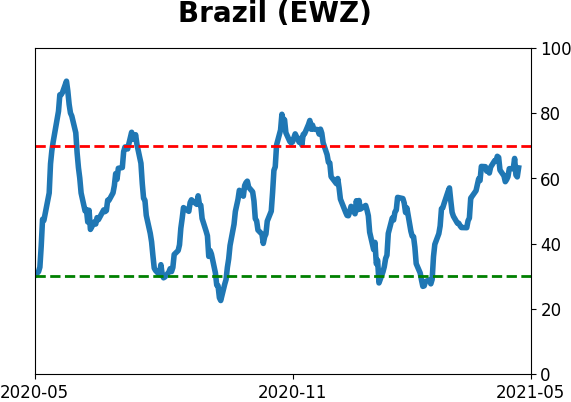
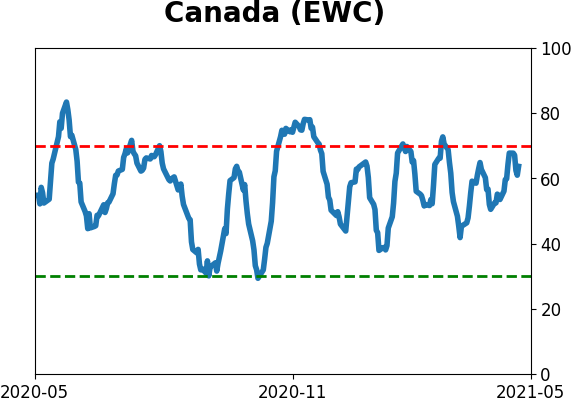
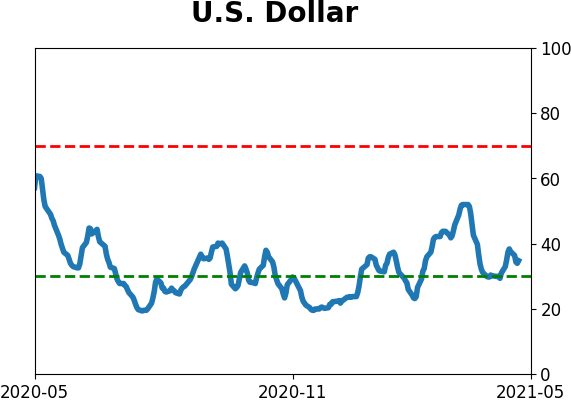
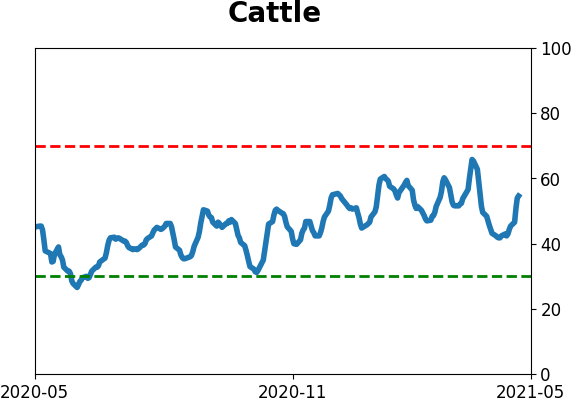
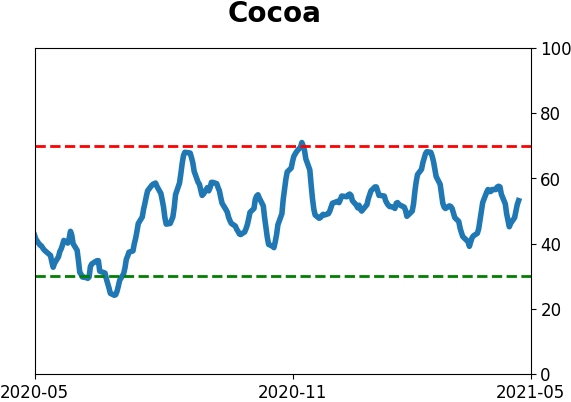
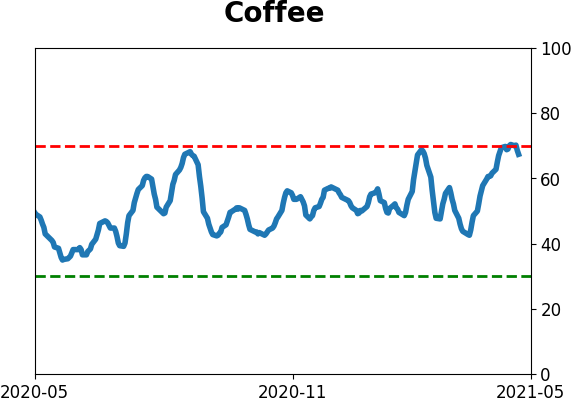
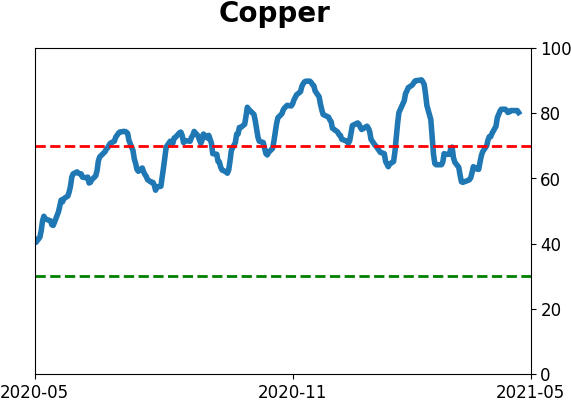
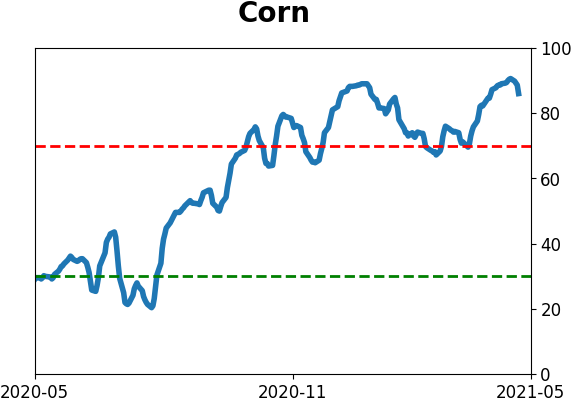
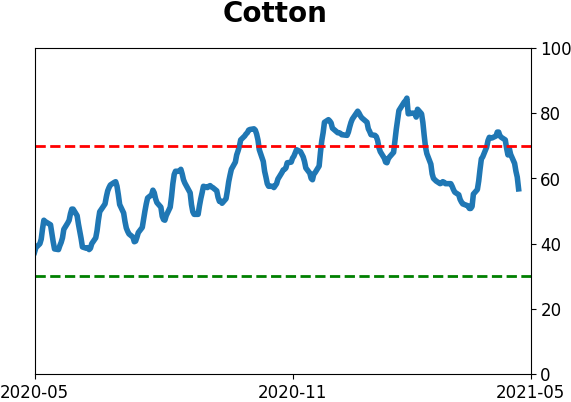
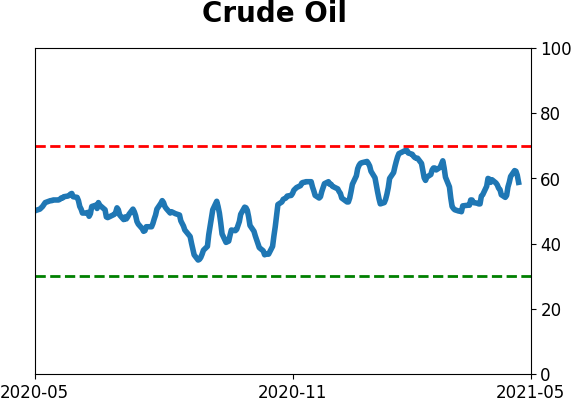
Optimism Index Thumbnails
|
|
|
|
|
|
|
|
|
|
|
|
|
|
|
|
|
|
|
|
|