Headlines
|
|
Institutions believe in stocks a lot more than mom-and-pop:
A monthly survey of institutional versus individual sentiment on stocks shows that the latter is a lot more optimistic than the former. Responses to questions by Yale University showed that the spread between sentiment in the two groups is near the highest level in 30 years.
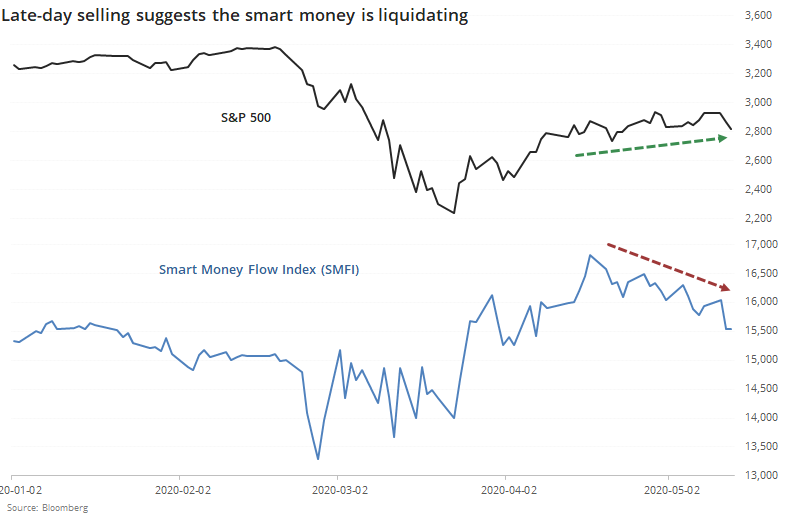
Late-day selling drives the Smart Money Flow Index to a lower low:
In recent sessions, stocks have sold off near the end of regular trading hours. This has pushed indicators that look at late-day activity relative to the rest of the day to lower lows. The Smart Money Flow Index looks at this kind of behavior, and it's diverging from the S&P 500.
An impressive turnaround: Stocks enjoyed a large intraday reversal on Thursday, erasing more than a 1.5% intraday loss to close more than 0.5% higher on the day. There have been 14 times since 1962 when it enjoyed a reversal like this while between 10% - 20% from a multi-year high (roughly equating to corrective periods). It chopped around the next couple weeks, but by three months later was positive 15 of the 17 times, averaging +6.9%. Whether this is enough to offset some recent negatives is questionable, since one-day price patterns have been inconsistent, especially when looking out as long as three months. For those curious, the dates were 1967-01-11, 1969-07-30, 1973-05-15, 1981-09-28, 1990-09-28, 1998-09-01, 2008-01-23, 2008-01-31, 2008-03-13, 2011-08-09, 2011-08-26, 2011-09-12, 2011-10-04, and 2018-12-27.
|
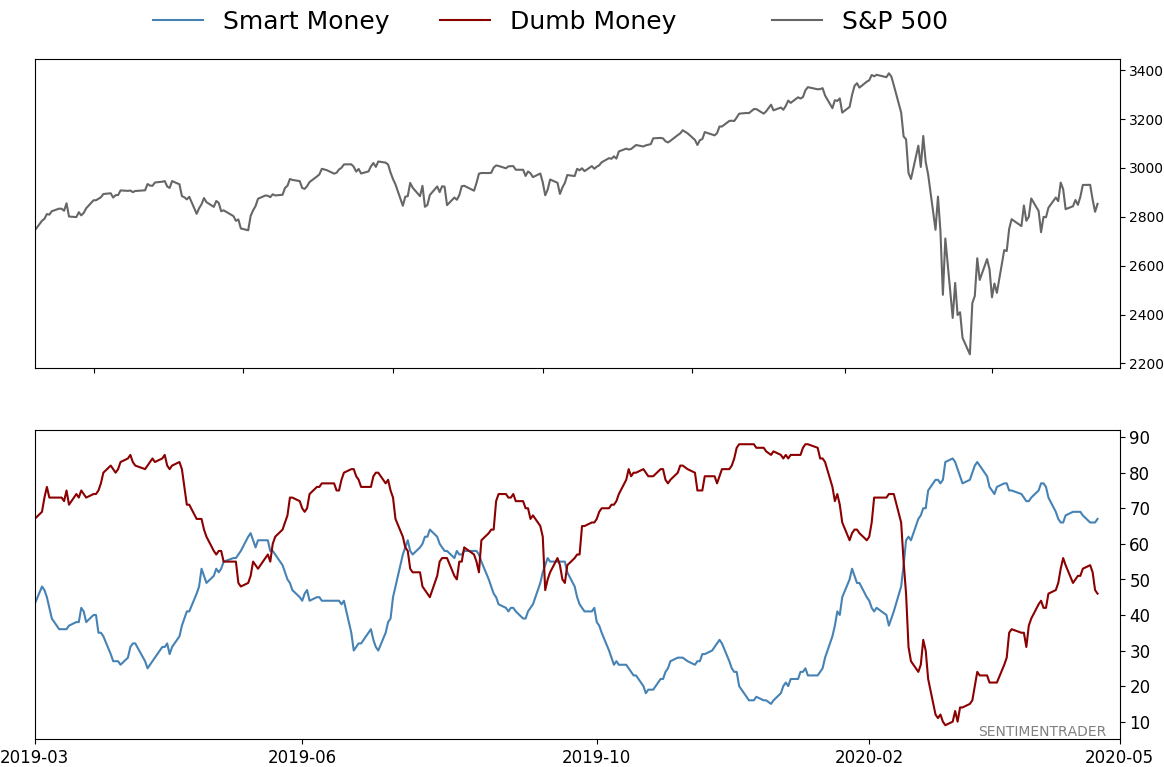
Smart / Dumb Money Confidence
|
Smart Money Confidence: 67%
Dumb Money Confidence: 46%
|
|
Risk Levels
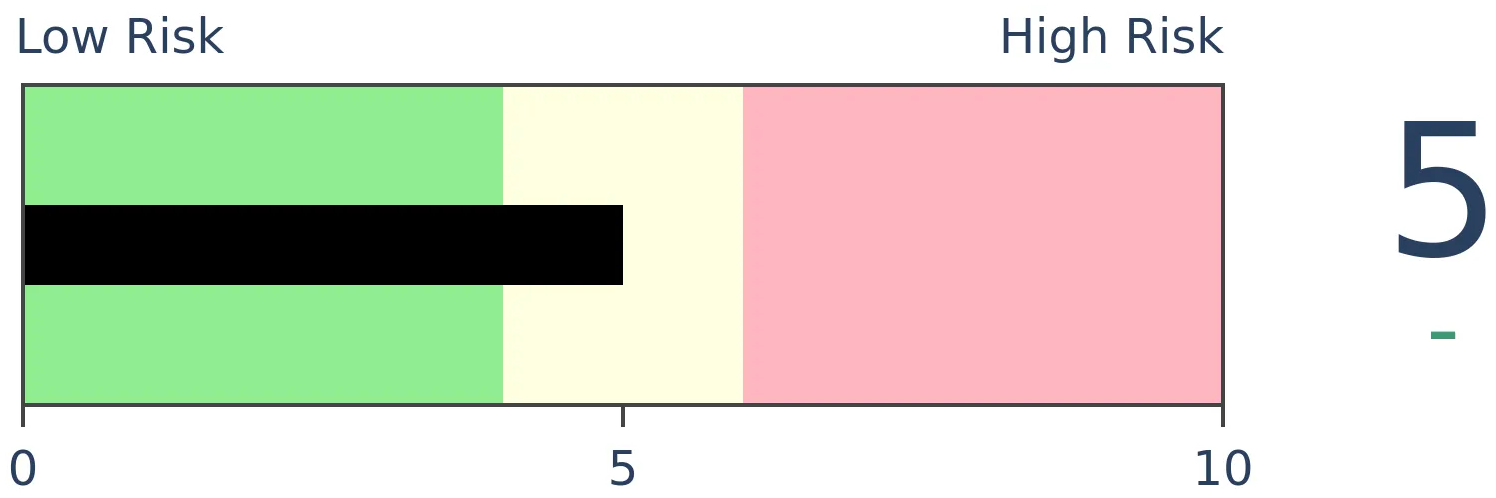
Stocks Short-Term

|
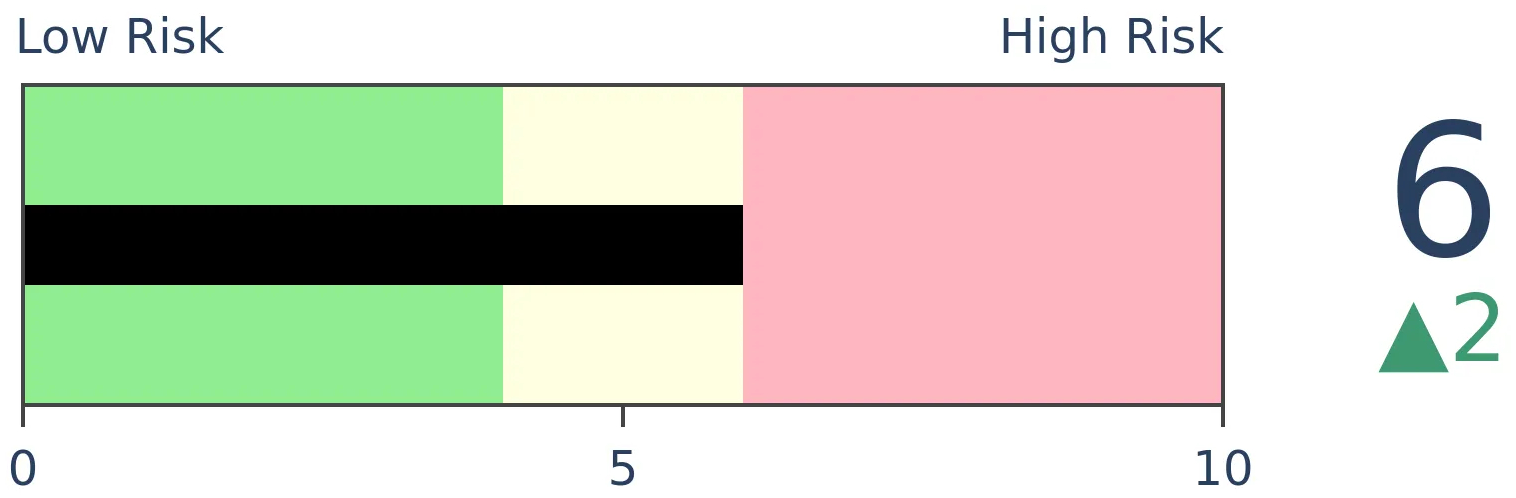
Stocks Medium-Term

|
|
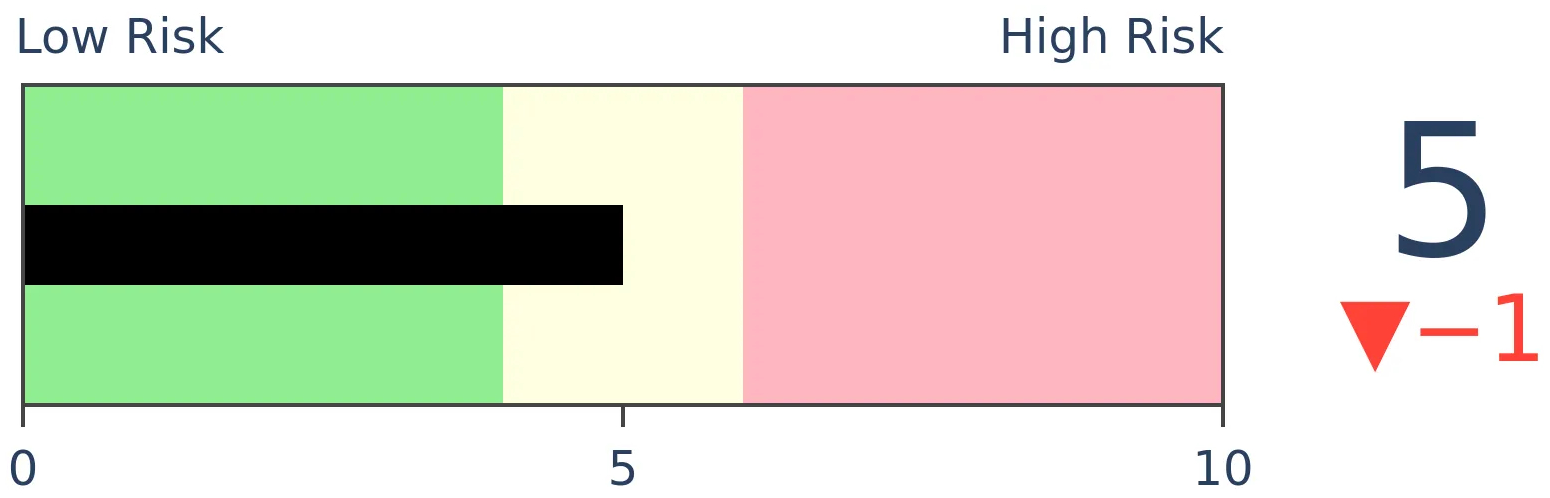
Bonds
|
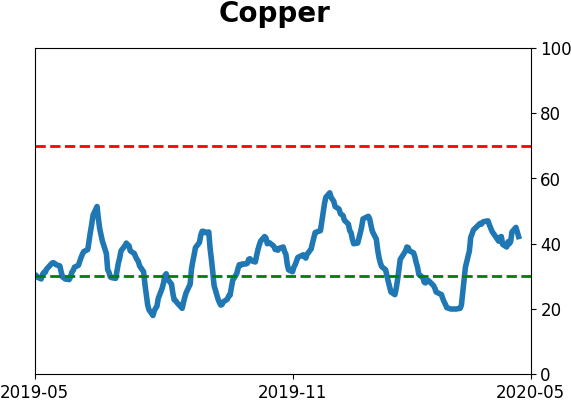
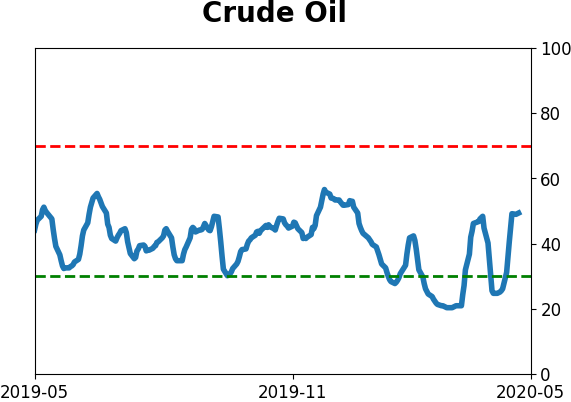
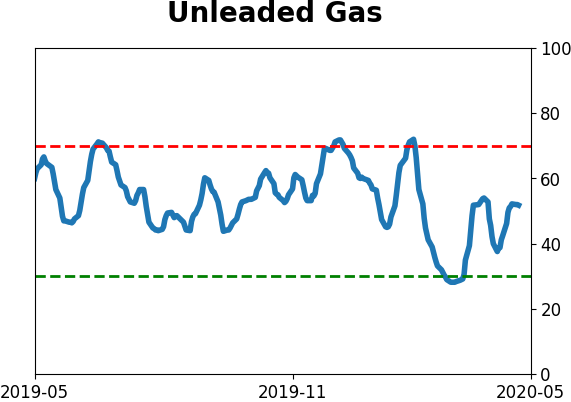
Crude Oil

|
|
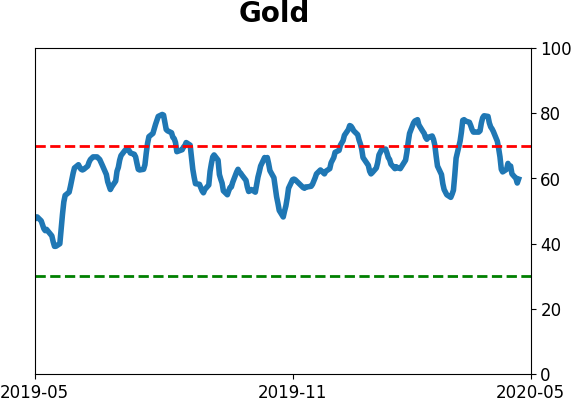
Gold
|
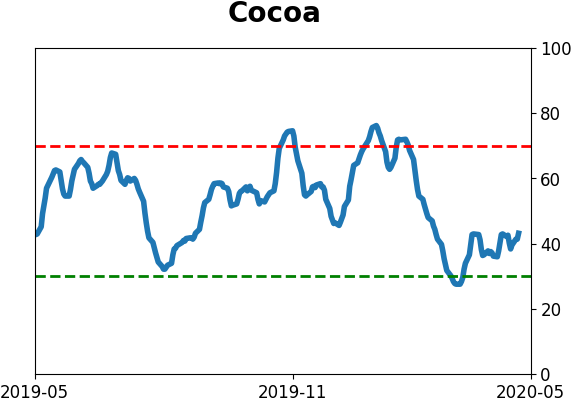
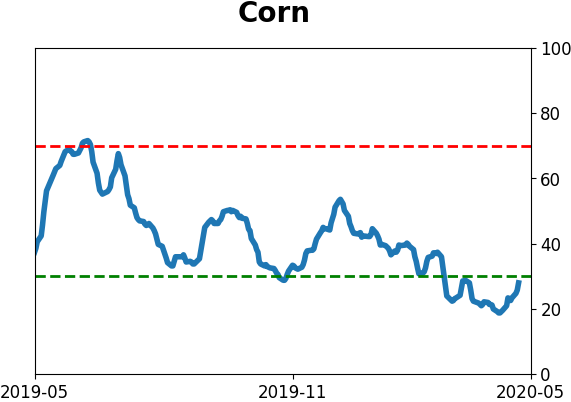
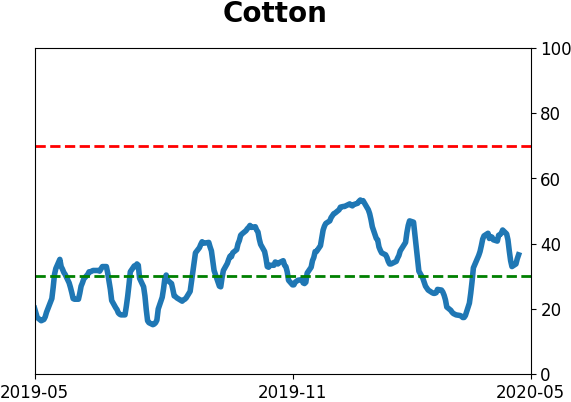
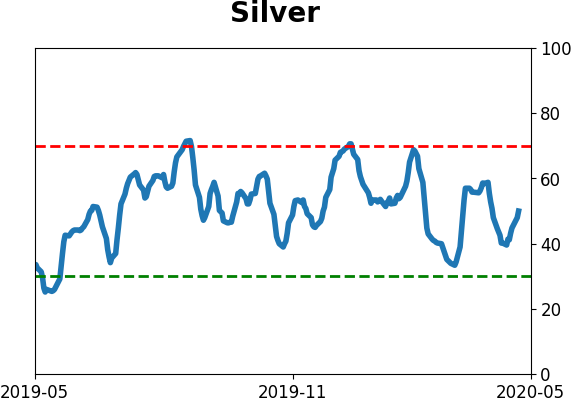
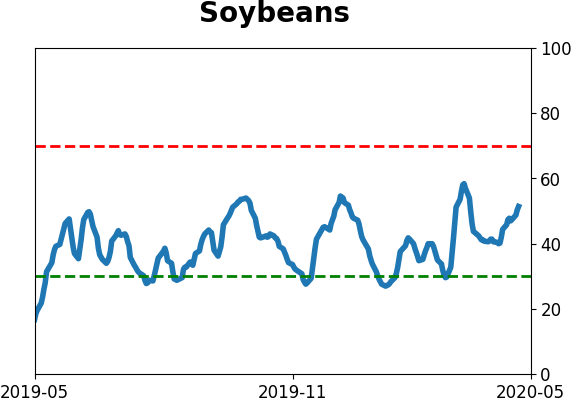
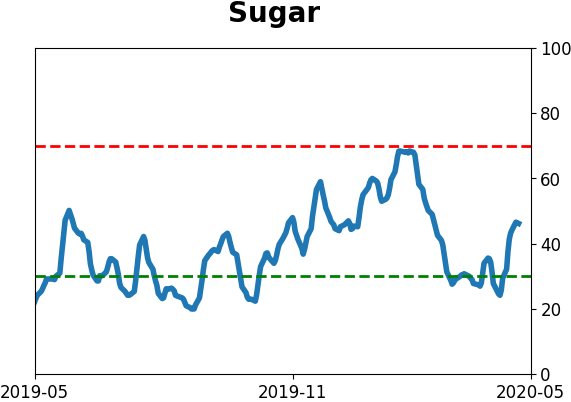
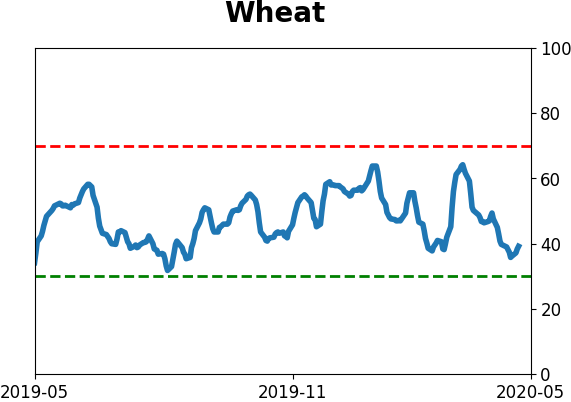
Agriculture
|
|
Research
BOTTOM LINE
A monthly survey of institutional versus individual sentiment on stocks shows that the latter is a lot more optimistic than the former. Responses to questions by Yale University showed that the spread between sentiment in the two groups is near the highest level in 30 years.
FORECAST / TIMEFRAME
None
|
Institutions are a lot more optimistic than mom-and-pop, and that may not be a good thing.
The latest results from a monthly survey by Yale University show that overall confidence about stocks is high, and it's especially so among institutions. Please see the Yale University website for underlying charts and data.
The survey asks four questions, with the tabulations designed to show what percentage of respondents are optimistic.
- The percent of the population expecting an increase in the Dow in the coming year.
- The percent of the population expecting a rebound the next day should the market ever drop 3% in one day.
- The percent of the population who attach little probability to a stock market crash in the next six months.
- The percent of the population who think that the market is not too high.
Based on the latest responses to each question, institutions represented in the survey are about 65% confident in the market. Individuals, however, are only about 54% confident. That sets up a classic "smart money" versus "dumb money" battle.
We saw on Tuesday that it isn't usually that easy, though. Just because someone has more money or more education does not make them a better investor. If anything, it's the opposite.
Below, we can see the spread between overall confidence levels in institutions vs. individuals.
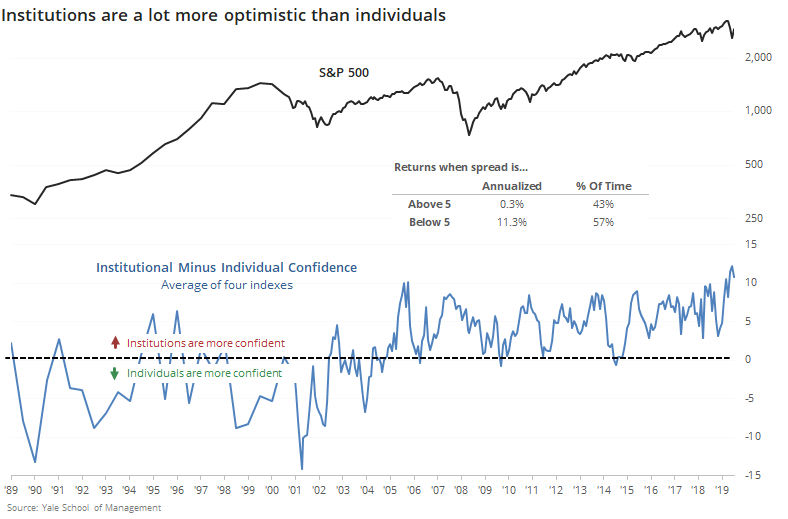
While it ticked down in April, it's still near the highest level in more than 30 years. Looking at the S&P 500's annualized returns, it averaged only +0.3% when the spread was more than +5 (meaning institutions were quite a bit more optimistic than individuals) versus a healthy +11.3% when the spread was below +5.
The spread has been gyrating within a range since 2005, so if we only look at the annualized returns since then, it remained at +0.3% when the spread was above +5 and it rose to +14.9% when below. So, it has only gotten stronger as a contrary indicator. This is not nearly enough to scream "sell" but it has a long enough history to at least suggest some caution.
BOTTOM LINE
In recent sessions, stocks have sold off near the end of regular trading hours. This has pushed indicators that look at late-day activity relative to the rest of the day to lower lows. The Smart Money Flow Index looks at this kind of behavior, and it's diverging from the S&P 500.
FORECAST / TIMEFRAME
None
|
Stocks are wildly overvalued, risk is the highest it's ever been, and some of the best investors in history see no reason to deploy cash. That's been the tone of repeated articles in the past week, suggesting that now is no time to buy.
While there isn't always a direct correlation between what respected investors say publicly and what they do privately, some indicators attempt to monitor their activity by looking at how stocks do during various times of the day. The most popular, by far, is some version of the Smart Money Flow Index (SMFI), which looks at trading activity before the close relative to the rest of the day.
The idea is that the most informed investors watch activity during the day, absorb as much information as possible, then transact before the close of regular trading hours. Whether that's actually true or not is debatable. Especially lately, since ETFs have become such a large part of the market and they drive an increasing amount of the volume in the last half hour.
If the smart money really does wait until the waning minutes, then perhaps we have an issue. As Bloomberg notes:
"U.S. stocks have been dropping toward the end of their regular session in the past couple of weeks....the Smart Money Flow Index, which measures the Dow Jones Industrial Average 30 minutes into a session versus the end of the day, has been decreasing in the past few weeks..."
Indeed it has. Over the past month, the S&P 500 has been rising steadily while the SMFI has been declining. Even though it uses the Dow instead of S&P, our version which focuses on the S&P during more narrow windows is also declining quickly.
The question is whether it matters. If we go back to 1970 and look for times when the S&P 500 was below its 200-day moving average and had rallied at least a couple of percent over the past month while the SMFI declined, then we get the following.
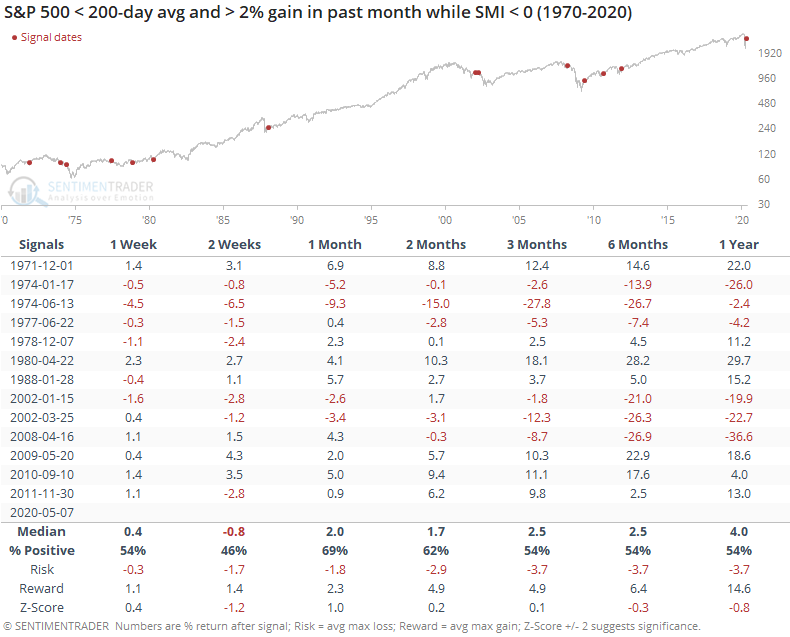
If the S&P rallied during downtrends and the smart money was selling, it dragged on returns over the next couple of weeks. Across the other time frames, its returns were about in line with random. The risk/reward was mostly positive, but unimpressive. There were some very large losses, but also some large gains. This was an inconsistent predictor.
Looked at another way, the table below shows downtrends when the S&P 500 was within 1% of its highest level over the past month, while the SMFI was within 1% of its lowest level.
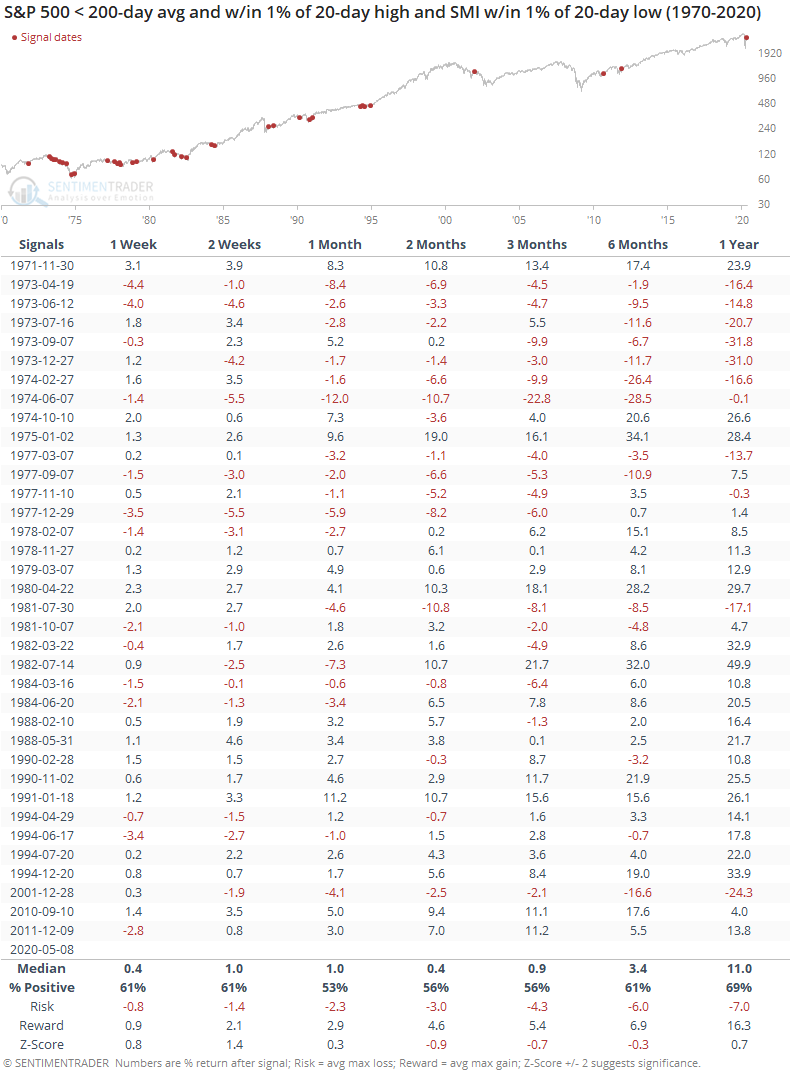
This was quite negative during the 1970s but considerably less so in recent decades.
The idea that we can monitor smart investors by price action alone is an iffy one. It can work when there are very wide divergences or rapid changes, but it has become less of an accurate guide in recent years, most likely due to the influence of passive fund flows and the influence they have over late-day trading activity.
The recent drop in the Smart Money Flow Index might be a worry, but it should be only a minor one at worst.
Active Studies
| Time Frame | Bullish | Bearish | | Short-Term | 0 | 6 | | Medium-Term | 12 | 3 | | Long-Term | 37 | 3 |
|
Indicators at Extremes
Portfolio
| Position | Weight % | Added / Reduced | Date | | Stocks | 38.9 | Reduced 10% | 2020-05-13 | | Bonds | 0.0 | Reduced 6.7% | 2020-02-28 | | Commodities | 5.1 | Added 2.4%
| 2020-02-28 | | Precious Metals | 0.0 | Reduced 3.6% | 2020-02-28 | | Special Situations | 0.0 | Reduced 31.9% | 2020-03-17 | | Cash | 56.0 | | |
|
Updates (Changes made today are underlined)
In the first months of the year, we saw manic trading activity. From big jumps in specific stocks to historic highs in retail trading activity to record highs in household confidence to almost unbelievable confidence among options traders. All of that came amid a market where the average stock couldn't keep up with their indexes. There were signs of waning momentum in stocks underlying the major averages, which started triggering technical warning signs in late January. The kinds of extremes we saw in December and January typically take months to wear away, but the type of selling in March went a long way toward getting there. When we place the kind of moves we saw into March 23 into the context of coming off an all-time high, there has been a high probability of a multi-month rebound. After stocks bottomed on the 23rd, they enjoyed a historic buying thrust and retraced a larger amount of the decline than "just a bear market rally" tends to. While other signs are mixed that panic is subsiding, those thrusts are the most encouraging sign we've seen in years. Shorter-term, there have been some warning signs popping up and our studies have stopped showing as positively skewed returns. I reduced my exposure some in late April and was looking for a pattern of lower highs and lower lows to reduce it further. With weakness on May 12, our studies turned even more negative over the short- to medium-term so I reduced a bit more. Some short-term indicators are already nearing oversold so we may get a quick rebound but it is what it is. If we see a clear pattern of lower lows, I may reduce even further in the week(s) ahead. Long-term prospects look decent because of the thrusts we saw off the low, but I'm more comfortable in cash in the interim. I'd consider adding back if we see our indicators and studies start to skew to the upside again, or if price action turns clearly better, indicating my caution is wrong.
RETURN YTD: -9.3% 2019: 12.6%, 2018: 0.6%, 2017: 3.8%, 2016: 17.1%, 2015: 9.2%, 2014: 14.5%, 2013: 2.2%, 2012: 10.8%, 2011: 16.5%, 2010: 15.3%, 2009: 23.9%, 2008: 16.2%, 2007: 7.8%
|
|
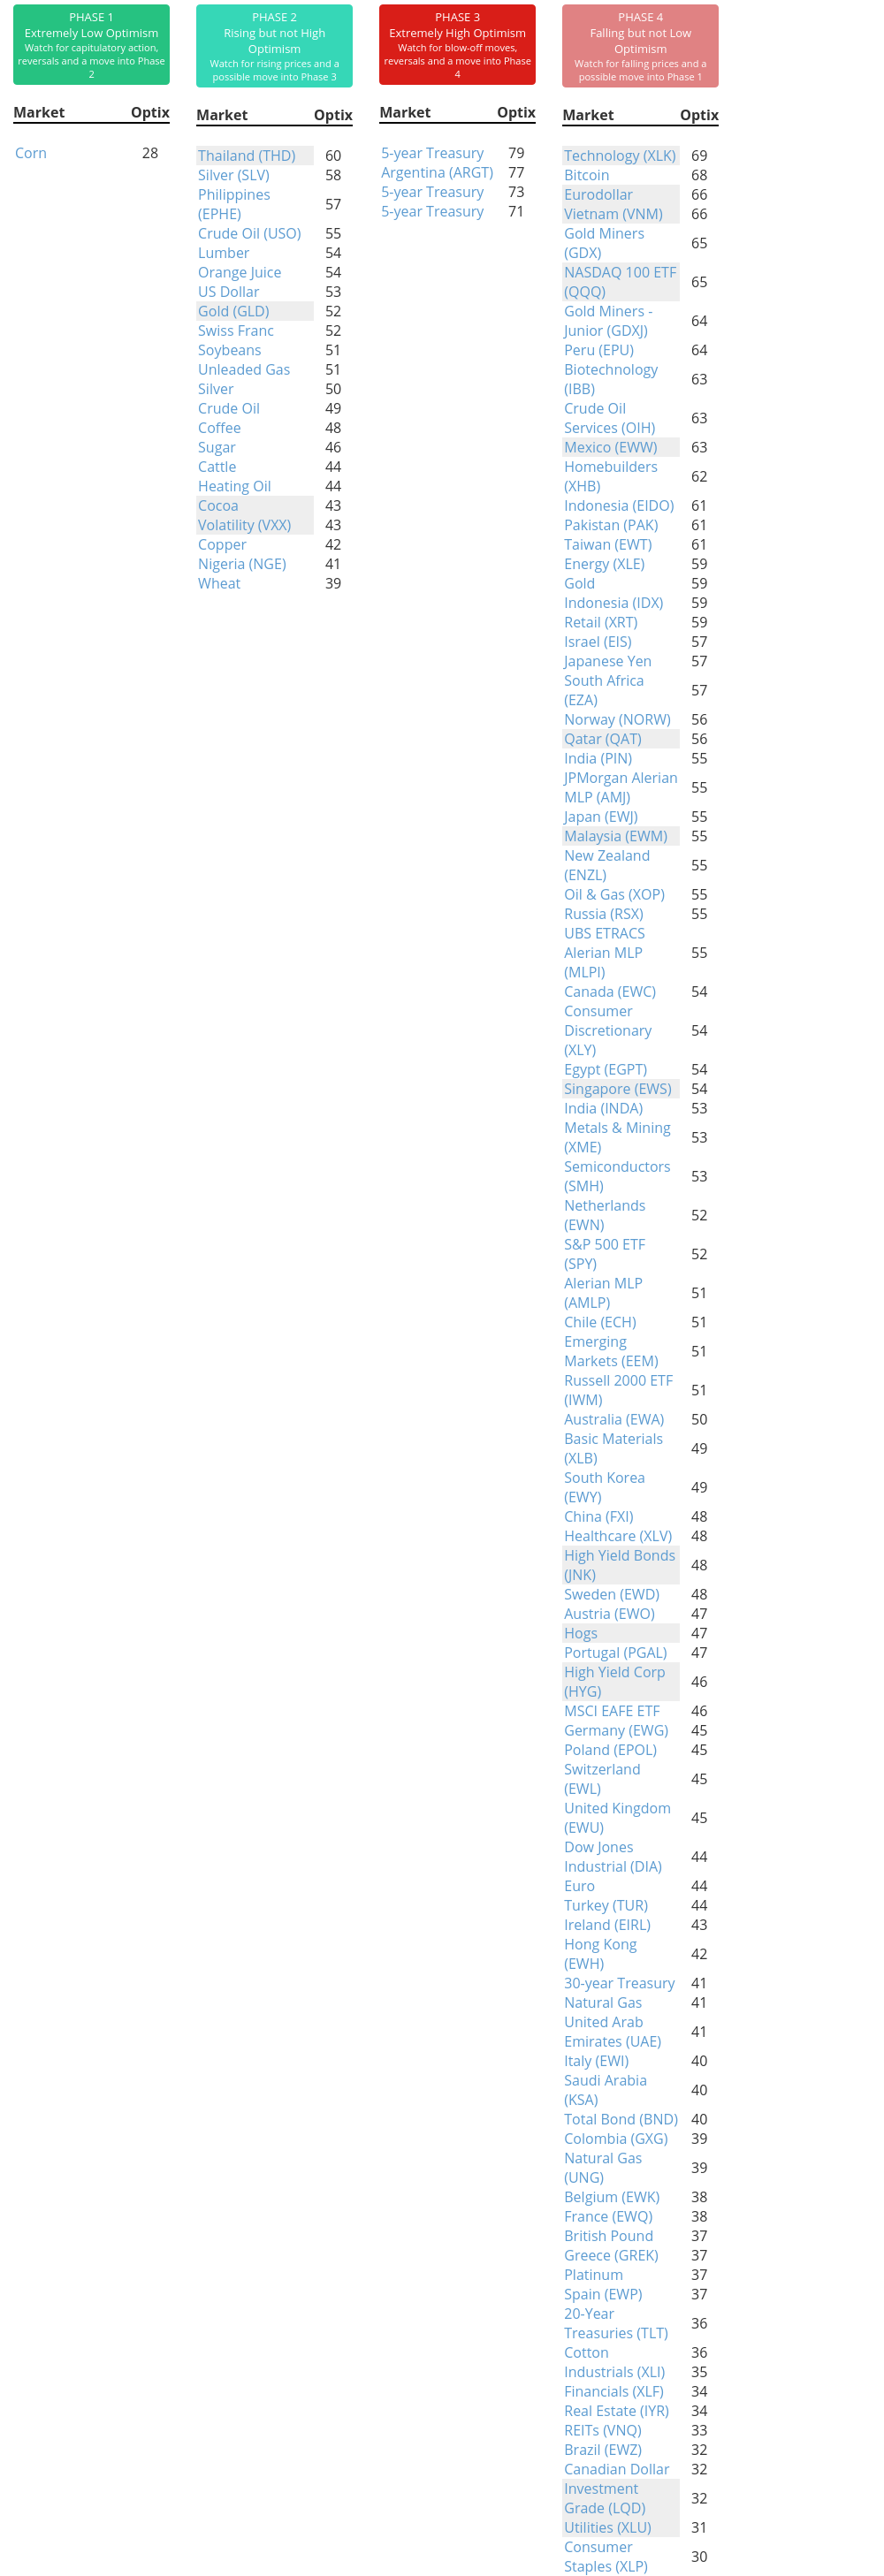
Phase Table
Ranks
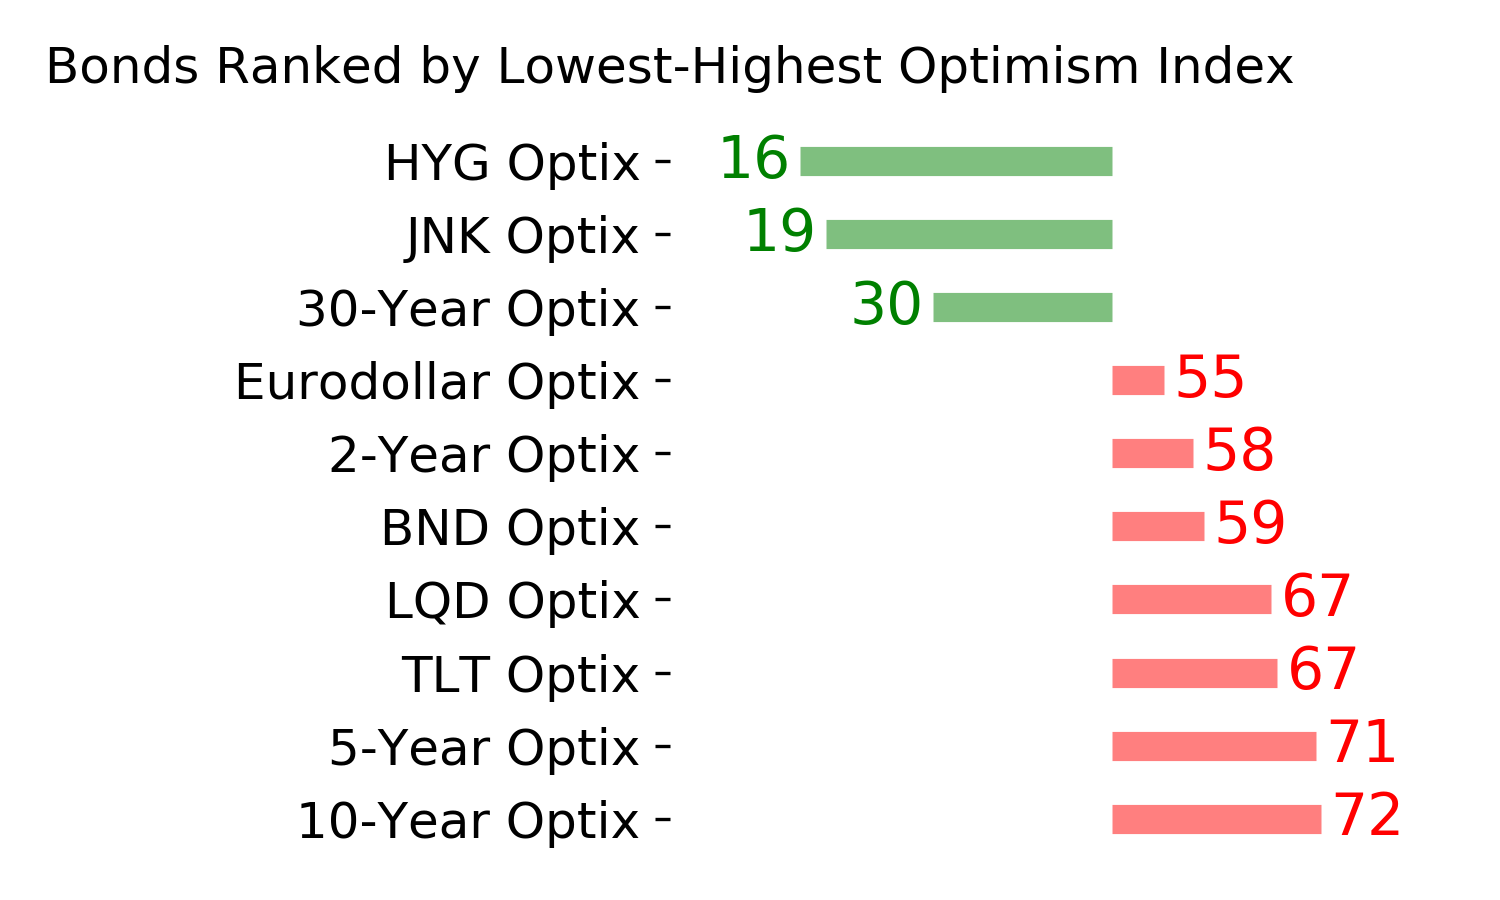
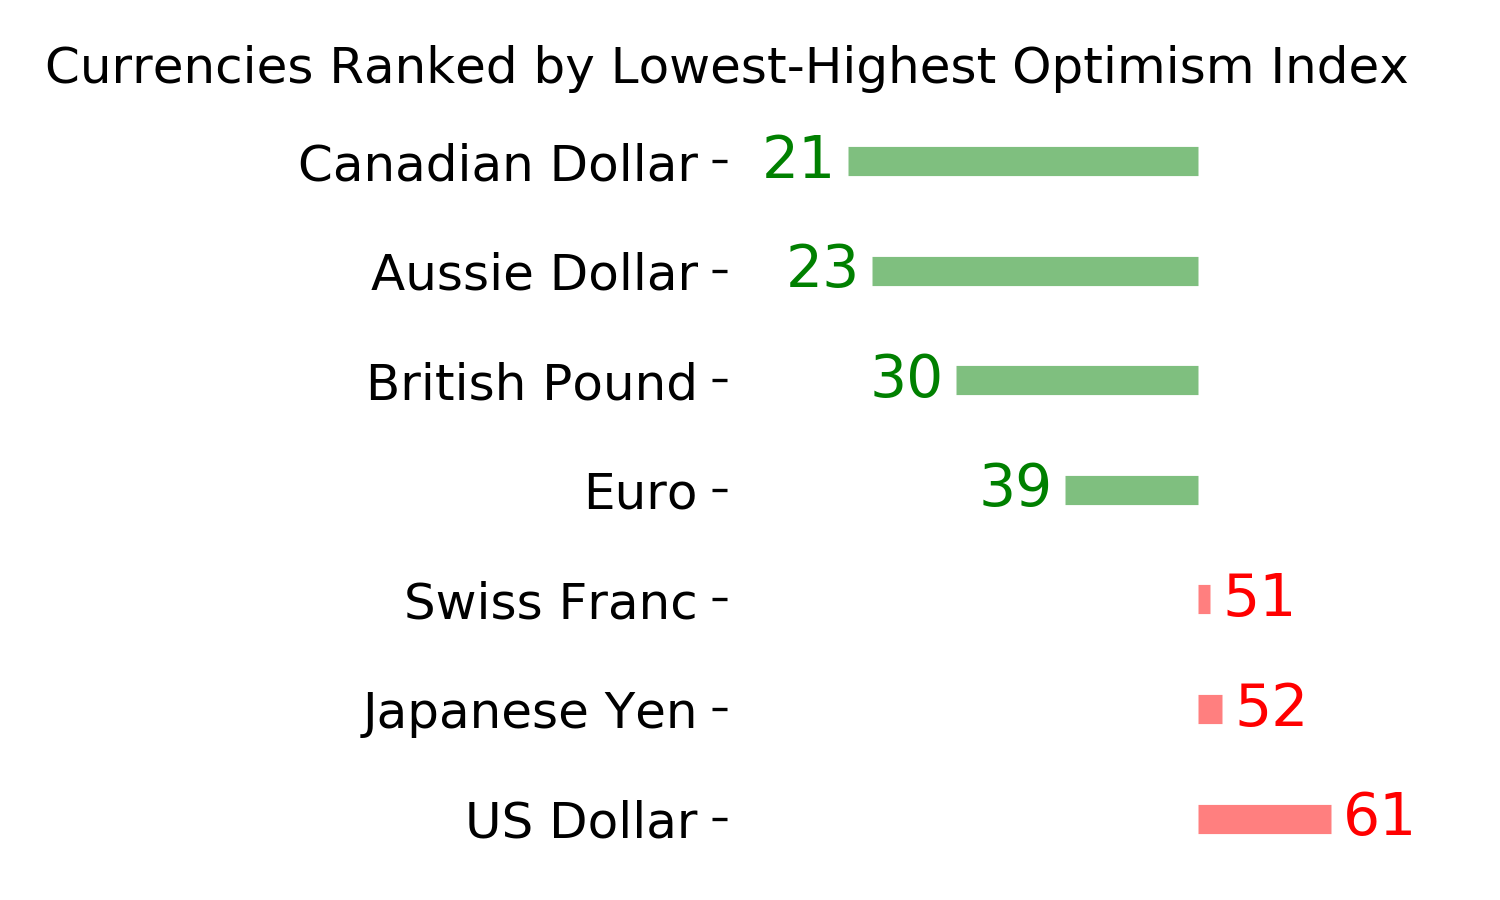
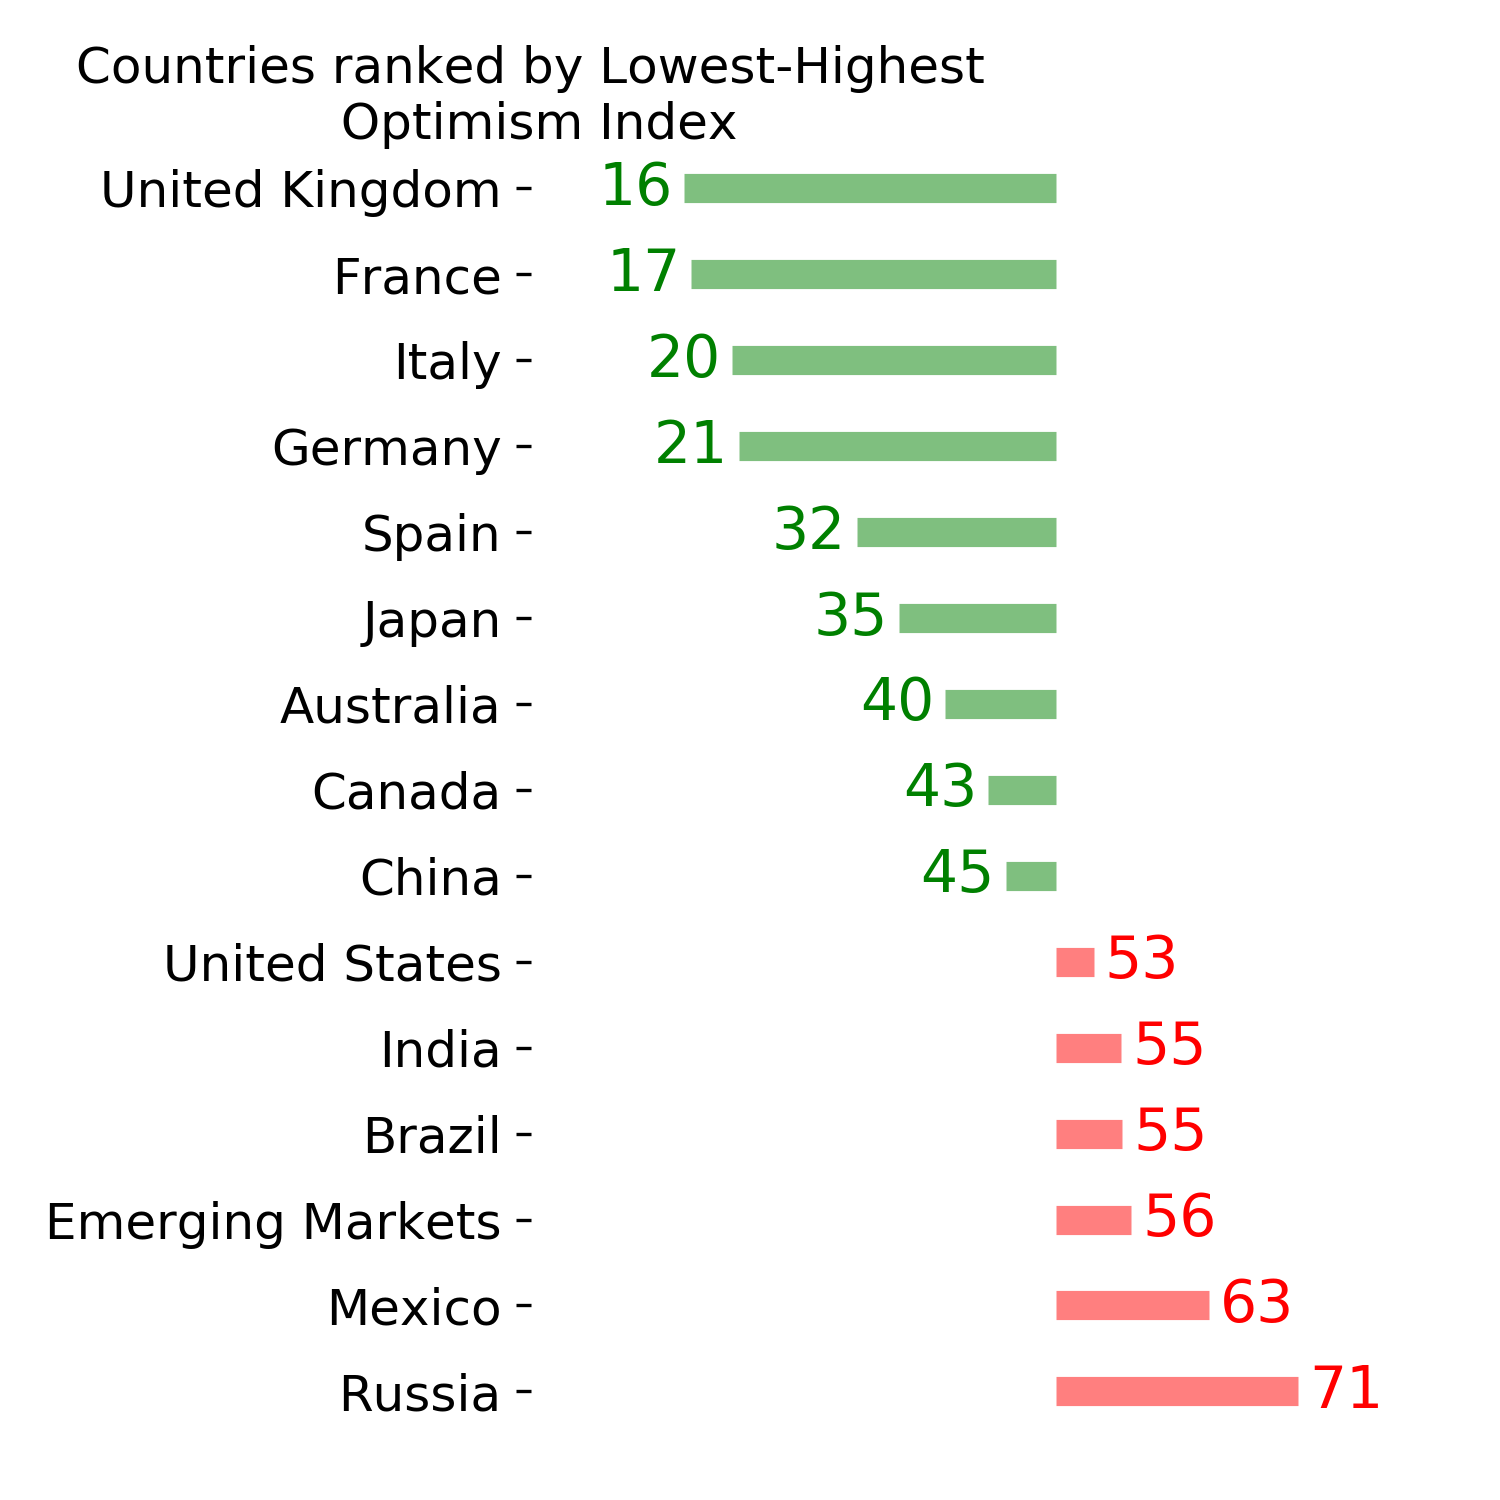
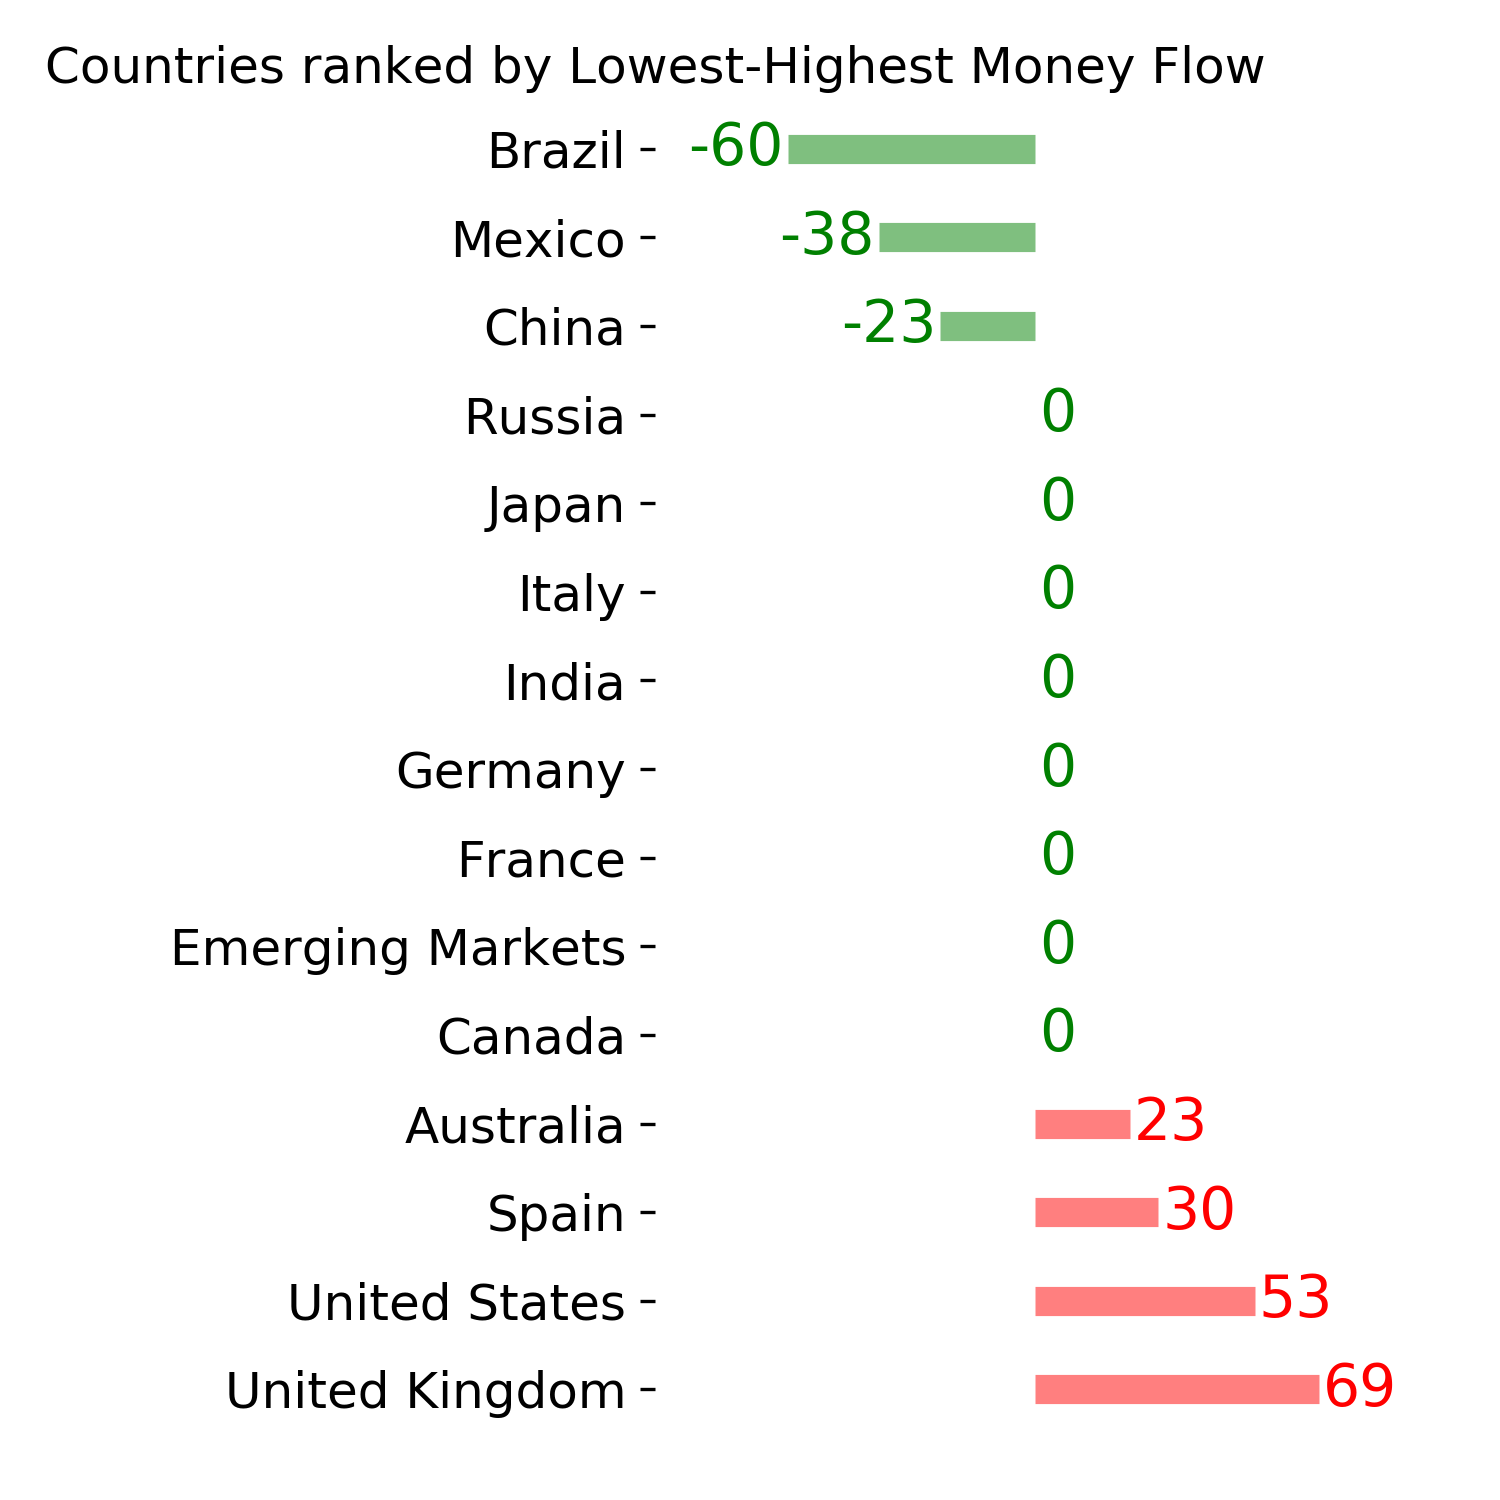
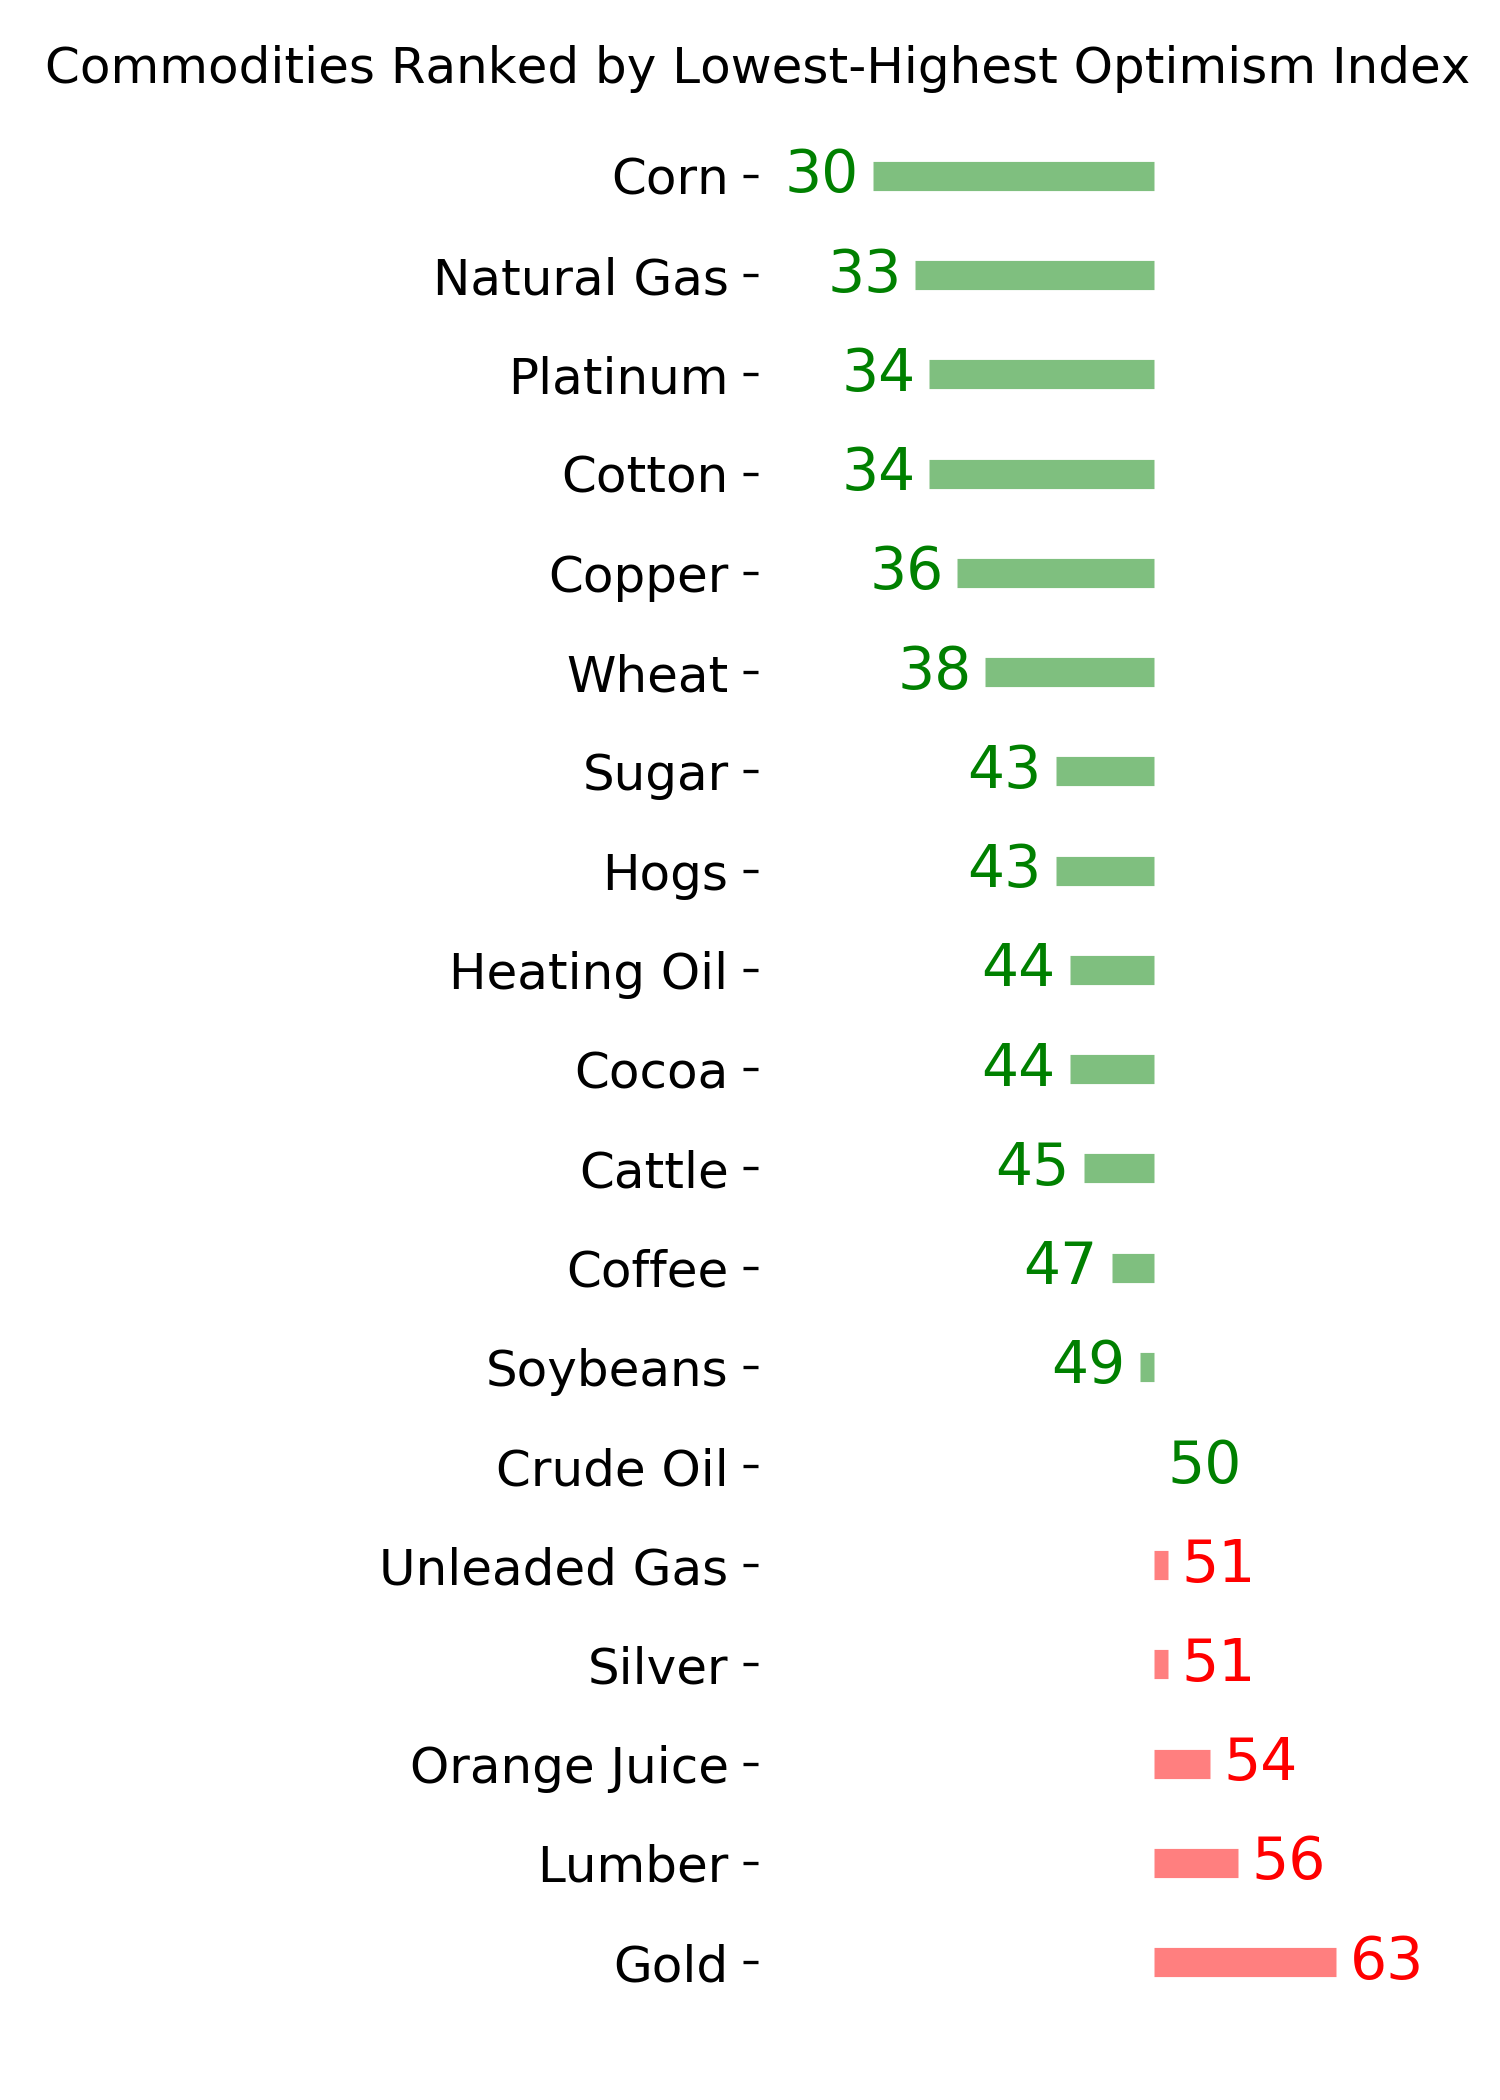
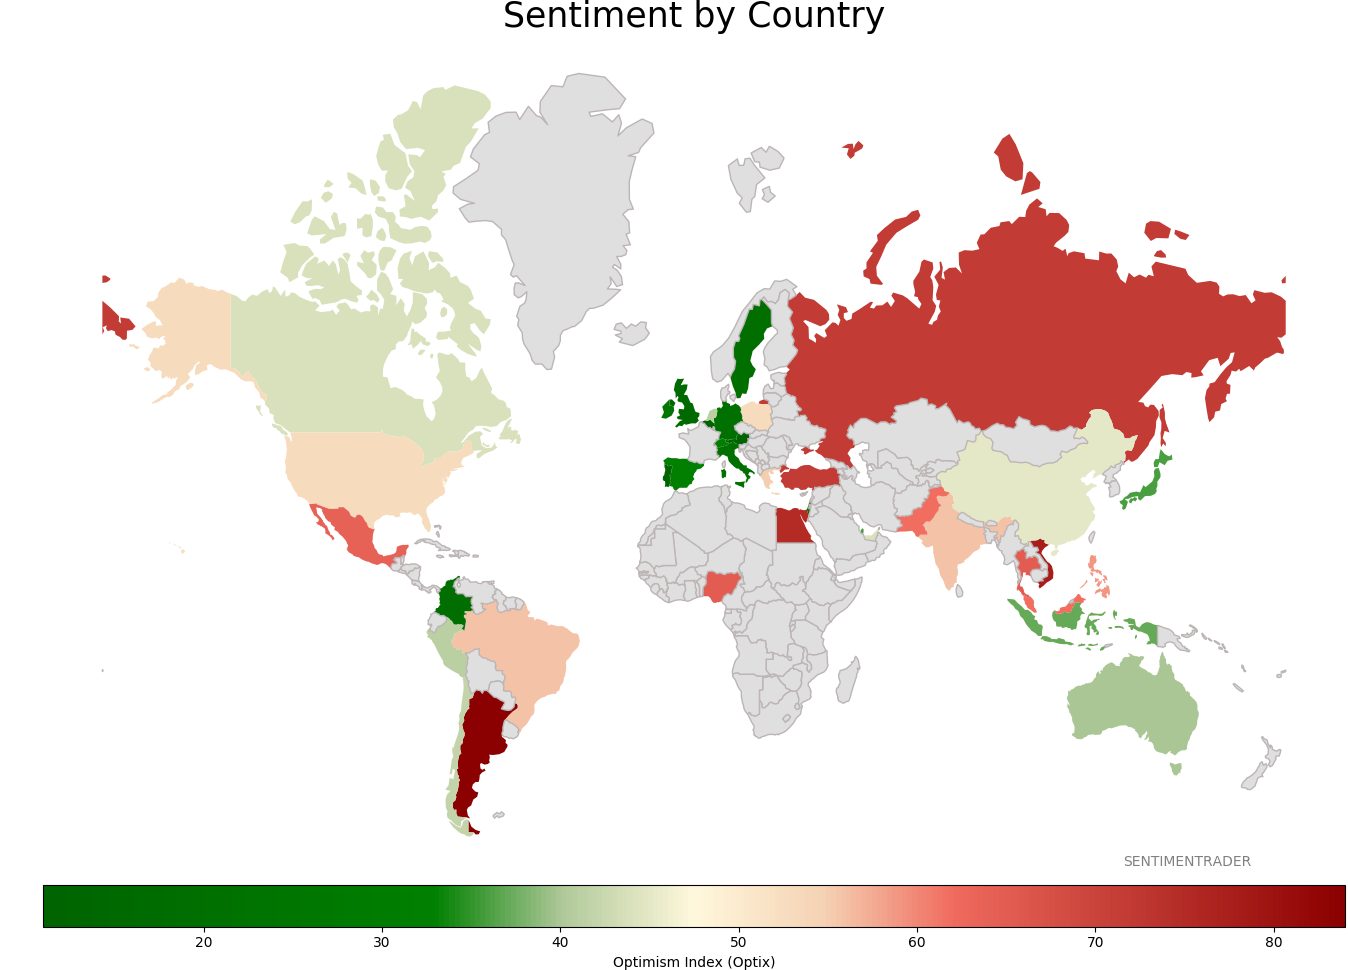
Sentiment Around The World
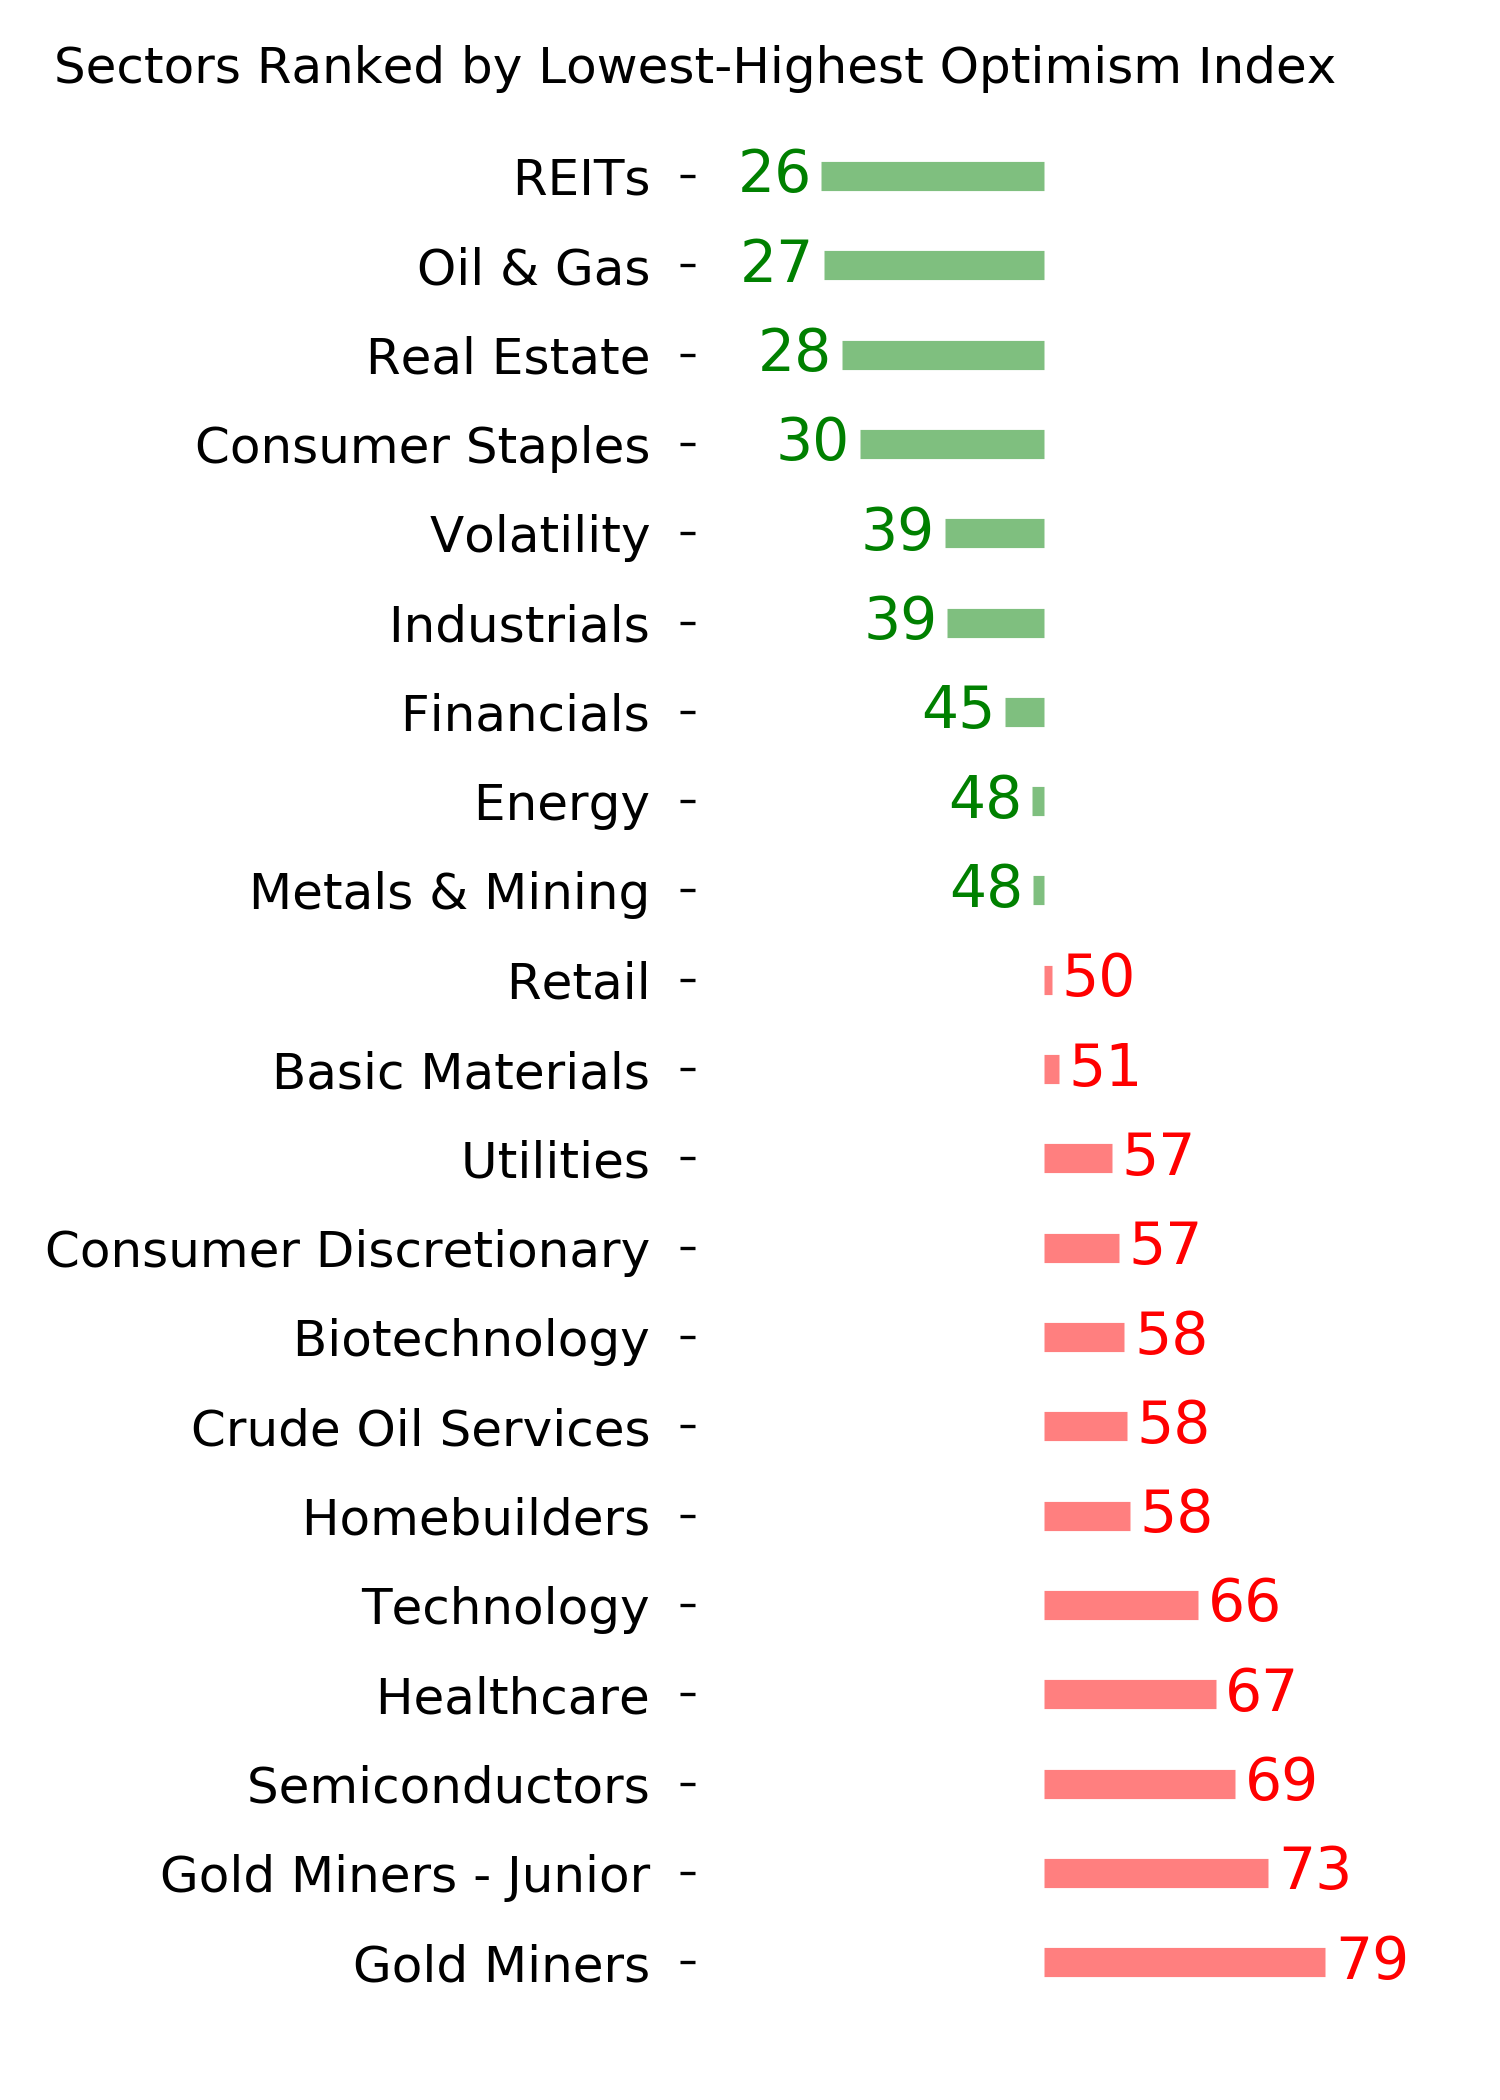
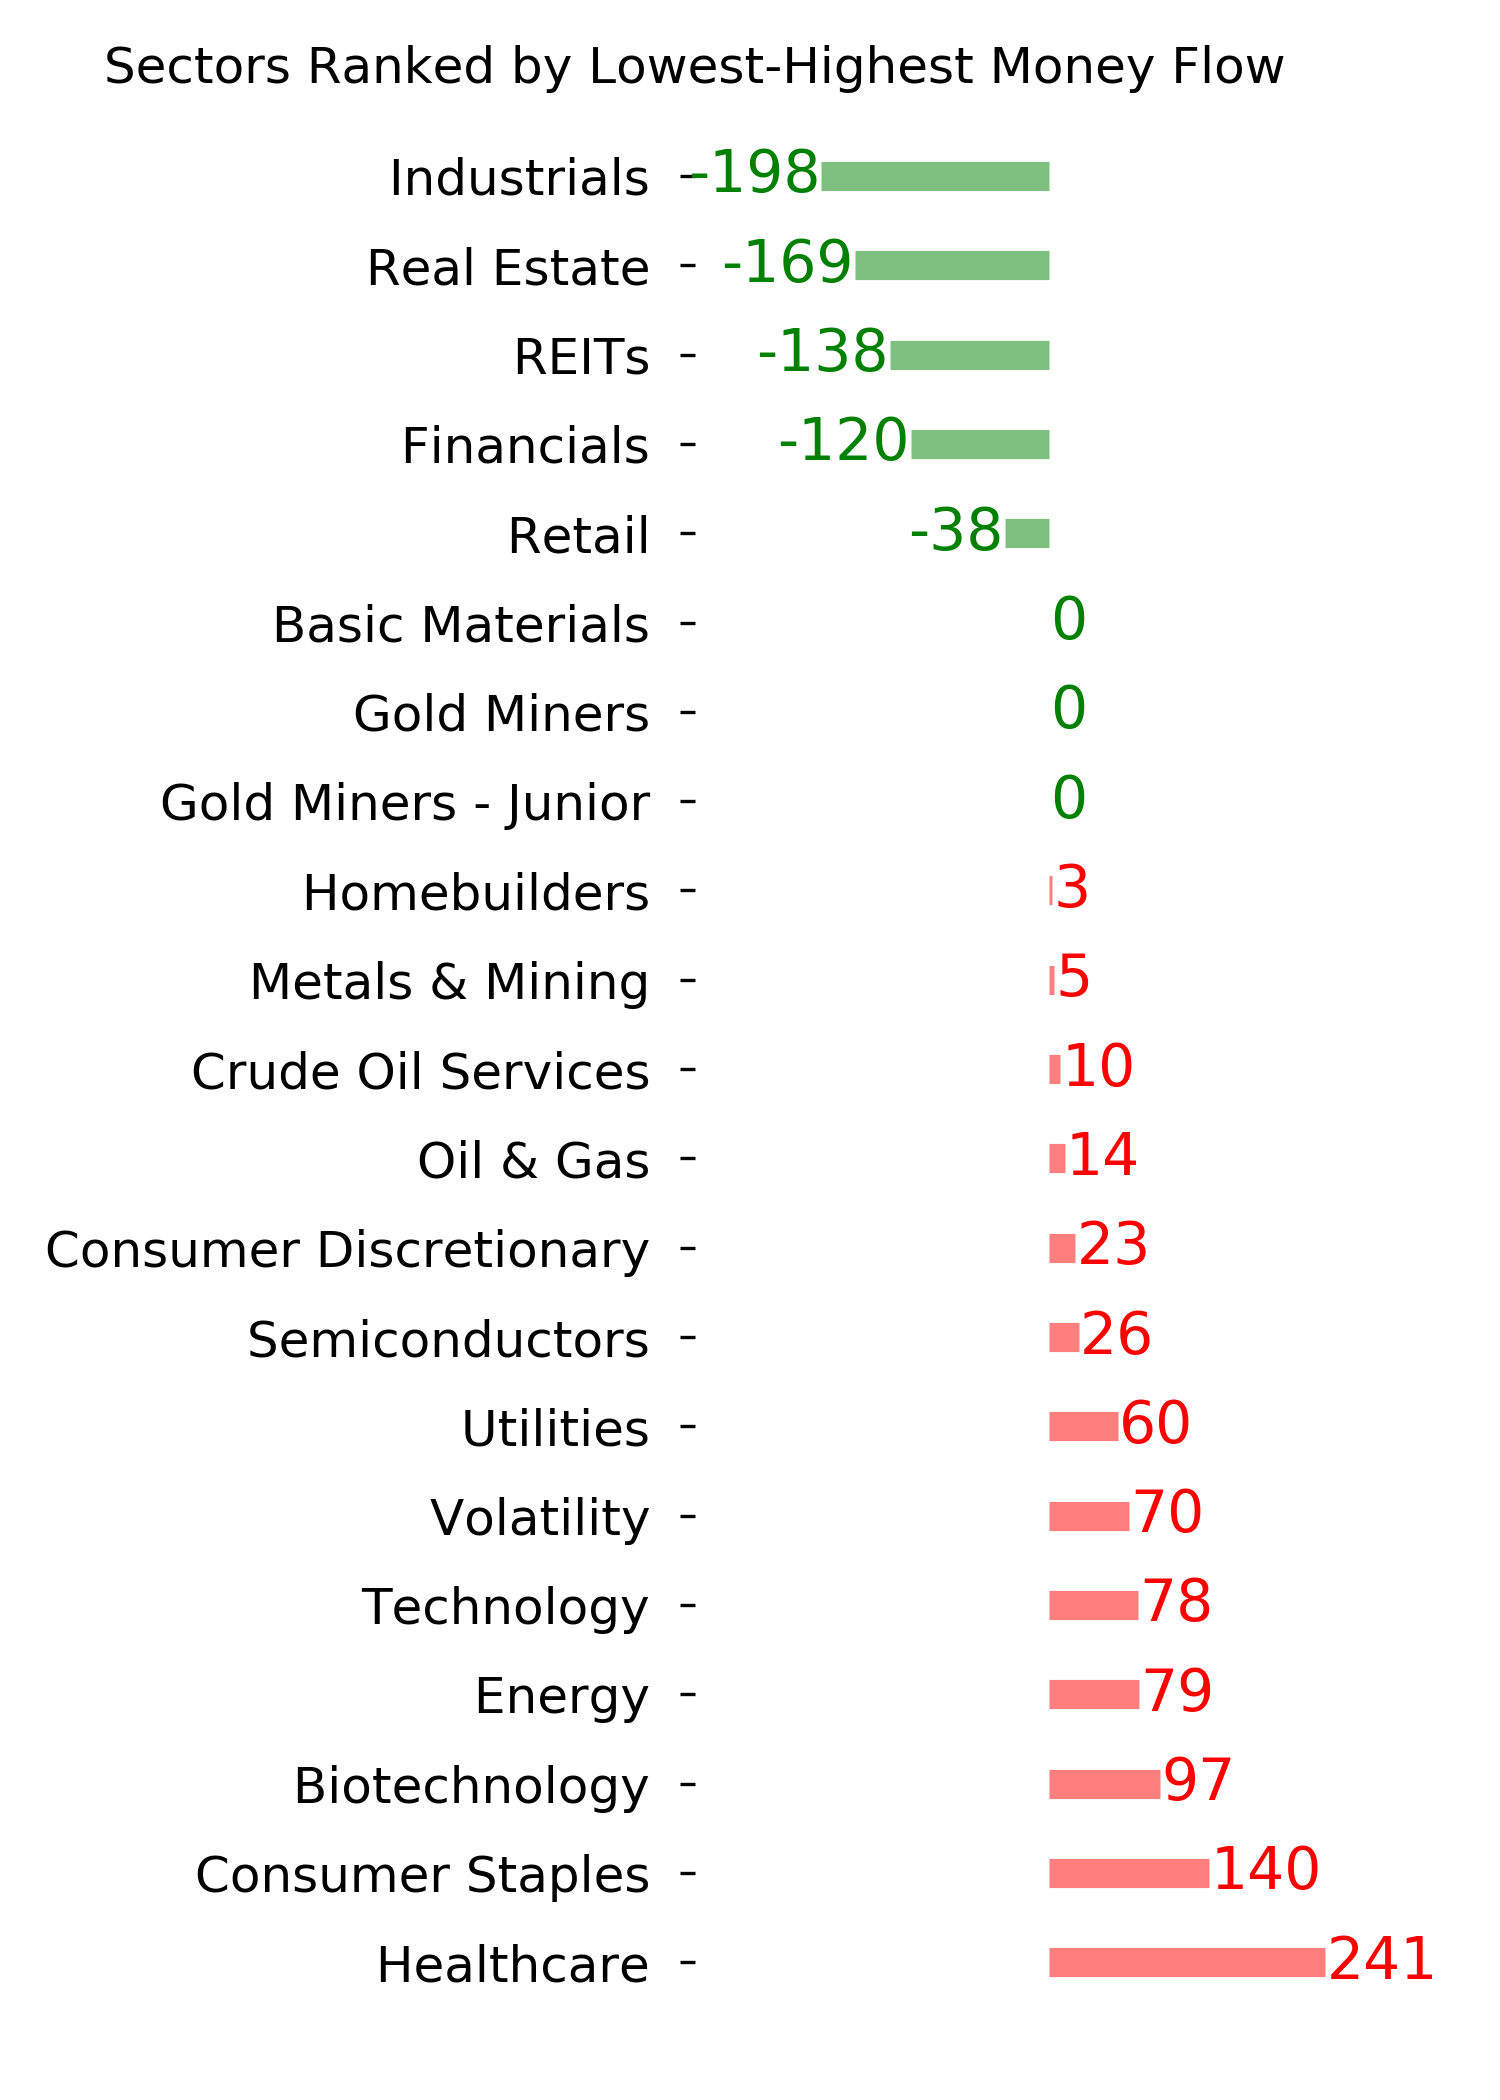
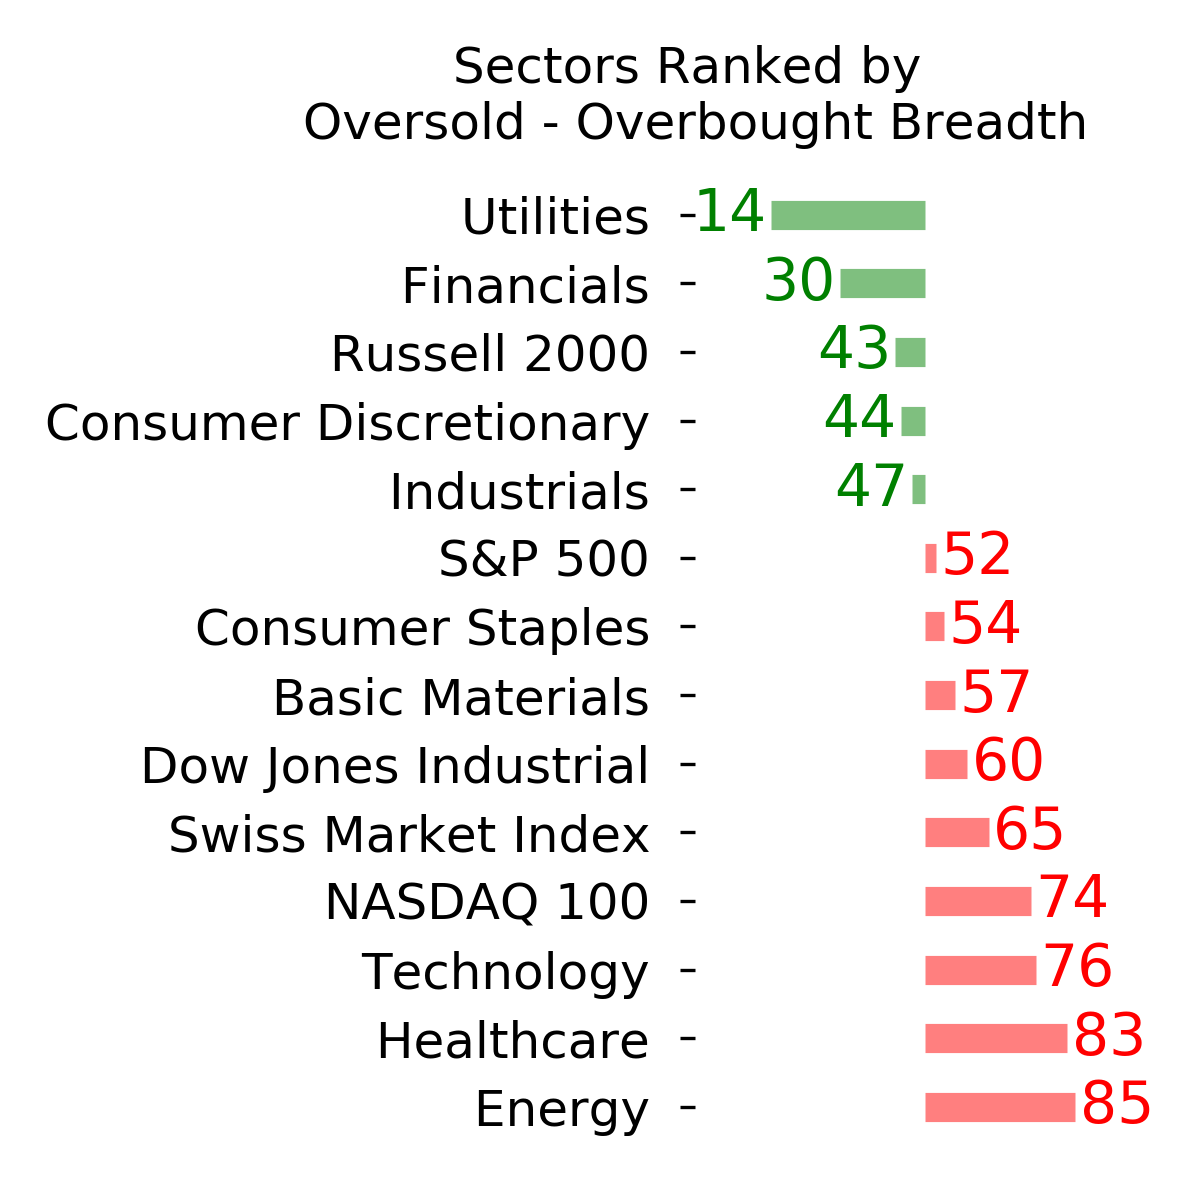
Optimism Index Thumbnails
|
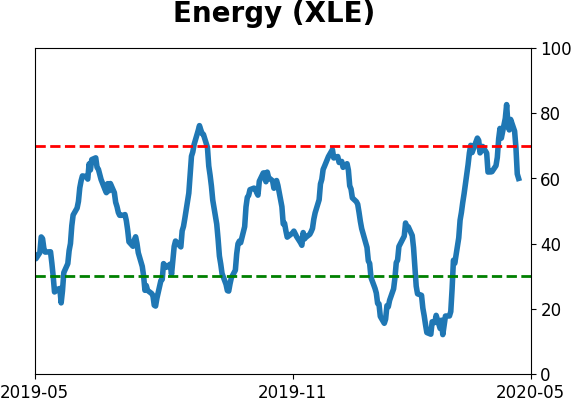
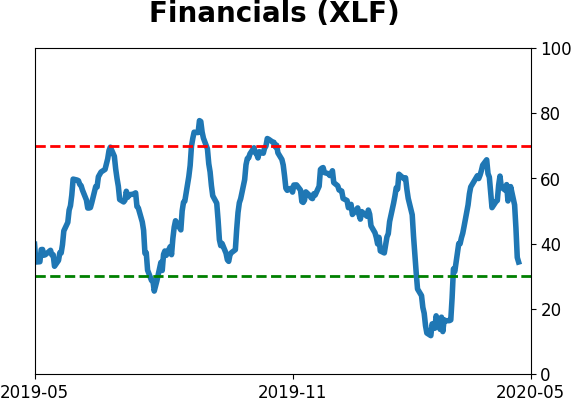
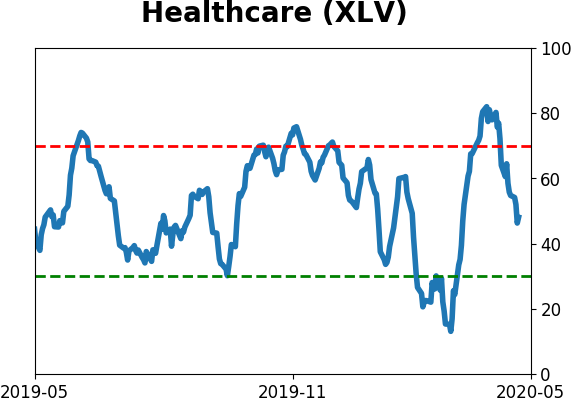
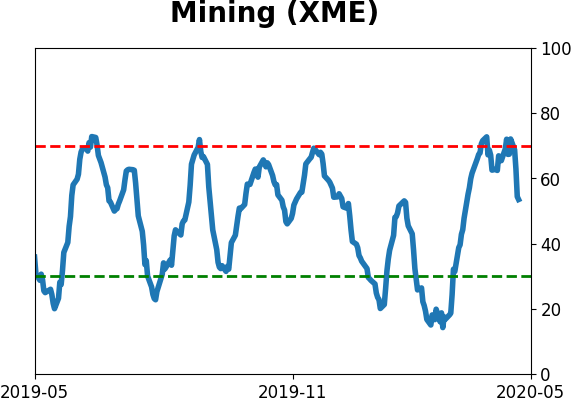
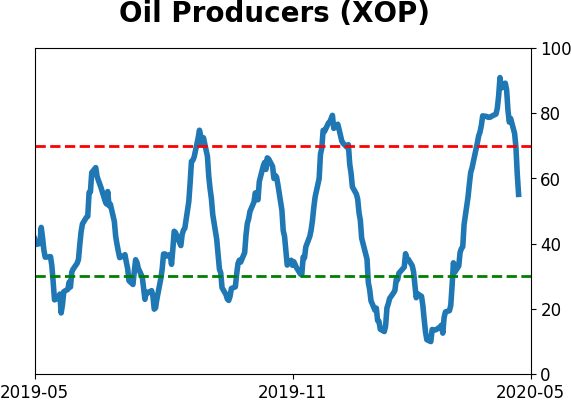
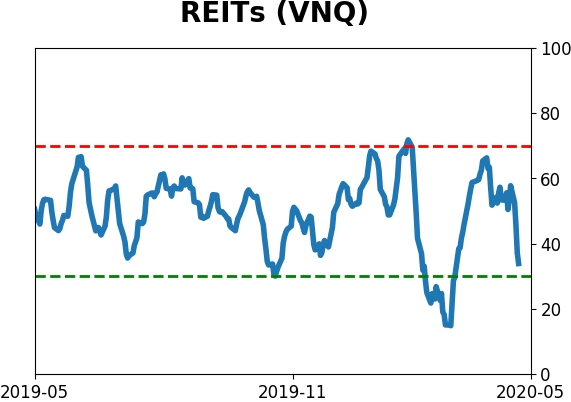
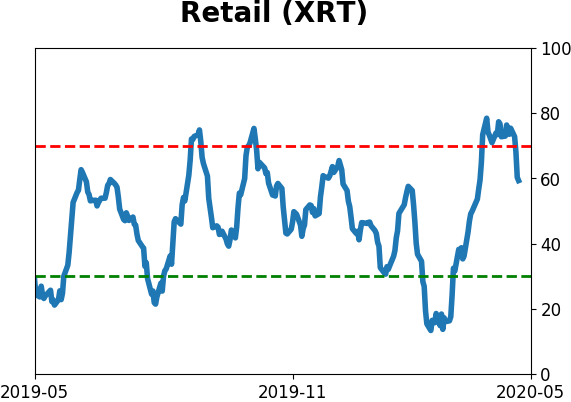
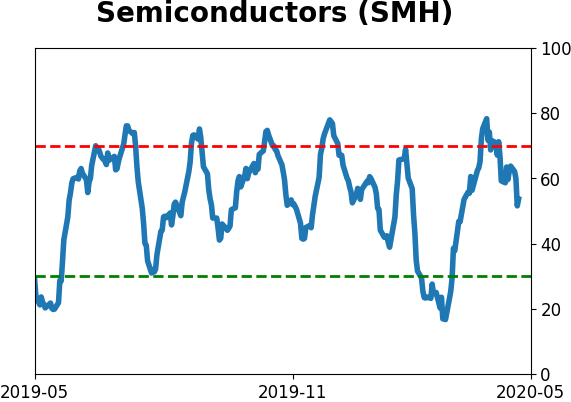
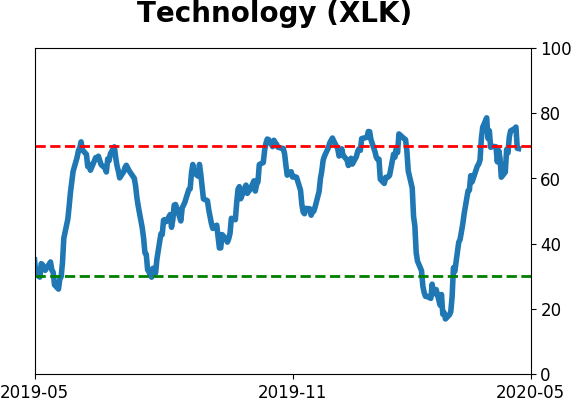
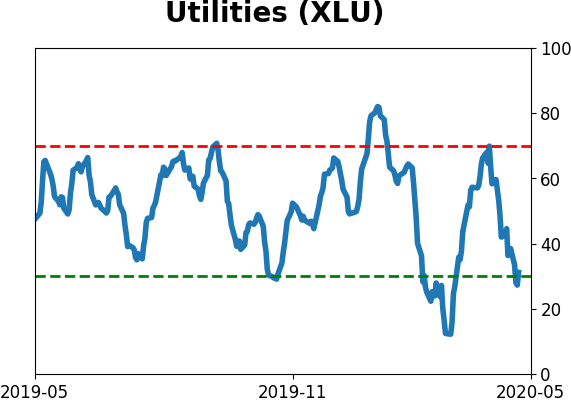
Sector ETF's - 10-Day Moving Average
|
|
|
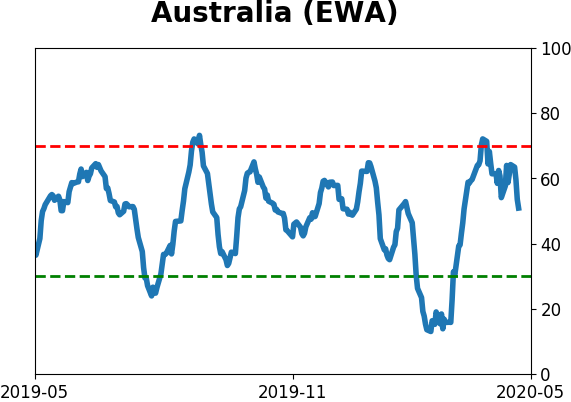
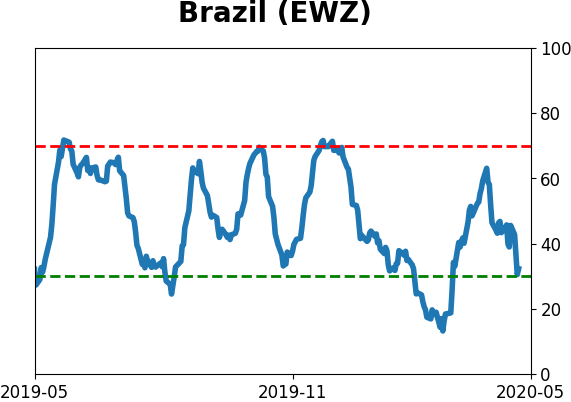
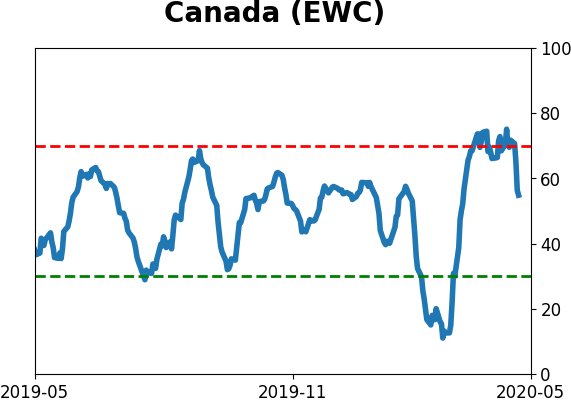
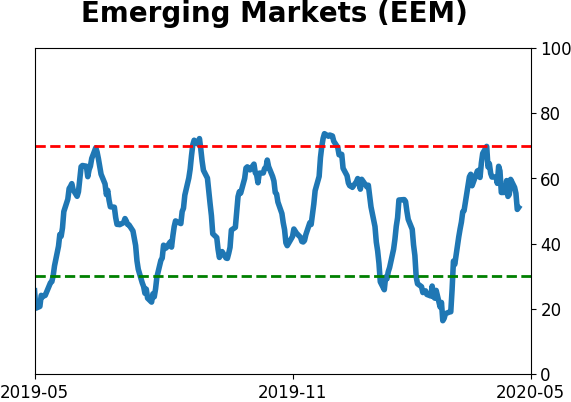
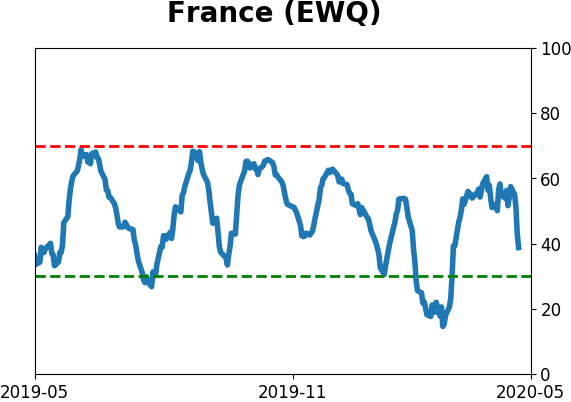
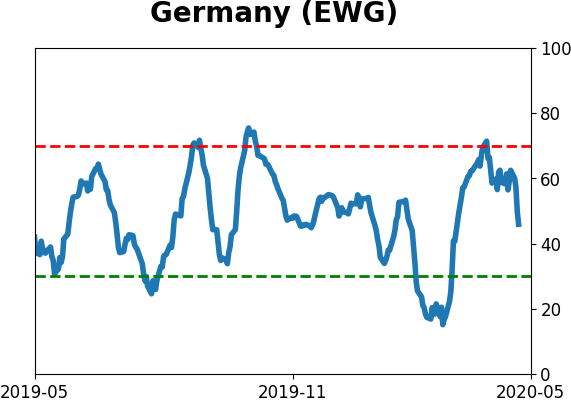
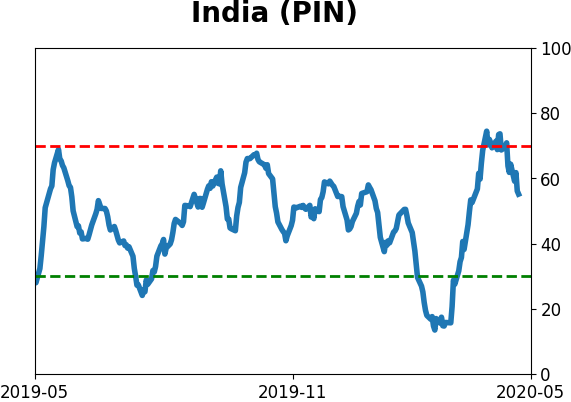
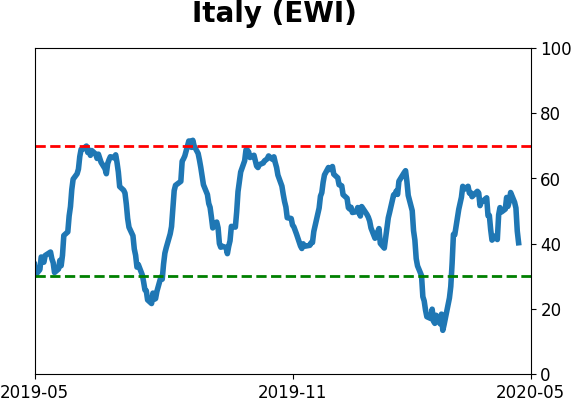
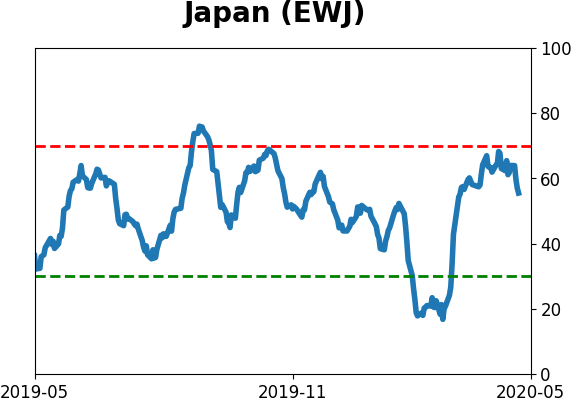
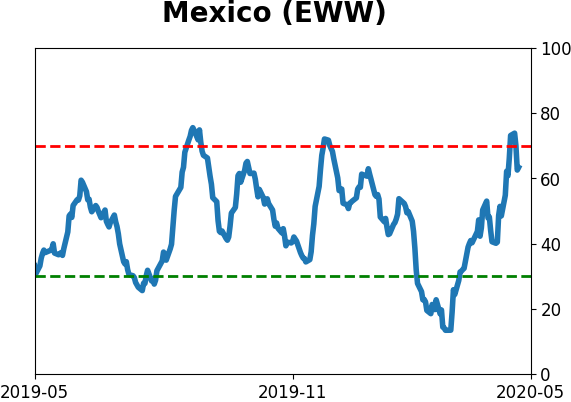
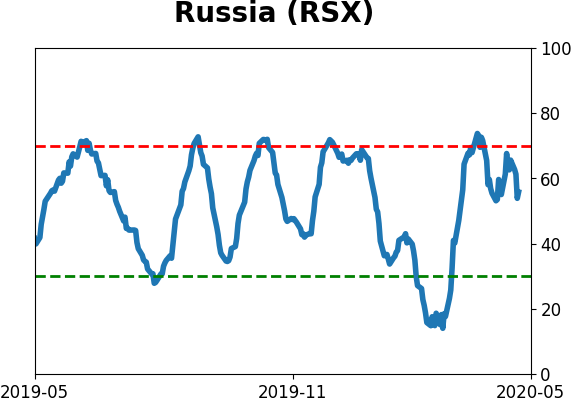
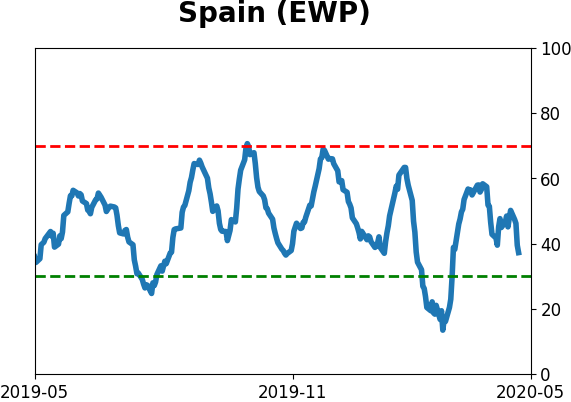
Country ETF's - 10-Day Moving Average
|
|
|
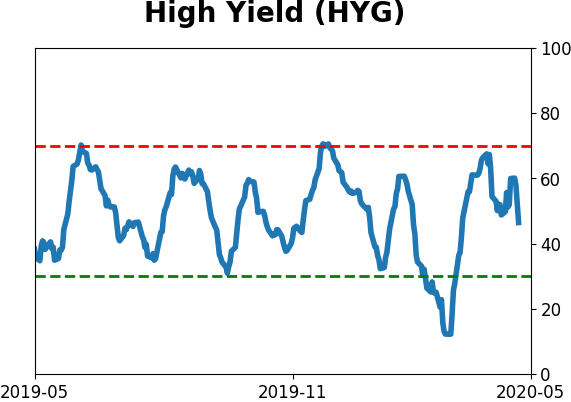
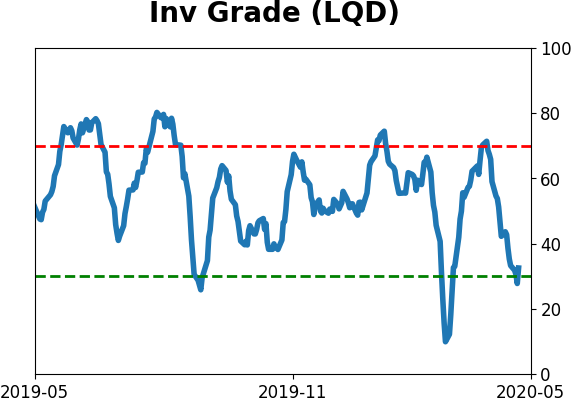
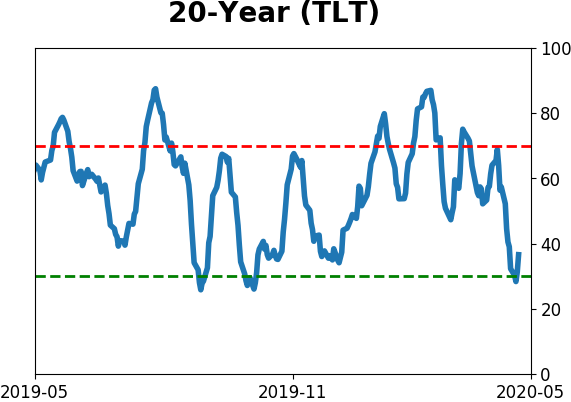
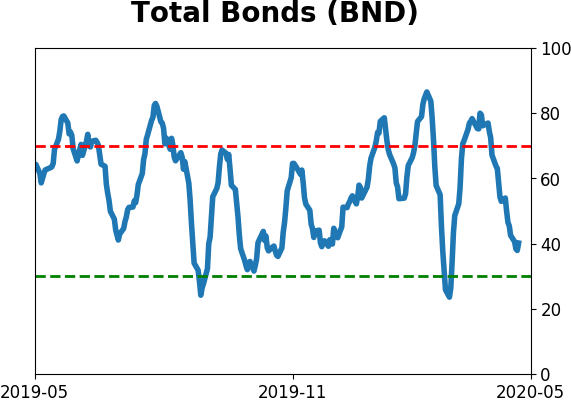
Bond ETF's - 10-Day Moving Average
|
|
|
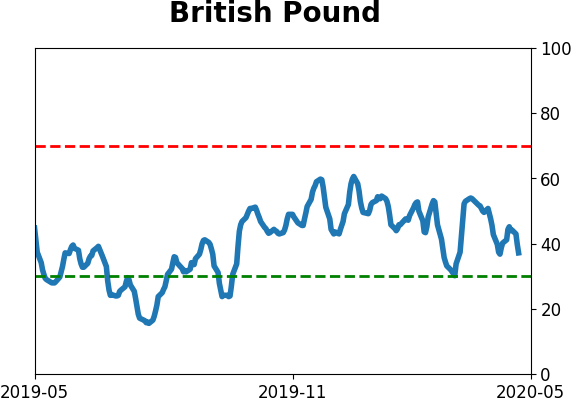
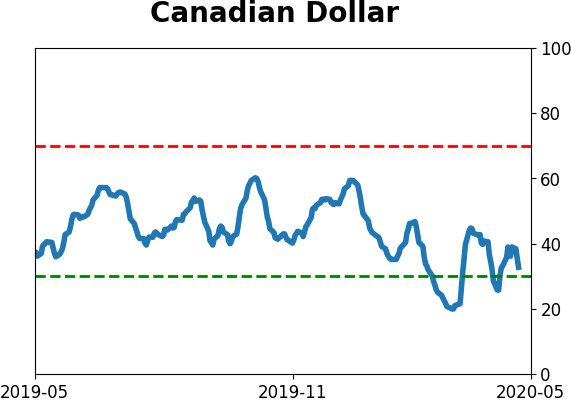
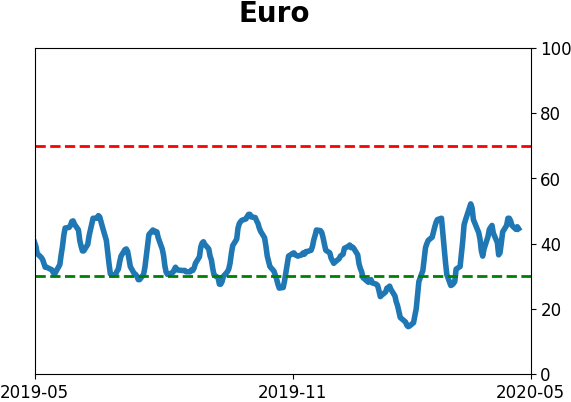
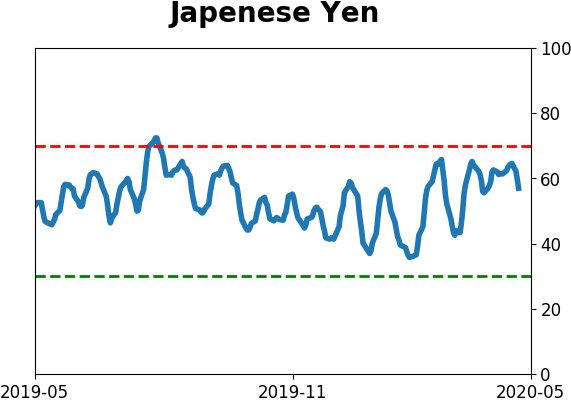
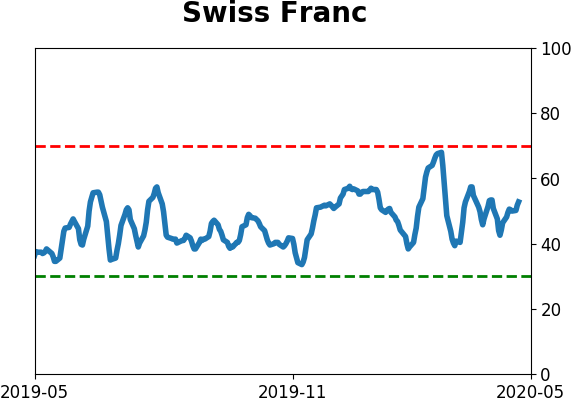
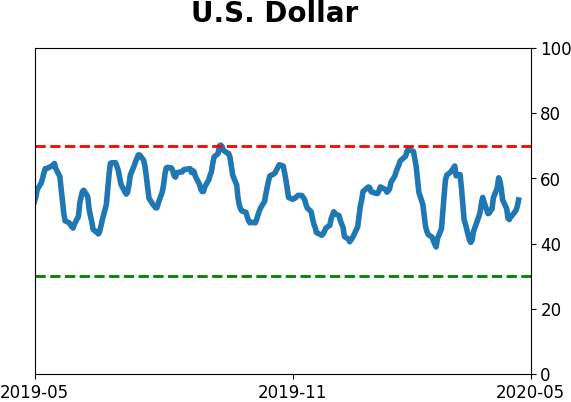
Currency ETF's - 5-Day Moving Average
|
|
|
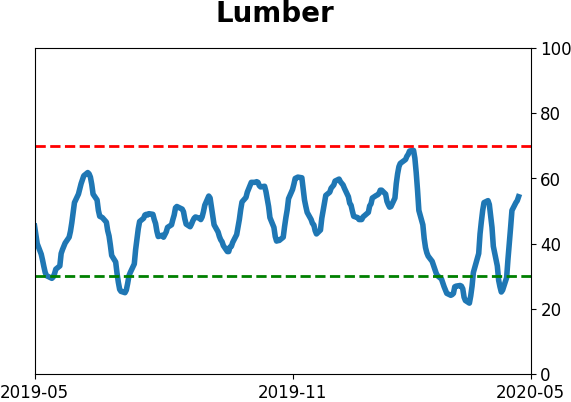
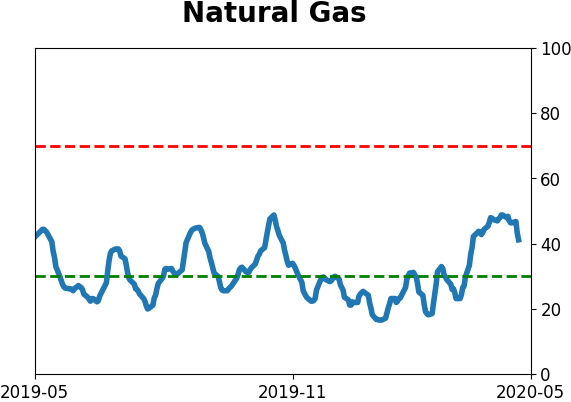
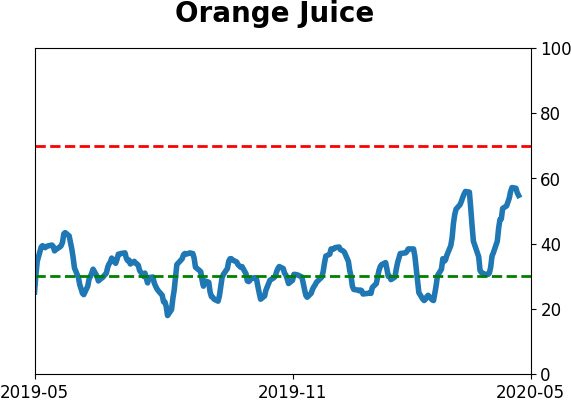
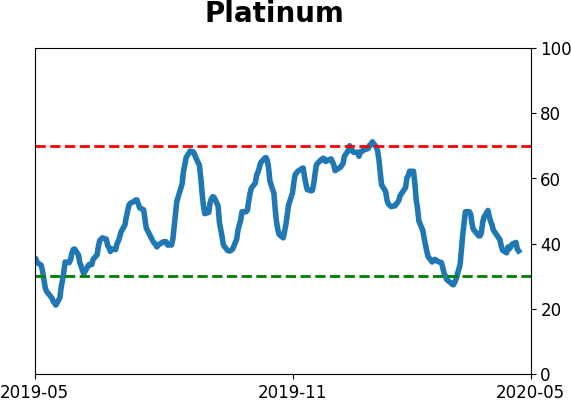
Commodity ETF's - 5-Day Moving Average
|
|