Headlines
|
|
When it comes to markets, "book learnin'" isn't necessarily a good thing:
A survey from the New York Fed shows high optimism about stocks among consumers. But that optimism isn't so evenly distributed. Ironically, the time to worry is when those with high incomes, high education, and high numeracy become the most optimistic compared to those without those qualities, and so far they're holding back.
Options data shows concern is just a memory:
Over the past couple of weeks, options traders have shifted their focus from protective puts to speculative calls. While the indicators aren't yet showing excessive optimism, it's clear that most of the fear has worn off and sentiment is, at worst, apathetic, and it happened fast. During a bear market, that's enough to be a concern.
Almost, but not quite: After trading below its 200-day moving average for more than 30 days, the S&P 500 had nearly been able to overtake its widely-watched long-term average. Without being able to rise above its average, sellers stepped back in and slapped the index for a 2% loss on Tuesday. Of the 7 other times this happened, the S&P showed a negative return either 1 or 2 months later each time (the dates were 1941-04-08, 1988-04-14, 2000-11-10, 2008-06-06, 2009-05-11, and 2011-10-25). There were 17 times it was rejected by 1.5% or more, leading to rebounds only 25% of the time over the next 2 months. There were 48 times it was rejected by 1% or more, with rebounds 2 months later only 30% of the time. This isn't a great sign for bulls here.
|
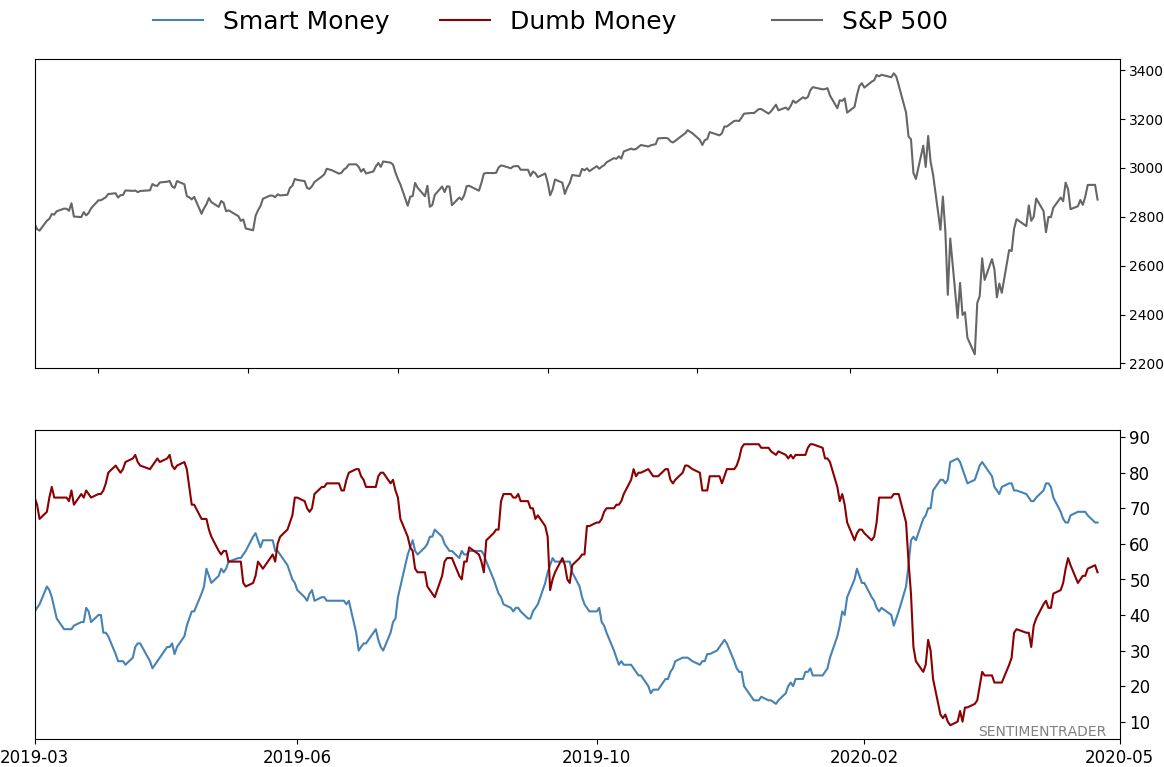
Smart / Dumb Money Confidence
|
Smart Money Confidence: 66%
Dumb Money Confidence: 52%
|
|
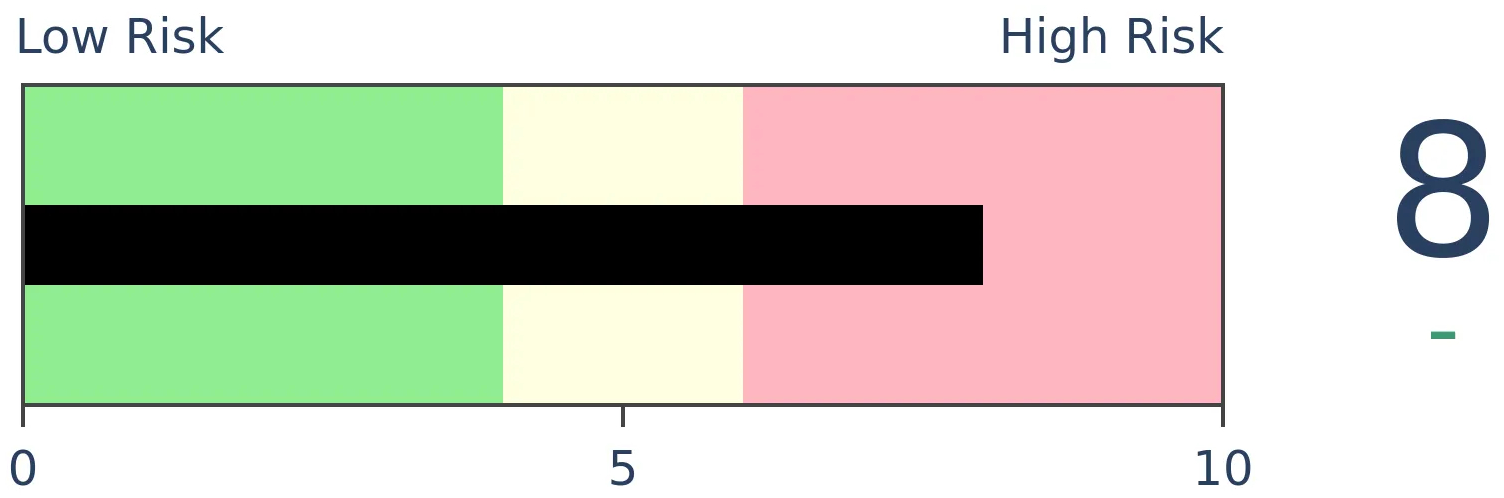
Risk Levels
Stocks Short-Term
|
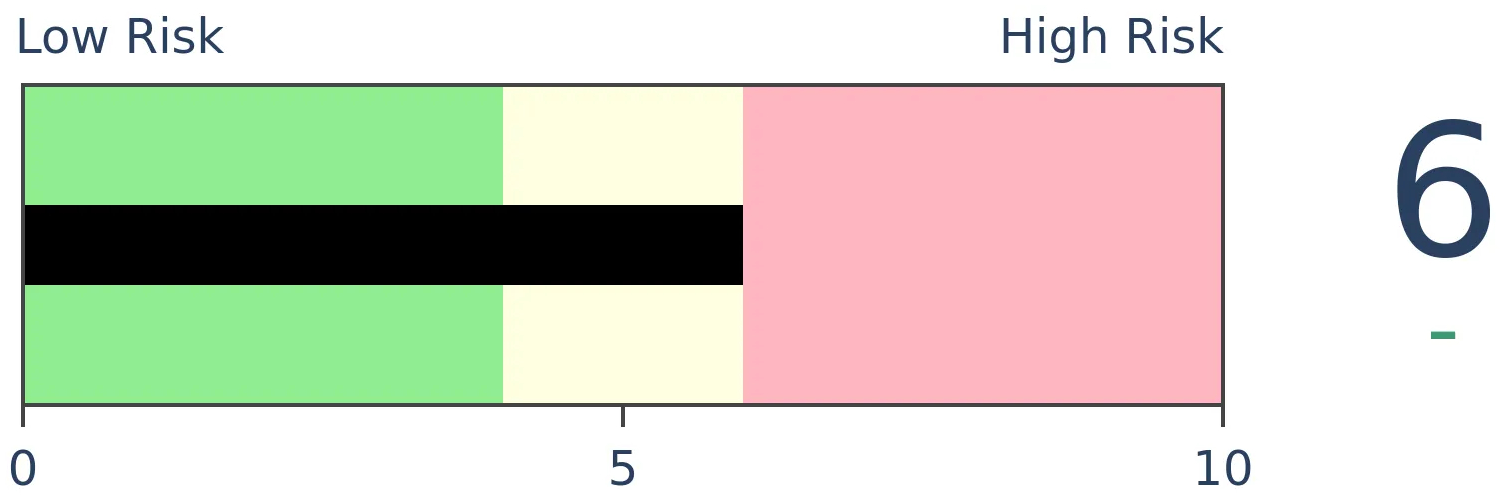
Stocks Medium-Term

|
|
Bonds
|
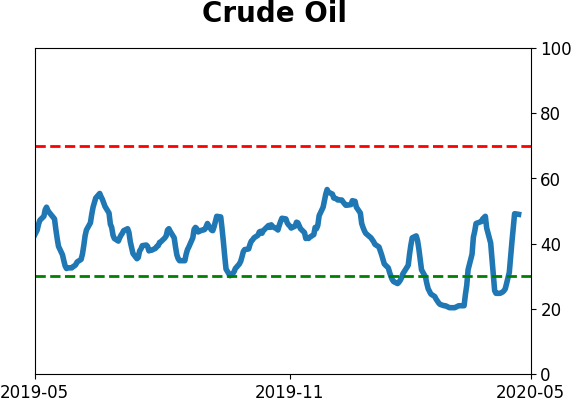
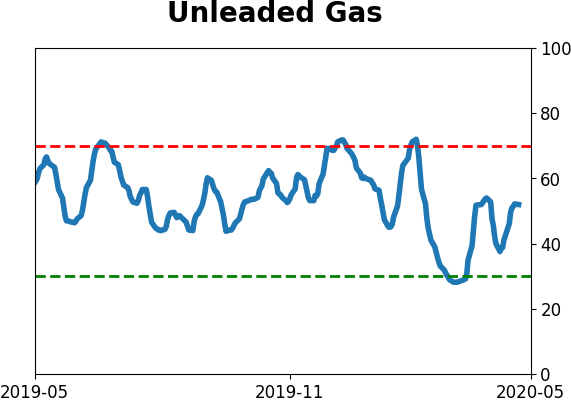
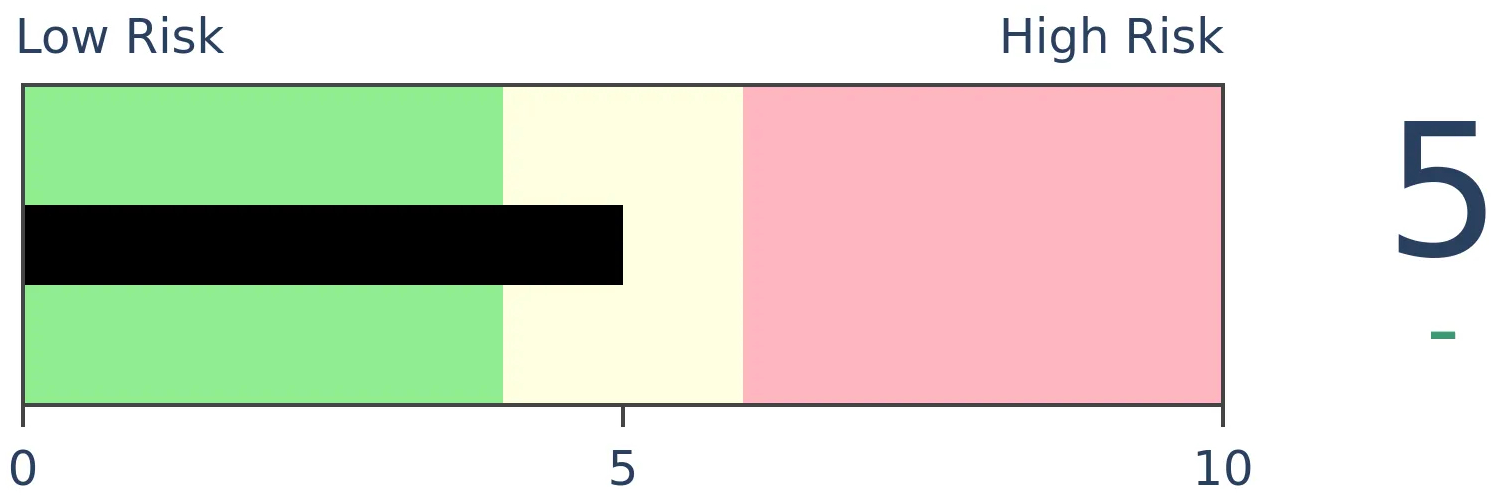
Crude Oil
|
|
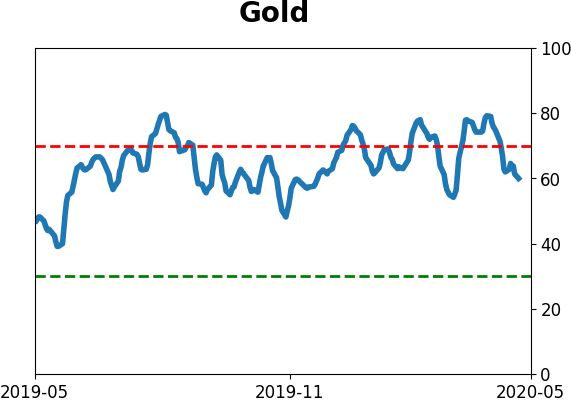
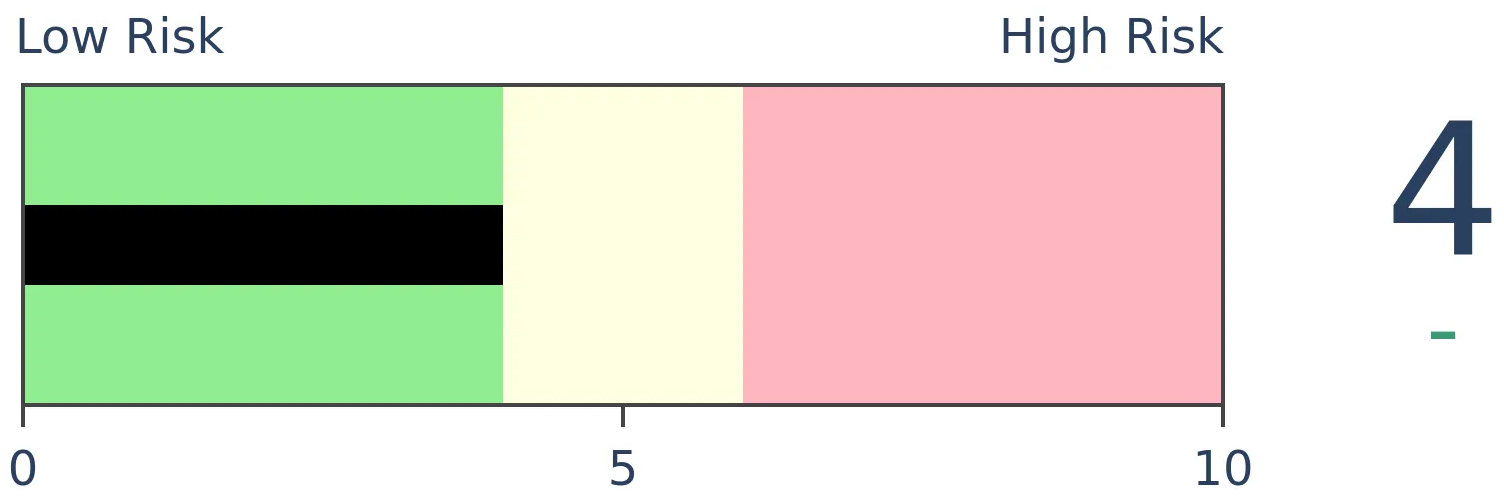
Gold

|
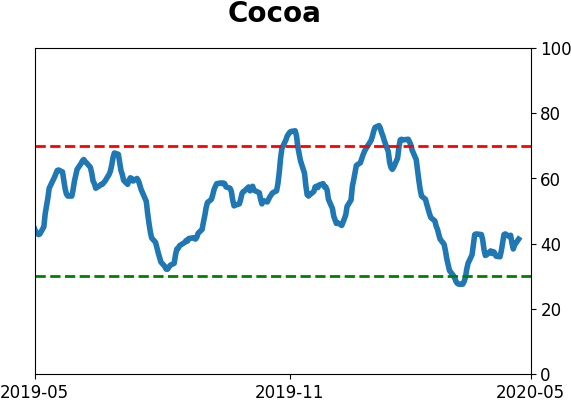
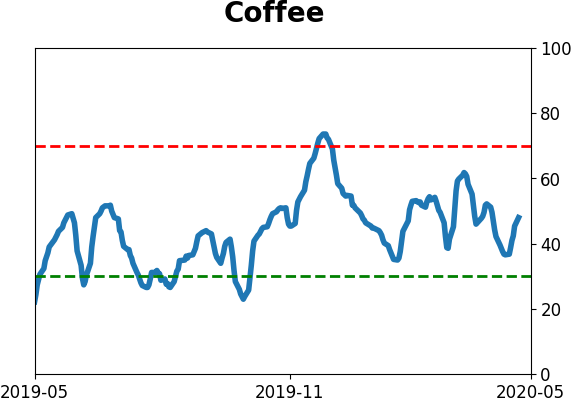
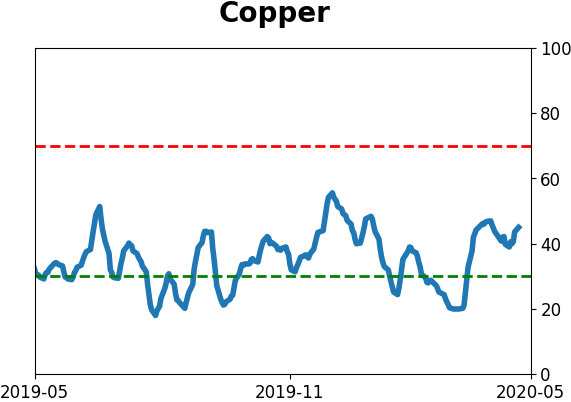
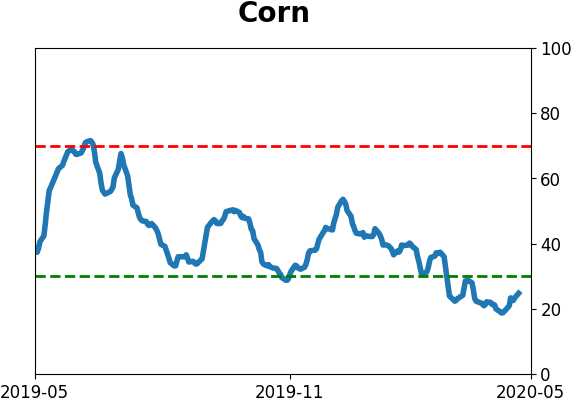
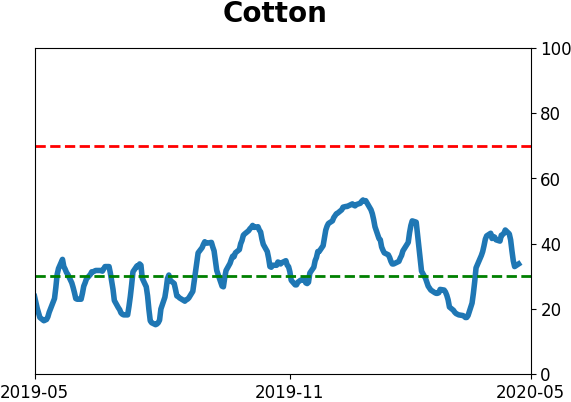
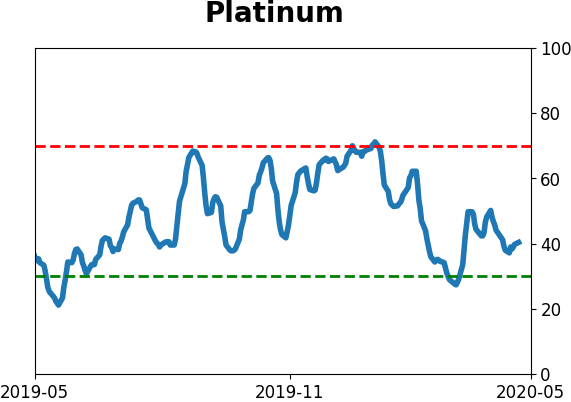
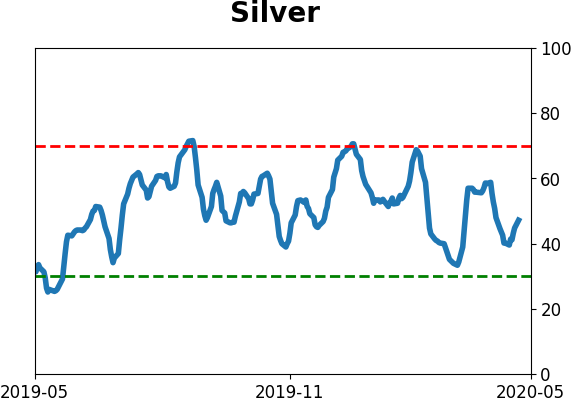
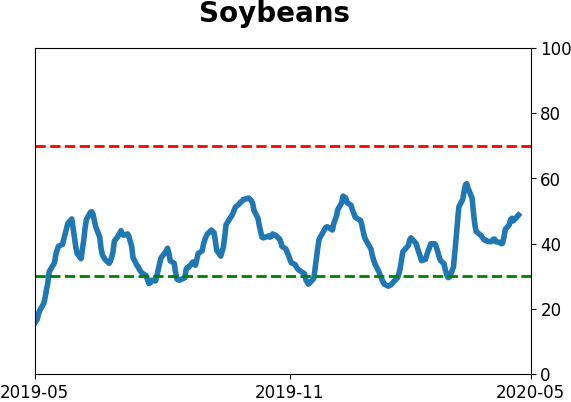
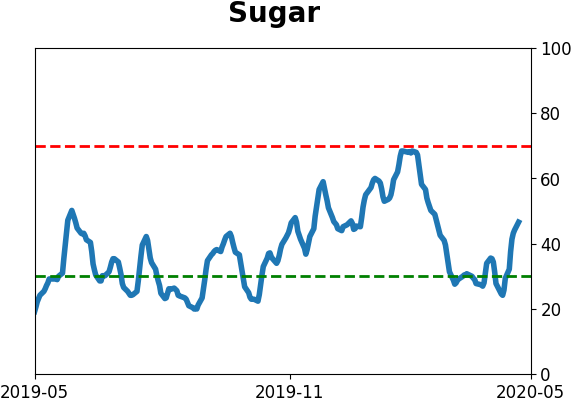
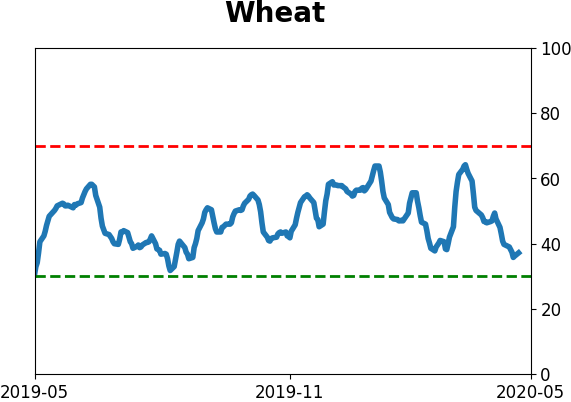
Agriculture
|
|
Research
BOTTOM LINE
A survey from the New York Fed shows high optimism about stocks among consumers. But that optimism isn't so evenly distributed. Ironically, the time to worry is when those with high incomes, high education, and high numeracy become the most optimistic compared to those without those qualities, and so far they're holding back.
FORECAST / TIMEFRAME
None
|
The Federal Reserve Bank of New York (FRBNY) has been conducting an in-depth survey of consumers for about 7 years. One part of the survey asks for opinions about whether stocks will rise over the next year.
The latest data of about 1,300 consumers, out on Monday, showed an uptick in optimism, with the most-ever percentage of consumers expecting stocks to rise. Sounds troubling, so let's look.
The FRBNY isolates consumers' outlook about stocks over the next year by about a dozen demographic identifiers. The interesting thing is that when we look at each group's success at predicting the next year in stocks, the best-performing groups are the ones that should have the least knowledge. The worst-performing groups are the ones that should have the most.
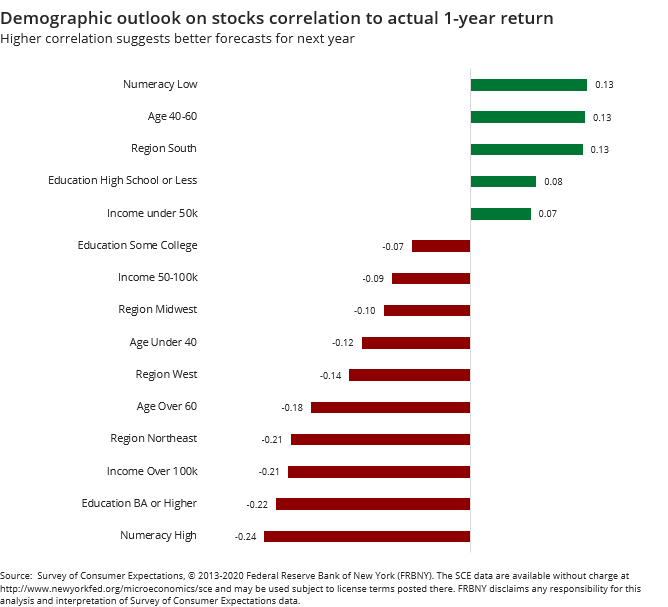
None of them were especially successful at being bulling or bearish at the right times. But among the few demographics that showed a positive correlation were those with low numeracy (the confidence and skill to use numbers to solve problems in everyday life), those with at most a high school education, and those with incomes under $50,000/year.
The demographics with the worst forecasting records were those with high numeracy, high education, and high incomes. Most of us would probably think it should be the exact opposite, but markets don't necessarily reward book smarts.
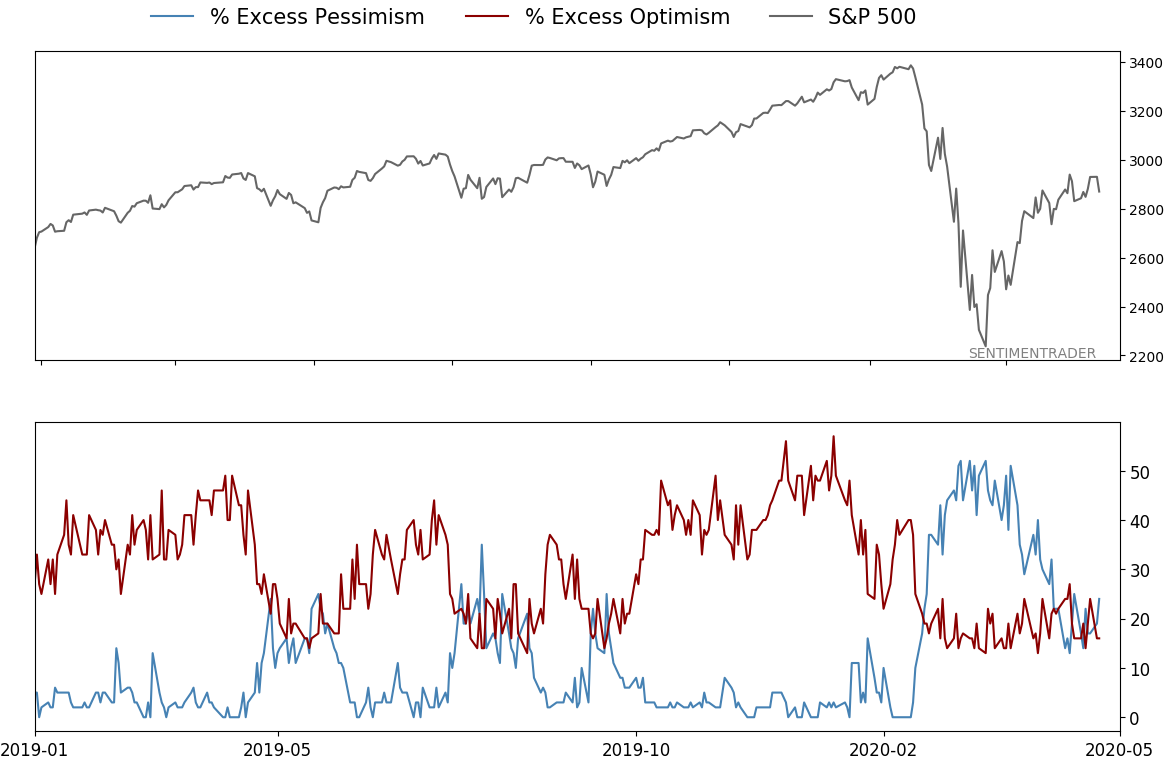
If we look at the current optimism among those with "book smarts", it's well off the highs compared to those with "street smarts."
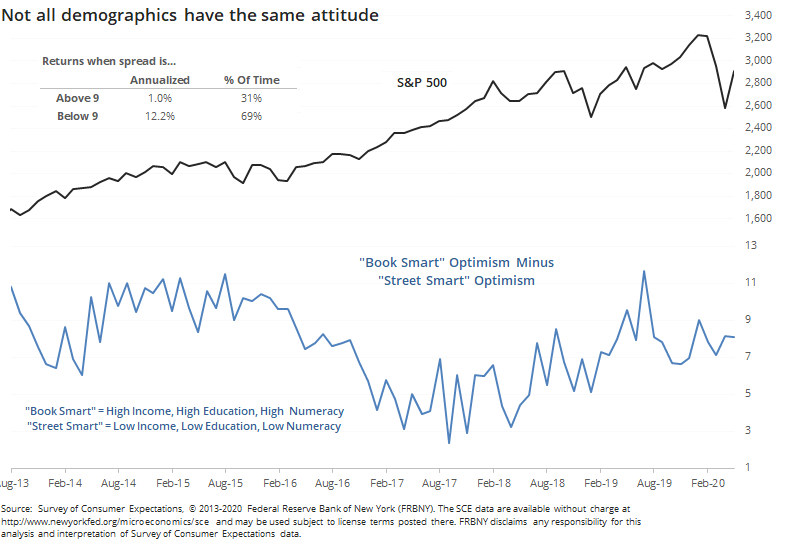
When the spread has been high over the past 7 years, meaning when those with high income, education, and numeracy were much more optimistic than those with low income, education, and numeracy, stocks actually tended to suffer. When the book smart group was relatively pessimistic, stocks did well, mainly in 2014 and 2017.
The annualized return when the spread was above 9 was only +1.0% versus +12.2% when the spread was below 9, which is where it is now.
It's not like there's a super-wide divergence between the two at the moment. One might think that given the disproportion share of job losses among the "street smart" group, they would be much more pessimistic than the "book smart" group, but that's not the case. And it's probably a good thing, too, since they've had a better record at predicting the market than their more educated peers.
We can see a similar pattern when "sophisticates" in the northeast are more optimistic than "bumpkins" from the Midwest. This is coming from a lifelong midwest resident, so I would be firmly in the bumpkin category.
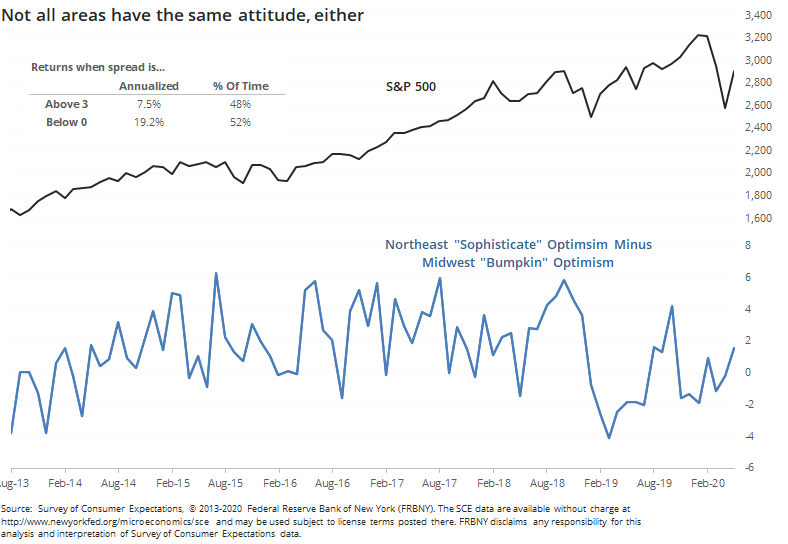
The spread between the two was about average for April, but it's interesting to note that when it's above 3, meaning those in the northeast are much more optimistic than midwesterners, the S&P's annualized return was much less than when those of us in flyover country were more positive.
There was even more of a stark divergence in north vs south optimism.
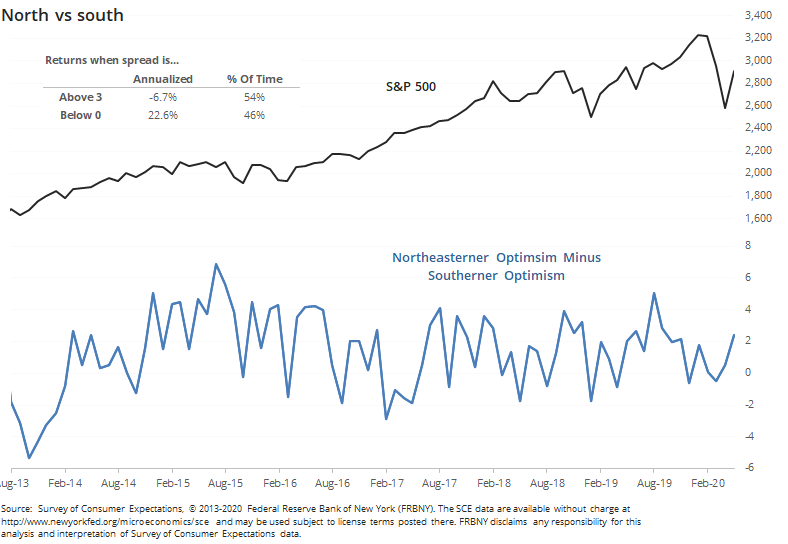
Whenever those in the northeast were more than 3 percentage points more optimistic than those in the south, the S&P's annualized return was a wretched -6.7%. When southerners were more optimistic, that shot up to +22.6%.
Highly developed cities, especially those with exchanges, see a kind of sociological agglomeration of services for finance types, likely helping to form a sense of groupthink and herd mentality. While there are developed cities and exchanges in the midwest and elsewhere, there is much less of a focus on finance and markets. For the past 7 years at least, that seems to be a good thing. Consumers without that focus have had a better record at sensing the risks and opportunities in stocks than those more directly impacted by their movements.
As of now, that appears to be a slight positive. When the sophisticates and book smart folks become a lot more optimistic, then it will be more of a worry.
BOTTOM LINE
Over the past couple of weeks, options traders have shifted their focus from protective puts to speculative calls. While the indicators aren't yet showing excessive optimism, it's clear that most of the fear has worn off and sentiment is, at worst, apathetic, and it happened fast. During a bear market, that's enough to be a concern.
FORECAST / TIMEFRAME
None
|
One of the many measures of panic that triggered in March was the overwhelming preference for traders to reach for put options, hedging against the possibility of further losses.
At its peak in March, the 10-day average of the Equity-only Put/Call Ratio neared 1.0, meaning more volume in protective put options than speculative calls. That's one of the highest readings in the history of the data. It has since calmed down and moved well into neutral territory.
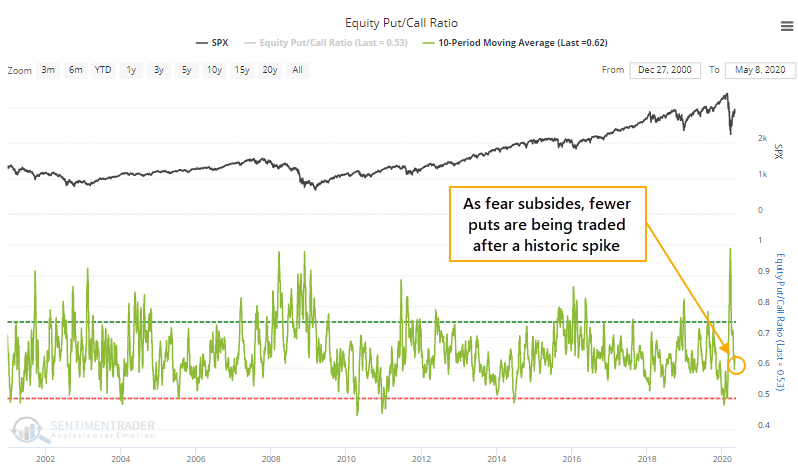
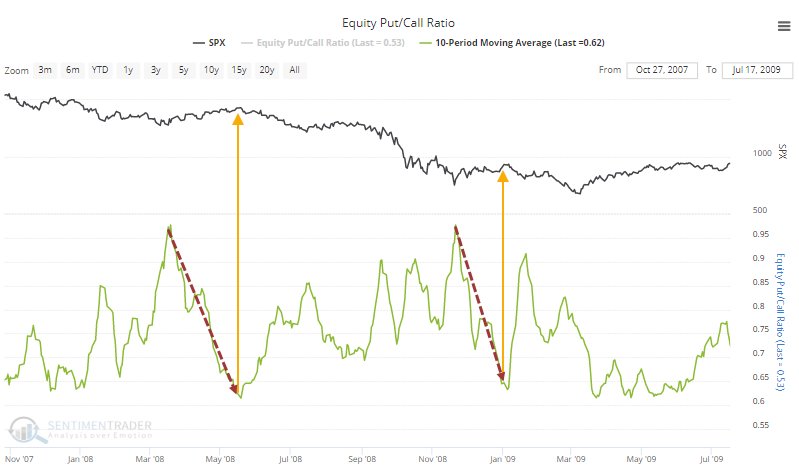
We've seen time and time again that during bear markets, neutral sentiment is about all that's required before sellers do their thing again. That's what happened in 2008, the only other time the 10-day ratio reached as high as it did this year. Both times, when the put/call ratio dropped to its current level, that was about it for the rally attempts.
What's also notable about the current behavior of options traders is that they're shifting sentiment quickly. It has taken barely a month for the 10-day average of the put/call ratio to drop this much.
Even if we're in a bull market, which is when these quick shifts in sentiment tend to occur, future returns were iffy.
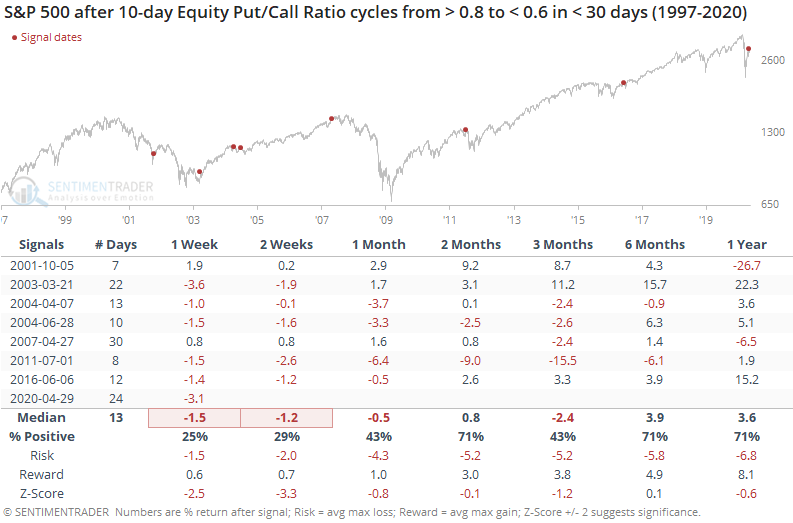
Other than March 2003, when stocks dropped quickly then recovered just as fast and showed sustained gains, most of the others saw weakness, or small or unsustained gains, in the months ahead.
Contrast that to times when it took longer for traders to ease back on their bearish sentiment.
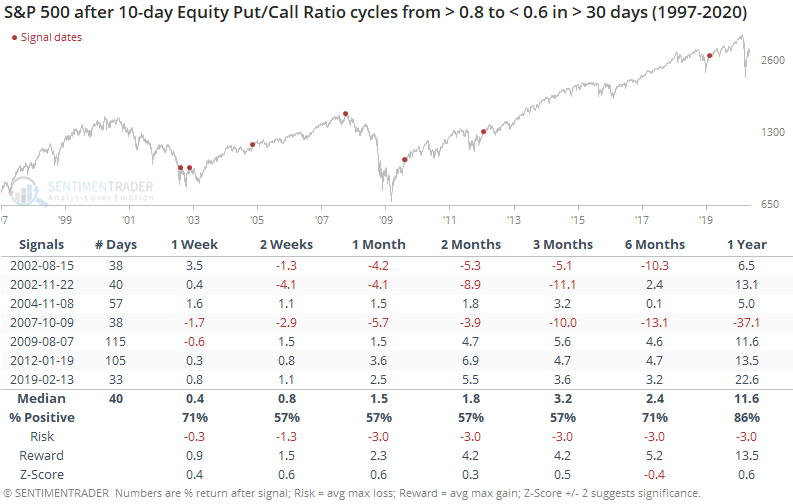
In these cases, returns were more likely to be positive over the short- to medium-term, and with a better risk/reward skew. There were still a couple of large losses, from the bottoming action in 2002 and the market peak in 2007, but overall it was a more positive bias than those times when the put/call ratio cycled quickly.
The ratio isn't yet showing an optimistic extreme. The troubling thing is that it has come down so quickly, though, especially since we're still mired in a downtrending market. It's a minor warning for the short- to medium-term, especially since overall speculation in options remains in the upper end of its range.
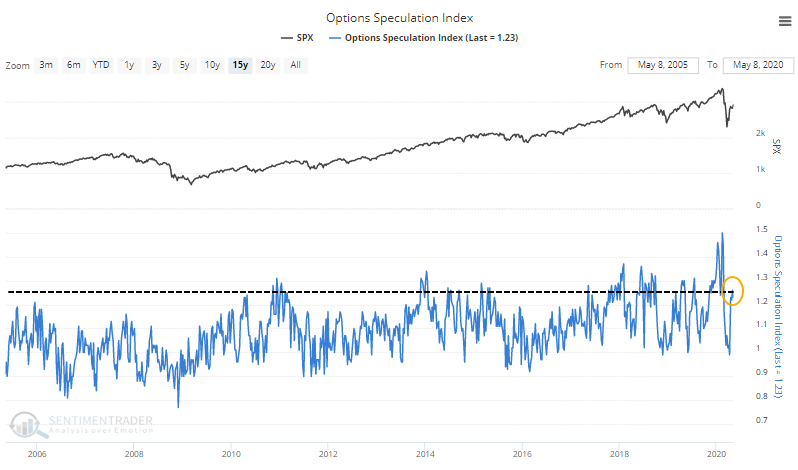
This is the highest the Options Speculation Index has ever been with the S&P 500 trading below its 50-week moving average, and while there has been a general trend higher in the data over the years, it's still higher than bulls would like to see.
Active Studies
| Time Frame | Bullish | Bearish | | Short-Term | 0 | 6 | | Medium-Term | 12 | 1 | | Long-Term | 37 | 3 |
|
Indicators at Extremes
Portfolio
| Position | Weight % | Added / Reduced | Date | | Stocks | 49.9 | Reduced 10.3% | 2020-04-23 | | Bonds | 0.0 | Reduced 6.7% | 2020-02-28 | | Commodities | 5.1 | Added 2.4%
| 2020-02-28 | | Precious Metals | 0.0 | Reduced 3.6% | 2020-02-28 | | Special Situations | 0.0 | Reduced 31.9% | 2020-03-17 | | Cash | 45.0 | | |
|
Updates (Changes made today are underlined)
In the first months of the year, we saw manic trading activity. From big jumps in specific stocks to historic highs in retail trading activity to record highs in household confidence to almost unbelievable confidence among options traders. All of that came amid a market where the average stock couldn't keep up with their indexes. There were signs of waning momentum in stocks underlying the major averages, which started triggering technical warning signs in late January. The kinds of extremes we saw in December and January typically take months to wear away, but the type of selling in March went a long way toward getting there. When we place the kind of moves we saw into March 23 into the context of coming off an all-time high, there has been a high probability of a multi-month rebound. After stocks bottomed on the 23rd, they enjoyed a historic buying thrust and retraced a larger amount of the decline than "just a bear market rally" tends to. While other signs are mixed that panic is subsiding, those thrusts are the most encouraging sign we've seen in years. Shorter-term, there have been some warning signs popping up and our studies have stopped showing as positively skewed returns. I reduced my exposure some in late April and will consider further reducing it if we start to see some lower highs and lower lows. Long-term suggestions from the studies remain robust, but shorter-term ones are significantly less so, and stocks still have to prove that we're in something other than a protracted, recessionary bear market.
RETURN YTD: -9.5% 2019: 12.6%, 2018: 0.6%, 2017: 3.8%, 2016: 17.1%, 2015: 9.2%, 2014: 14.5%, 2013: 2.2%, 2012: 10.8%, 2011: 16.5%, 2010: 15.3%, 2009: 23.9%, 2008: 16.2%, 2007: 7.8%
|
|
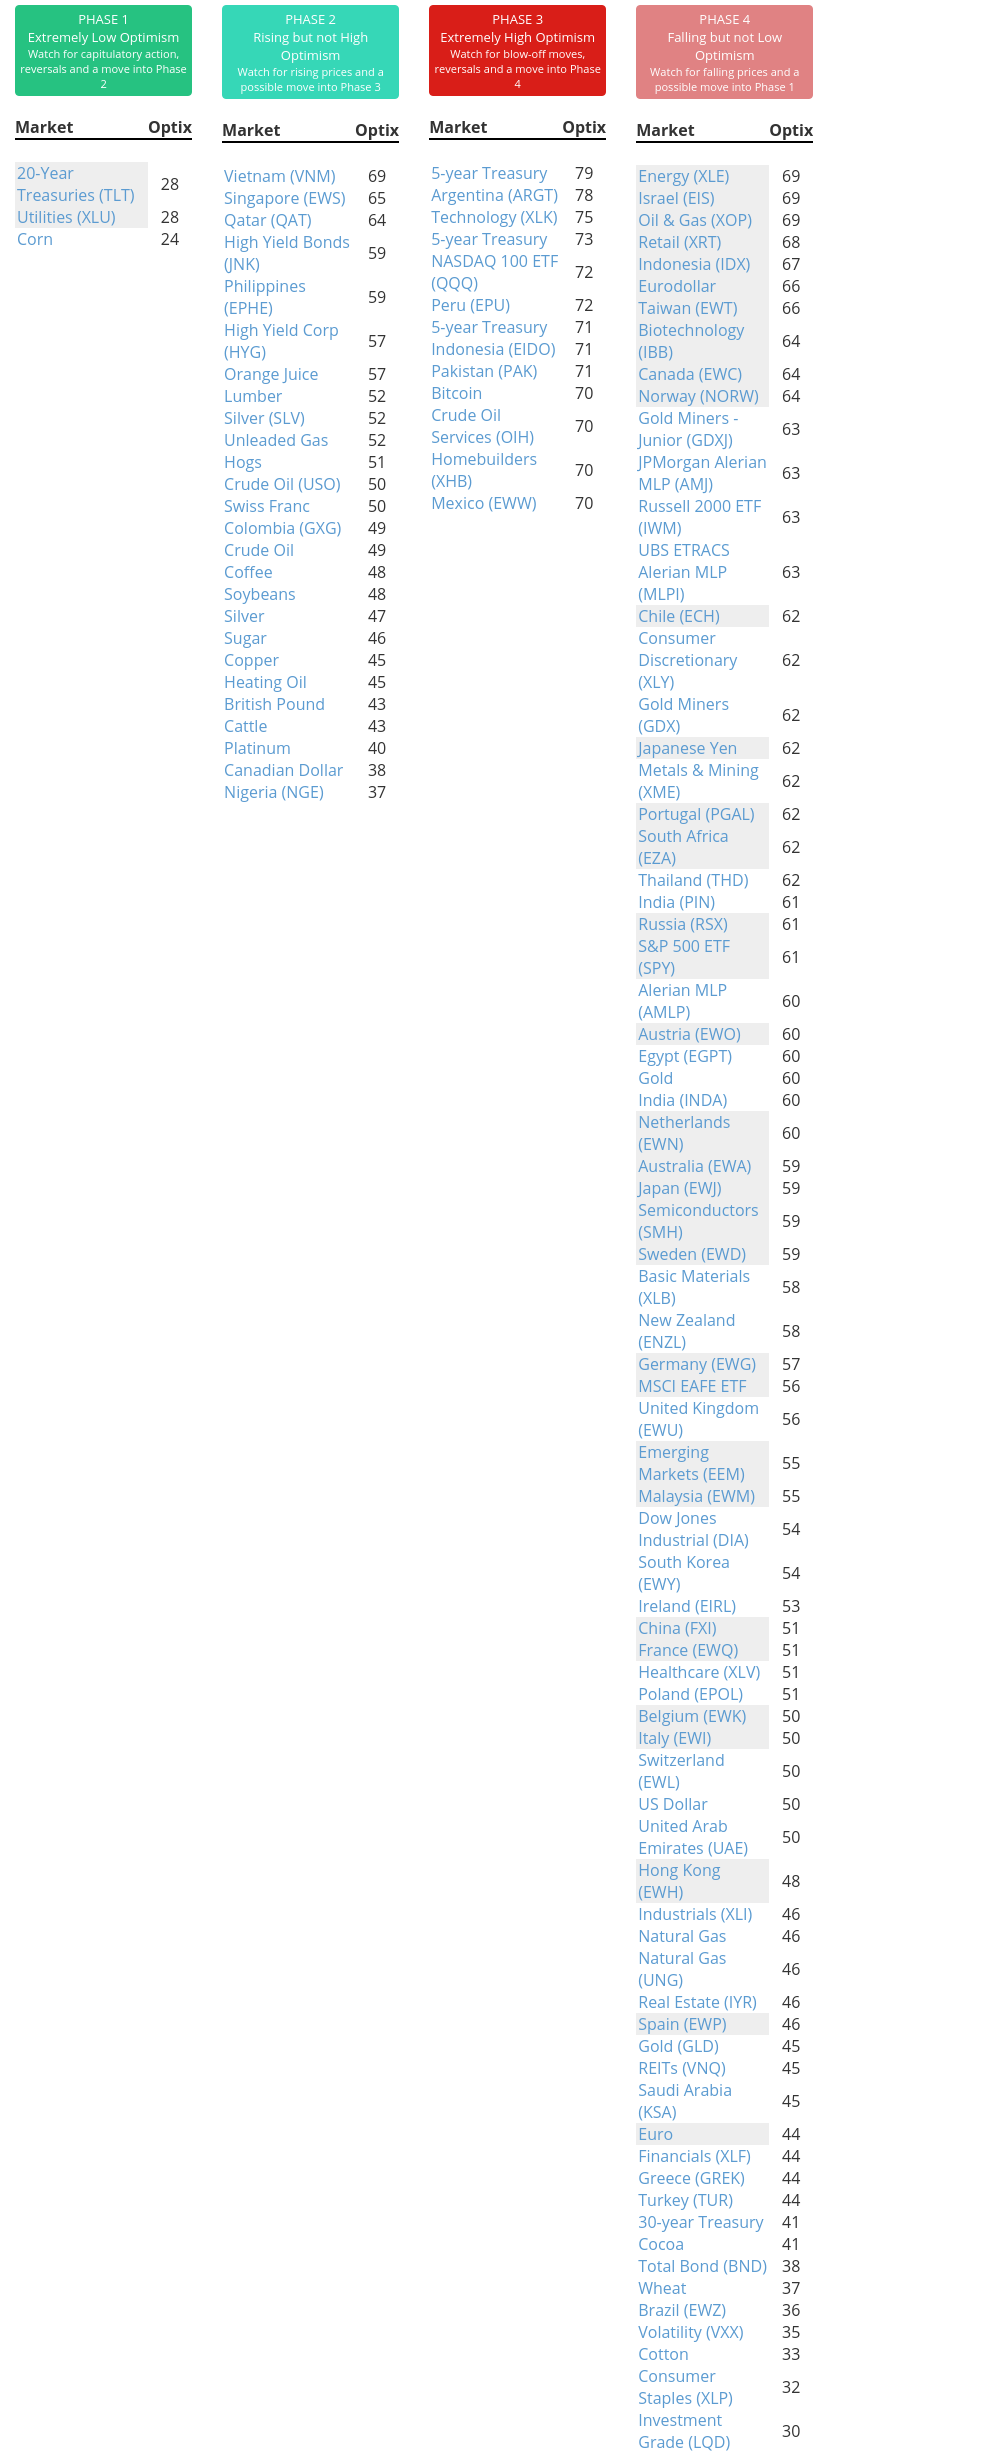
Phase Table
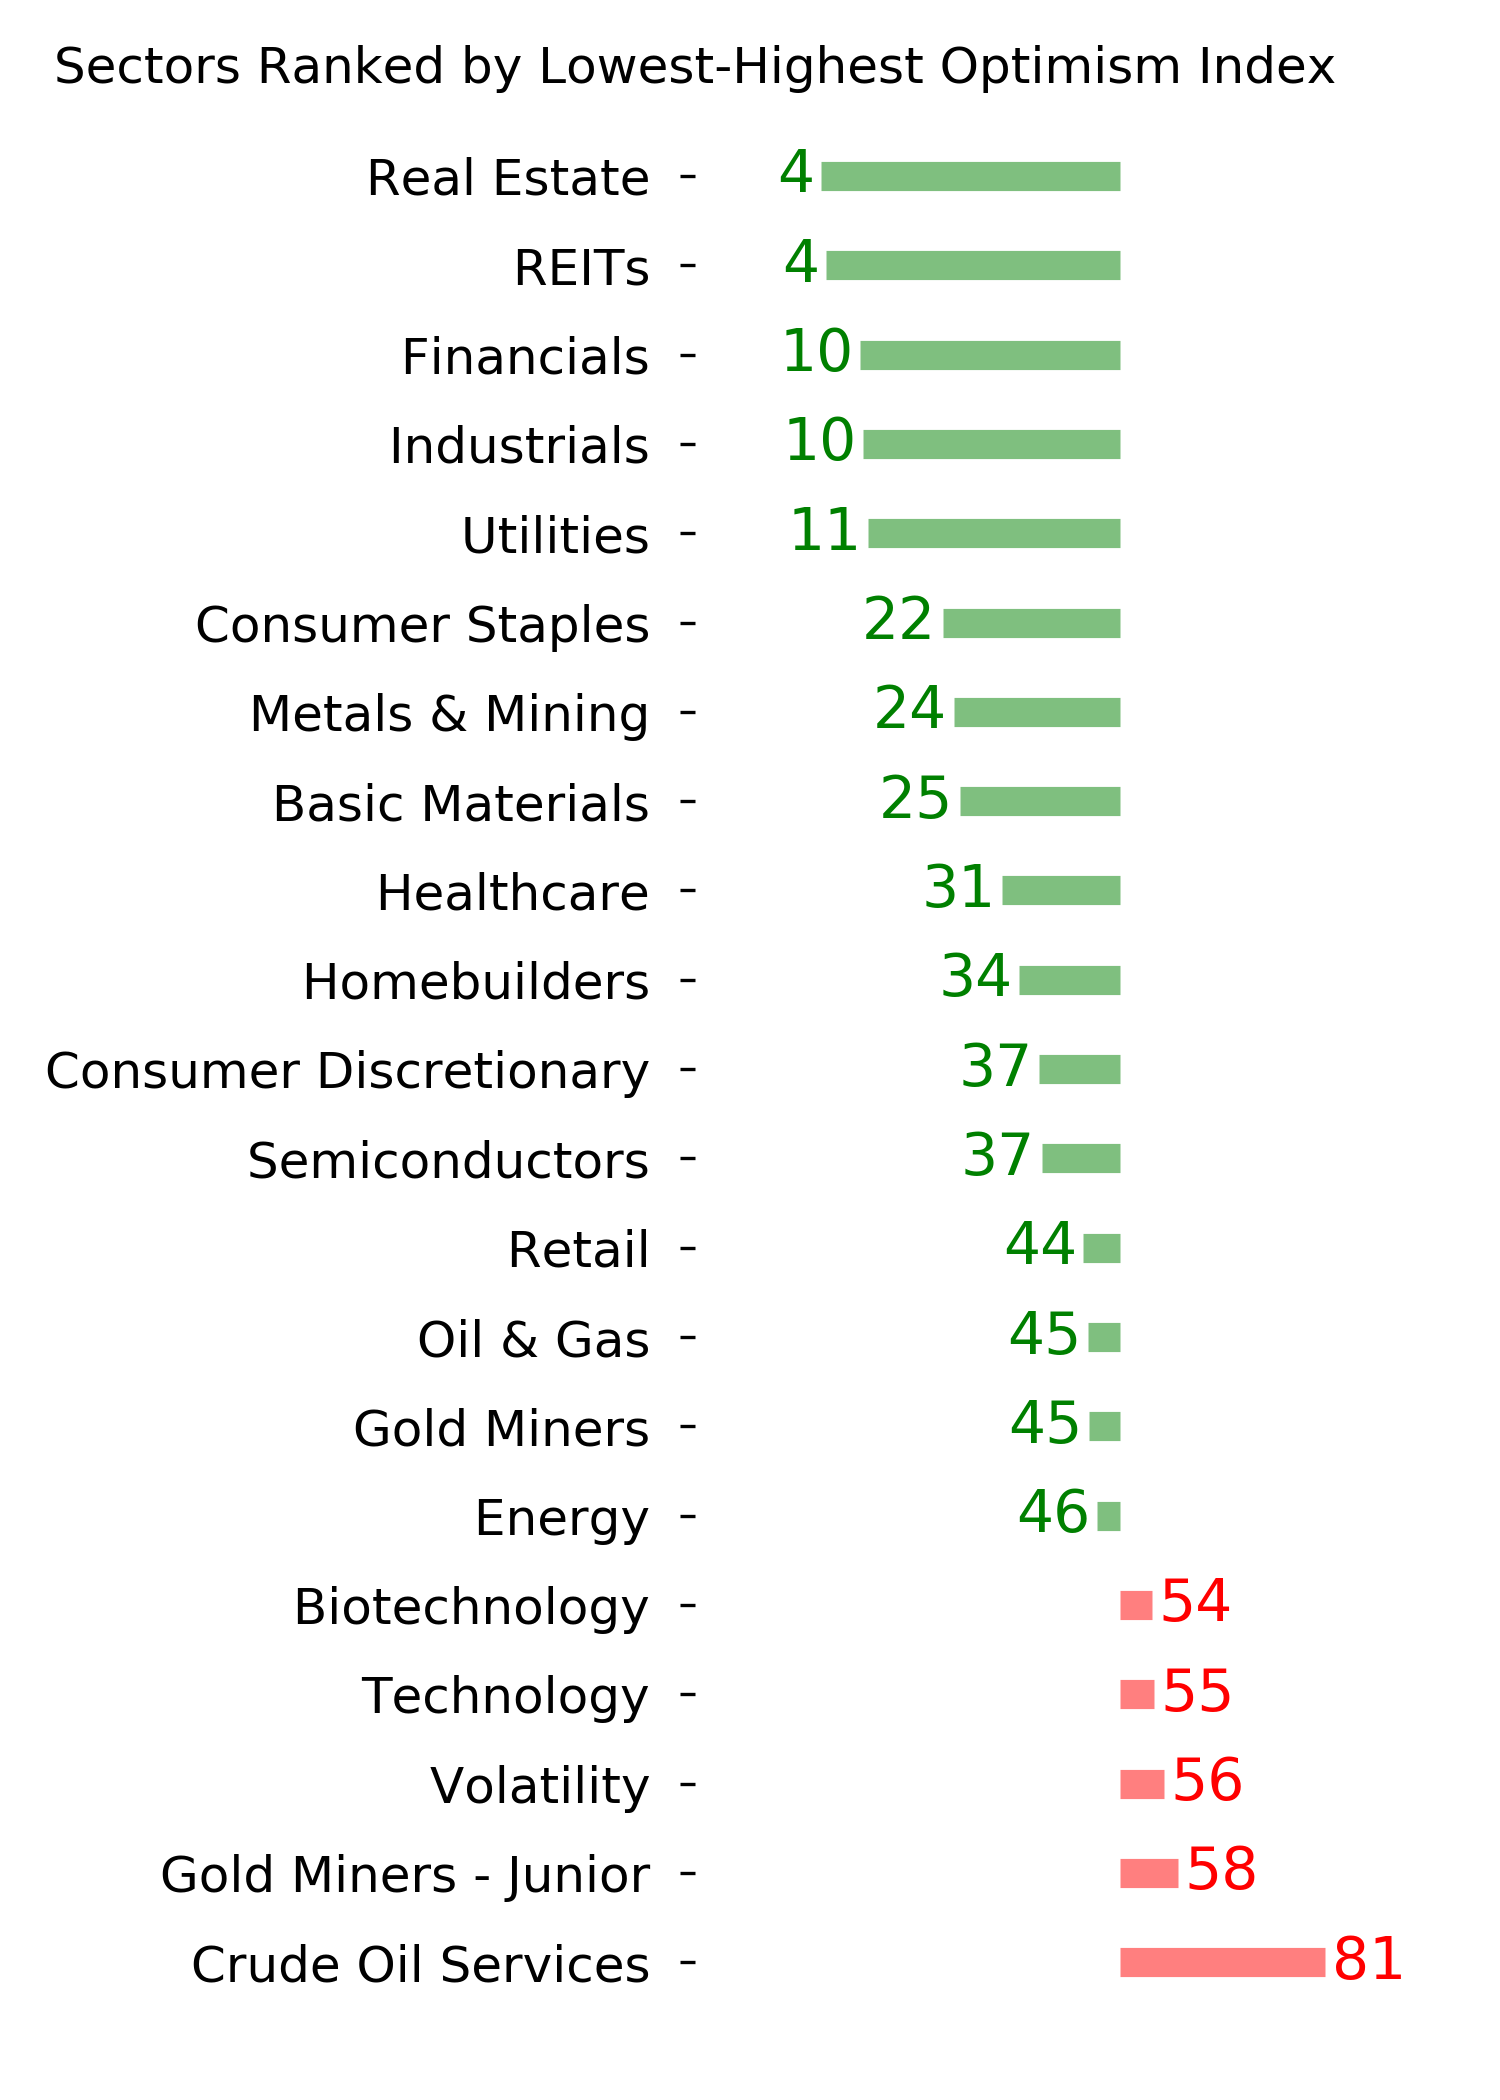
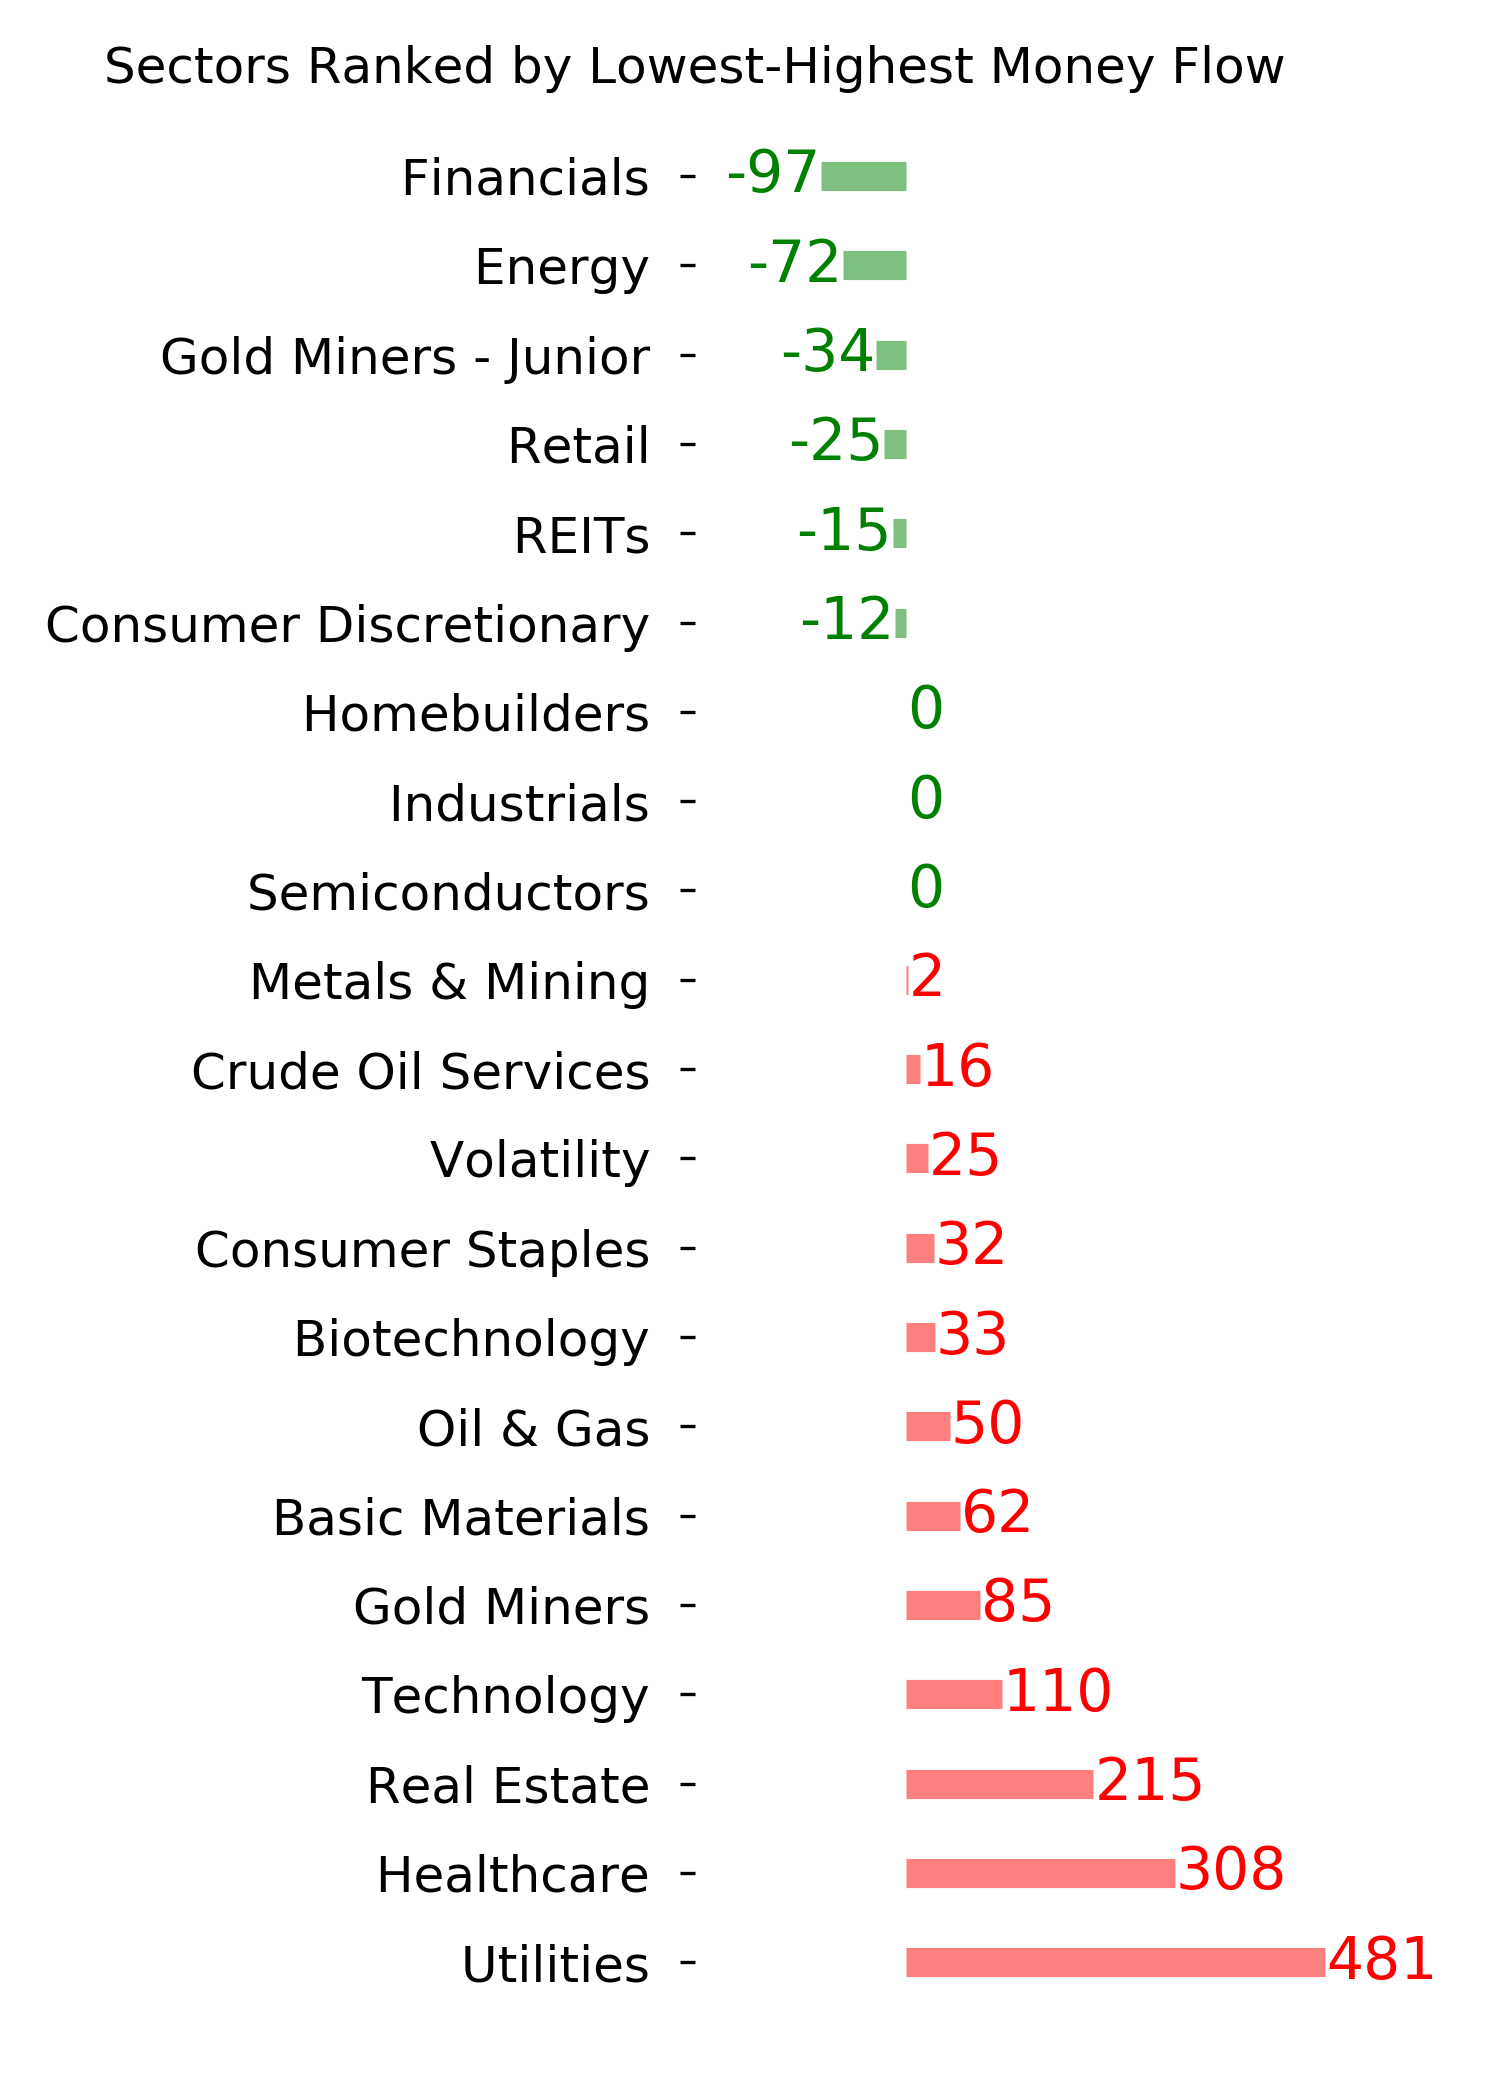
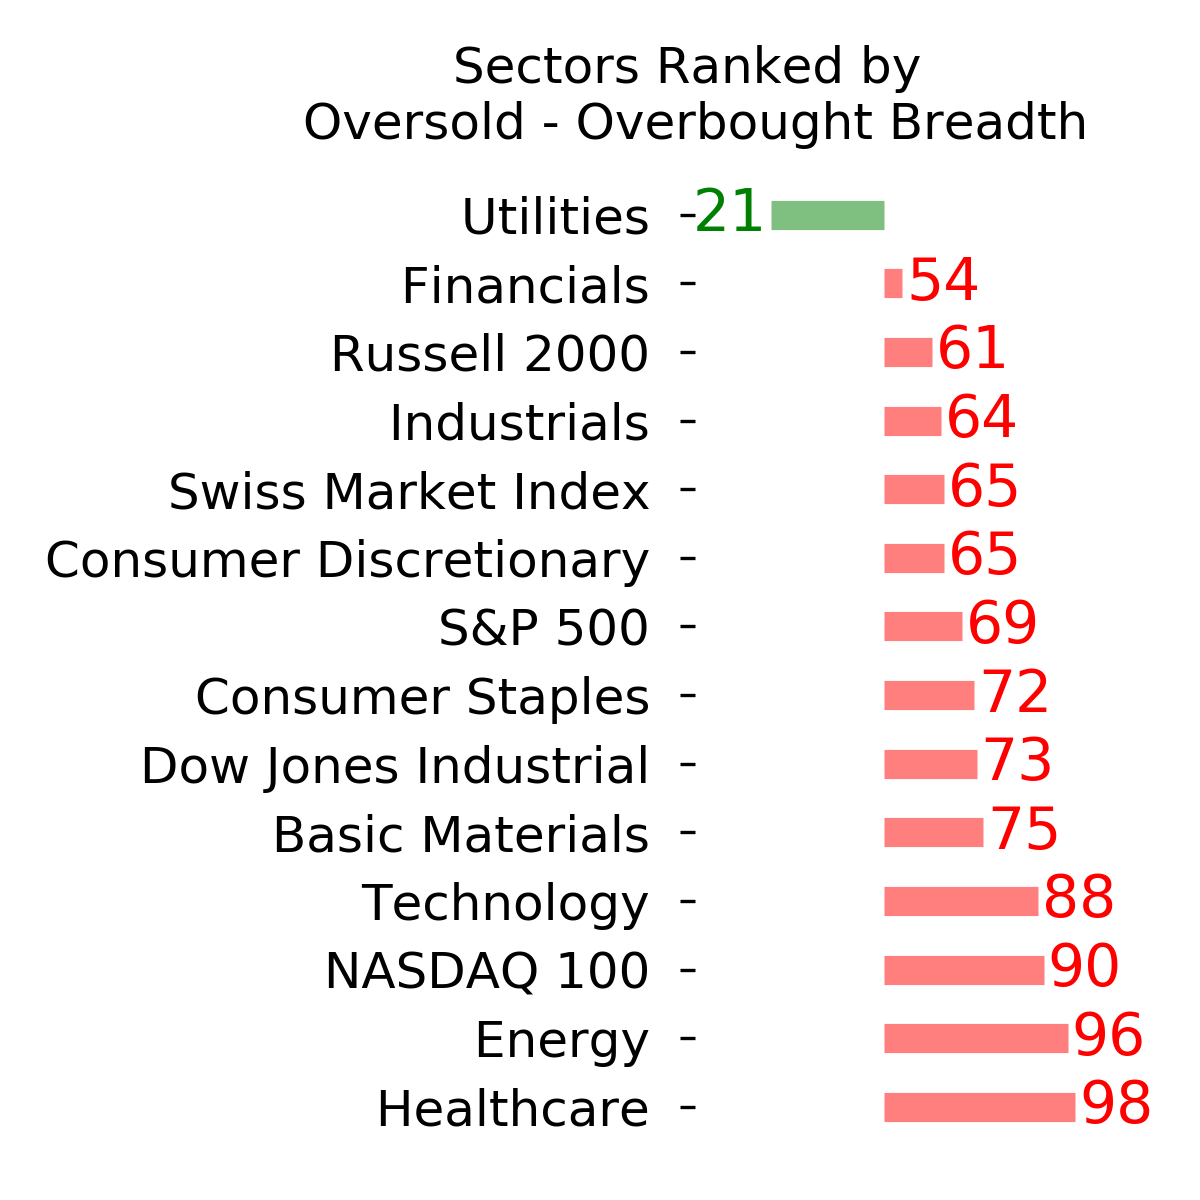
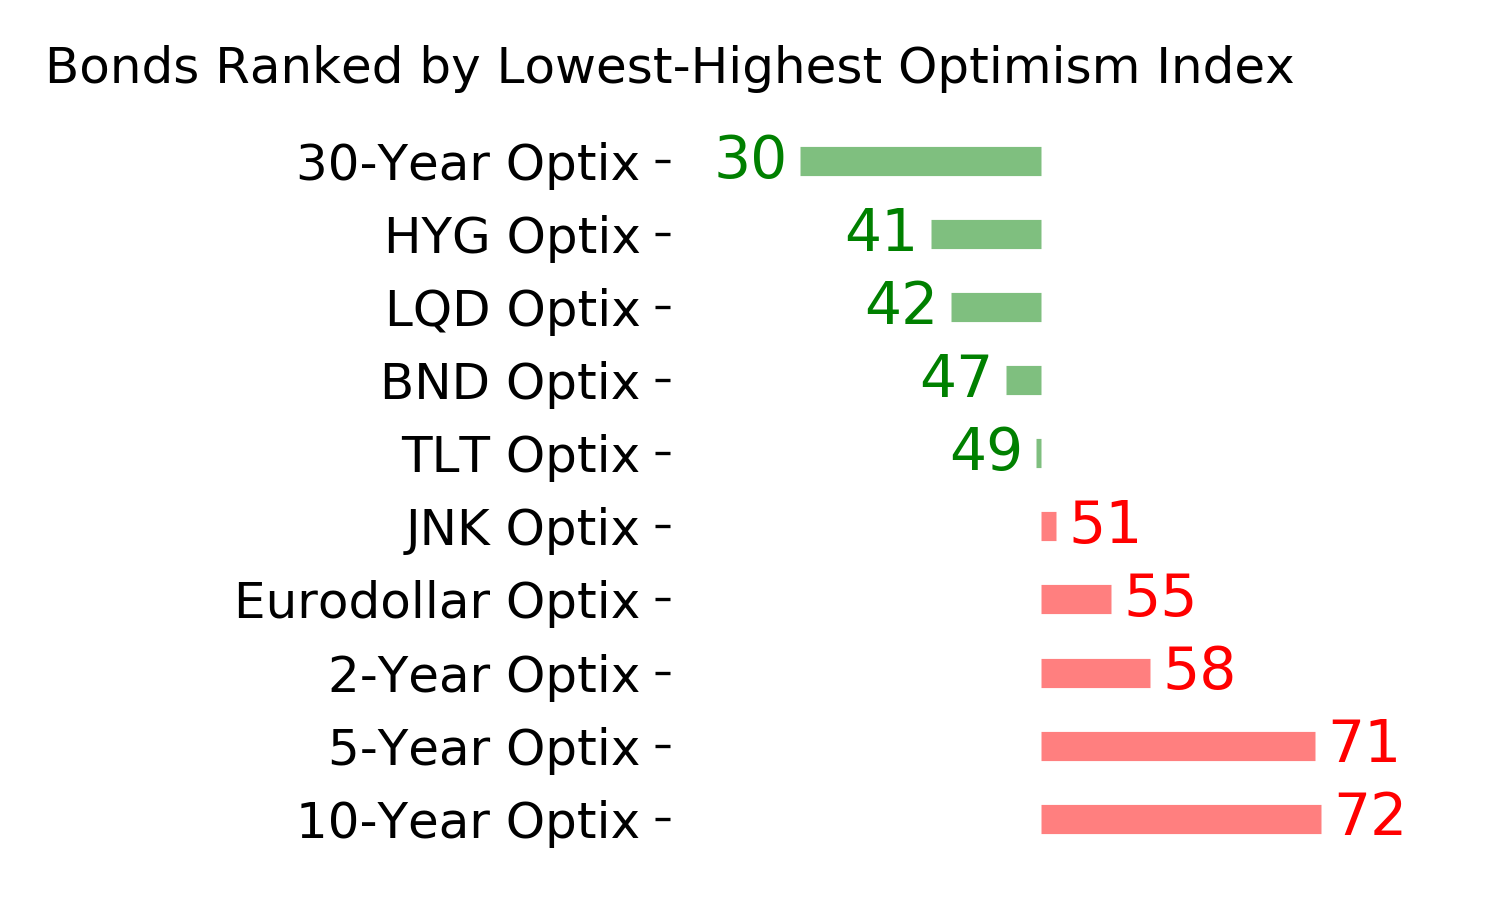
Ranks
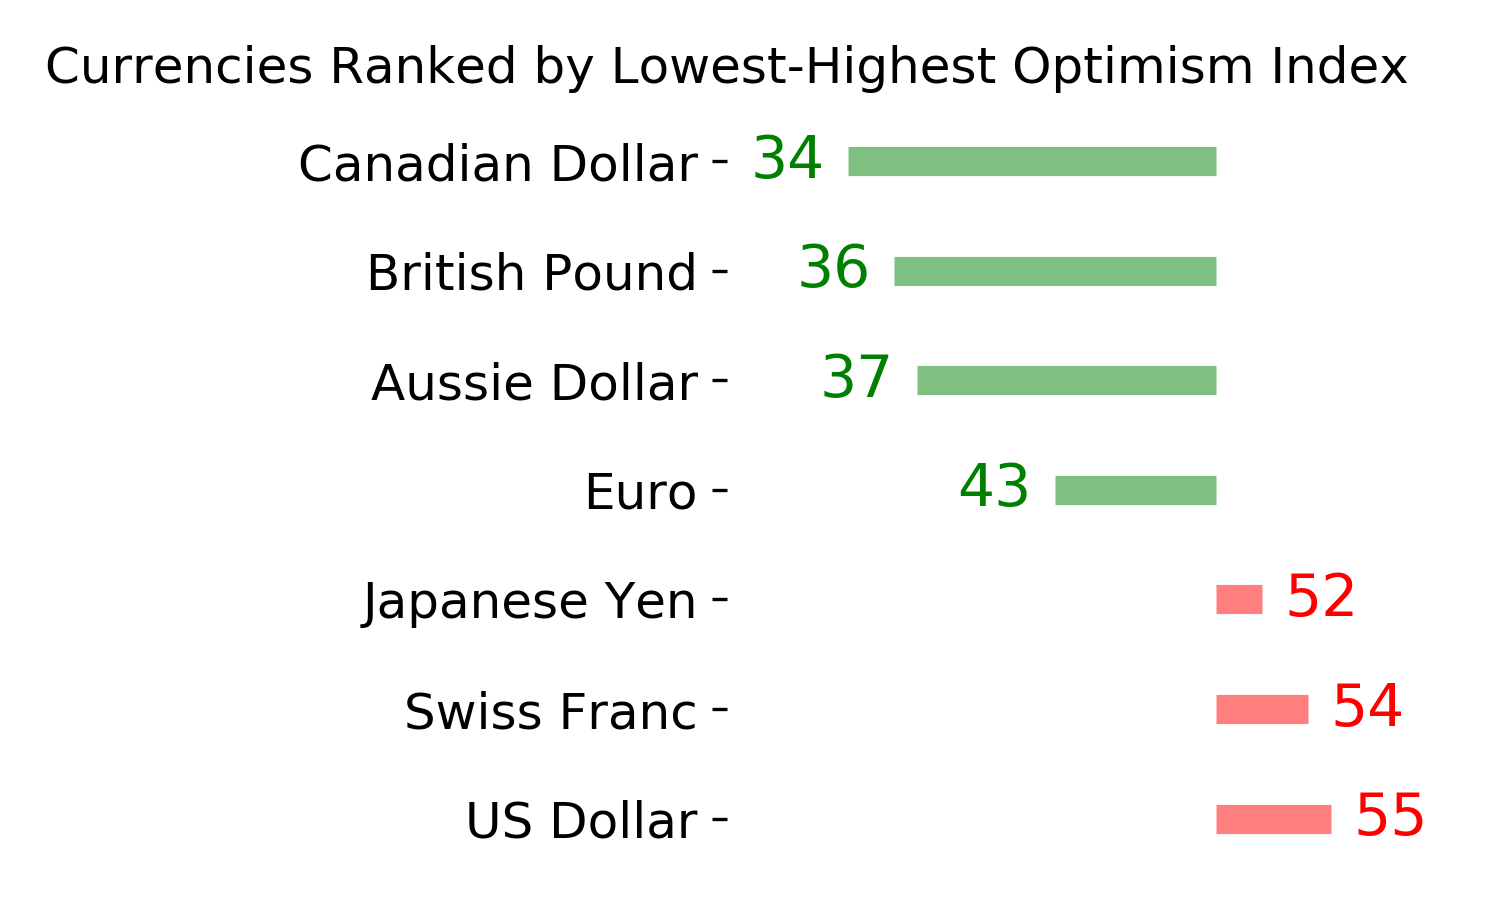
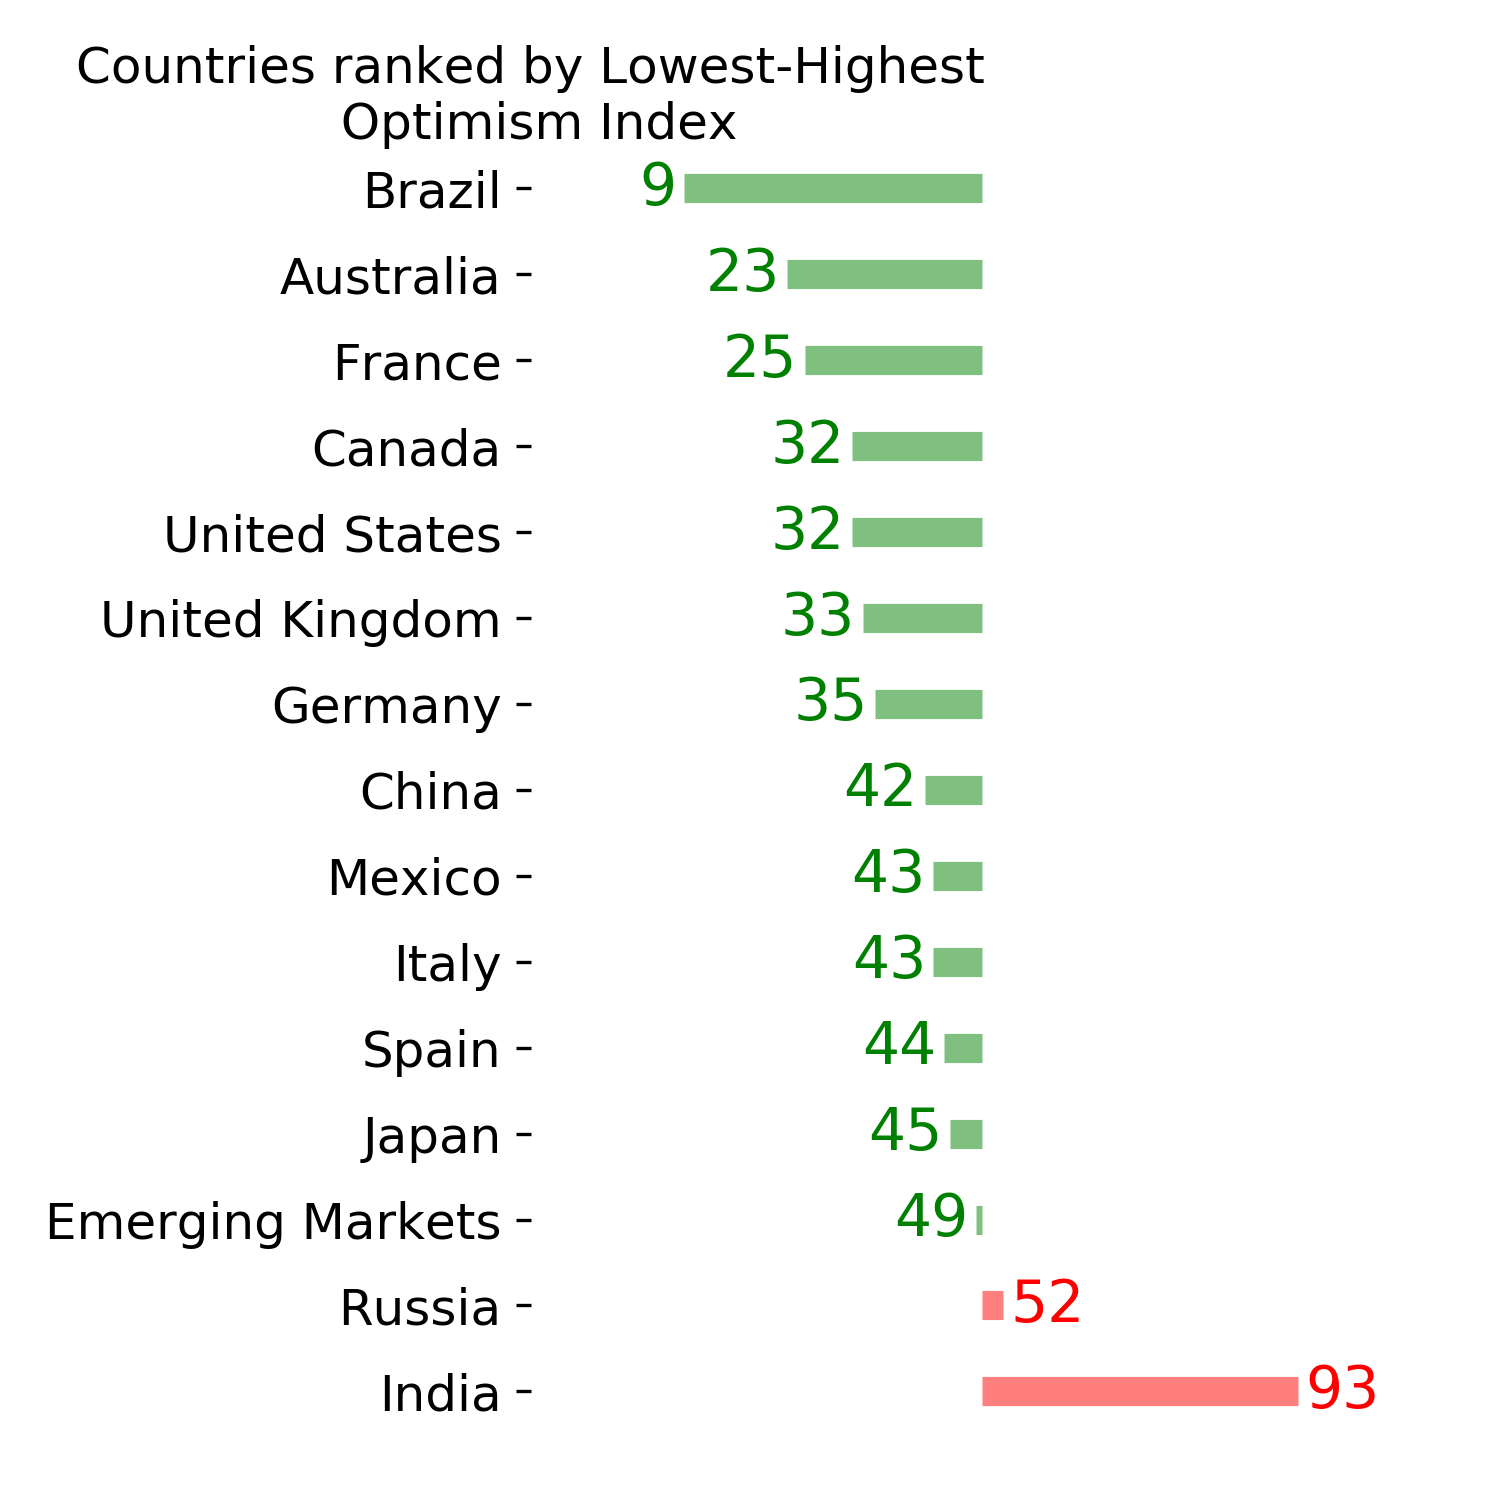
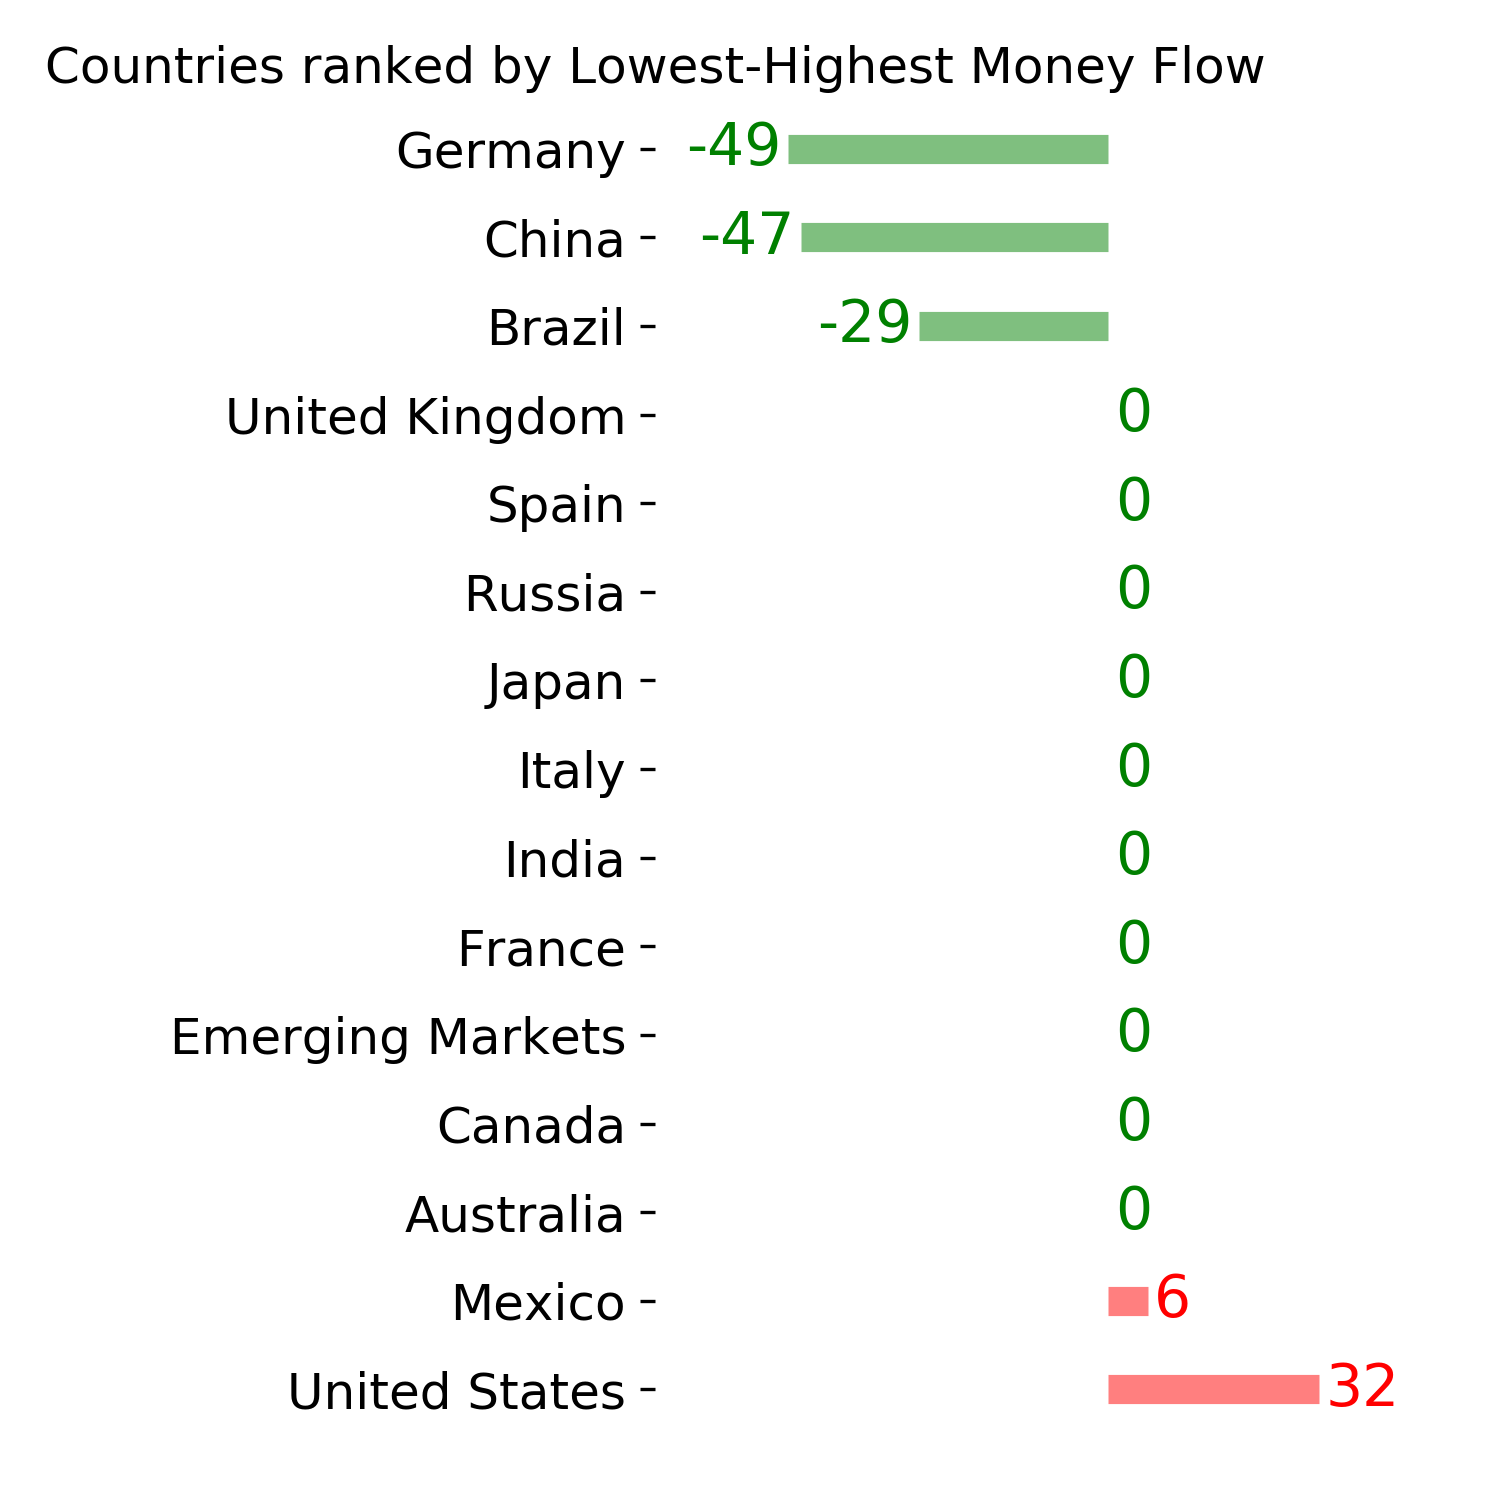
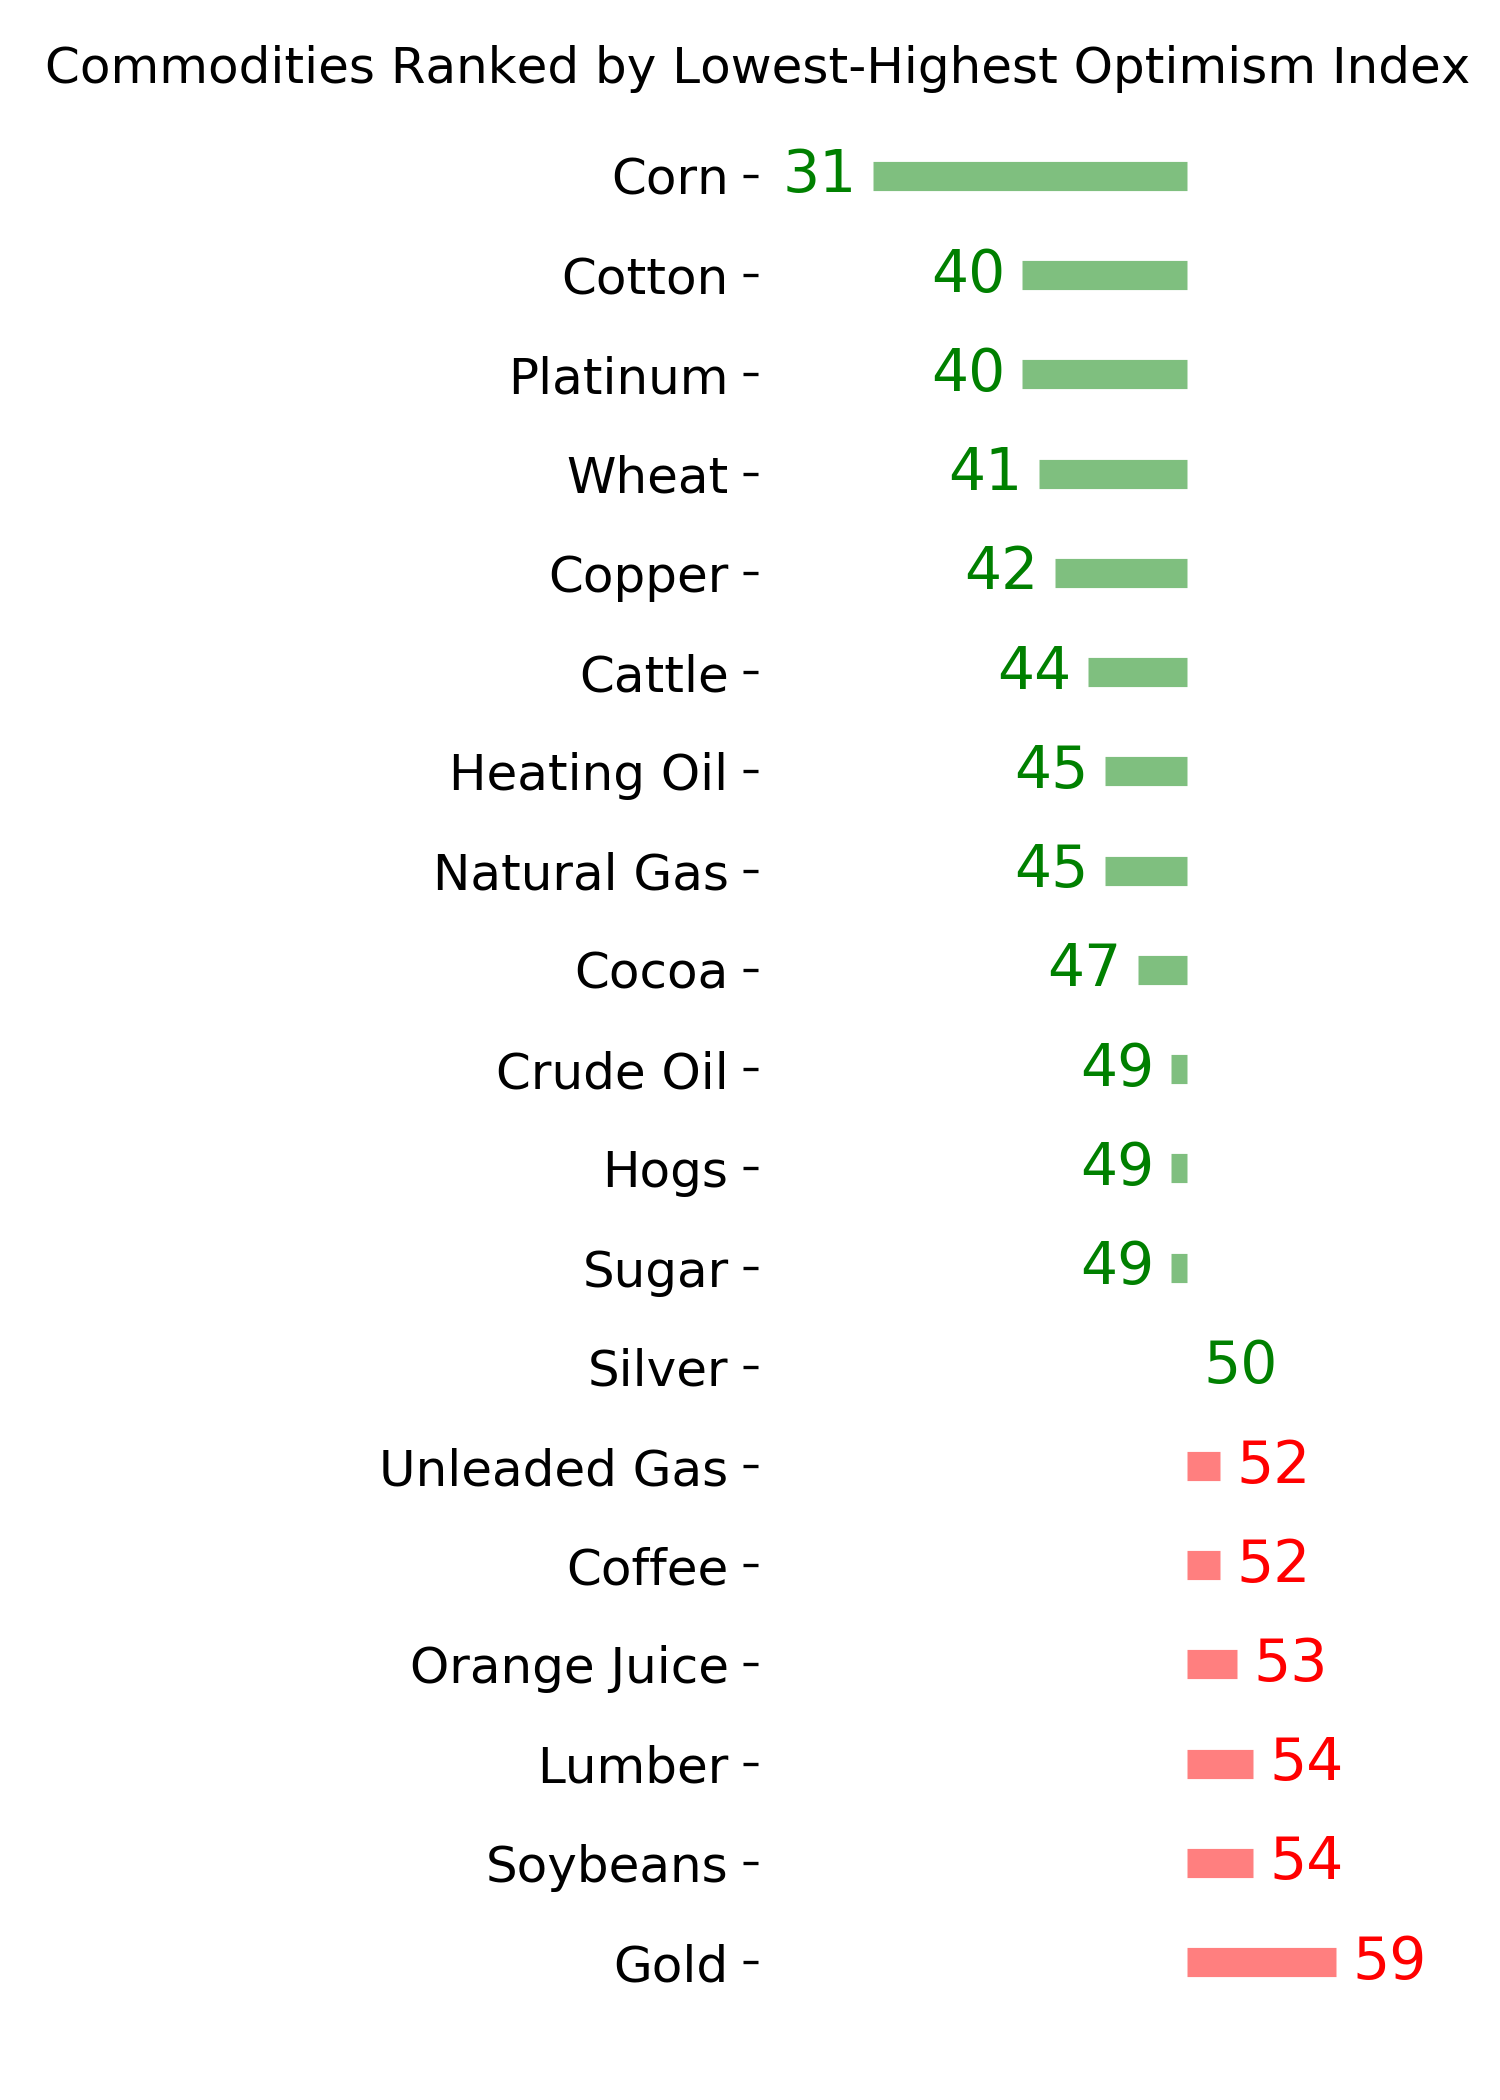
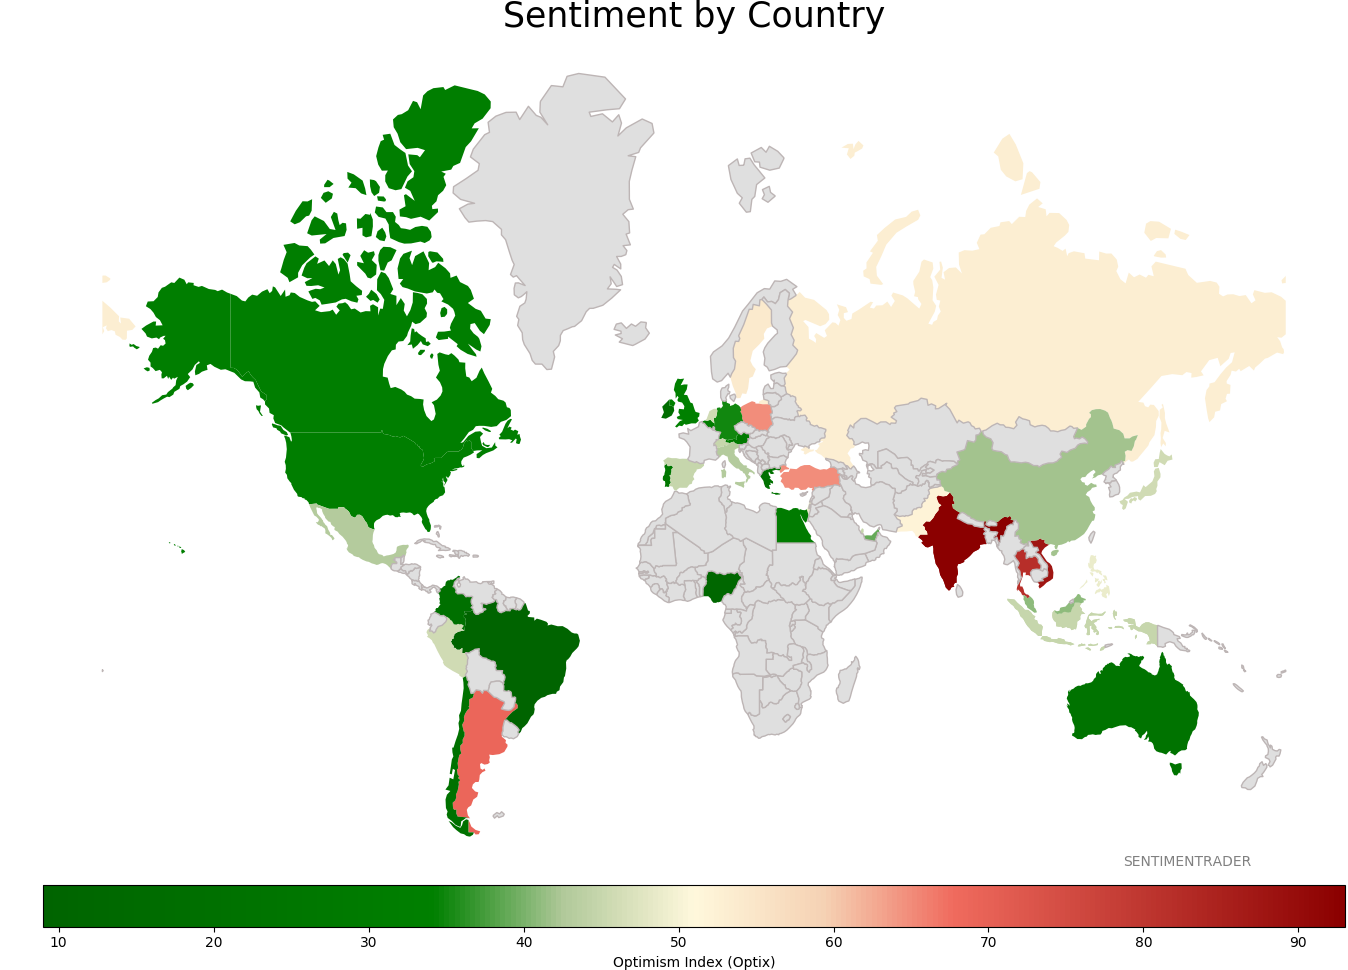
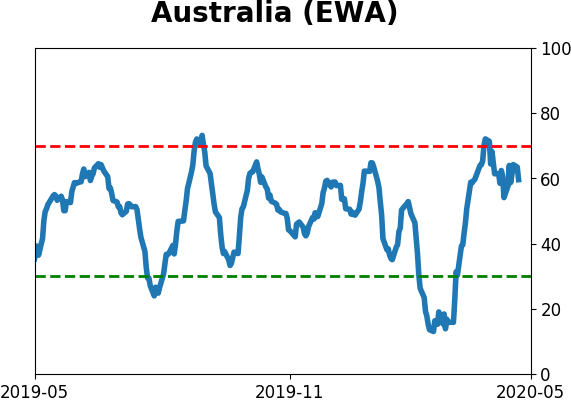
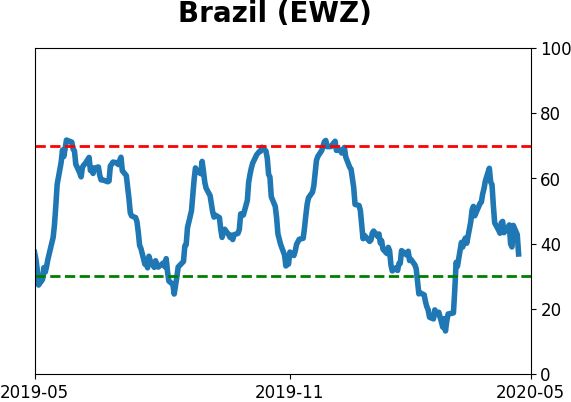
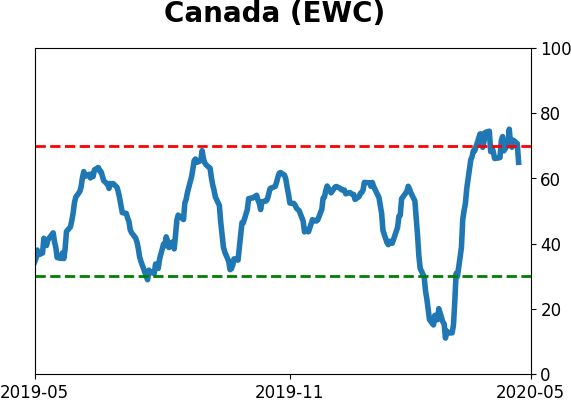
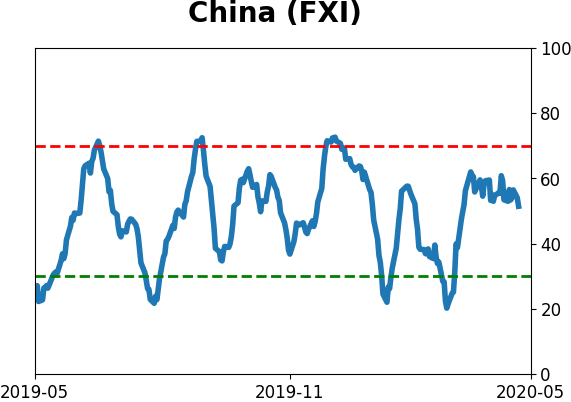
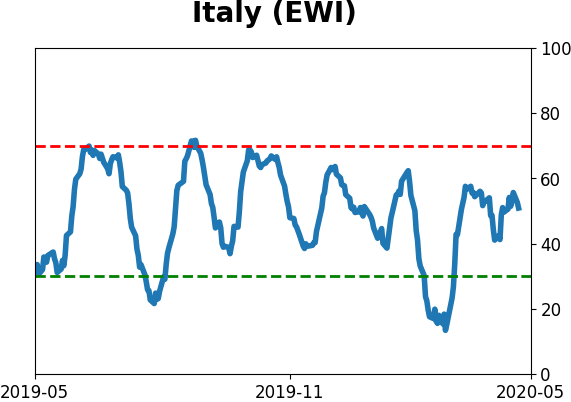
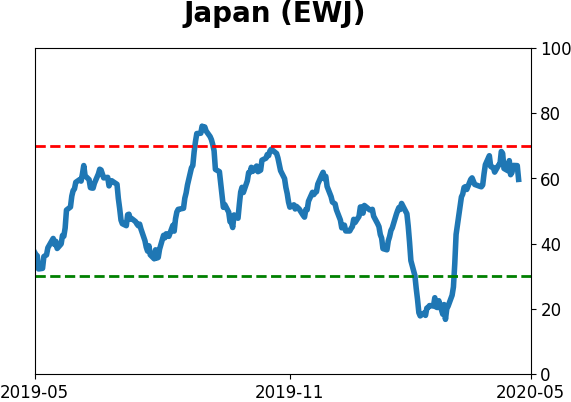
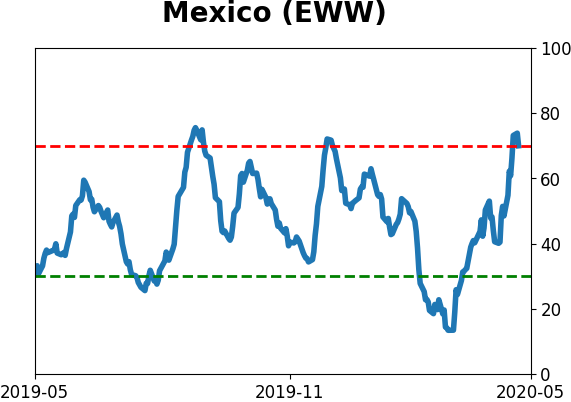
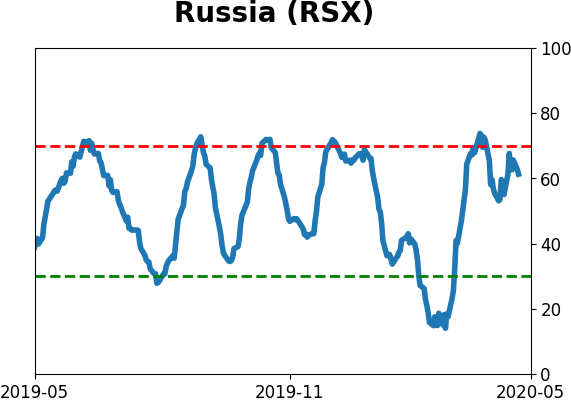
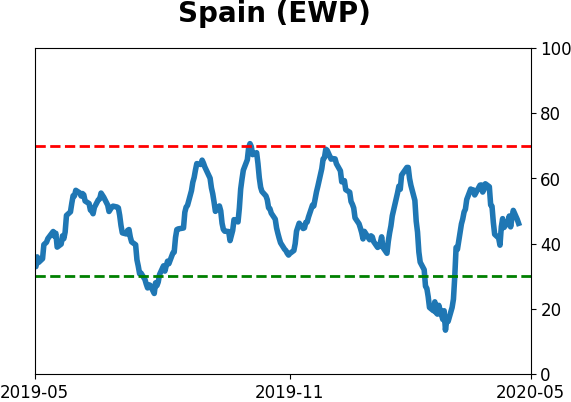
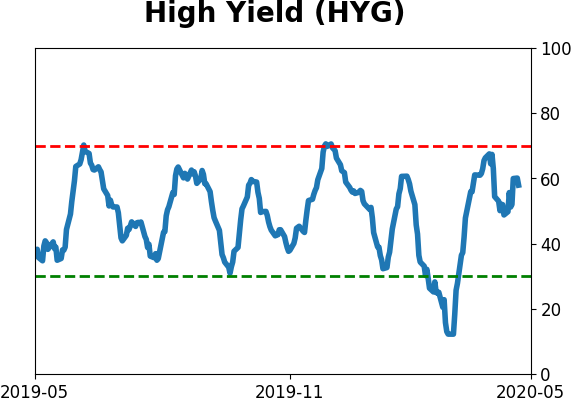
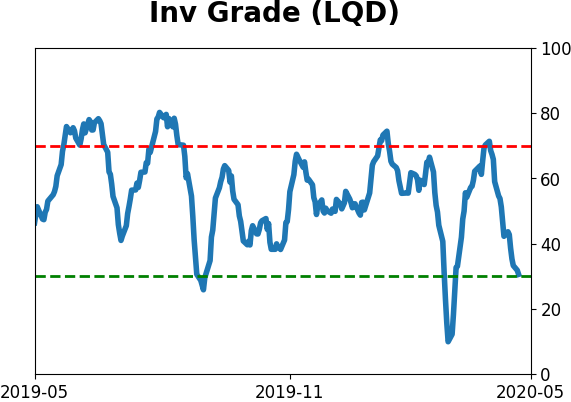
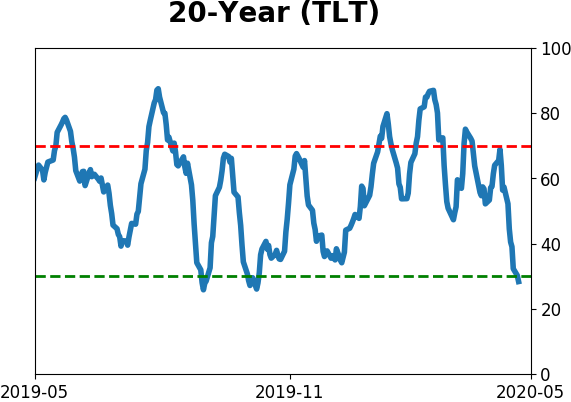
Sentiment Around The World
Optimism Index Thumbnails
|
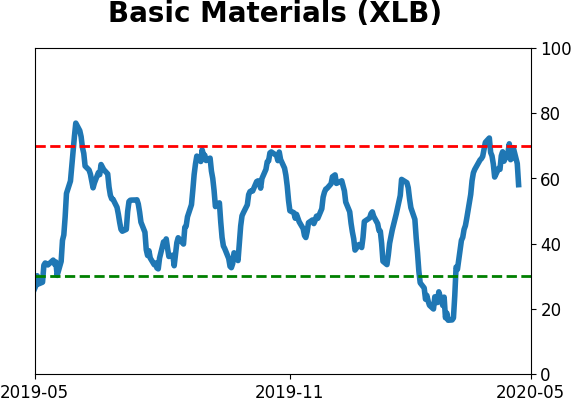
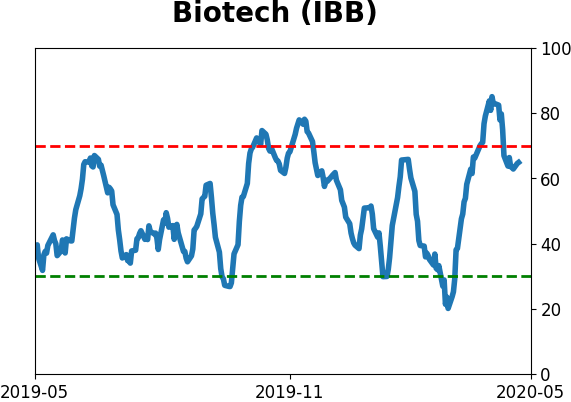
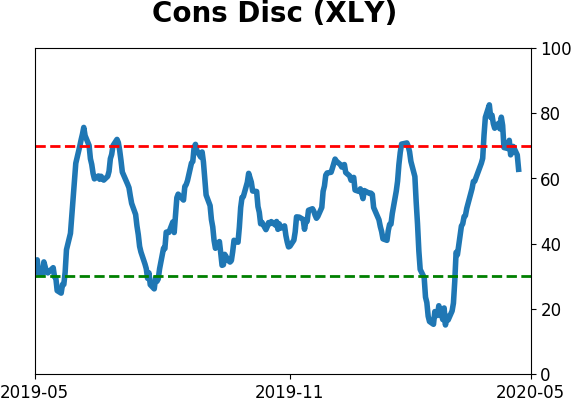
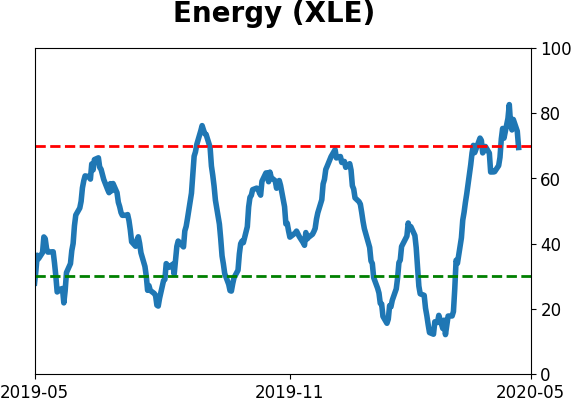
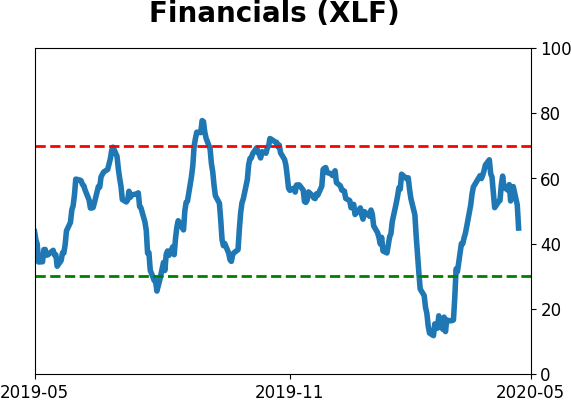
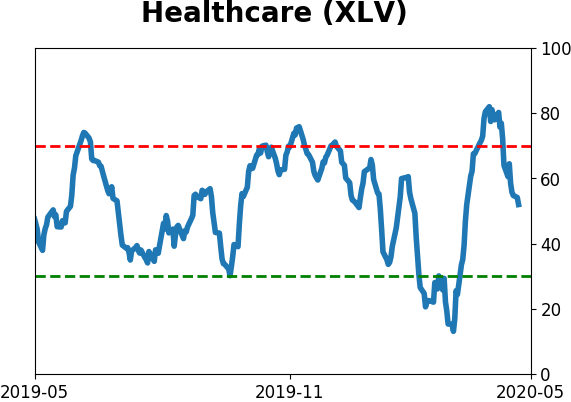
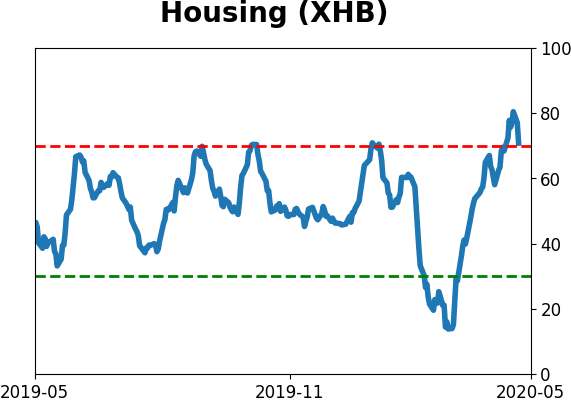
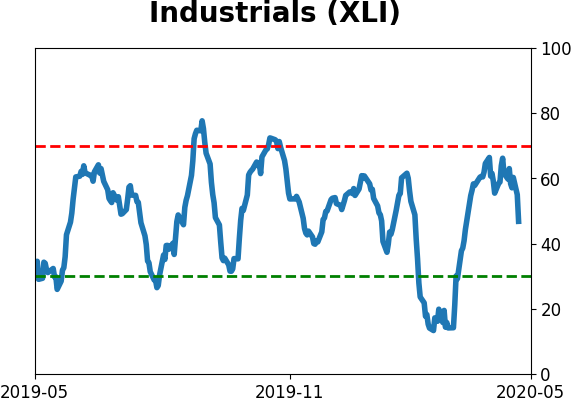
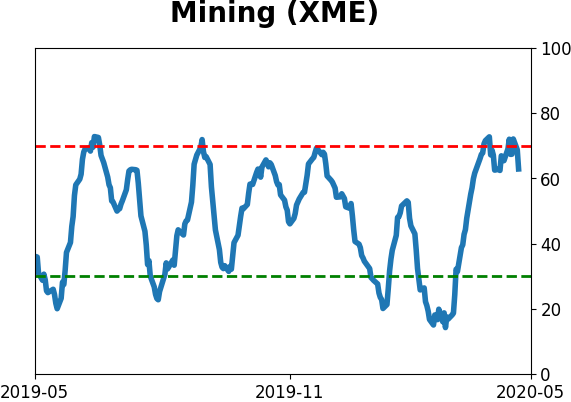
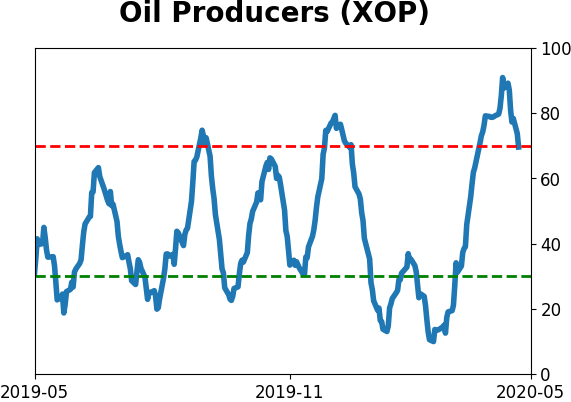
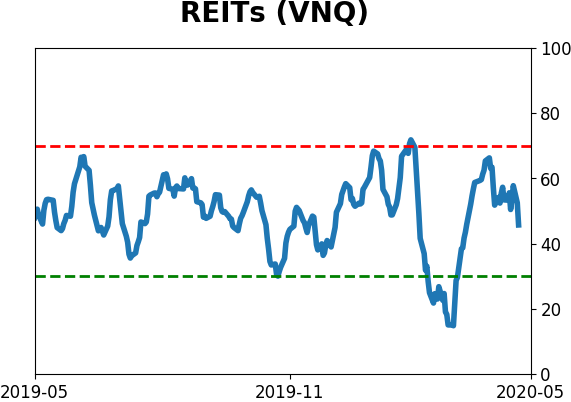
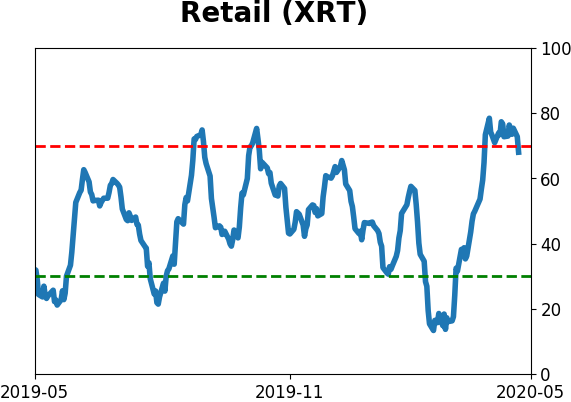
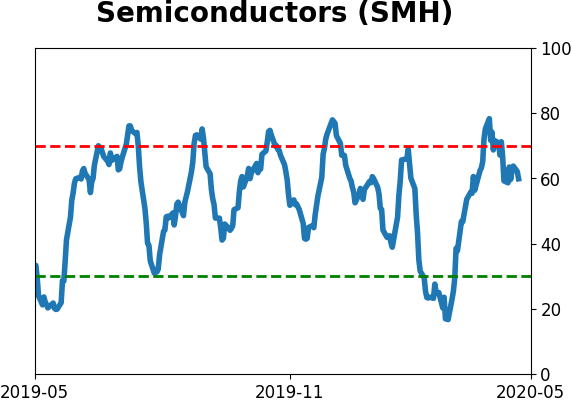
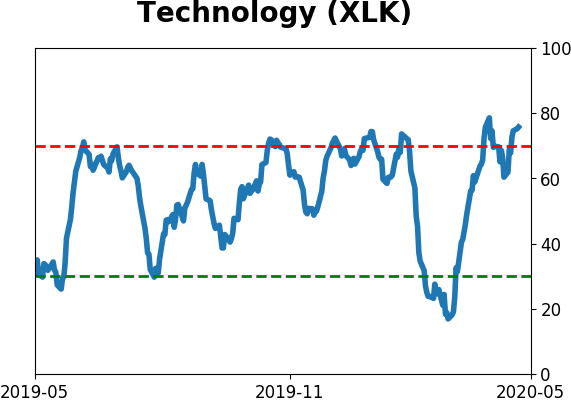
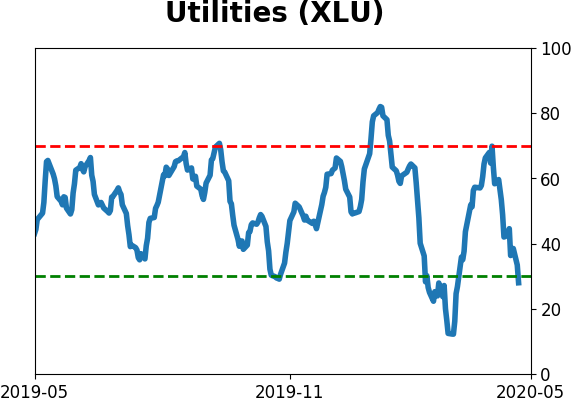
Sector ETF's - 10-Day Moving Average
|
|
|
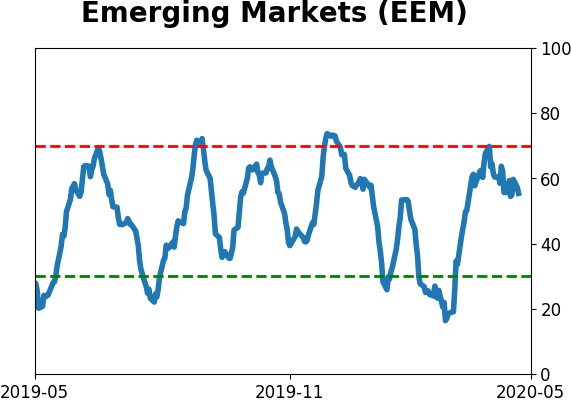
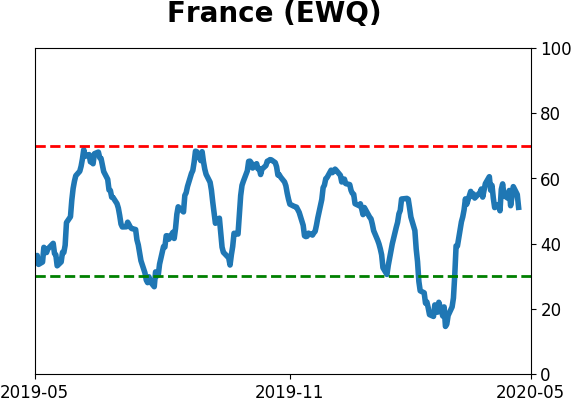
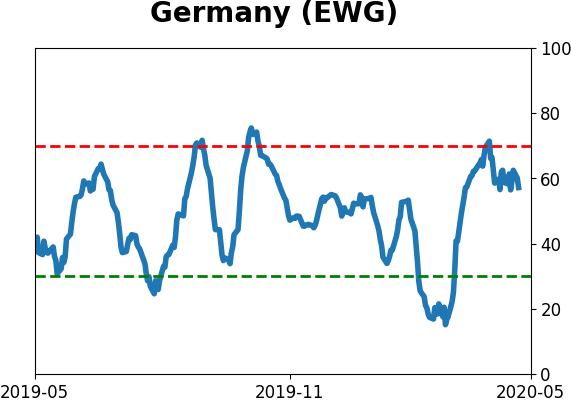
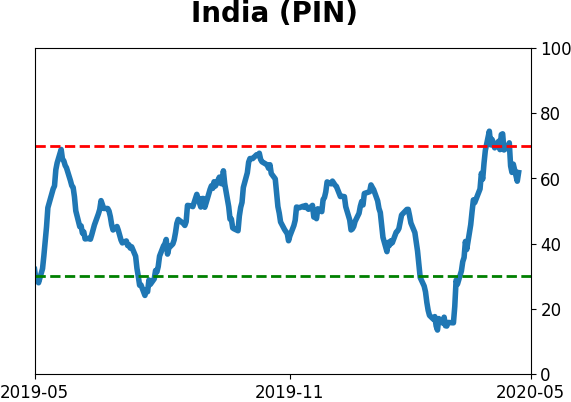
Country ETF's - 10-Day Moving Average
|
|
|
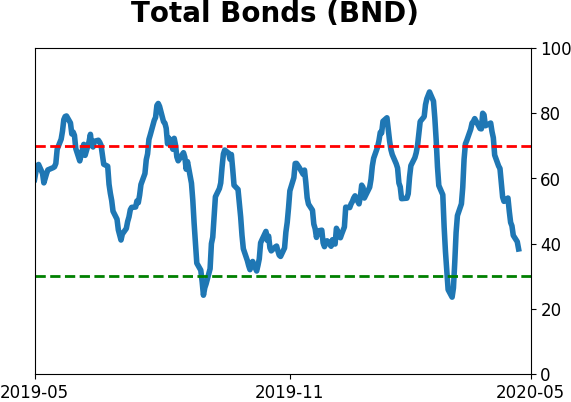
Bond ETF's - 10-Day Moving Average
|
|
|
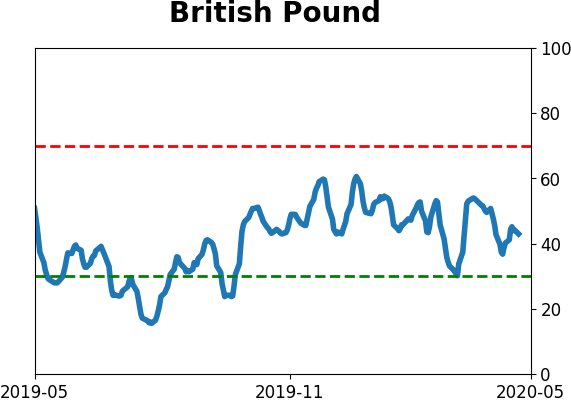
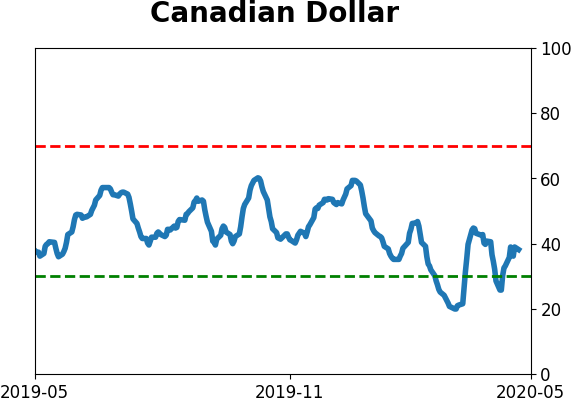
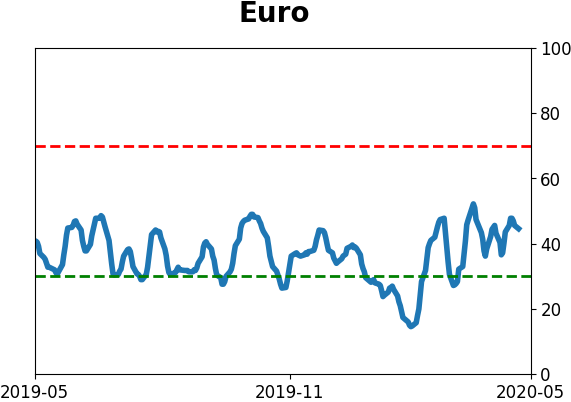
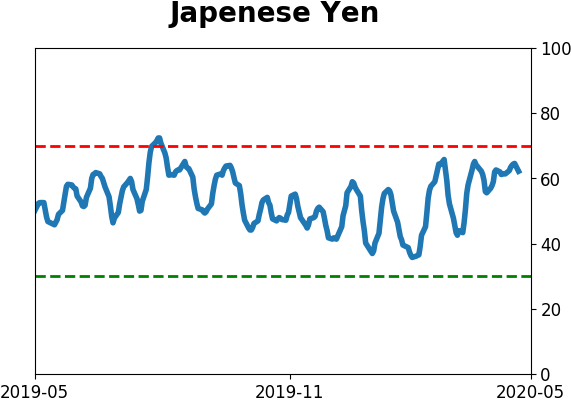
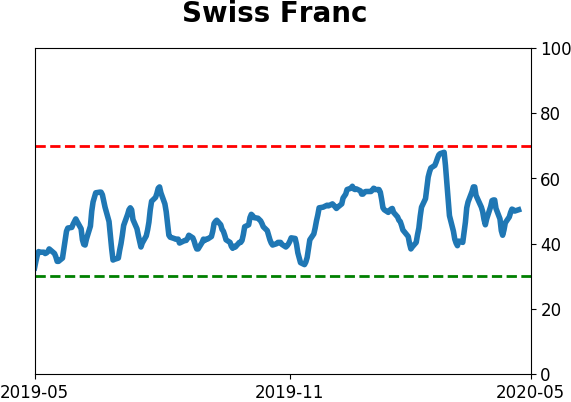
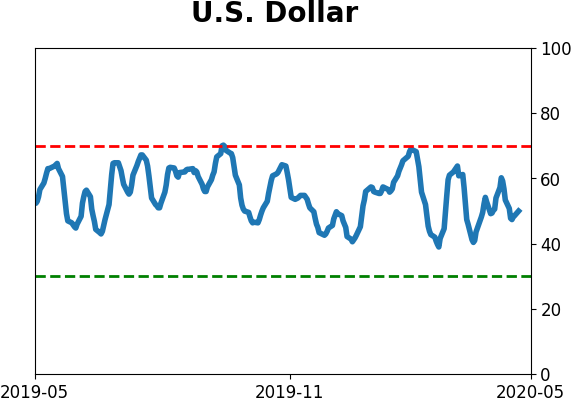
Currency ETF's - 5-Day Moving Average
|
|
|
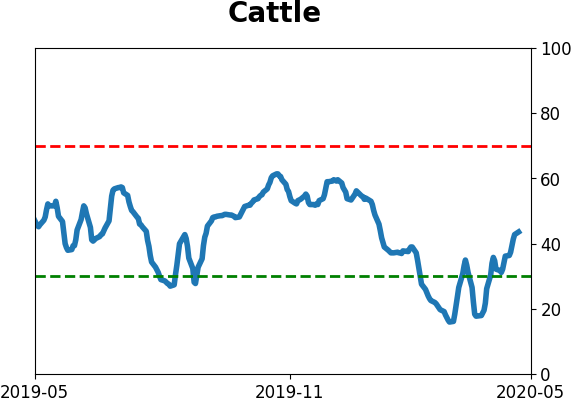
Commodity ETF's - 5-Day Moving Average
|
|