Headlines
|
|
A Historic Surge in New Highs, and Reversals:
The S&P 500 has had a 7-month run of setting new highs, among its best stretches ever. There has also been a big spike in the number of its members hitting 52-week highs. This comes amid odd behavior in other stocks and a surge in buying climaxes.
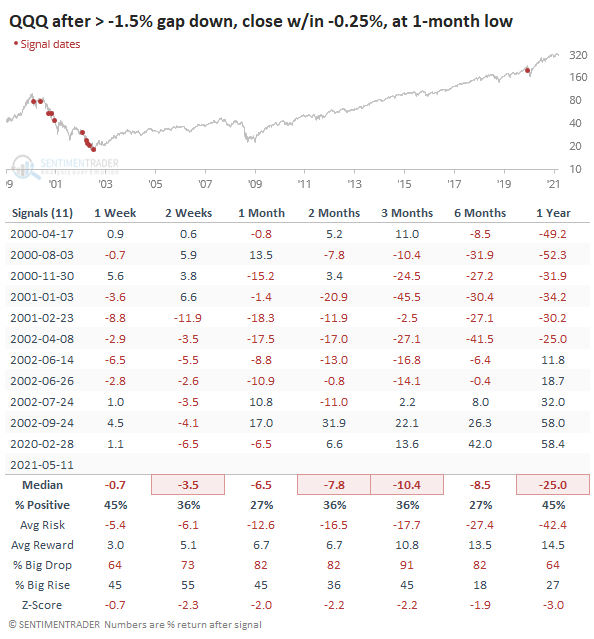
Relying on reversals: Many times over the years, we've highlighted the danger of relying too heavily on single-day reversals to suggest a change in trend. They're highly unreliable. Take Tuesday in the Nasdaq 100 fund, QQQ. It gapped down more than -1.5% at the open then rallied to close down less than 0.25% while hitting a 1-month low at its trough. It looks pretty on a chart but it has not been a good reason to expect the reversal to hold.
Bottom Line:
See the Outlook & Allocations page for more details on these summaries STOCKS: Weak sell
The speculative frenzy in February is getting wrung out. Internal dynamics have mostly held up, with some recent exceptions. Most of our studies show a poor risk/reward over the short- to medium-term, with a more positive skew longer-term. BONDS: Hold
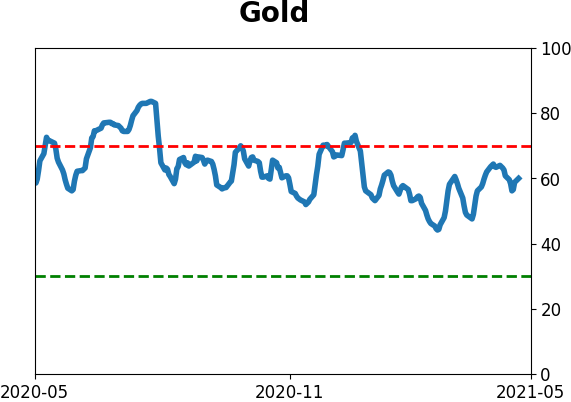
Various parts of the market got hit in March, with the lowest Bond Optimism Index we usually see during healthy environments. After a shaky couple of weeks, the broad bond market has modestly recovered. Not a big edge here either way. GOLD: Weak buy
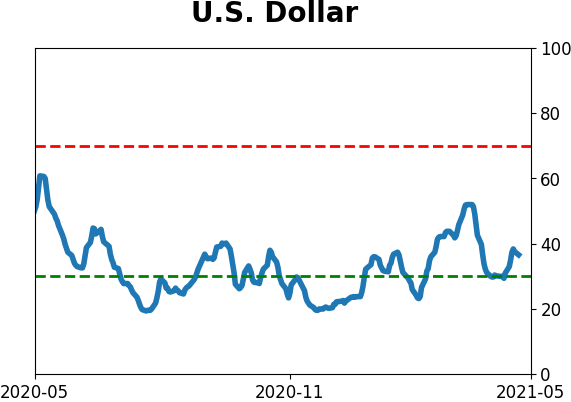
The dollar keeps failing on bulls' hopes that it's finally going to turn a corner, so that's been good for gold and miners. Studies from recent months remain in effect, with a modest positive bias.
|
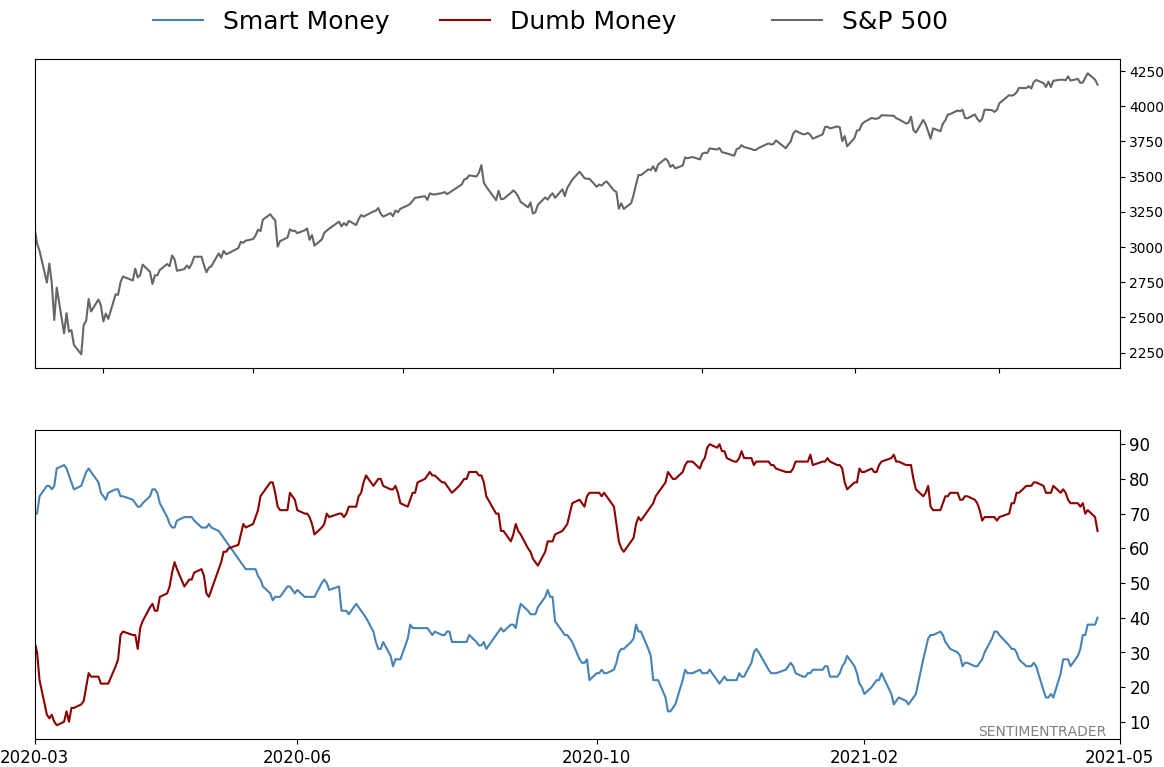
Smart / Dumb Money Confidence
|
Smart Money Confidence: 40%
Dumb Money Confidence: 65%
|
|
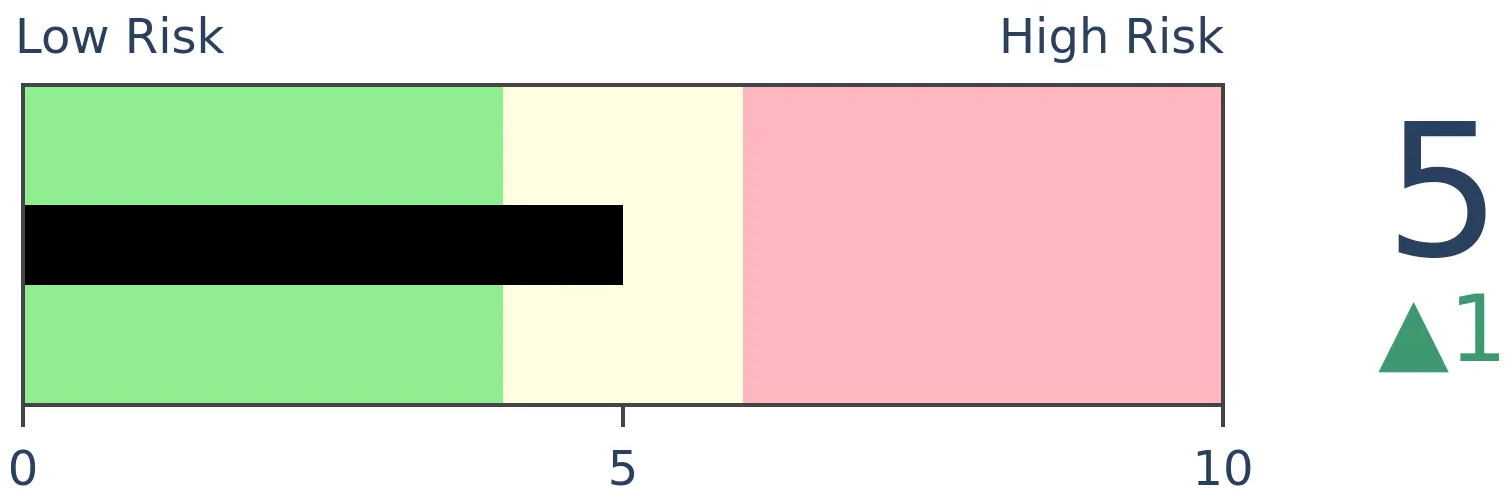
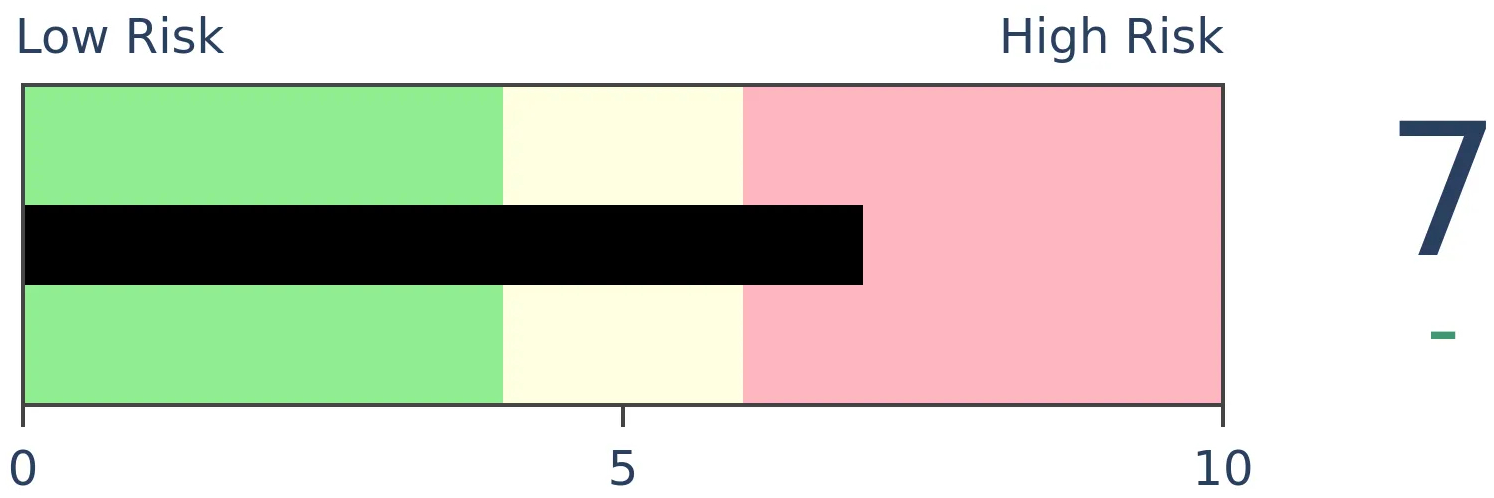
Risk Levels
Stocks Short-Term
|
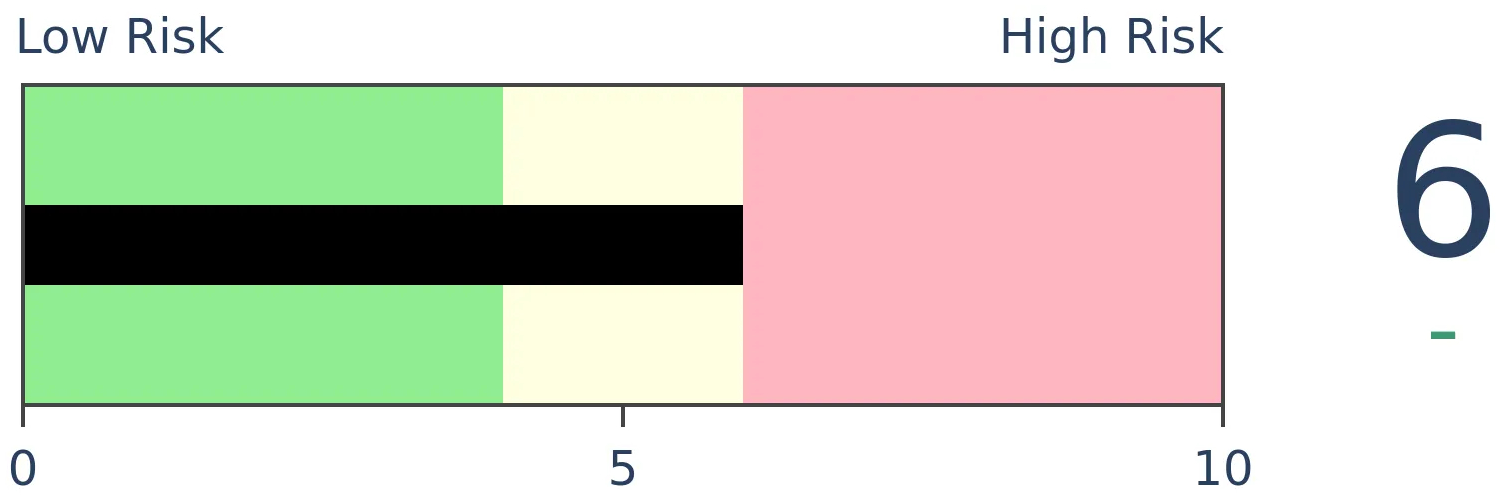
Stocks Medium-Term
|
|
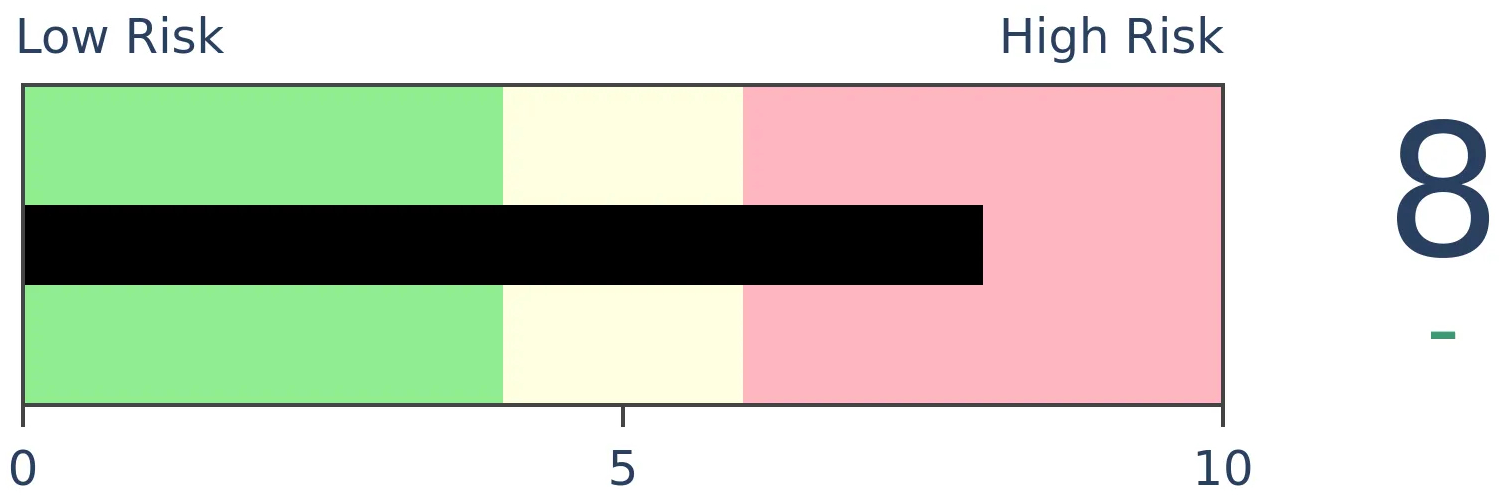
Bonds
|
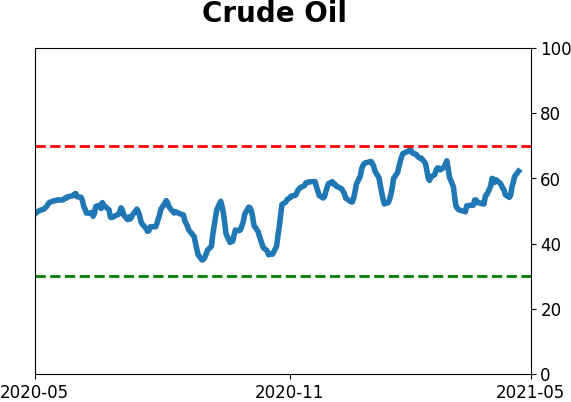
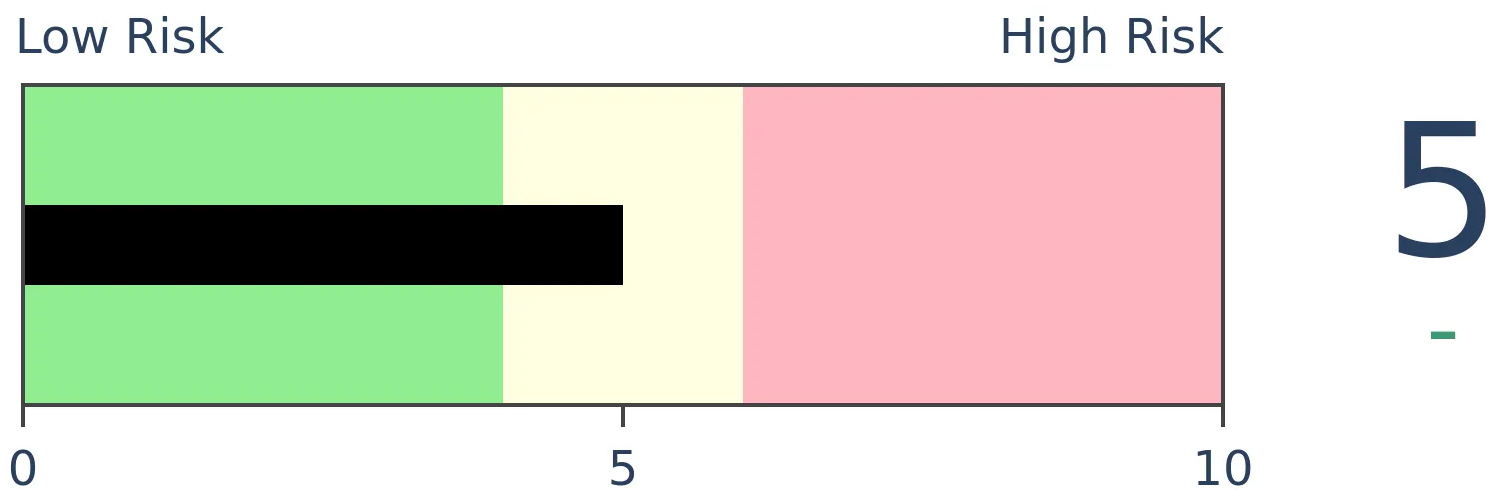
Crude Oil
|
|
Gold
|
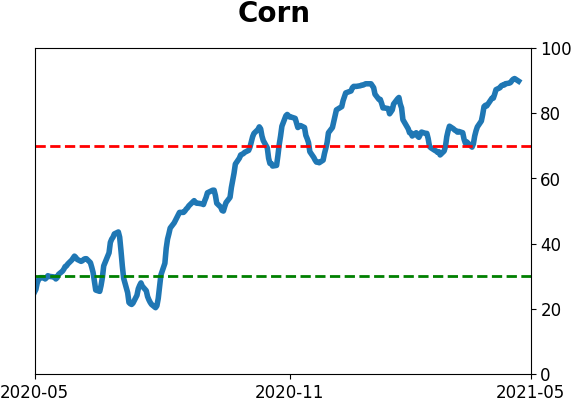
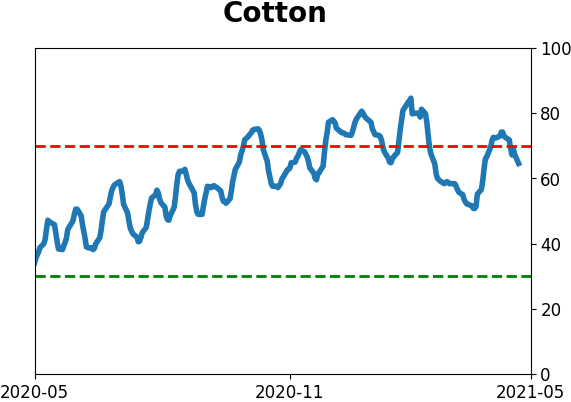
Agriculture
|
|
Research
BOTTOM LINE
The S&P 500 has had a 7-month run of setting new highs, among its best stretches ever. There has also been a big spike in the number of its members hitting 52-week highs. This comes amid odd behavior in other stocks and a surge in buying climaxes.
FORECAST / TIMEFRAME
None
|
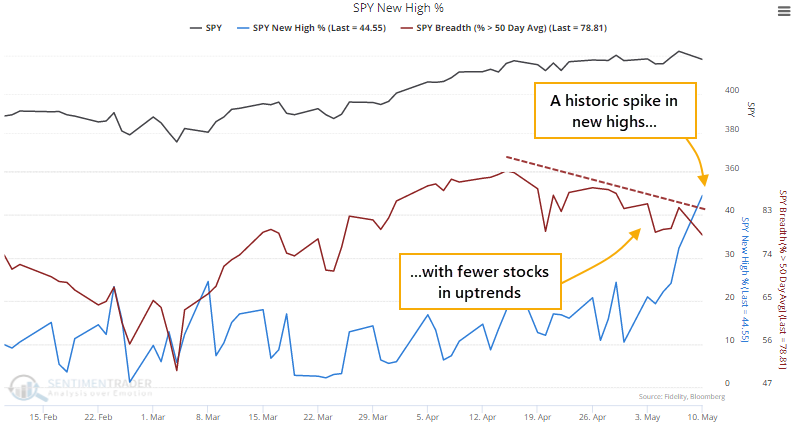
On Friday, nearly a third of stocks in the S&P 500 managed to hit a 52-week high on that day alone. Then it skyrocketed to a stunning 78-year high on Monday.
Even Friday's reading was so high that it had been matched by only 7 other days in more than 20 years, as we noted on Friday. The Backtest Engine shows how the index performed after the others.
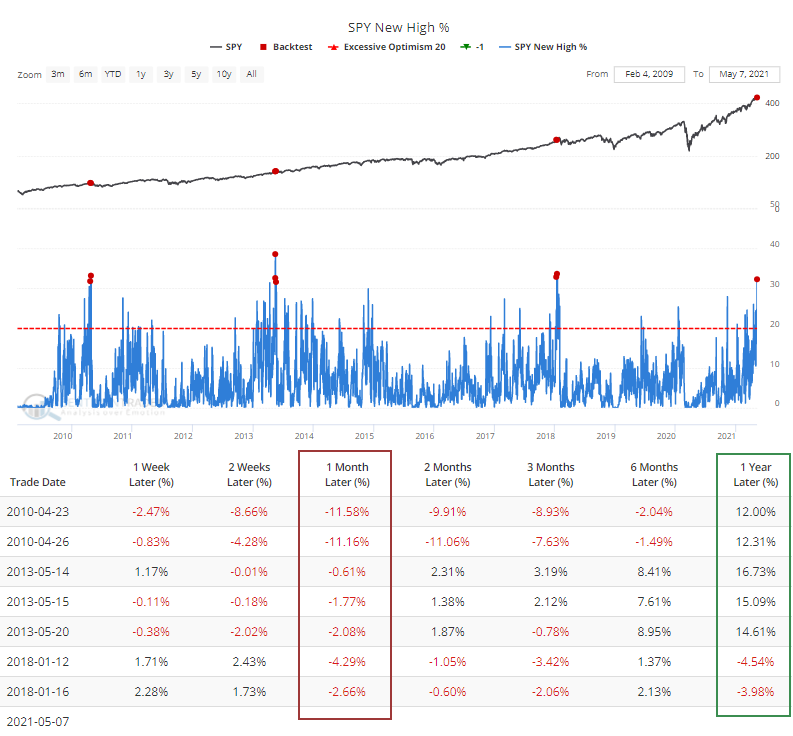
Every one of the sessions preceded a loss over the next month, but those losses were front-loaded, and over the next 6-12 months, stocks rebounded.
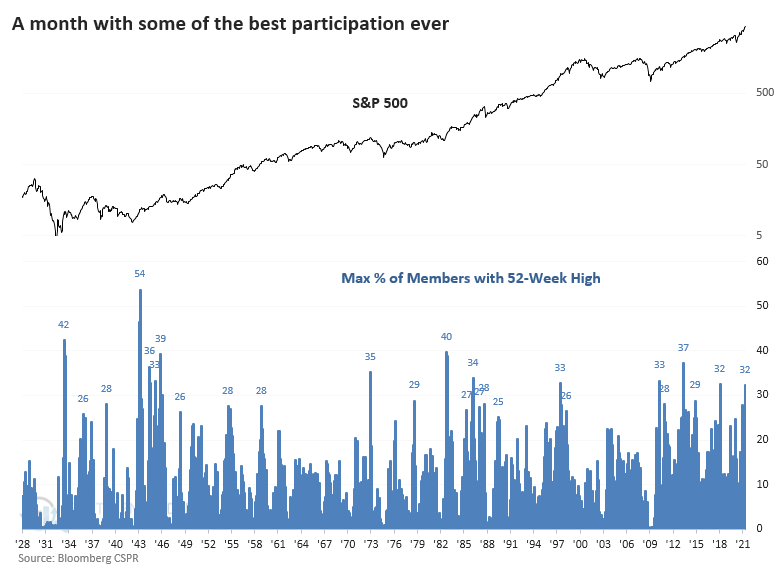
Dating back to 1928, this is among the months with the greatest participation ever, and that's before Monday's remarkable session.
If we look for times when the S&P strung together at least 5 straight months with an all-time high, and at least 20% of its members hit a 52-week high, we can get a sense of what happened after other bouts of extreme momentum + participation.
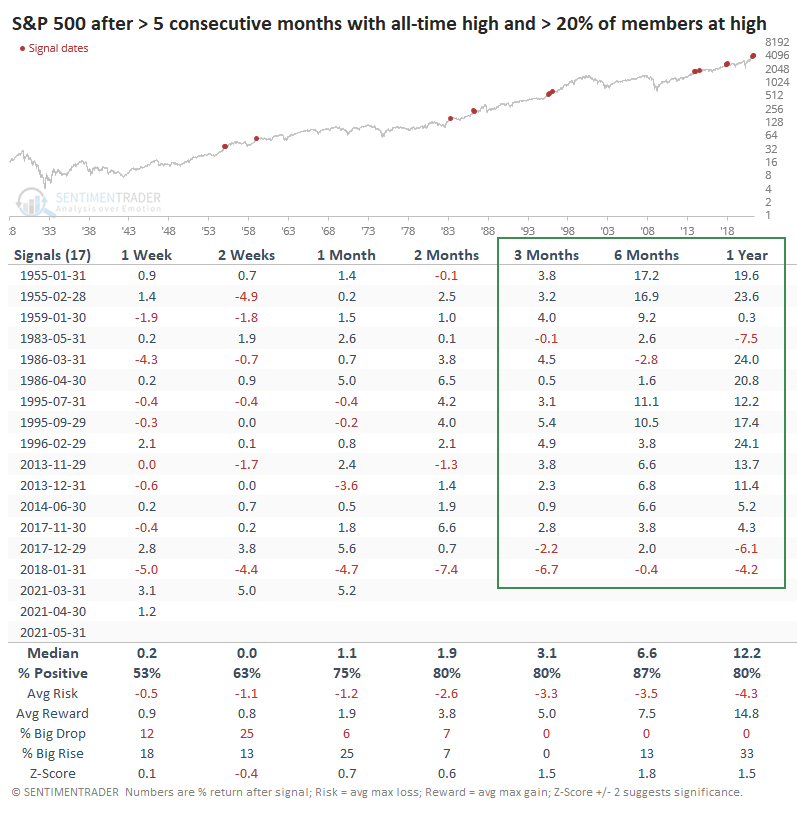
Shorter-term returns were fine, in line with random. The S&P typically rose, and losses were relatively small. The most impressive performance was over a medium- to long-term time frame, with only a few losses, and all under 7.5% across every time frame.
This confirms most of the other studies we've looked at lately, with impressive momentum and broad participation rarely preceding large, sustained losses and bear markets. The shorter term is more of an issue, though.
Monday was odd in many respects, not the least being another surge in stocks setting 52-week highs. More than 44% of S&P members notched a high in the morning, the most since 1943. Since 1928, there has only been a single day - January 16, 2018 - when more than 30% of stocks hit a 52-week high at the same time that fewer than 80% of them were trading above their 50-day moving averages.
This is exceptionally odd behavior.
The burst of gains and push to new highs early on Monday was reversed during the session, causing a spike in the number of stocks suffering a buying climax. This is triggered when a stock hits a 52-week high then reverses to close below the prior day's close, potentially a sign of exhaustion among buyers.
The Backtest Engine shows that this is the 6th-largest number of climaxes in a single day since the inception of SPY.
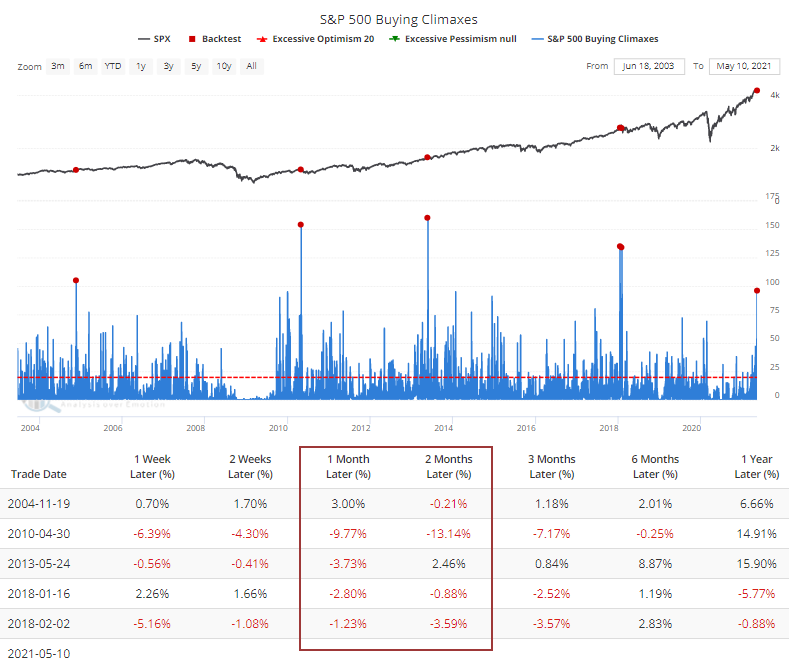
Every time more than 95 stocks suffered a buying climax, the S&P 500 showed a loss over the next 1-2 months. Again, though, there were few losses over the next 6-12 months, and they were relatively small.
Monday's session emphasized the high potential risk and low probable reward that buyers are facing right now. This is mostly a concern for those with a time frame of weeks, however. So far, the type of activity and behavior we've seen has typically preceded gains over longer time frames of 6-12 months.
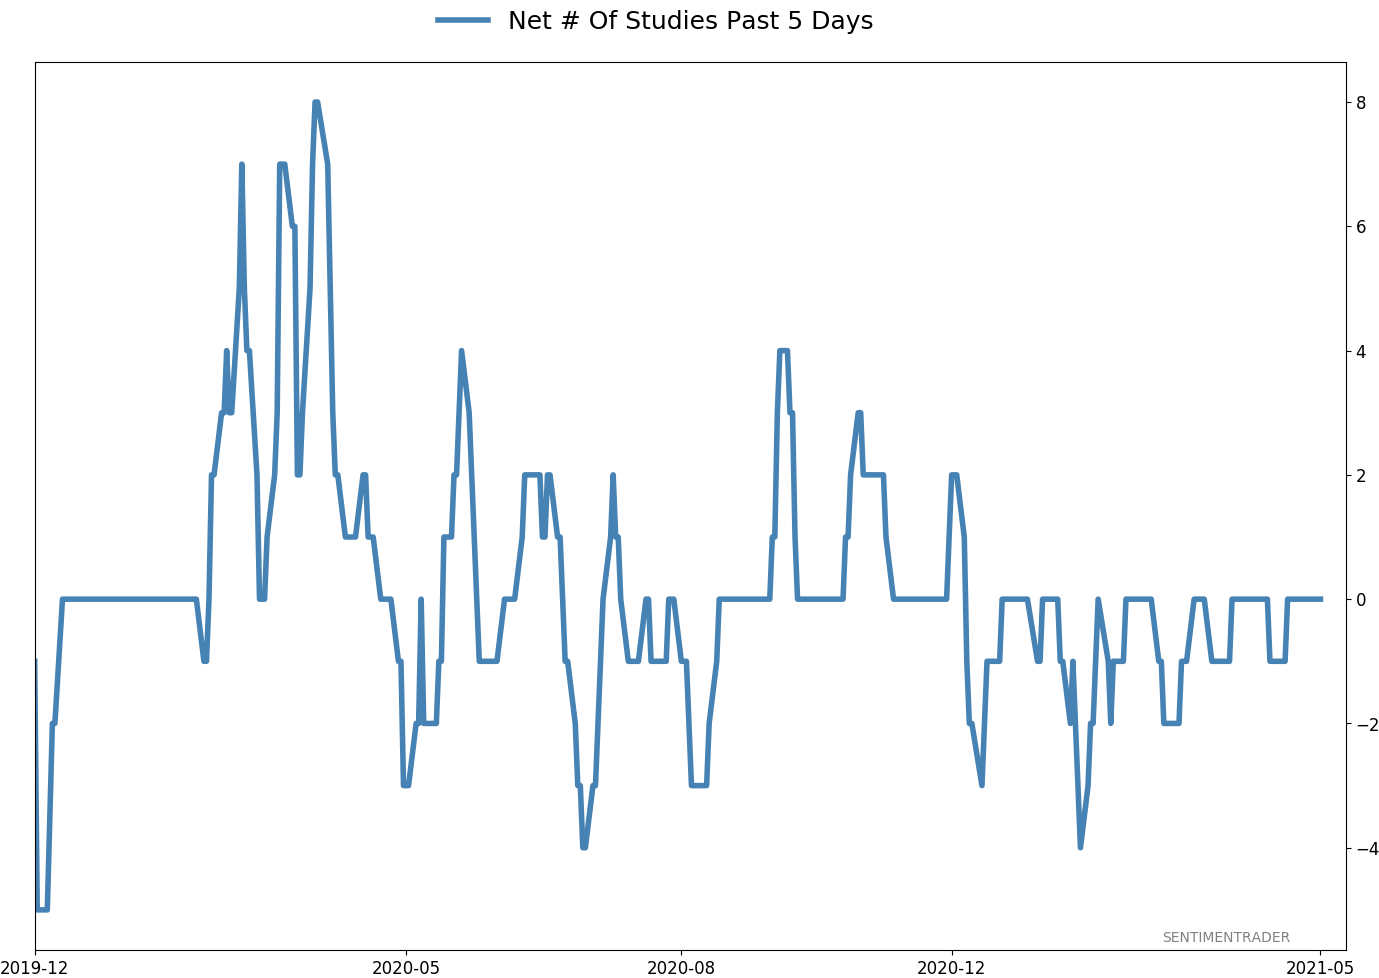
Active Studies
| Time Frame | Bullish | Bearish | | Short-Term | 0 | 0 | | Medium-Term | 1 | 11 | | Long-Term | 11 | 4 |
|
Indicators at Extremes
Portfolio
| Position | Description | Weight % | Added / Reduced | Date | | Stocks | RSP | 0.0 | Reduced 4.9% | 2021-04-22 | | Bonds | 30.0% BND, 8.8% SCHP | 37.9 | Added 15.1% | 2021-02-18 | | Commodities | GCC | 2.5 | Reduced 2.1%
| 2020-09-04 | | Precious Metals | GDX | 9.8 | Added 0.1% | 2021-02-18 | | Special Situations | 4.3% XLE, 2.2% PSCE | 6.5 | Reduced 5.6% | 2021-04-22 | | Cash | | 43.3 | | |
|
Updates (Changes made today are underlined)
I've made no adjustments for months, as the situation remained essentially stuck - energy was doing what it should, sentiment in the broader market was ridiculously stretched but with no major warning signs, and sentiment toward gold and bonds appeared overdone on the pessimistic side. Those conditions have started to reverse a bit, so I further reduced my risk. There are still no major warning signs, but I'm getting increasingly uncomfortable and would prefer to sit safely in cash and wait for better risk/reward opportunities. RETURN YTD: 8.5% 2020: 8.1%, 2019: 12.6%, 2018: 0.6%, 2017: 3.8%, 2016: 17.1%, 2015: 9.2%, 2014: 14.5%, 2013: 2.2%, 2012: 10.8%, 2011: 16.5%, 2010: 15.3%, 2009: 23.9%, 2008: 16.2%, 2007: 7.8%
|
|
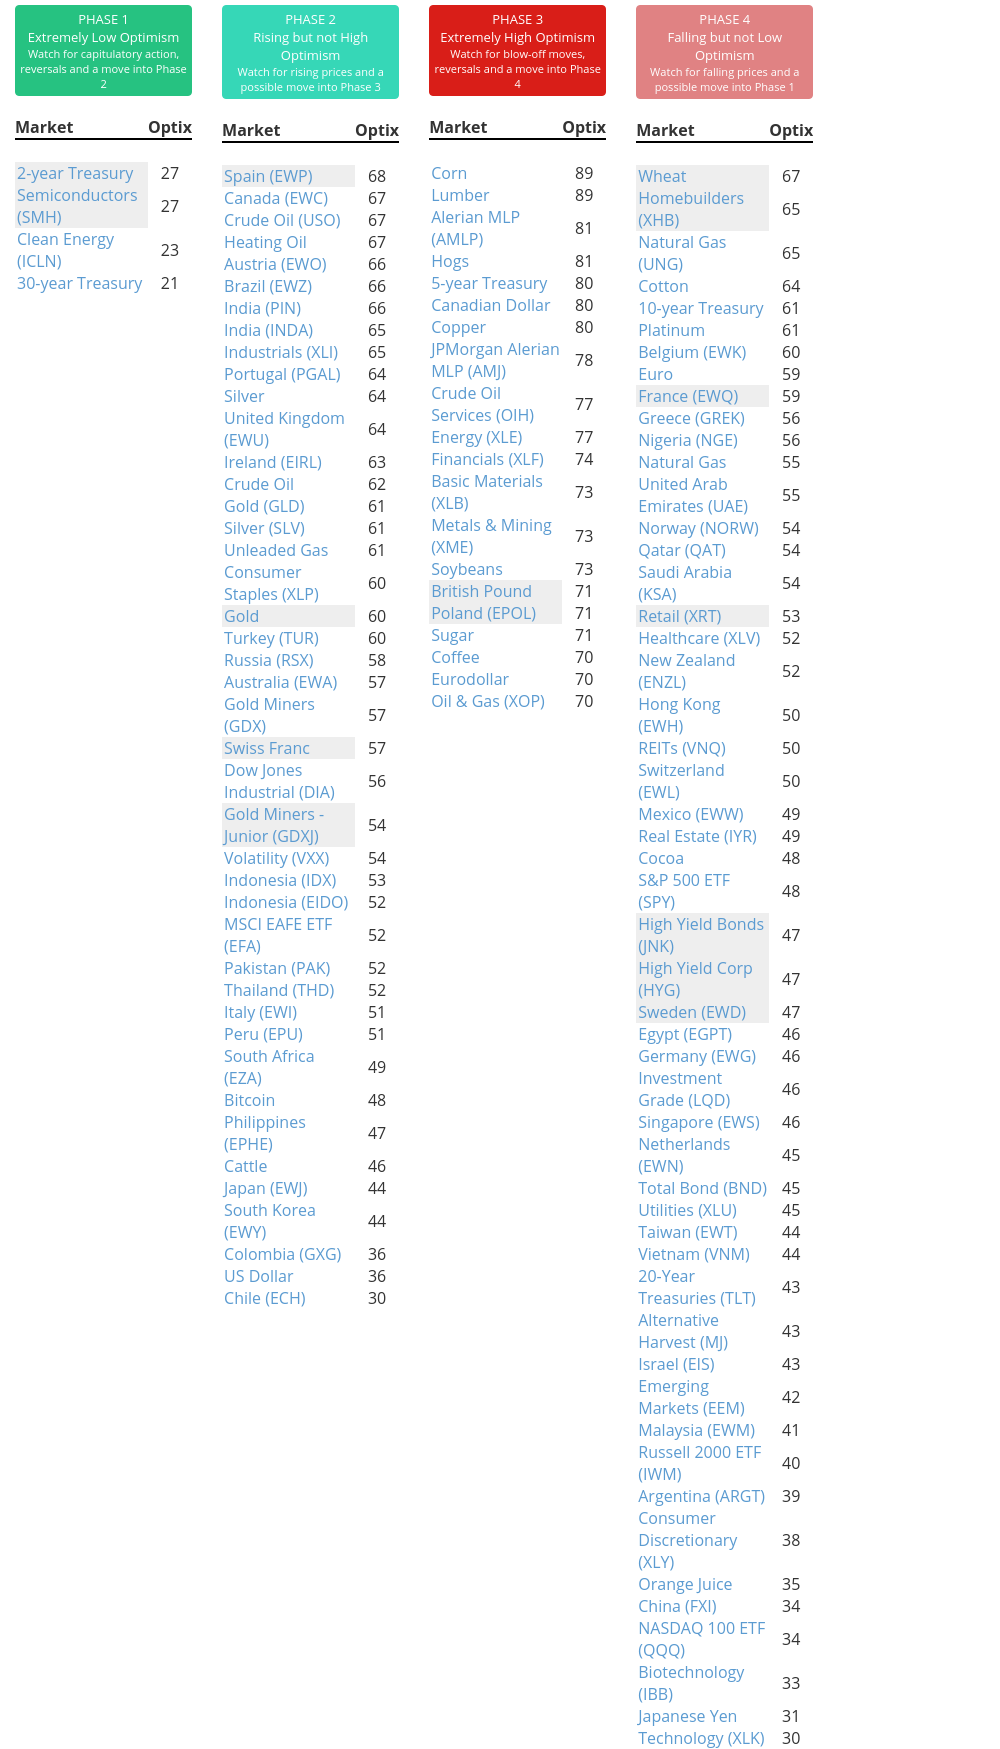
Phase Table
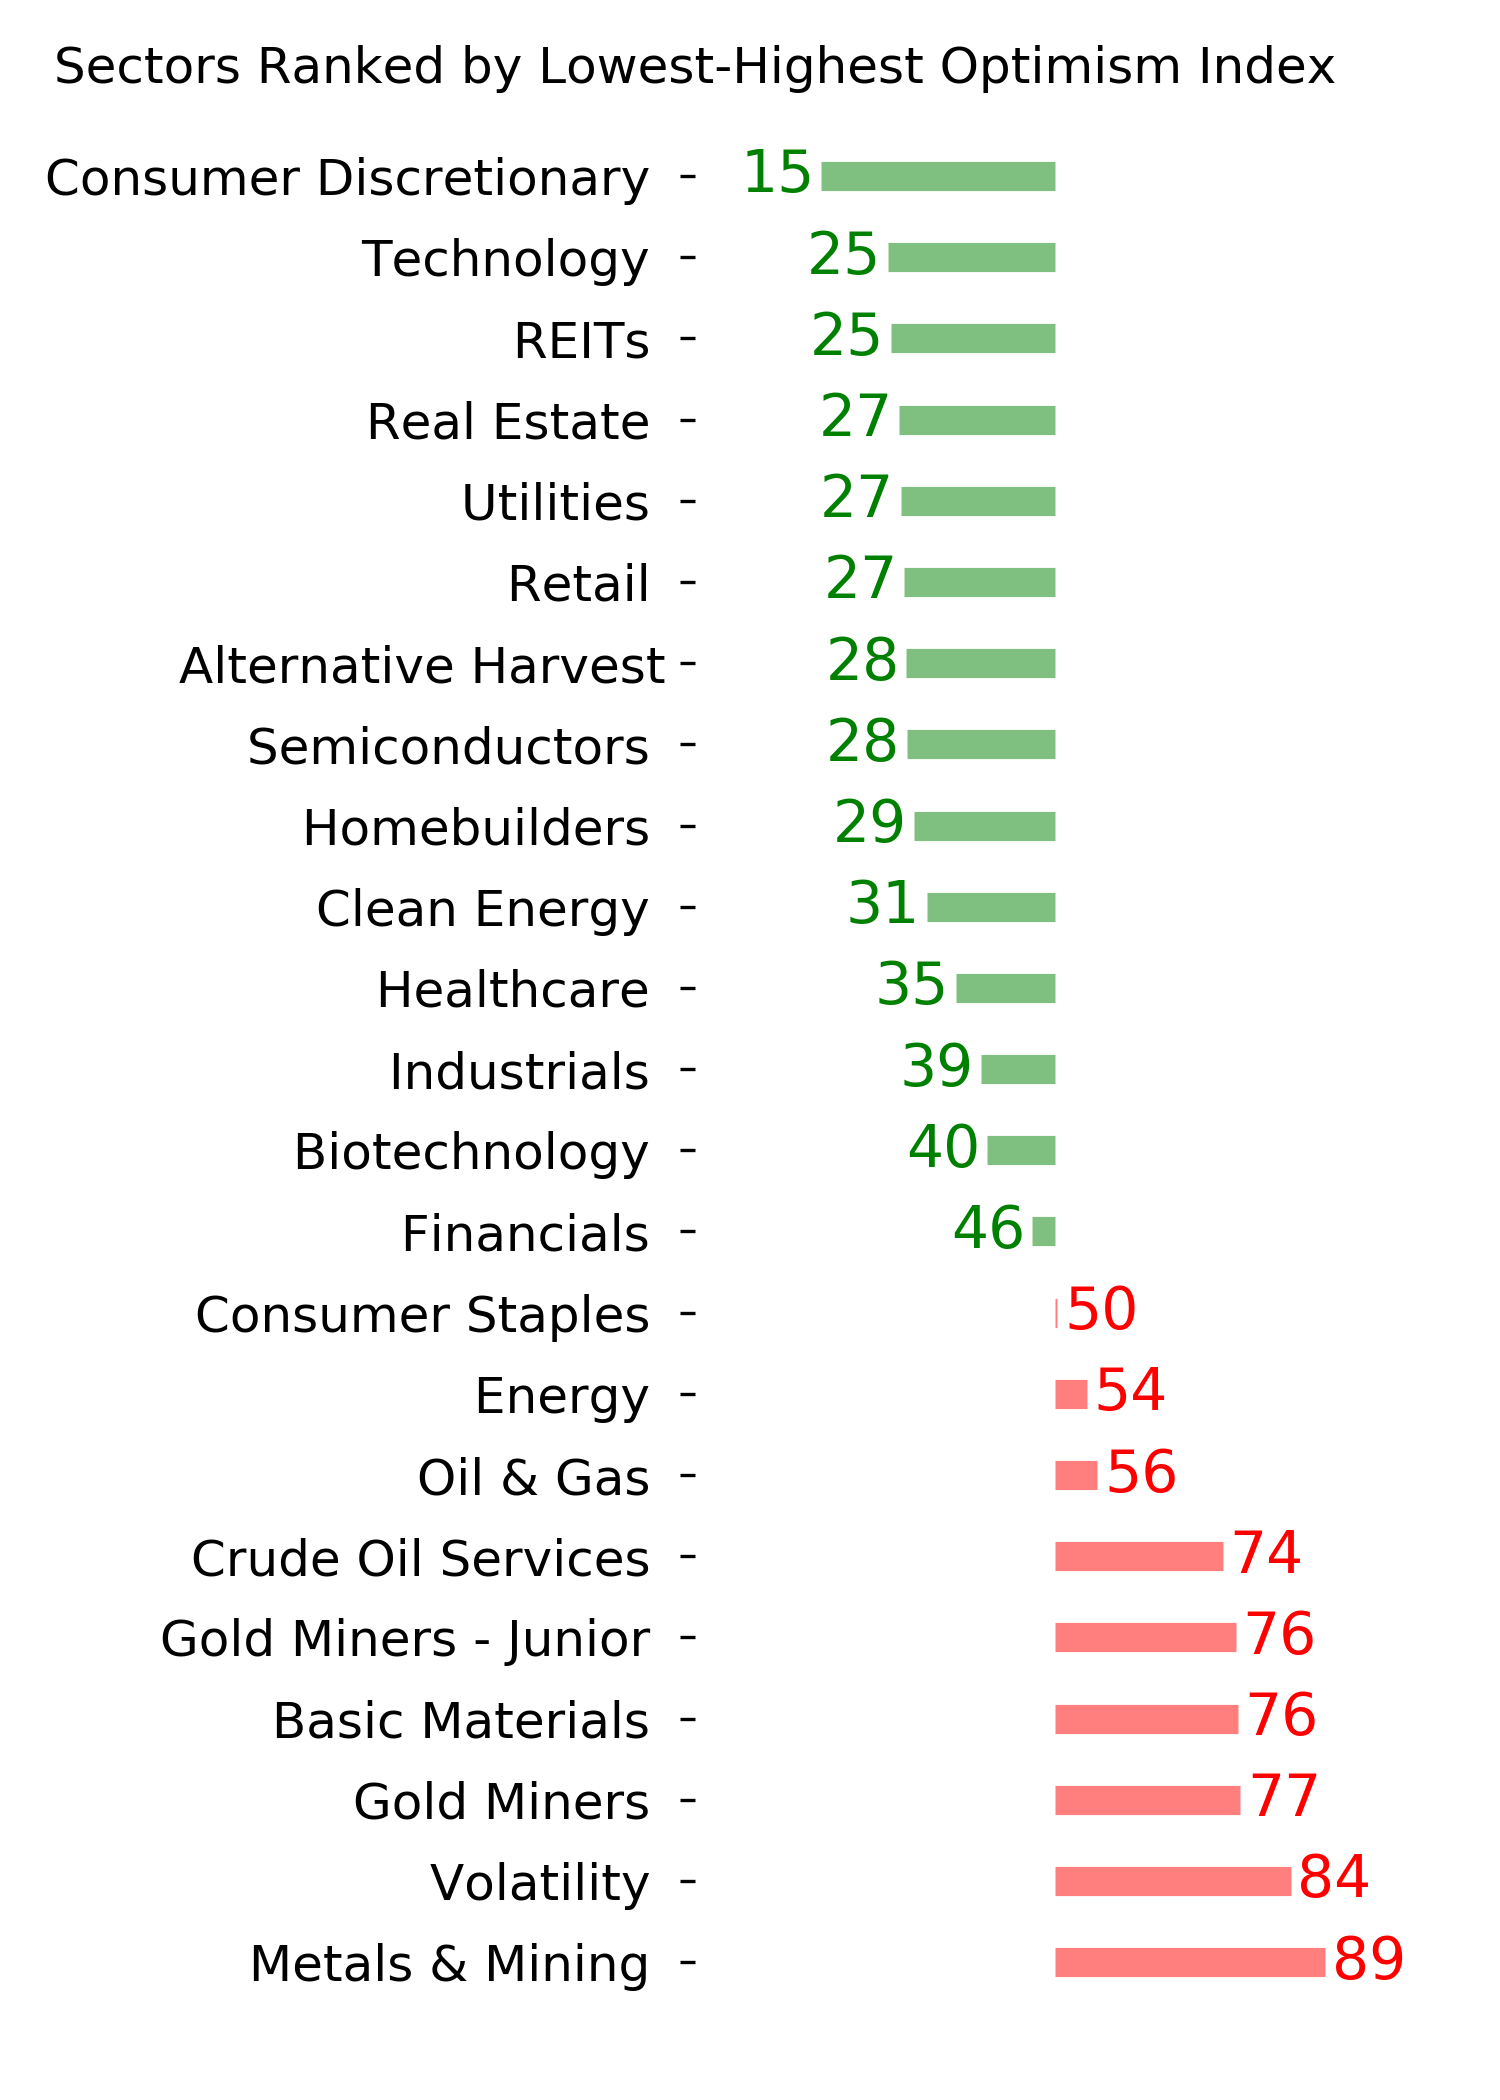
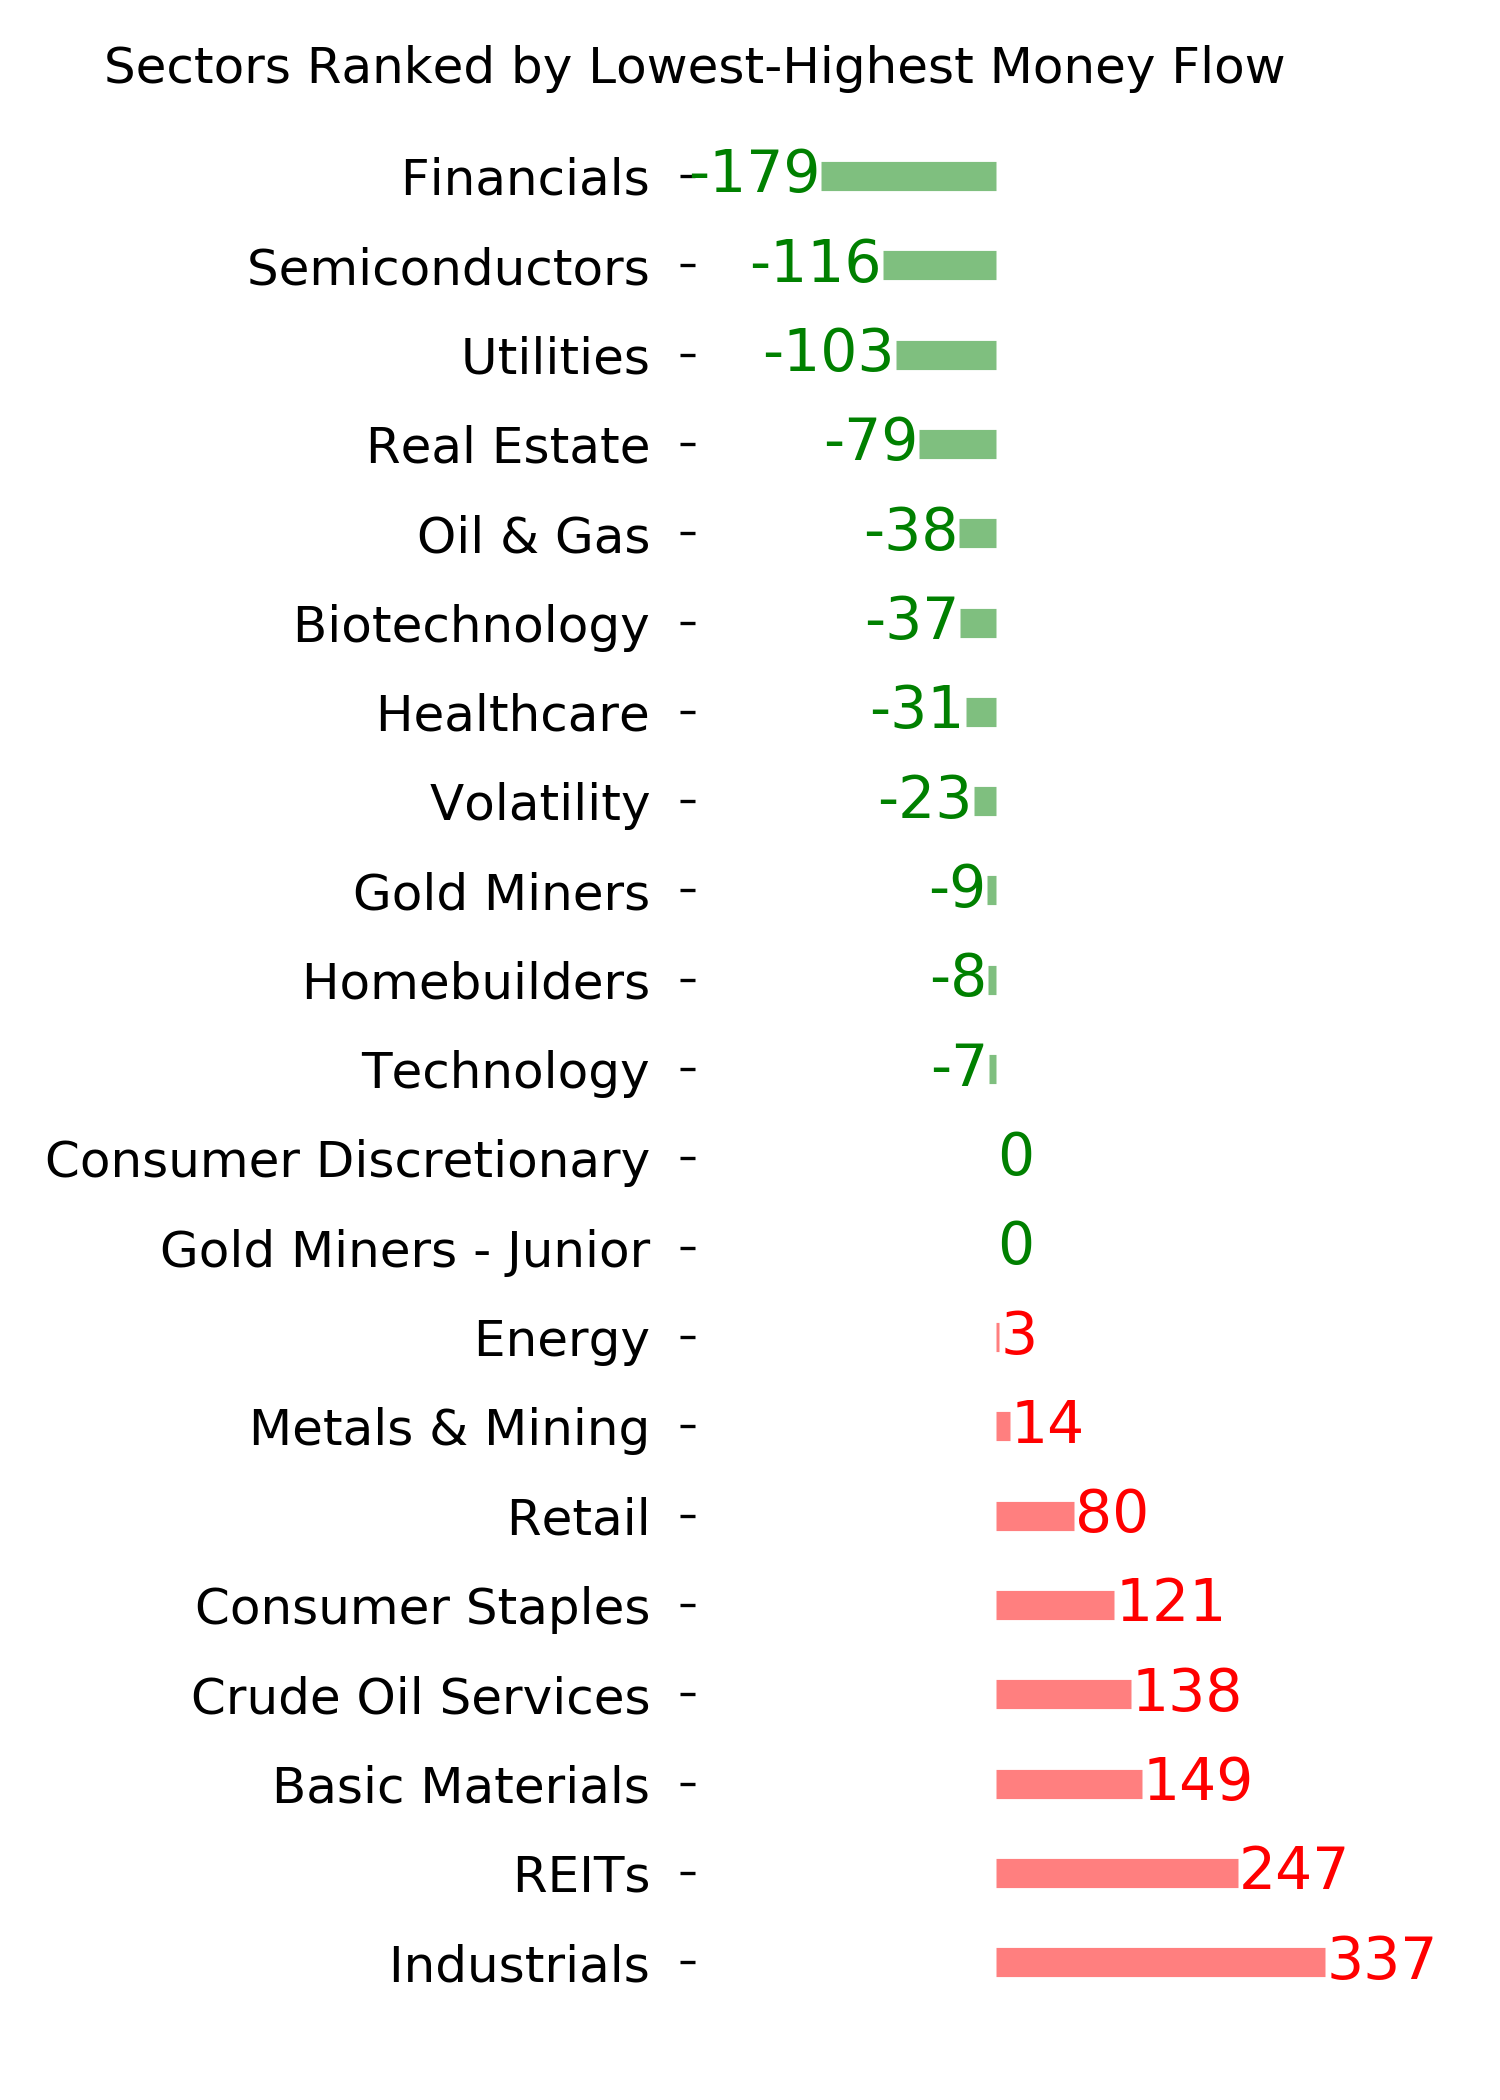
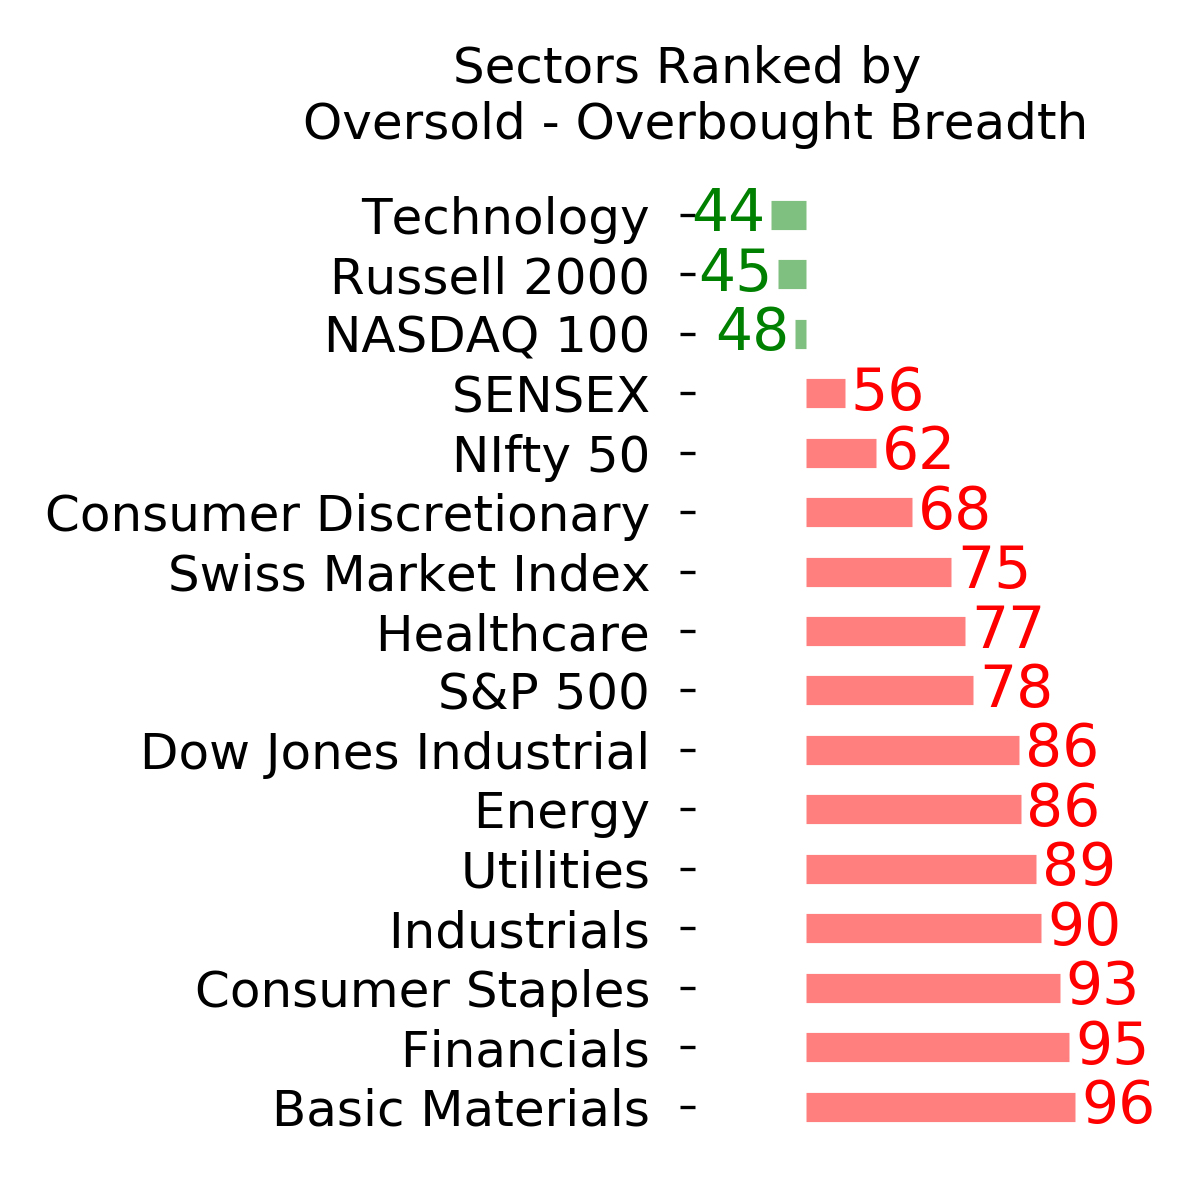
Ranks
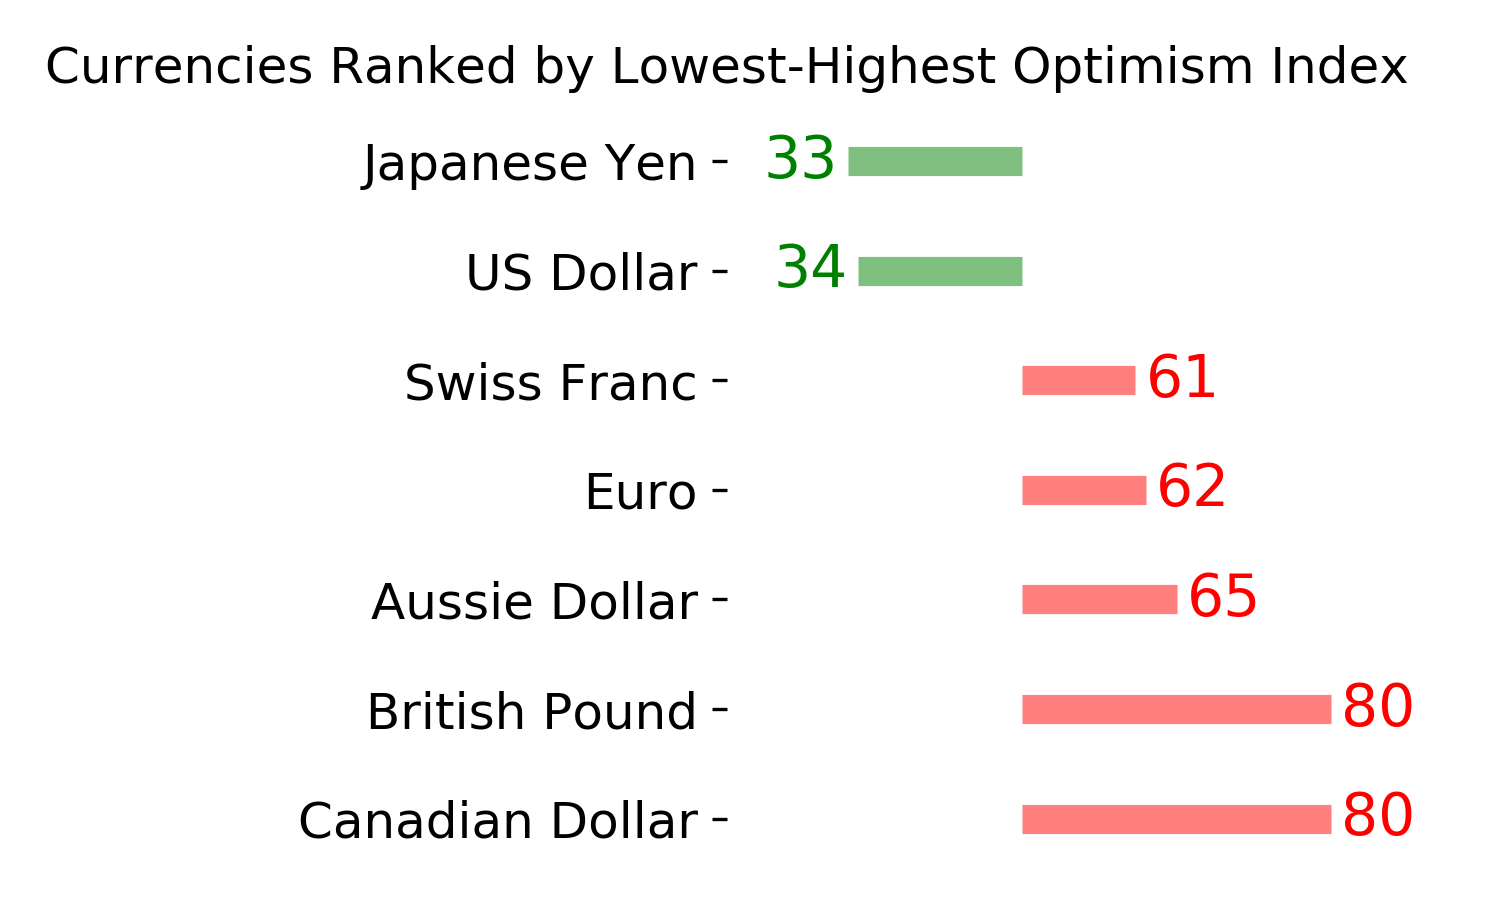
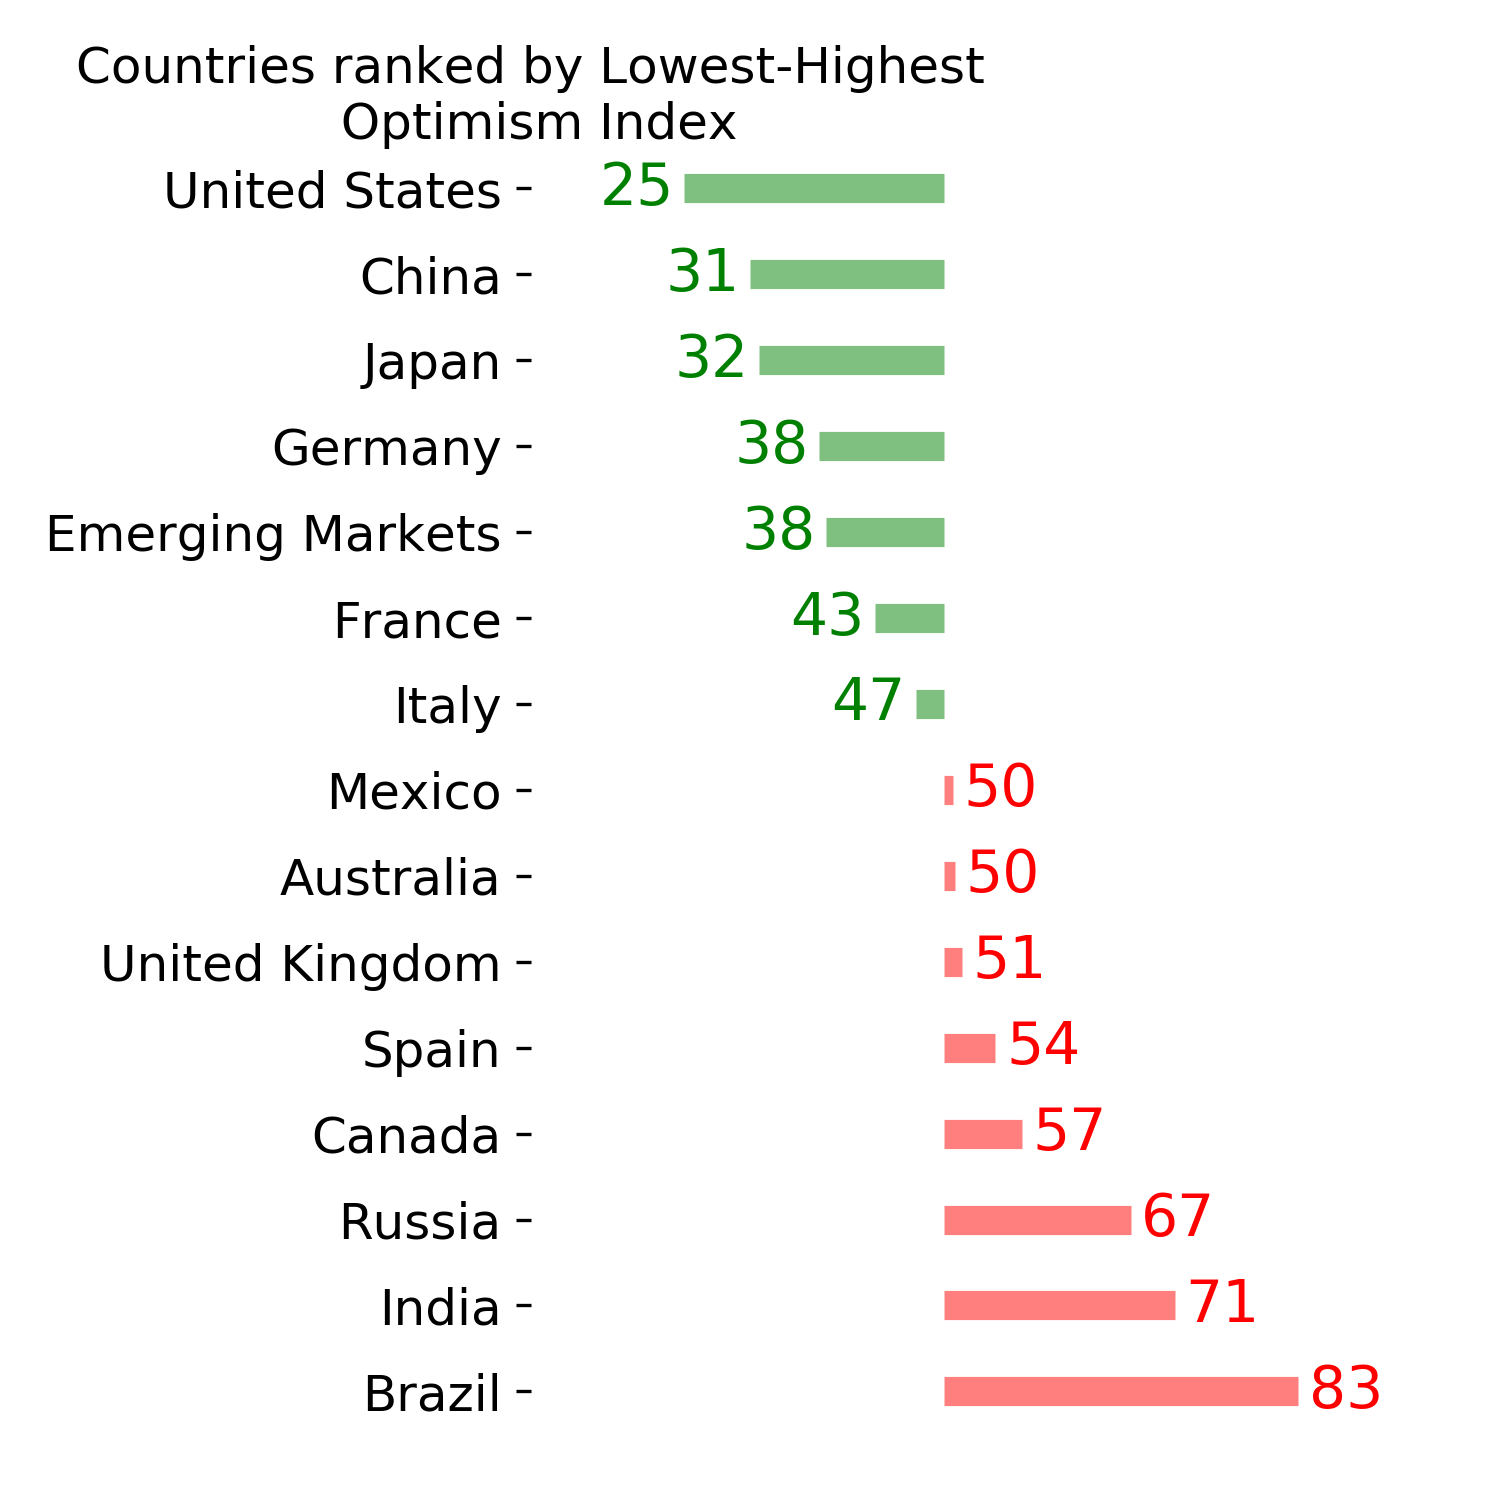
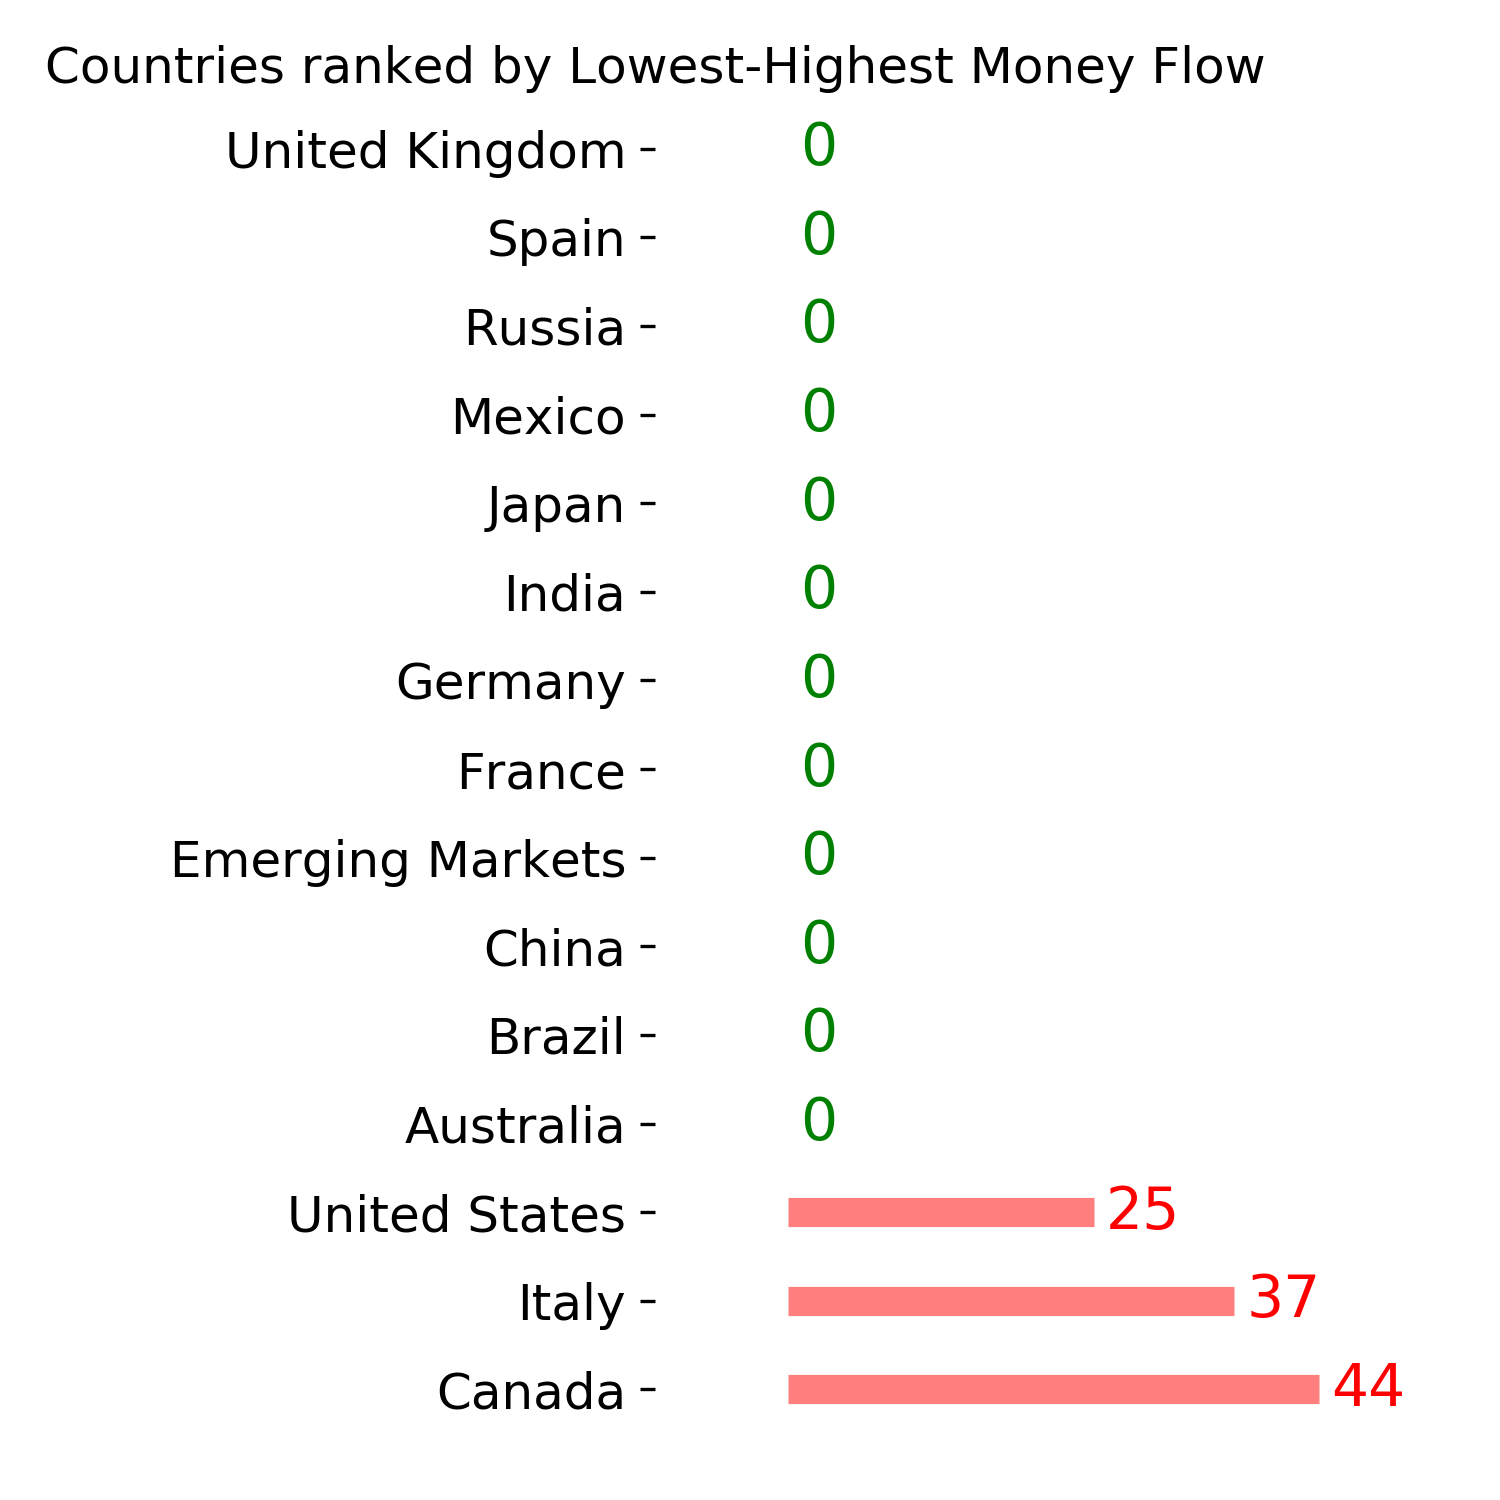
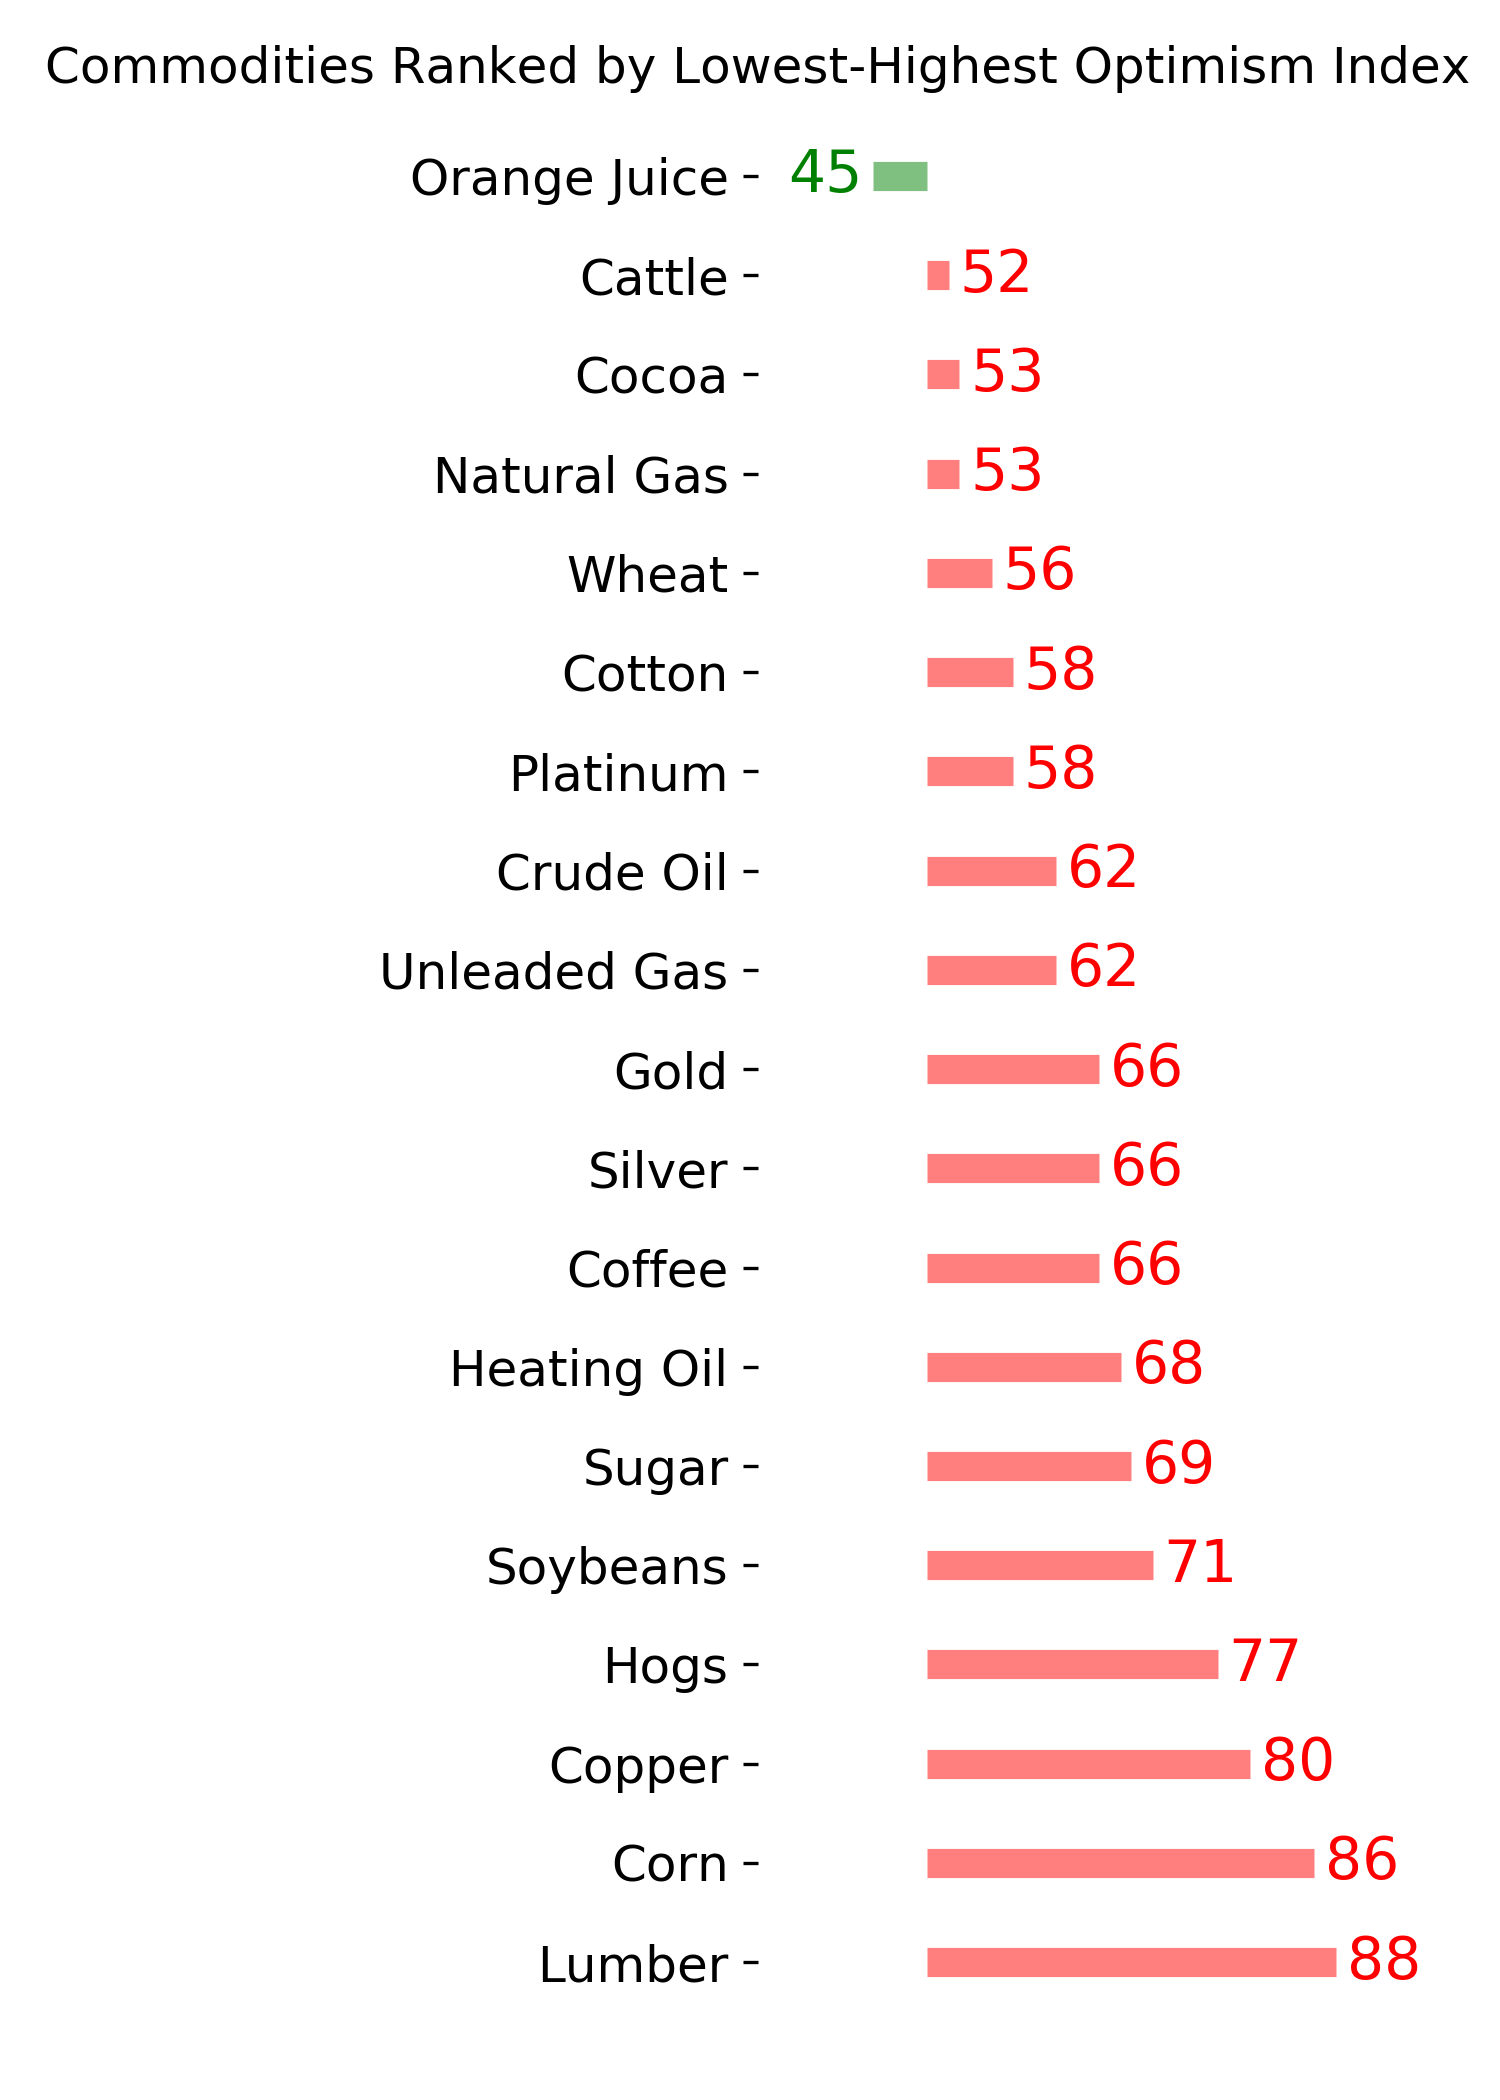
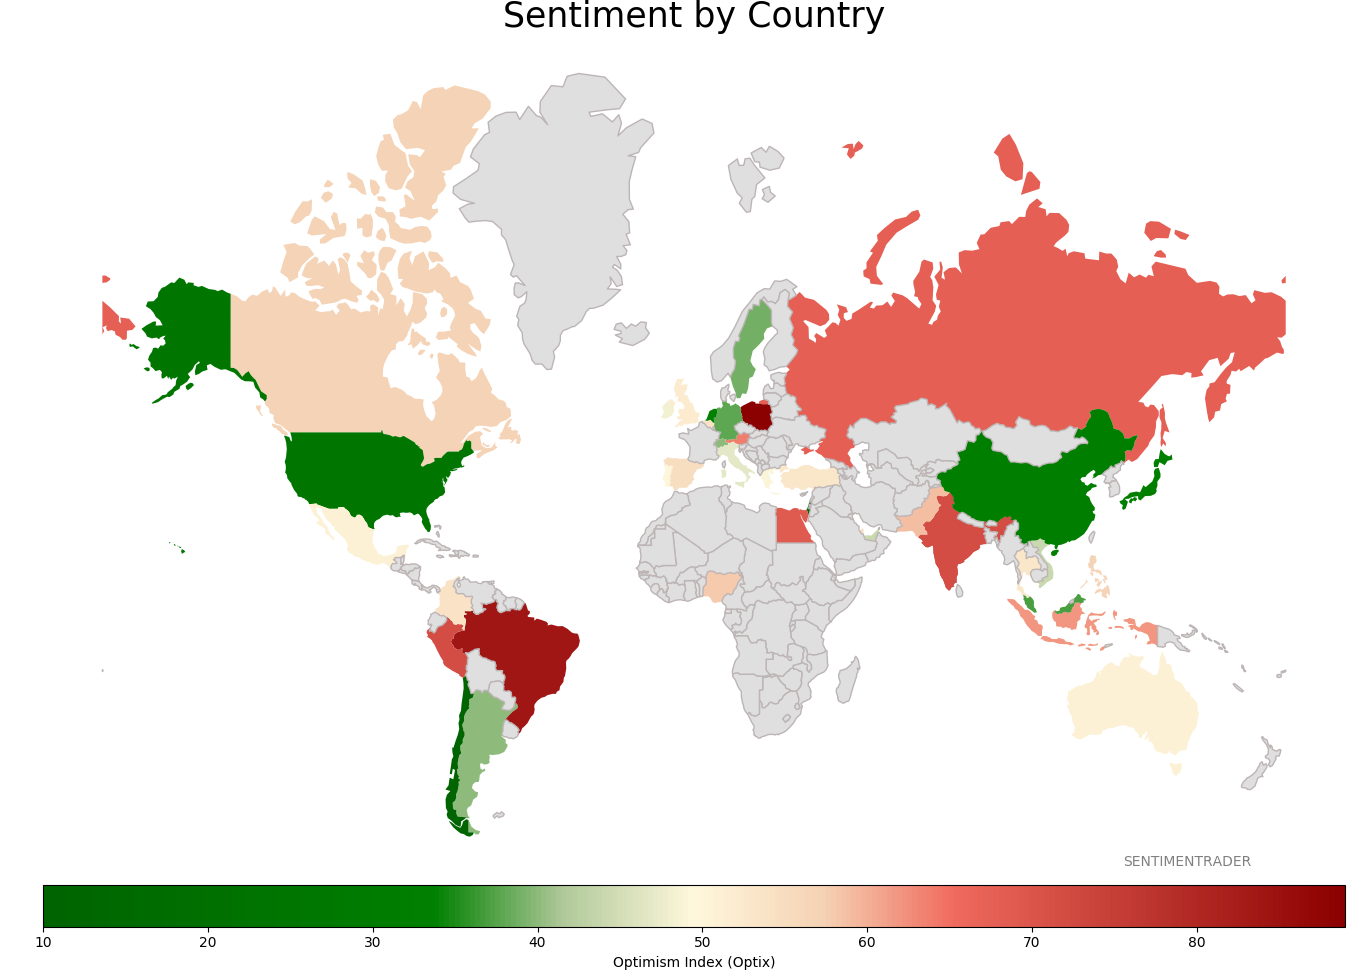
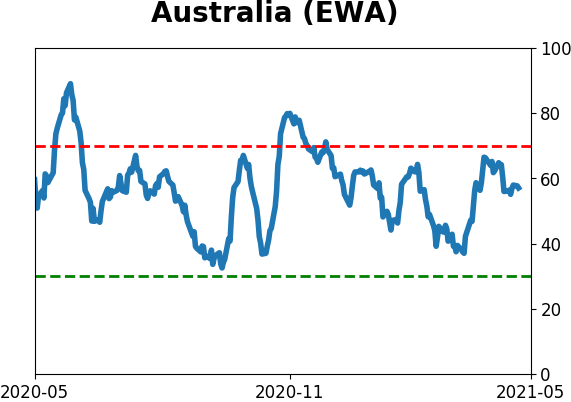
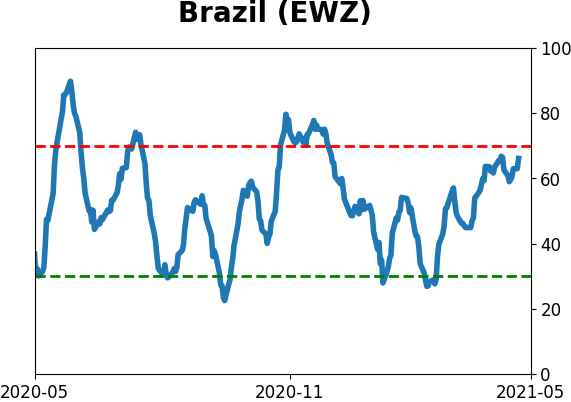
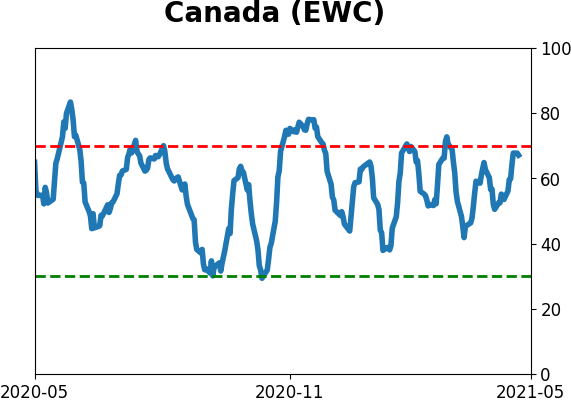
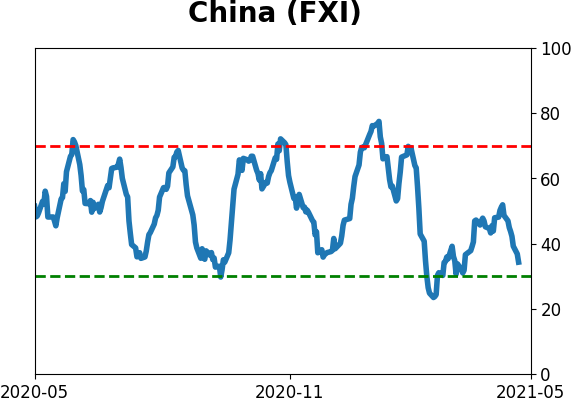
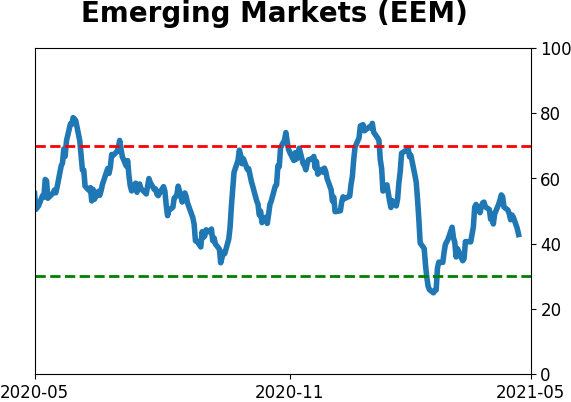
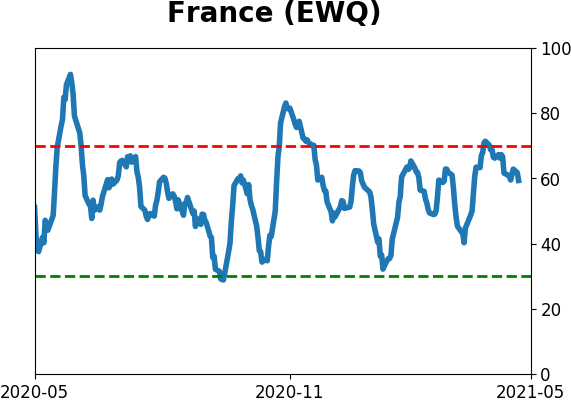
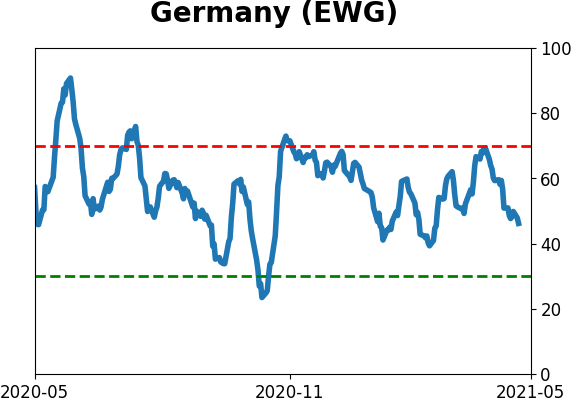
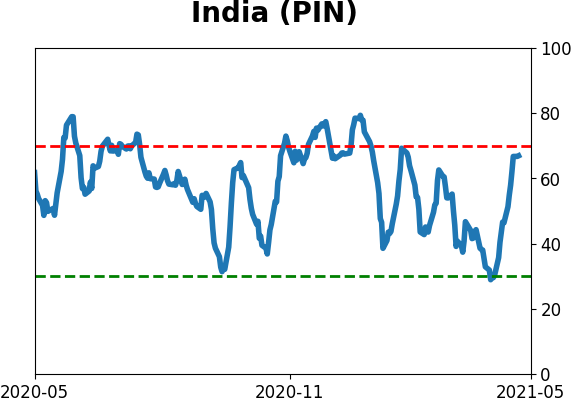
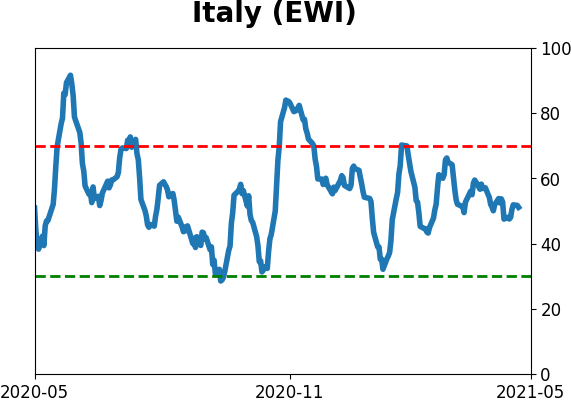
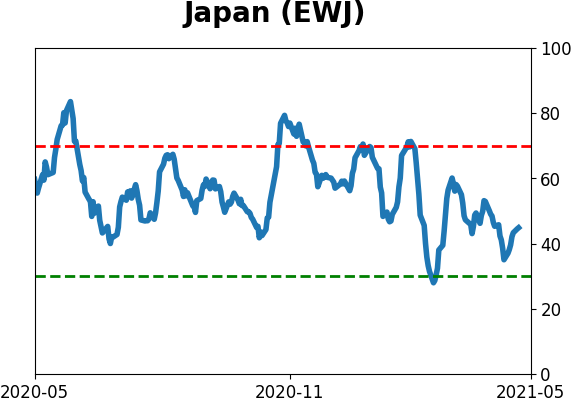
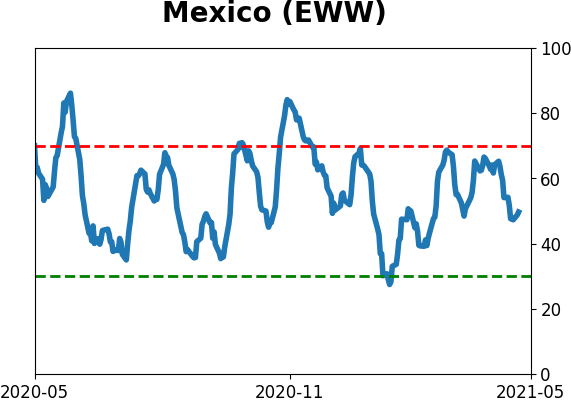
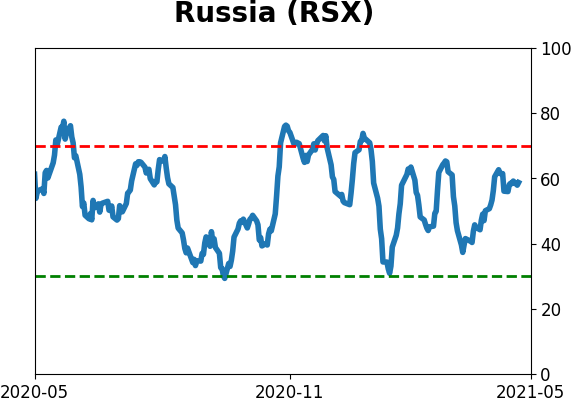
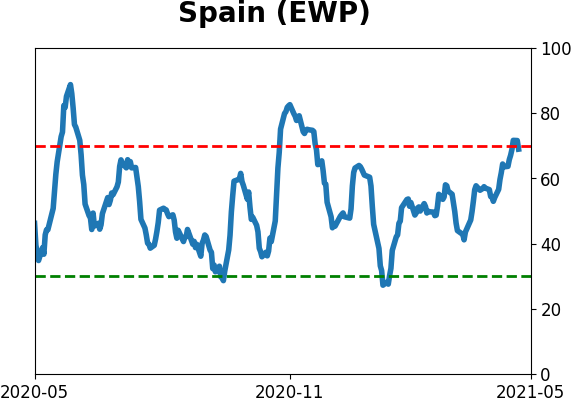
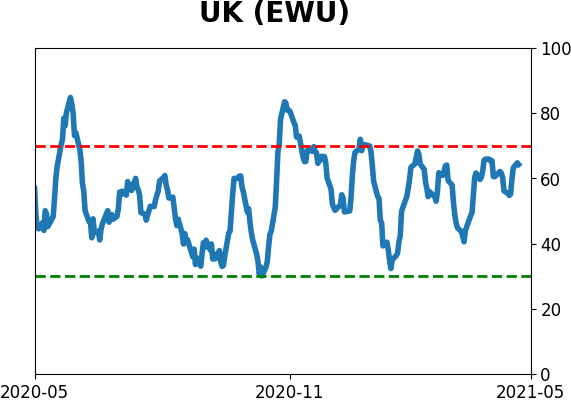
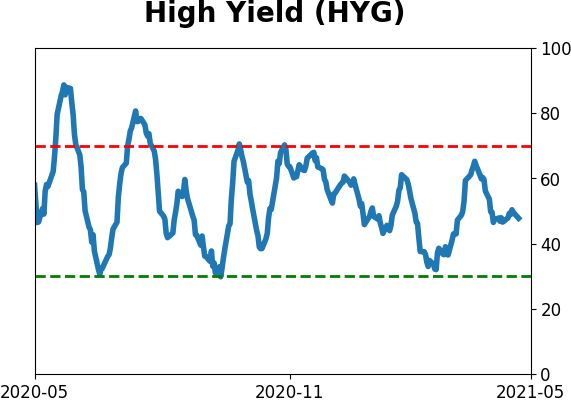
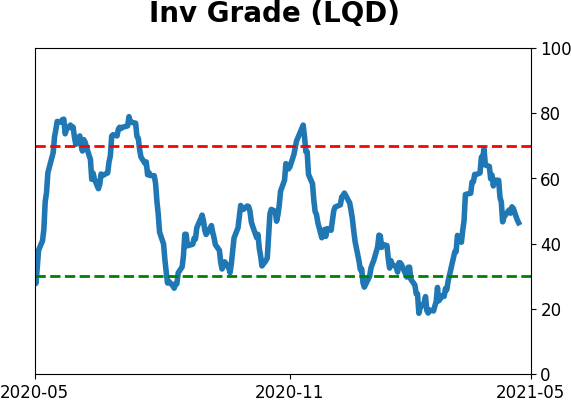
Sentiment Around The World
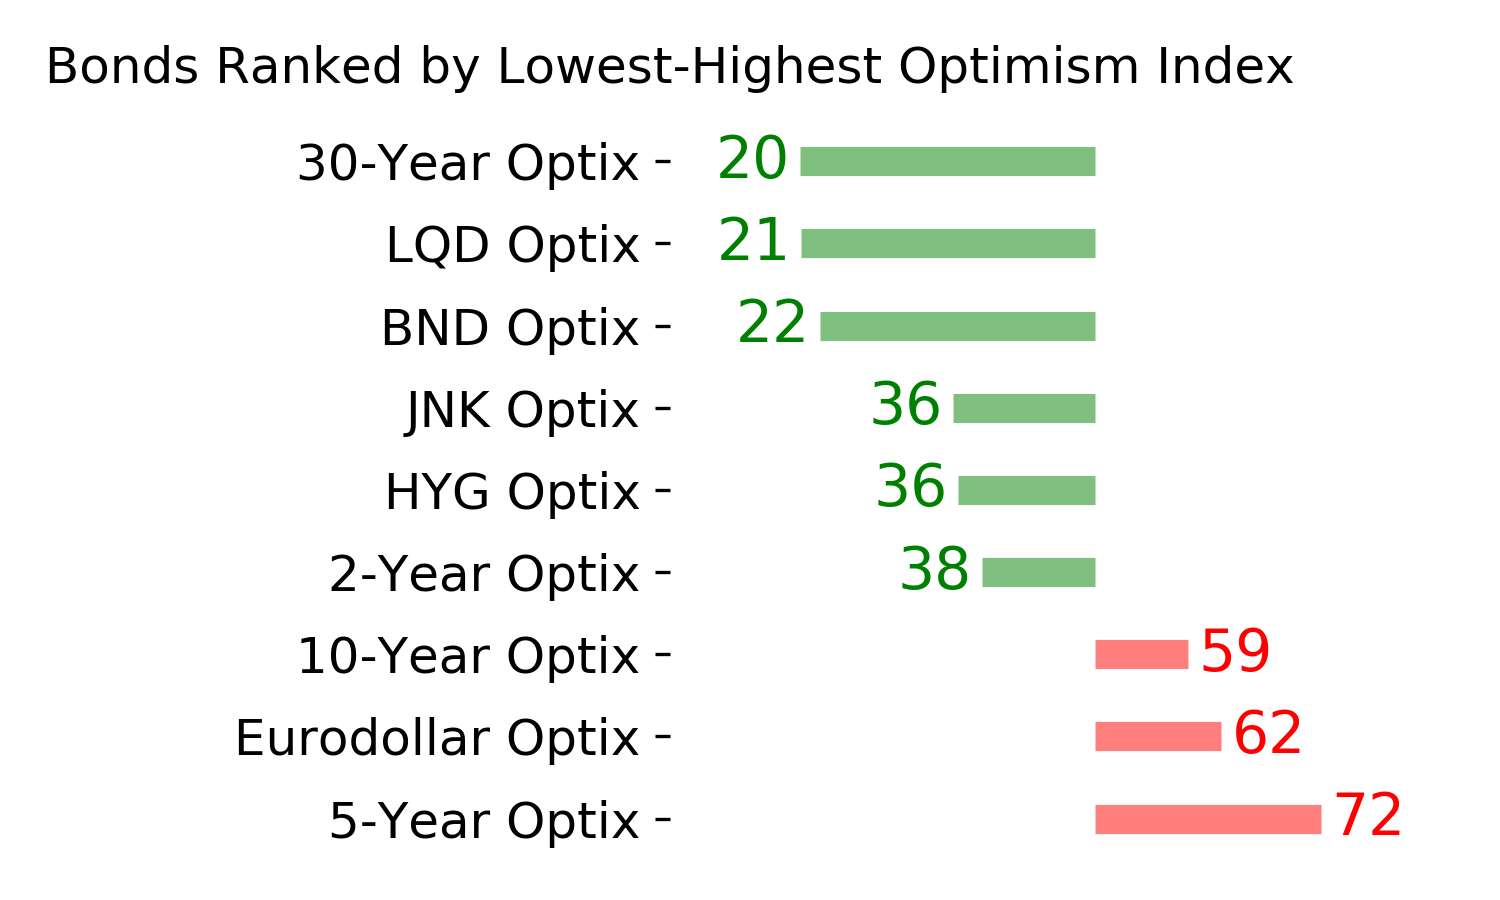
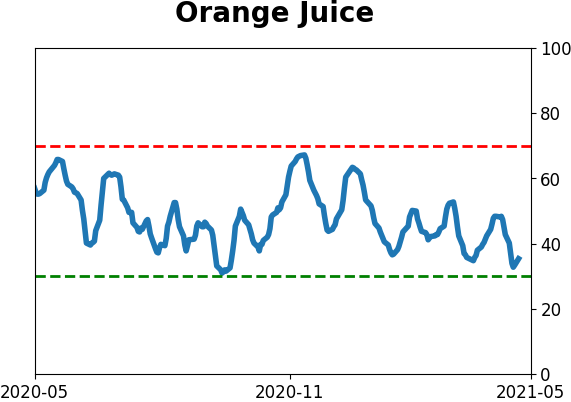
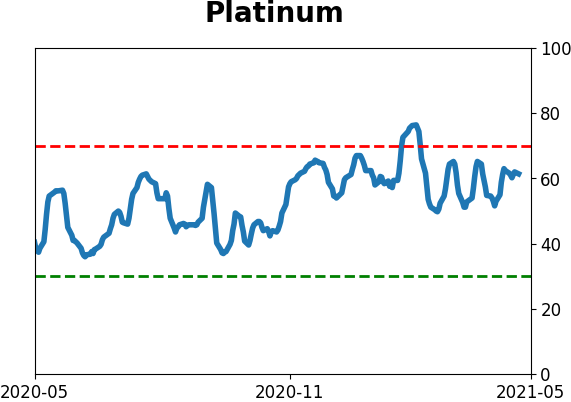
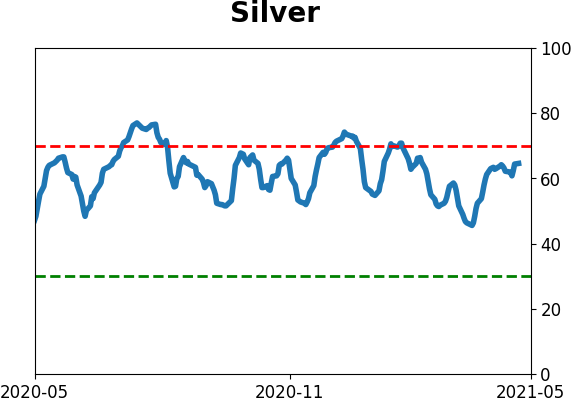
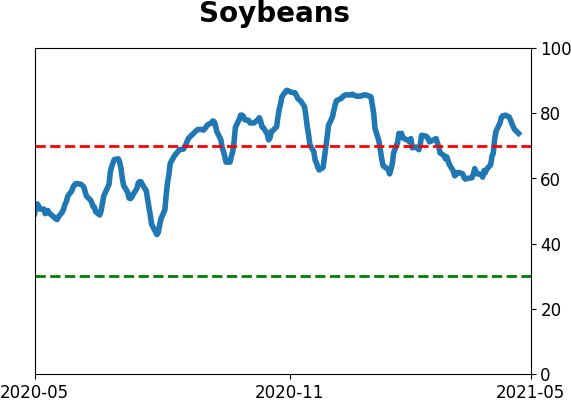
Optimism Index Thumbnails
|
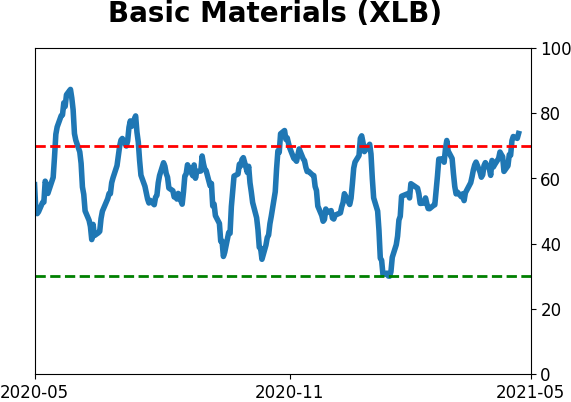
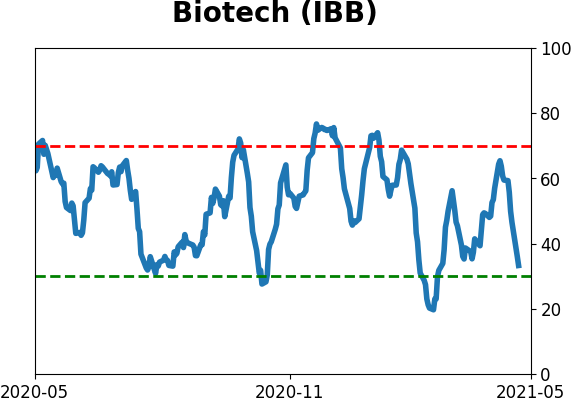
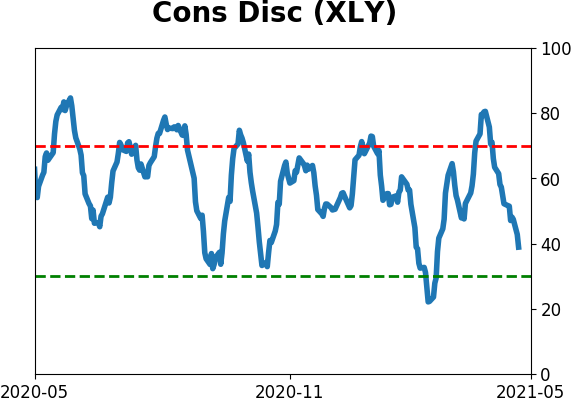
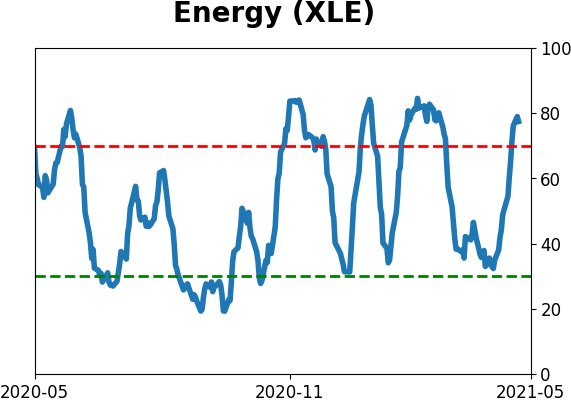
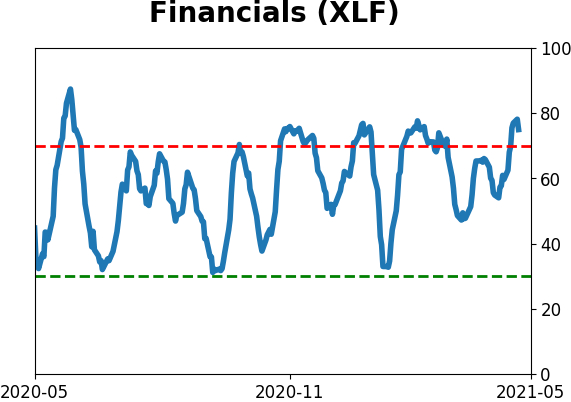
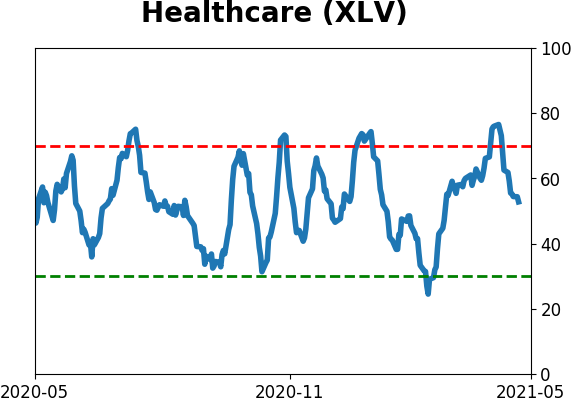
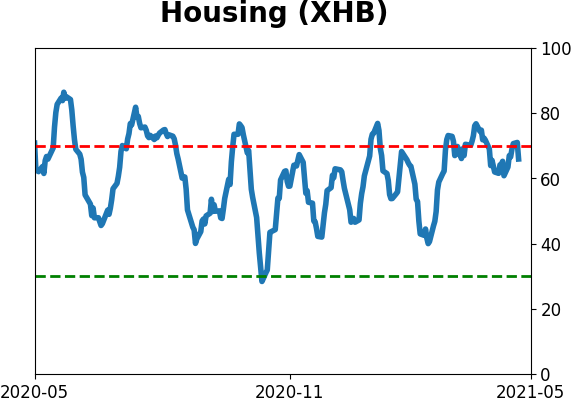
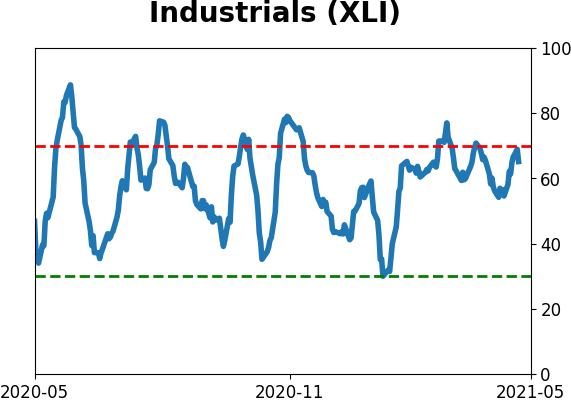
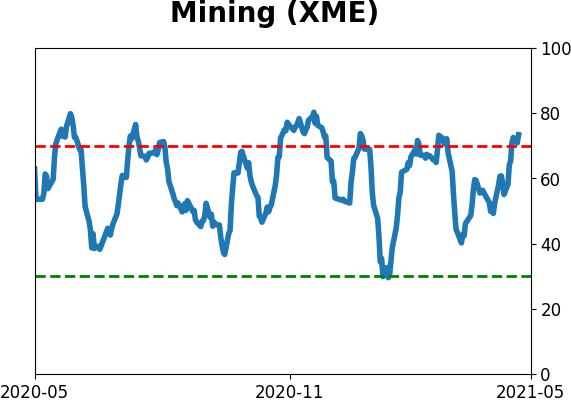
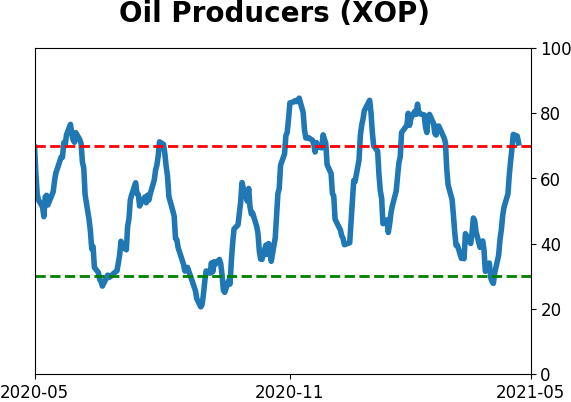
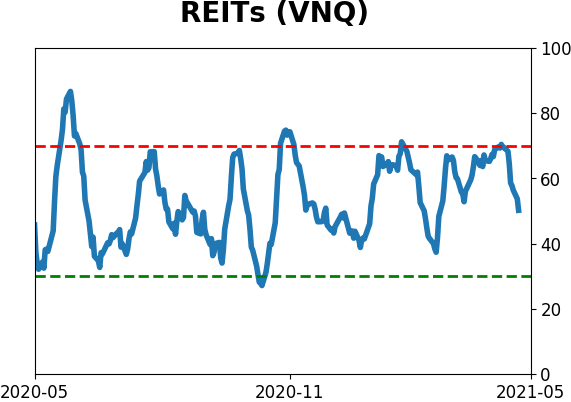
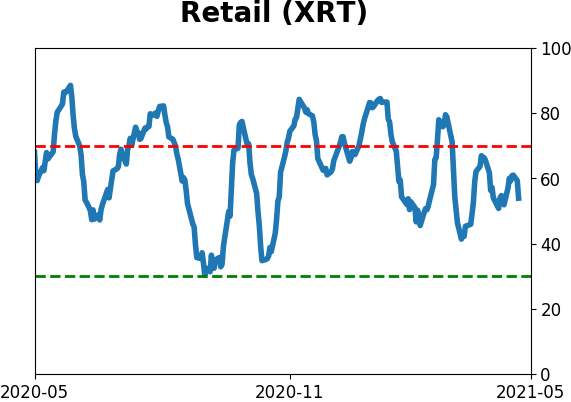
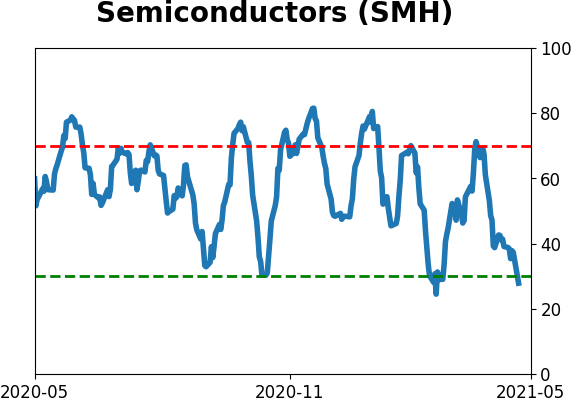
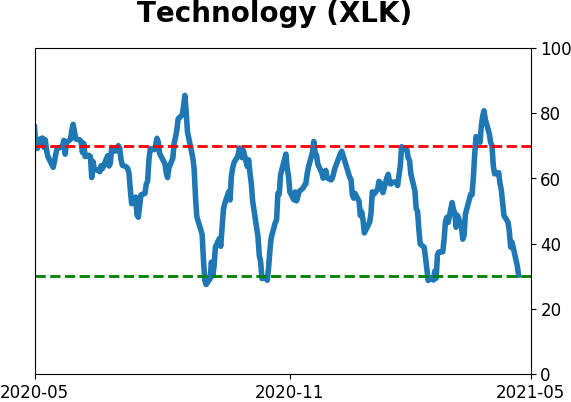
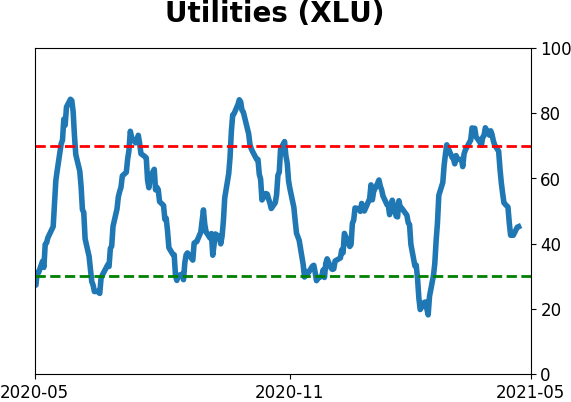
Sector ETF's - 10-Day Moving Average
|
|
|
Country ETF's - 10-Day Moving Average
|
|
|
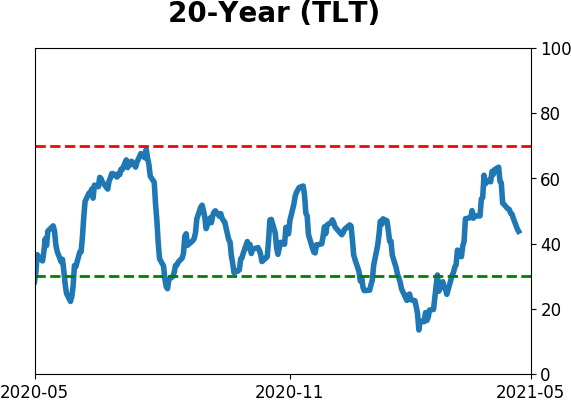
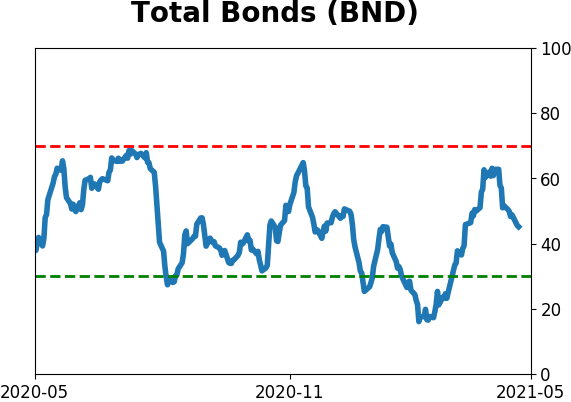
Bond ETF's - 10-Day Moving Average
|
|
|
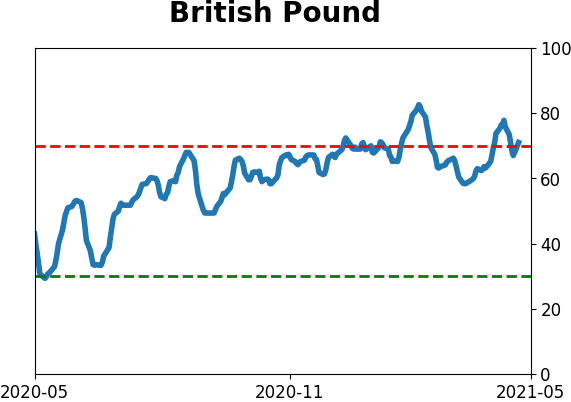
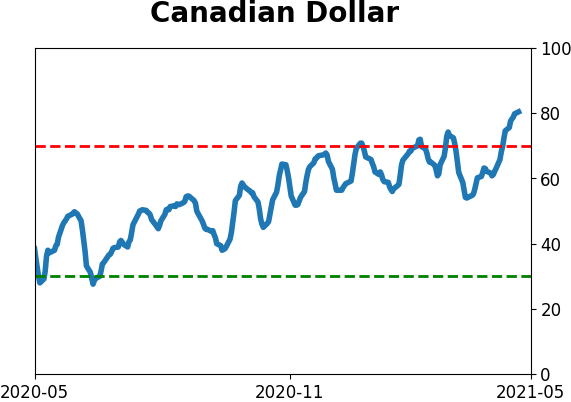
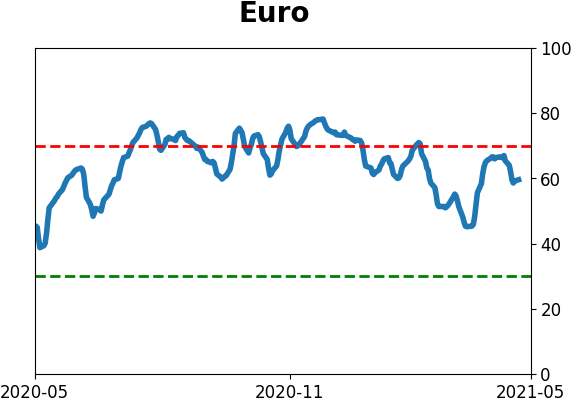
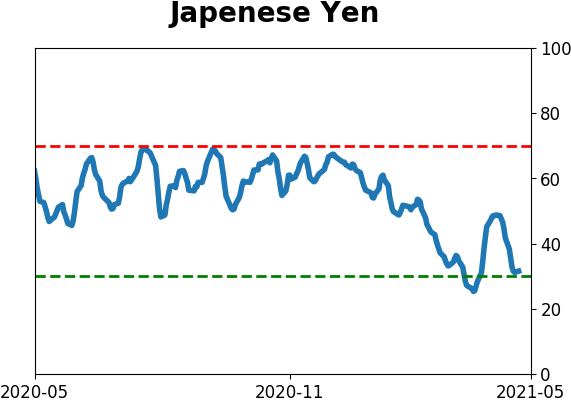
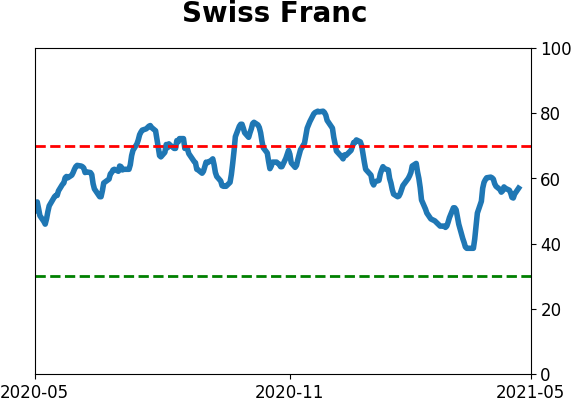
Currency ETF's - 5-Day Moving Average
|
|
|
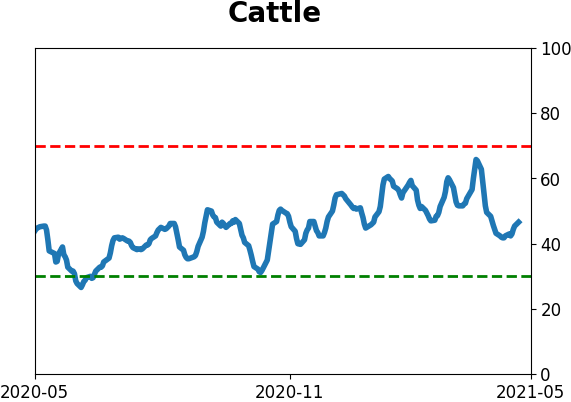
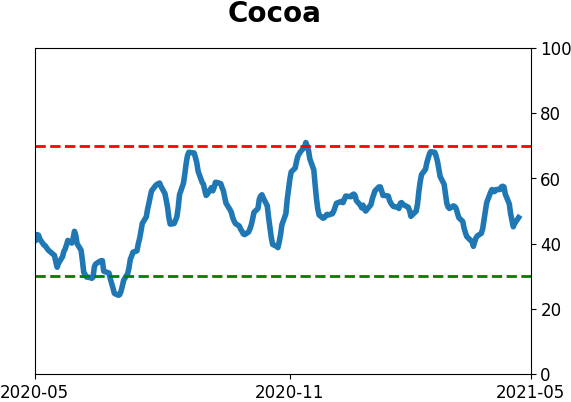
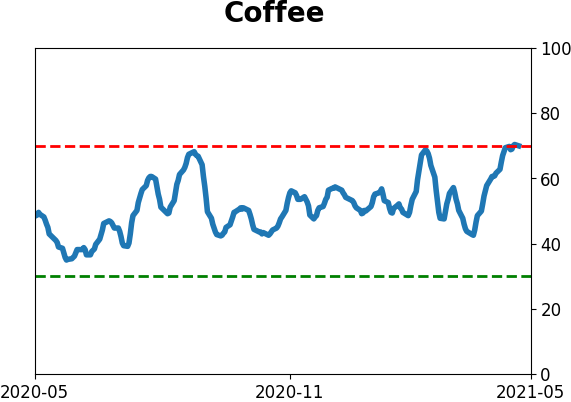
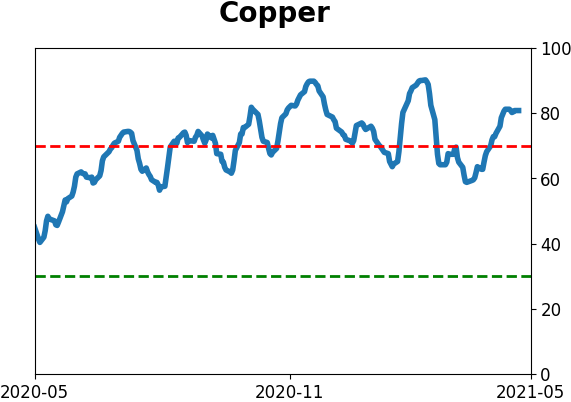
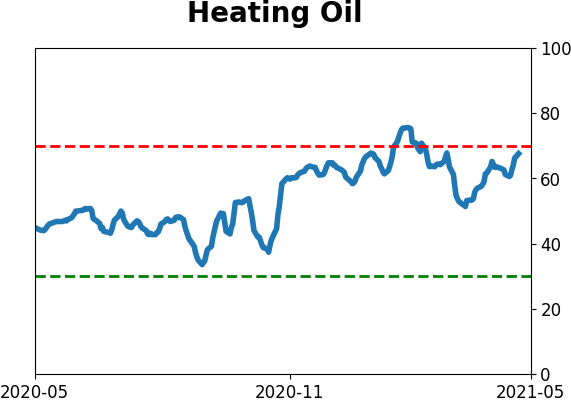
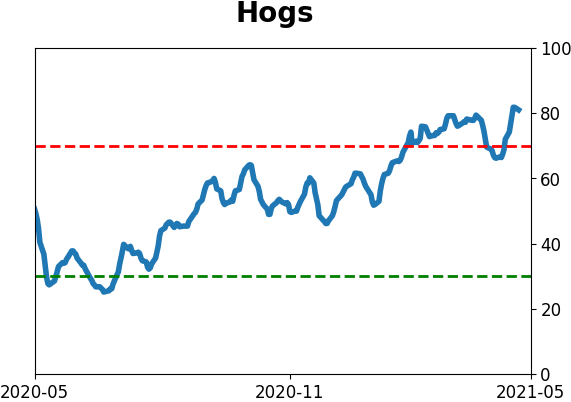
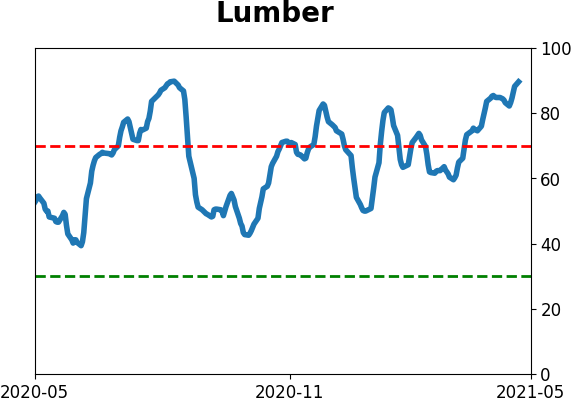
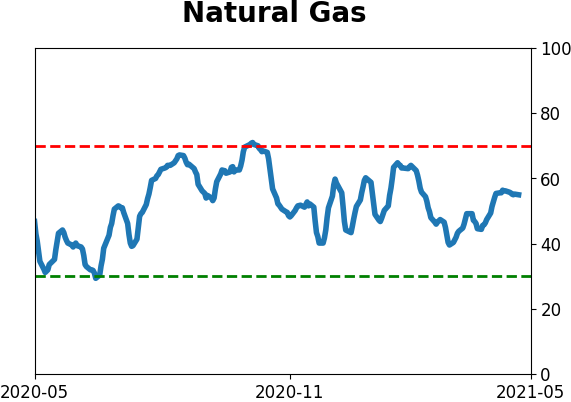
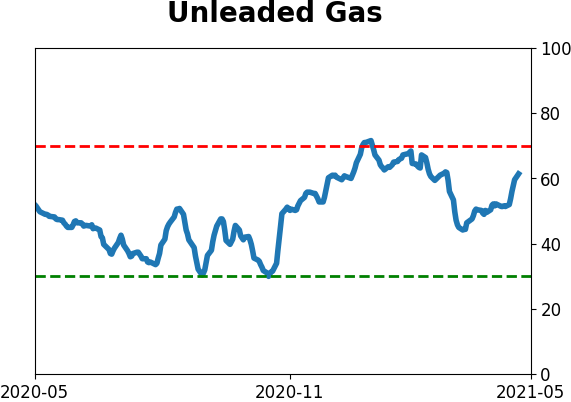
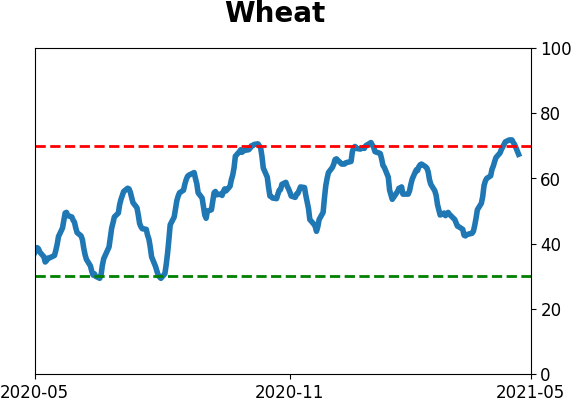
Commodity ETF's - 5-Day Moving Average
|
|