Headlines
|
|
One of the Dow's Best Starts in 125 Years:
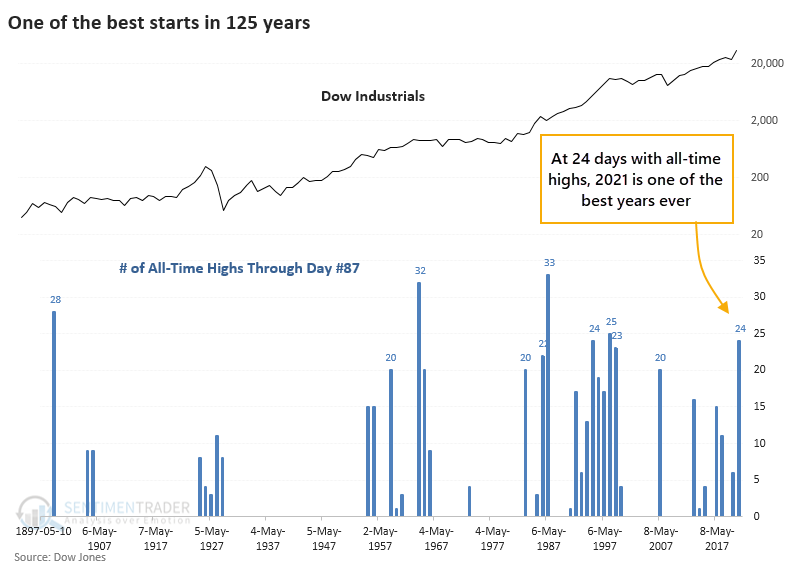
The Dow Industrials Average has closed at an all-time high on 24 sessions so far this year. That makes it the 6th best start to a year since 1896. Other times over the past 125 years when the Dow has had impressive starts, it often ran into some summer trouble.
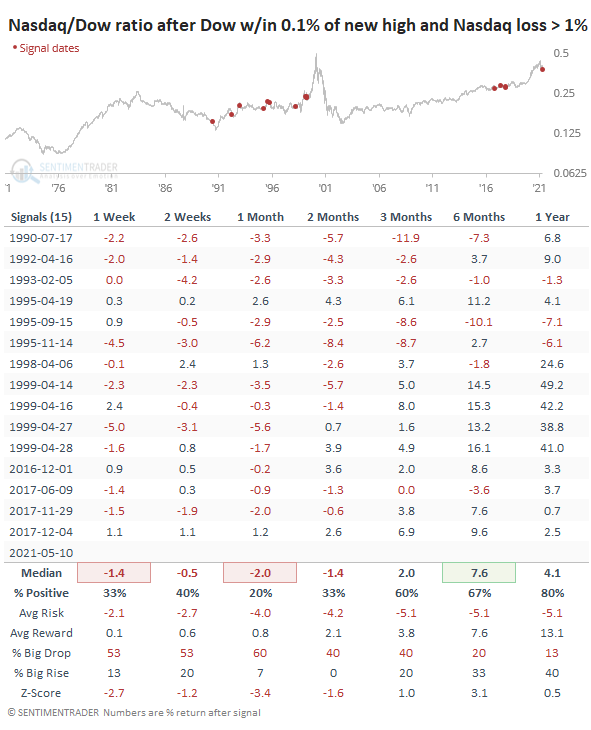
Tech tank: Until the last few minutes, the Dow Industrials almost managed to close at another all-time high. Weakness in the Nasdaq helped to sour sentiment, but the Dow still closed only 0.1% from its peak, while the Nasdaq Composite suffered its worst loss in months. The only day since 1971 when the Dow was so close to a high while the Nasdaq lost over 2% was April 14, 1999. The table below shows every time the Nasdaq lost 1% or more, along with the performance of the Nasdaq relative to the Dow. Investors were better served to hang out in Dow stocks instead of Nasdaq stocks after splits like this.
Bottom Line:
See the Outlook & Allocations page for more details on these summaries STOCKS: Weak sell
The extreme speculation registered in January and February is starting to get wrung out. Internal dynamics have mostly held up, so a return to neutral sentiment conditions would improve the forward risk/reward profile substantially. We're still a ways off from that. BONDS: Weak buy
Various parts of the market have been hit in recent weeks, with mild oversold conditions. The Bond Optimism Index is now about as low as it gets during healthy bond market environments. Fixed income isn't responding well, so that needs to be monitored in case it's transitioning to a longer-term negative market environment. GOLD: Weak buy
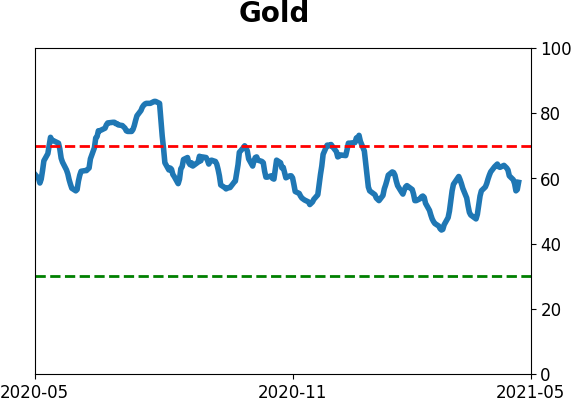
A dollar trying to rebound from a severe short position has weighed on gold and miners. The types of signals they've given in recent weeks, within the context of their recent surge, have usually resulted in higher prices over a medium- to long-term time frame. Like bonds, gold and miners aren't responding very well, and this needs to be monitored.
|
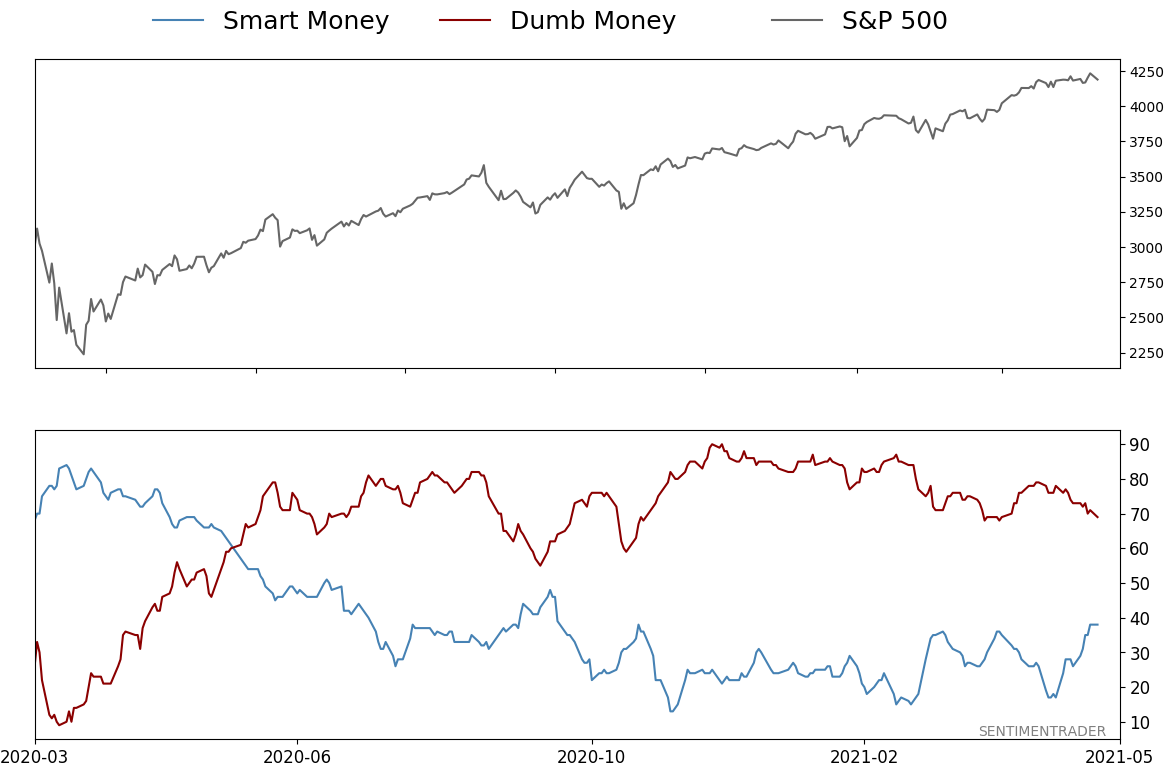
Smart / Dumb Money Confidence
|
Smart Money Confidence: 38%
Dumb Money Confidence: 69%
|
|
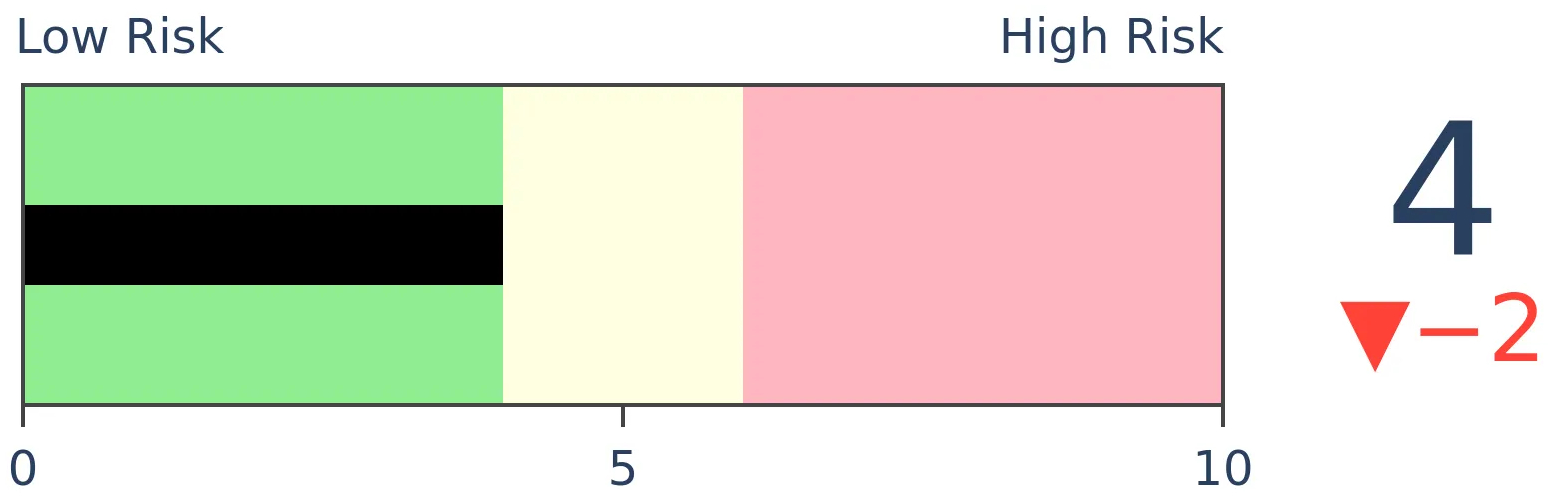
Risk Levels
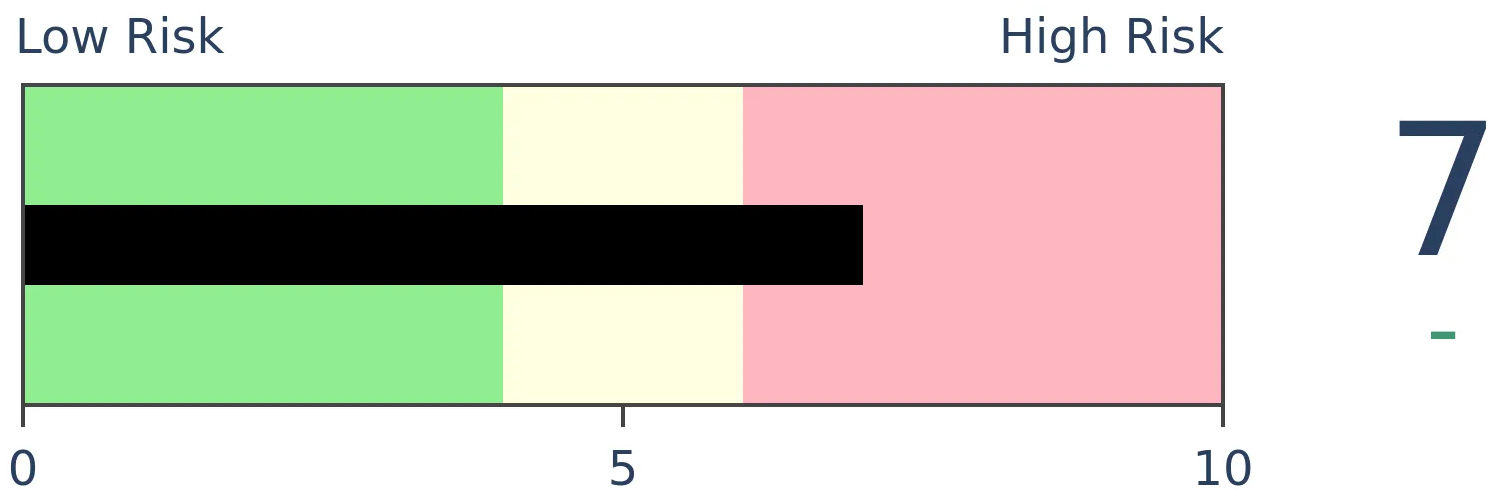
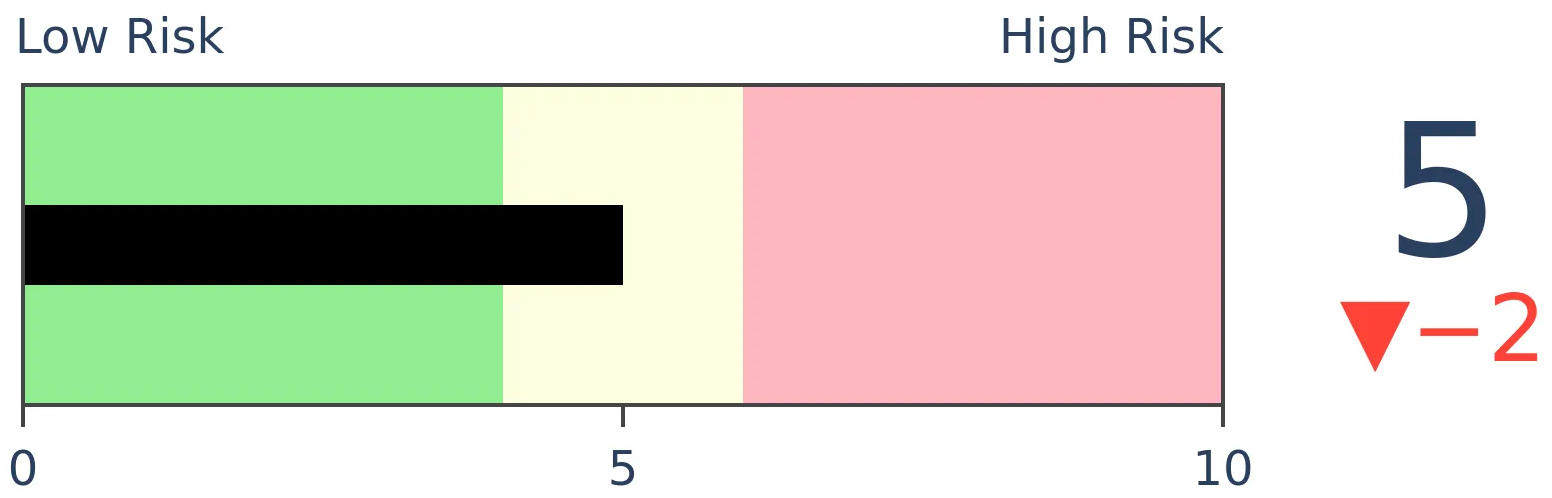
Stocks Short-Term
|
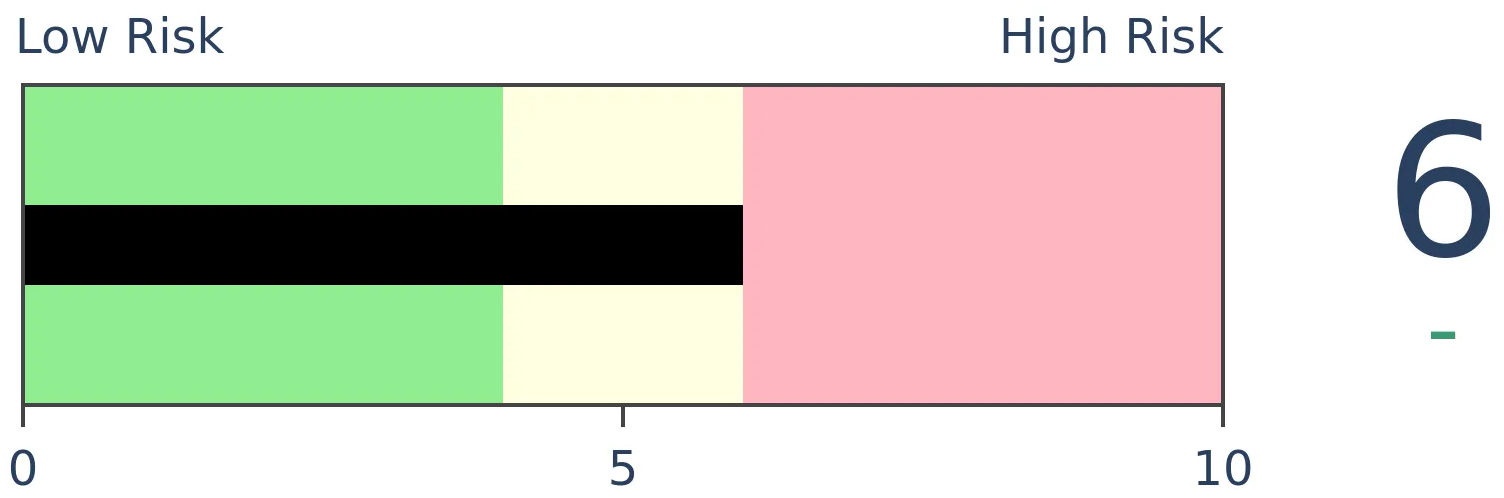
Stocks Medium-Term
|
|
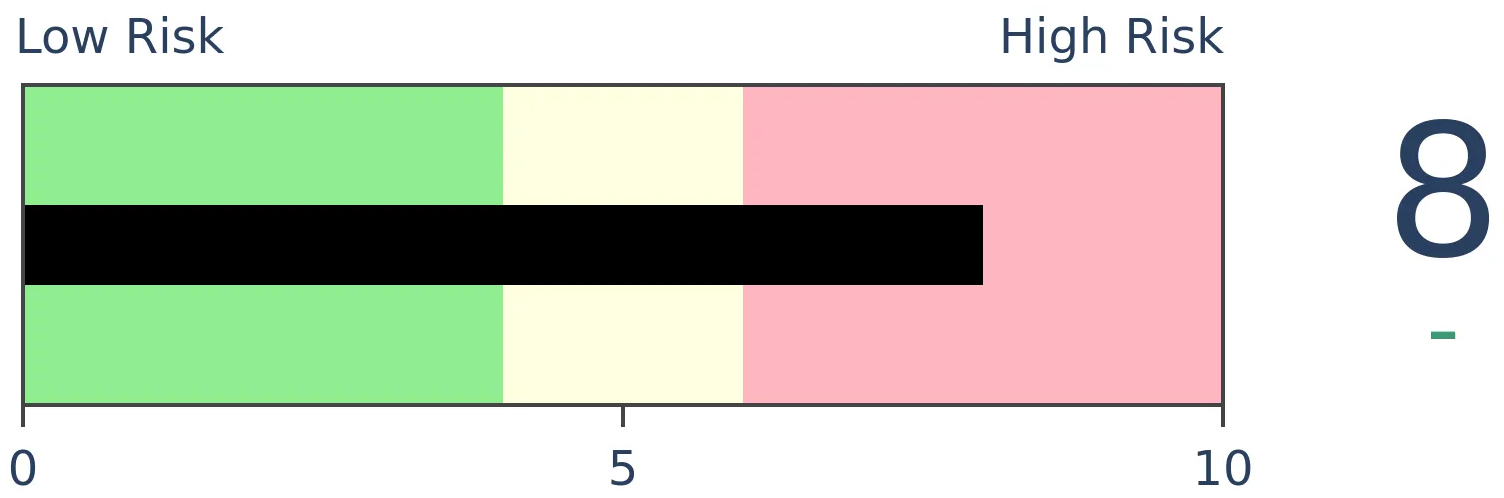
Bonds
|
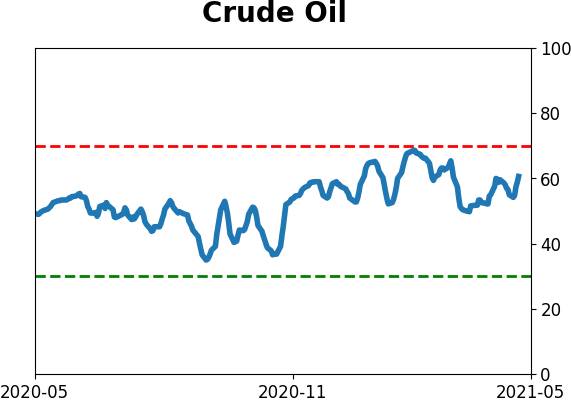
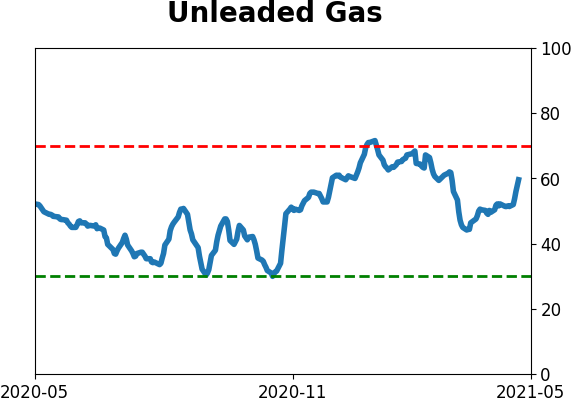
Crude Oil
|
|
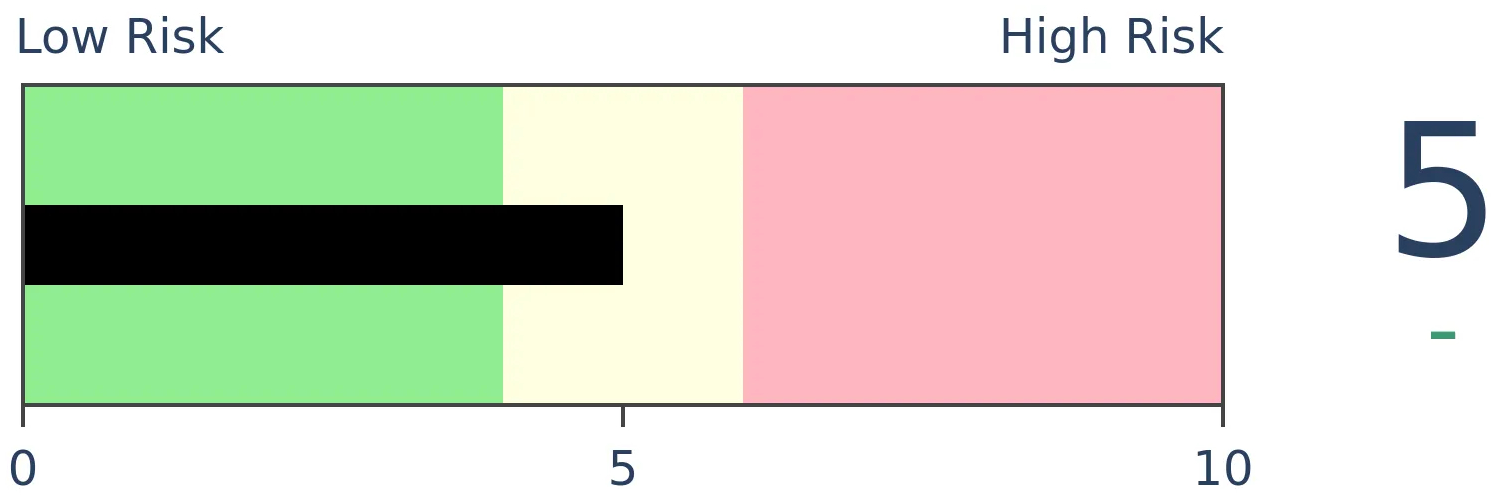
Gold
|
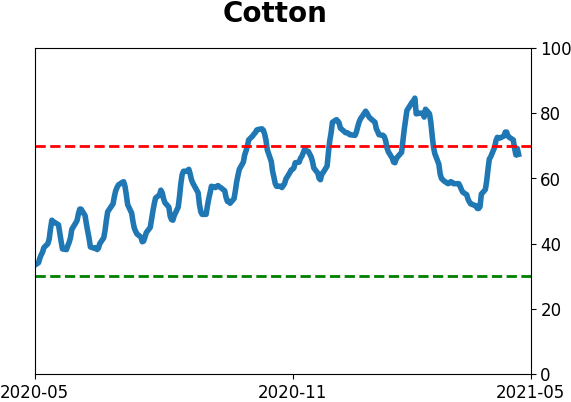
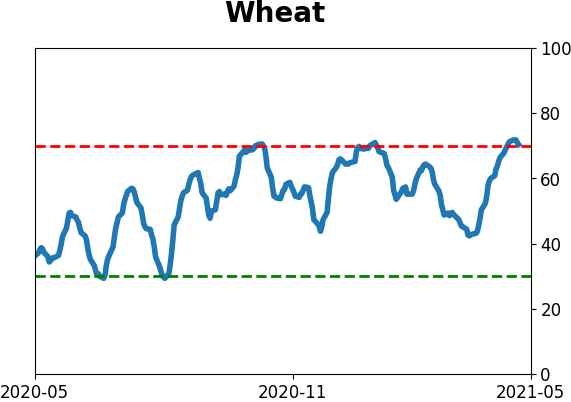
Agriculture
|
|
Research
BOTTOM LINE
The Dow Industrials Average has closed at an all-time high on 24 sessions so far this year. That makes it the 6th best start to a year since 1896. Other times over the past 125 years when the Dow has had impressive starts, it often ran into some summer trouble.
FORECAST / TIMEFRAME
None
|
The Dow just keeps chugging along.
Despite some tumult under the surface and weakness in tech stocks and other speculative areas, the Dow Industrials Average has held up its reputation as a stalwart. The venerable index has been consistently strong enough to score 24 record closing highs this year alone. Through trading day #87, this is tied for the 6th-best year since 1896.
The big question is always, "So what?"
WHAT BIG MOMENTUM MEANT FOR FUTURE RETURNS
For investors, the most important factor isn't where we've been; it's what it might mean going forward. The table below helps answer that, as it shows returns in the Dow after the handful of other years with more than 20 all-time highs through trading day #87.
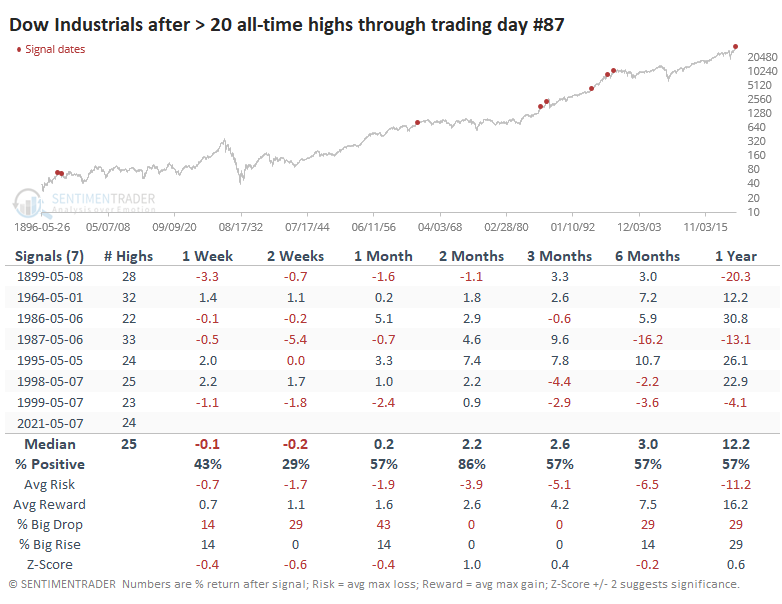
It was a bit of a struggle for the Dow to hold its momentum in the shorter-term, and even medium-term returns were mixed. Granted, relying on price action from 1899 - the year humans had just invented the paperclip - might be a stretch.
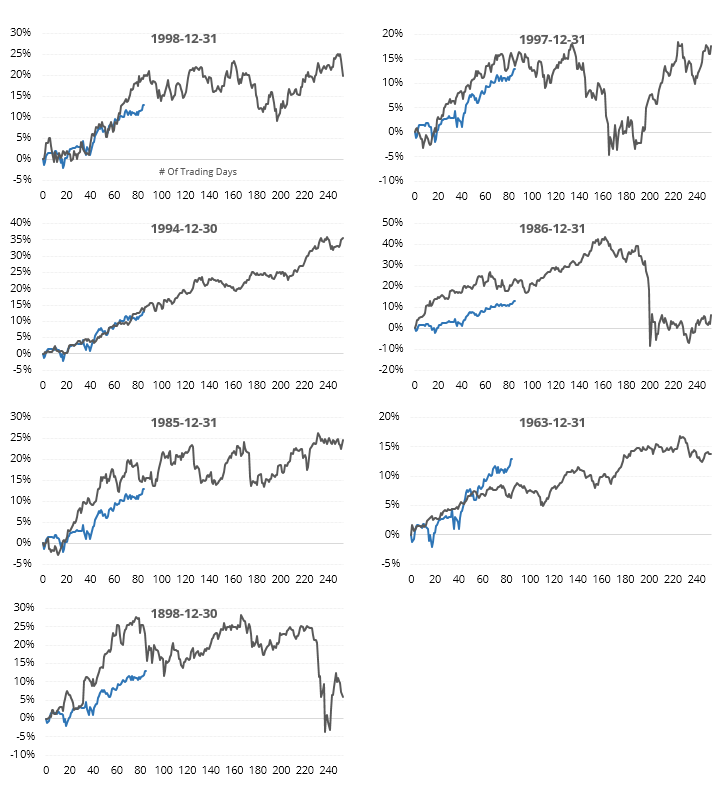
Looking at the average price path from those years, we can see the struggles once the year reached its current point.
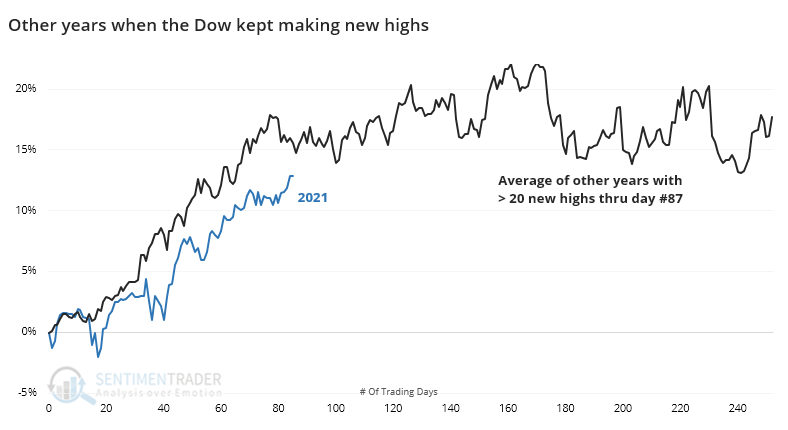
That's just an average, though, and looking at the individual instances, there was a do-or-die tendency. A couple of them took off on massive rallies; the rest petered out. It's interesting that out of 7 instances, 3 of them ended up in a crash scenario within the year.
GENERATING A LARGER SAMPLE
If we relax the parameters to 15 or more closing highs year-to-date, we can generate a larger sample size. While these might be less of a direct comparison, they at least give a clue to what happened during years with consistent upside momentum to start a year.
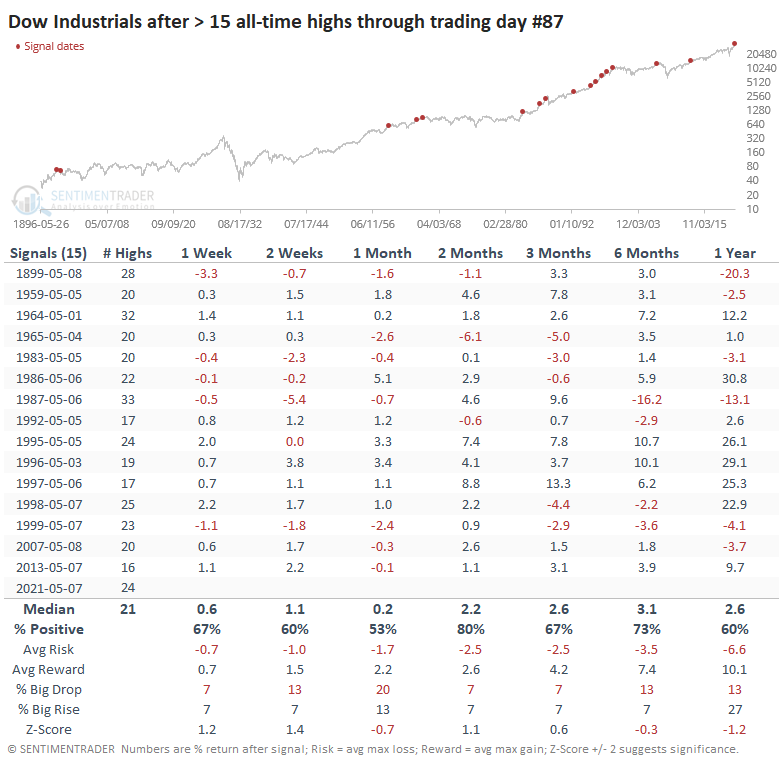
Here, the returns are more prosaic, but even with a doubling of the precedents, returns over the next month were mediocre. Up to 2 months later, average risk was higher than average reward.
In recent decades, like from 1995 forward, there were no losses over the next couple of months, with a few large gains. And that mid-1990s stretch also showed returns of more than 22% over the next year.
We tend to place more weight on recent occurrences, and the only two that are fresh in investors' memories are 2007 and 2013, both of which saw further gains during May, then a stumble into June before recovering with okay gains the rest of the year.
Like many other studies we've published showing historic momentum and a failure of anything but trend-following lately, this one suggests a flat or poor risk/reward setup for new capital over the short- to medium-term but mostly good longer-term.
Active Studies
| Time Frame | Bullish | Bearish | | Short-Term | 0 | 0 | | Medium-Term | 1 | 11 | | Long-Term | 11 | 4 |
|
Indicators at Extremes
Portfolio
| Position | Description | Weight % | Added / Reduced | Date | | Stocks | RSP | 0.0 | Reduced 4.9% | 2021-04-22 | | Bonds | 30.0% BND, 8.8% SCHP | 37.9 | Added 15.1% | 2021-02-18 | | Commodities | GCC | 2.5 | Reduced 2.1%
| 2020-09-04 | | Precious Metals | GDX | 9.8 | Added 0.1% | 2021-02-18 | | Special Situations | 4.3% XLE, 2.2% PSCE | 6.5 | Reduced 5.6% | 2021-04-22 | | Cash | | 43.3 | | |
|
Updates (Changes made today are underlined)
I've made no adjustments for months, as the situation remained essentially stuck - energy was doing what it should, sentiment in the broader market was ridiculously stretched but with no major warning signs, and sentiment toward gold and bonds appeared overdone on the pessimistic side. Those conditions have started to reverse a bit, so I further reduced my risk. There are still no major warning signs, but I'm getting increasingly uncomfortable and would prefer to sit safely in cash and wait for better risk/reward opportunities. RETURN YTD: 8.6% 2020: 8.1%, 2019: 12.6%, 2018: 0.6%, 2017: 3.8%, 2016: 17.1%, 2015: 9.2%, 2014: 14.5%, 2013: 2.2%, 2012: 10.8%, 2011: 16.5%, 2010: 15.3%, 2009: 23.9%, 2008: 16.2%, 2007: 7.8%
|
|
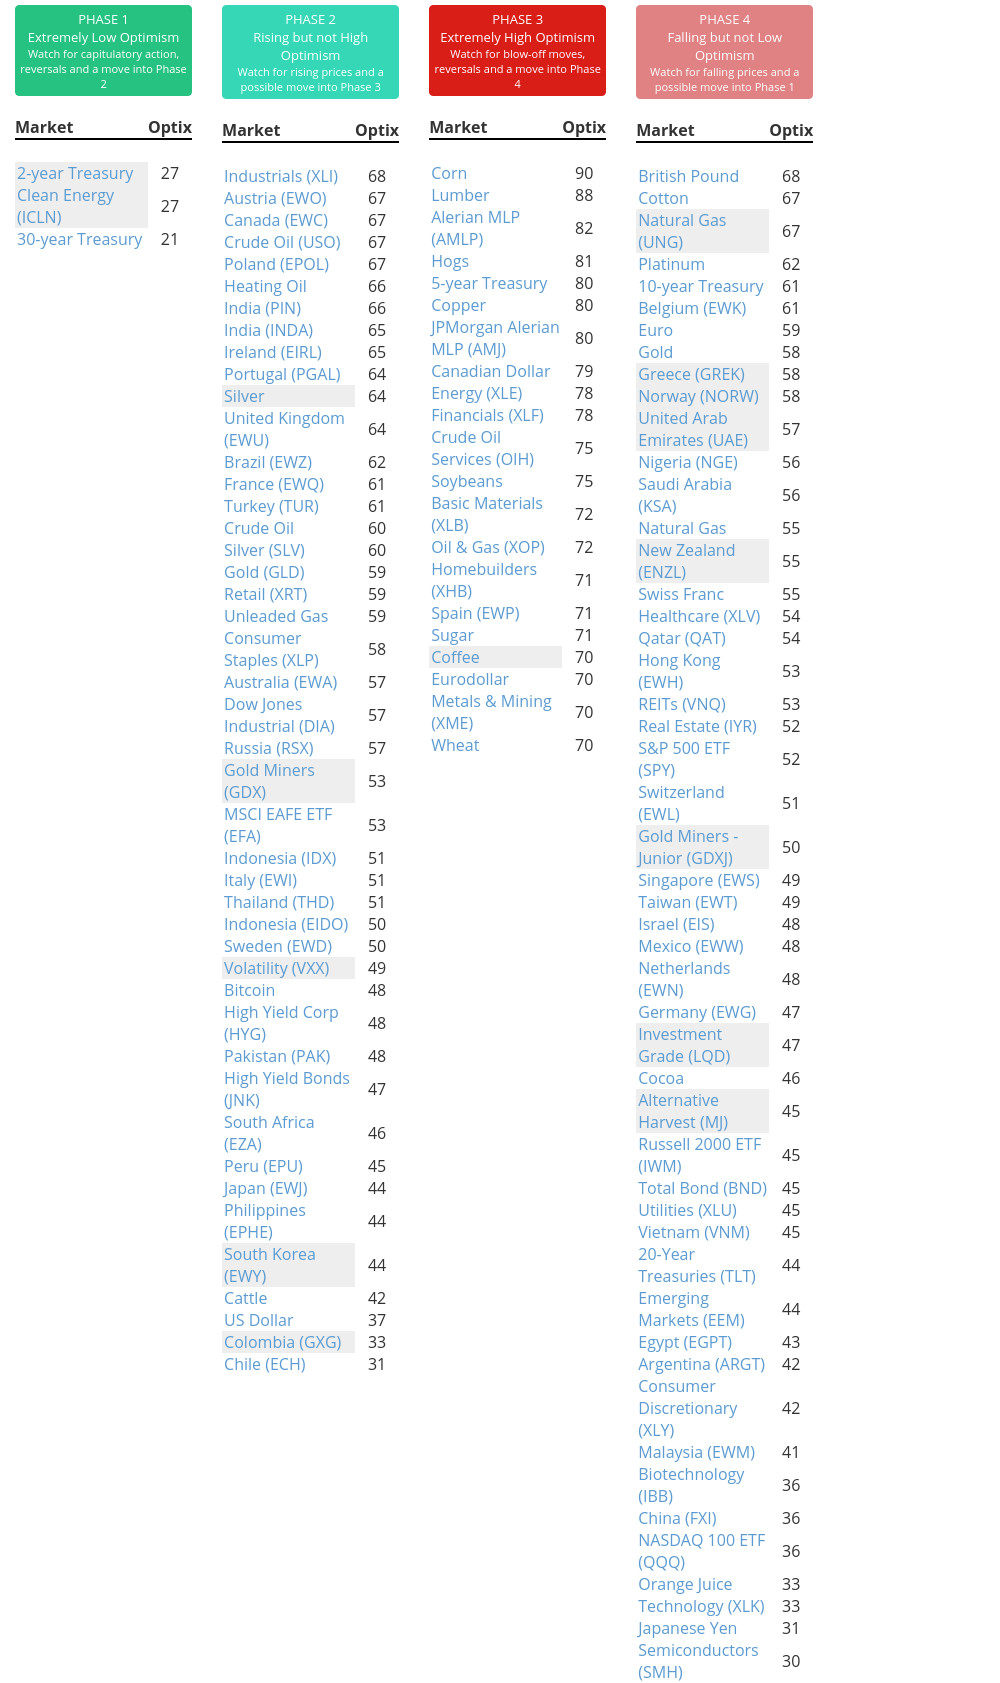
Phase Table
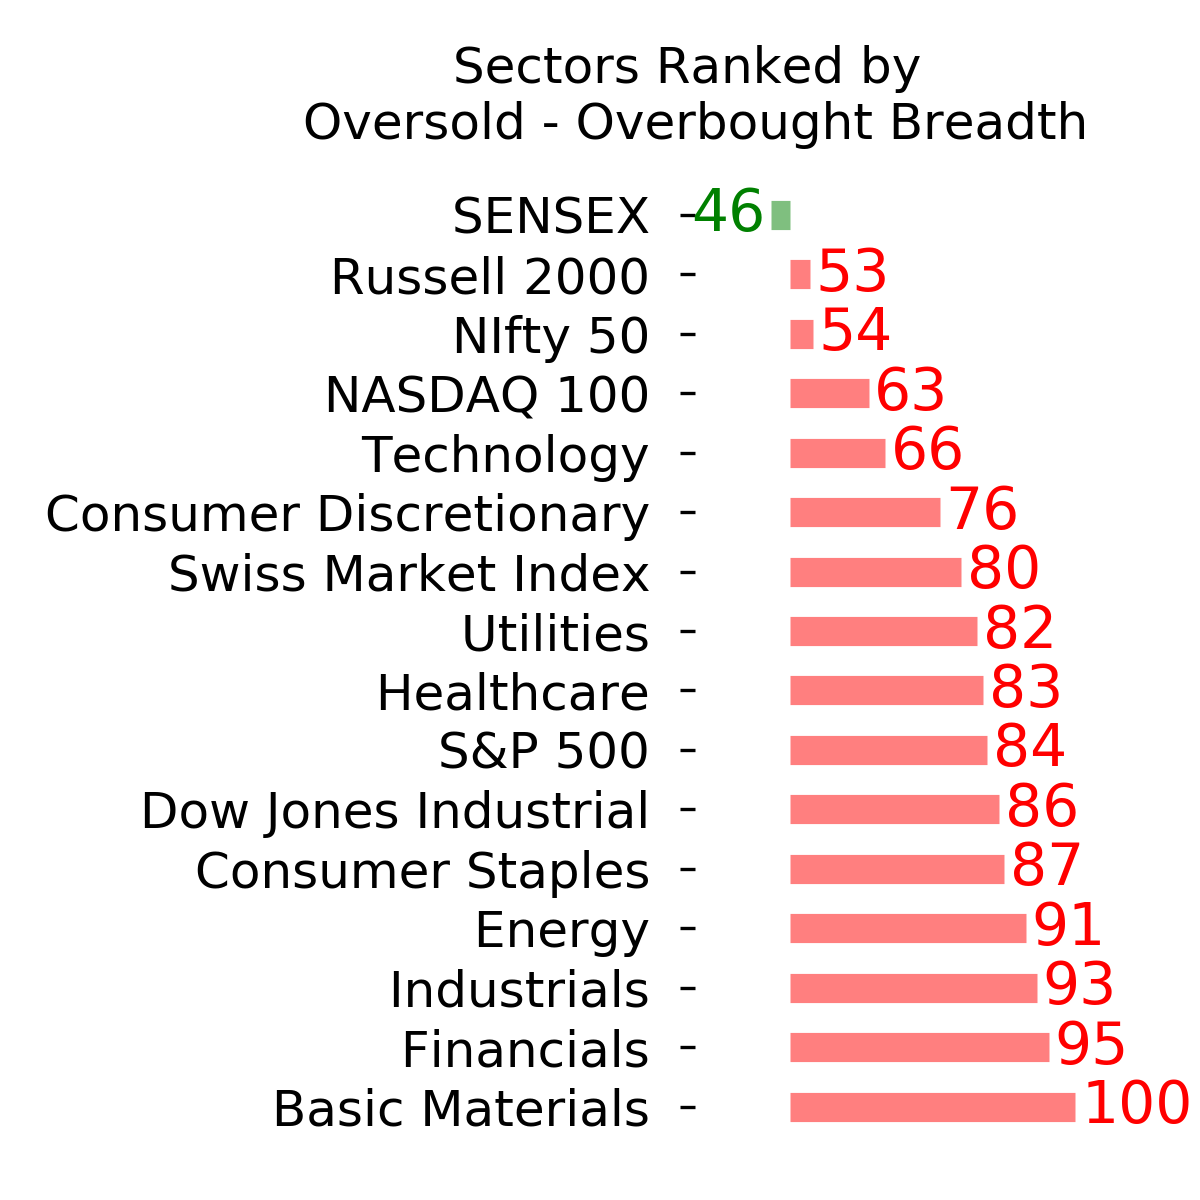
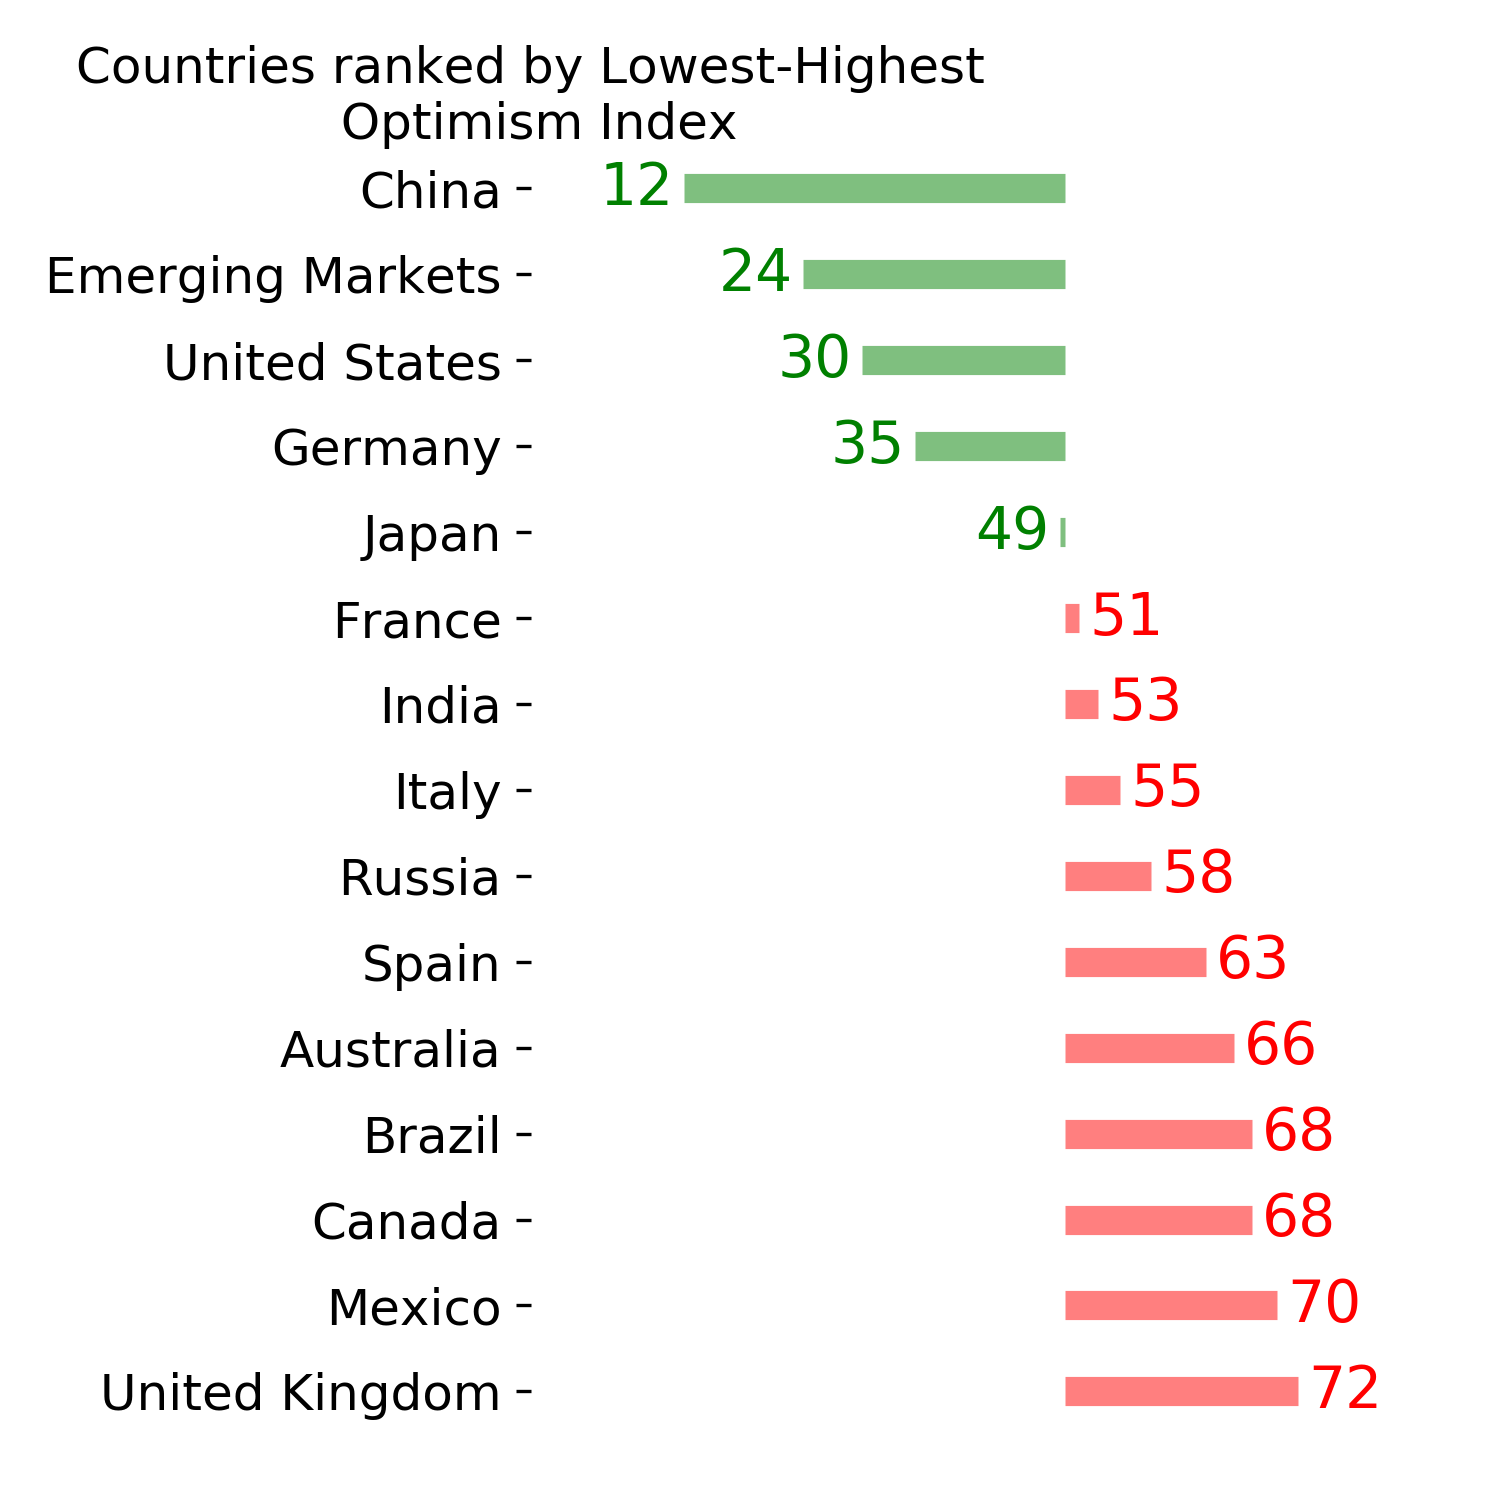
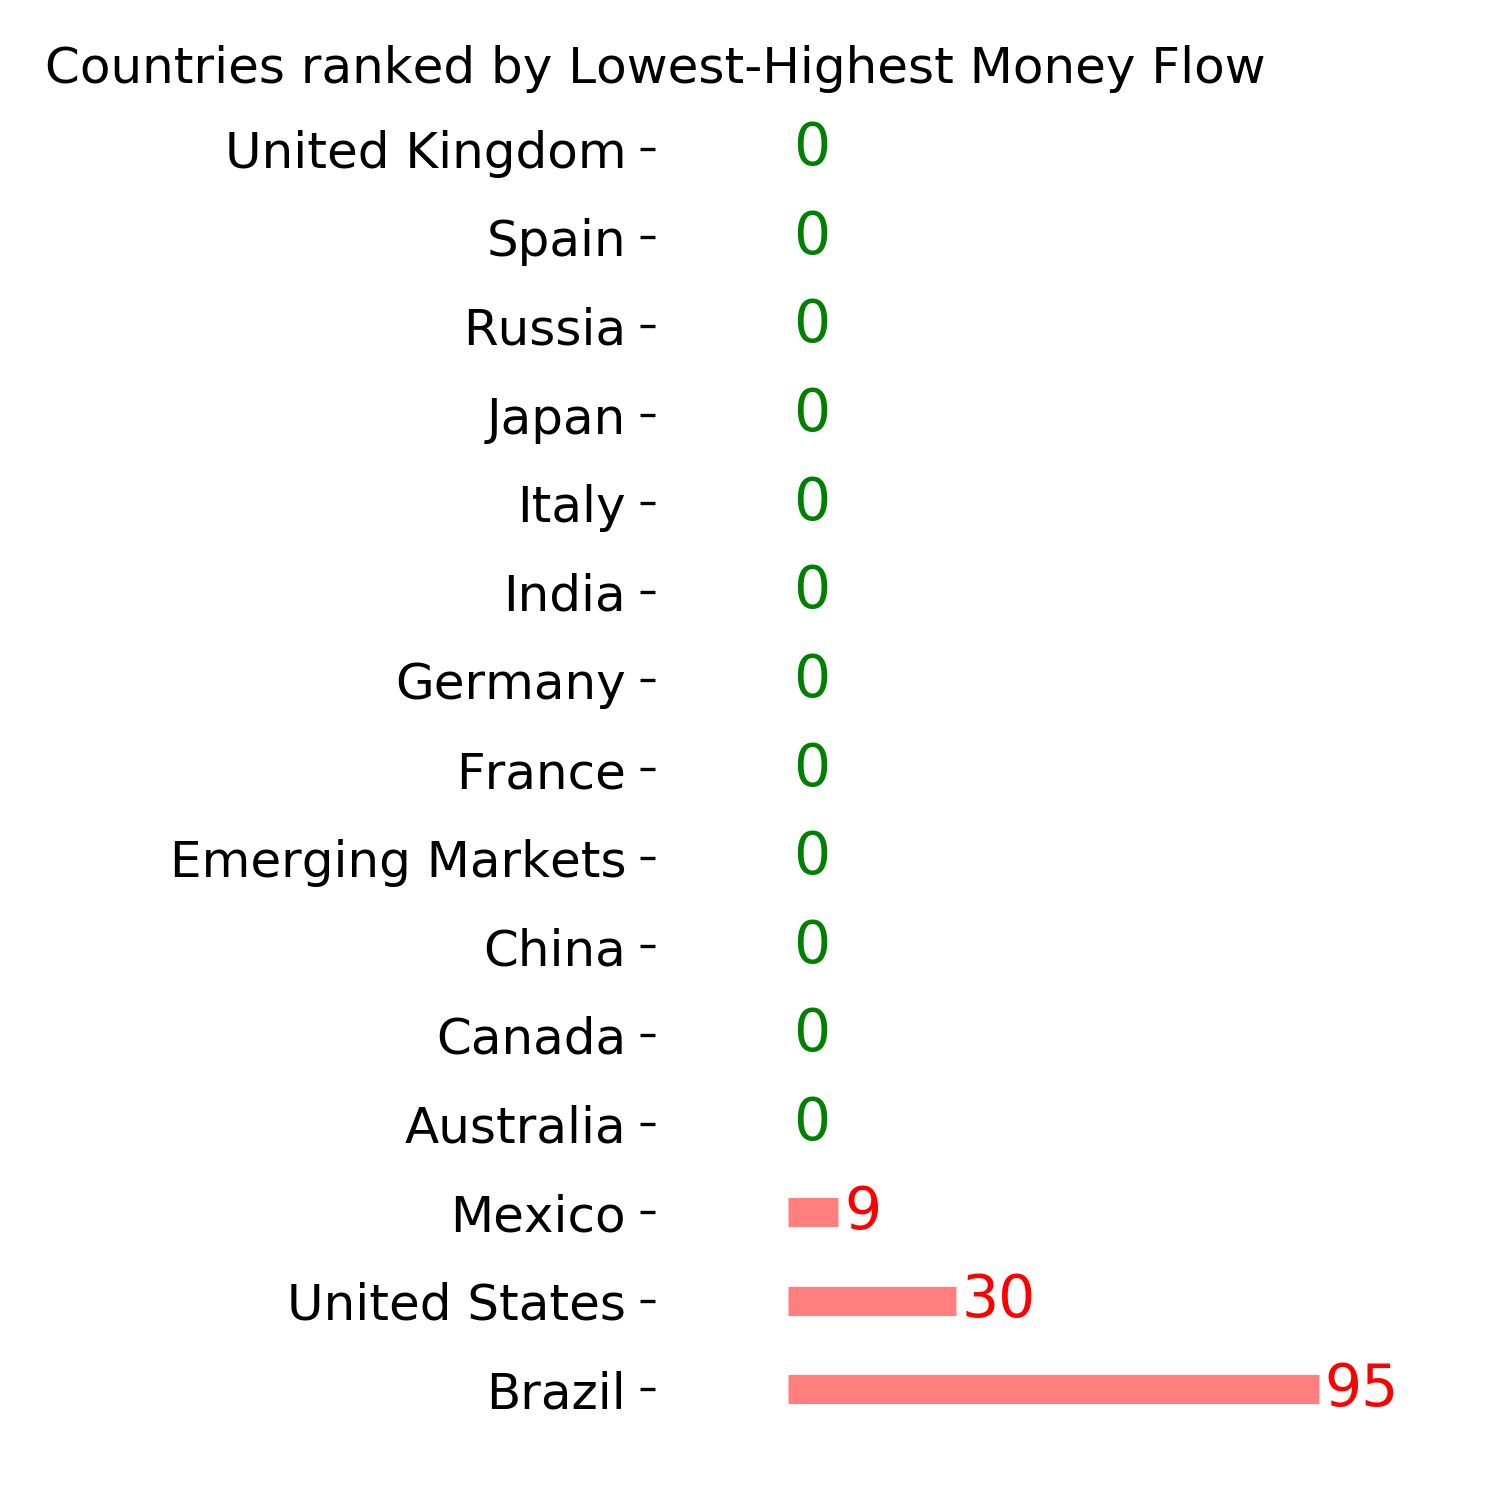
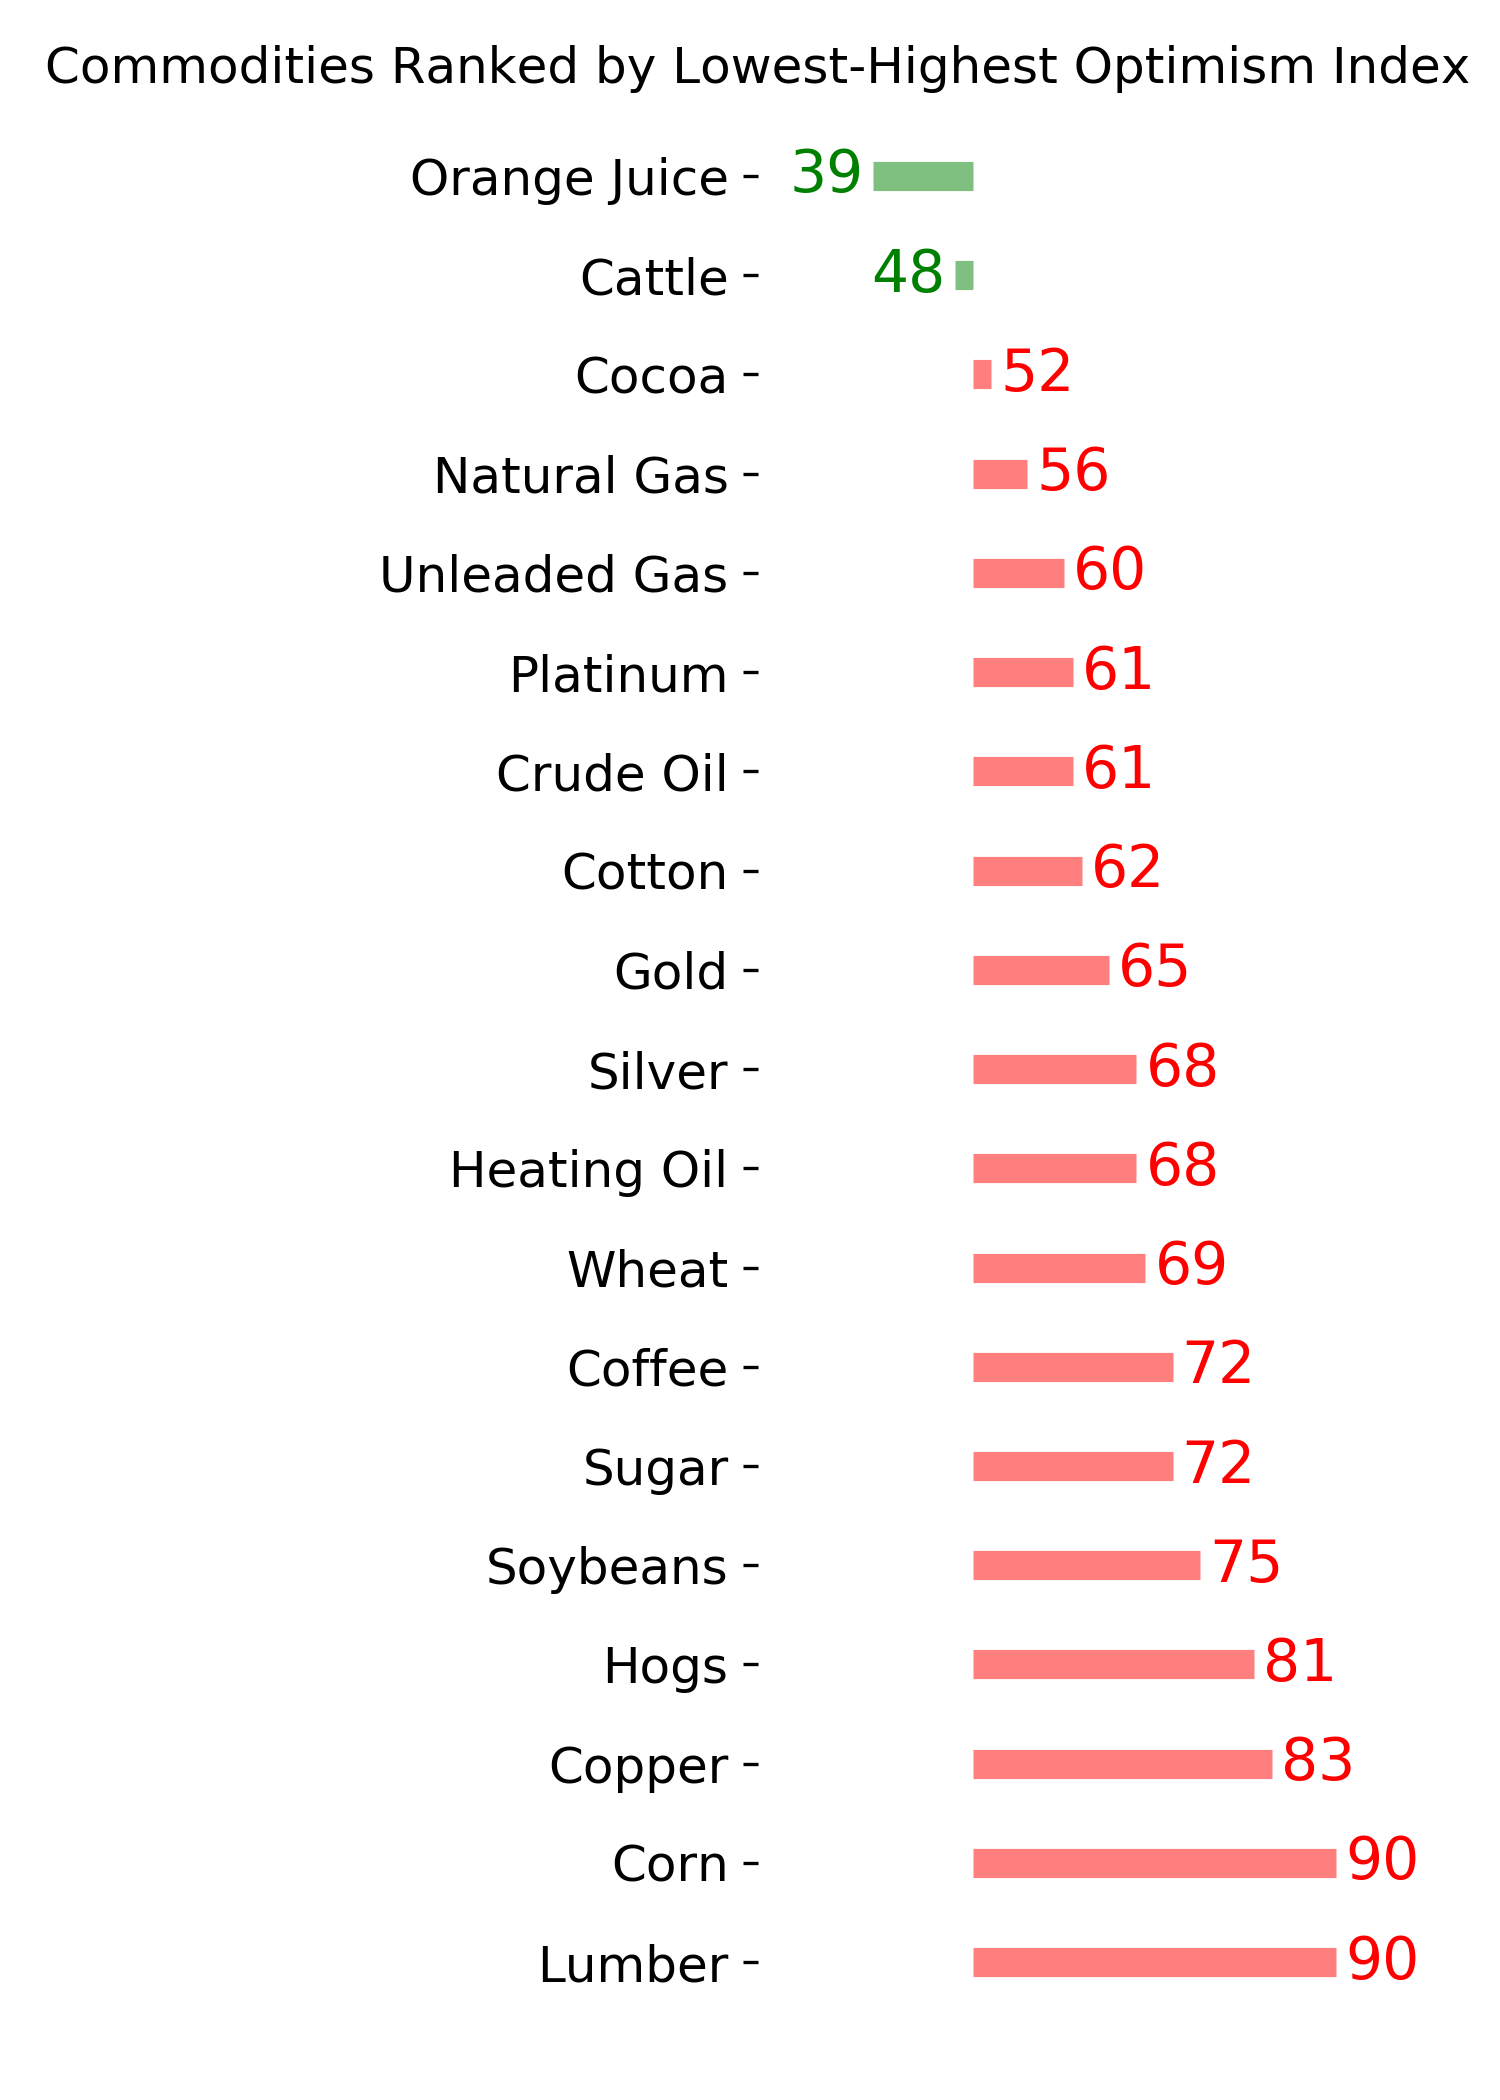
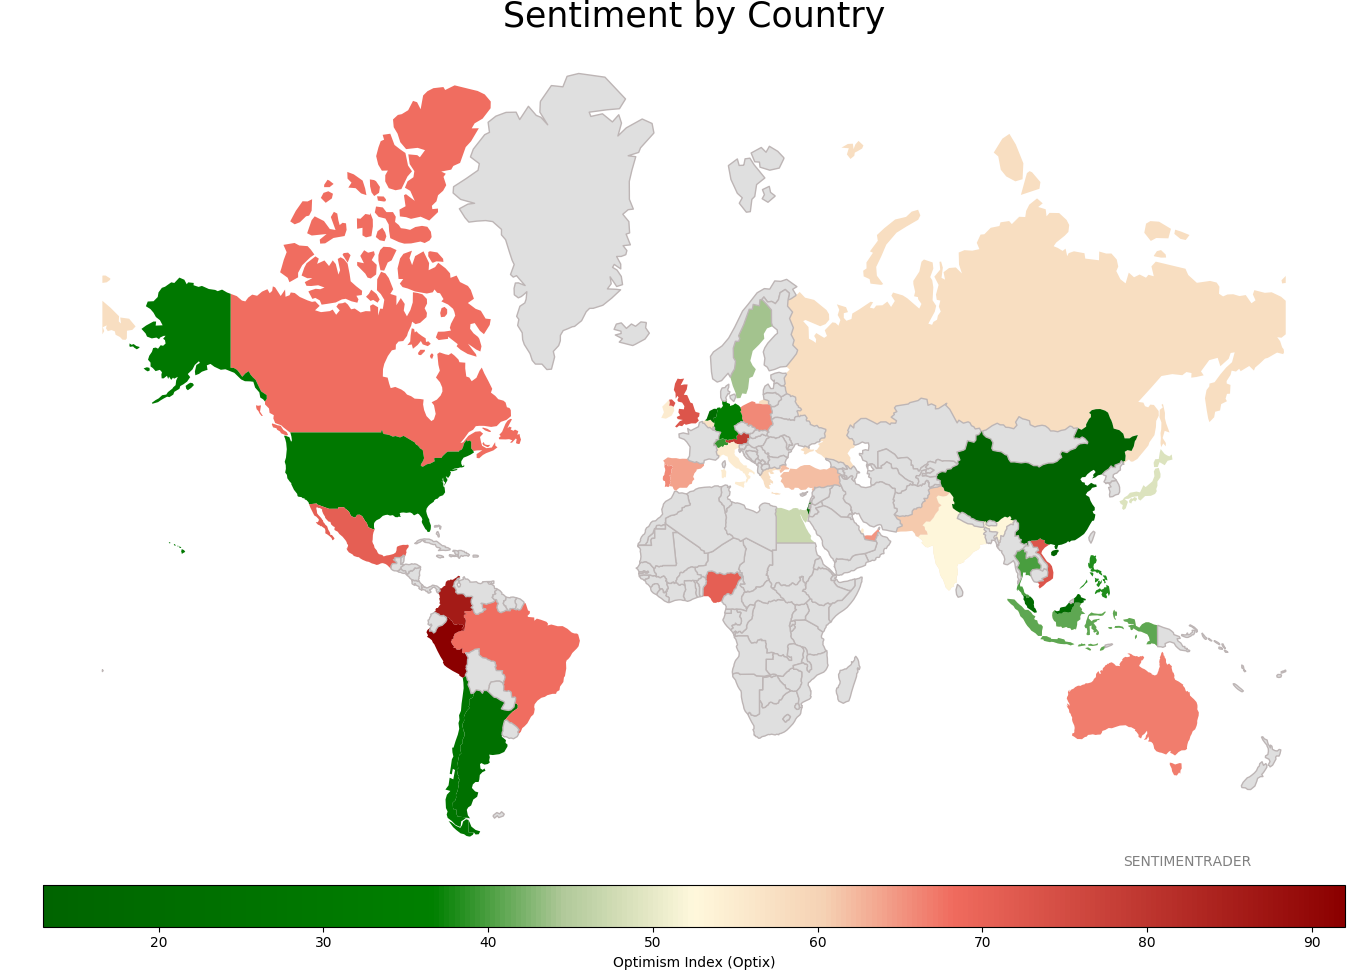
Ranks
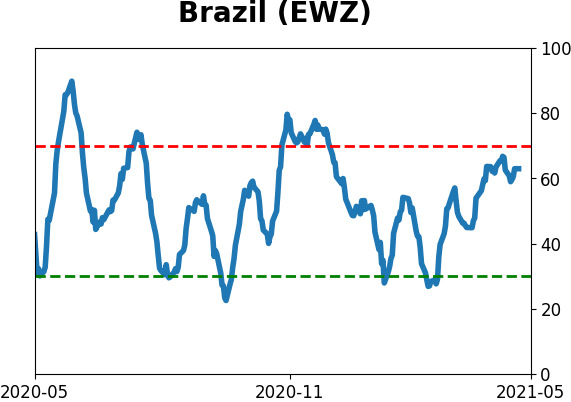
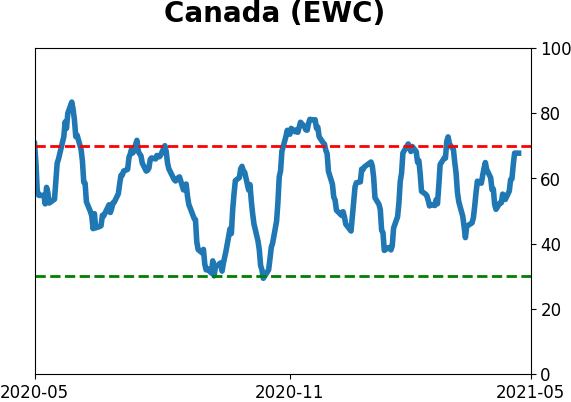
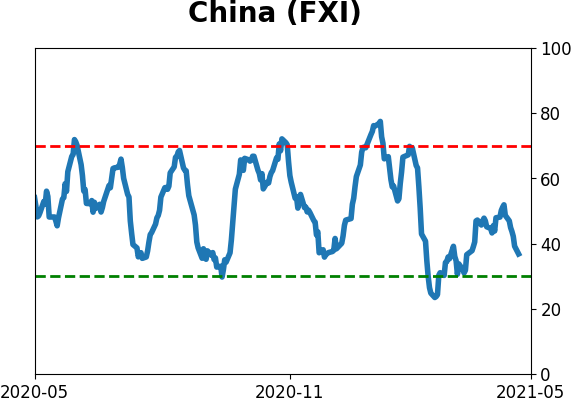
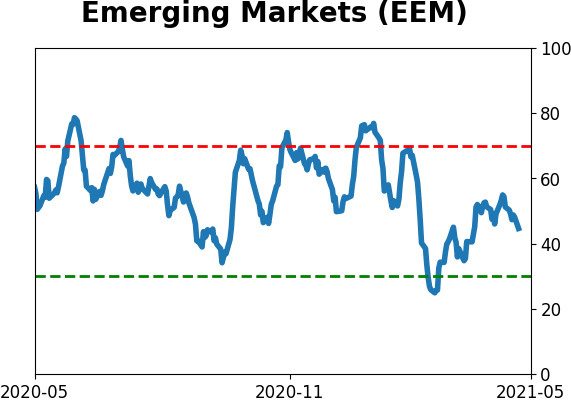
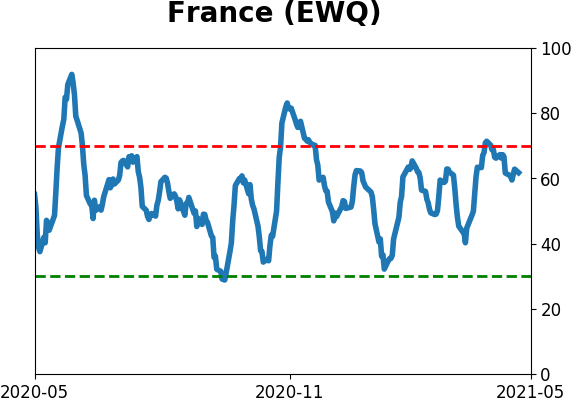
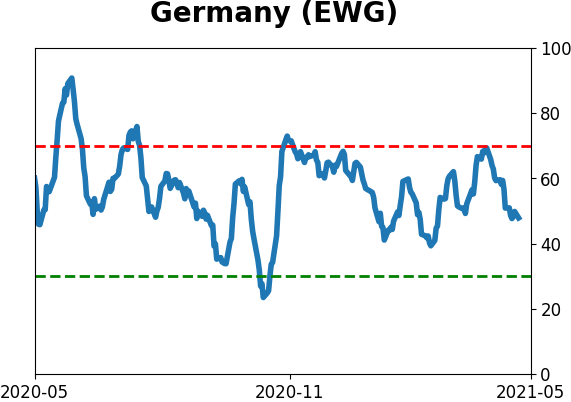
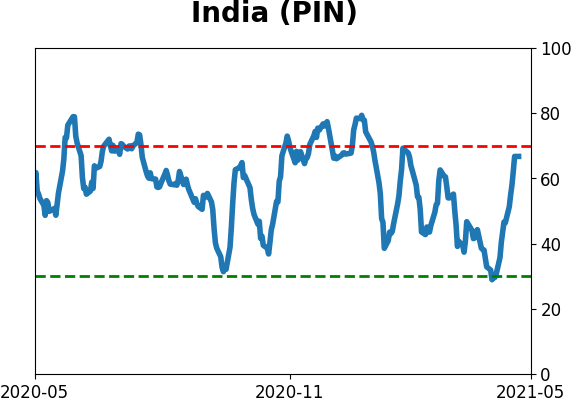
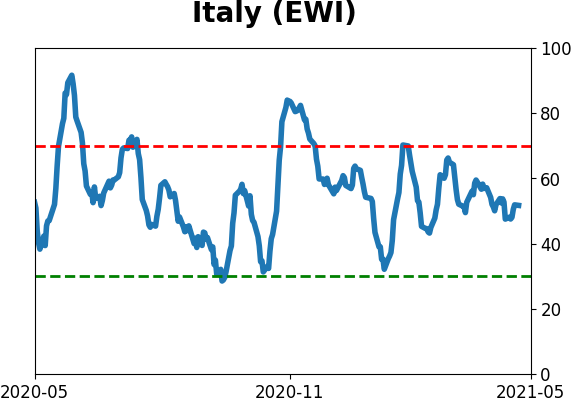
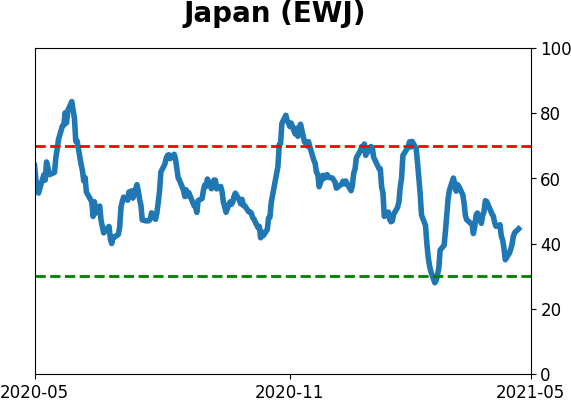
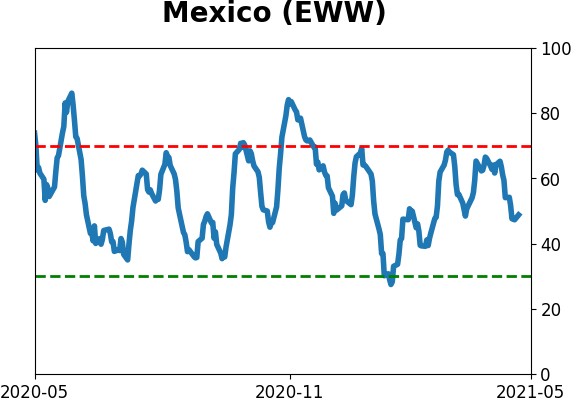
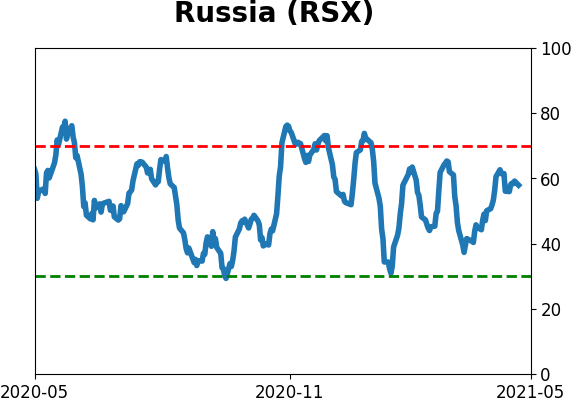
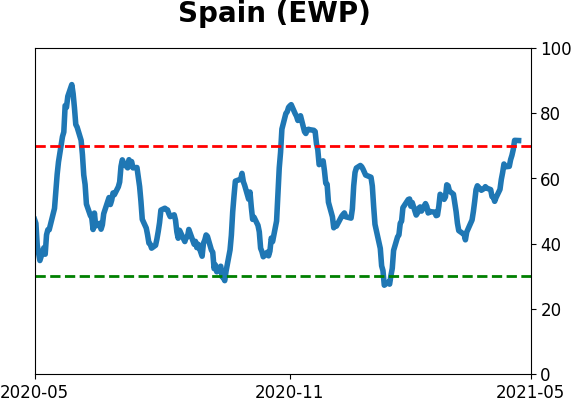
Sentiment Around The World
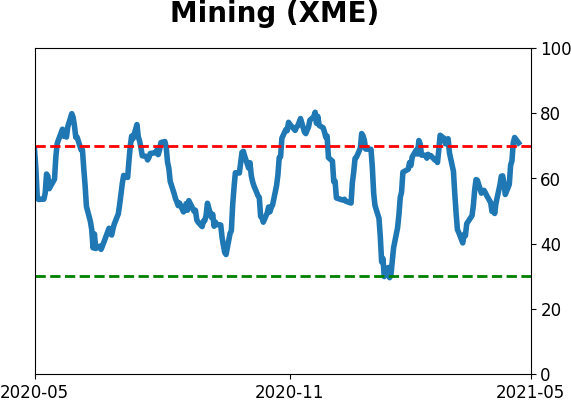
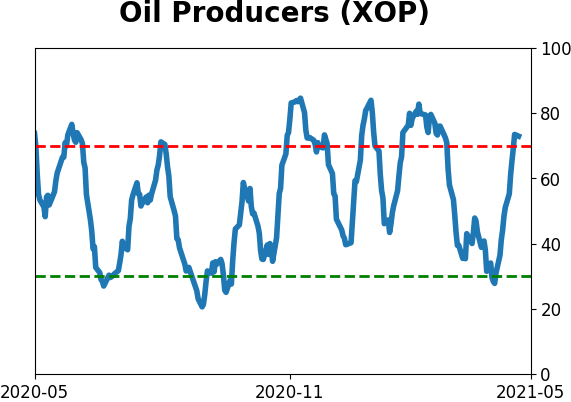
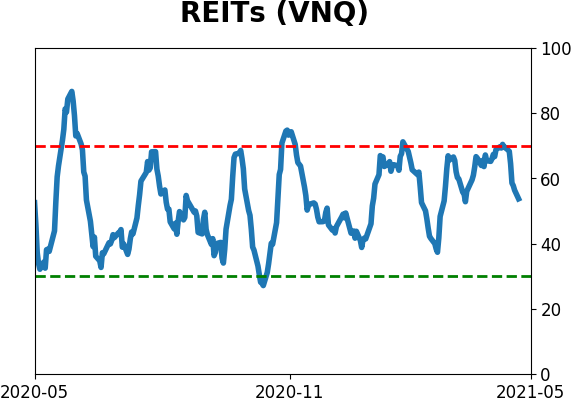
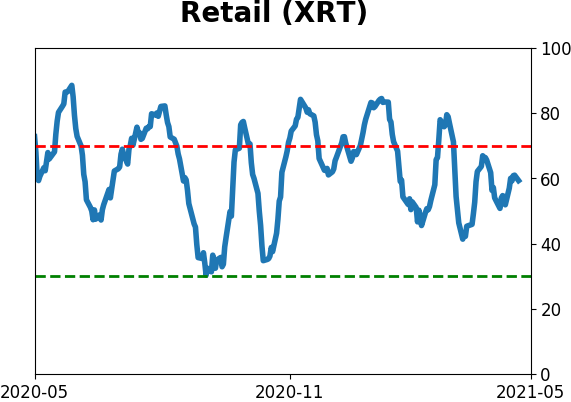
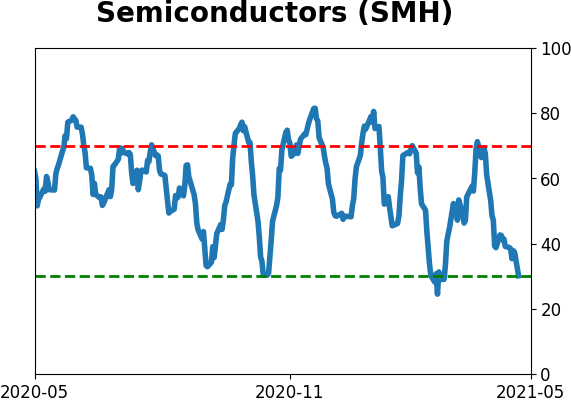
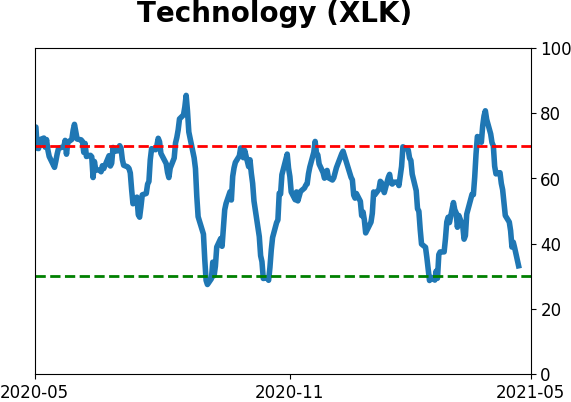
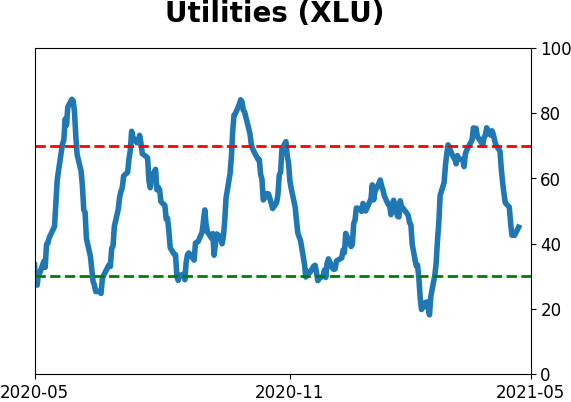
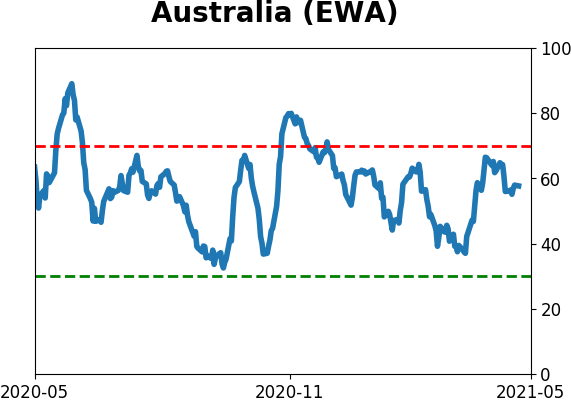
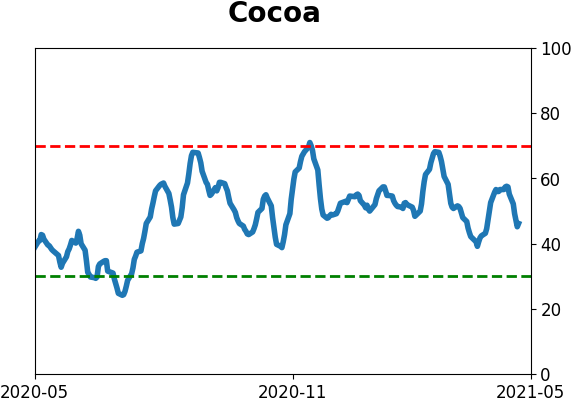
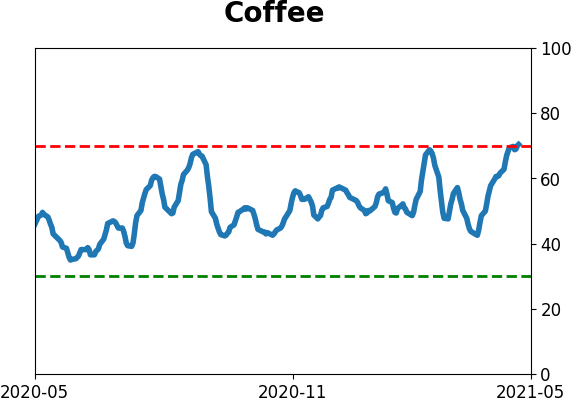
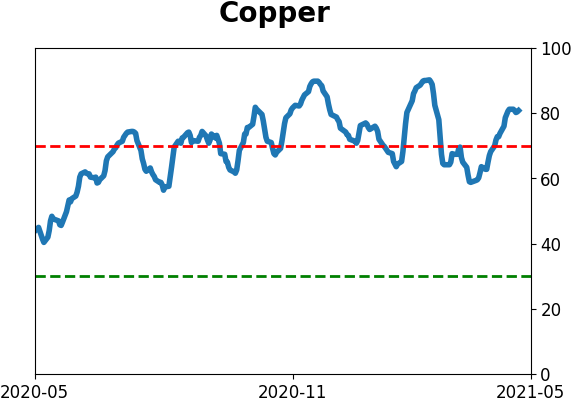
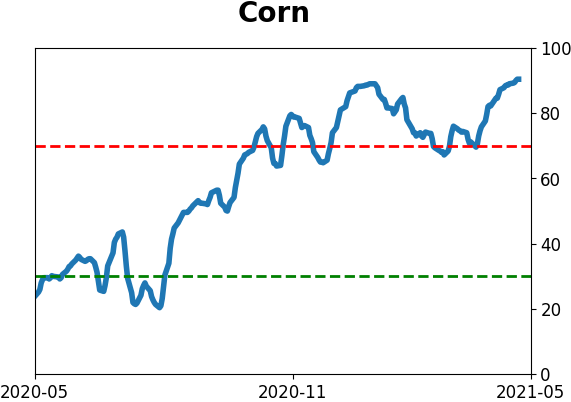
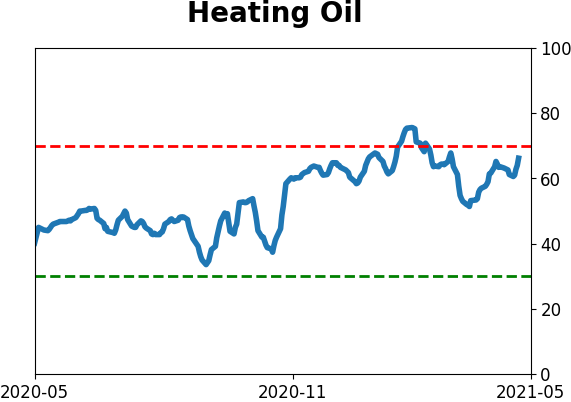
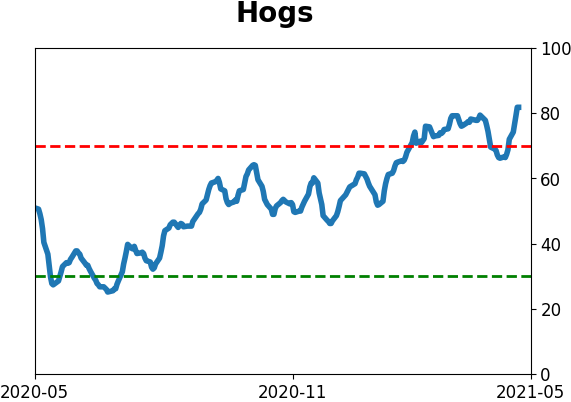
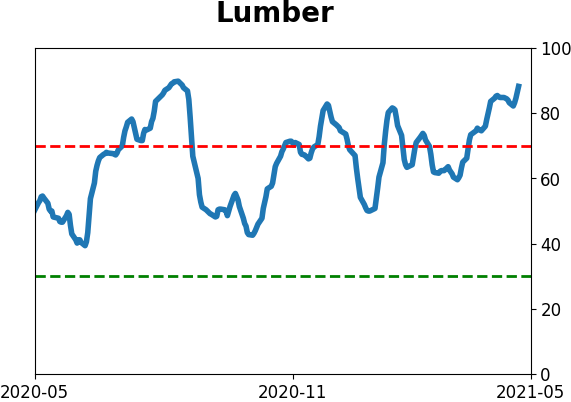
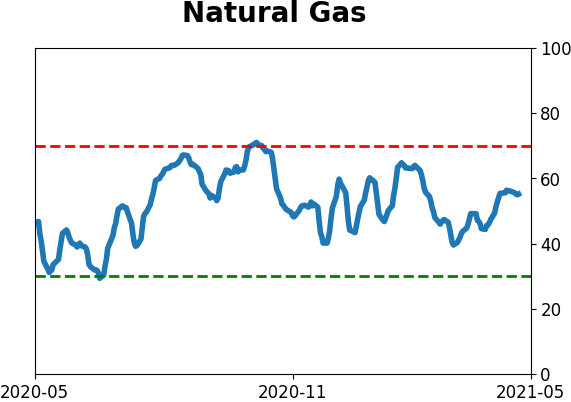
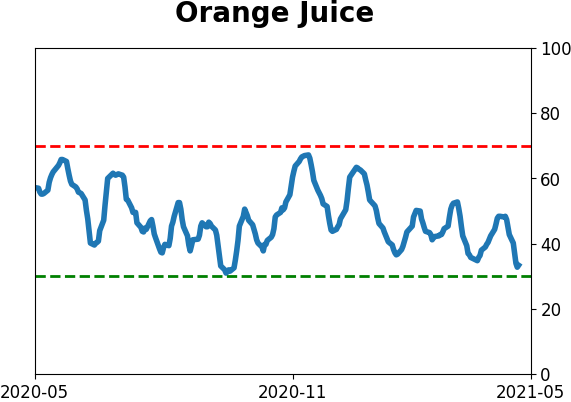
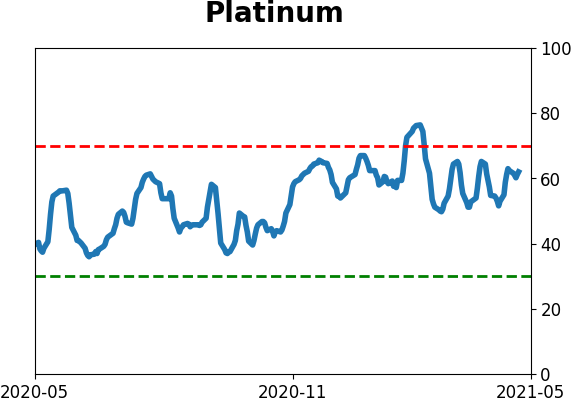
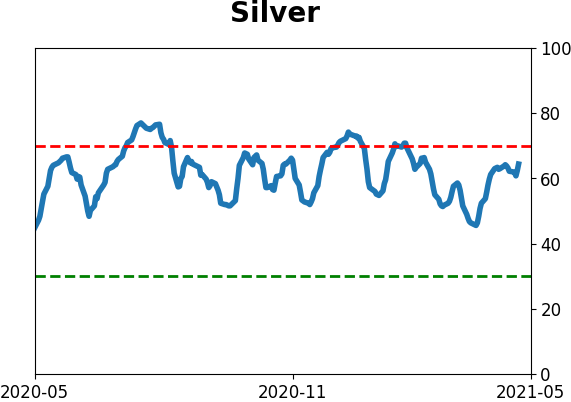
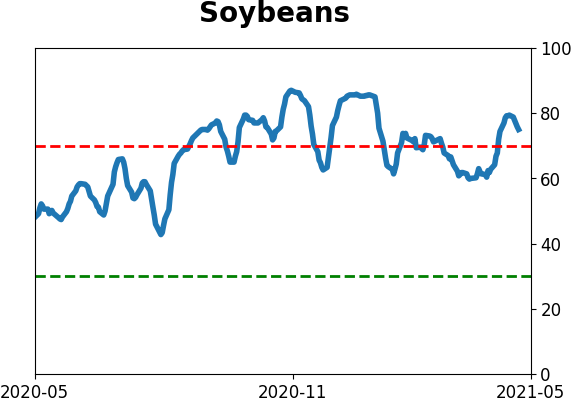
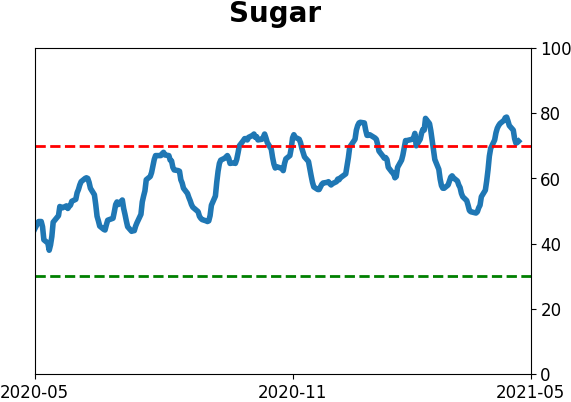
Optimism Index Thumbnails
|
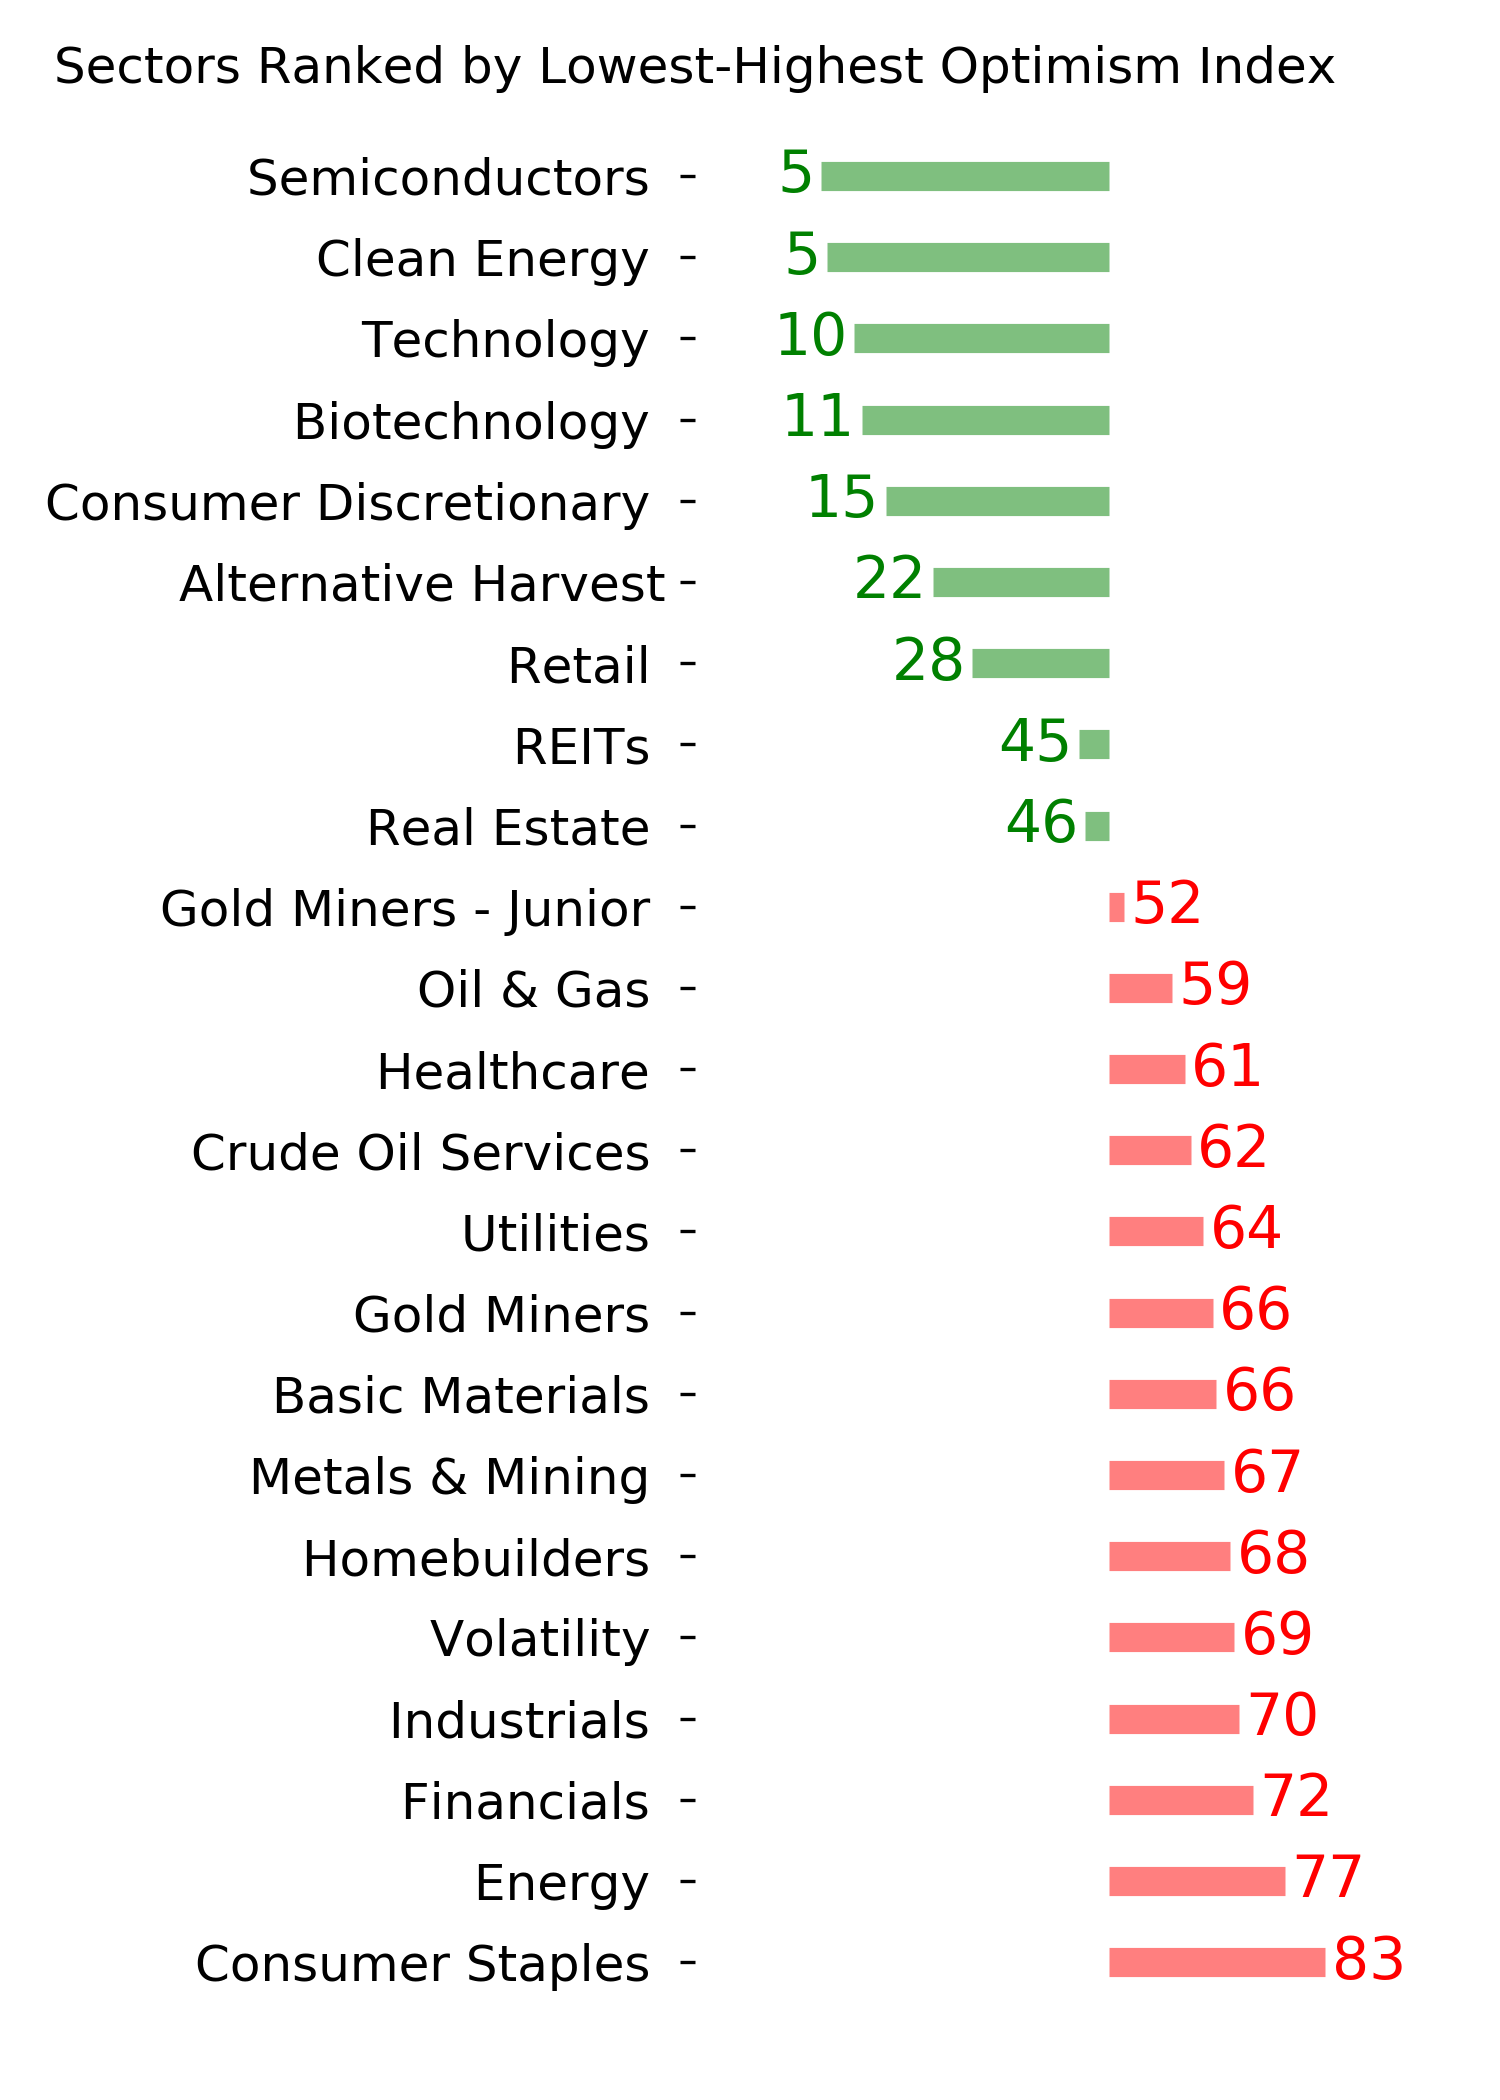
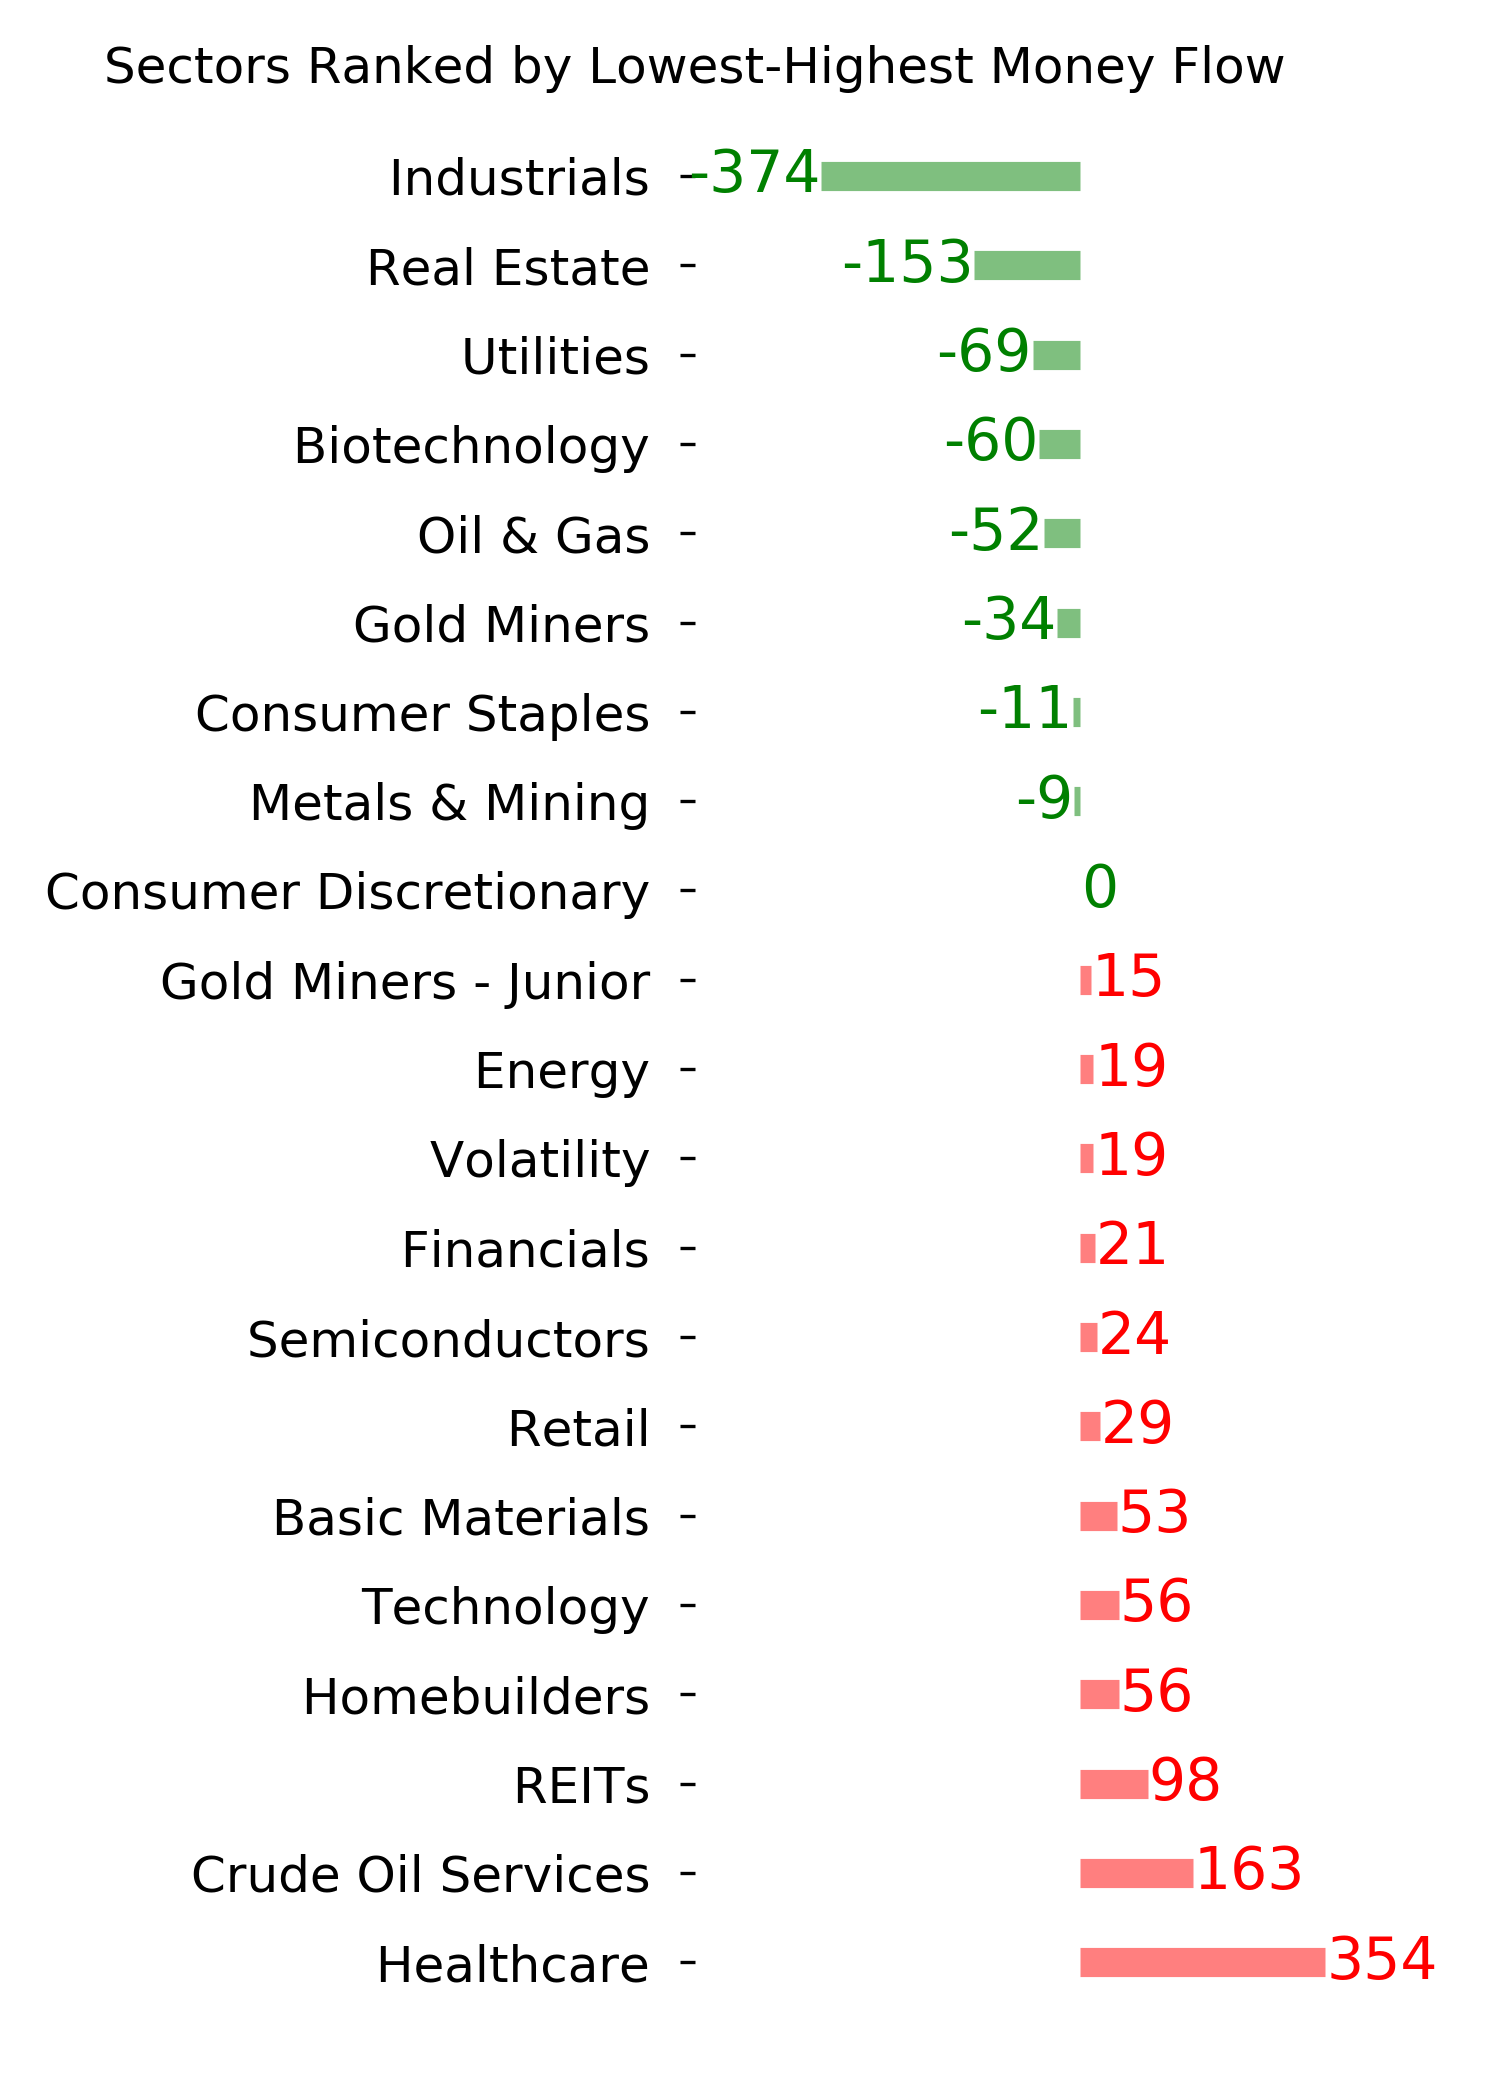
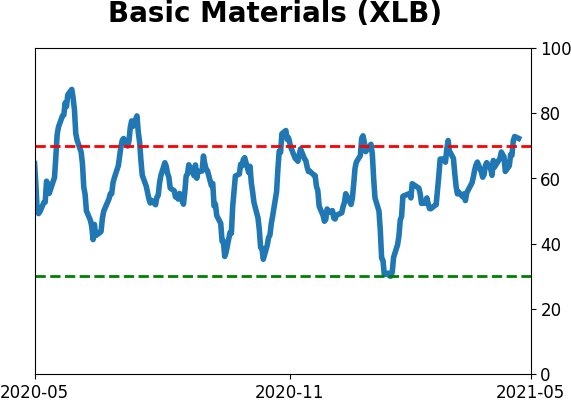
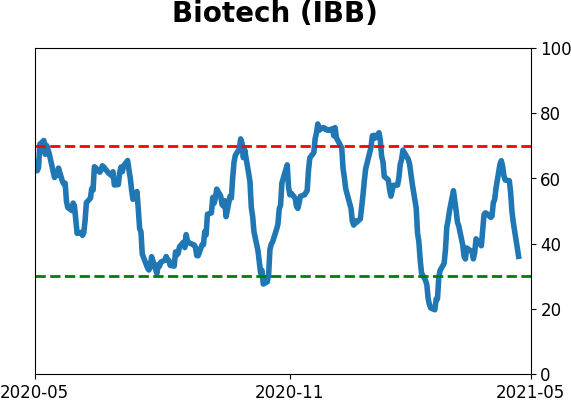
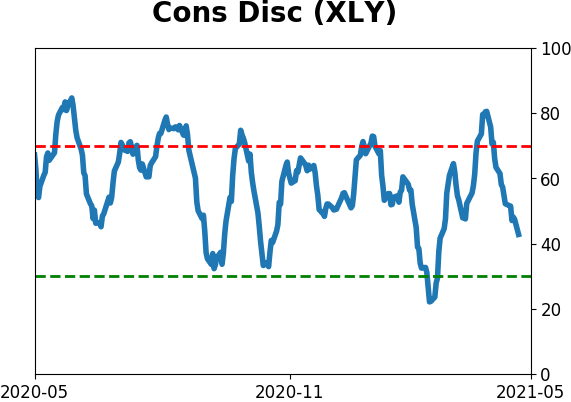
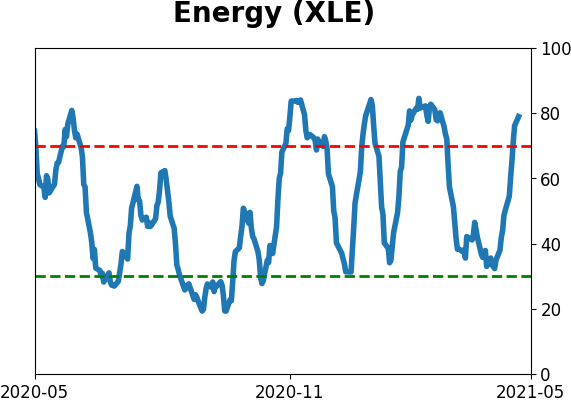
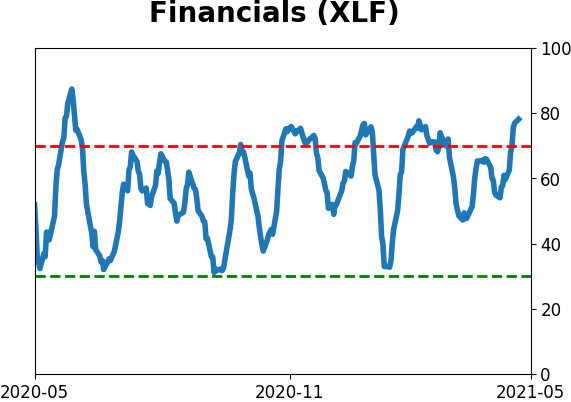
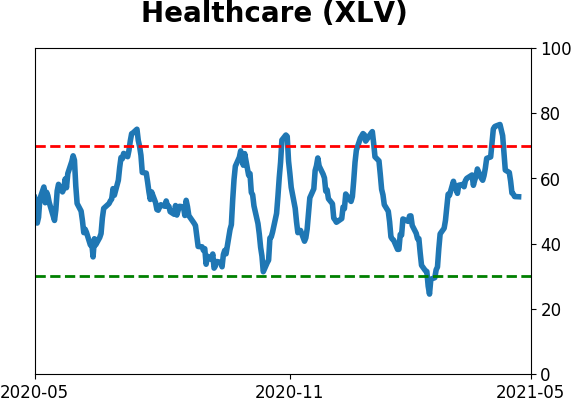
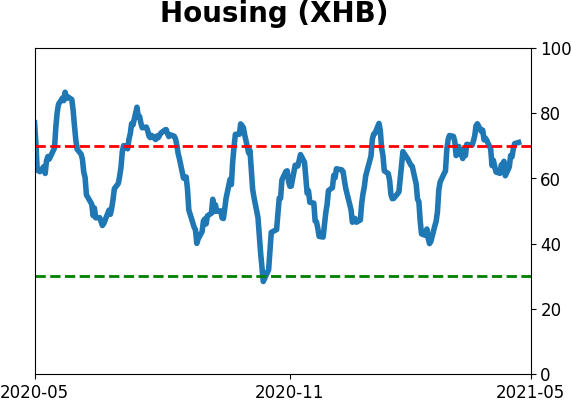
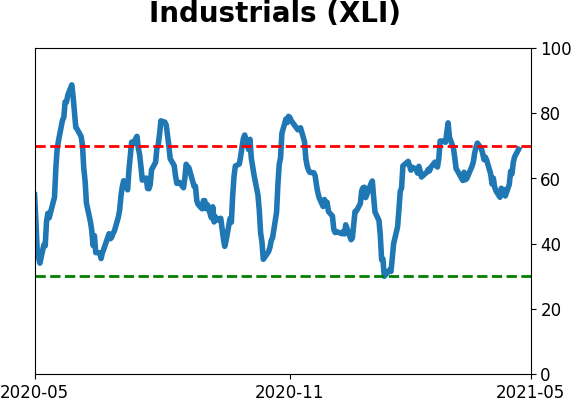
Sector ETF's - 10-Day Moving Average
|
|
|
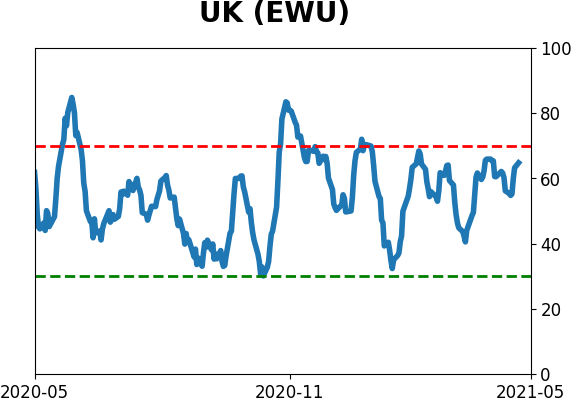
Country ETF's - 10-Day Moving Average
|
|
|
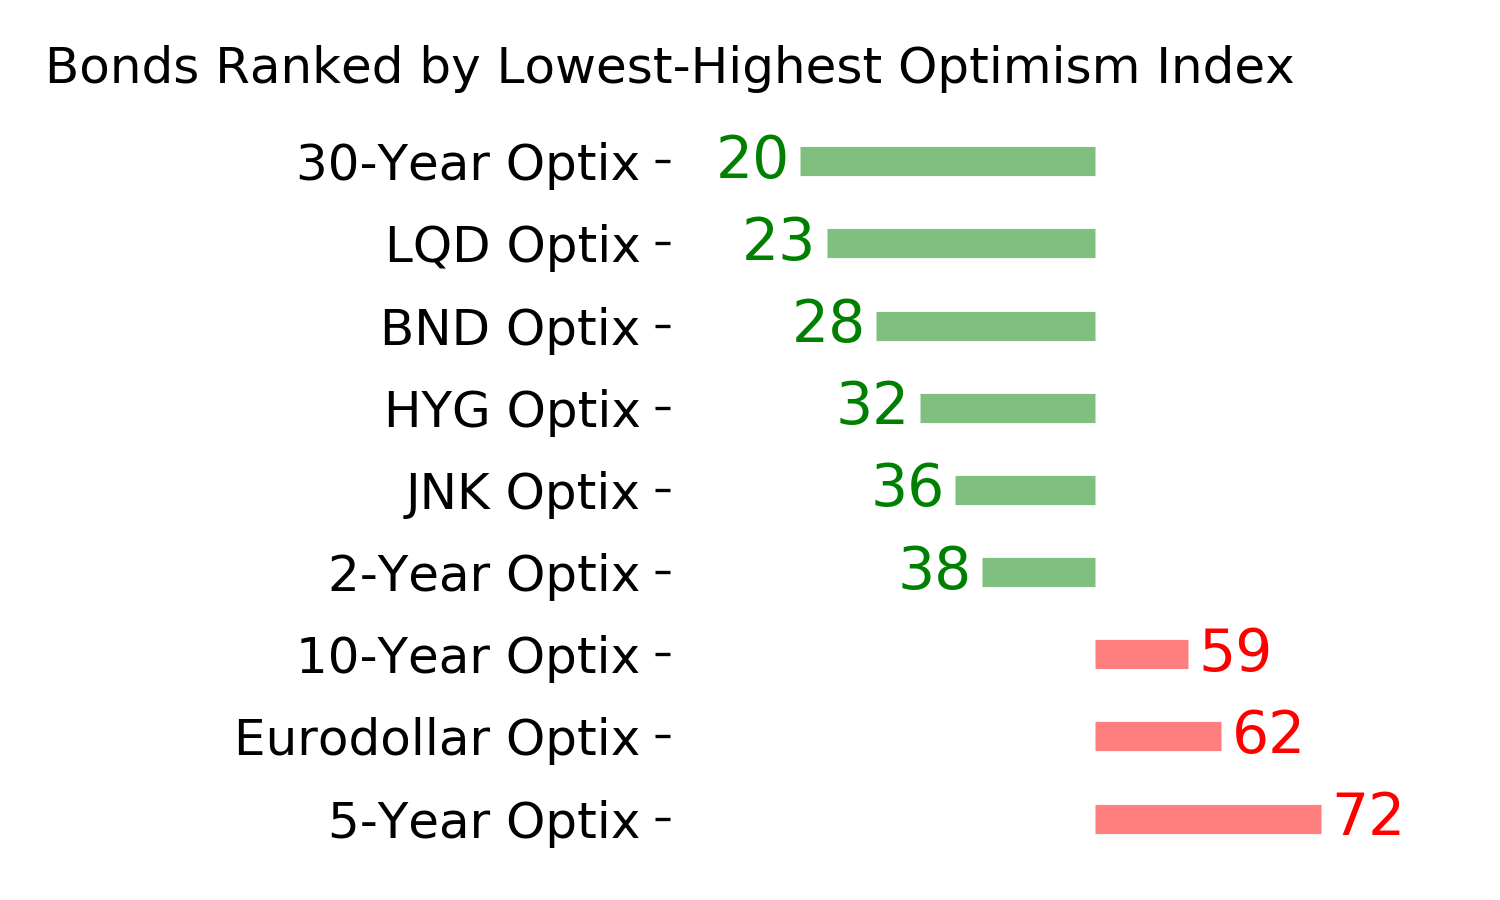
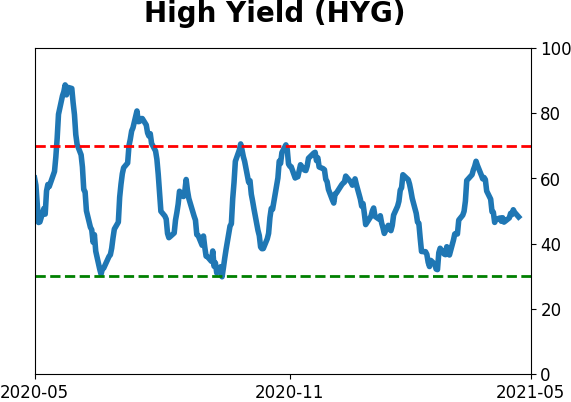
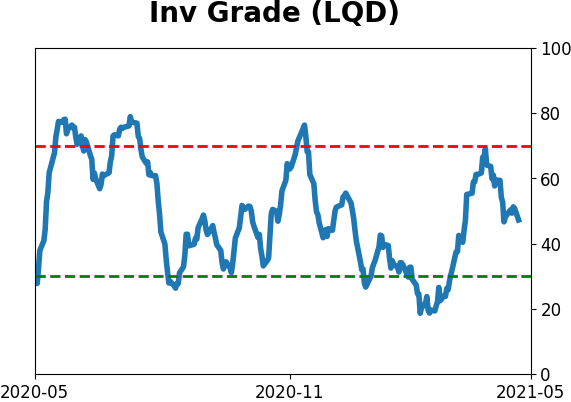
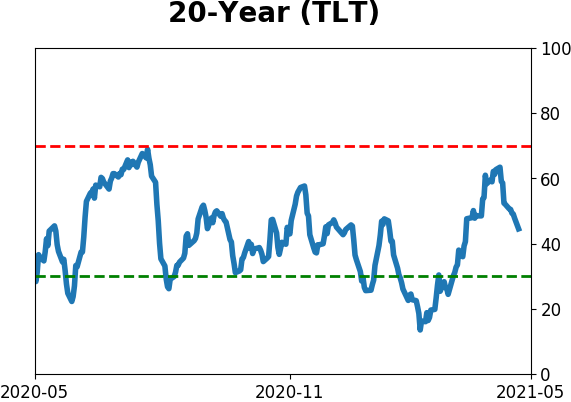
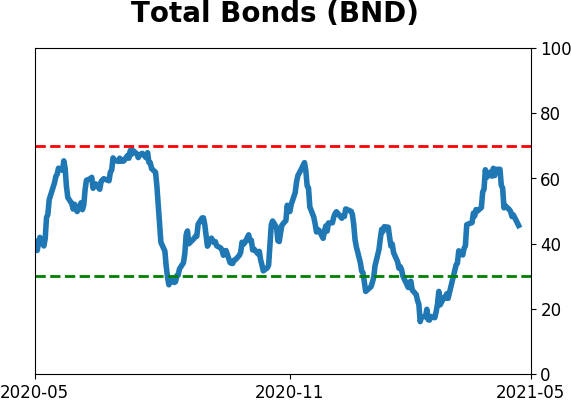
Bond ETF's - 10-Day Moving Average
|
|
|
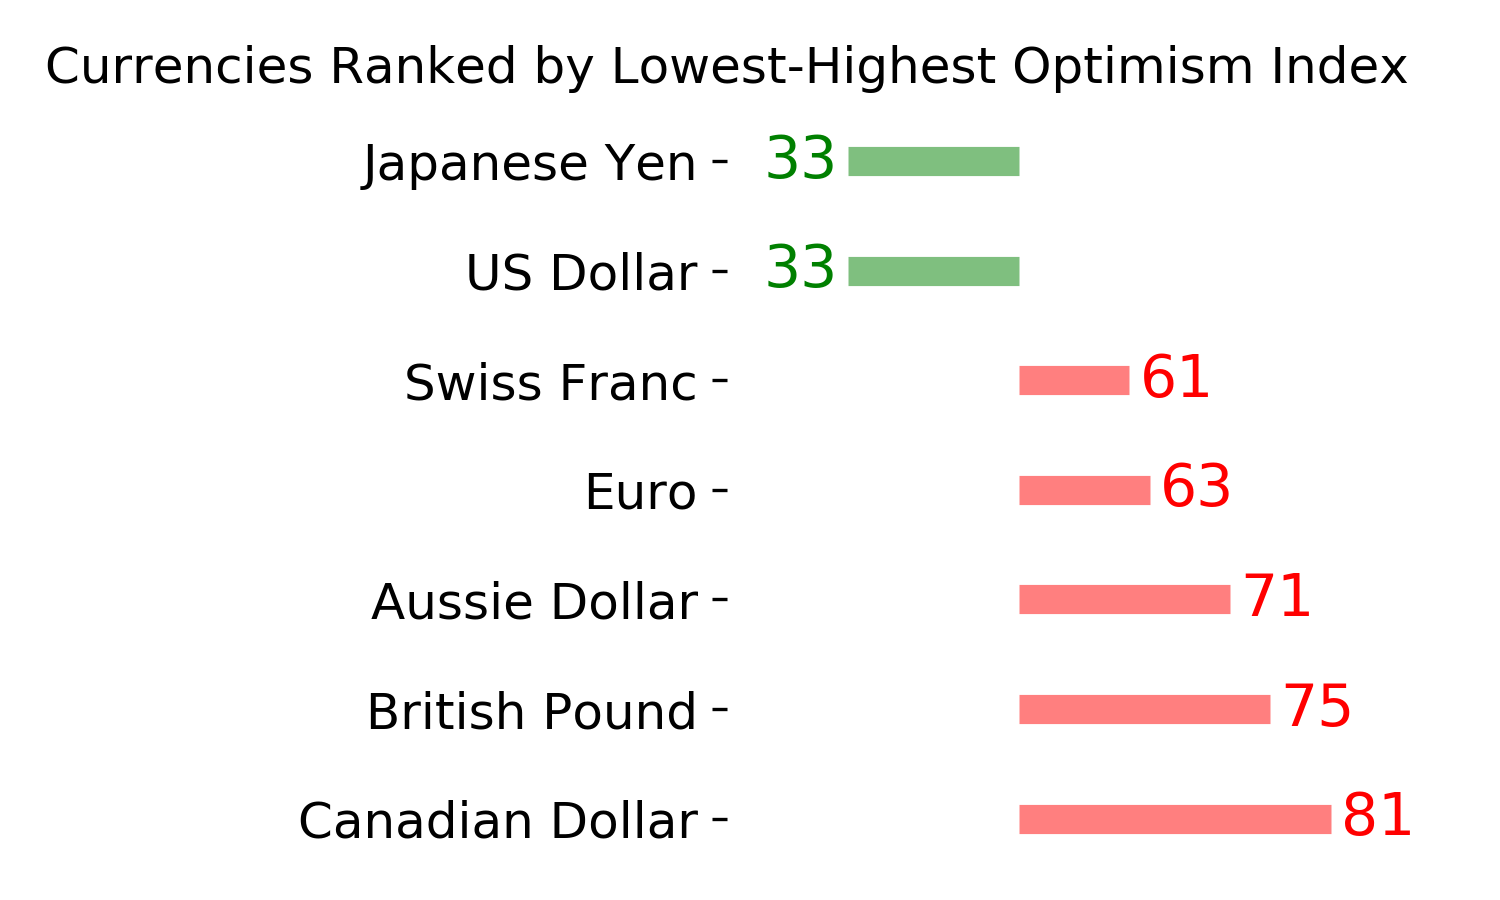
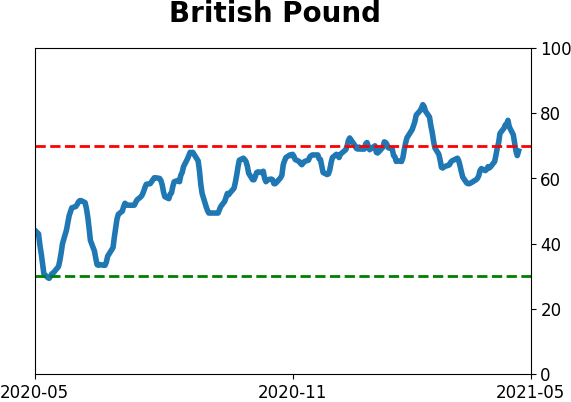
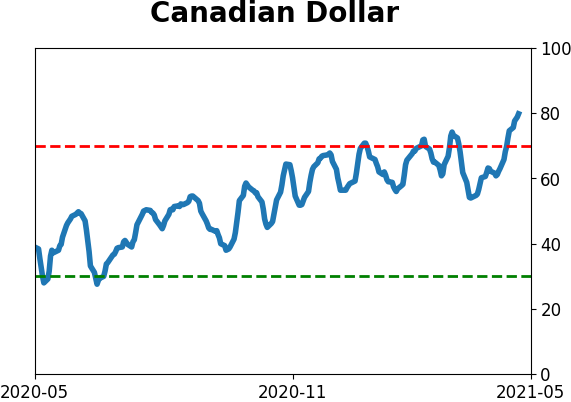
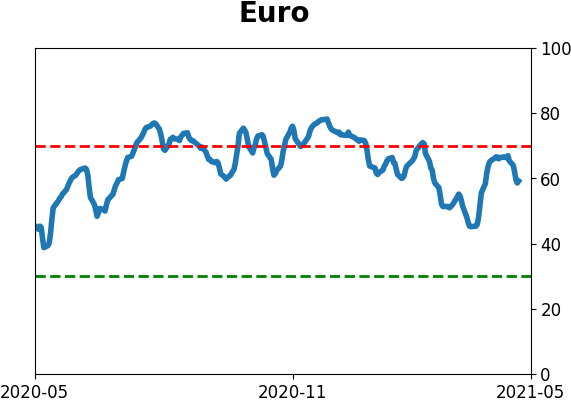
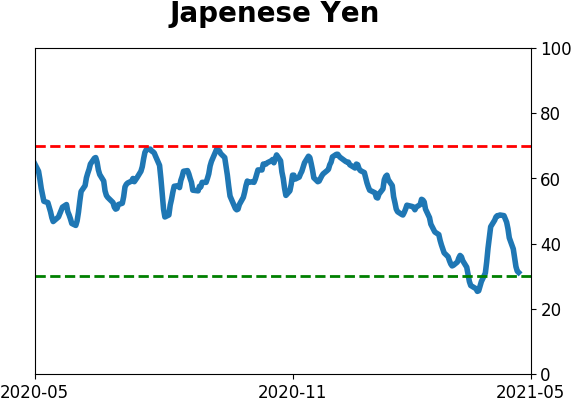
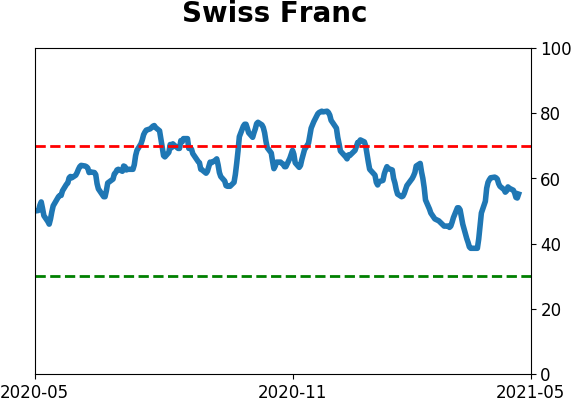
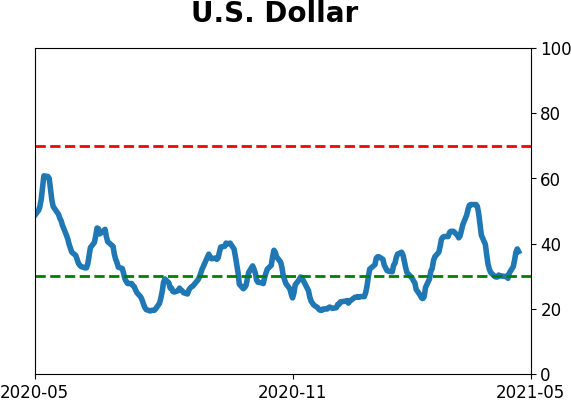
Currency ETF's - 5-Day Moving Average
|
|
|
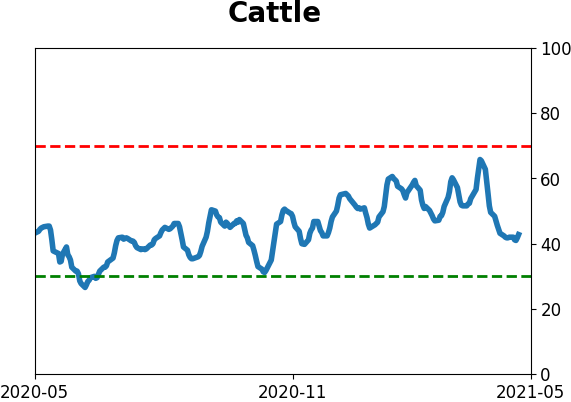
Commodity ETF's - 5-Day Moving Average
|
|