Headlines
|
|
A rally that's powered while traders sleep:
A large portion of the S&P 500's total gains since the March bottom have come overnight. Even though much of SPY's gains since inception have come overnight, it's rare to see so much of it during the initial leg off of a low. There is some slight evidence that this is a negative, compared to rallies off of a low that's driven more by gains during the regular day session.
The Nasdaq goes positive:
The Nasdaq Composite turned positive for the year, after suffering more than a 20% drawdown. This is one of the only times it has clawed back from such a large YTD pullback, especially so early in the year. The big gains in tech have pushed the QQQ fund above the $100 billion market cap threshold, joining few others.
The latest Commitments of Traders report was released, covering positions through Tuesday: The 3-Year Min/Max Screen didn't show any new extremes of note this week. While it's slightly below the record from 3 weeks ago, hedgers moved to a net long position of more than $40 billion in equity index futures again. They take the opposite side of large and small speculators, so it means those speculators have been fighting this rally the whole way, very similar to what happened in early 2019. Hedgers are also net long more than 10% of the open interest in 30-year Treasury bond futures, surprising given the rally in bonds in recent months. The Backtest Engine shows that the 30-year contract showed an average return of +2.8% over the next six months when hedgers held more than 10% of open interest net long. When they held 10% of it net short, then the return fell to -2.3%.
|
Smart / Dumb Money Confidence
|
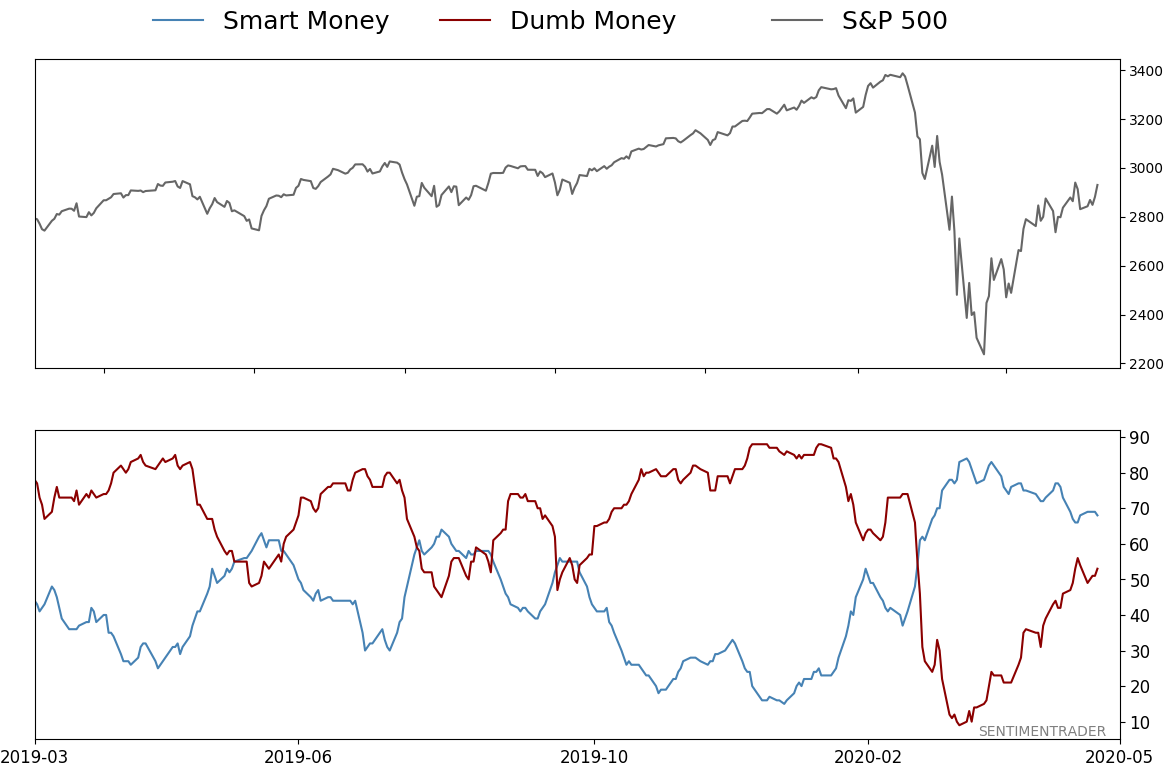
Smart Money Confidence: 68%
Dumb Money Confidence: 53%
|
|
Risk Levels
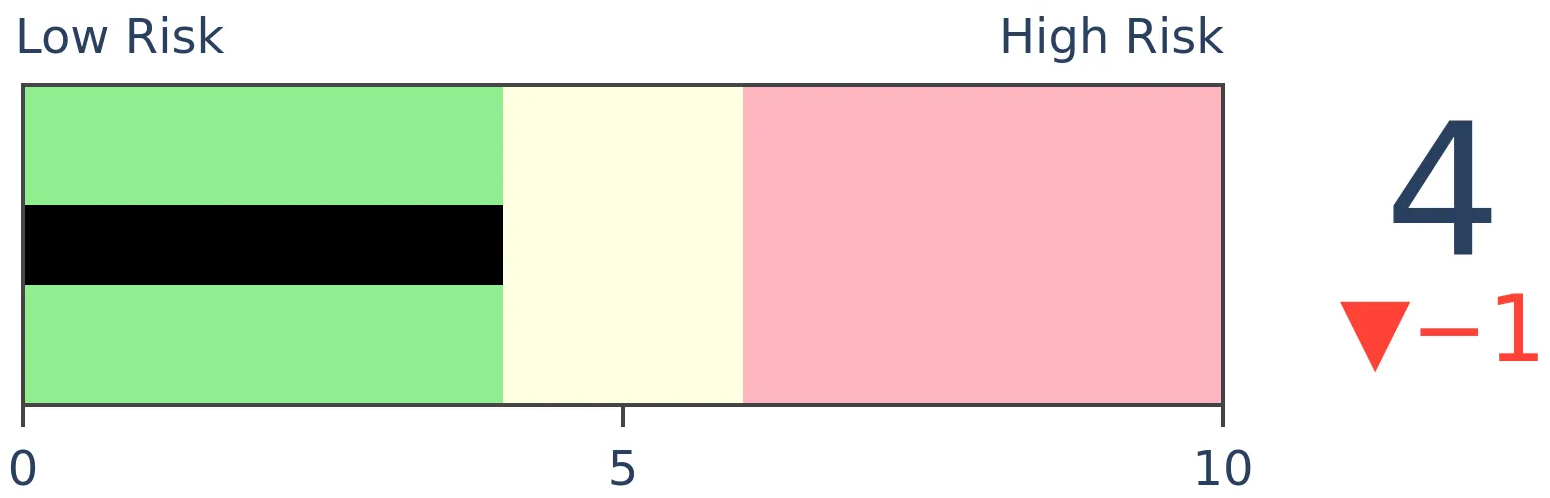
Stocks Short-Term
|
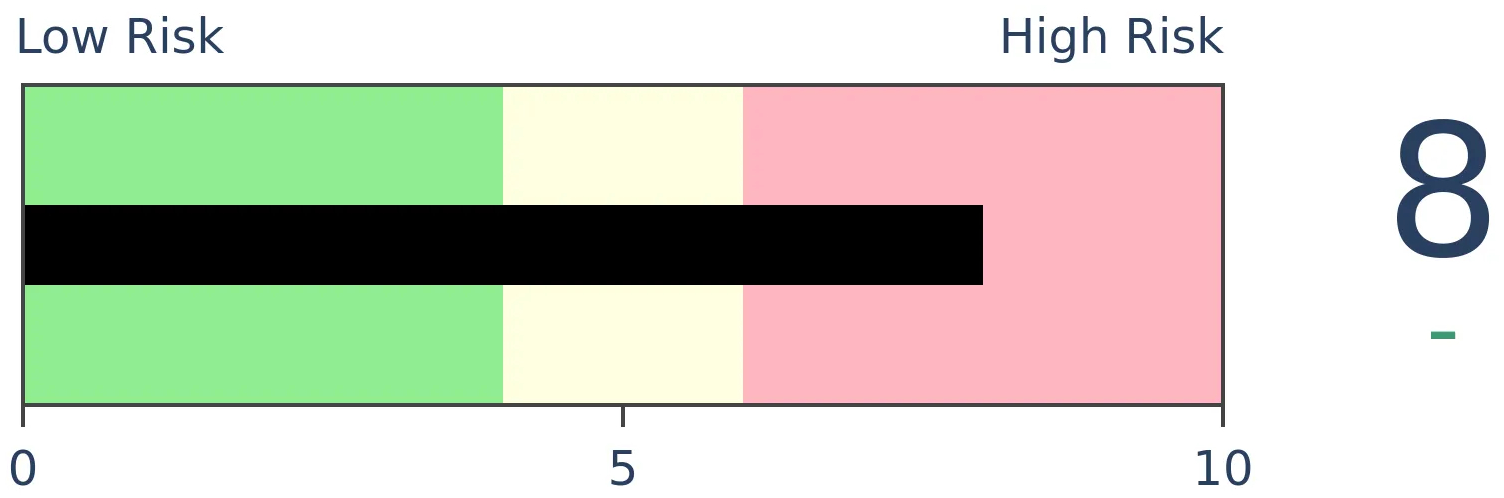
Stocks Medium-Term
|
|
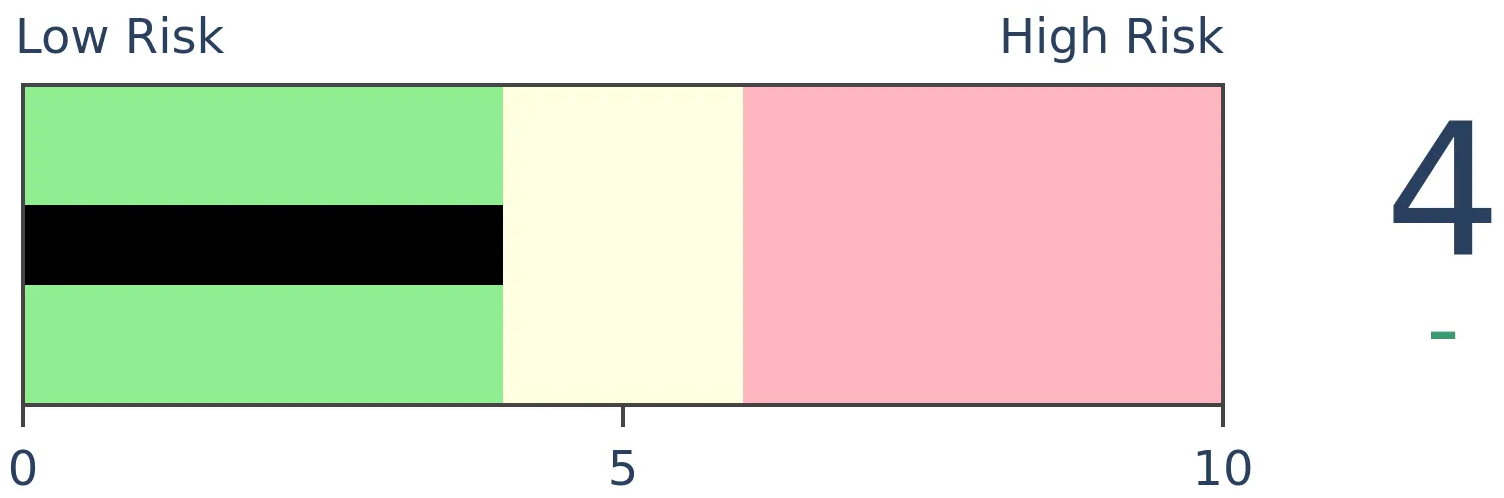
Bonds
|
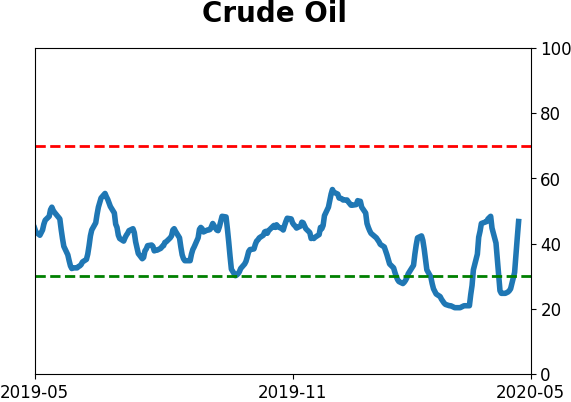
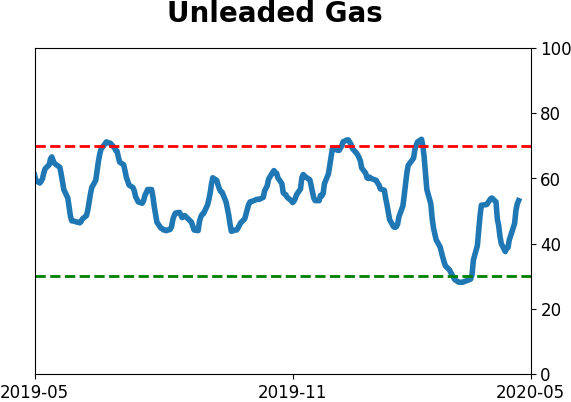
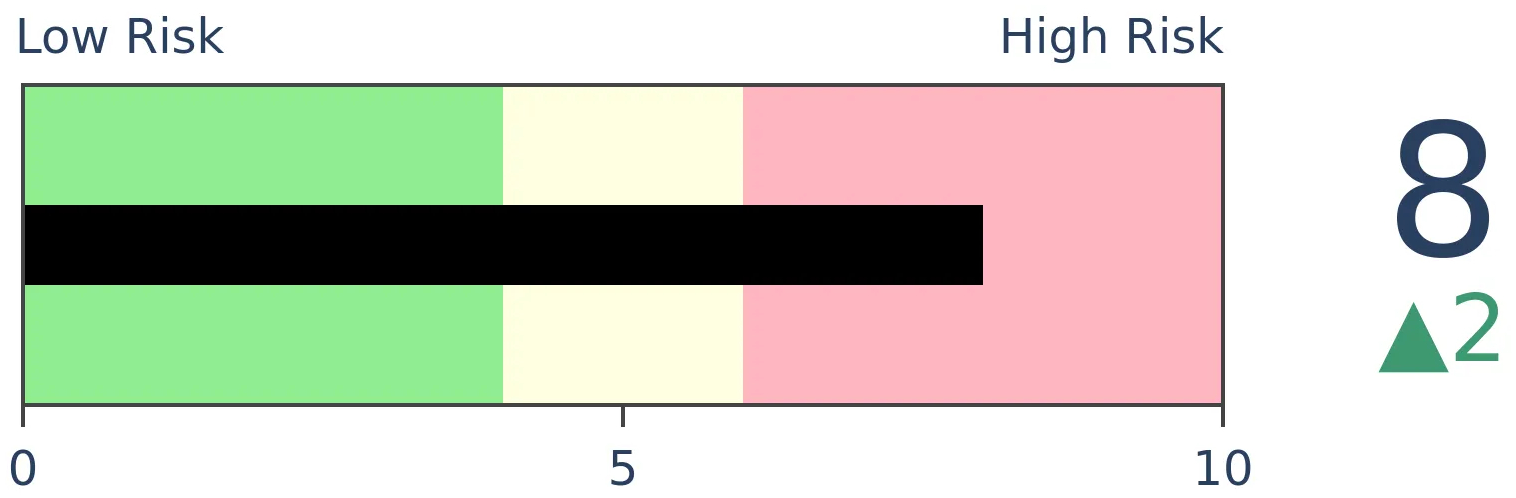
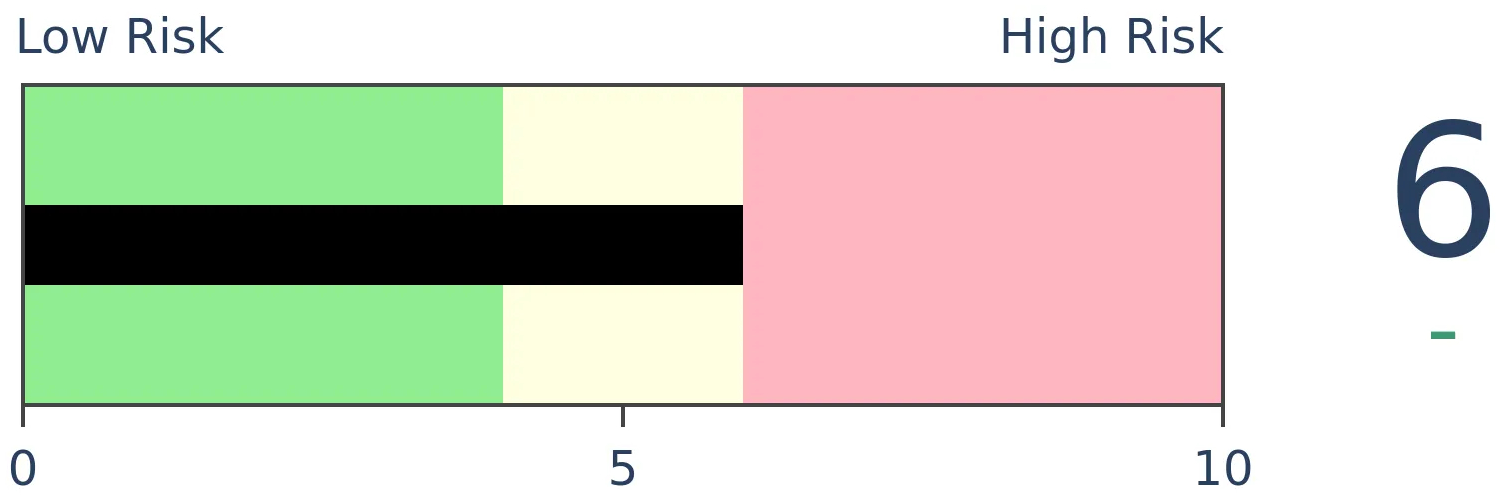
Crude Oil
|
|
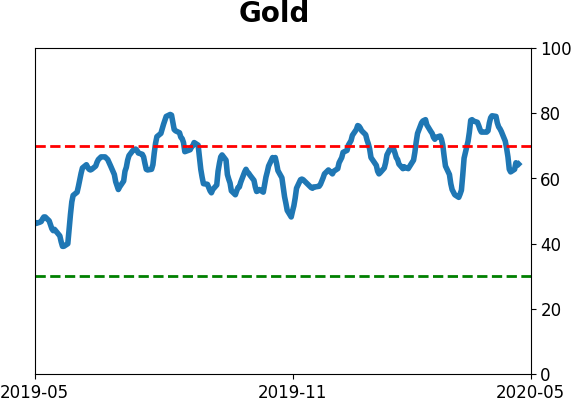
Gold
|
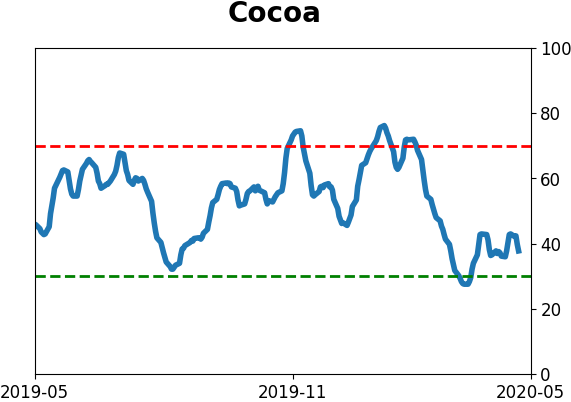
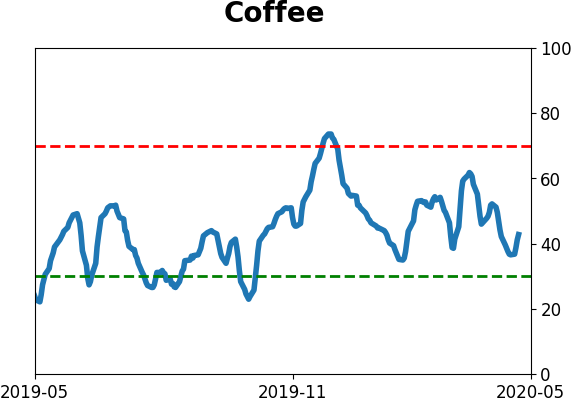
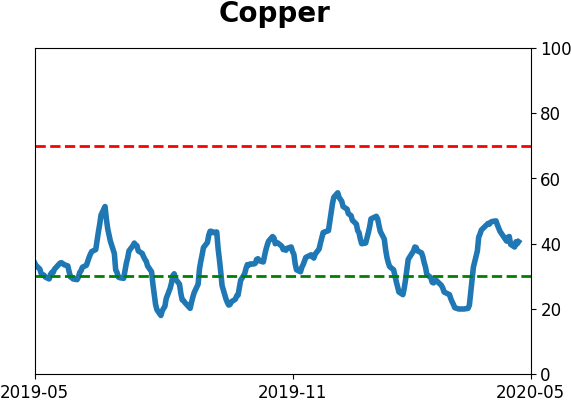
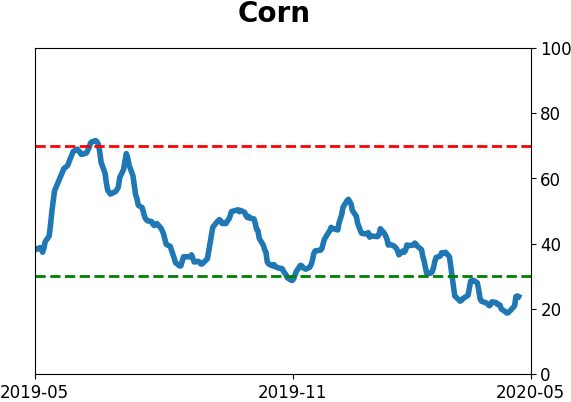
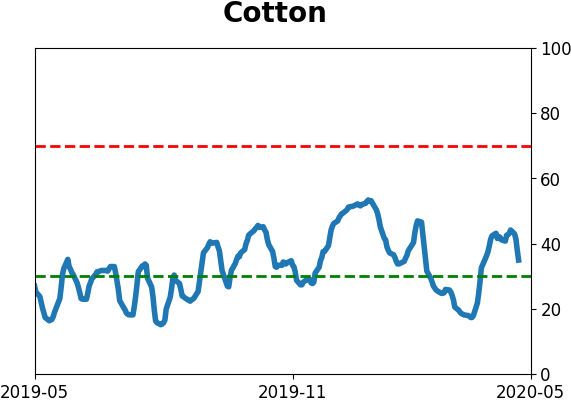
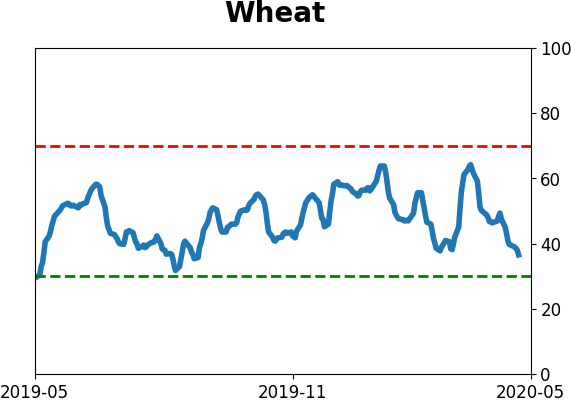
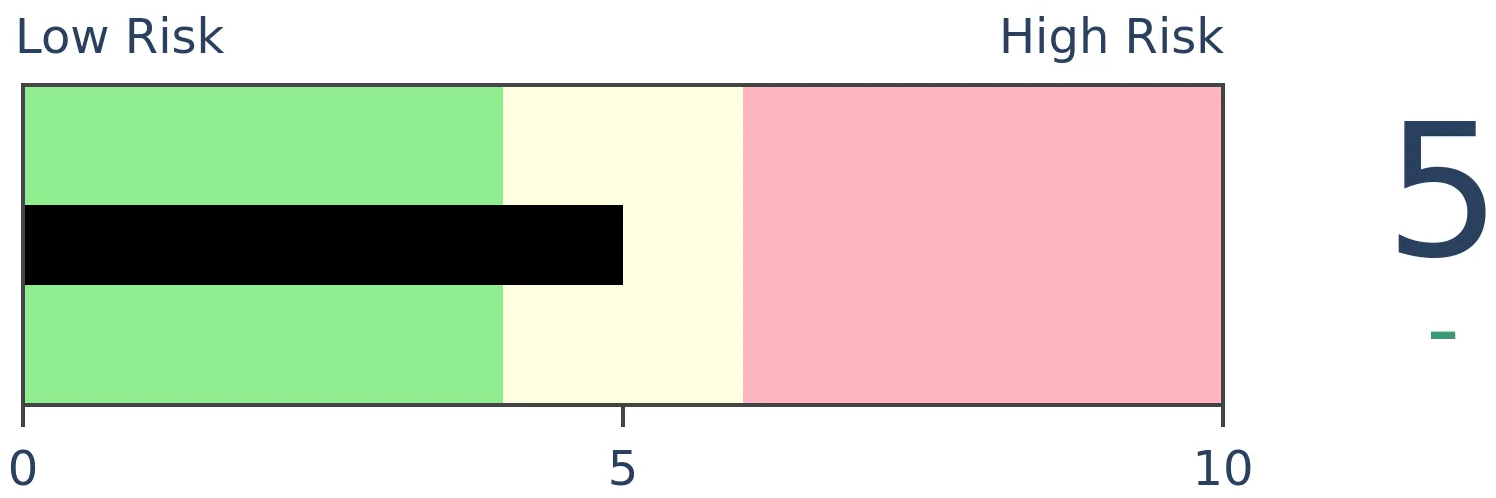
Agriculture
|
|
Research
BOTTOM LINE
A large portion of the S&P 500's total gains since the March bottom have come overnight. Even though much of SPY's gains since inception have come overnight, it's rare to see so much of it during the initial leg off of a low. There is some slight evidence that this is a negative, compared to rallies off of a low that's driven more by gains during the regular day session.
FORECAST / TIMEFRAME
None
|
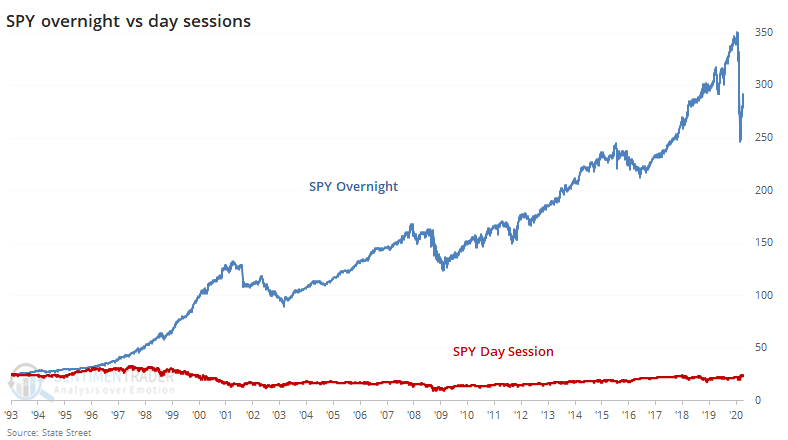
It seems like every day, stocks jump overnight, only to see gains evaporate, or at least moderate, during the day session. That's frustrating for many traders who can't take advantage of overnight hours.
It's not a new phenomenon, though. Most of the gains in SPY since its inception have come while domestic traders are sleeping.
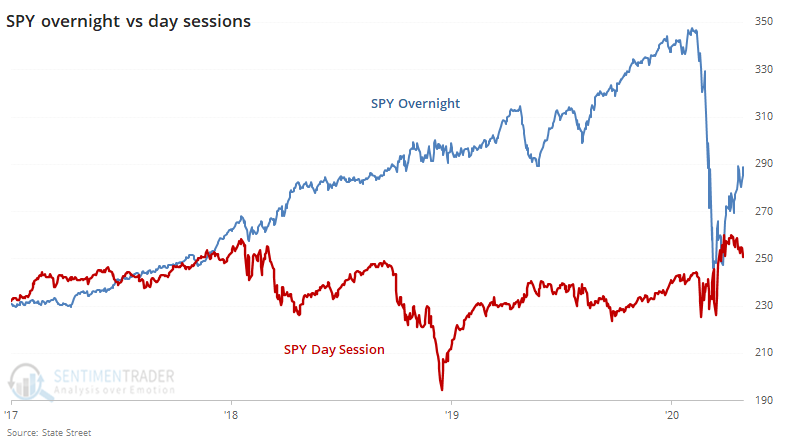
Over the past few years, while stocks soared, we can see that the overnight vs day session divergence was just as stark.
In the 30 days following the March 23 low, most of SPY's gains have come overnight. While that's not a surprise to anyone who's been watching the markets lately, it is an unusual pattern. During most 30-day rallies off of at least a 6-month low, the day session has accounted for less than 75% of total gains only a handful of times.
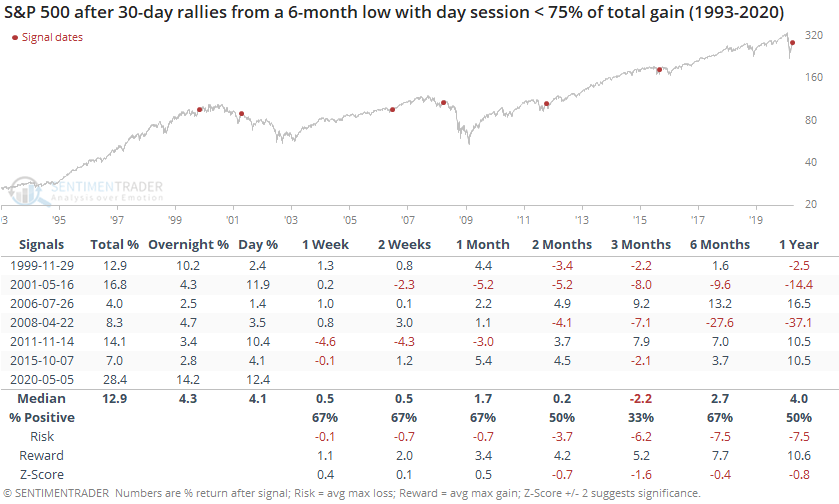
When the overnight session accounted for a significant part of the gains, the next few months proved to be a tough row to hoe, with SPY adding to its gains twice and losing four times. And one of those saw a pretty hefty drawdown first.
Contrast that with times when the bulk of total gains during the initial 30 days of a rally occurred during the day.
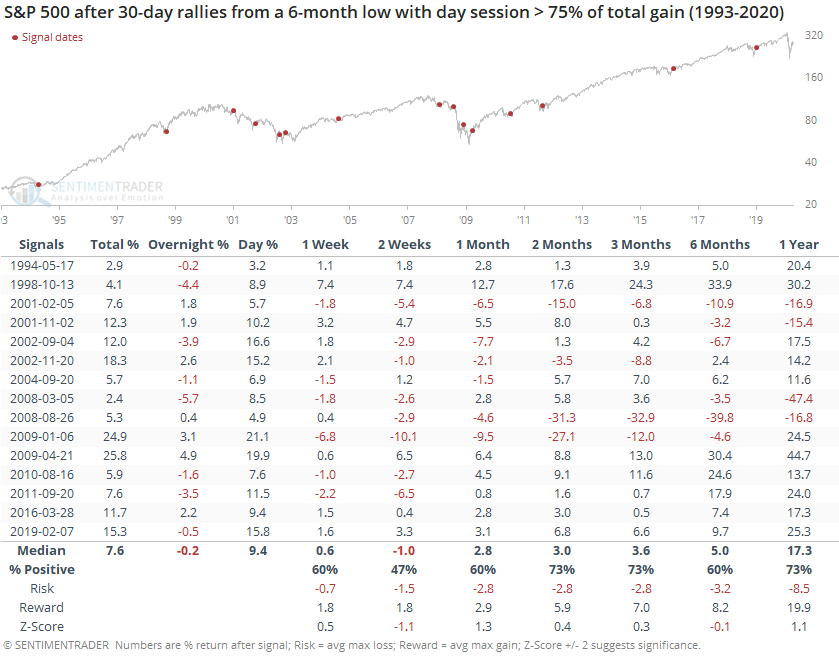
In these cases, the S&P suffered a bit more shorter-term but had more sustainable gains longer-term. Over the next three months, SPY returned an average of +3.6% (versus -2.2% when the overnight session powered more of the total gains) and was positive 73% of the time (versus 33% of the time).
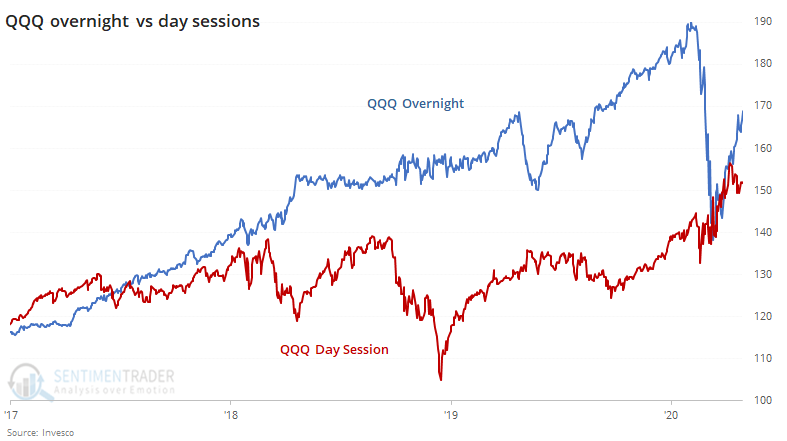
This is not just a SPY thing. The overnight session has driven most of the gains in the big-tech QQQ fund, too.
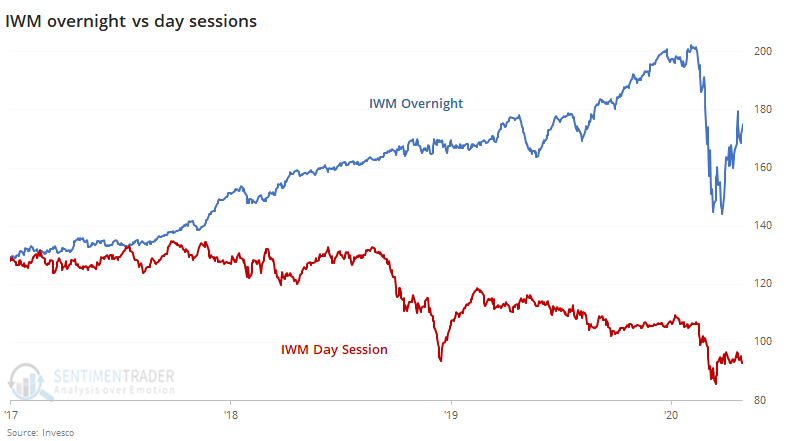
It's been especially prevalent in the small-cap IWM fund.
Every time stocks gap up big in the morning and then sell off, there is a round of conspiracy talk about who's fleecing whom. No doubt, some of it is due to games being played by large market participants, taking advantage of a pattern when they can. It's not a new thing; it's been going on for decades.
As to whether it means anything, that's not clear. There is a bit of evidence that rallies off a low that saw much of the gains driven by overnight trading were more likely to fall back in the months ahead than were the rallies driven more by "natural" gains during the day session. The edge is relatively weak given the small sample sizes, so the suggestion is that it's more of a "hmmm..." kind of warning as opposed to an outright signal to sell.
BOTTOM LINE
The Nasdaq Composite turned positive for the year, after suffering more than a 20% drawdown. This is one of the only times it has clawed back from such a large YTD pullback, especially so early in the year. The big gains in tech have pushed the QQQ fund above the $100 billion market cap threshold, joining few others.
FORECAST / TIMEFRAME
None
|
The remarkable run in stocks, primarily tech, pushed enough to turn the Nasdaq Composite positive for the year. That erases a more than 23% decline at its nadir.
Below, we can see how the index performed following the other times it erased more than a 10% year-to-date decline. Note that these are specifically year-to-date declines, so even if the index was in the midst of a pullback, the return reset to 0 on the first day of each year.
Most fund managers are graded based on calendar returns anyway, and not drawdowns from a peak, so the table will allow us to see if turning positive YTD generated some performance anxiety and a burst of additional buying pressure.
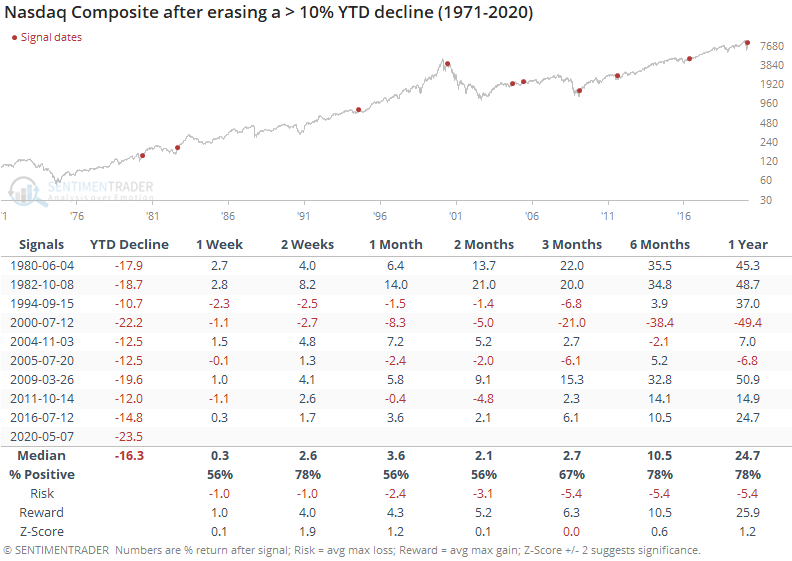
The only time it recovered from a more than 20% decline was in 2000, which wasn't the best signal going forward. Almost immediately after turning positive for the year, it made an about-face and fell into the post-bubble plunge. The only time it recovered from a 10% YTD decline earlier in the year than now was in 2009, which was a great sign for forward returns.
Overall, it showed some mixed performances in the months ahead, with returns about in line with random and a mostly uninspiring risk/reward ratio, especially over the next 1-3 months.
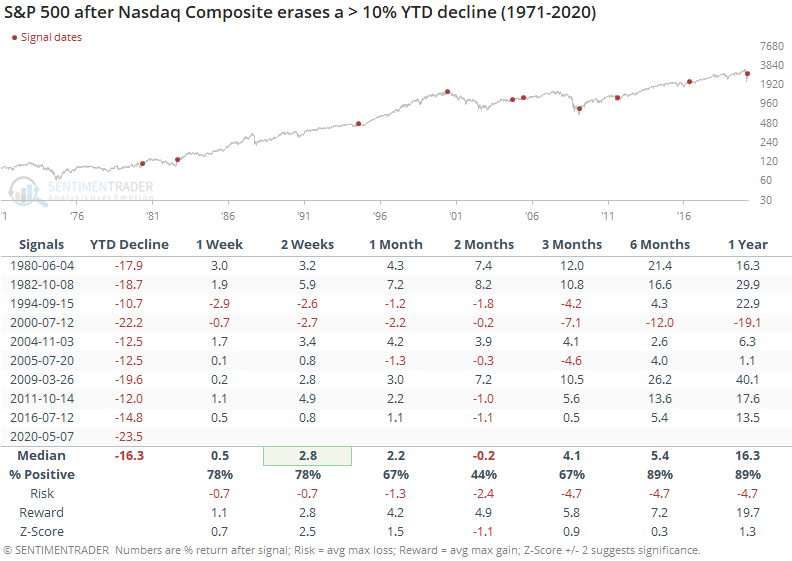
For the S&P 500, the Nasdaq's recoveries were less positive over the next two months, with more losses than gains, even if those losses were small. But over the next 6-12 months, it sported a positive return except for 2000.
The run in tech stocks, particularly the largest ones, have pushed the go-to ETF above a $100 billion market cap.
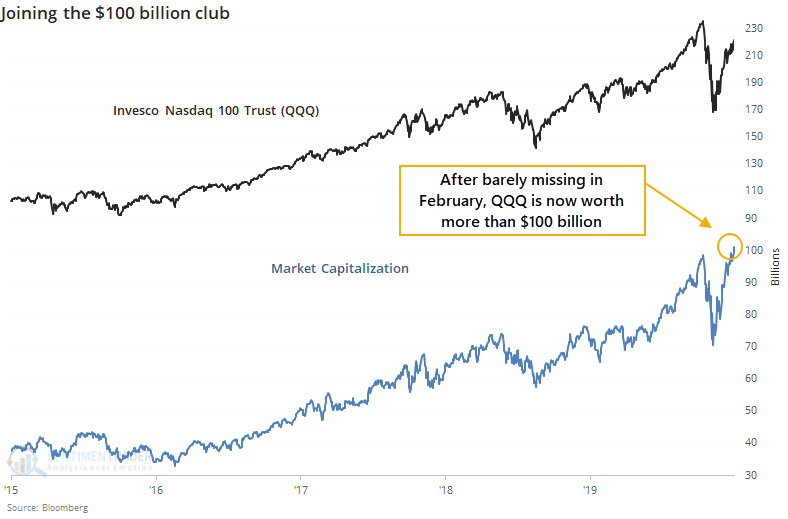
There are only four other ETFs that are in this club, all focused on either the S&P 500 or the broader market. There isn't anything magical about the $100 billion threshold, other than perhaps as a sign of intense interest on the part of investors. It's interesting to note that from 2-4 weeks after the others first surpassed $100 billion, the funds fell back.
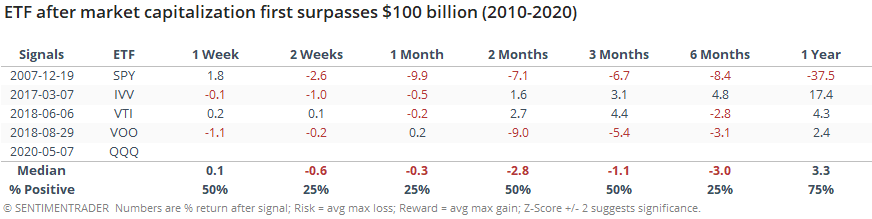
That's a slight worry here, along with all the other tech-love sentiment that we're seeing. The fact that tech has turned positive for the year hasn't proved to be a reliable reason to expect further gains, especially over the medium-term. While we're not seeing much that's a screaming sell signal, net positives are getting harder to come by, particularly for tech.
Active Studies
| Time Frame | Bullish | Bearish | | Short-Term | 0 | 6 | | Medium-Term | 12 | 0 | | Long-Term | 37 | 3 |
|
Indicators at Extremes
Portfolio
| Position | Weight % | Added / Reduced | Date | | Stocks | 49.9 | Reduced 10.3% | 2020-04-23 | | Bonds | 0.0 | Reduced 6.7% | 2020-02-28 | | Commodities | 5.1 | Added 2.4%
| 2020-02-28 | | Precious Metals | 0.0 | Reduced 3.6% | 2020-02-28 | | Special Situations | 0.0 | Reduced 31.9% | 2020-03-17 | | Cash | 45.0 | | |
|
Updates (Changes made today are underlined)
In the first months of the year, we saw manic trading activity. From big jumps in specific stocks to historic highs in retail trading activity to record highs in household confidence to almost unbelievable confidence among options traders. All of that came amid a market where the average stock couldn't keep up with their indexes. There were signs of waning momentum in stocks underlying the major averages, which started triggering technical warning signs in late January. The kinds of extremes we saw in December and January typically take months to wear away, but the type of selling in March went a long way toward getting there. When we place the kind of moves we saw into March 23 into the context of coming off an all-time high, there has been a high probability of a multi-month rebound. After stocks bottomed on the 23rd, they enjoyed a historic buying thrust and retraced a larger amount of the decline than "just a bear market rally" tends to. While other signs are mixed that panic is subsiding, those thrusts are the most encouraging sign we've seen in years. Shorter-term, there have been some warning signs popping up and our studies have stopped showing as positively skewed returns. I reduced my exposure some in late April and will consider further reducing it if we start to see some lower highs and lower lows. Long-term suggestions from the studies remain robust, but shorter-term ones are significantly less so, and stocks still have to prove that we're in something other than a protracted, recessionary bear market.
RETURN YTD: -8.1% 2019: 12.6%, 2018: 0.6%, 2017: 3.8%, 2016: 17.1%, 2015: 9.2%, 2014: 14.5%, 2013: 2.2%, 2012: 10.8%, 2011: 16.5%, 2010: 15.3%, 2009: 23.9%, 2008: 16.2%, 2007: 7.8%
|
|
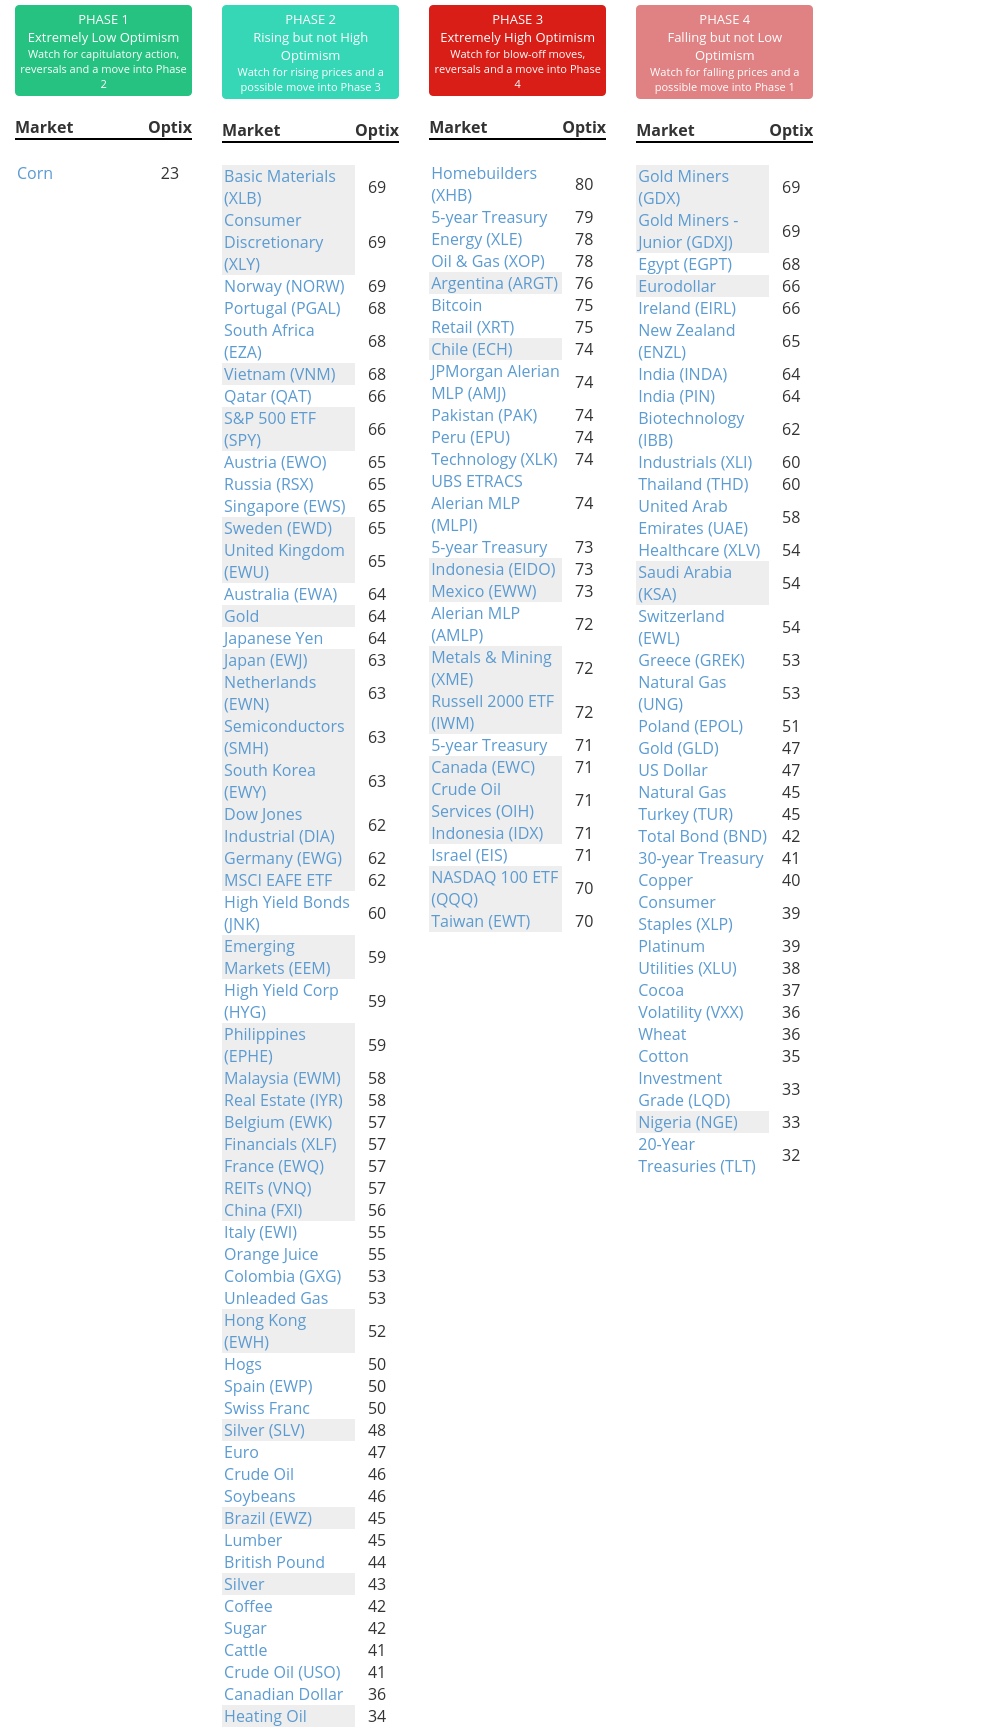
Phase Table
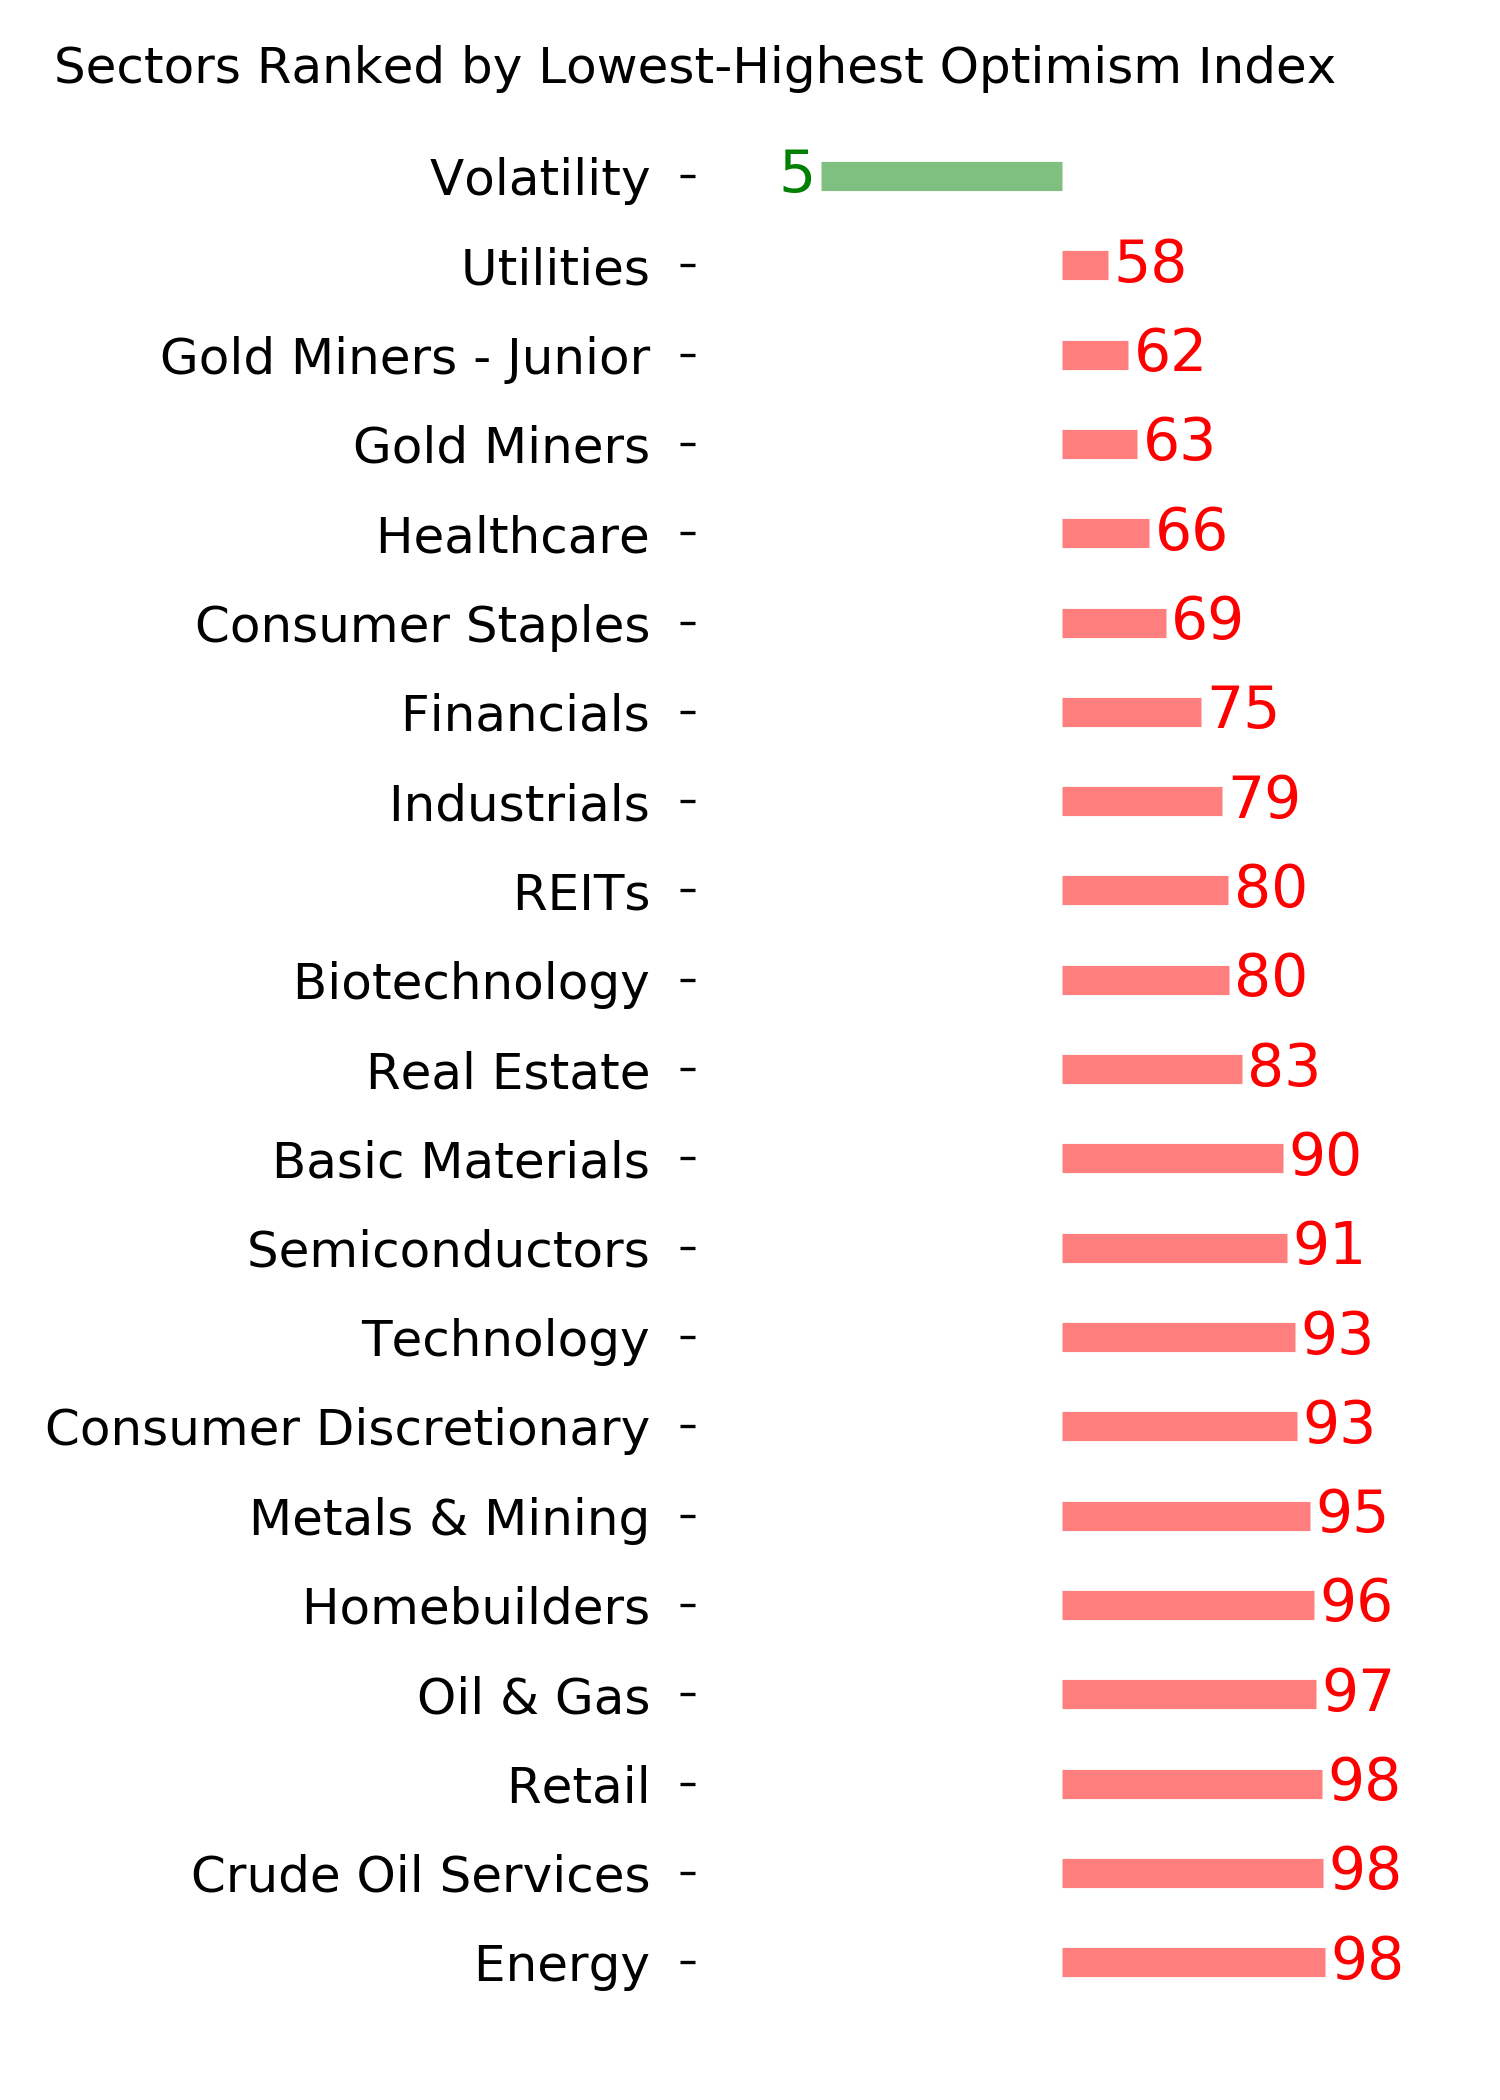
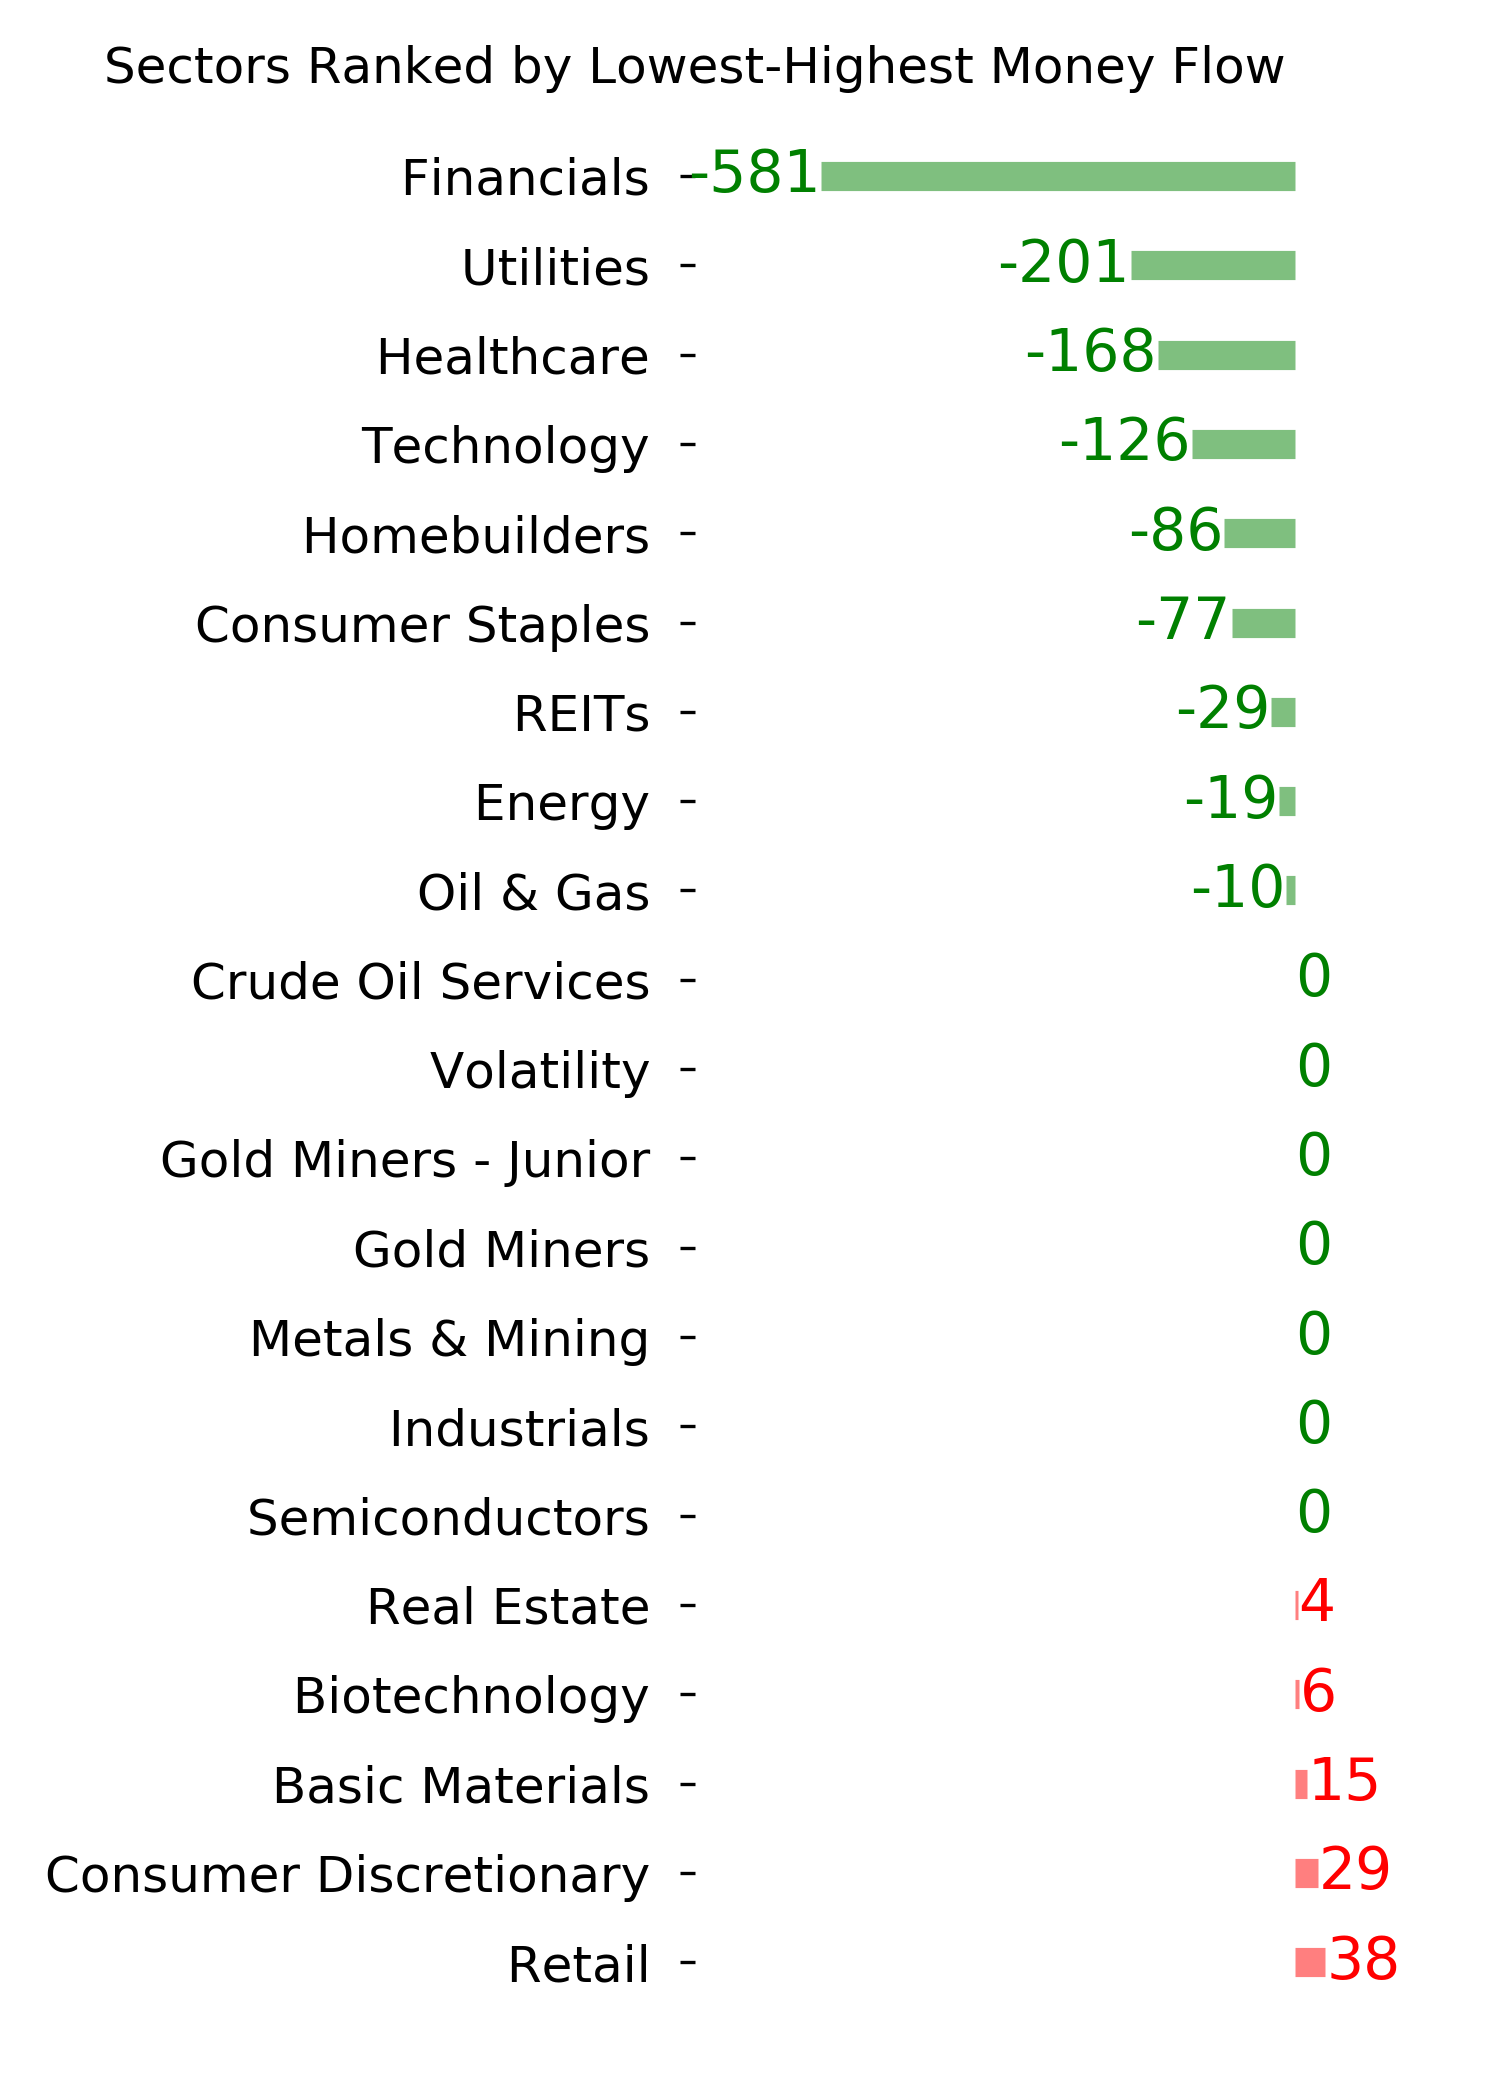
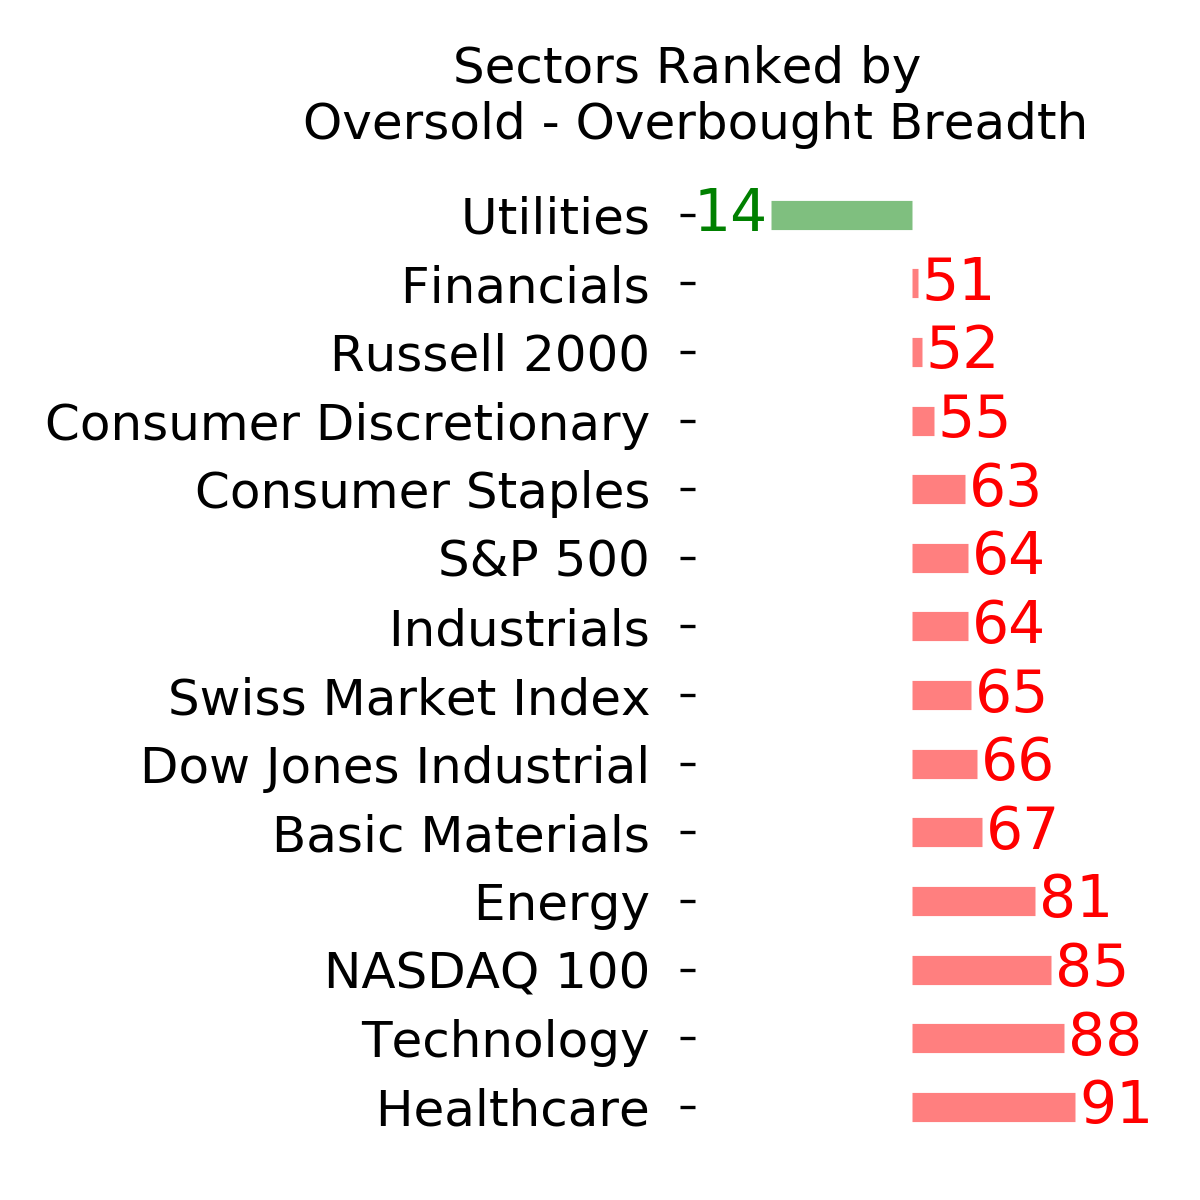
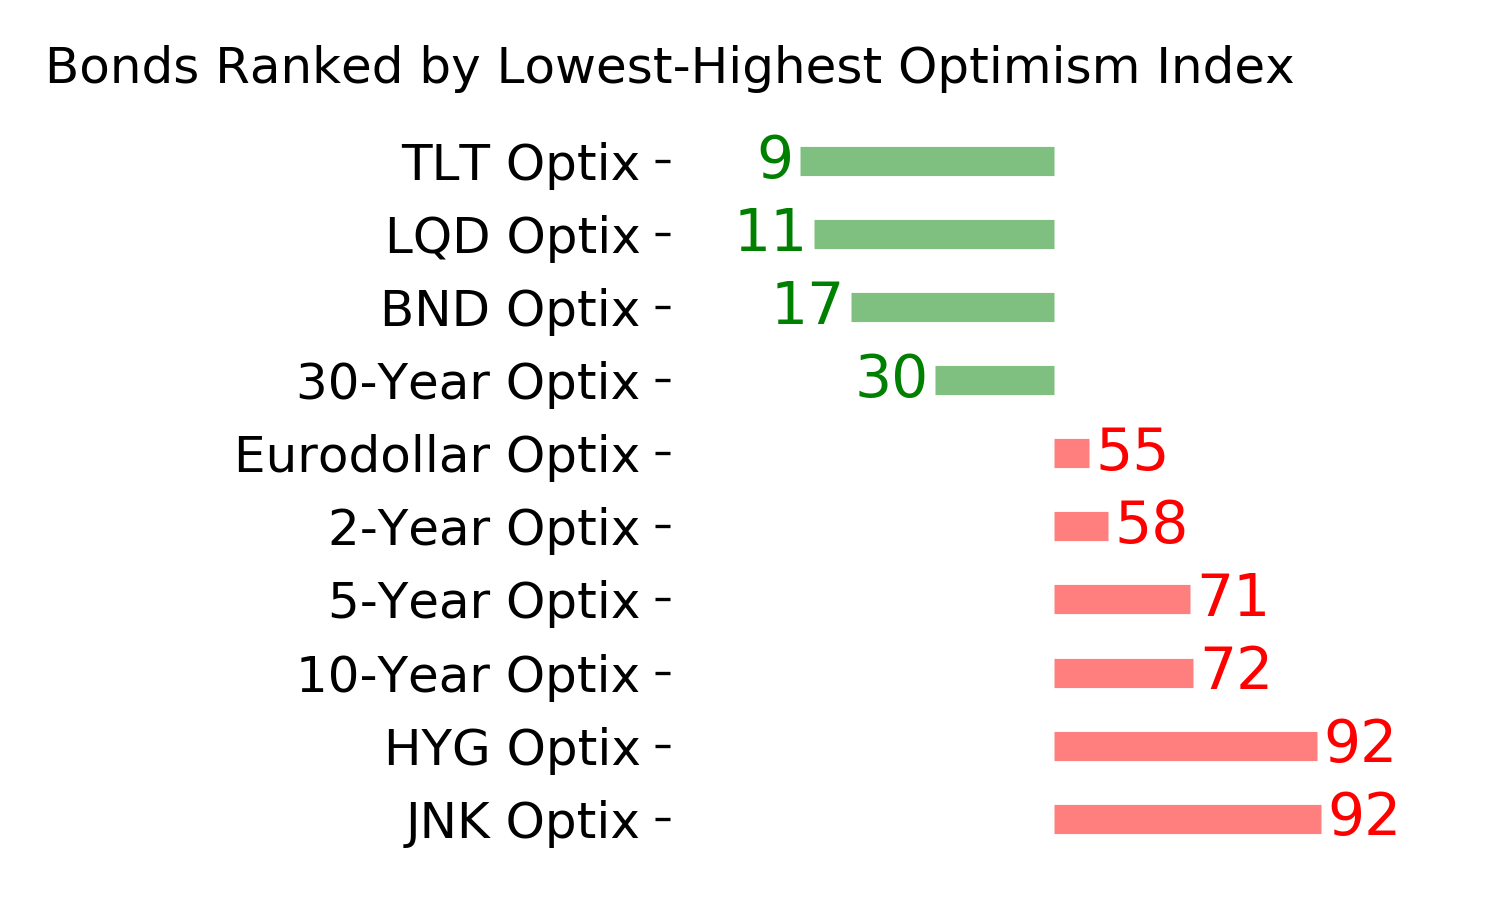
Ranks
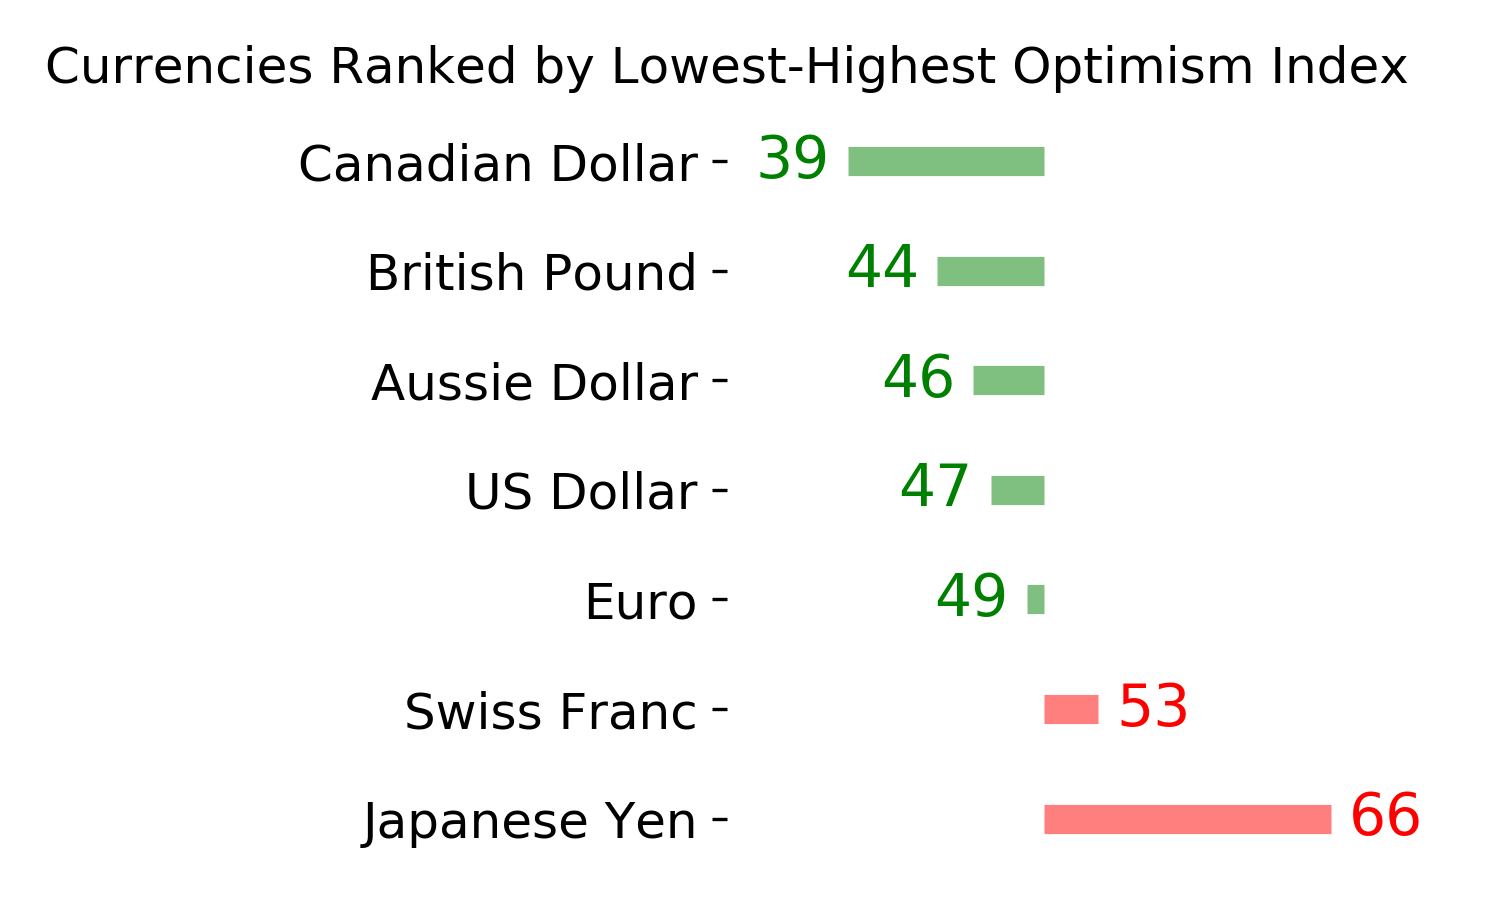
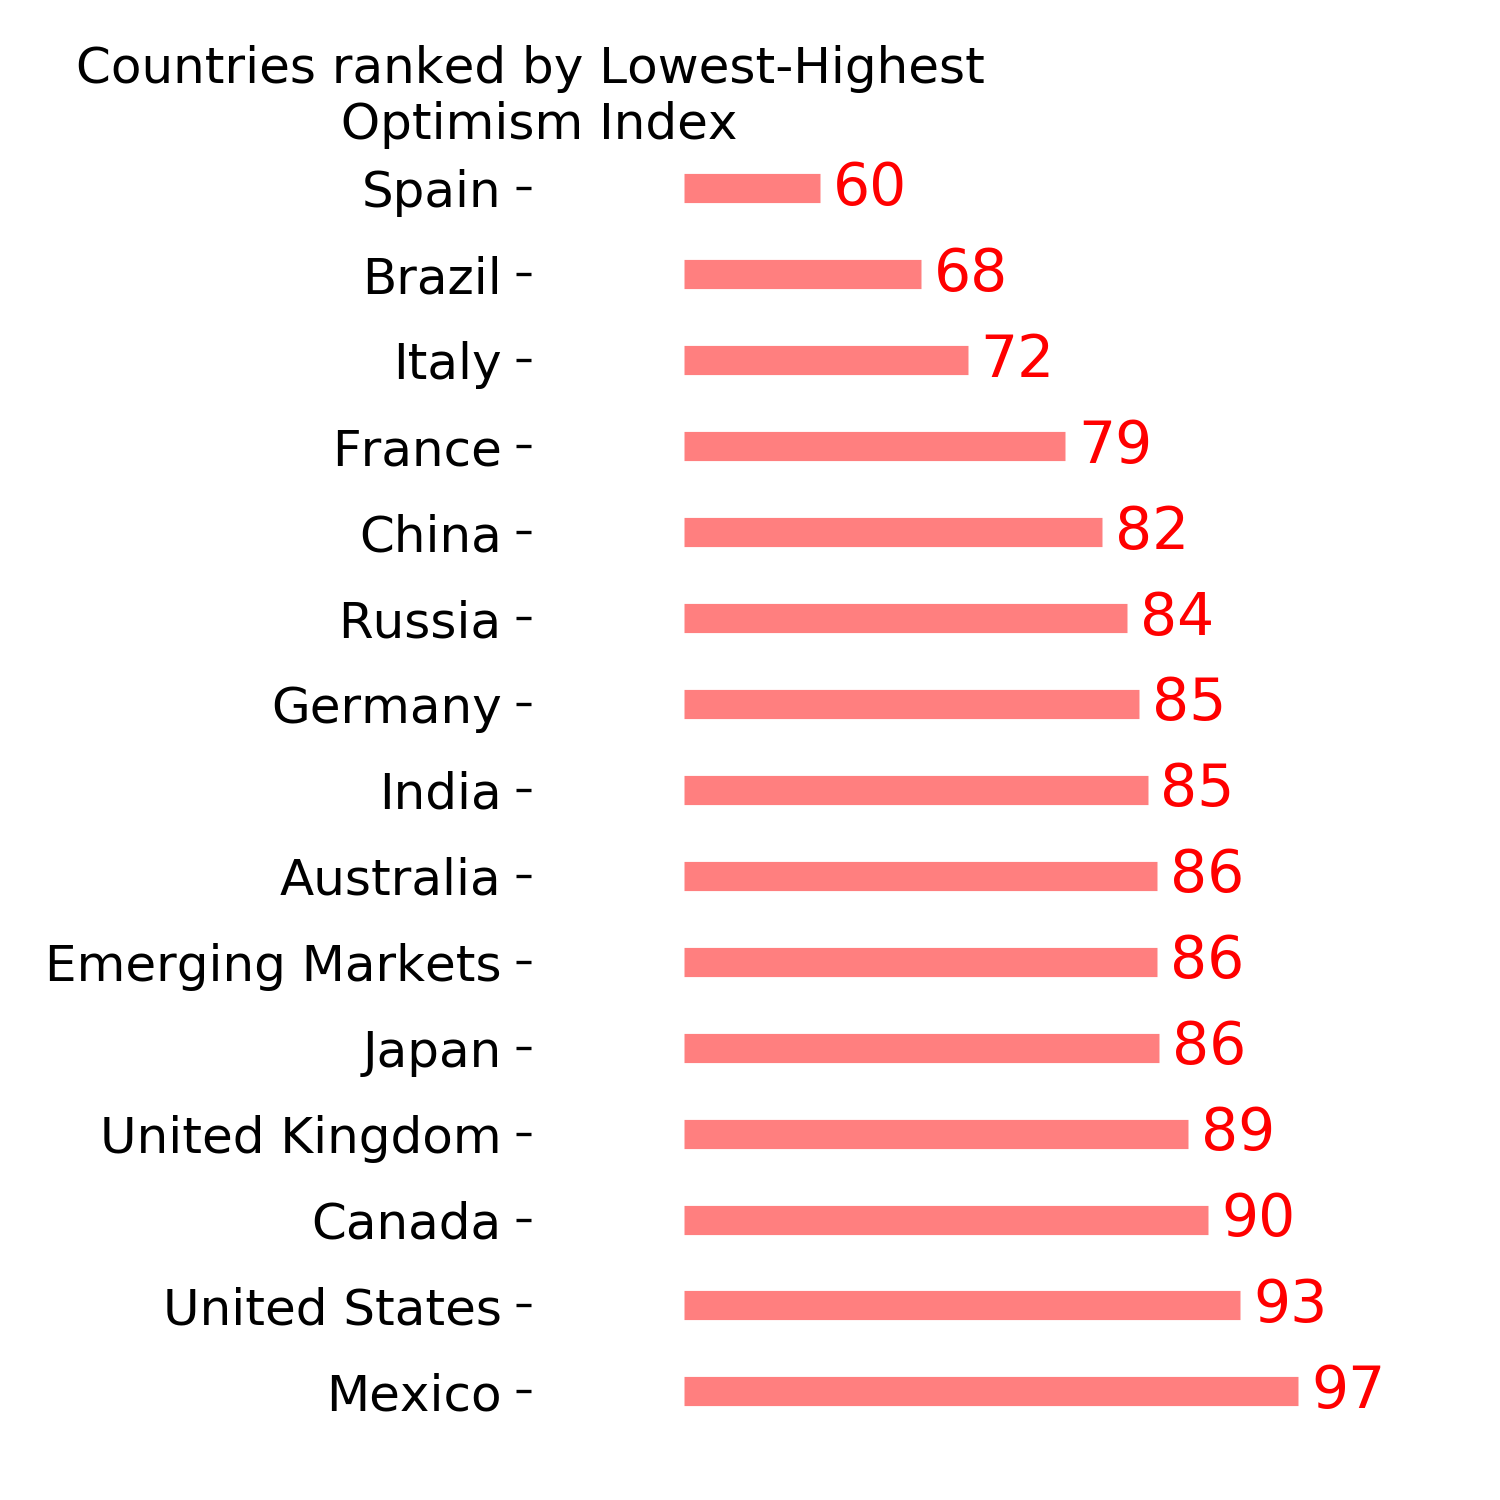
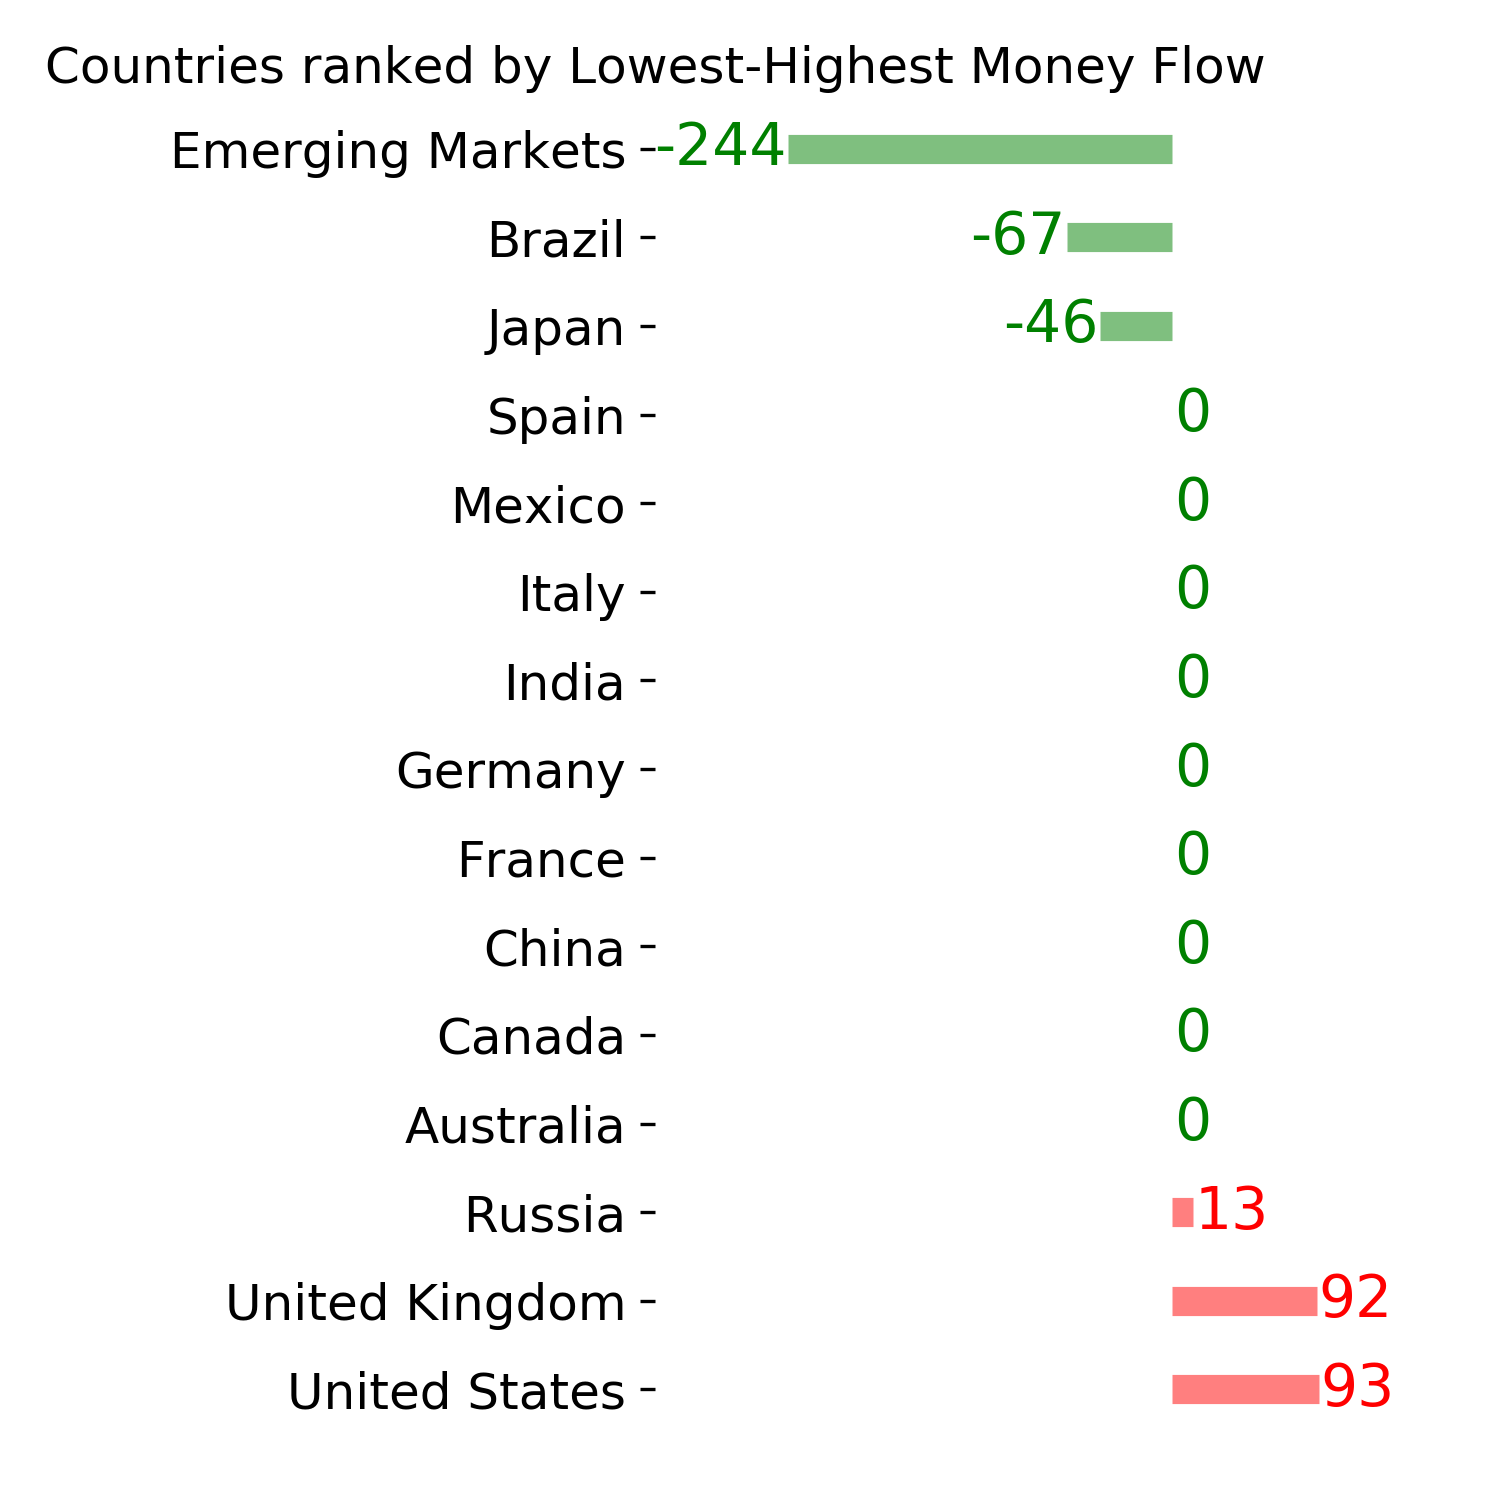
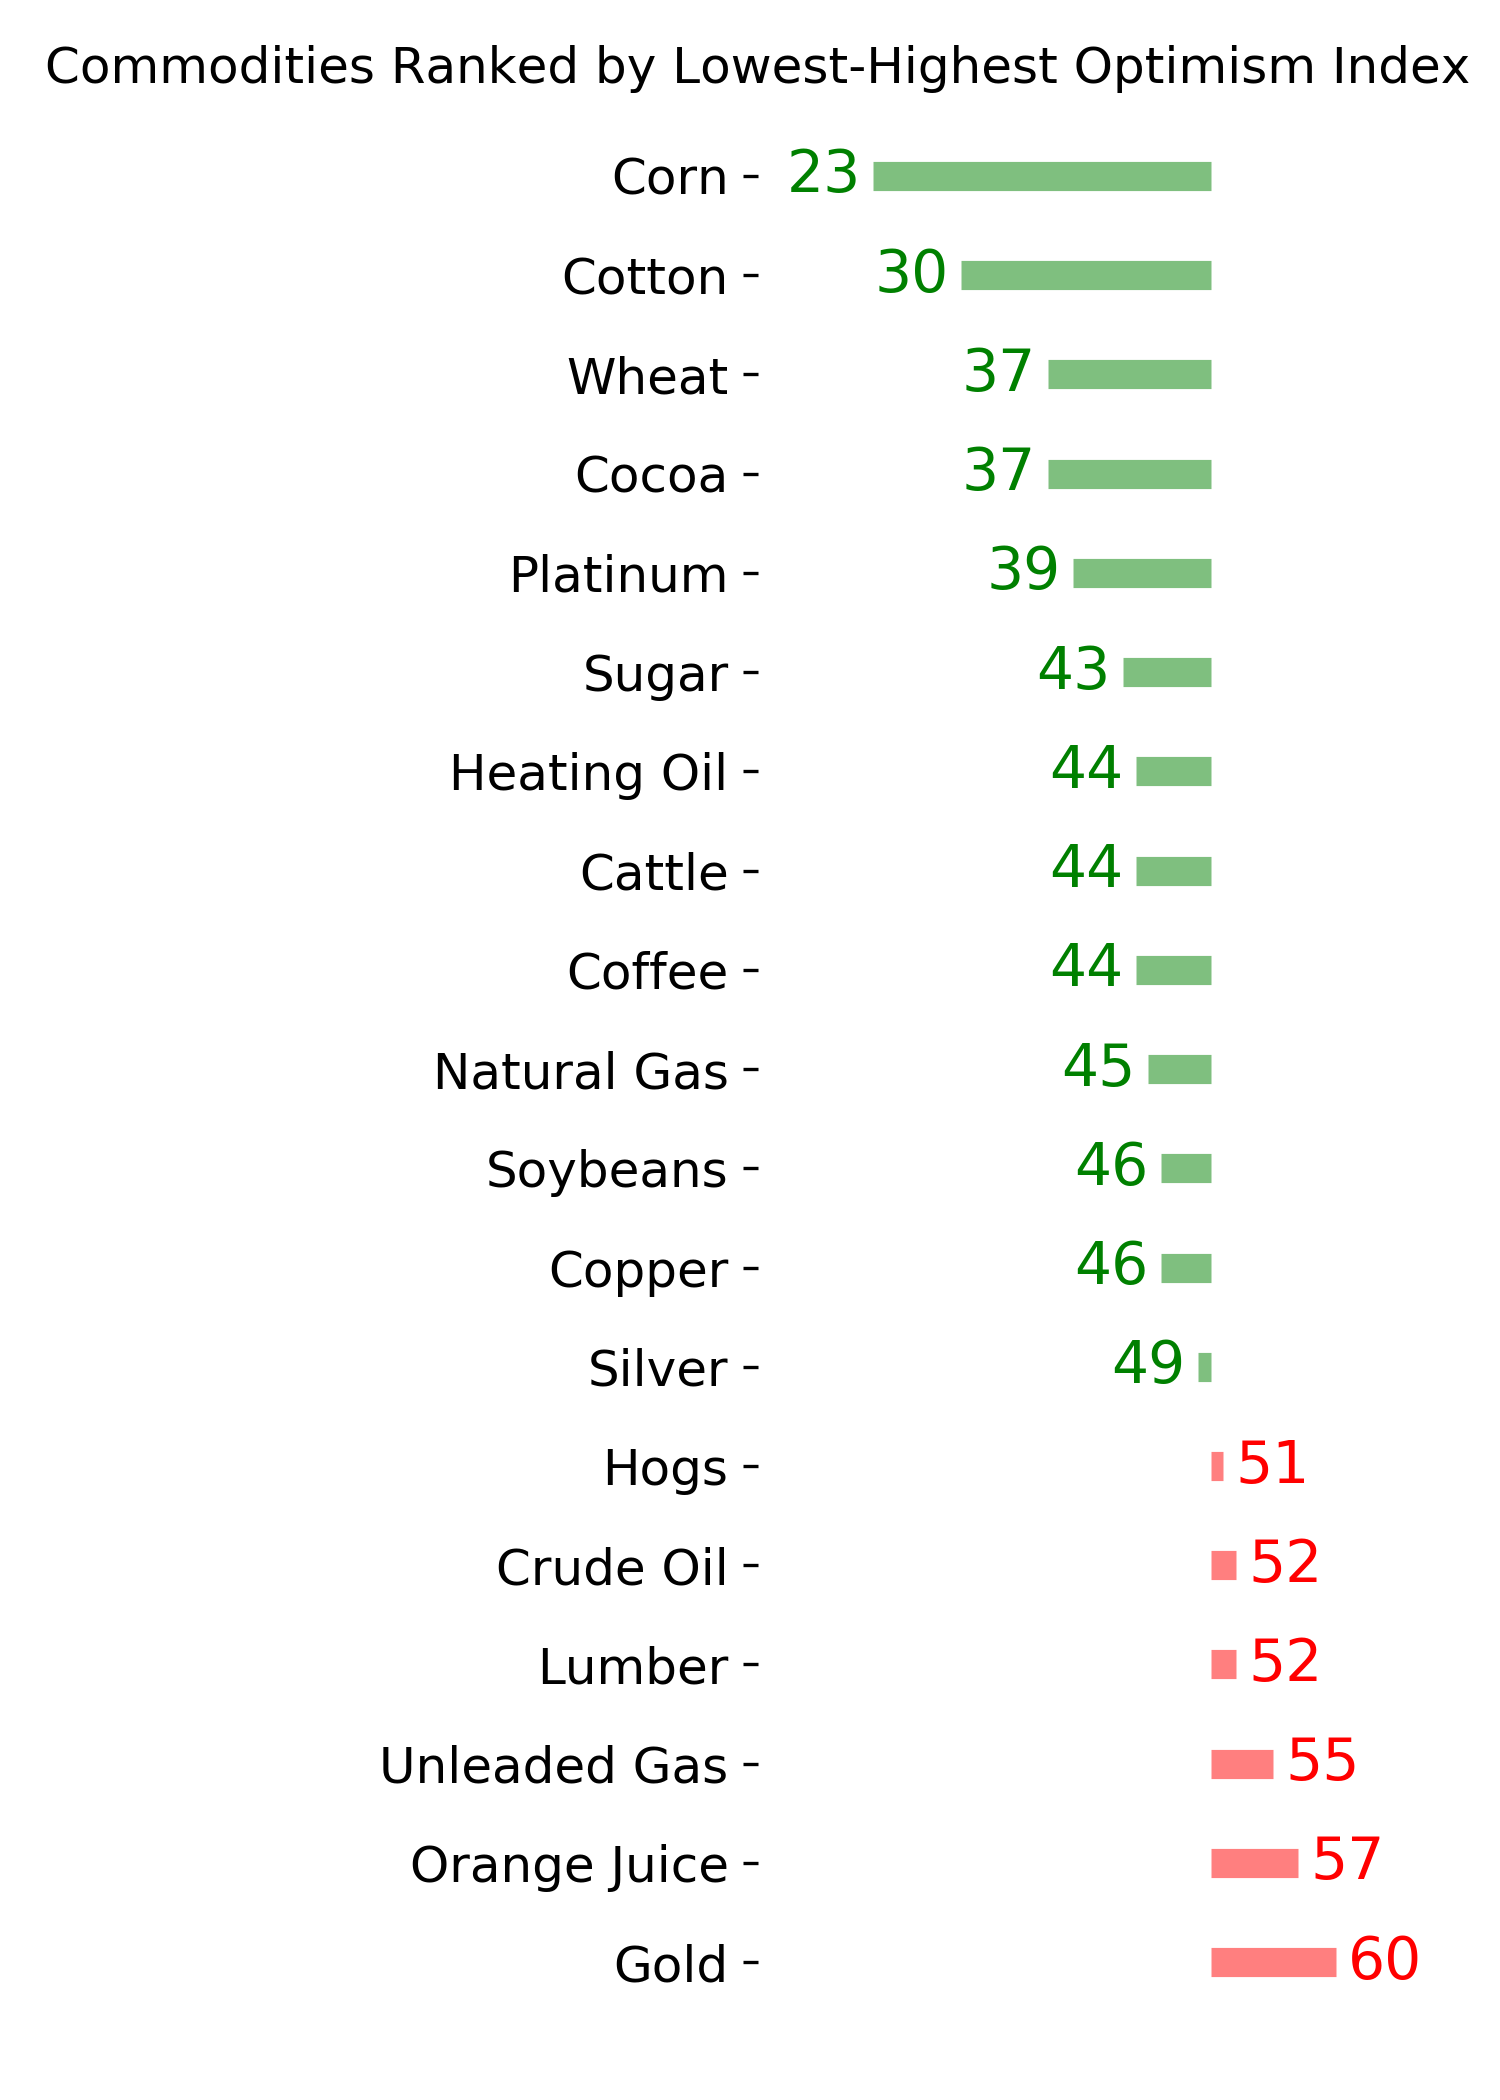
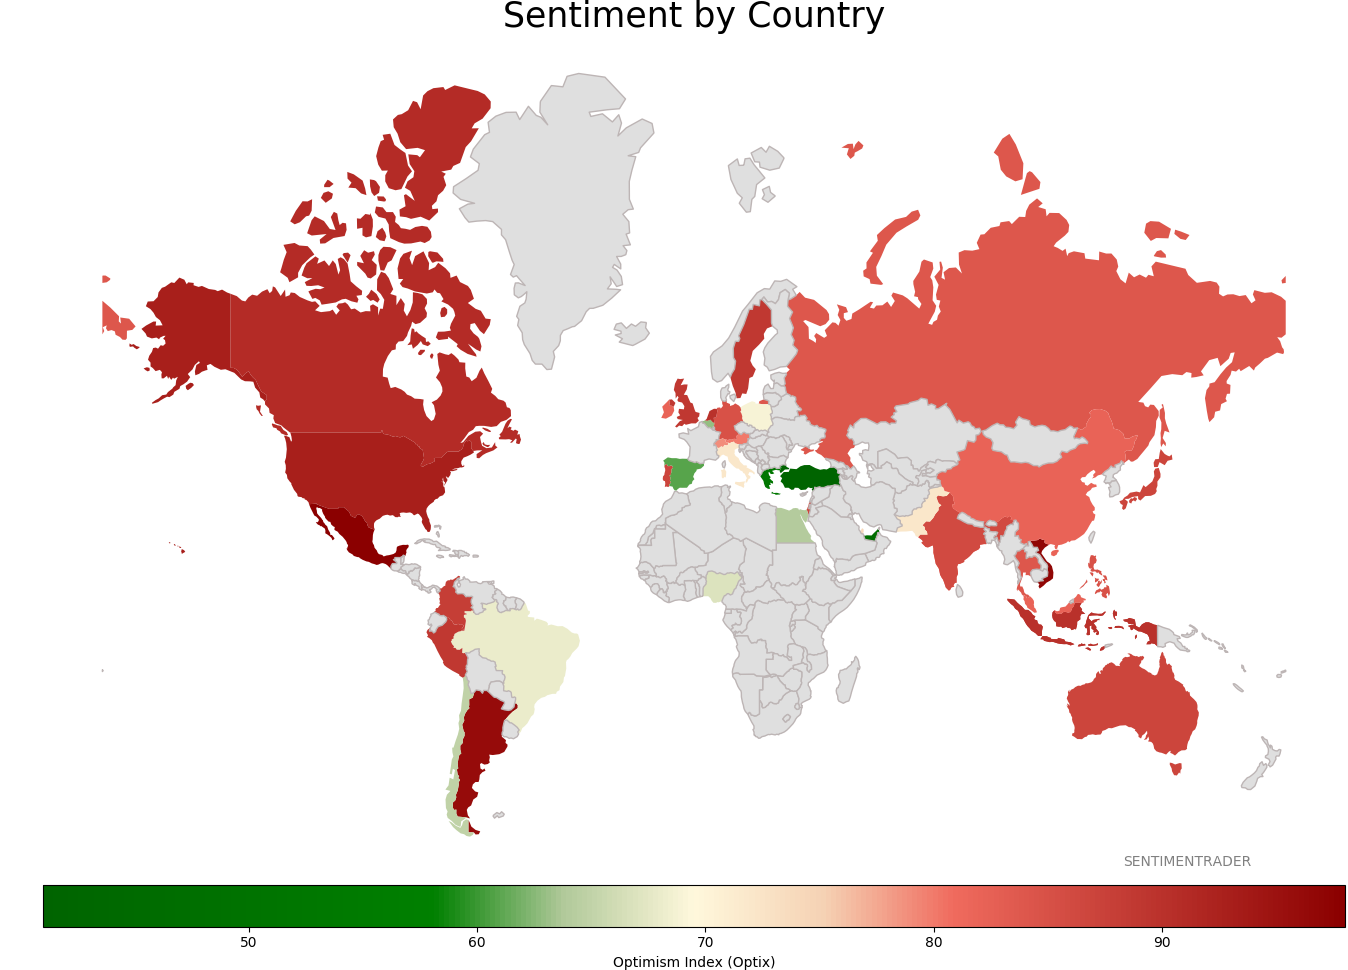
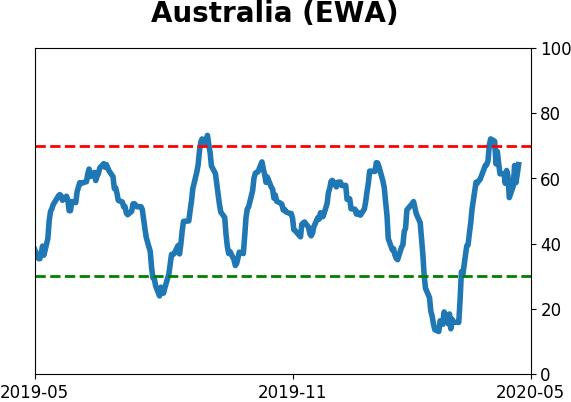
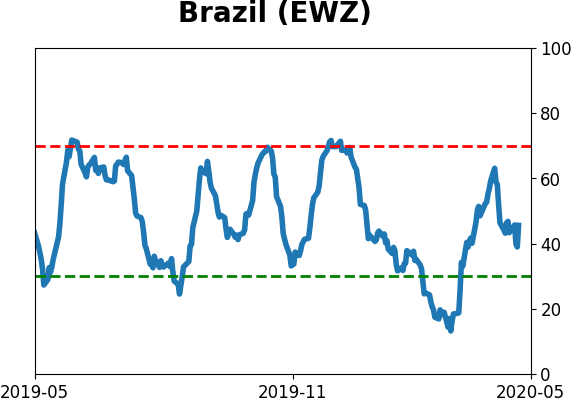
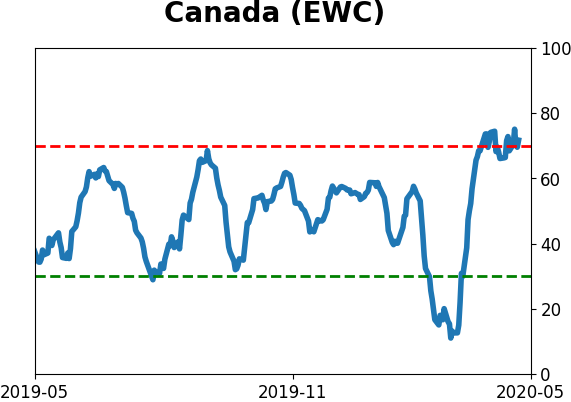
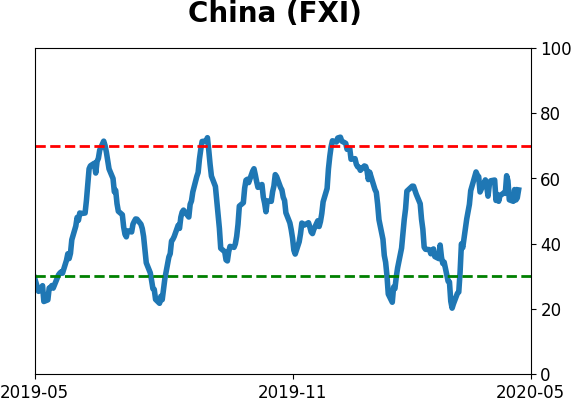
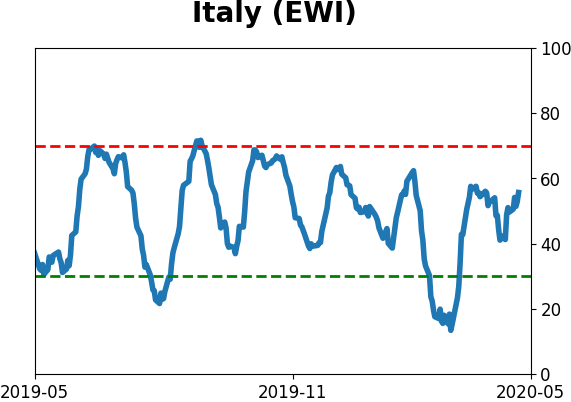
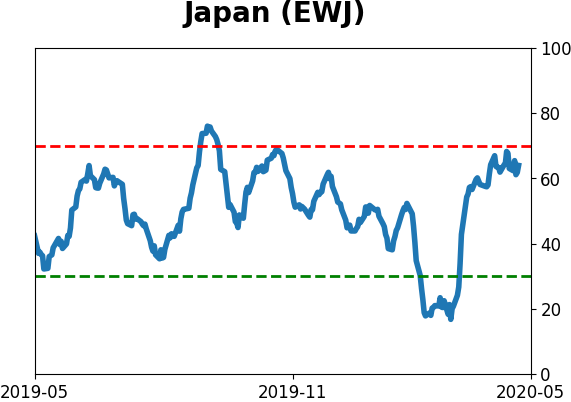
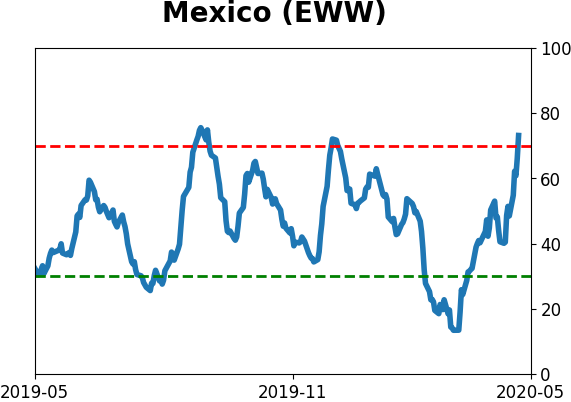
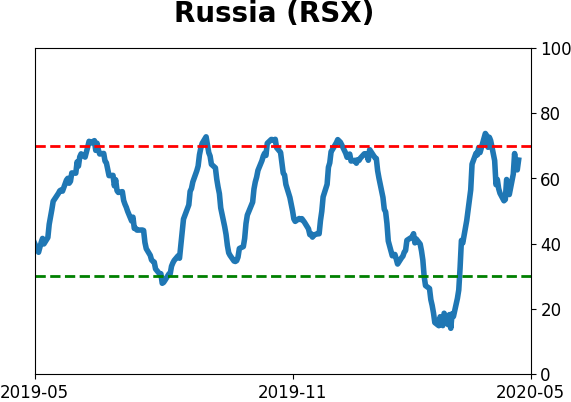
Sentiment Around The World
Optimism Index Thumbnails
|
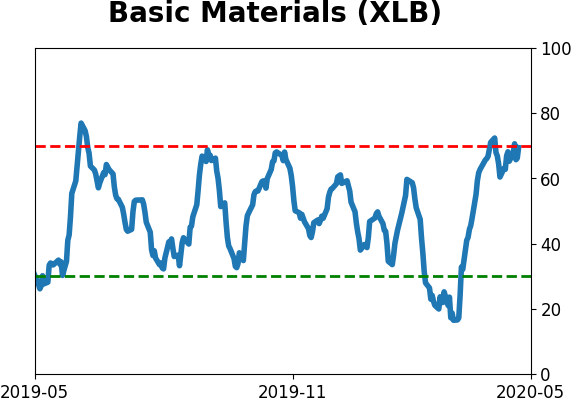
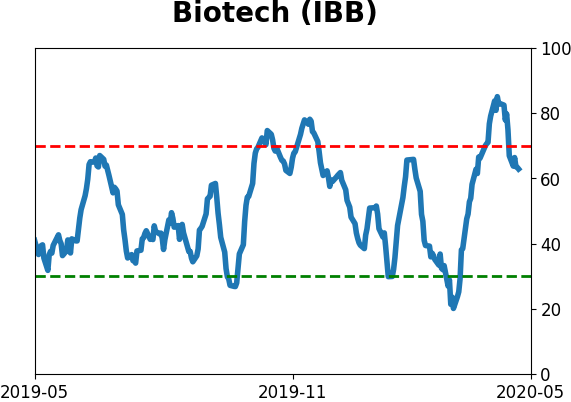
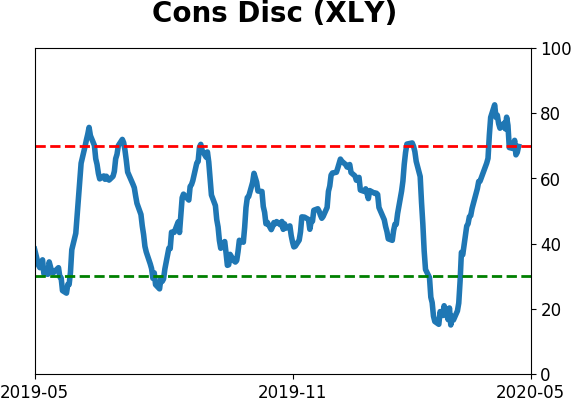
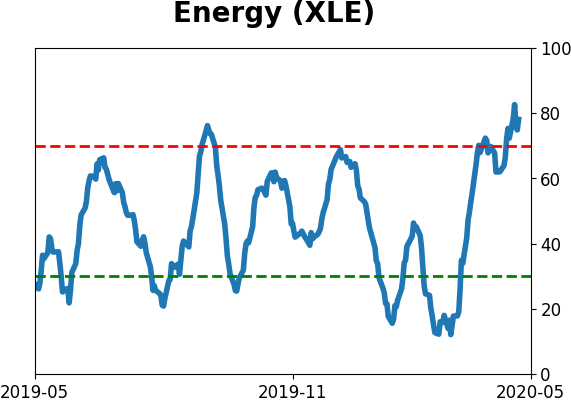
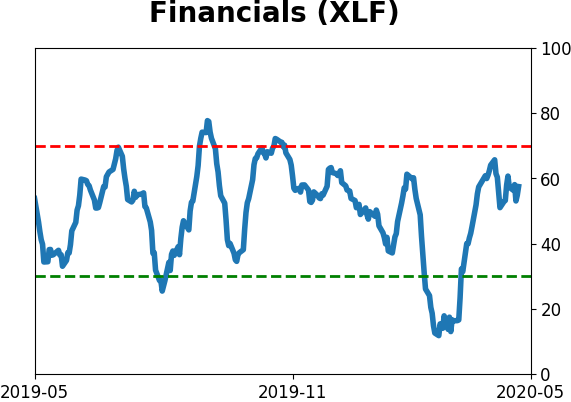
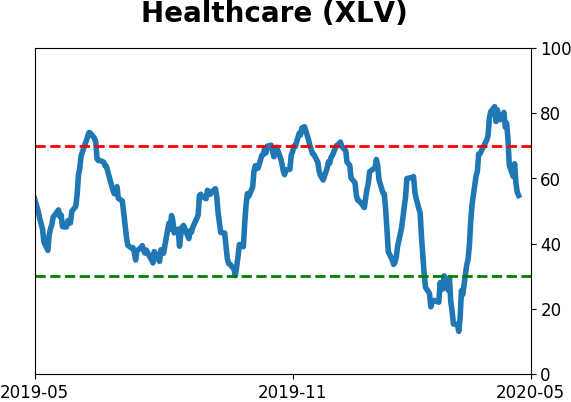
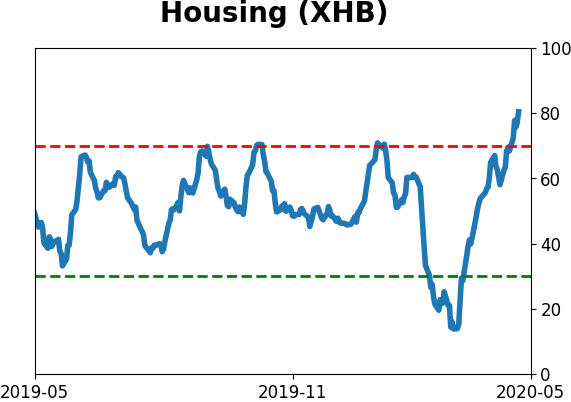
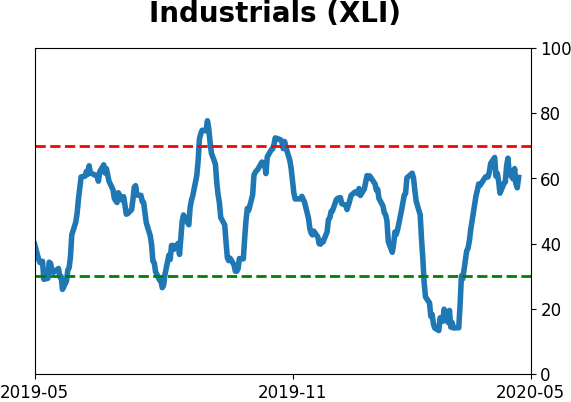
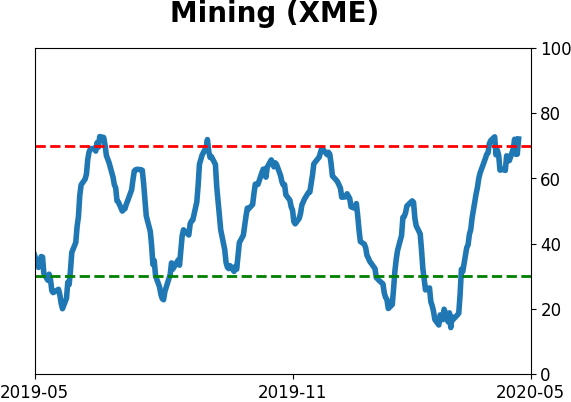
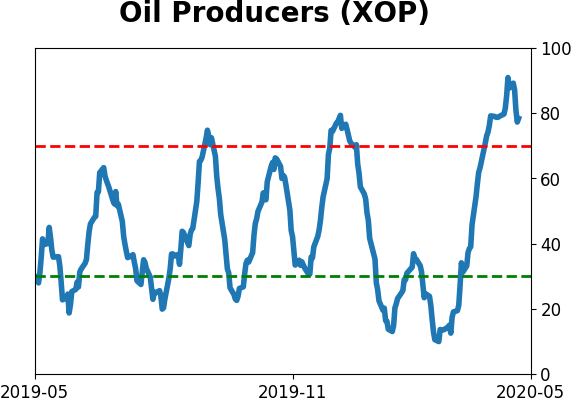
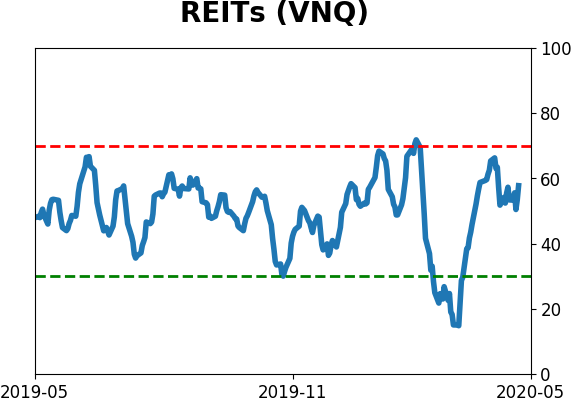
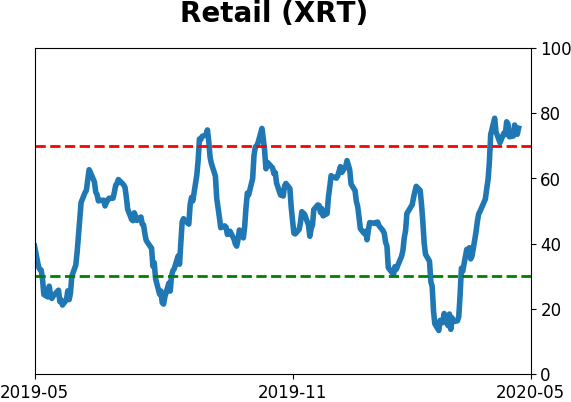
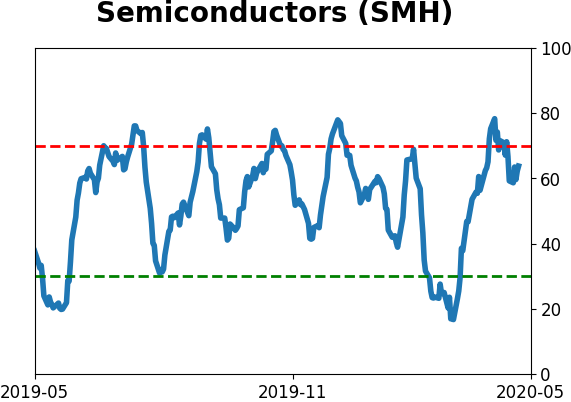
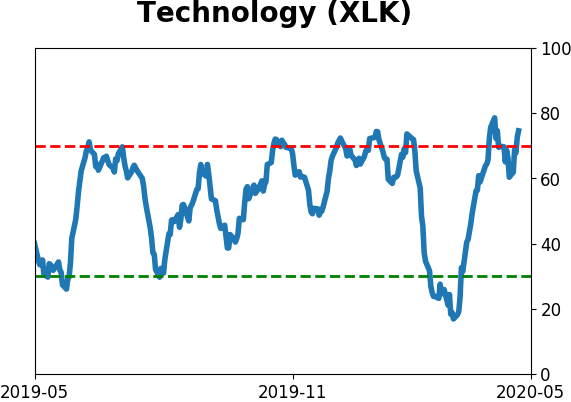
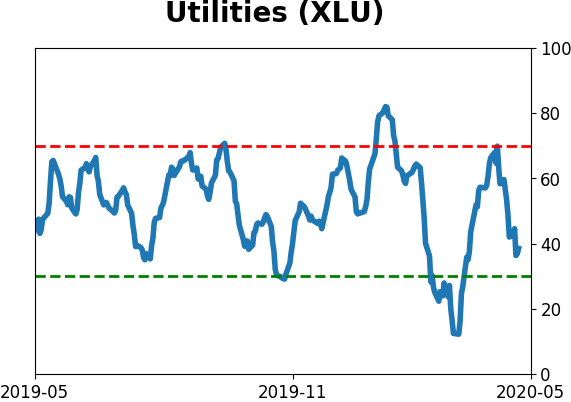
Sector ETF's - 10-Day Moving Average
|
|
|
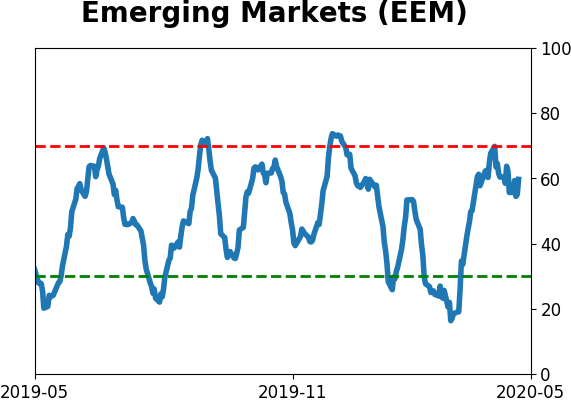
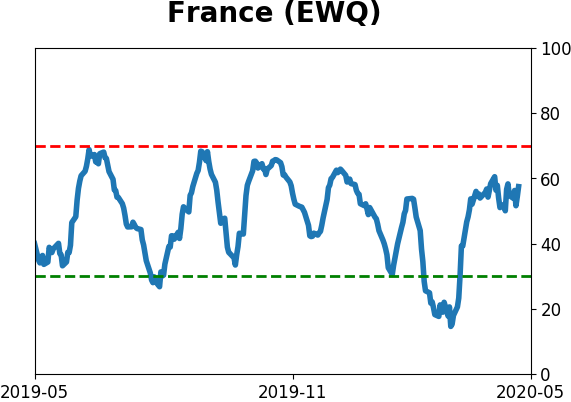
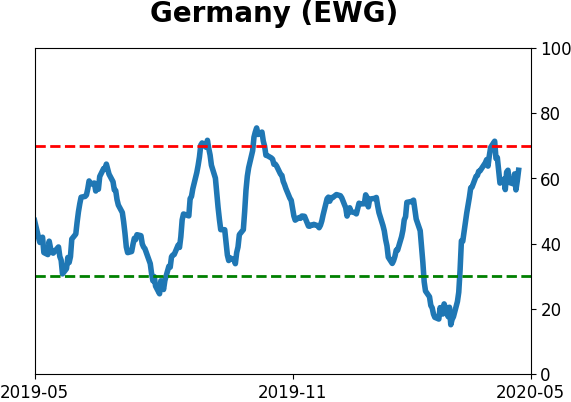
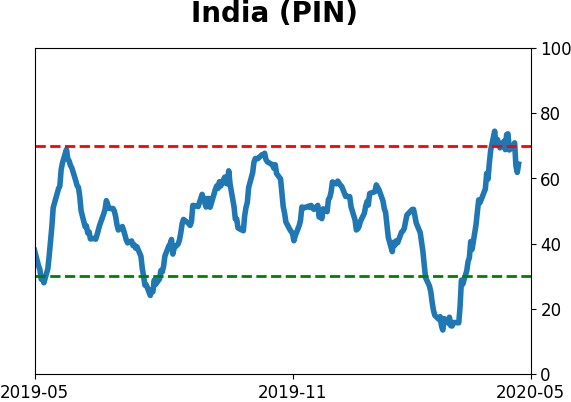
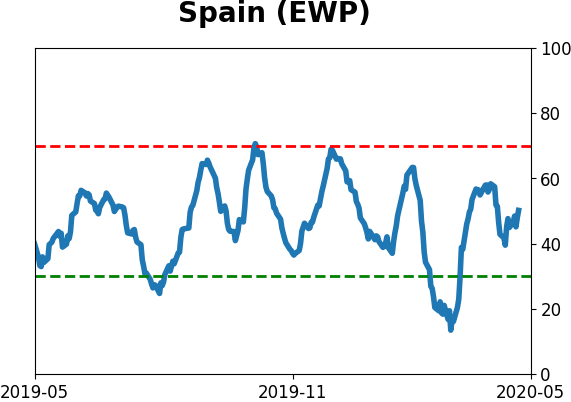
Country ETF's - 10-Day Moving Average
|
|
|
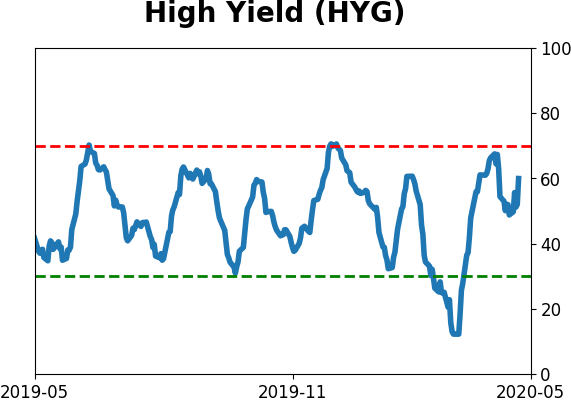
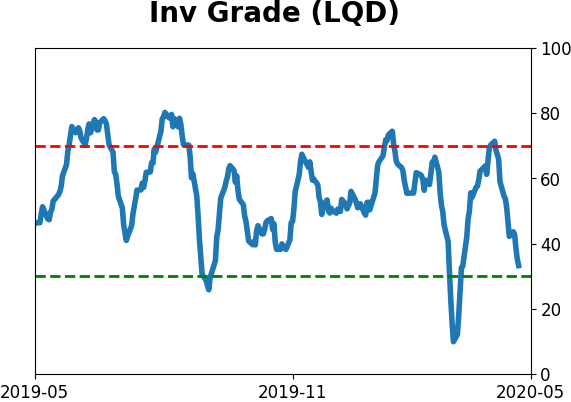
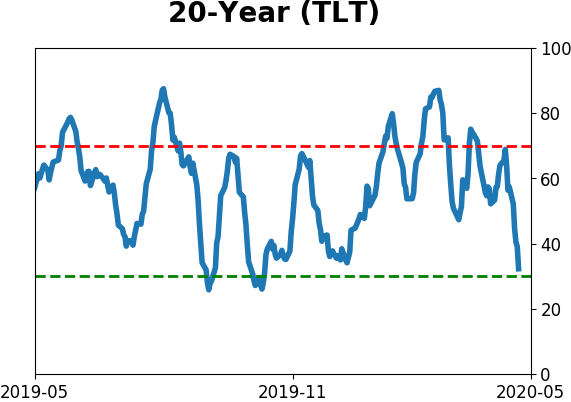
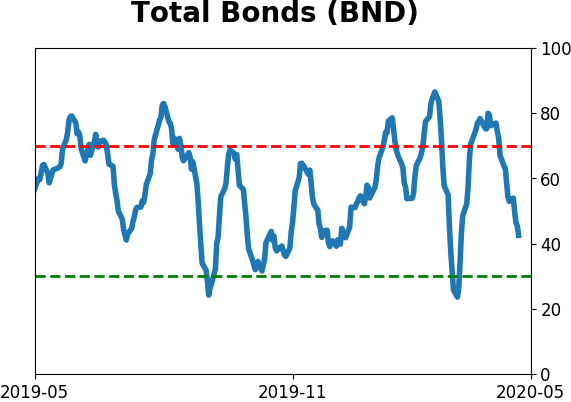
Bond ETF's - 10-Day Moving Average
|
|
|
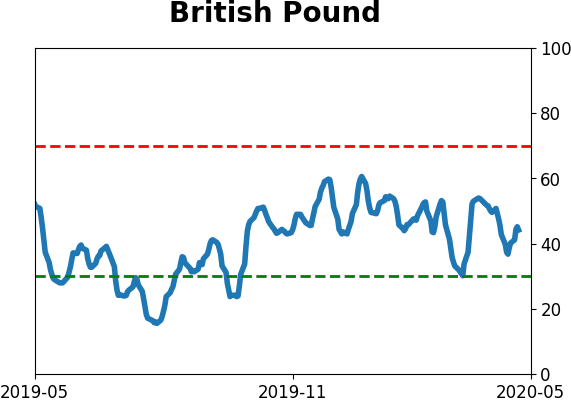
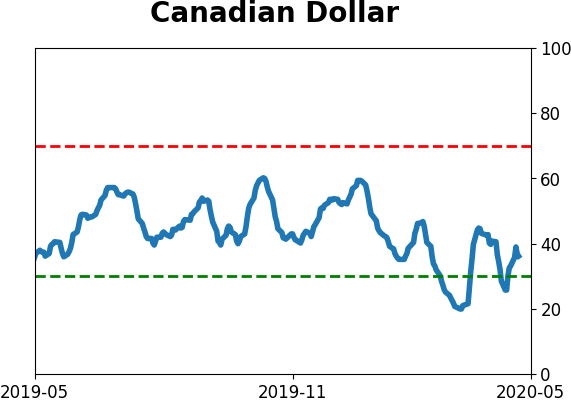
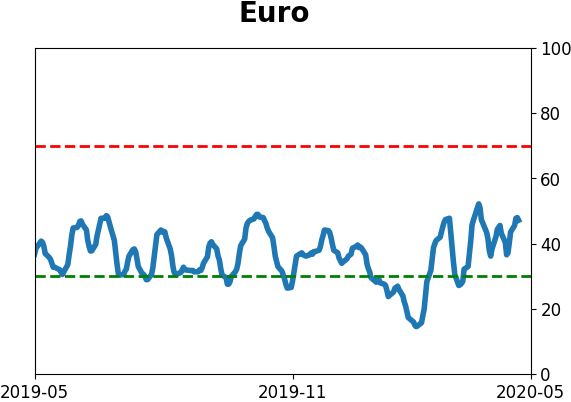
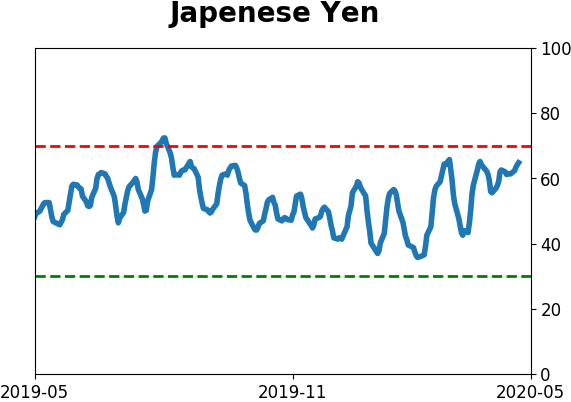
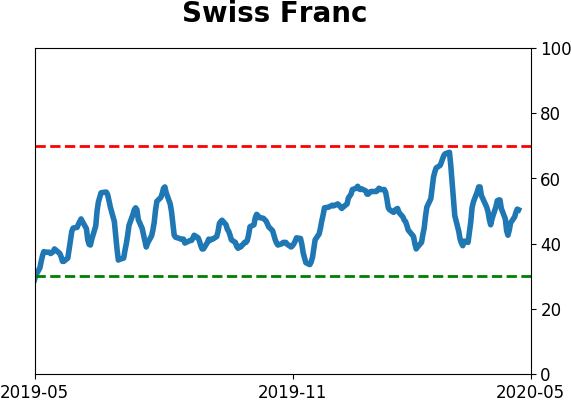
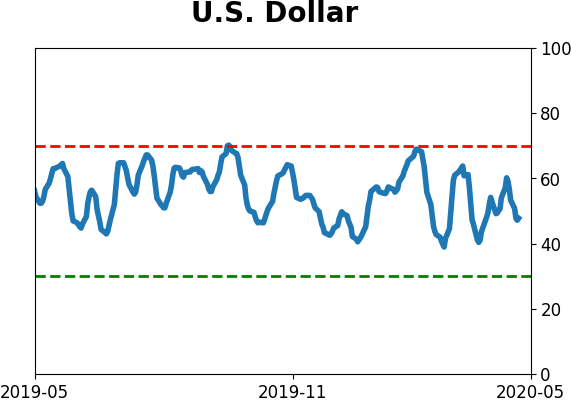
Currency ETF's - 5-Day Moving Average
|
|
|
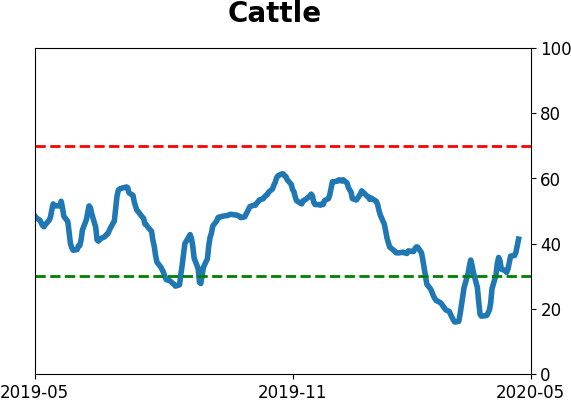
Commodity ETF's - 5-Day Moving Average
|
|