Daily Report : Weekly Wrap for May 7 - Impressive Starts for Stocks, Commodities

| View/Print a PDF version of this Report |
Headlines
|
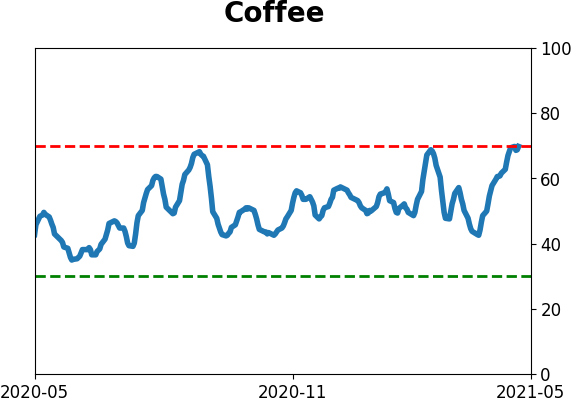
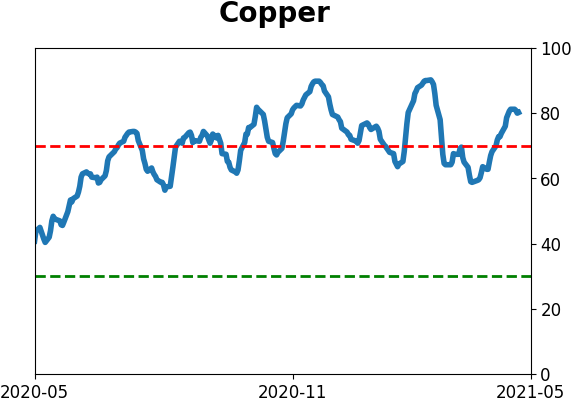
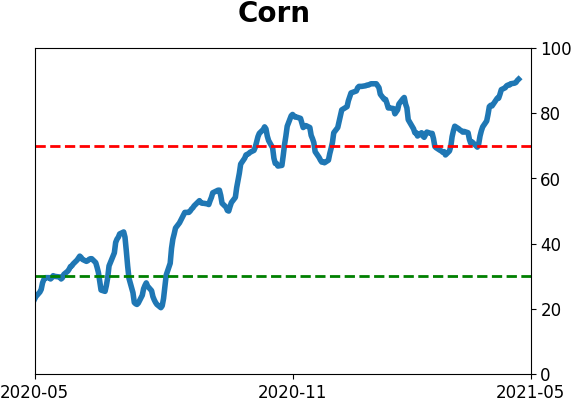
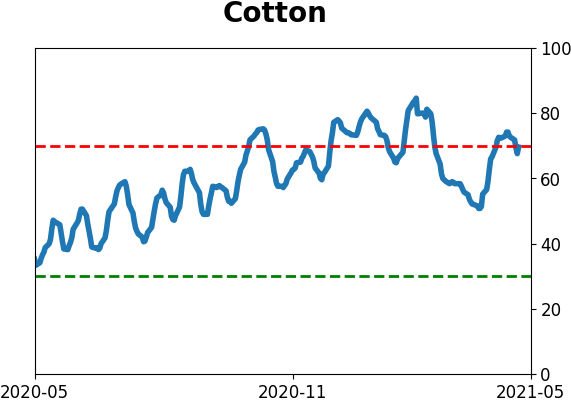
Weekly Wrap for May 7 - Impressive Starts for Stocks, Commodities: This week, there were some notable streaks in indexes like Transports. The breadth and gains in April show impressive historical biases toward even higher prices. Tech has stumbled, but commodities have not, putting in a 4-month start to a year with few precedents since 1933. New high explosion: A euphoric reaction to a terrible jobs report pushed 32% of S&P 500 stocks to fresh 52-week highs, one of the highest readings in more than 20 years. According to the Backtest Engine, there have been 7 days with 31.5% or more stocks hitting 52-week highs on the same day. All 7 of them saw the S&P trade lower over the next month, averaging a return of -4.9%. That was typically the worst time frame, and most of them then traded higher afterward. The dates were 2010-04-23, 2010-04-26, 2013-05-14, 2013-05-15, 2013-05-20, 2018-01-12, and 2018-01-16. The latest Commitments of Traders report was released, covering positions through Tuesday: The 3-Year Min/Max Screen shows no new extreme positioning among "smart money" hedgers this week. The Commodity page shows that hedgers continued their pattern of selling pretty much anything starting with "c," with heavy (and mostly getting heavier) short exposure in coffee, copper, corn, cotton, and crude oil. In major equity index futures, hedgers mostly reversed the big sales from the prior week. We've been saying that this data is acting differently in equity contracts for almost a year than it had for most of the past decade, so not sure how much weight to put on this any longer. Bottom Line: See the Outlook & Allocations page for more details on these summaries STOCKS: Weak sell BONDS: Weak buy GOLD: Weak buy |
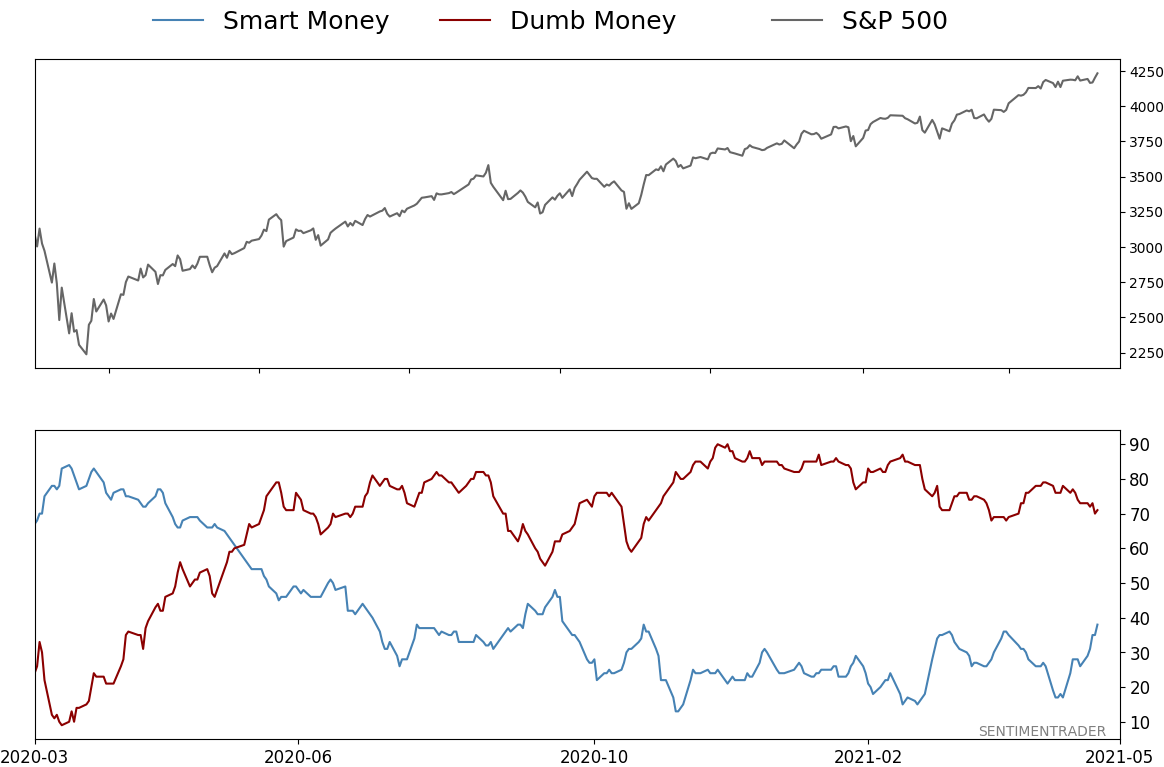
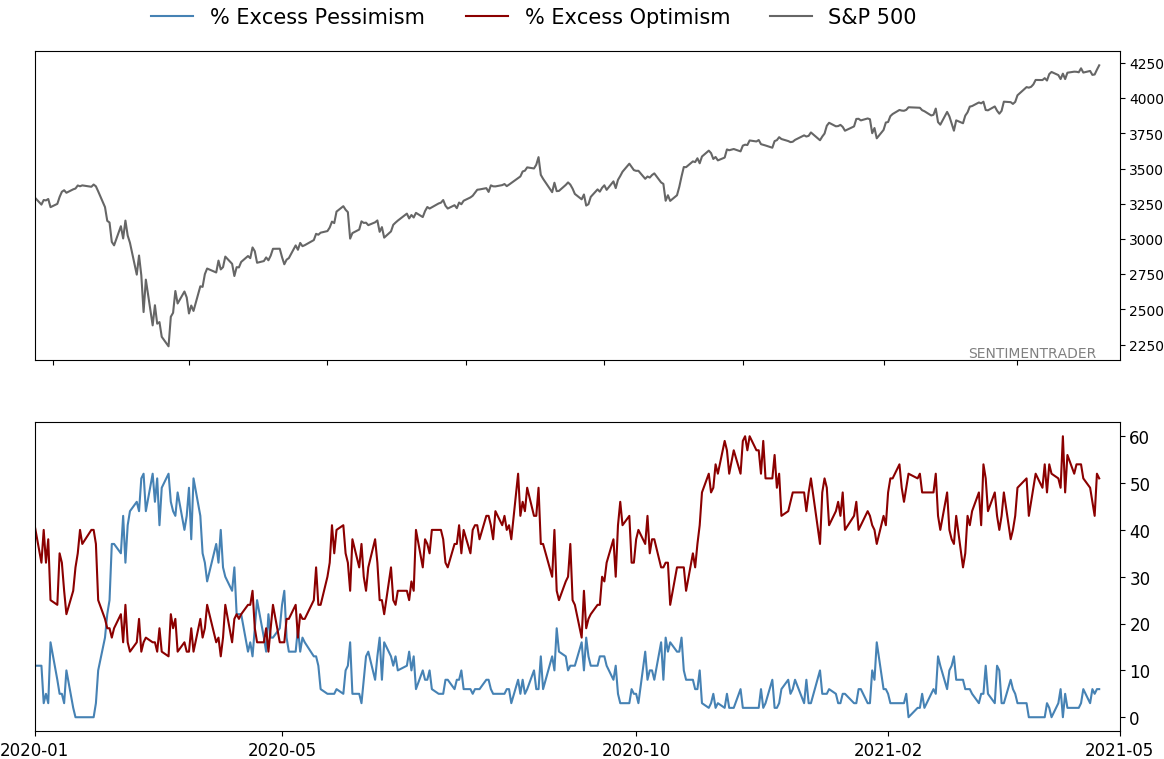
Smart / Dumb Money Confidence
|
|
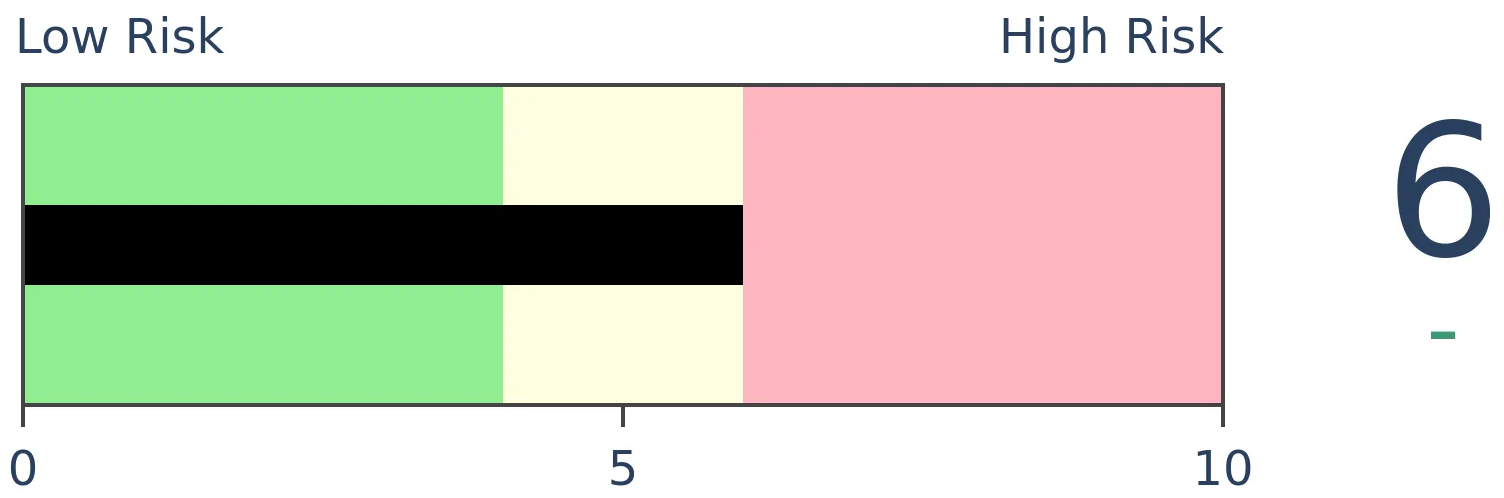
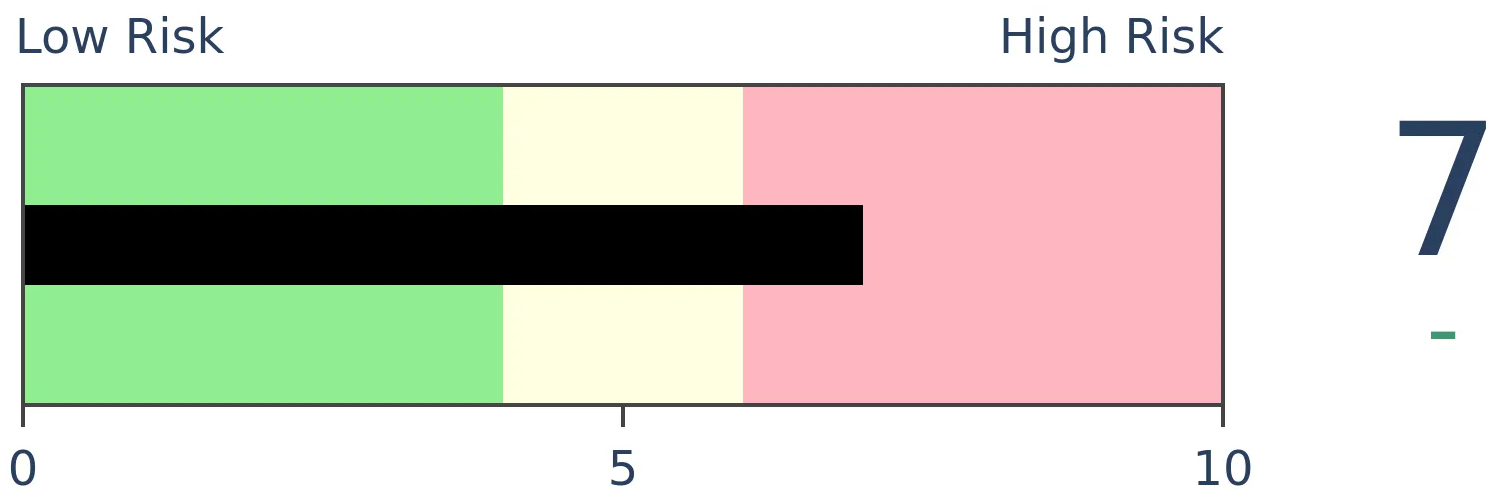
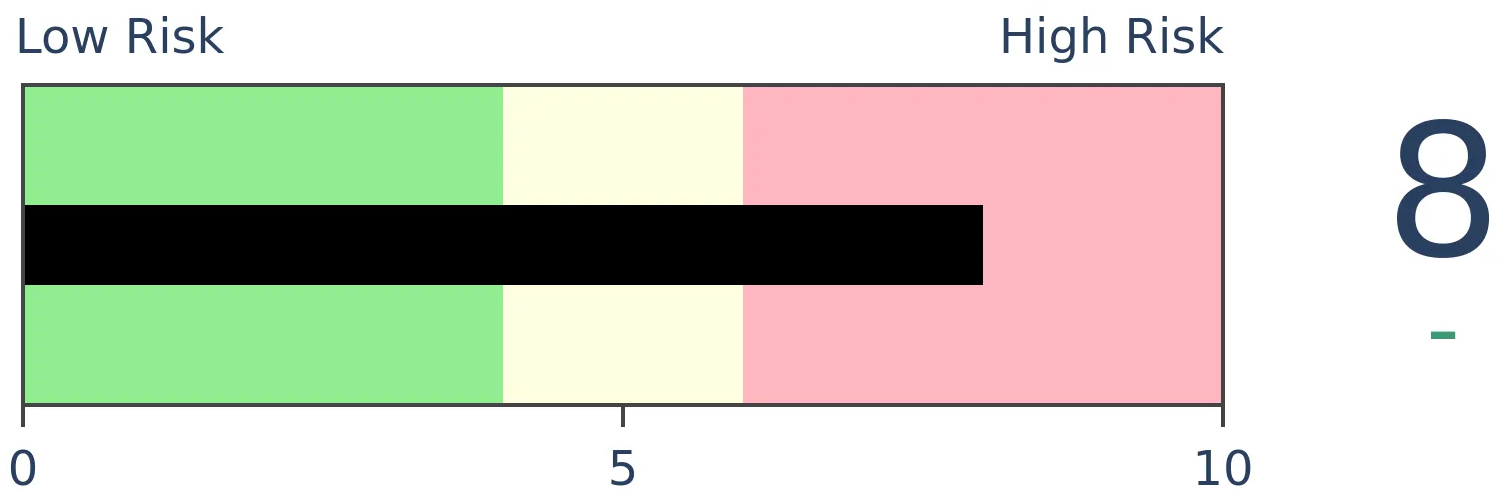
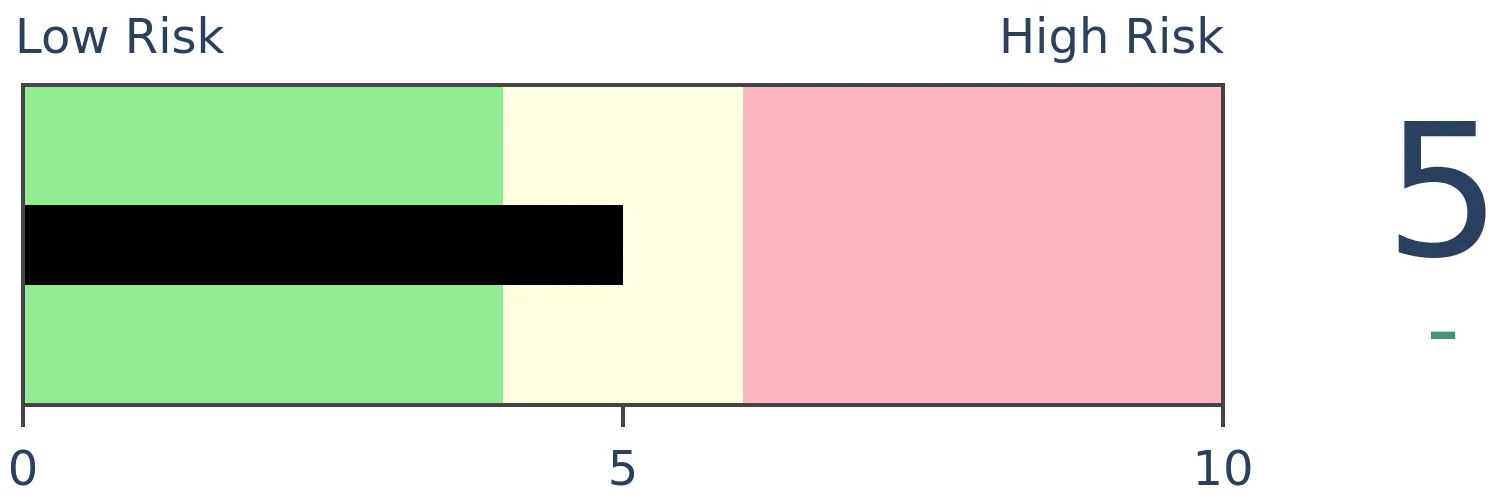
Risk Levels
|
|

|

Research
Weekly Wrap for May 7 - Impressive Starts for Stocks, CommoditiesBOTTOM LINEThis week, there were some notable streaks in indexes like Transports. The breadth and gains in April show impressive historical biases toward even higher prices. Tech has stumbled, but commodities have not, putting in a 4-month start to a year with few precedents since 1933. FORECAST / TIMEFRAME |
The goal of the Weekly Wrap is to summarize our recent research. Some of it includes premium content (underlined links), but we're highlighting the key focus of the research for all. Sometimes there is a lot to digest, with this summary meant to highlight the highest conviction ideas we discussed. Tags will show any symbols and time frames related to the research.
| STOCKS | ||
 |  |  |
Even in a market that can't seem to go down for more than a couple of days, one index stands out.
The Dow Jones Transportation Average just completed its 13th straight week with a gain. None of them were tremendous, but the persistence is incredible.
The Transports set a 122-year record for weekly persistence a couple of weeks ago. Last week just added to the gains.
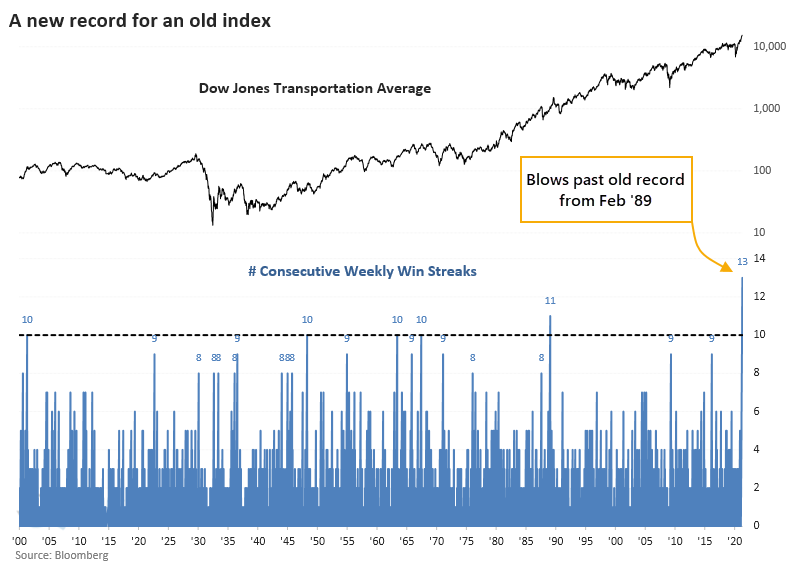
The handful of times Transports managed to do this, forward returns were sketchy over the next 6-24 months. Only 1 out of the 5 other signals managed to show a profit even 2 years later.
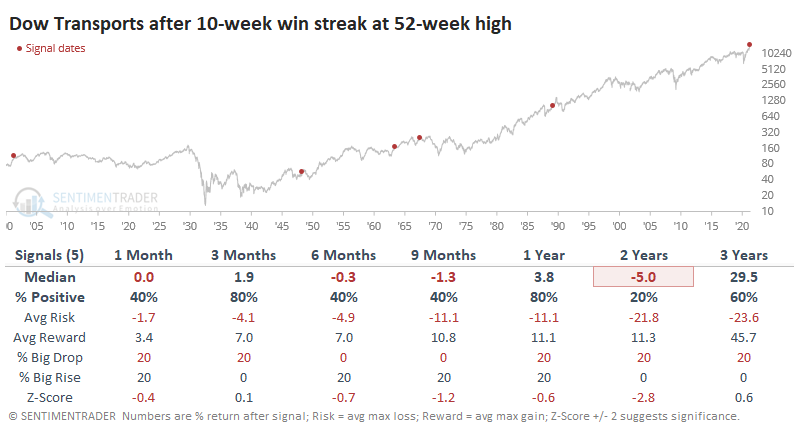
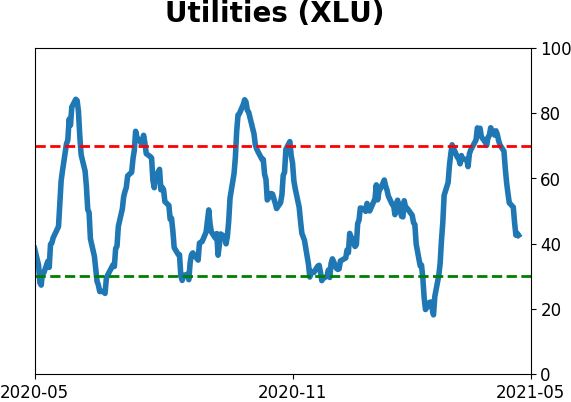
Following these streaks in Transports, Health Care and Financial stocks had the best returns, followed by Staples and Energy. The laggards were Communications, Utilities, and Industrials.
Among factors, Growth stocks tended to show the strongest returns across time frames, though Value wasn't too far behind on most of them or even exceeded the returns on shorter time frames.
A HISTORIC START TO THE YEAR
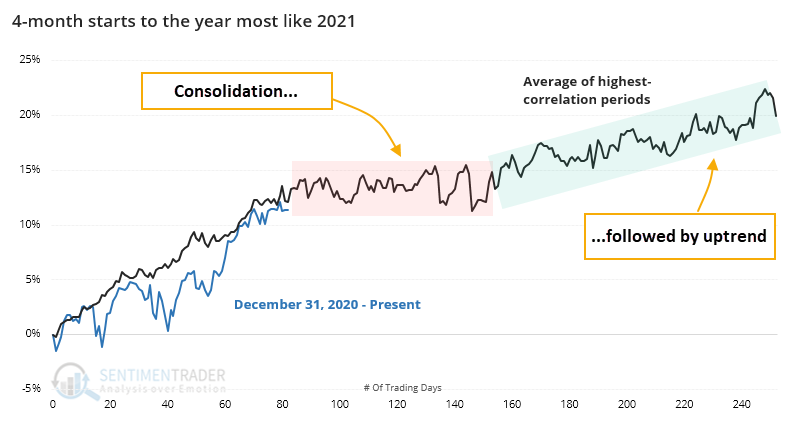
Through the first 4 months of the year, stocks have barely suffered any downside volatility. Buying momentum to start the year has rolled over just about every mean-reversion strategy in 2021, and it's tempting to pick a year that seems similar based on eyeballing a chart.
Using a more objective discipline, we can go back nearly 100 years and look for every 4-month (84 trading-day) start to the year. We'll then filter the years, looking only at those that showed the highest correlation.
There were 19 years with a correlation of more than +0.75 (on a scale of -1.0 to +1.0). We can see their average price path below.
The table below shows the S&P's future returns as of day #84 for the years with the highest correlation so far to 2021.
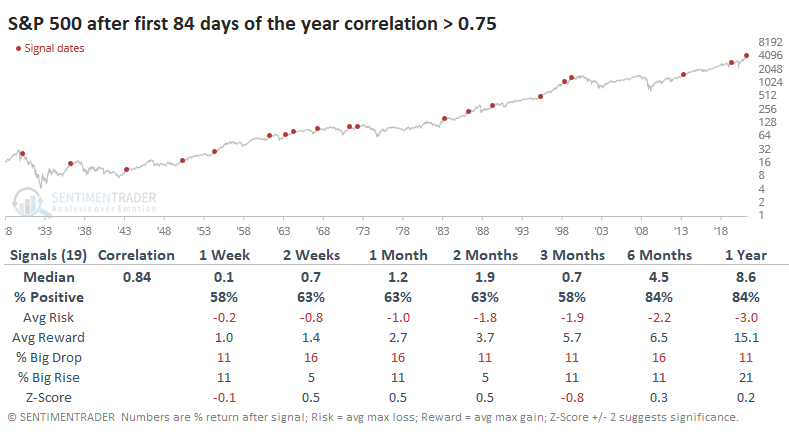
Over the next 3 months, the S&P averaged a return of only +0.7%, below a random 3-month return. The risk/reward wasn't bad at all, and over the next 6-12 months, there was only one terrible loss.
An additional challenge for the short- to medium-term this year is the high level of sentiment. When entering May with the highest levels of Dumb Money Confidence, only 2 out of 12 years didn't see weakness, or more than a minimal gain, through June. And both of those, 2003 and 2009, were the first years of a bear market recovery.
APRIL BAROMETER
Likewise, Jay discussed an "April barometer."
The stock market's performance during April - and for the first months of the year as a whole - can at times offer useful clues regarding the performance of the stock market during the remainder of the year.
The table below displays only those years since 1931 when the S&P 500 showed a price gain of +5% or more during April.
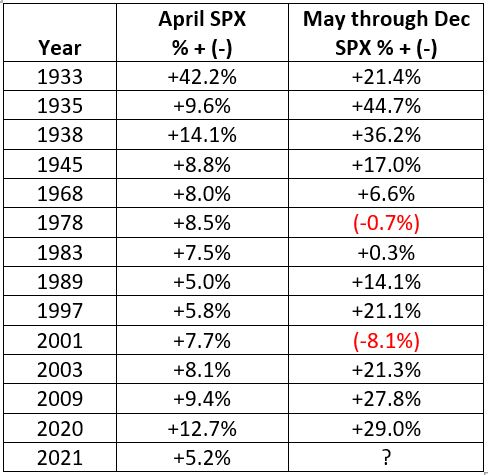
From May through December, the S&P rose 11 times (an 85% win rate), with the winners averaging +21.8% and the losers -4.4%. That doesn't mean it was perfect - after a +7.7% gain in April 2001, the S&P 500 suffered a -22.7% drawdown into the September low before closing the May-Dec period -8.1%.
Jay also looked at big gains for stocks if the first 4 months of the year were up by 10% or more.
Out of those 20 years, only twice did the market show a loss during the last 8 months of the year. The 18 winning years averaged +10.1%, while the 2 losers averaged -8.1%.
The chart below displays the cumulative price gain for the S&P 500 Index held ONLY during May through December of those years to provide a sense of its consistency.
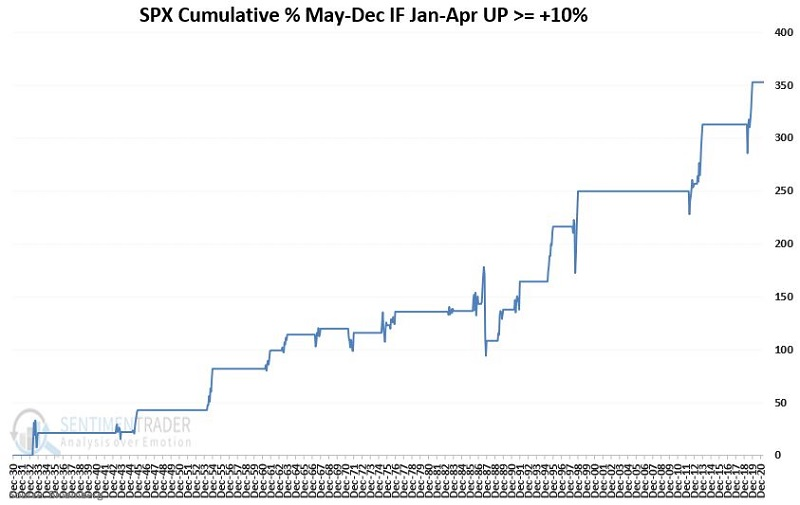
Does the S&P 500 Index rising +11.3% through April 2021 ensure that the rest of 2021 is "smooth sailing" for stocks? Not at all. It didn't work out well at all in 1987, so there were (rare) exceptions.
MOMENTUM ROLLS ON
The momentum we've discussed in recent months isn't just the price gains in major averages. It's mostly the internal health of the moves, especially since October. Participation among stocks, industries, sectors, and even countries has been stellar - even record-breaking.
During the entire month of April, 73% of S&P members traded above their 10-day moving averages on an average day. That puts last month near the far right on the distribution curve of all months. Looking at a medium-term time frame, last month 88% of S&P members traded above their 50-day moving averages on an average day. That puts us even further out on the right side of the curve.
And on a long time frame, 96% of S&P members traded above their 200-day moving averages on an average day last month. That ranks among the greatest of all months since 1928.
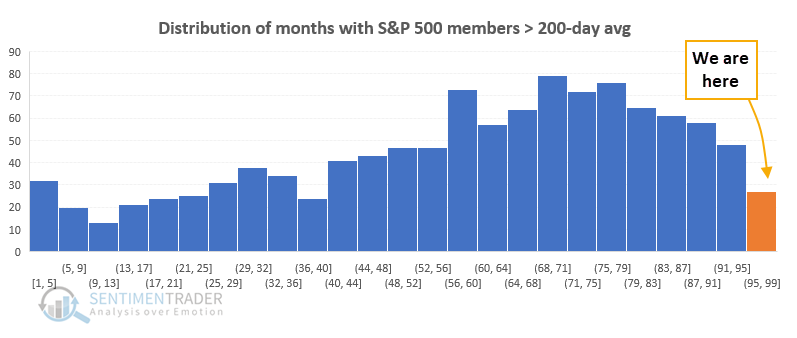
Looking at all three time frames, April 2021 made the top 20 months only with the percentage trading above their 200-day averages.
Even so, last month ranked relatively high on all 3 metrics. When we average all 3 together, April 2021 ranked as the 7th best breadth month ever.
We can see the S&P's future returns after the 20 best months across all 3 breadth metrics.
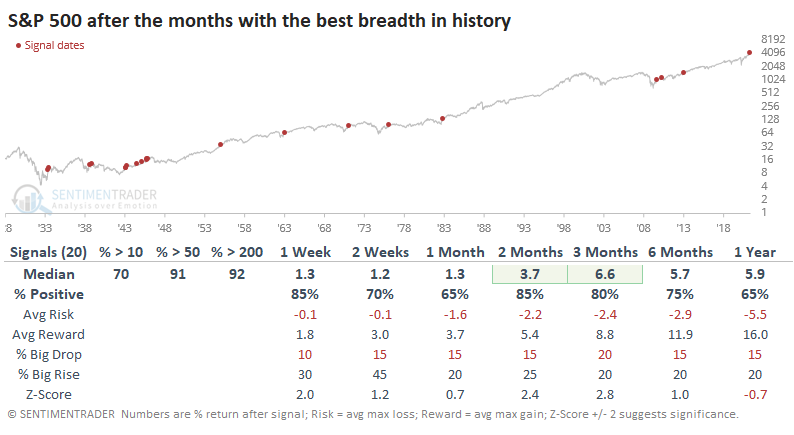
Almost all of these monthly breadth thrusts triggered in the first year or so of a bull market following a protracted or sharp decline. Here's the kicker and the reason we've been struggling so much with the sentiment vs. momentum tension in recent months...on average, the S&P 500 was 39% below its all-time high when these thrusts triggered.
Only 4 months saw a monthly thrust when the S&P was within 10% of its high, with 3 of the 4 preceding choppy short- to medium-term conditions.
The incredible trends from April were historic. Not just the magnitude but also the context. There have been few precedents in history, which makes relying on historical behaviors...challenging. Overall, stocks held up well after other thrusts, especially over the next 2-3 months. The biggest issue now is that the few other times these kinds of thrusts triggered when stocks were relatively close to their highs, only once did we see large, sustained gains right away (in 1982).
SOME SHAKINESS IN SPECULATIVE AREAS
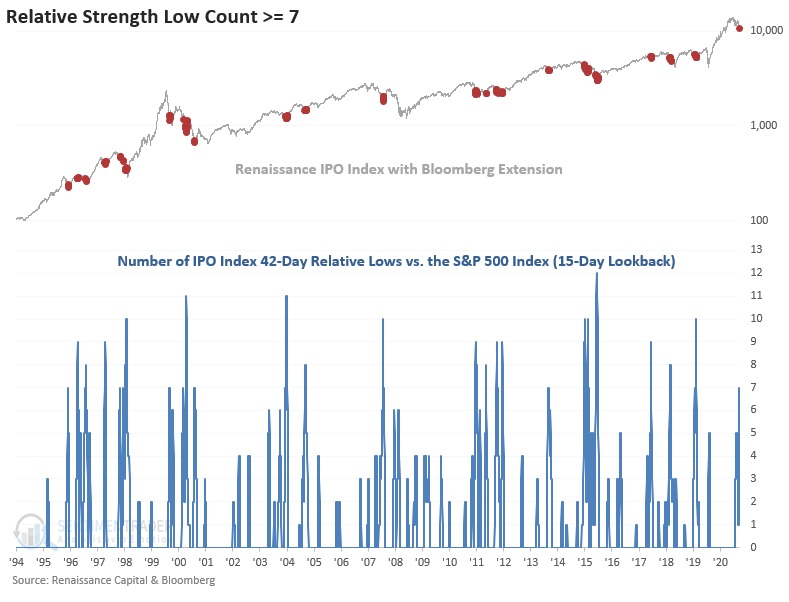
After a multi-month bounce and consolidation phase, the Renaissance IPO Index formed a significant intermediate-term top last week. IPOs represent one of the more speculative areas of the market, especially in the last few decades as the percentage of unprofitable companies coming public has surged.
When Dean applied a relative strength indicator to the IPO/S&P 500 ratio to assess relative performance, the weakness in IPOs really stands out. The indicator in the chart below counts the number of IPO Index 42-day relative lows versus the S&P 500 index in the last 15 days. A high count reflects severe underperformance.
The count reached 7 late last week.
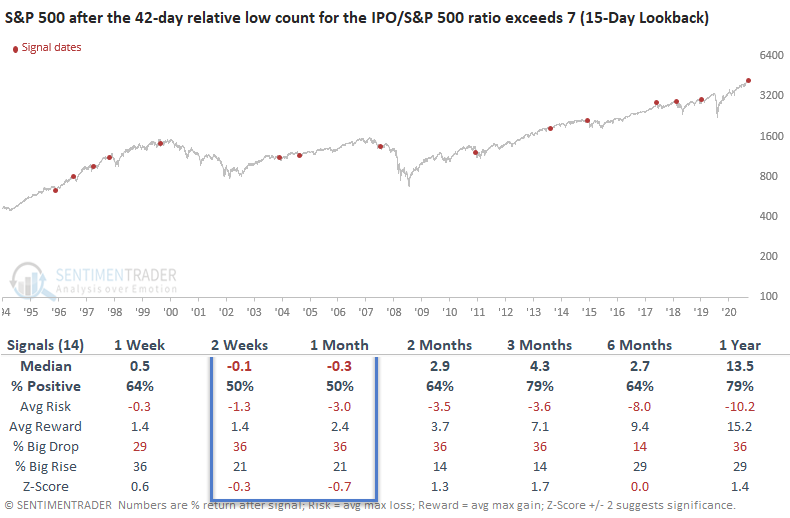
When the relative low count reaches 7 after the IPO Index registered a 252-day high, forward performance in the IPO Index is weak in the 2-4 week timeframe with z-scores that suggest significance. For the broader market, it also preceded some weak shorter-term returns.
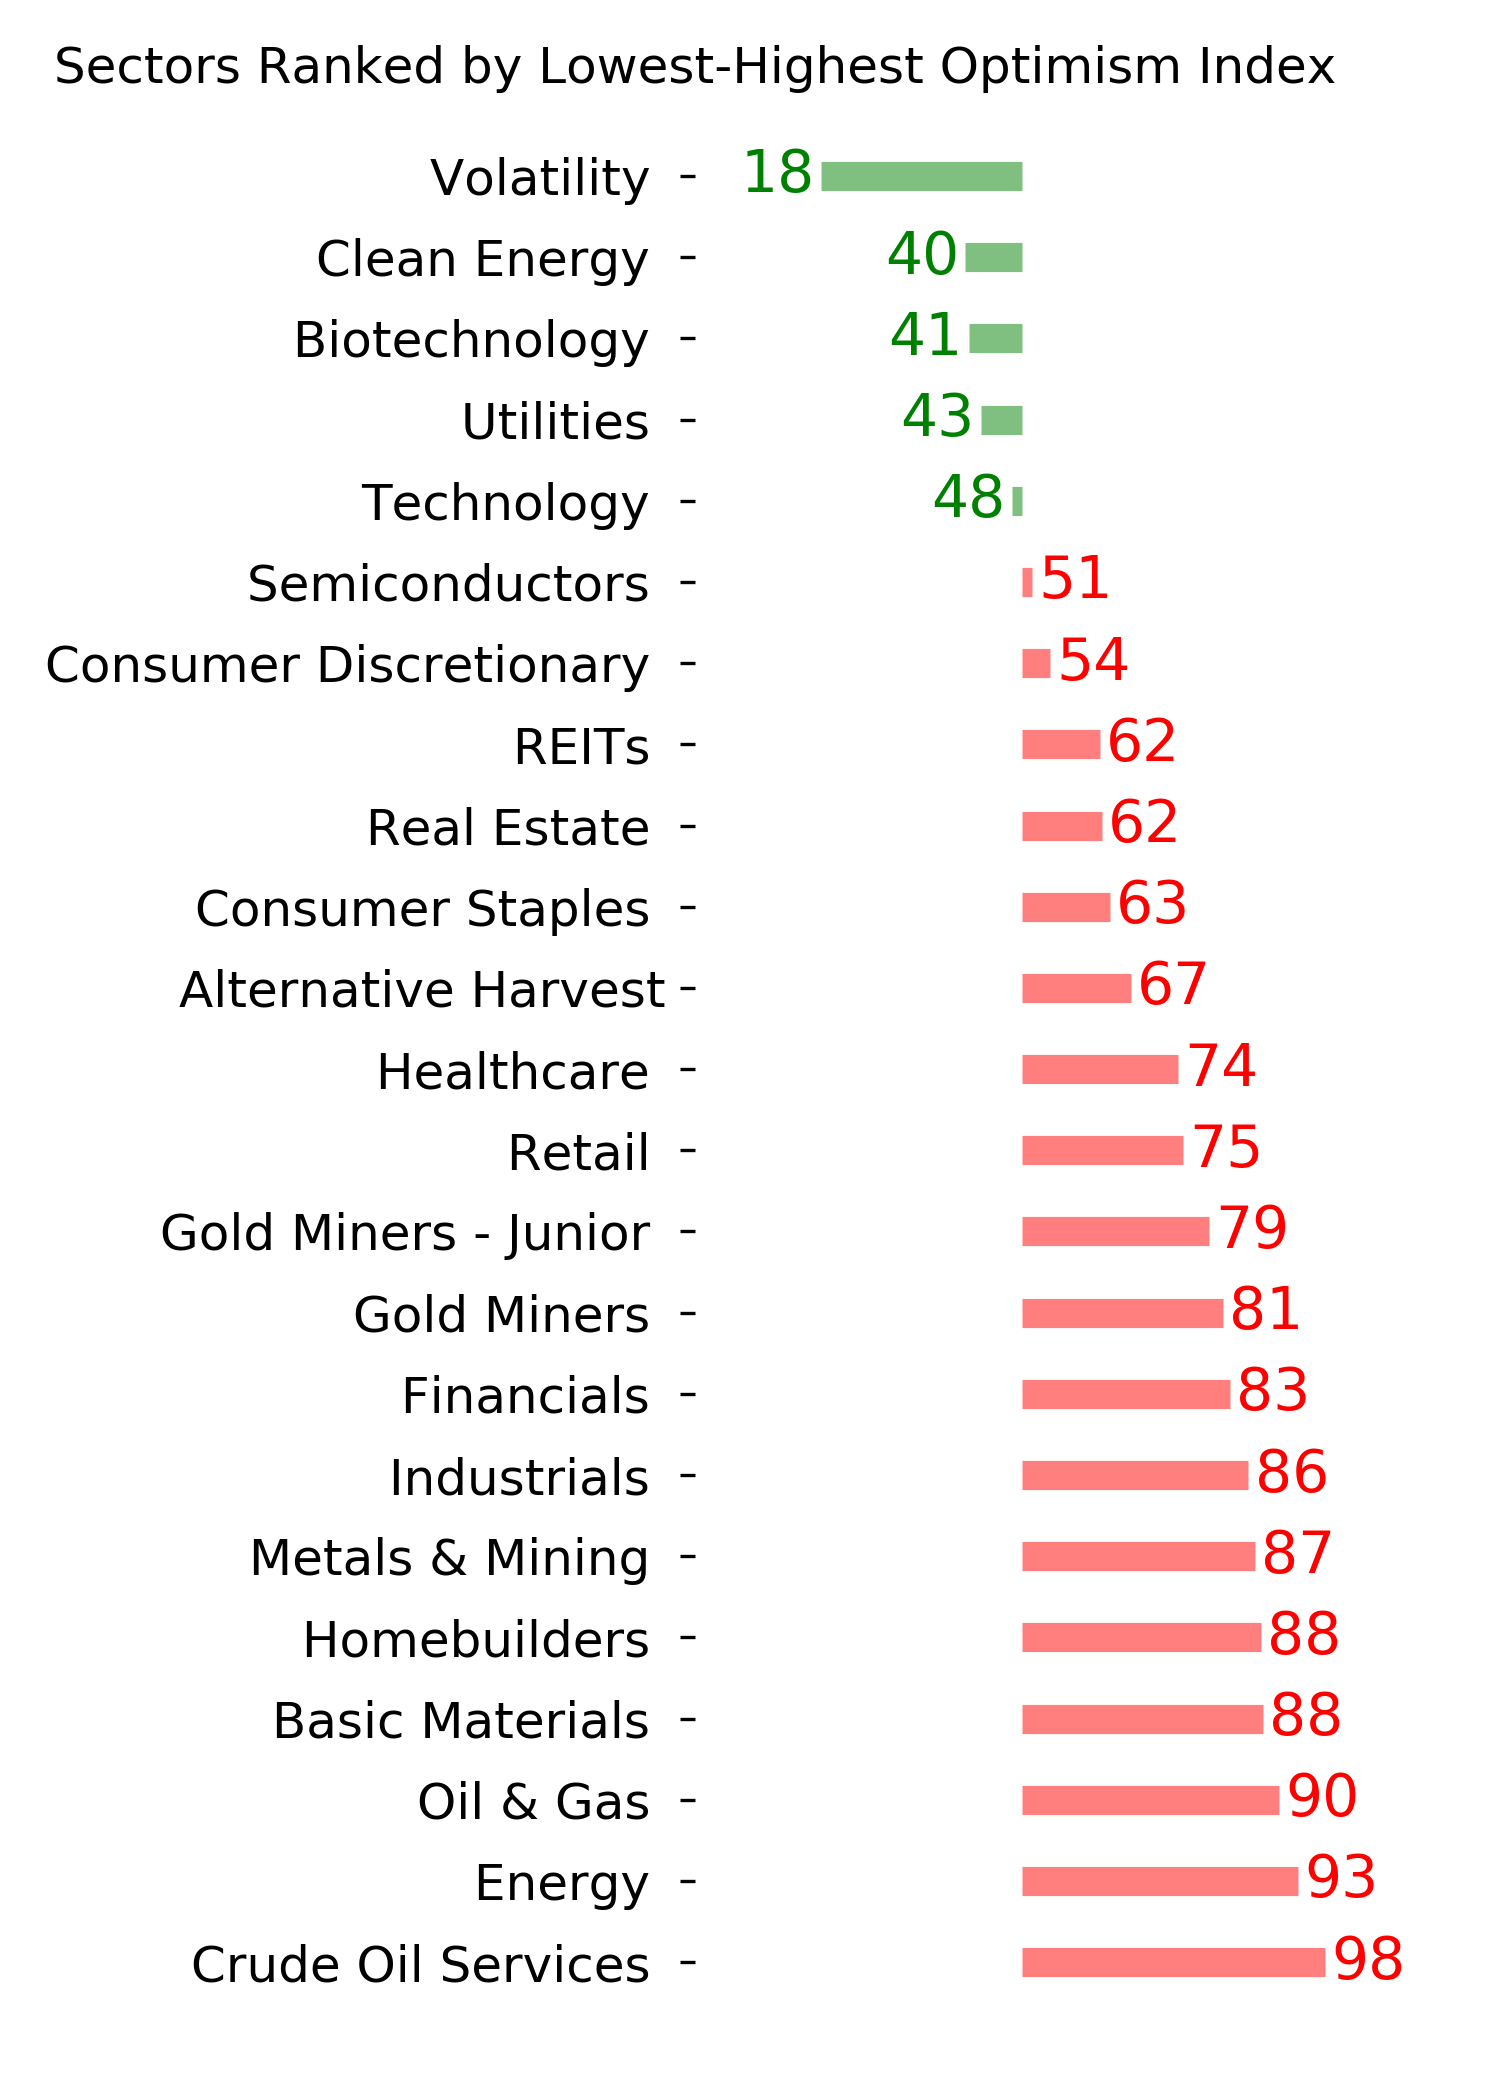
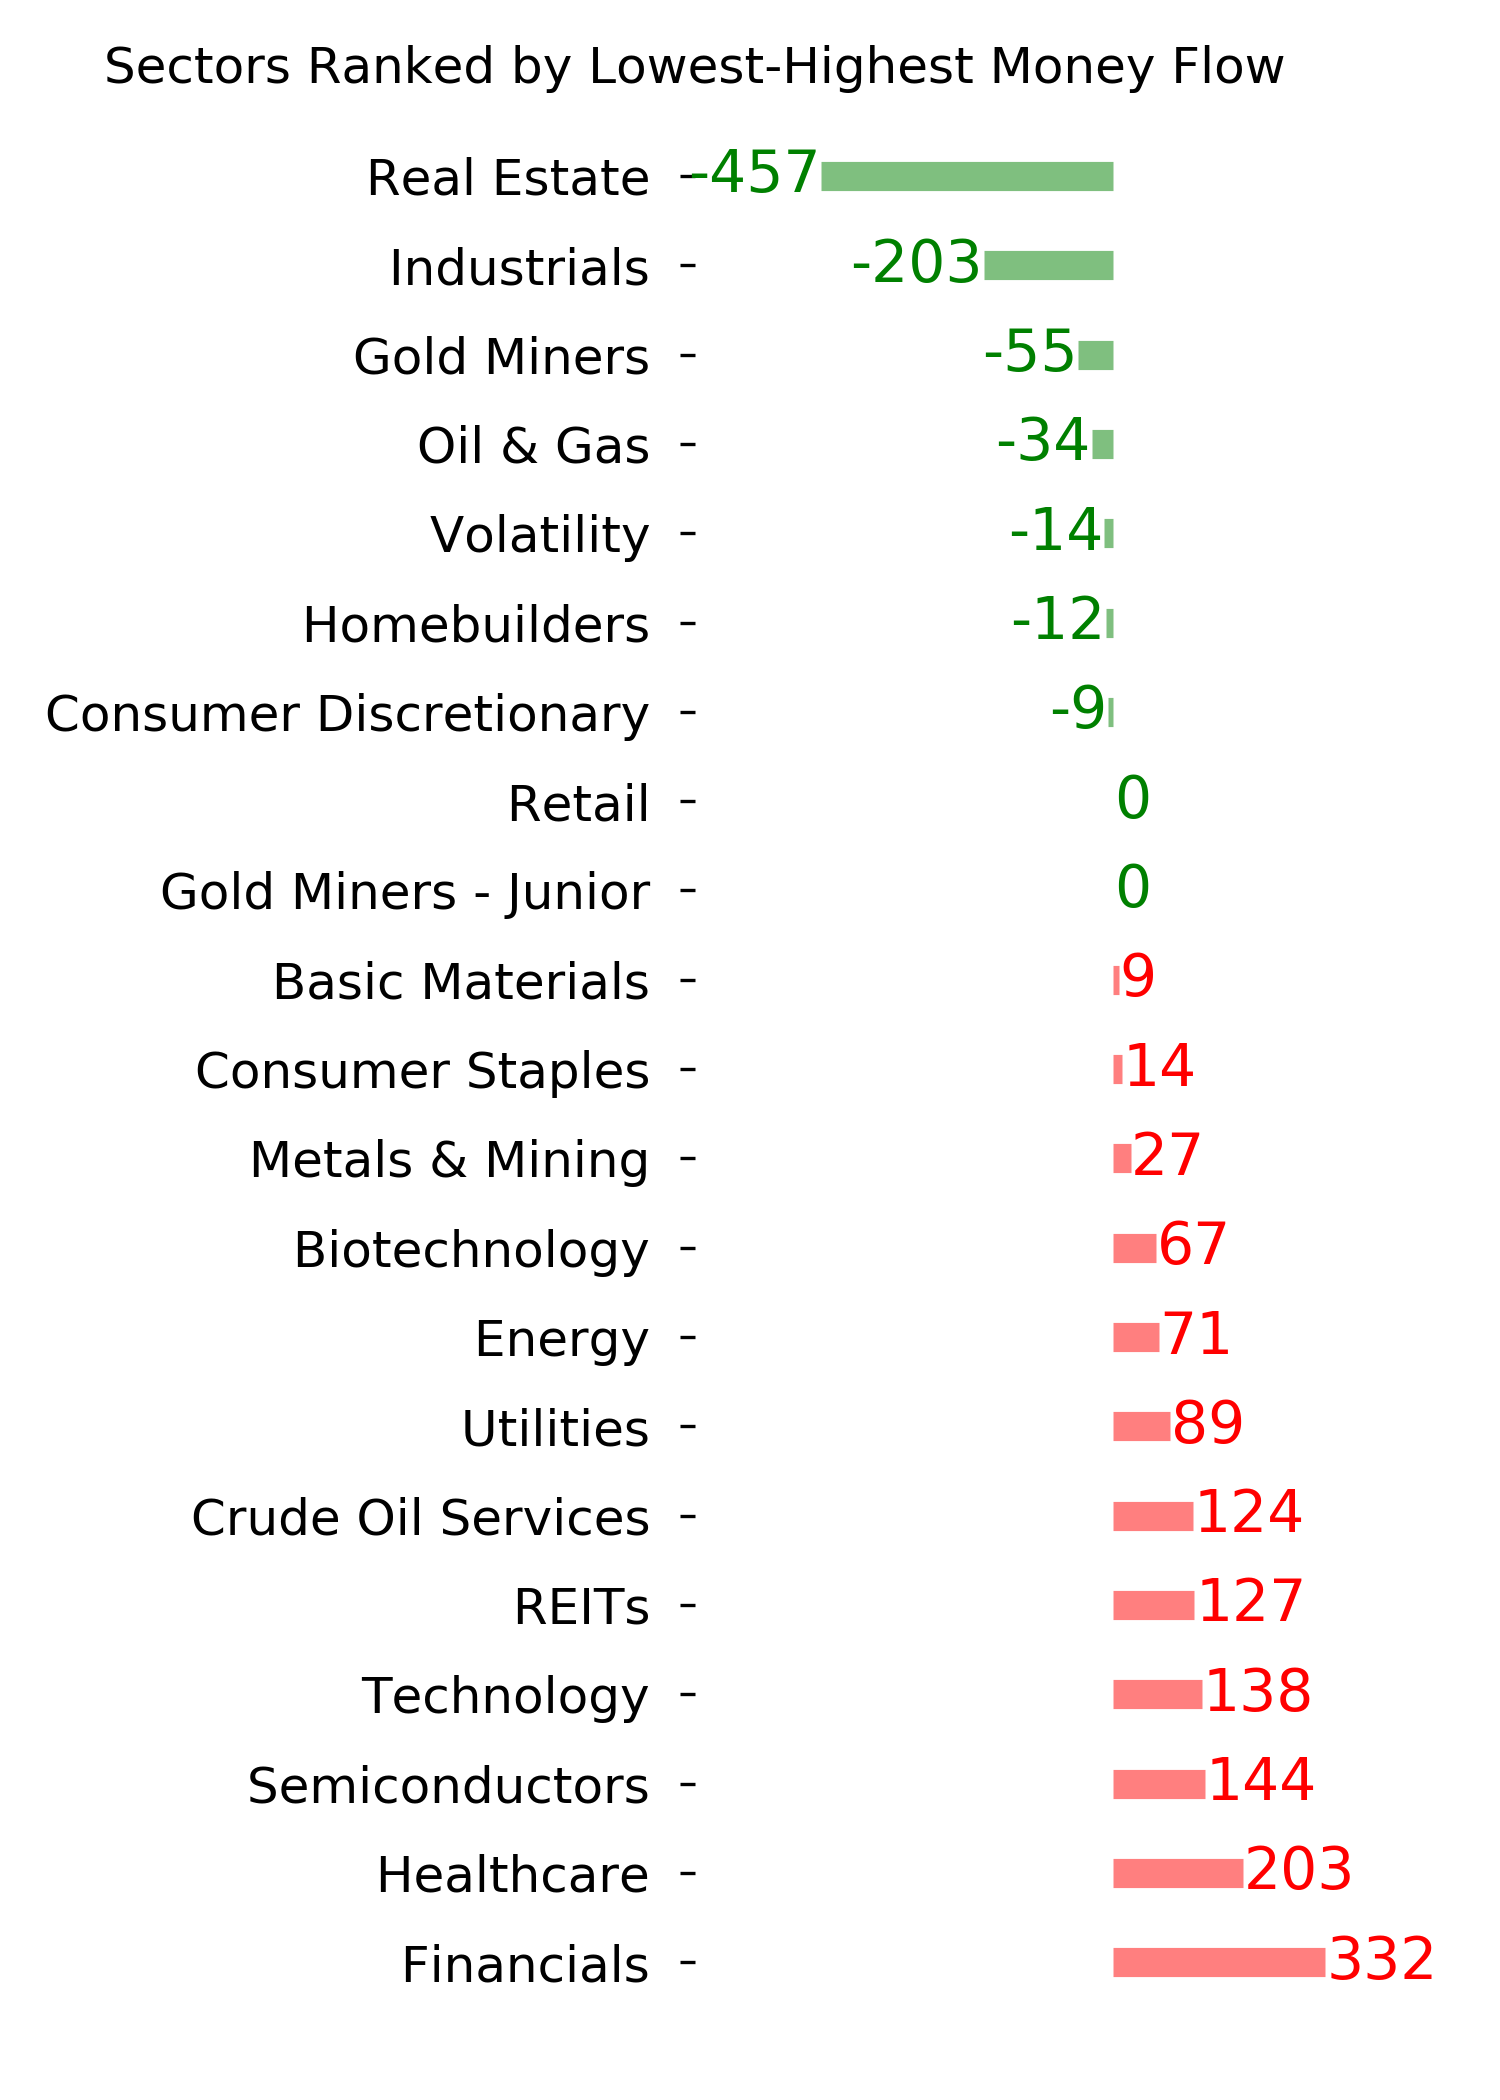
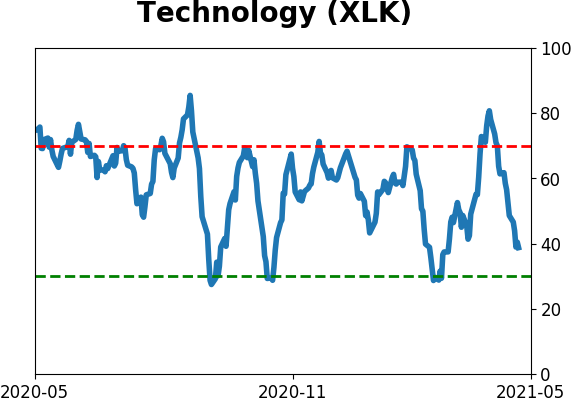
STOCKS AND SECTORS - TECH AND GERMANY STUMBLE
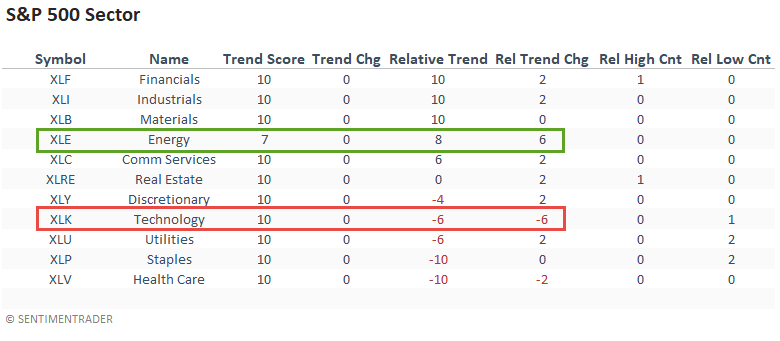
Dean updated his absolute and relative trend following indicators for domestic and international ETFs.
Relative trend scores versus the S&P 500 ETF (SPY) show a clear bias toward value/cyclical groups. There has been a big jump in the Energy score, while Technology showed a noticeable decrease and now maintains the weakest relative profile since February 2019.
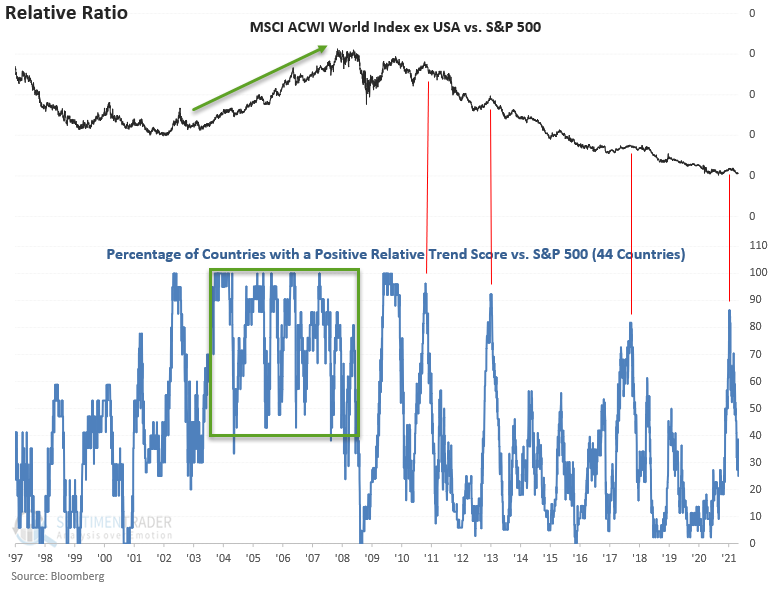
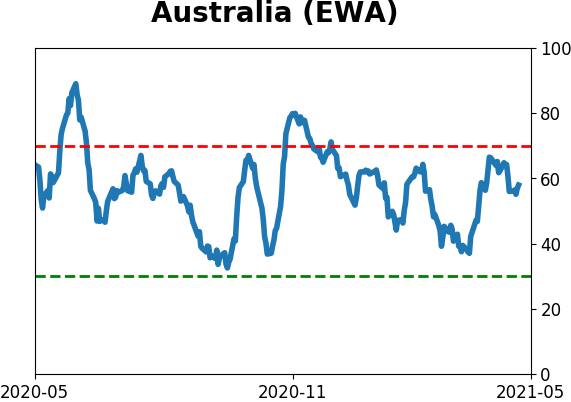
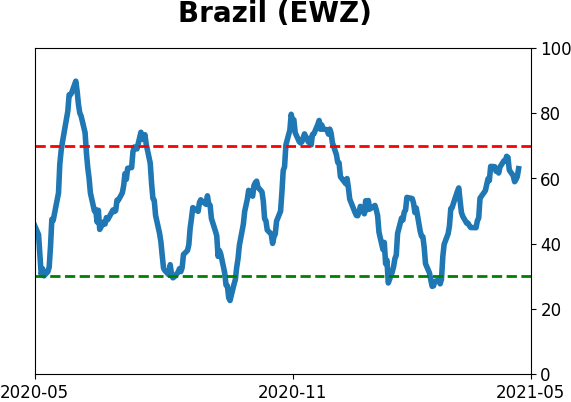
Global indexes have been falling relative to the S&P 500 as well.
The following chart measures the percentage of countries with a positive relative trend score versus the S&P. The indicator has fallen by a considerable amount since the peak in January and looks similar to other instances since 2010. It is nothing like the 2003-2007 timeframe when the global markets outperformed the S&P 500 in a sustained way.
This chart further highlights why one needs to be careful with a broad-based global allocation. The inability of the indicator to maintain a high level like 2003-2007 is noteworthy.
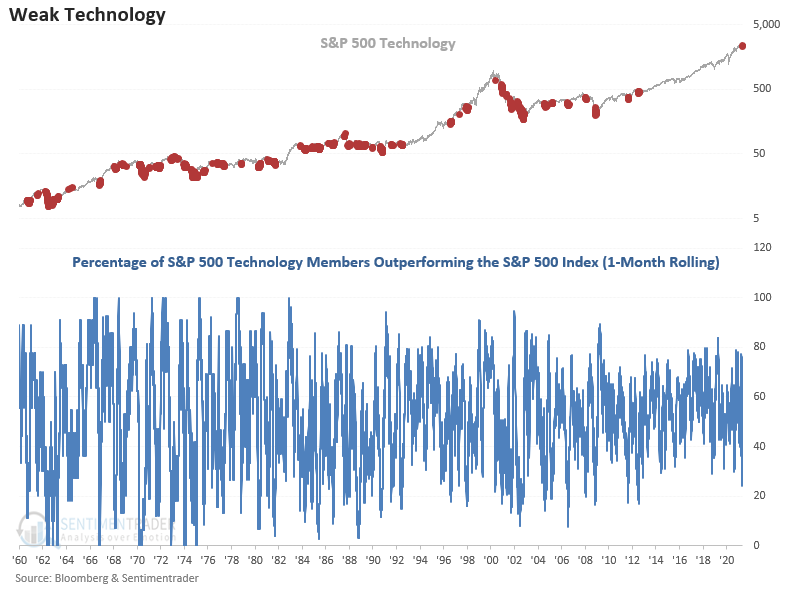
Dean looked further at how tech stocks are holding up relative to the S&P 500. And it's not well.
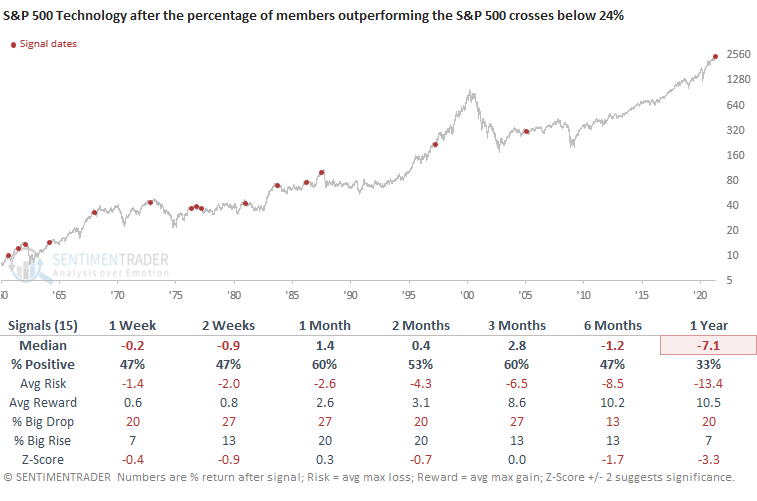
The percentage of S&P 500 Technology members outperforming the S&P 500 index on a rolling 1-month basis dropped to the lowest level since July 2012. Let's review what happens to technology when the percentage of members outperforming the S&P 500 index crosses below 24%.
Performance was weak across all timeframes with a notable z-score 1-year forward. When the S&P 500 Technology sector was within 10% of its high at the time of these deteriorations, it was not often able to show sustained gains.
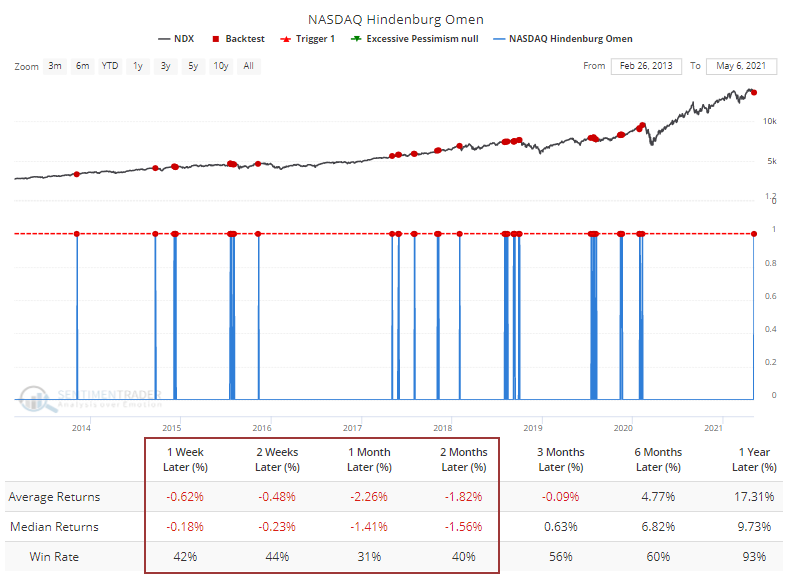
It's also worth at least noting that on Thursday, a Hindenburg Omen triggered on the Nasdaq. Even during the last decade of a roaring bull market, the NDX has struggled after even a single signal, with the Backtest Engine showing the index rallied only 31% of the time over the next month.
For the first time in a month, fewer than 80% of stocks in the DAX are trading above their 200-day moving averages.
As the DAX was peaking in early 2018 and early 2020, there were pronounced internal divergences with the percentage of its members above their long-term averages. We're not seeing that same kind of divergence now because the measure just hit its highest level in several years.
Below, we can see what the future held for the DAX once fewer than 80% of its members were trading above their 200-day averages for the first time in at least several weeks.
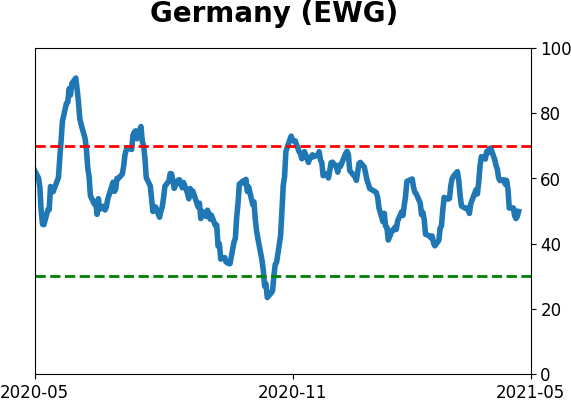
For U.S.-based investors, the iShares MSCI Germany ETF (EWG) is by far the go-to choice for trading German stocks as a whole.
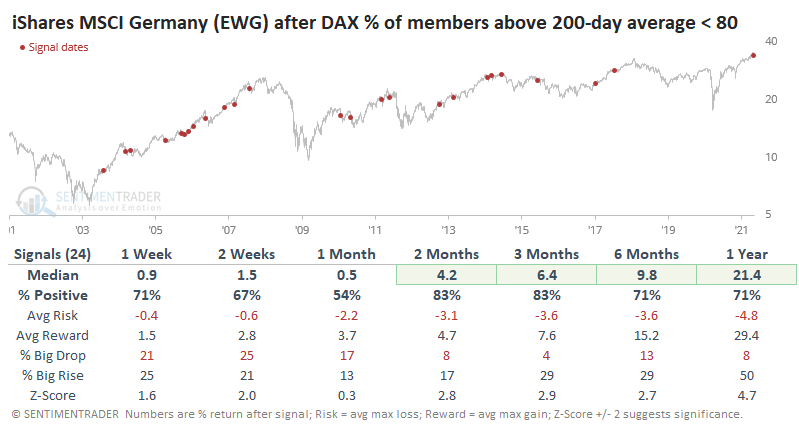
Even though it's traded in dollars instead of euros, EWG showed as good - or even better - returns than the DAX itself. Over the next 3 months, EWG rallied 83% of the time with a large average return of +6.4%. It was much more likely to show a big rise during those months than a big drop. That's not to say there was no risk, with a rally in 2011 leading to a harrowing drop. A couple of others neared a 10% decline over the next 3-6 months, but again those were clearly exceptions.
| BONDS | ||
 | ||
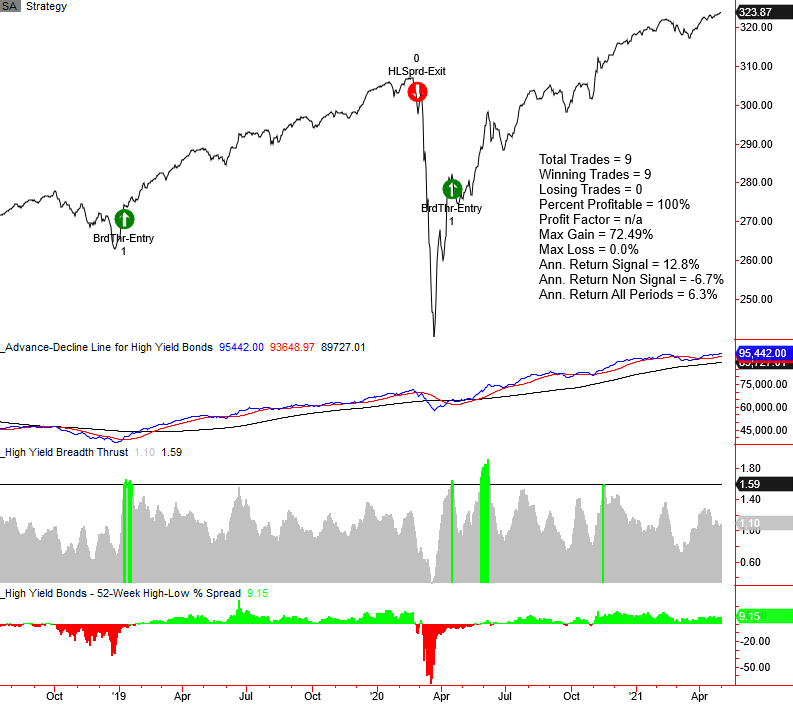
Dean provided an update on his corporate bond timing models for high yield and investment-grade indexes. The models use market breadth measures to identify trend changes in advance of price action alone.
ENTRY SIGNALS
- Breadth thrust
- Advance-Decline line moving average golden cross with positive index momentum
- New highs vs. new lows spread cross above a threshold level
EXIT SIGNALS
- Advance-Decline line moving average death cross with negative index momentum
- Advance-decline divergence
- New highs vs. new lows spread cross below a threshold level
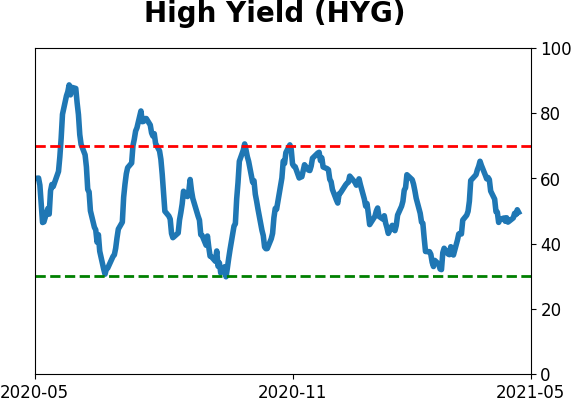
HIGH YIELD CHART
The high yield timing model registered a breadth thrust buy signal on 4/17/20 and continues to remain invested. The advance-decline line and new high-low spread indicators look constructive and nowhere near levels that would trigger a sell signal.
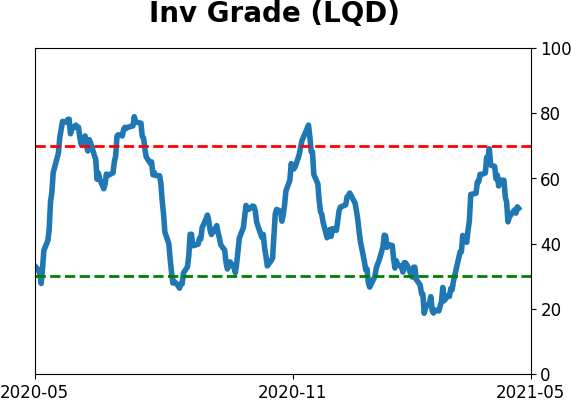
The investment-grade timing model remains on a sell signal that triggered on 1/6/21. It's not uncommon to see investment-grade bond performance suffer in the face of rising treasury yields.
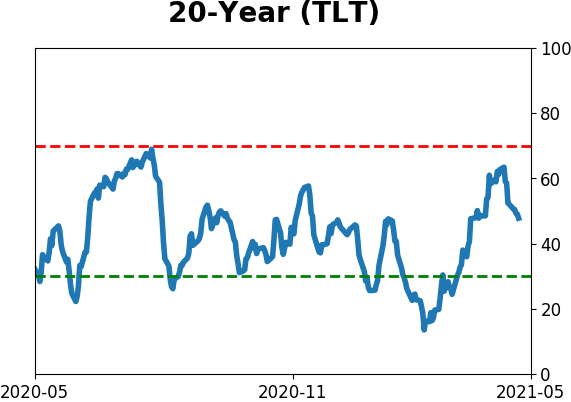
For now, the increase in rates looks to be waning. However, there is nothing yet that suggests a new buy signal for investment-grade bonds is imminent. Interestingly, the investment-grade timing model does a pretty good job with signals for long-term treasury bonds as well.
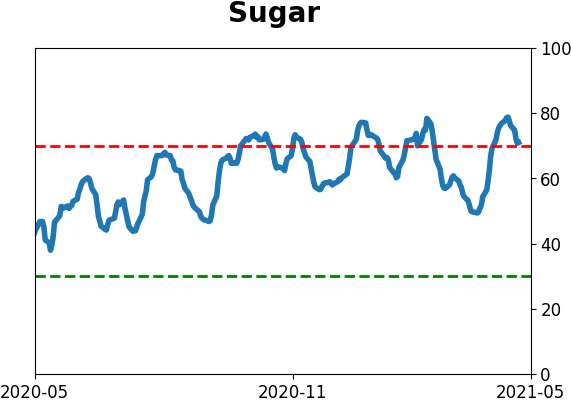
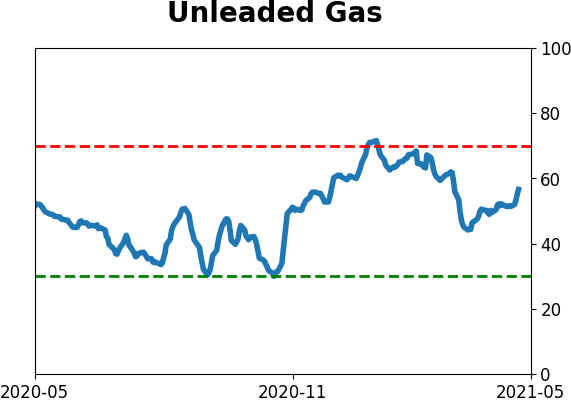
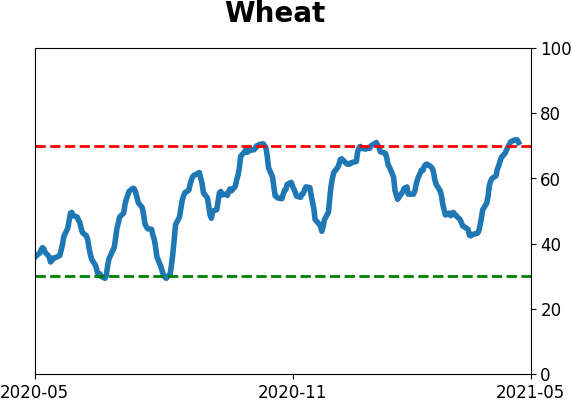
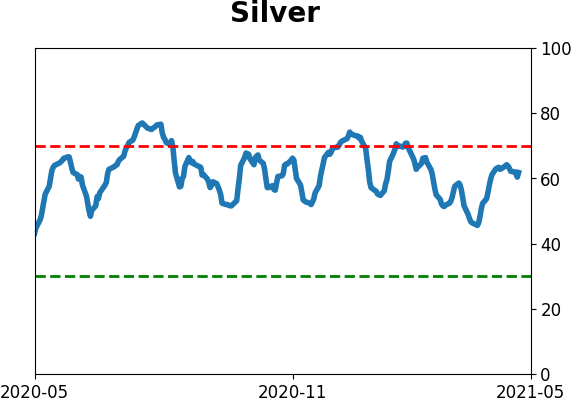
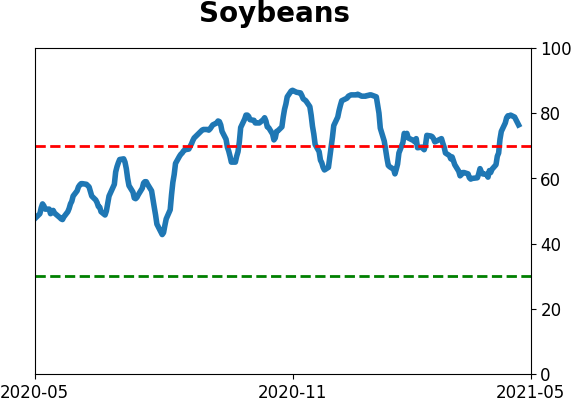
| COMMODITIES | ||
 | ||
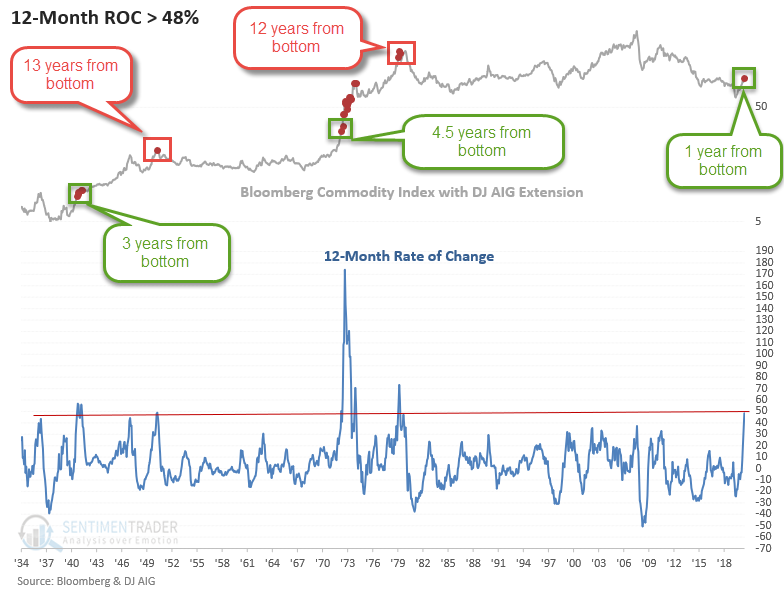
With April coming to a close, Dean shared the following commodity chart now that it's been one year since the Bloomberg Commodity Index bottomed.
The chart is similar to what we looked at in April, but it contains a data extension from the Dow Jones AIG Commodity Index. The historical extension provides us with some more insight into the potential outlook for commodities.
When I compare the current surge in commodities to other instances in history, the thrust looks more like the start of a trend versus the end of one.
Commodities have had an impressive start to the year for sure.
The long-term trend in stocks is well-documented to be higher as companies innovate and produce profits, but commodities are much more cyclical. As prices rise, farmers plant more crops, or miners dig more stuff out of the ground, and prices go down. It's hard to sustain uptrends except when there is a massive supply/demand imbalance.
Using the same methodology we used for stocks (shown above), we see that 9 other years had a correlation greater than +0.7 (on a scale of -1.0 to +1.0) through the first 4 months of the year.
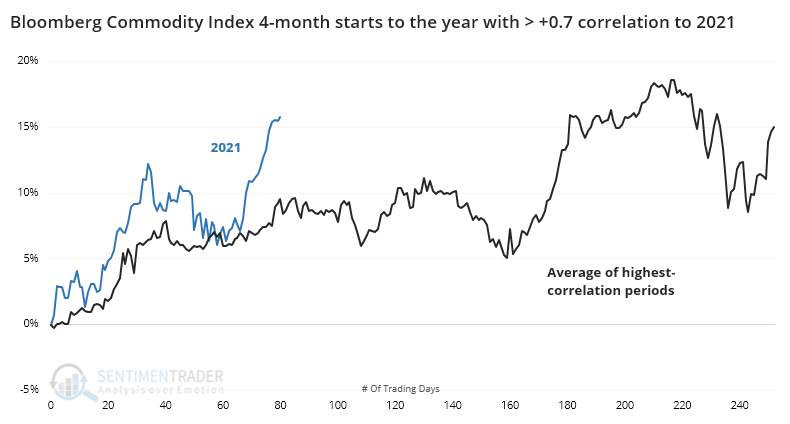
The years all showed gains through April and enjoyed a roughly similar path to get there, but the only year with a better 4-month beginning was 1973. Commodity bulls would love to see a repeat, as it preceded massive additional gains.
So, commodities should pause over the next few months and digest their recent gains. As always, a market that doesn't do what it should gives us a strong hint that something structural has changed, and this market has already done that to some degree. If commodities follow the 1973 playbook, then we won't see much, if any, weakness in the weeks and months to come. But it will have to fight historical analogs, seasonality, momentum, and sentiment, all pointing to a pause.
Active Studies
|
|
|
|
|
|
Indicators at Extremes
|
|
|
Portfolio
|
|
|
|
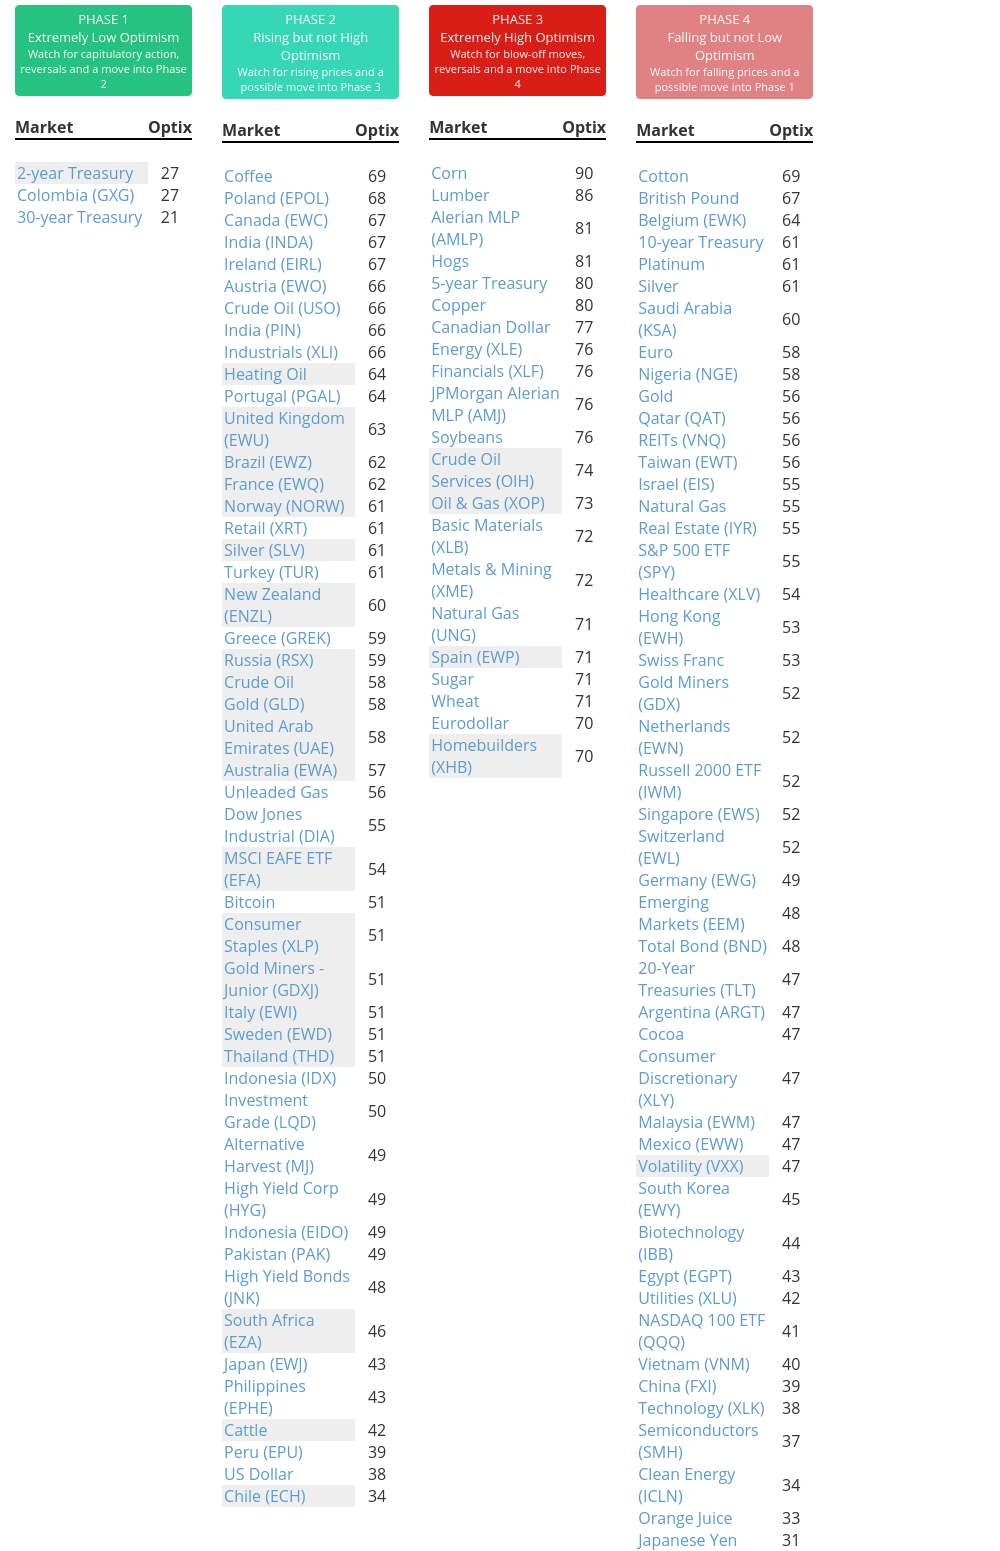
Phase Table
|
|
|
Ranks
|
|
|
|
|
|
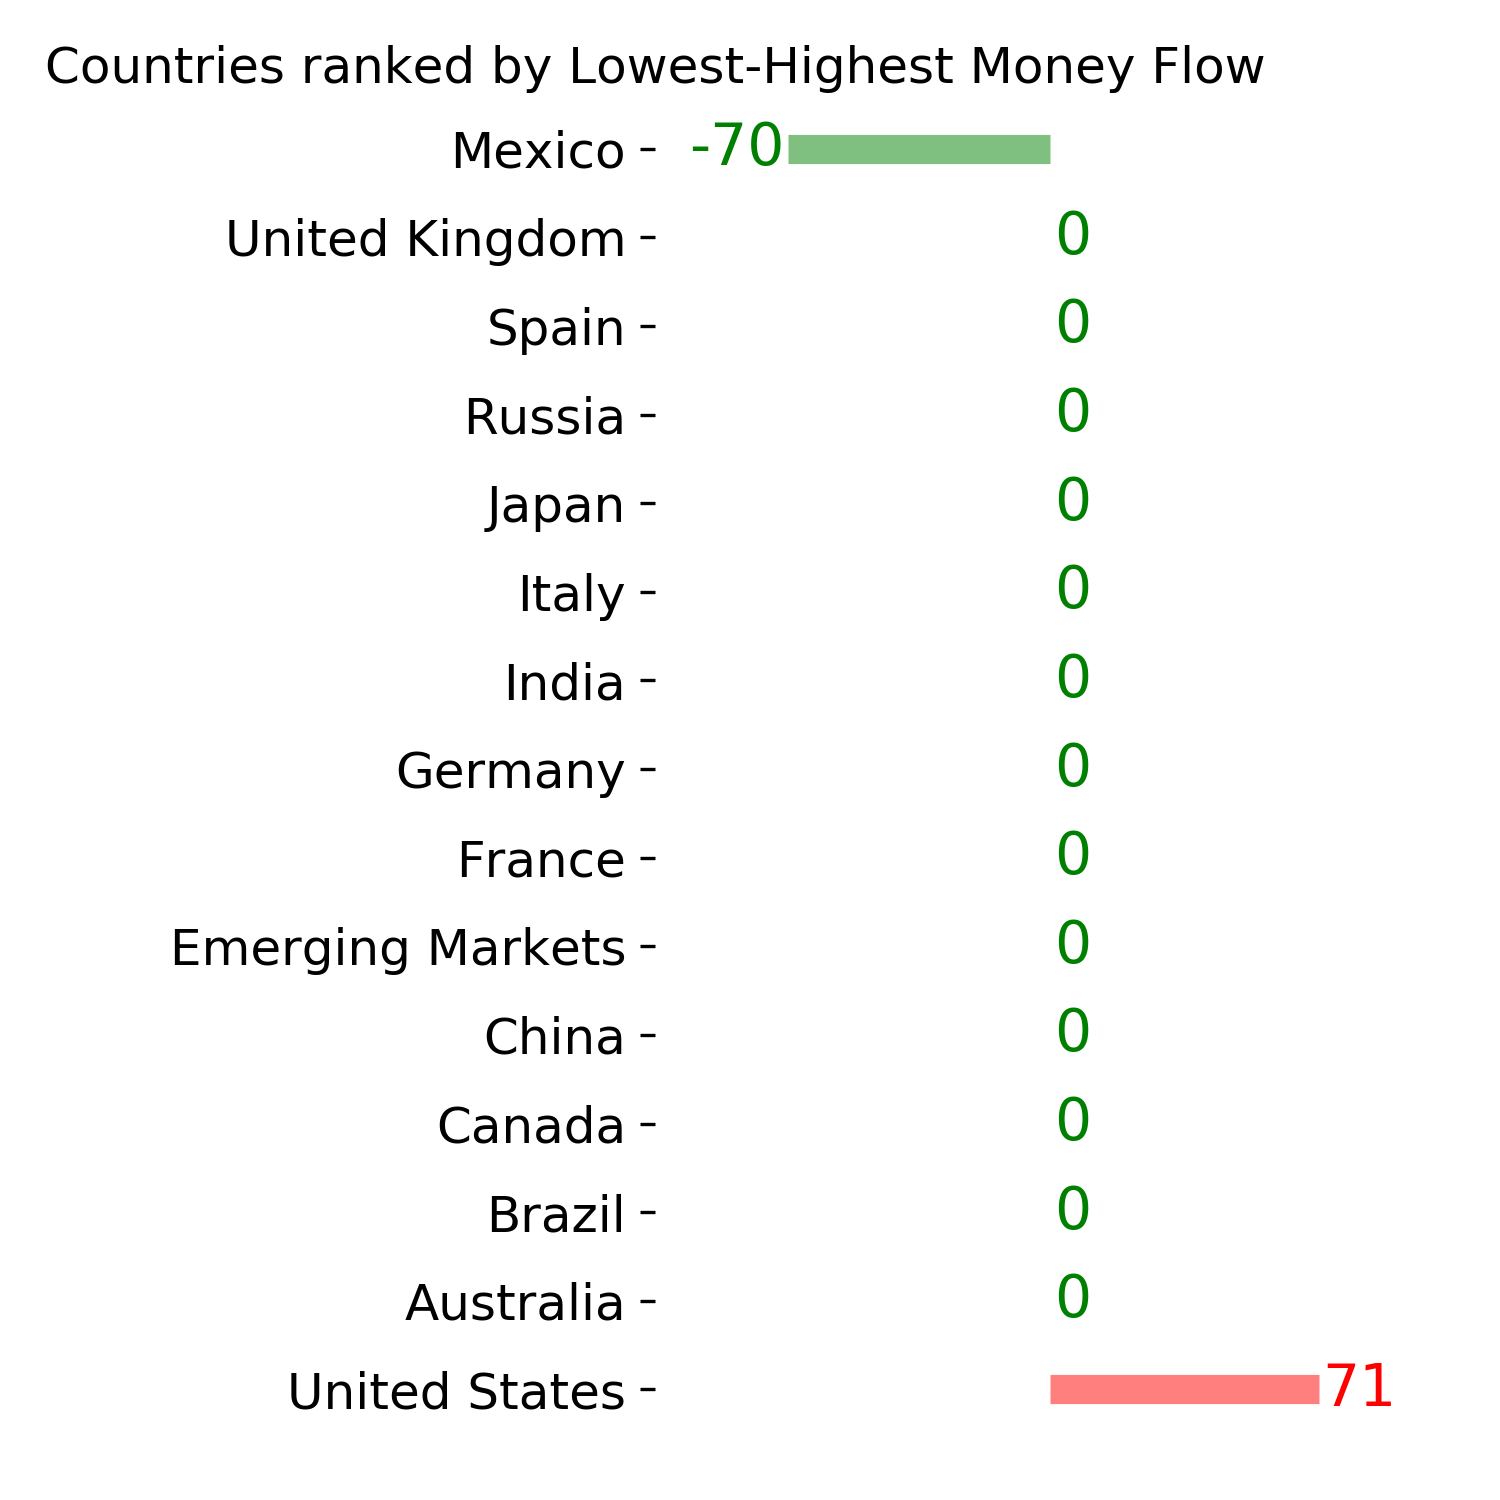
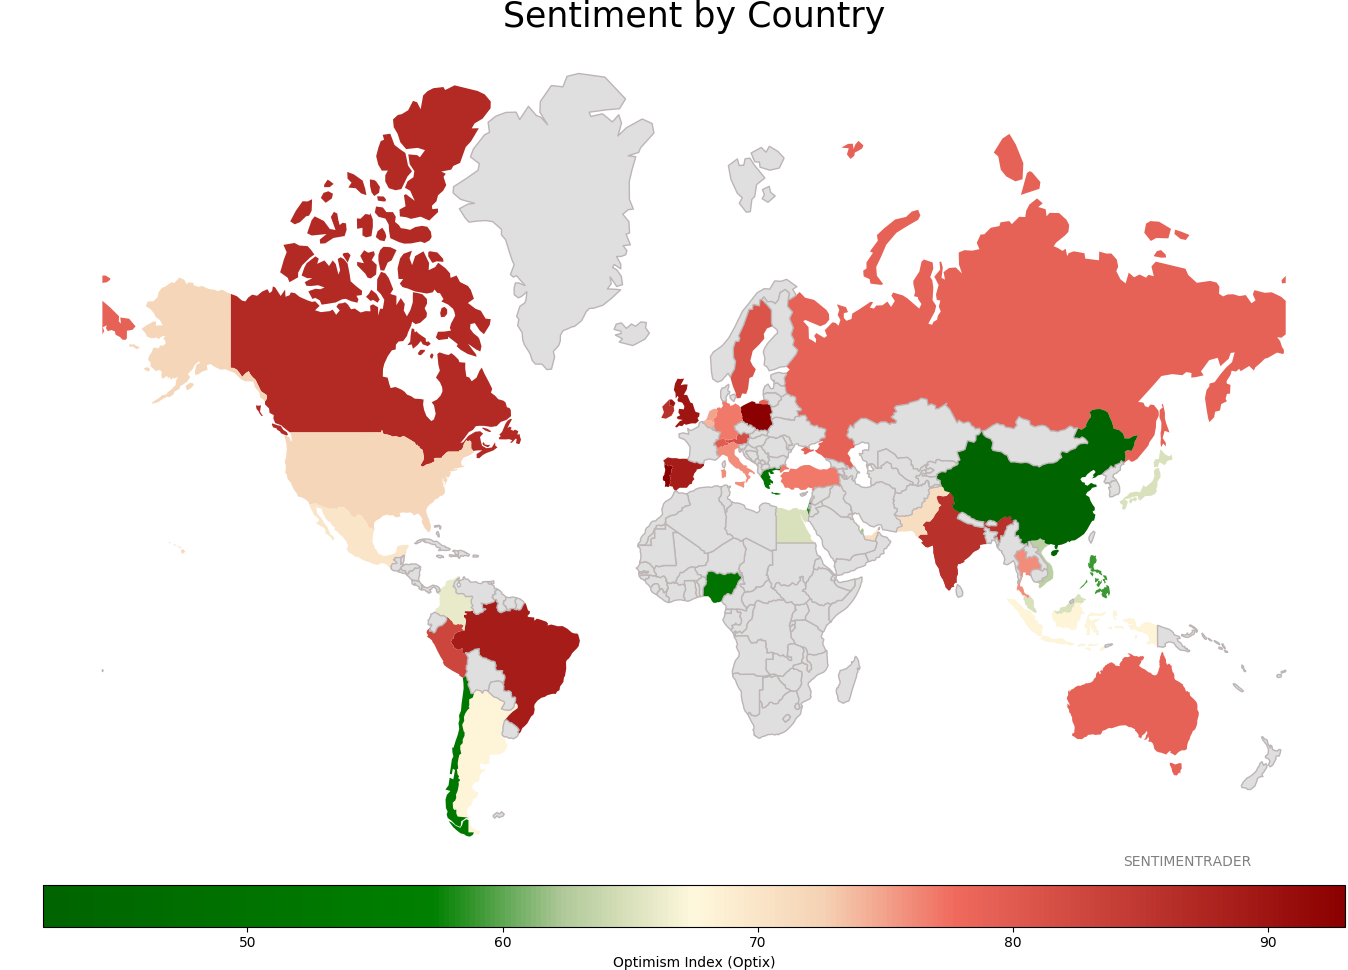
Sentiment Around The World
|
|
|
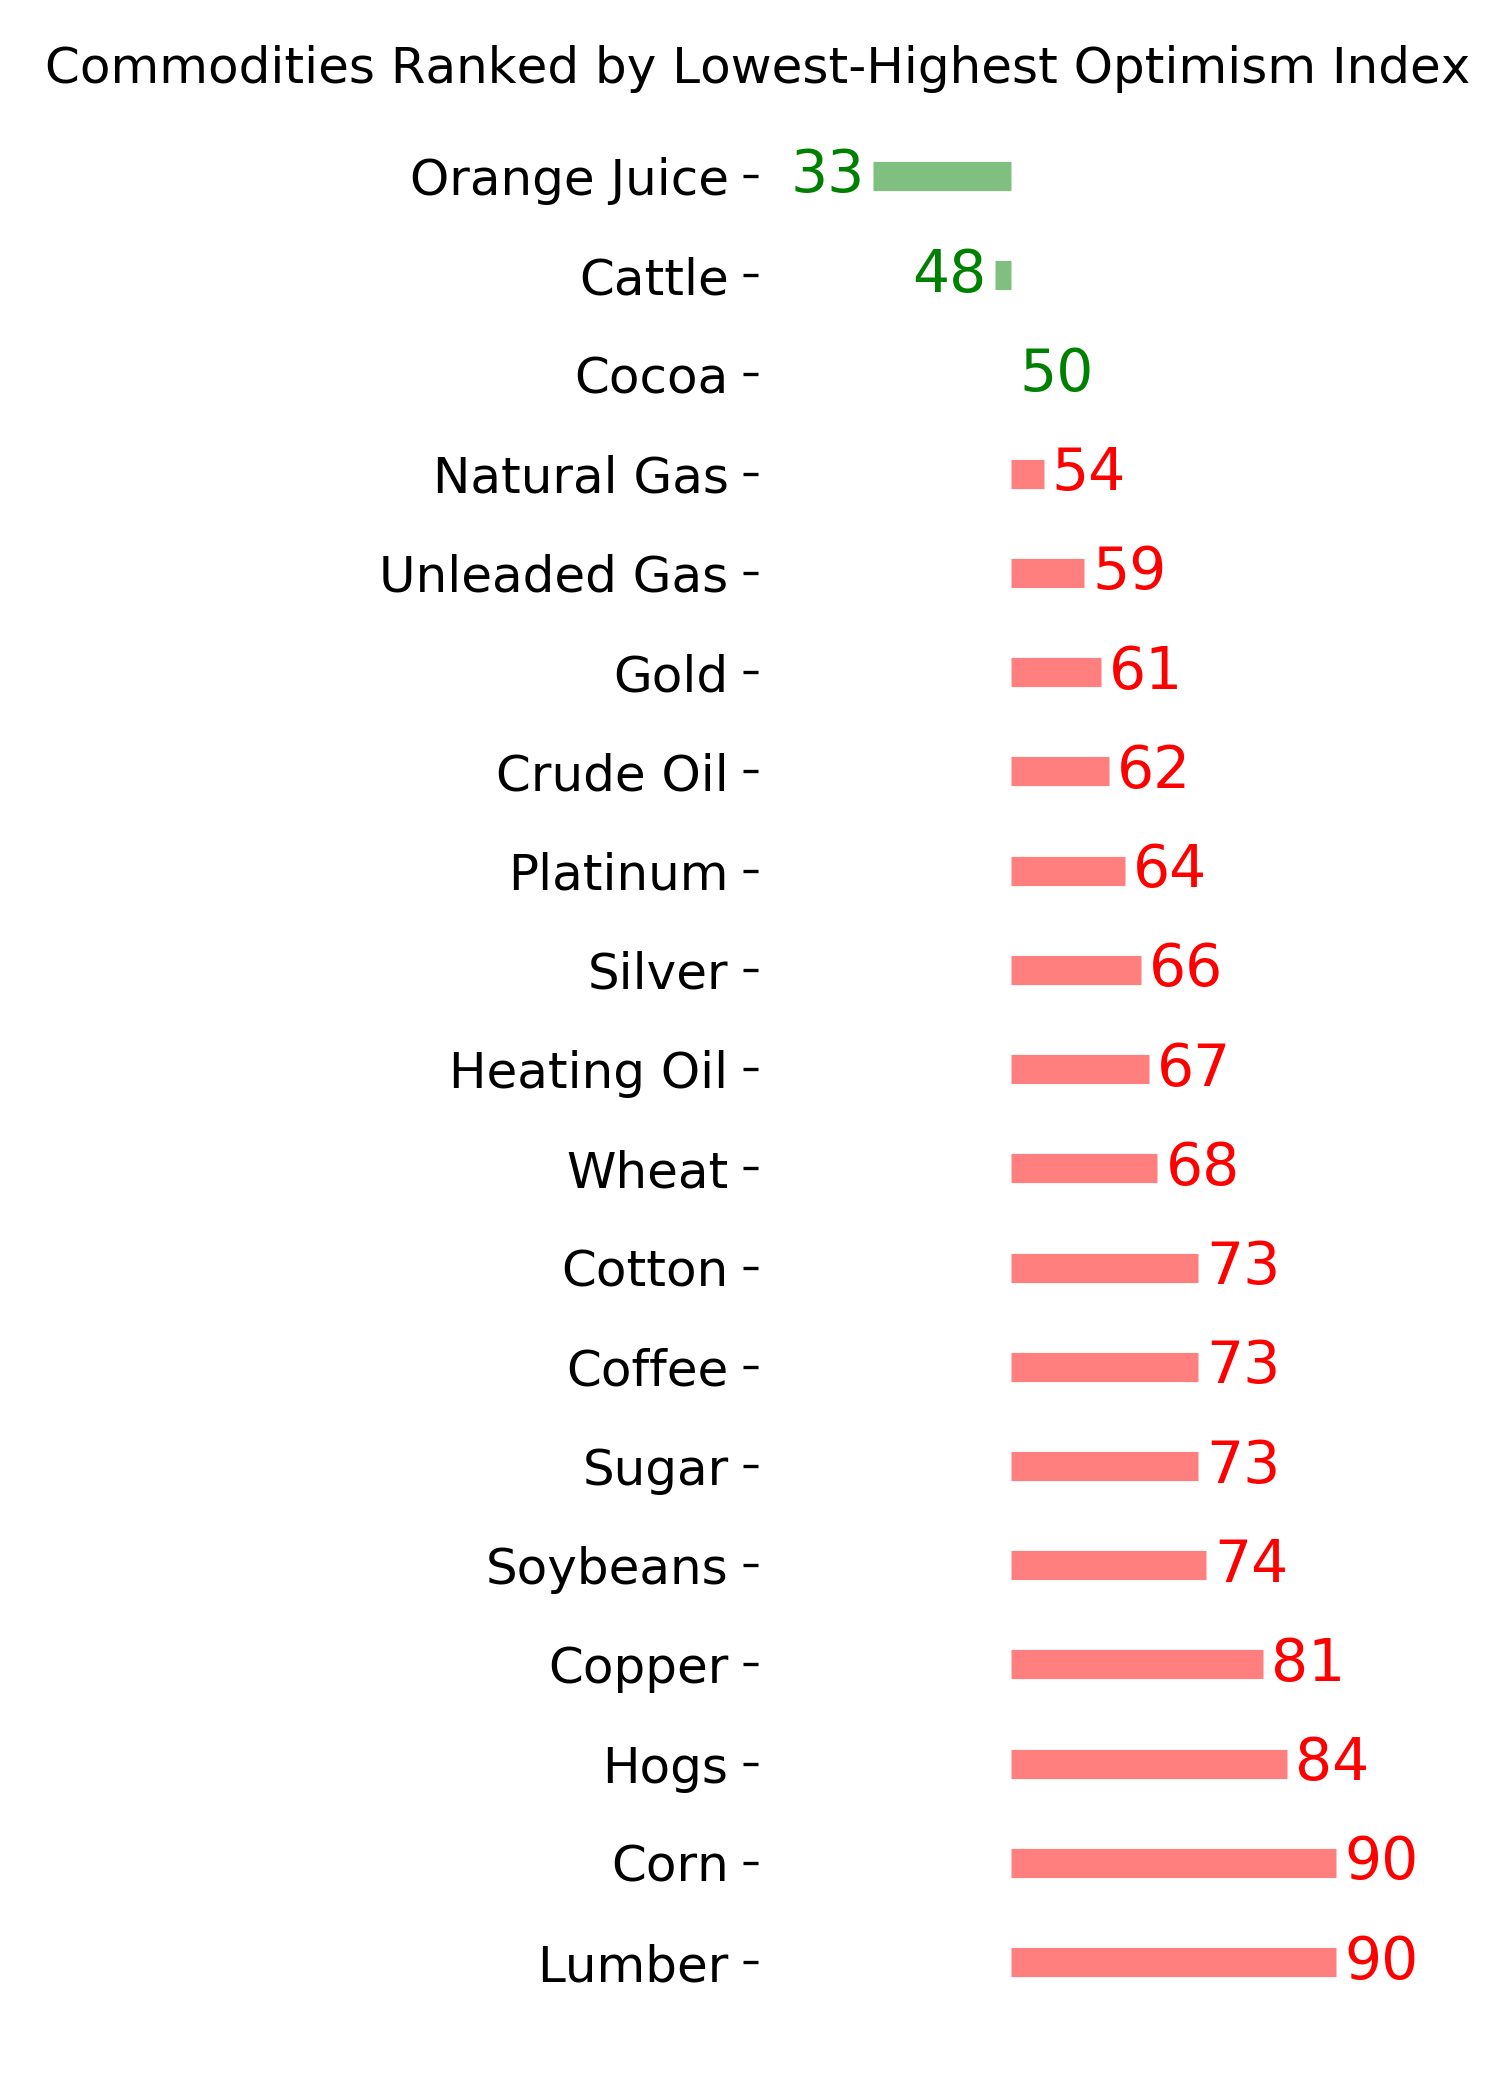
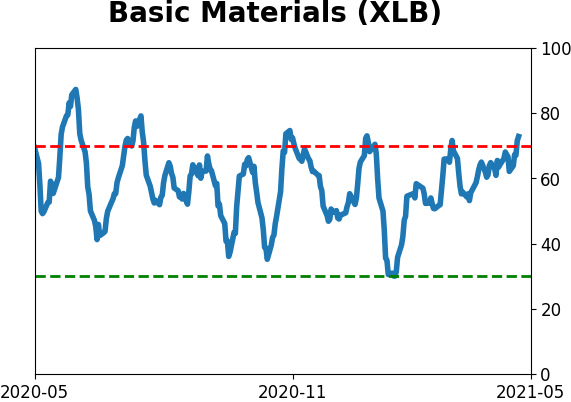
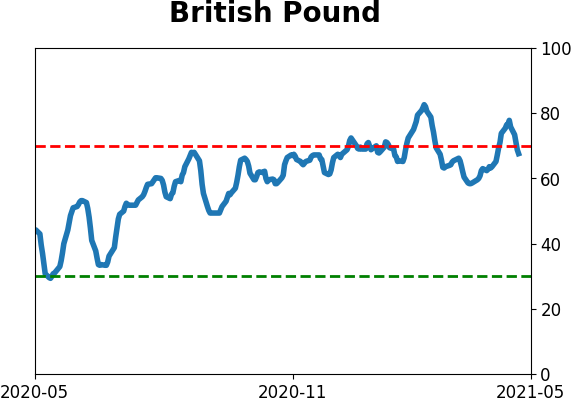
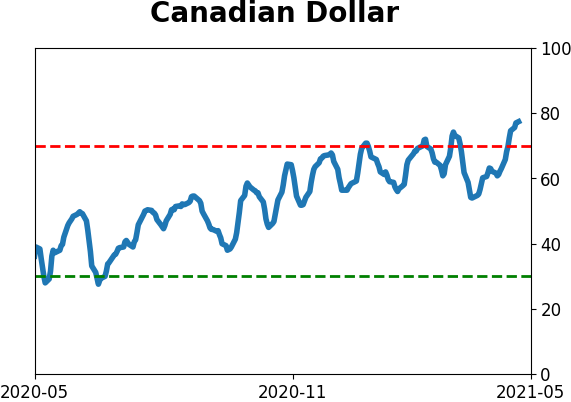
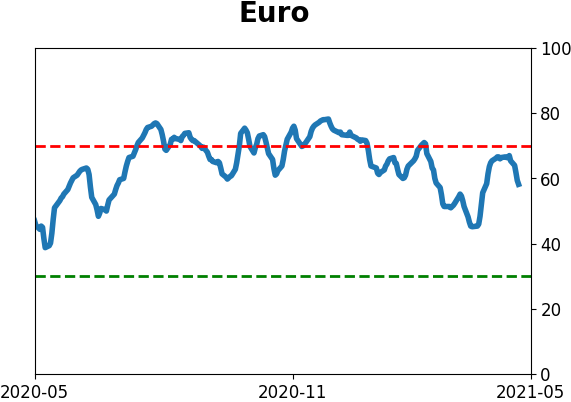
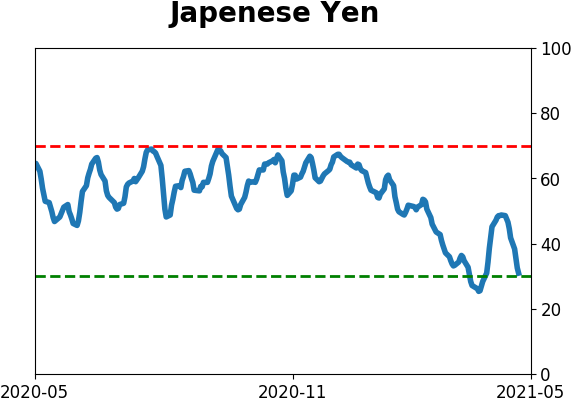
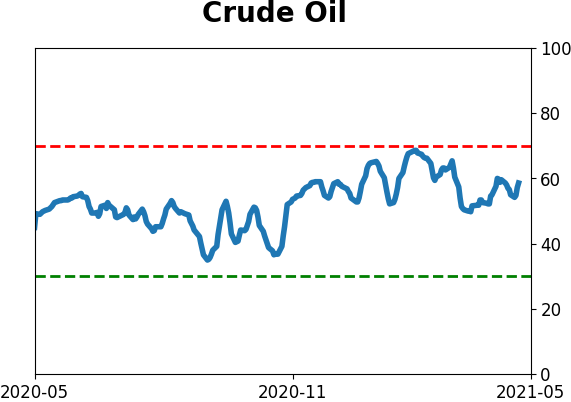
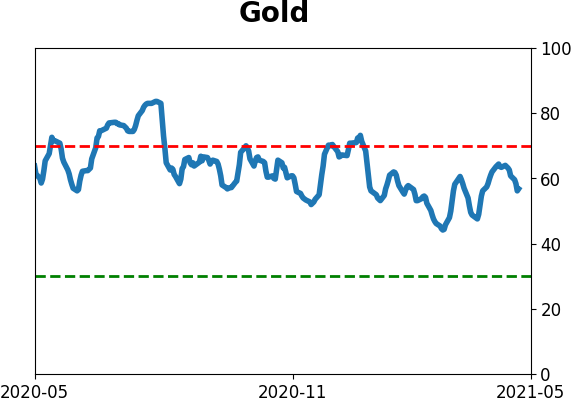
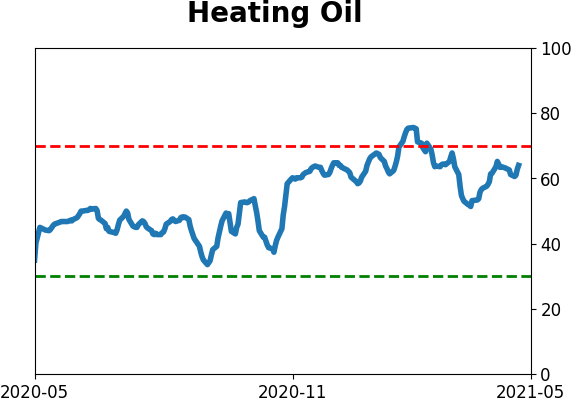
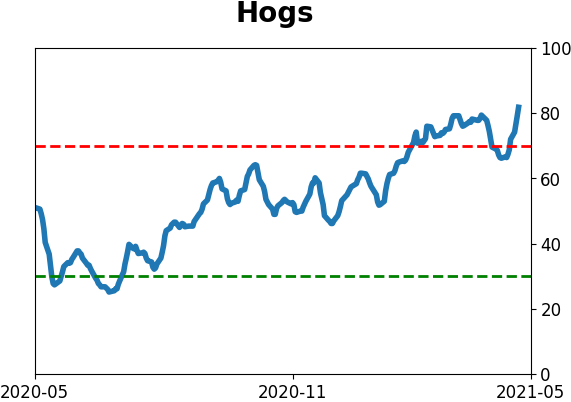
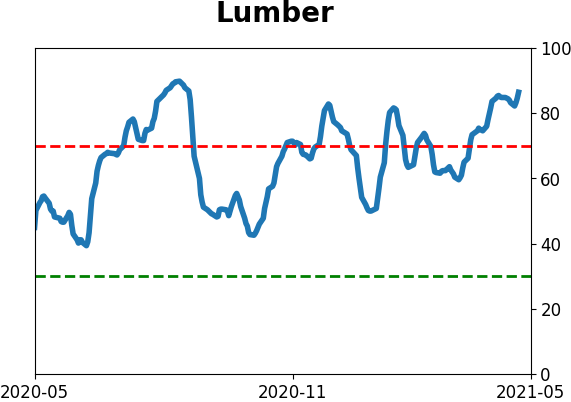
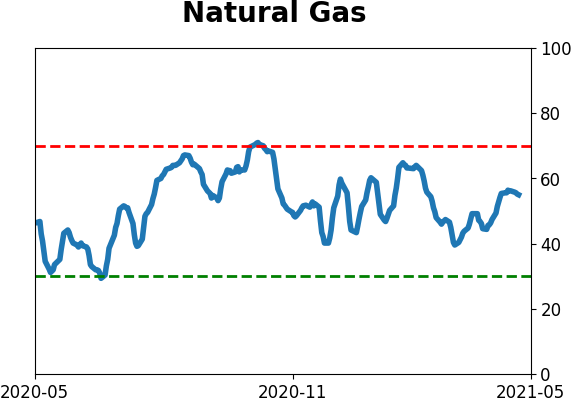
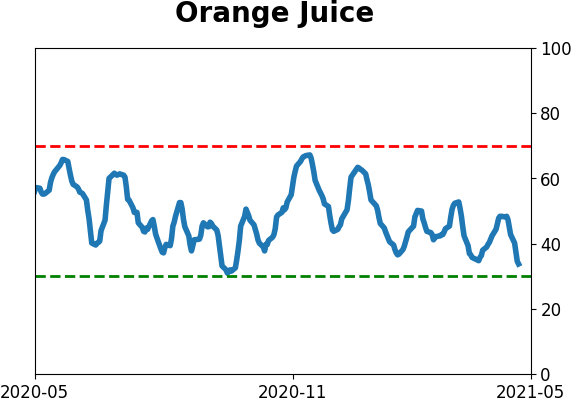
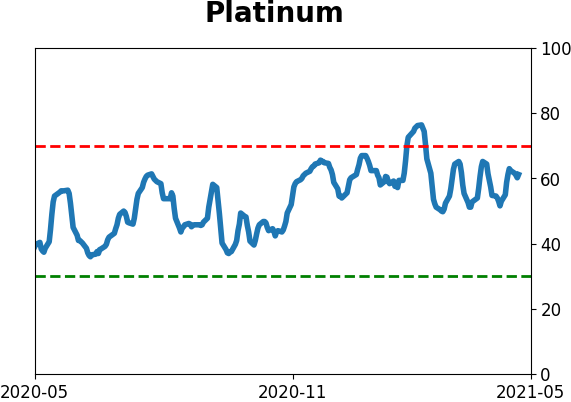
Optimism Index Thumbnails
|
|
|
|
|
|
|
|
|
|
|
|
|
|
|
|
|
|
|
|
|