Headlines
|
|
Who is actually buying?:
The latest surveys show that investors are still apathetic about stocks, even after a massive rise. The AAII survey even showed more bears than bulls. Fund flows have continued to be negative, and hedge fund exposure looks tepid, as do Rydex timer positions, futures speculators, and general consumers.
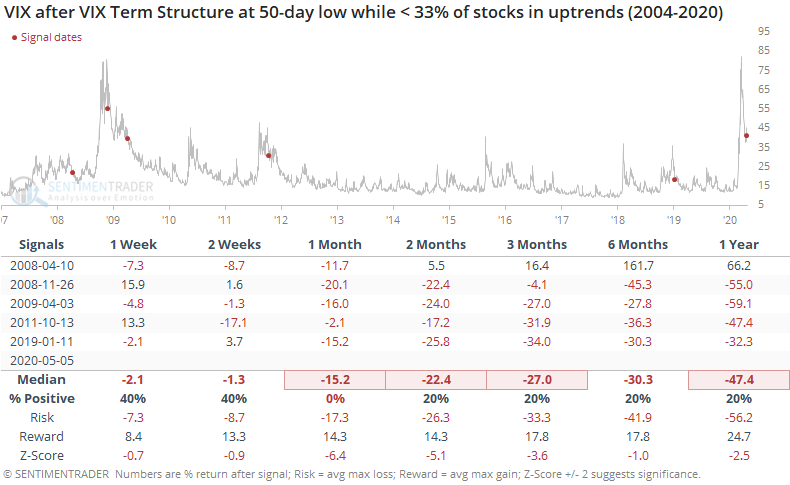
Volatility panic subsides, even with most stocks in downtrends:
Traders panicked in March, sending expectations of near-term volatility to extremely high levels versus longer-term expectations. That has eased and the spread between VIX futures contracts is nearing a 50-day low. But most stocks remain in downtrends, with fewer than a third of S&P 500 stocks above their 200-day moving averages.
The $100 billion club: The Invesco QQQ Trust (QQQ), the main go-to ETF for tech exposure, surpassed $100 billion in market capitalization on Thursday. There have been four other funds that have reached this milestone, all either broad market or S&P 500 funds. We'll see on Friday that it wasn't a great sign for those trying to jump on the bandwagon. Over the next 1-2 months, each of the funds showed a negative return.
Traders buying a lot of calls on stocks: On the ISE exchange on Thursday, traders bought to open nearly 350 call options on stocks for every 100 put options. That's among the most ever, with mixed results after the other very high readings. The Backtest Engine shows that when it was 250 or higher, the S&P 500 showed a slight negative bias up to two months later, with a -0.4% average return and 49% probability of showing a positive return. When it was that high and traders were buying a lot of index puts, with that ratio below 50, then two months later the S&P averaged a return of -2.1% and 44% win rate, but most of those losses were from 2007. Overall, it's a very slight negative.
|
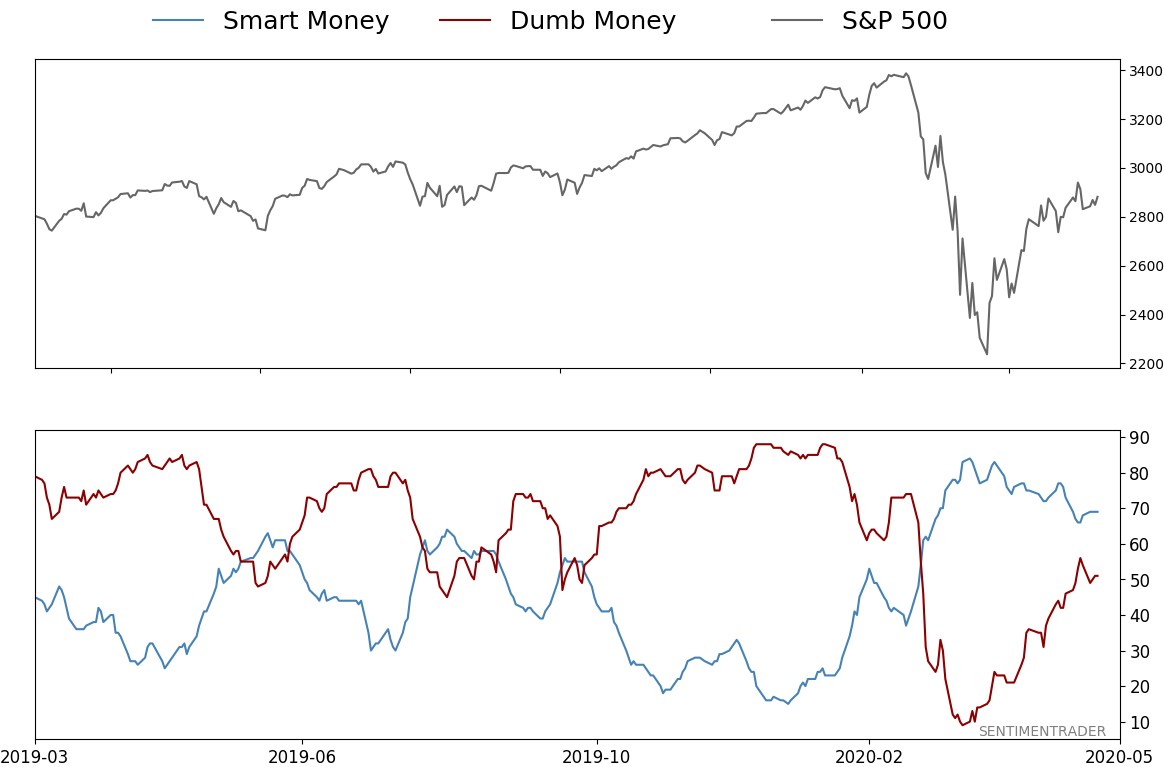
Smart / Dumb Money Confidence
|
Smart Money Confidence: 69%
Dumb Money Confidence: 51%
|
|
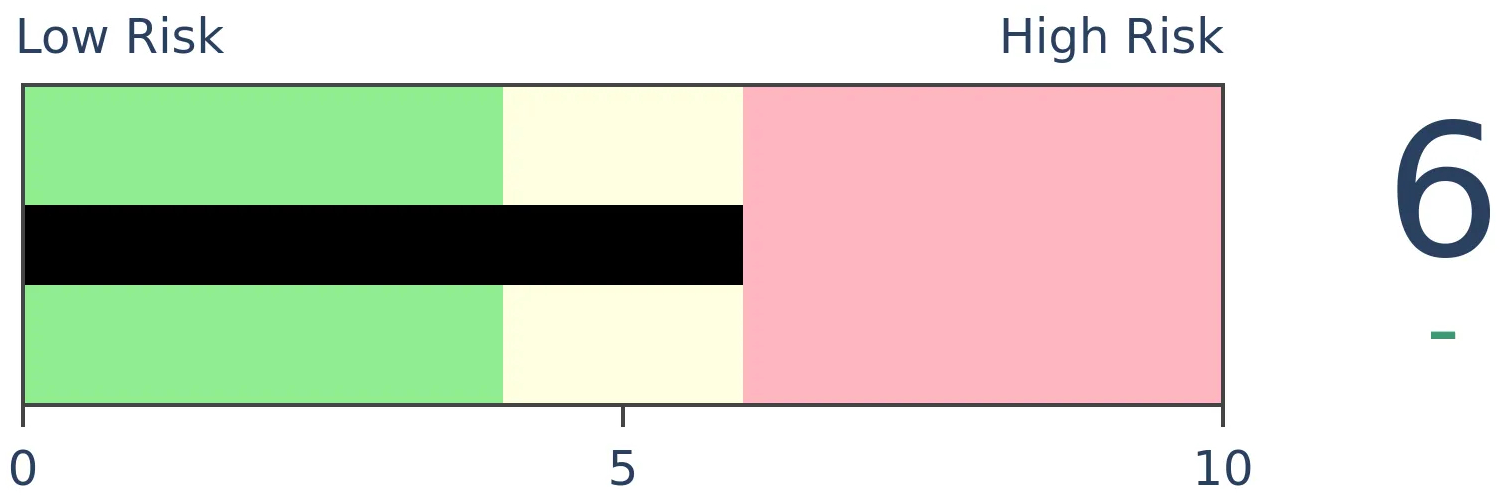
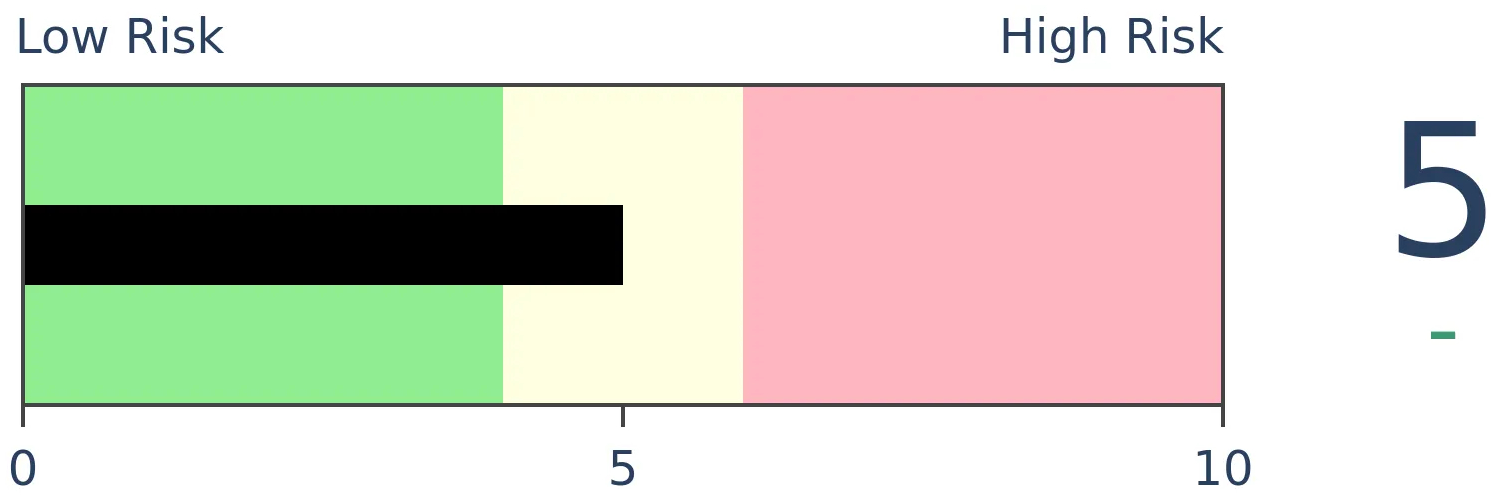
Risk Levels
Stocks Short-Term
|
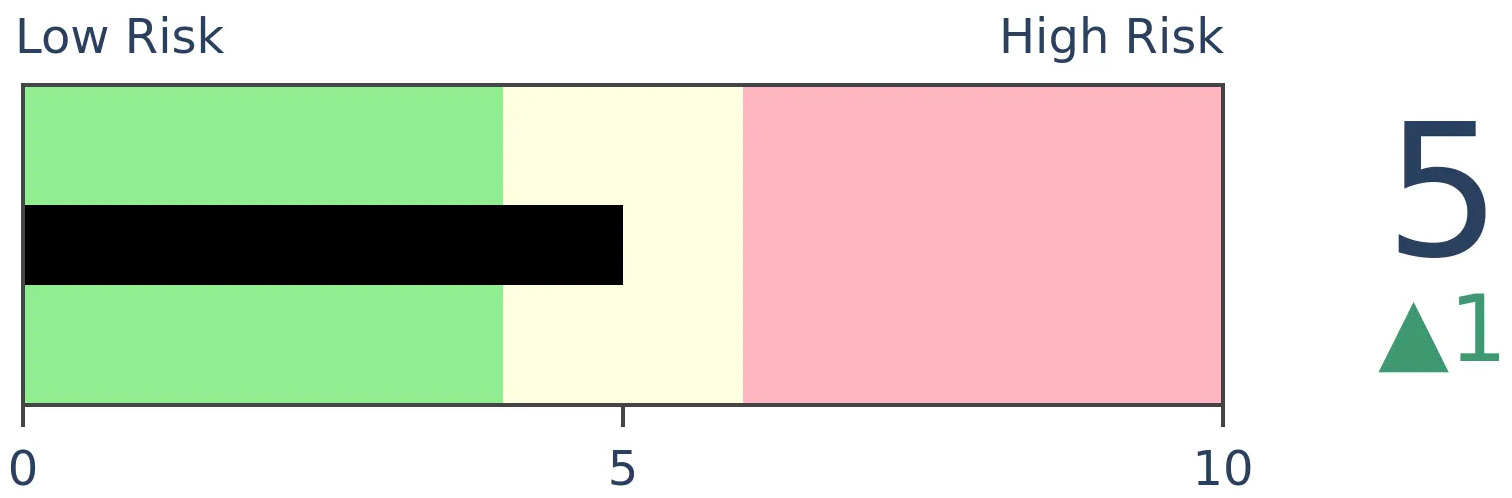
Stocks Medium-Term
|
|
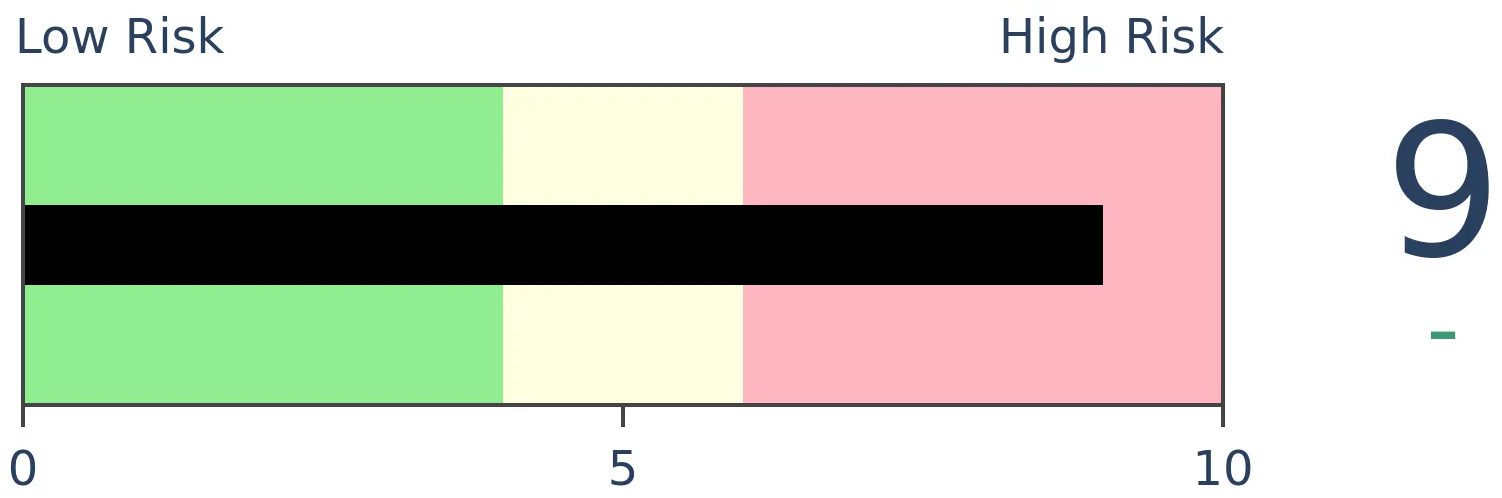
Bonds
|
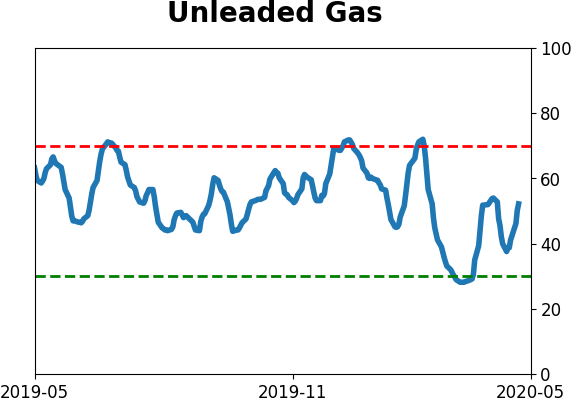
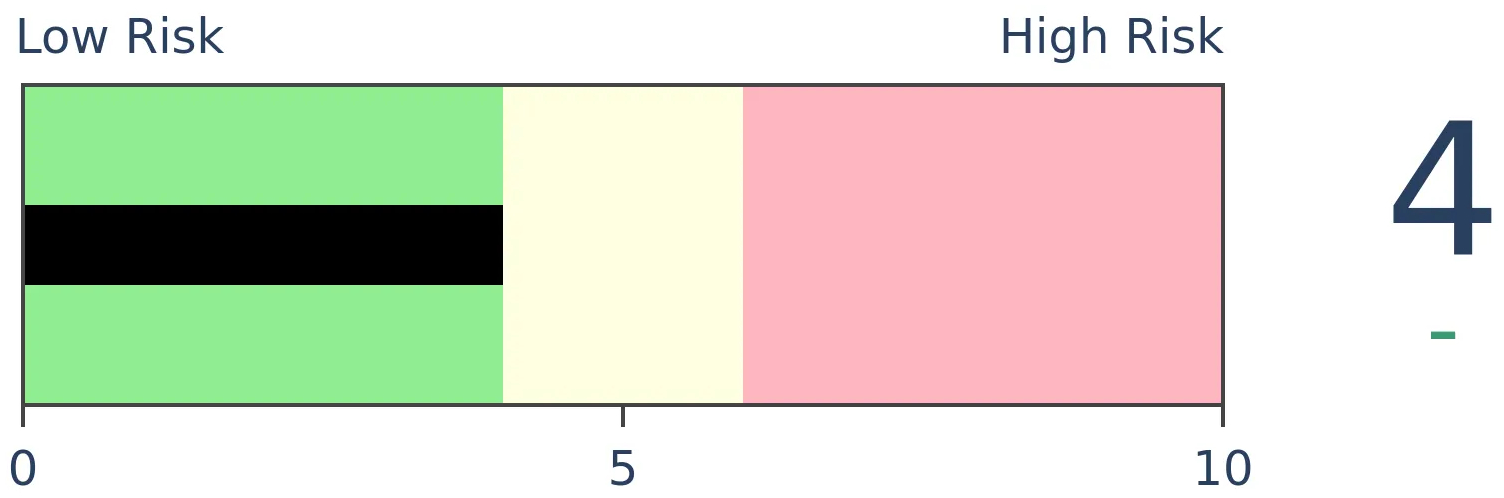
Crude Oil
|
|
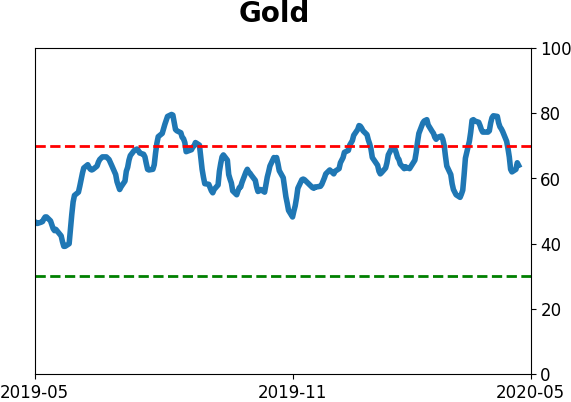
Gold
|
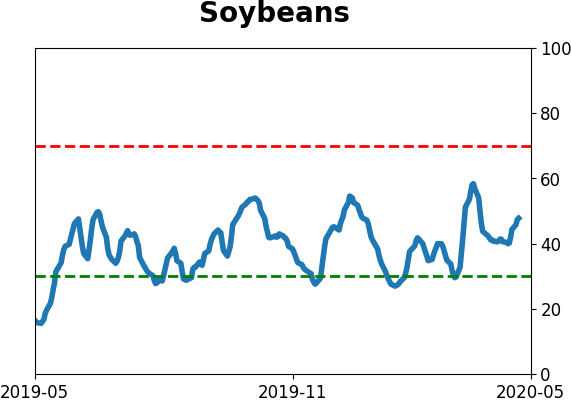
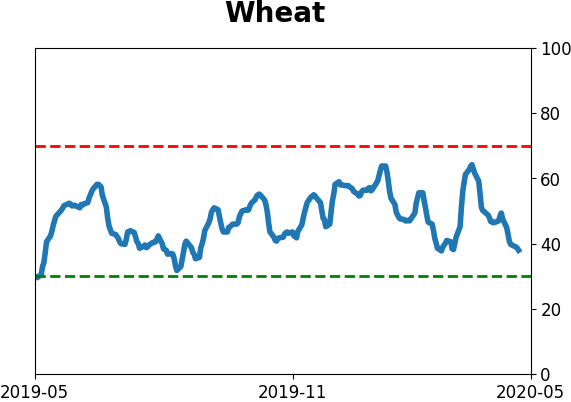
Agriculture

|
|
Research
BOTTOM LINE
The latest surveys show that investors are still apathetic about stocks, even after a massive rise. The AAII survey even showed more bears than bulls. Fund flows have continued to be negative, and hedge fund exposure looks tepid, as do Rydex timer positions, futures speculators, and general consumers.
FORECAST / TIMEFRAME
None
|
The latest survey of individual investors from AAII showed a big drop in optimism. We saw a couple of weeks ago that apathy was prevalent in most of the surveys, and that has continued.
The Backtest Engine shows that following any week when the Bull Ratio (Bulls / (Bulls + Bears)) was below 32%, forward returns in the S&P 500 were consistently positive.
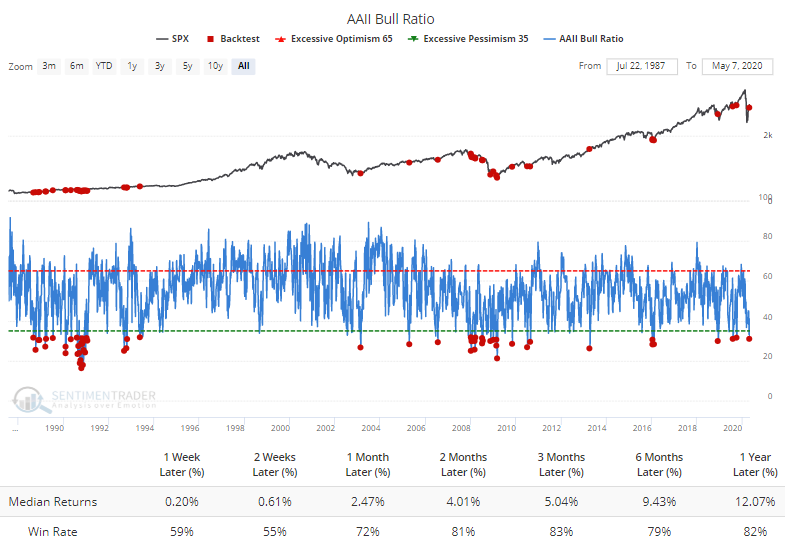
What's outstanding about the current week's reading is that it isn't coming after a big decline. Quite the opposite.
There has never been a period when optimism was so low after such a big rally. Out of the 54 times when the S&P 500 showed a gain of 10% or more over a 7-week period, not one of them (until this week) saw more than 50% of respondents consider themselves bearish.
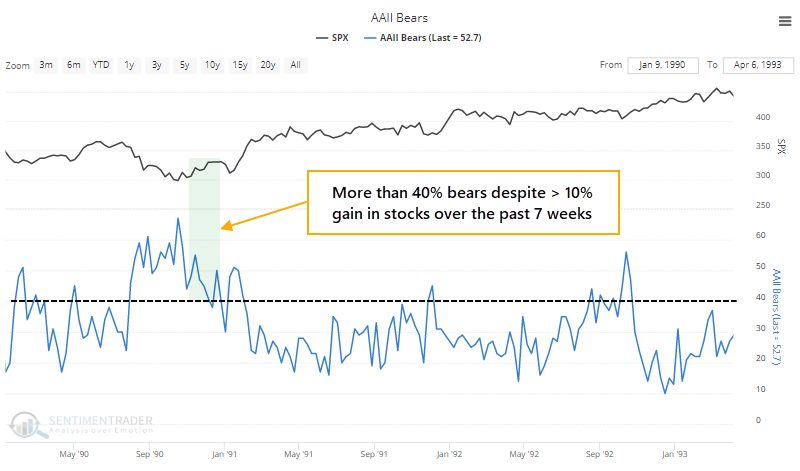
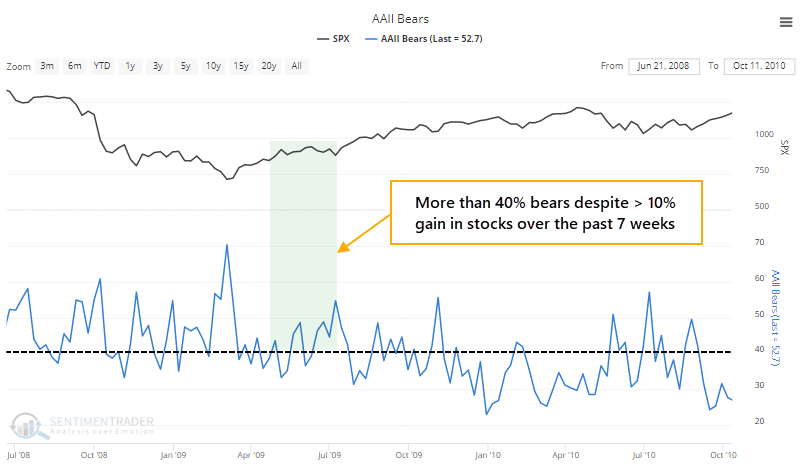
The only times more than 40% of respondents were bearish were December 1990 and a few weeks from April - August 2009.
Like we've had to do with so many developments over the past two months, we'll need to relax the parameters in order to get any semblance of a precedent. The table below looks for times when the S&P rallied 10% or more over the past 7 weeks, and yet the AAII Bull Ratio declined during that stretch.
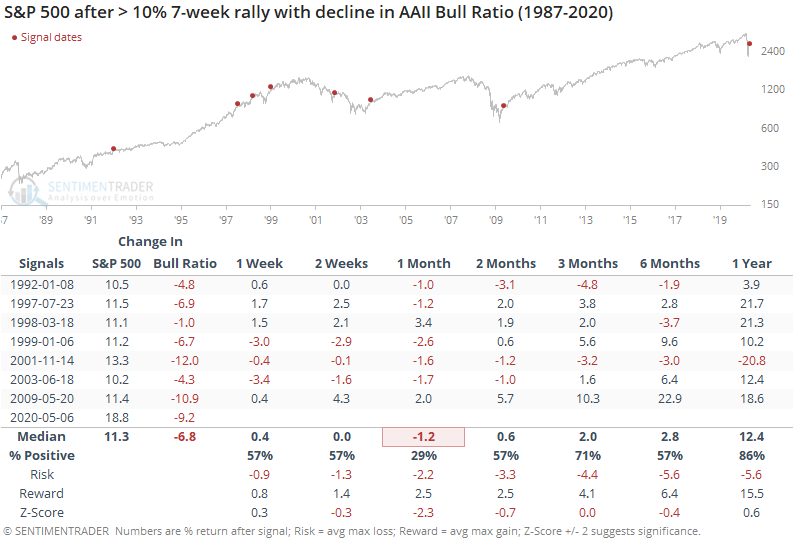
Bull markets need an increasing number of folks to turn optimistic, so stocks usually struggled a bit shorter-term after similar bouts of skepticism, then turned increasingly positive in the months ahead.
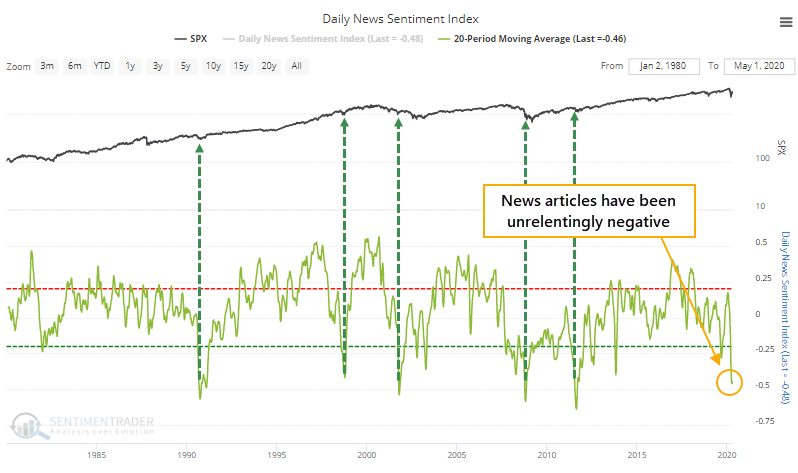
It's not hard to see why investors are so skittish. Watching any local or national news broadcast makes jumping off a bridge seem like an enjoyable afternoon activity. The unrelenting negativity is onerous, and by some measures, among the worst it's ever been.
There is some evidence that investors are voting with their actions and not just their mouths. Combined equity fund flows in mutual funds and ETFs, with domestic and overseas exposure, continue to be among the lowest seen in over a decade.
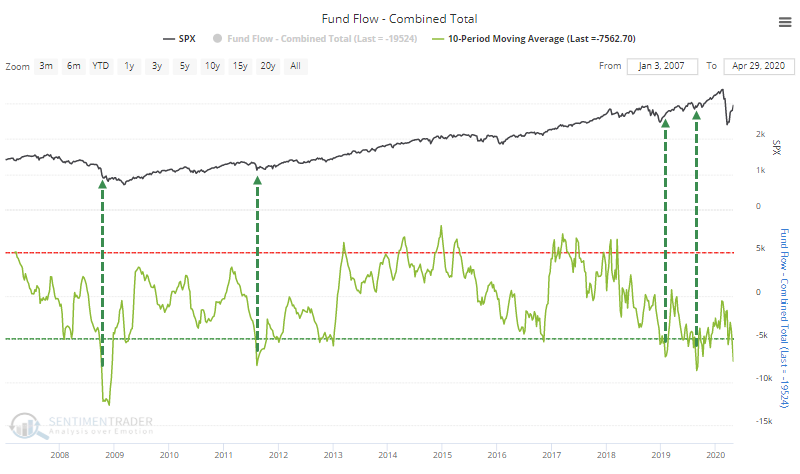
It's even worse for overseas-specific funds.

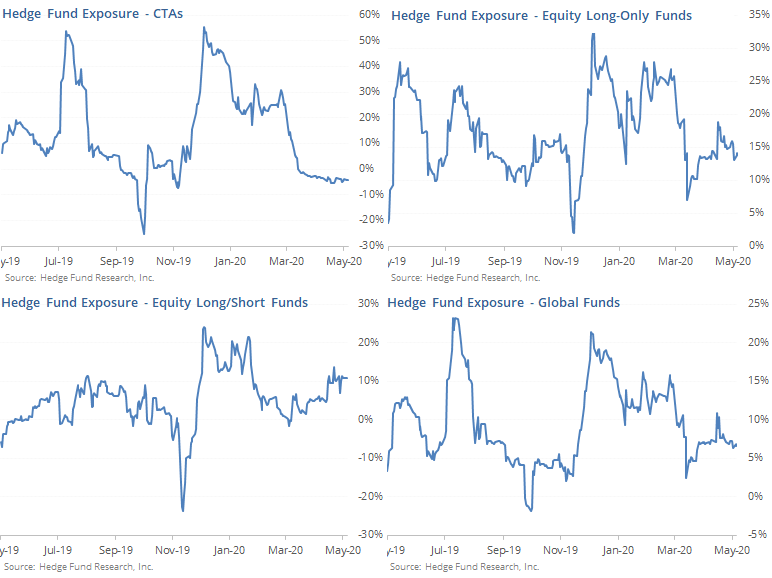
If individuals aren't buying, then maybe hedge funds are. Some large investment banks have noted recently that their hedge fund clients have been buying, with relatively high net long positions.
Based on the rolling beta of various hedge fund indexes to the S&P 500 over the past month, though, it's hard to see which types of funds have been buyers. Trend-following CTAs remain net short, at least roughly judging by their movements against the S&P. The only group showing above-neutral exposure is long/short equity funds, and even that is only mediocre.
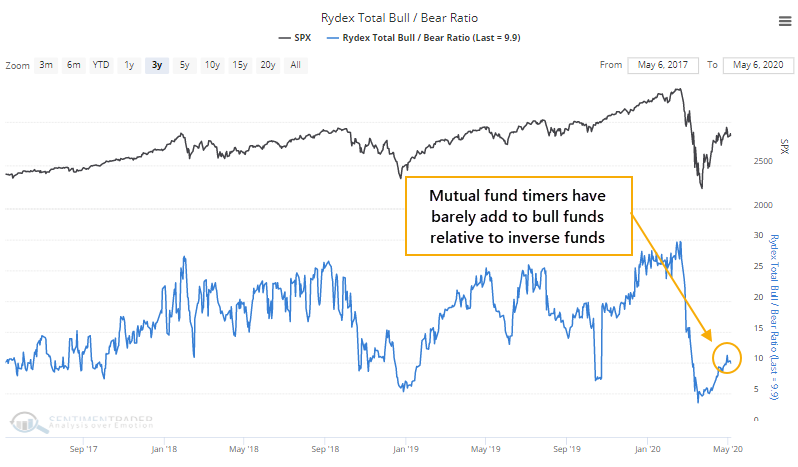
Rydex fund timers aren't buying, either. The ratio of assets in bull versus bear funds remains very low, including all index funds and only those that are leveraged.
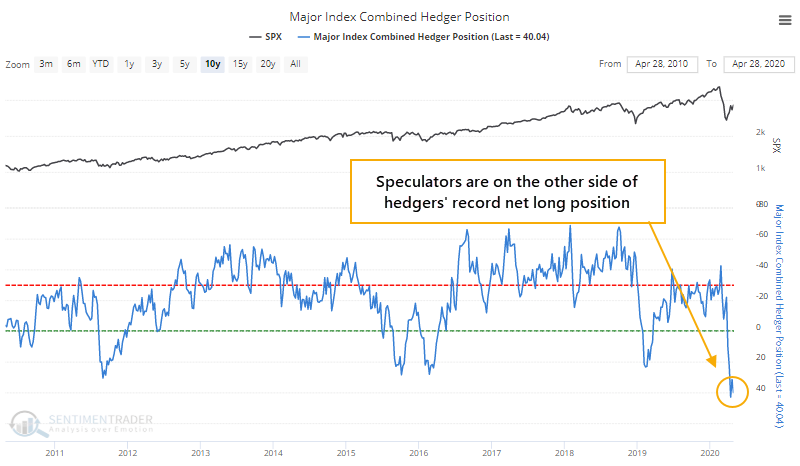
Large and small speculators in the major index futures are net short more than $40 billion worth of contracts, near a record. So, clearly, they're not eager to buy, either. By definition, speculators are on the other side of hedgers' positions.
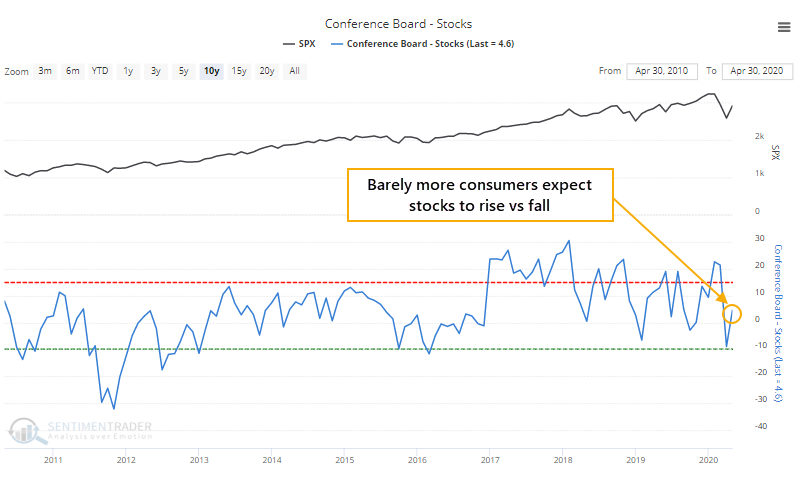
While they're not exactly showing pessimism, consumers in general still have a subdued outlook on stocks. Despite a massive rally in April, barely more expect stocks to rise than fall in the months ahead.
So...who's actually doing all the buying? I dunno. It seems to be a broad mix of groups, adding back modestly to whatever they sold during the plunge. There doesn't seem to be any single group that's helping to drive prices higher, at least not a group that's large enough to show an impact.
These are not necessarily positive developments. Bulls should want to see more and more people become optimistic, until the point when it hits an extreme. If we're truly in a prolonged bear market environment, then we won't likely see much more optimism than we have lately before stocks start to really struggle again. The jury is still out on that one. In a bull market, we have a ways to go before optimism would be considered troublesome, as most of them are still well below their thresholds.
BOTTOM LINE
Traders panicked in March, sending expectations of near-term volatility to extremely high levels versus longer-term expectations. That has eased and the spread between VIX futures contracts is nearing a 50-day low. But most stocks remain in downtrends, with fewer than a third of S&P 500 stocks above their 200-day moving averages.
FORECAST / TIMEFRAME
None
|
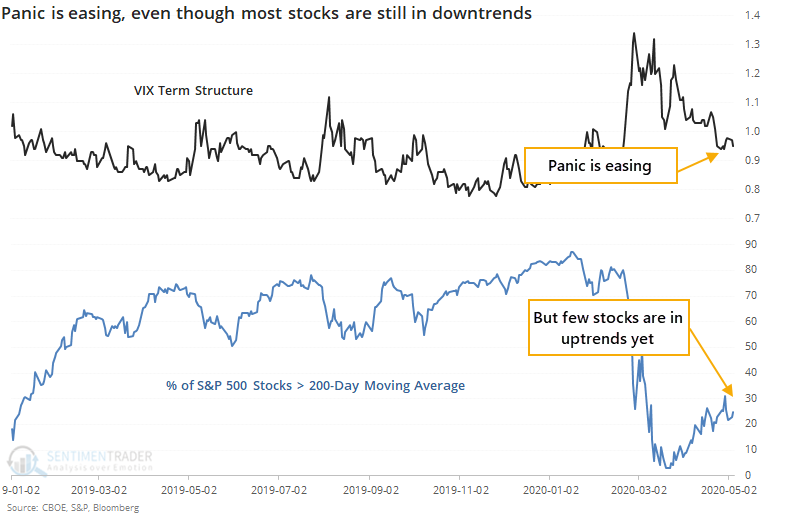
Traders continue to ease off the extreme panic seen in March, even though most stocks are still struggling.
The Wall Street Journal notes that:
"While S&P 500 volatility levels have subsided, only 23% of stocks are above their 200-day moving average. That's an indication of low market breadth, according to State Street."
The VIX Term Structure showed that traders were pricing in higher volatility in the very short-term while lower levels longer-term. This happens during times of outright panic.
The spread between those futures contracts has contracted steadily since the peak in March and is now sitting near a 50-day low. Even while that has eased, though, fewer than a third of stocks within the S&P 500 have managed to climb back above their 200-day averages.
The suggestion is that volatility traders are getting ahead of themselves, with improving sentiment that's not backed up by a majority of stocks. VIX futures history is limited, so we don't have a lot to work with.
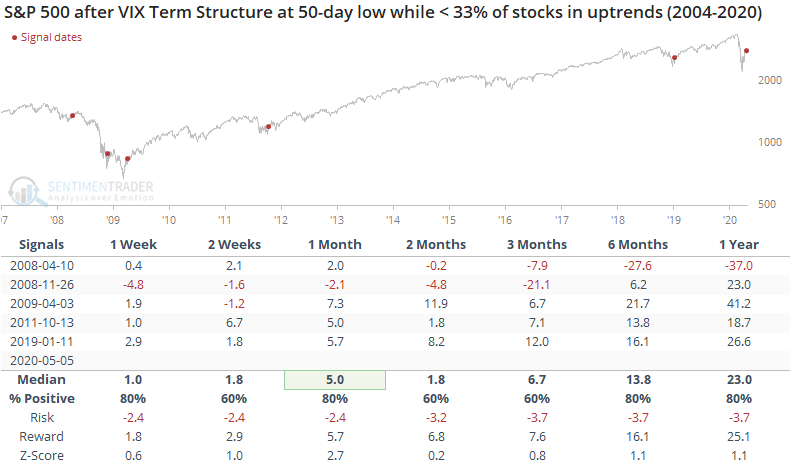
In 2008, traders got ahead of themselves, and stocks fell back hard both times. But when it triggered in 2009, 2011, and 2019, it was a sign that the worst was past and the easing panic led to more and more stocks recovering.
For the VIX, it led to lower levels each time during the next month, even in 2008, which is a bit of a surprise.
Active Studies
| Time Frame | Bullish | Bearish | | Short-Term | 0 | 6 | | Medium-Term | 12 | 0 | | Long-Term | 37 | 3 |
|
Indicators at Extremes
Portfolio
| Position | Weight % | Added / Reduced | Date | | Stocks | 49.9 | Reduced 10.3% | 2020-04-23 | | Bonds | 0.0 | Reduced 6.7% | 2020-02-28 | | Commodities | 5.1 | Added 2.4%
| 2020-02-28 | | Precious Metals | 0.0 | Reduced 3.6% | 2020-02-28 | | Special Situations | 0.0 | Reduced 31.9% | 2020-03-17 | | Cash | 45.0 | | |
|
Updates (Changes made today are underlined)
In the first months of the year, we saw manic trading activity. From big jumps in specific stocks to historic highs in retail trading activity to record highs in household confidence to almost unbelievable confidence among options traders. All of that came amid a market where the average stock couldn't keep up with their indexes. There were signs of waning momentum in stocks underlying the major averages, which started triggering technical warning signs in late January. The kinds of extremes we saw in December and January typically take months to wear away, but the type of selling in March went a long way toward getting there. When we place the kind of moves we saw into March 23 into the context of coming off an all-time high, there has been a high probability of a multi-month rebound. After stocks bottomed on the 23rd, they enjoyed a historic buying thrust and retraced a larger amount of the decline than "just a bear market rally" tends to. While other signs are mixed that panic is subsiding, those thrusts are the most encouraging sign we've seen in years. Shorter-term, there have been some warning signs popping up and our studies have stopped showing as positively skewed returns. I reduced my exposure some in late April and will consider further reducing it if we start to see some lower highs and lower lows. Long-term suggestions from the studies remain robust, but shorter-term ones are significantly less so, and stocks still have to prove that we're in something other than a protracted, recessionary bear market.
RETURN YTD: -8.9% 2019: 12.6%, 2018: 0.6%, 2017: 3.8%, 2016: 17.1%, 2015: 9.2%, 2014: 14.5%, 2013: 2.2%, 2012: 10.8%, 2011: 16.5%, 2010: 15.3%, 2009: 23.9%, 2008: 16.2%, 2007: 7.8%
|
|
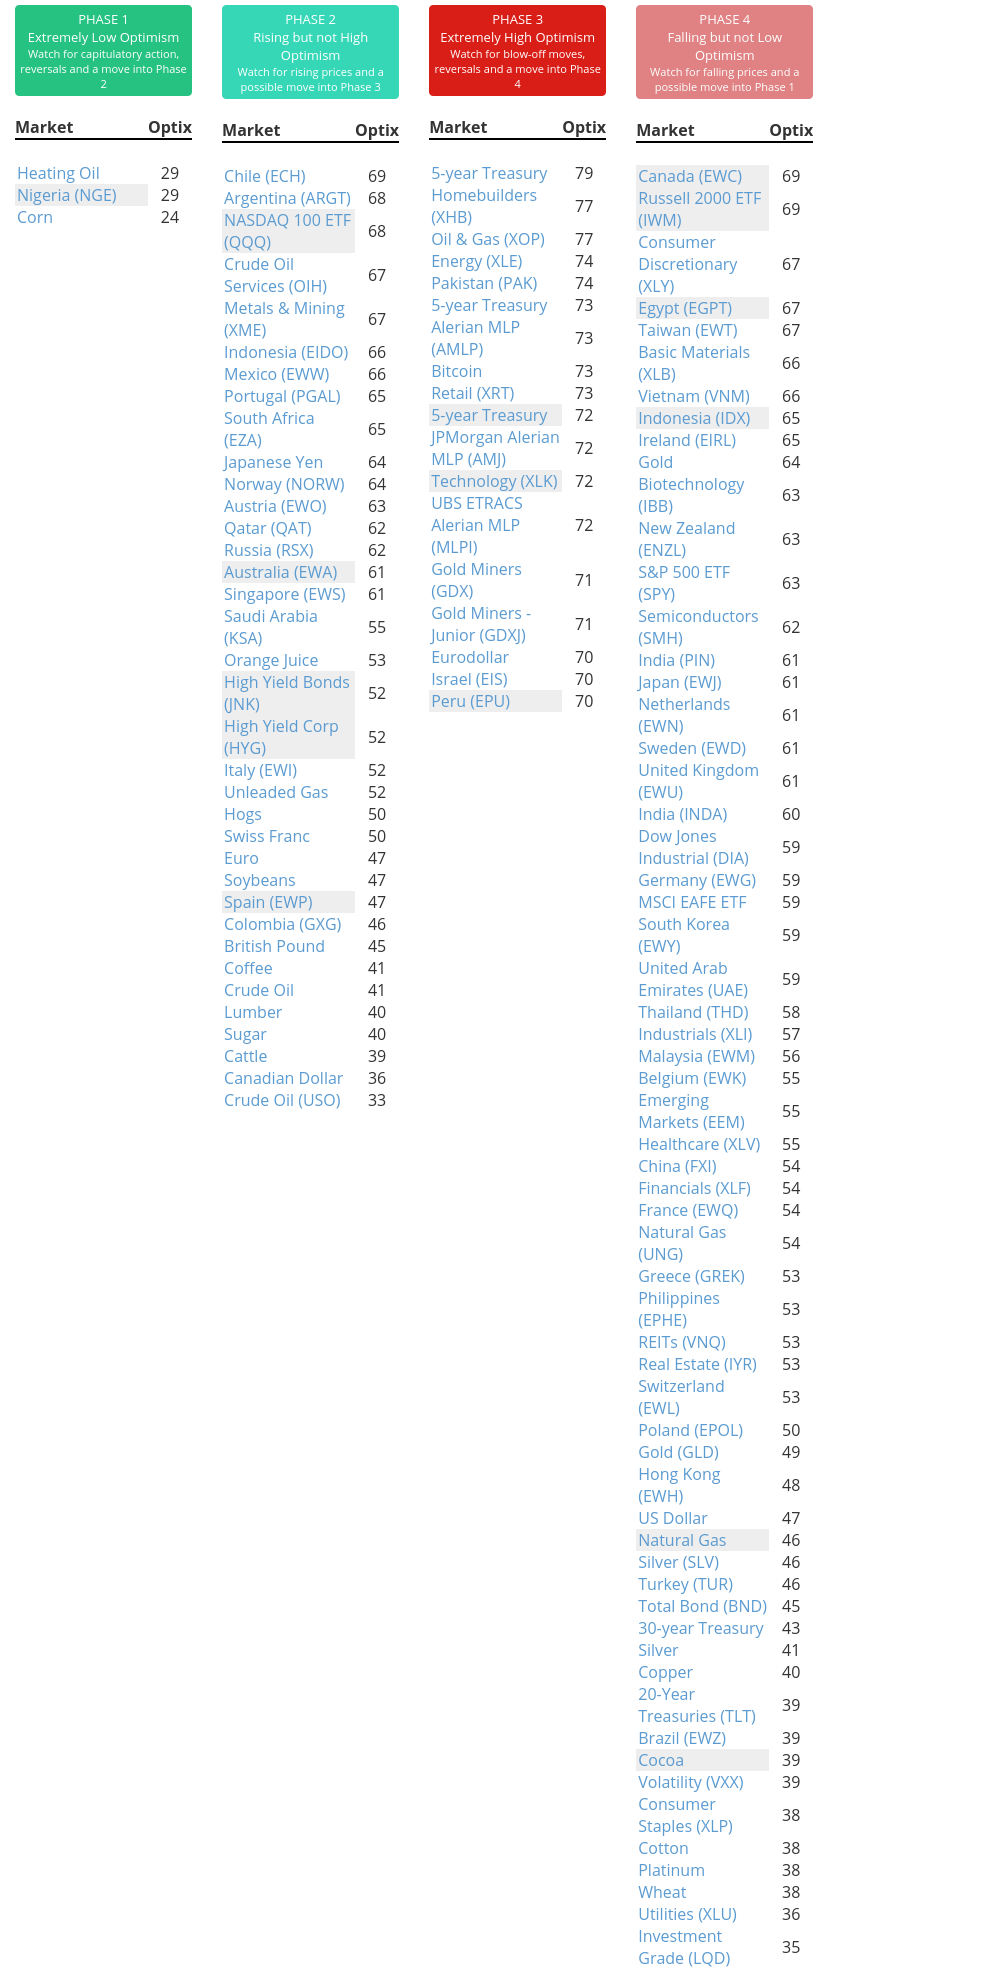
Phase Table
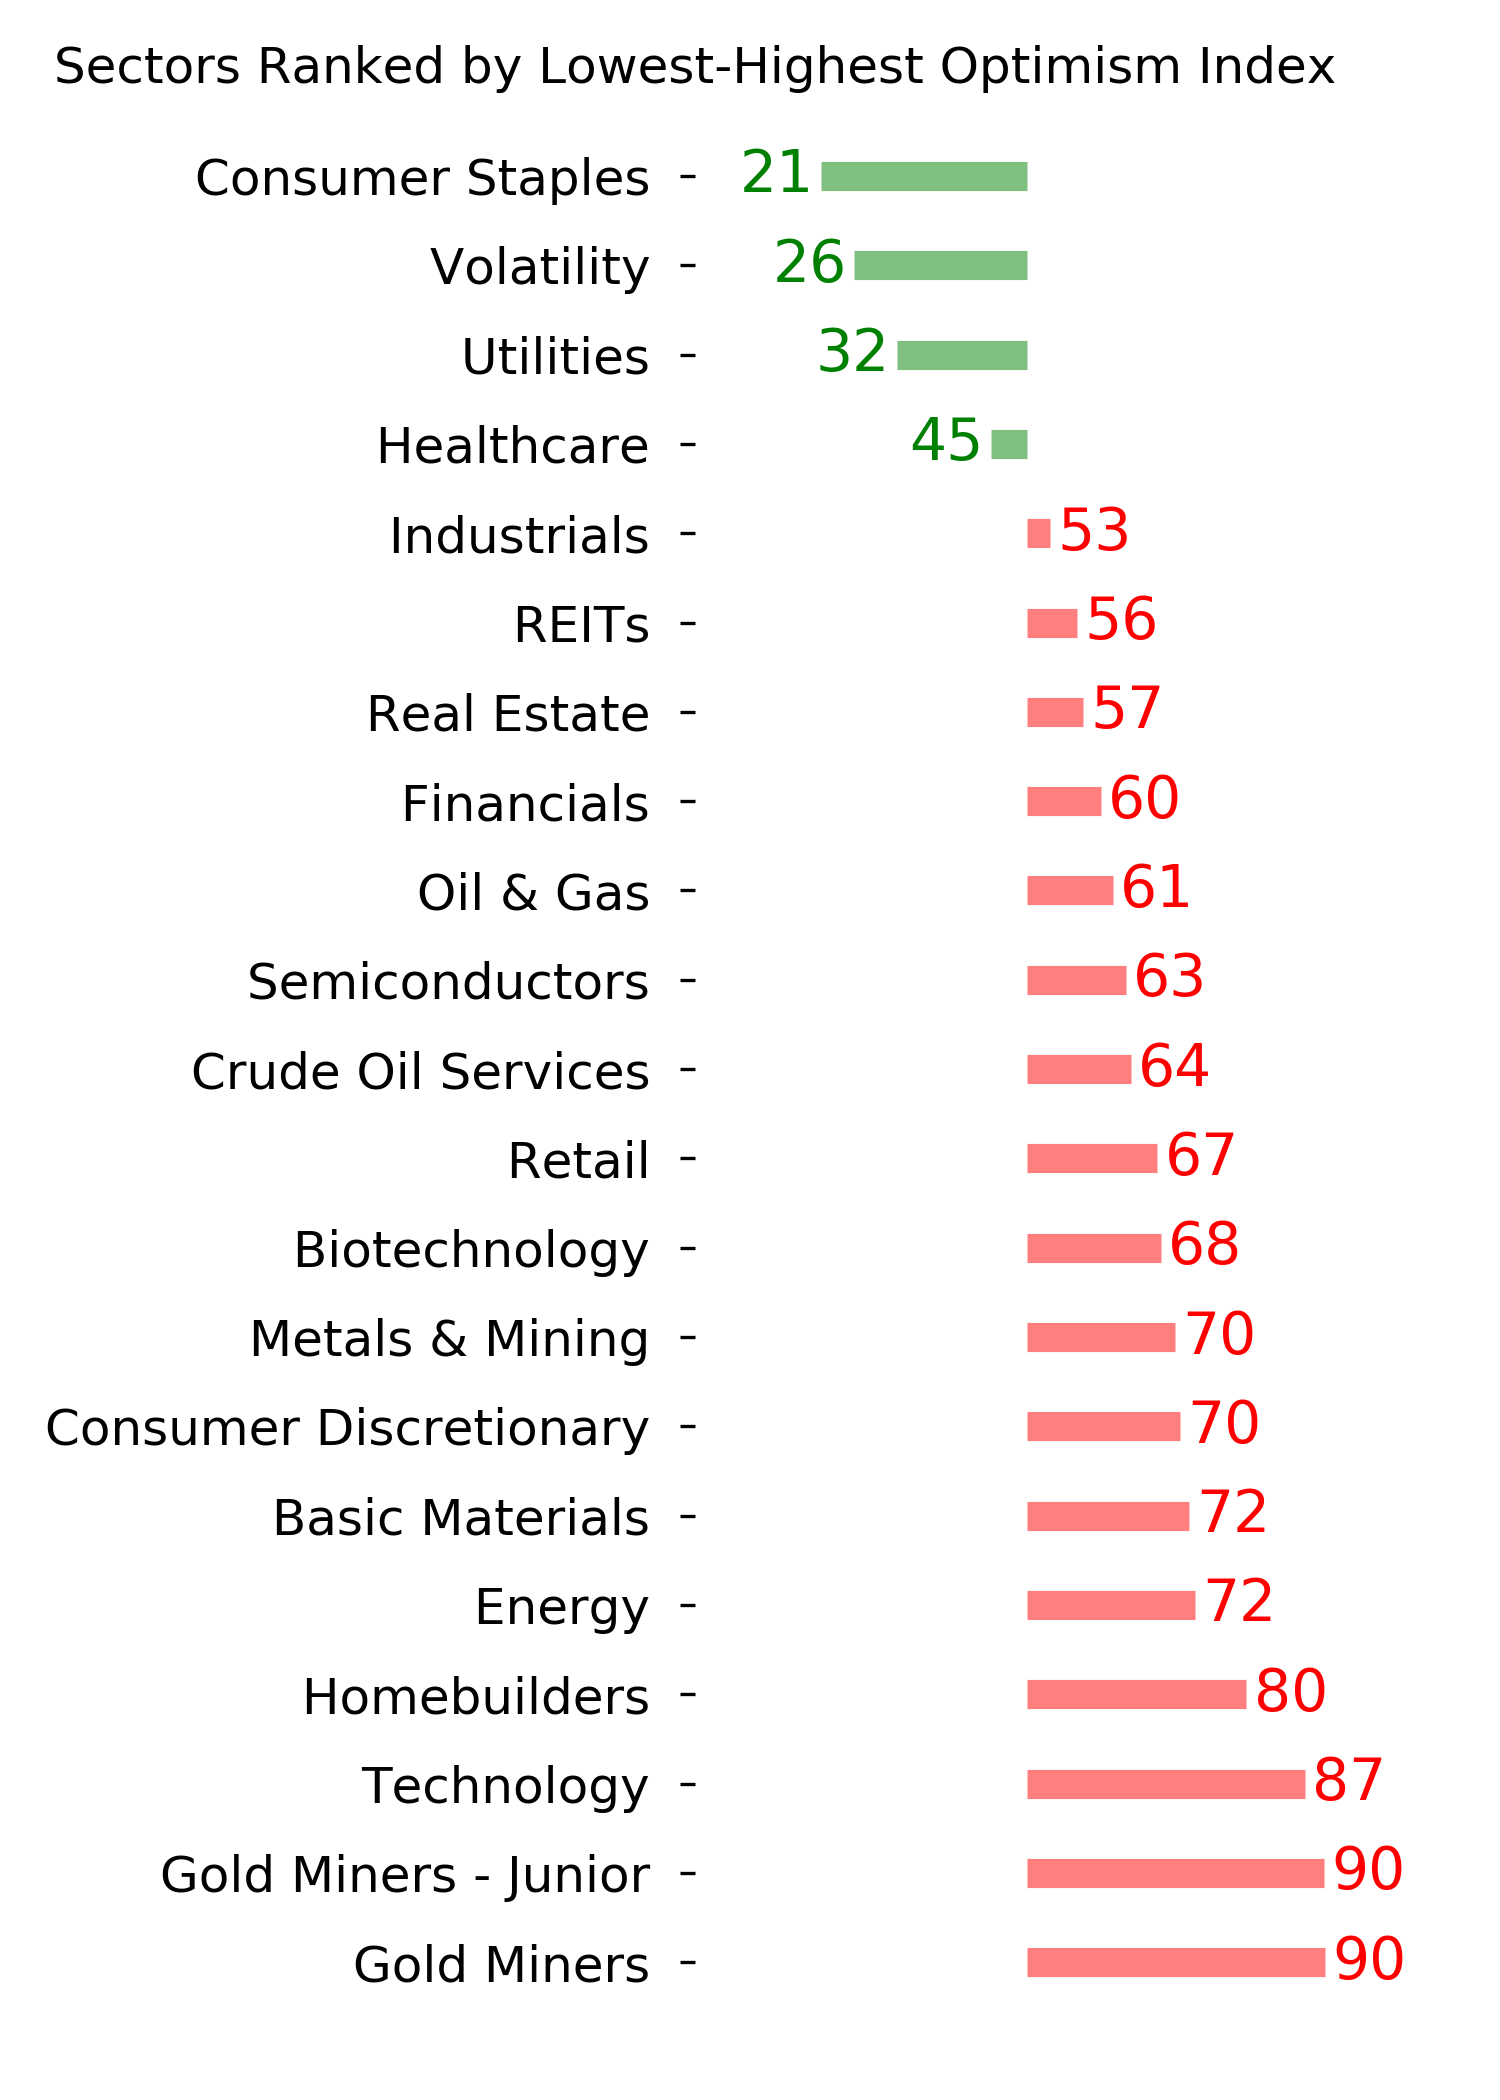
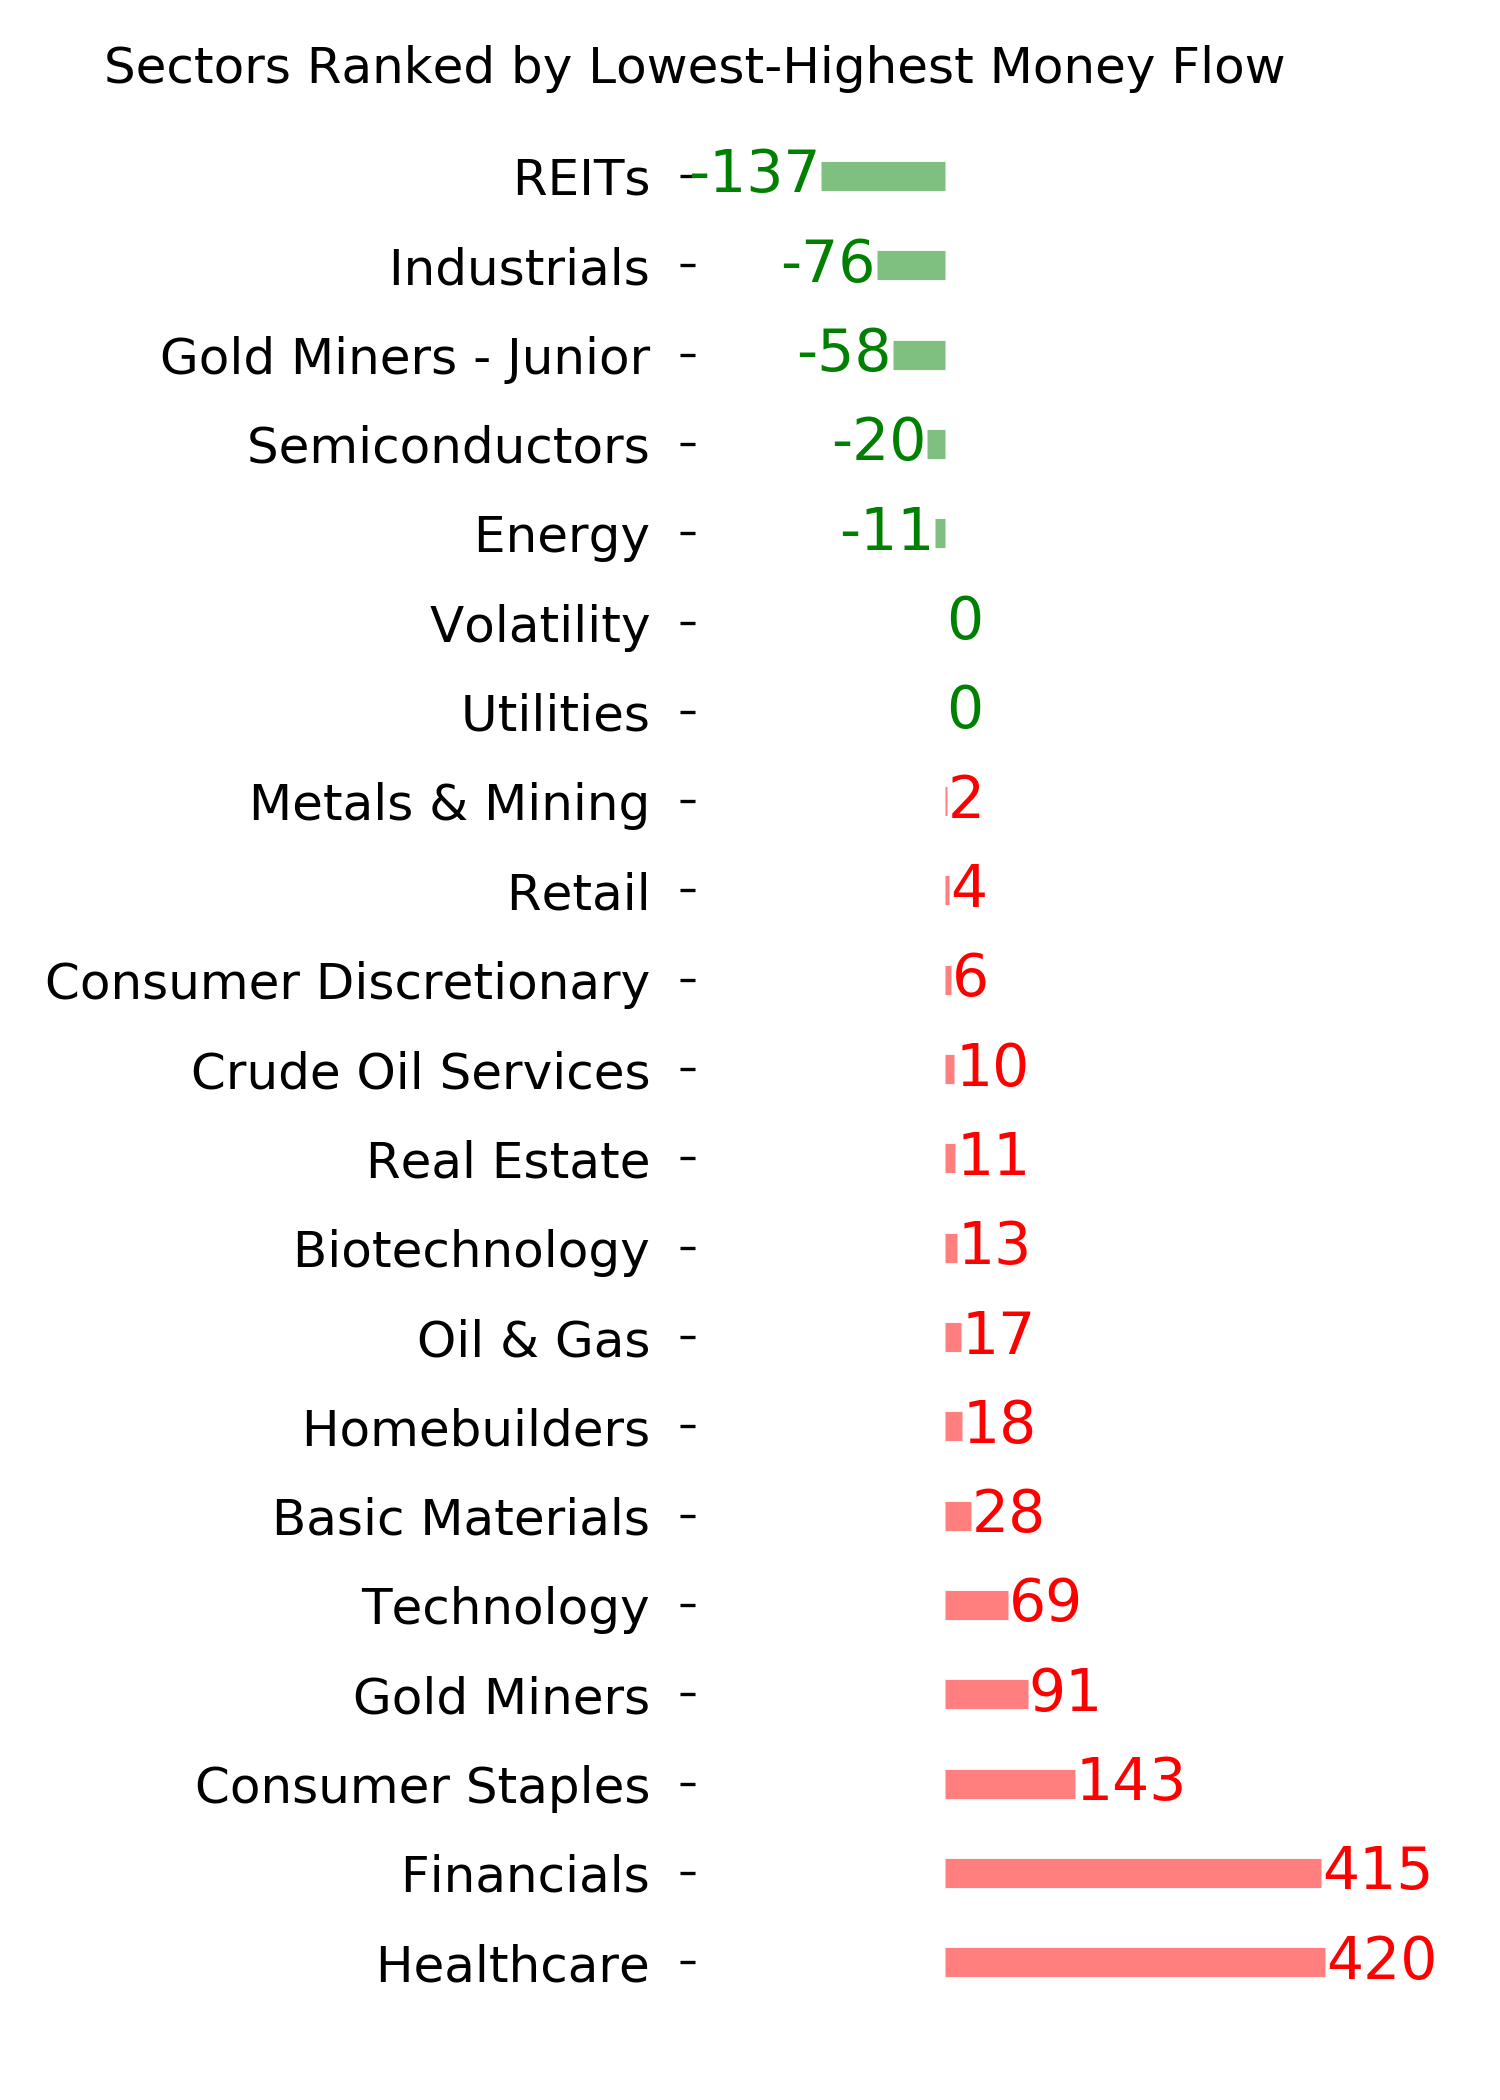
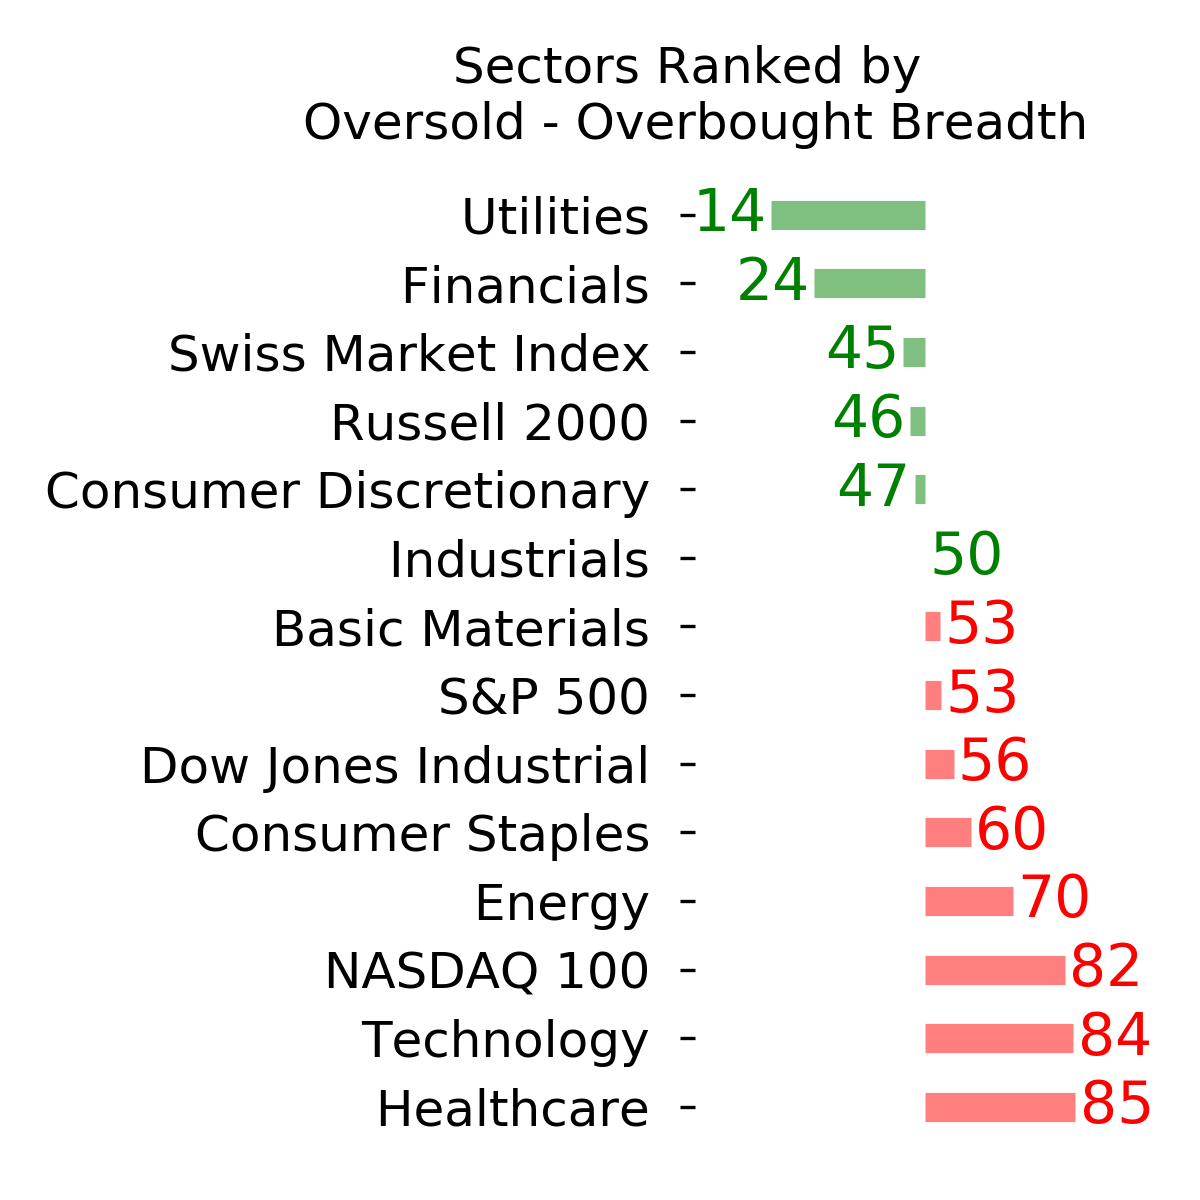
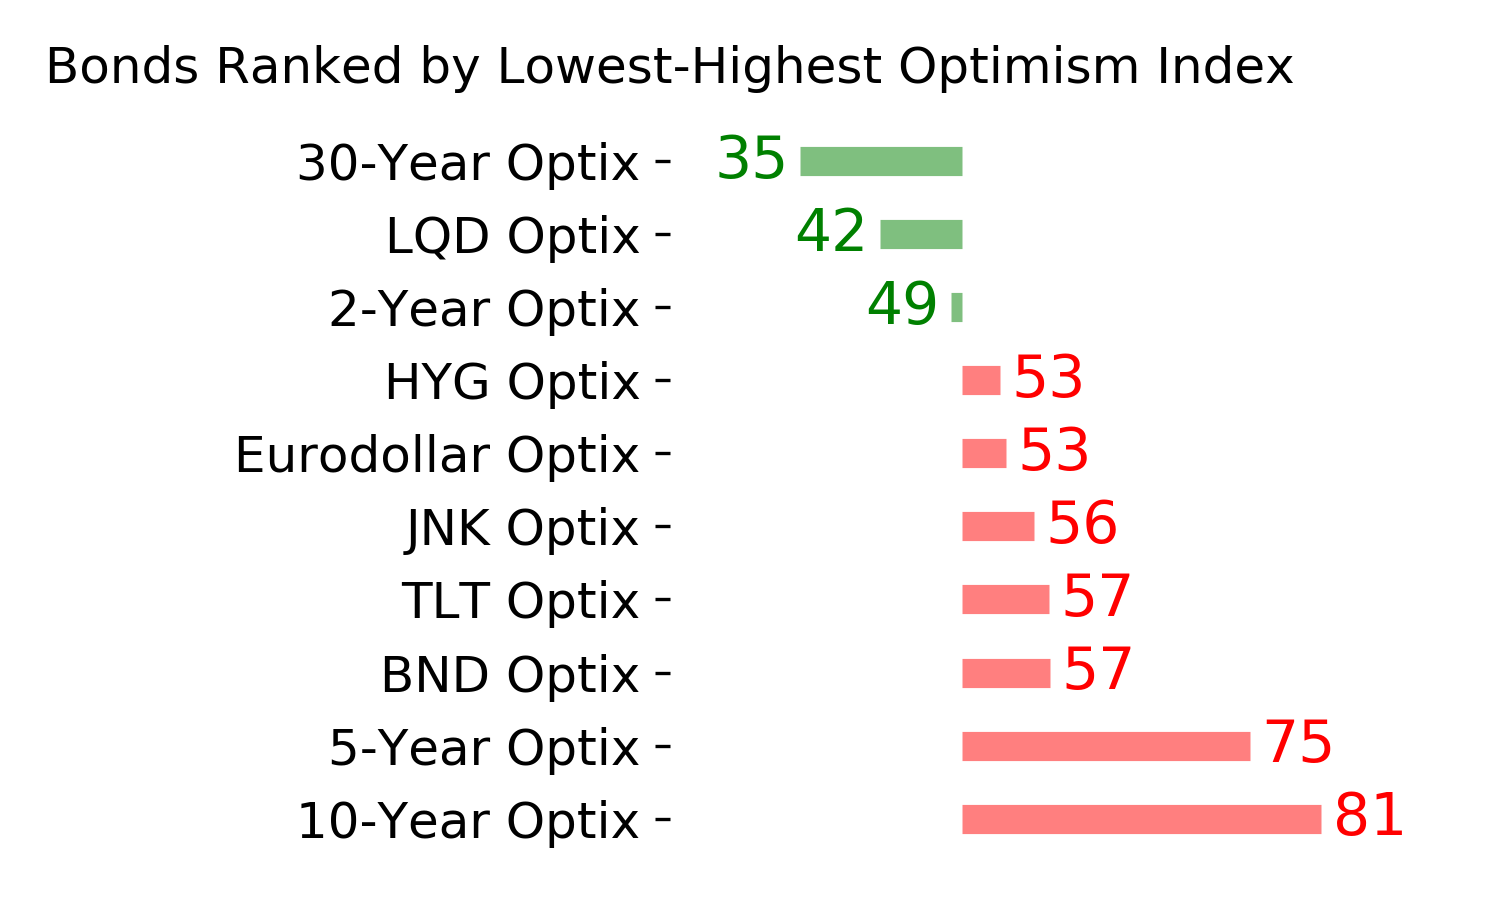
Ranks
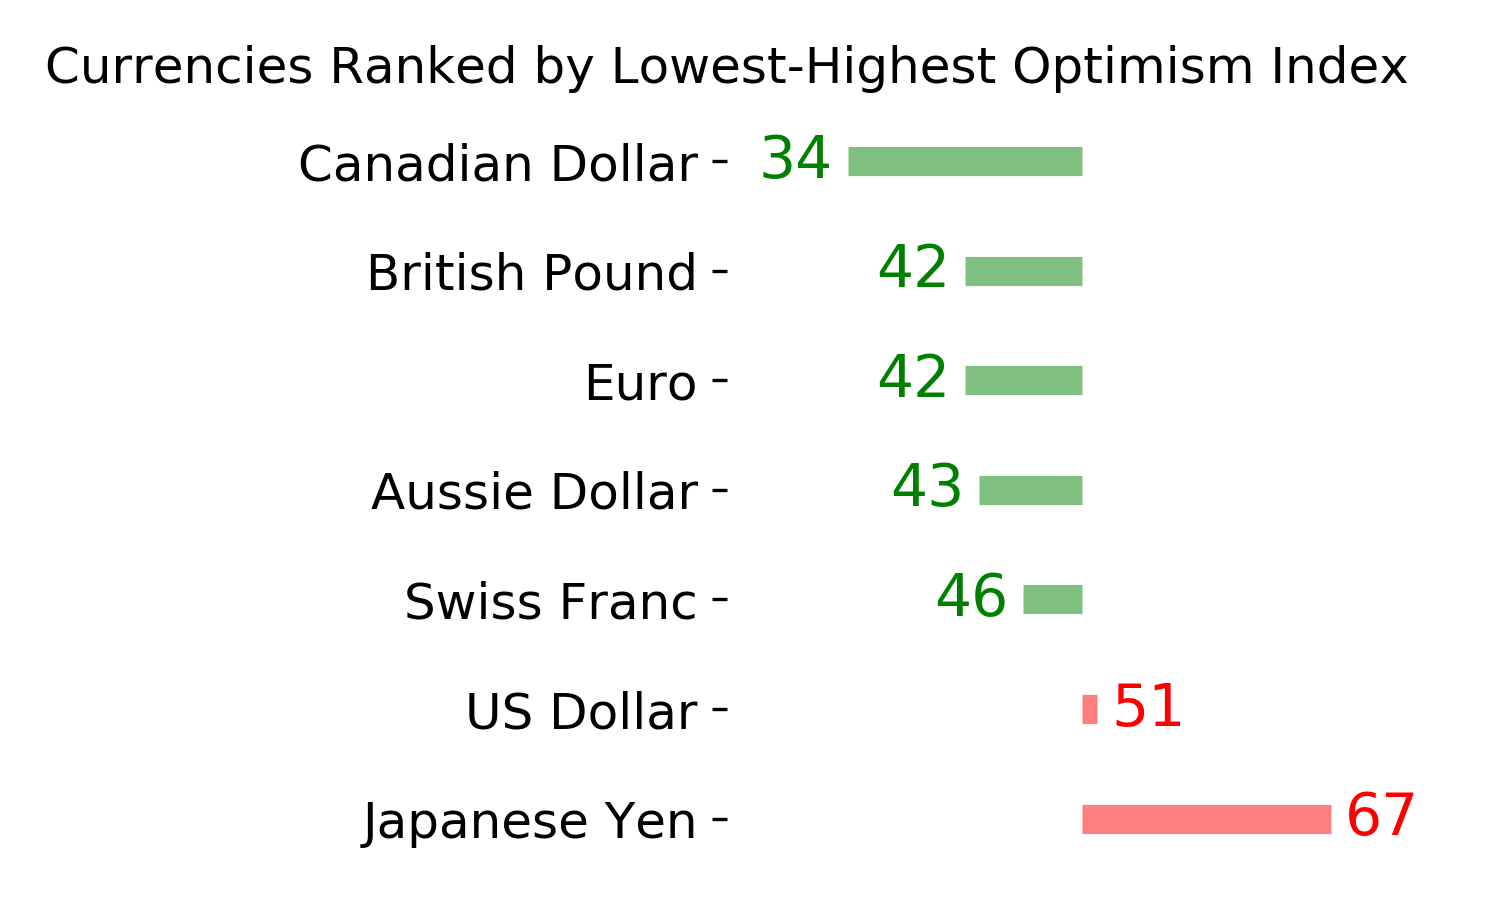
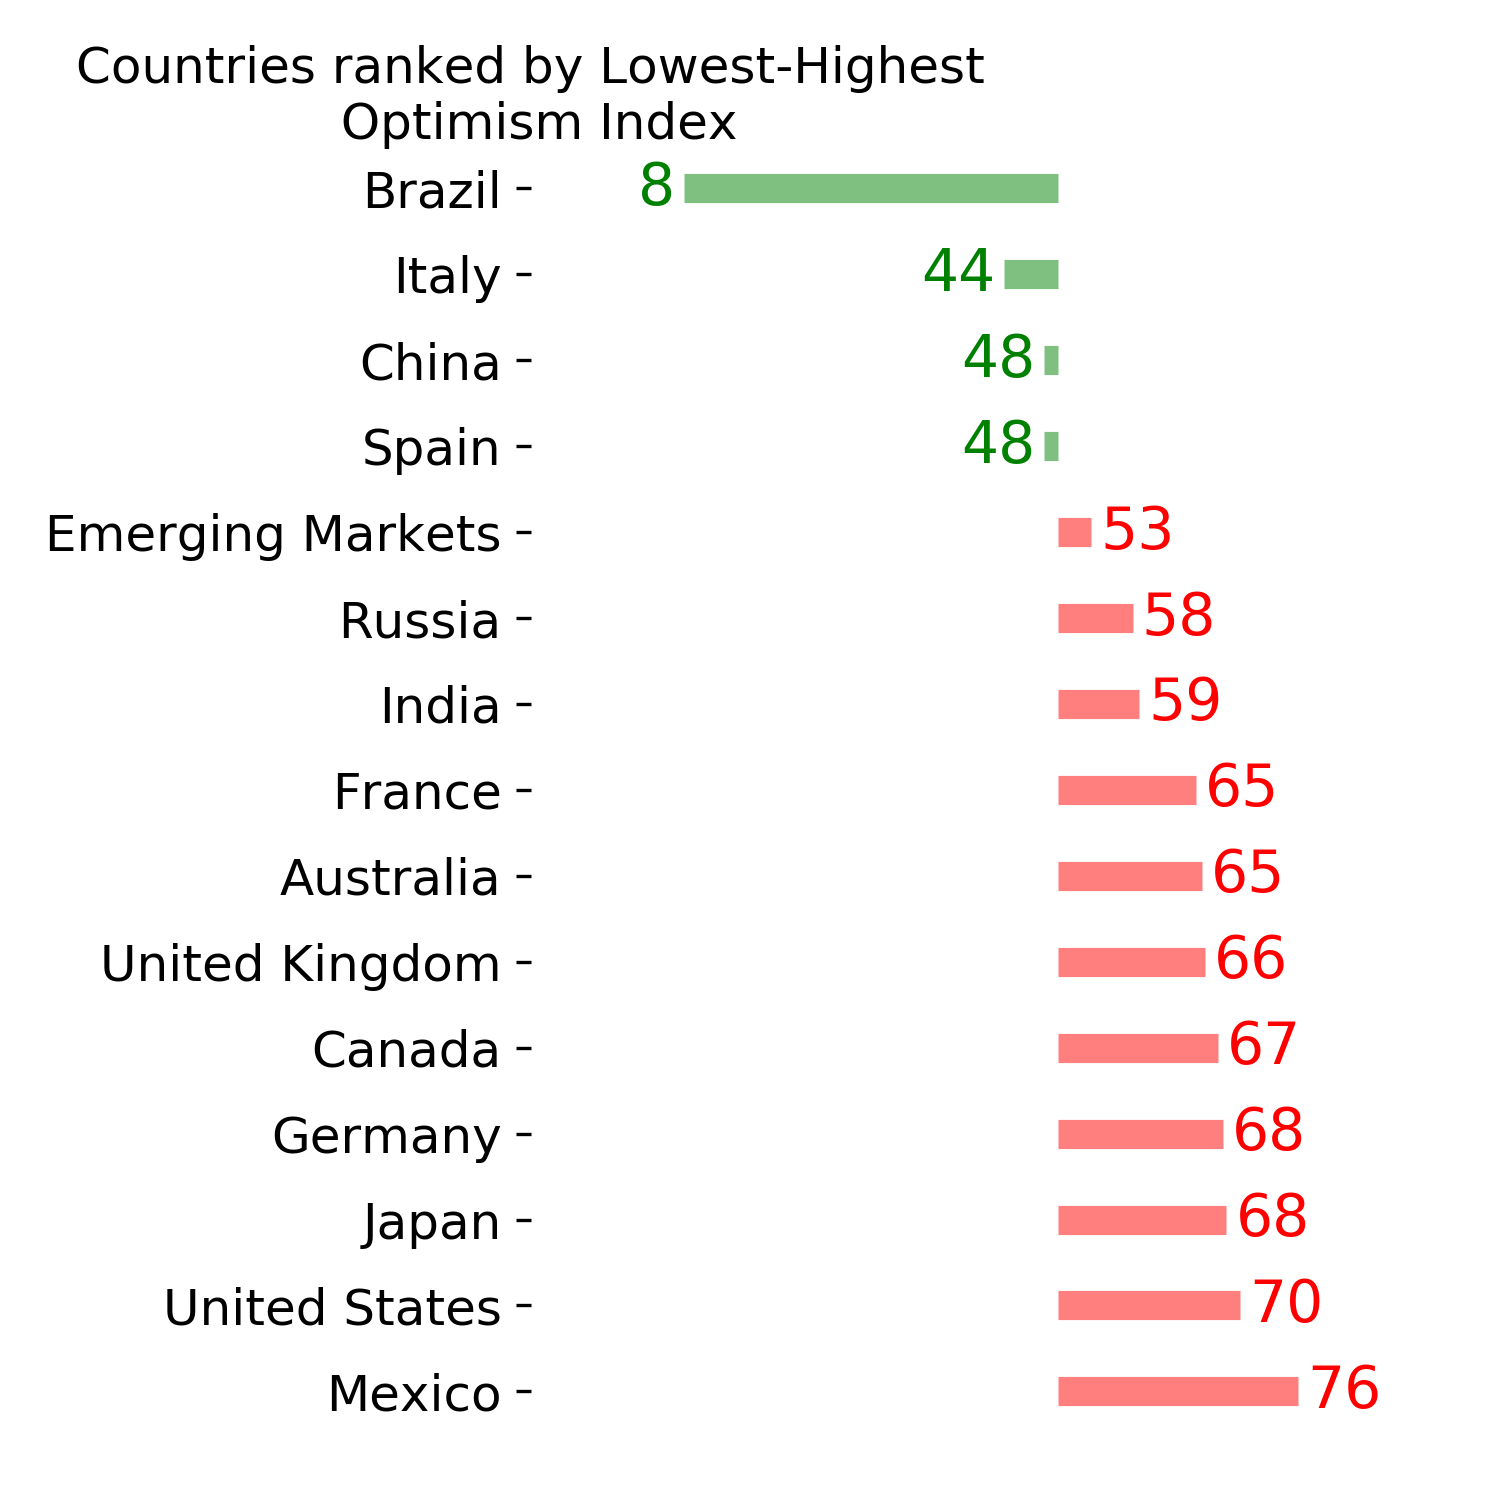
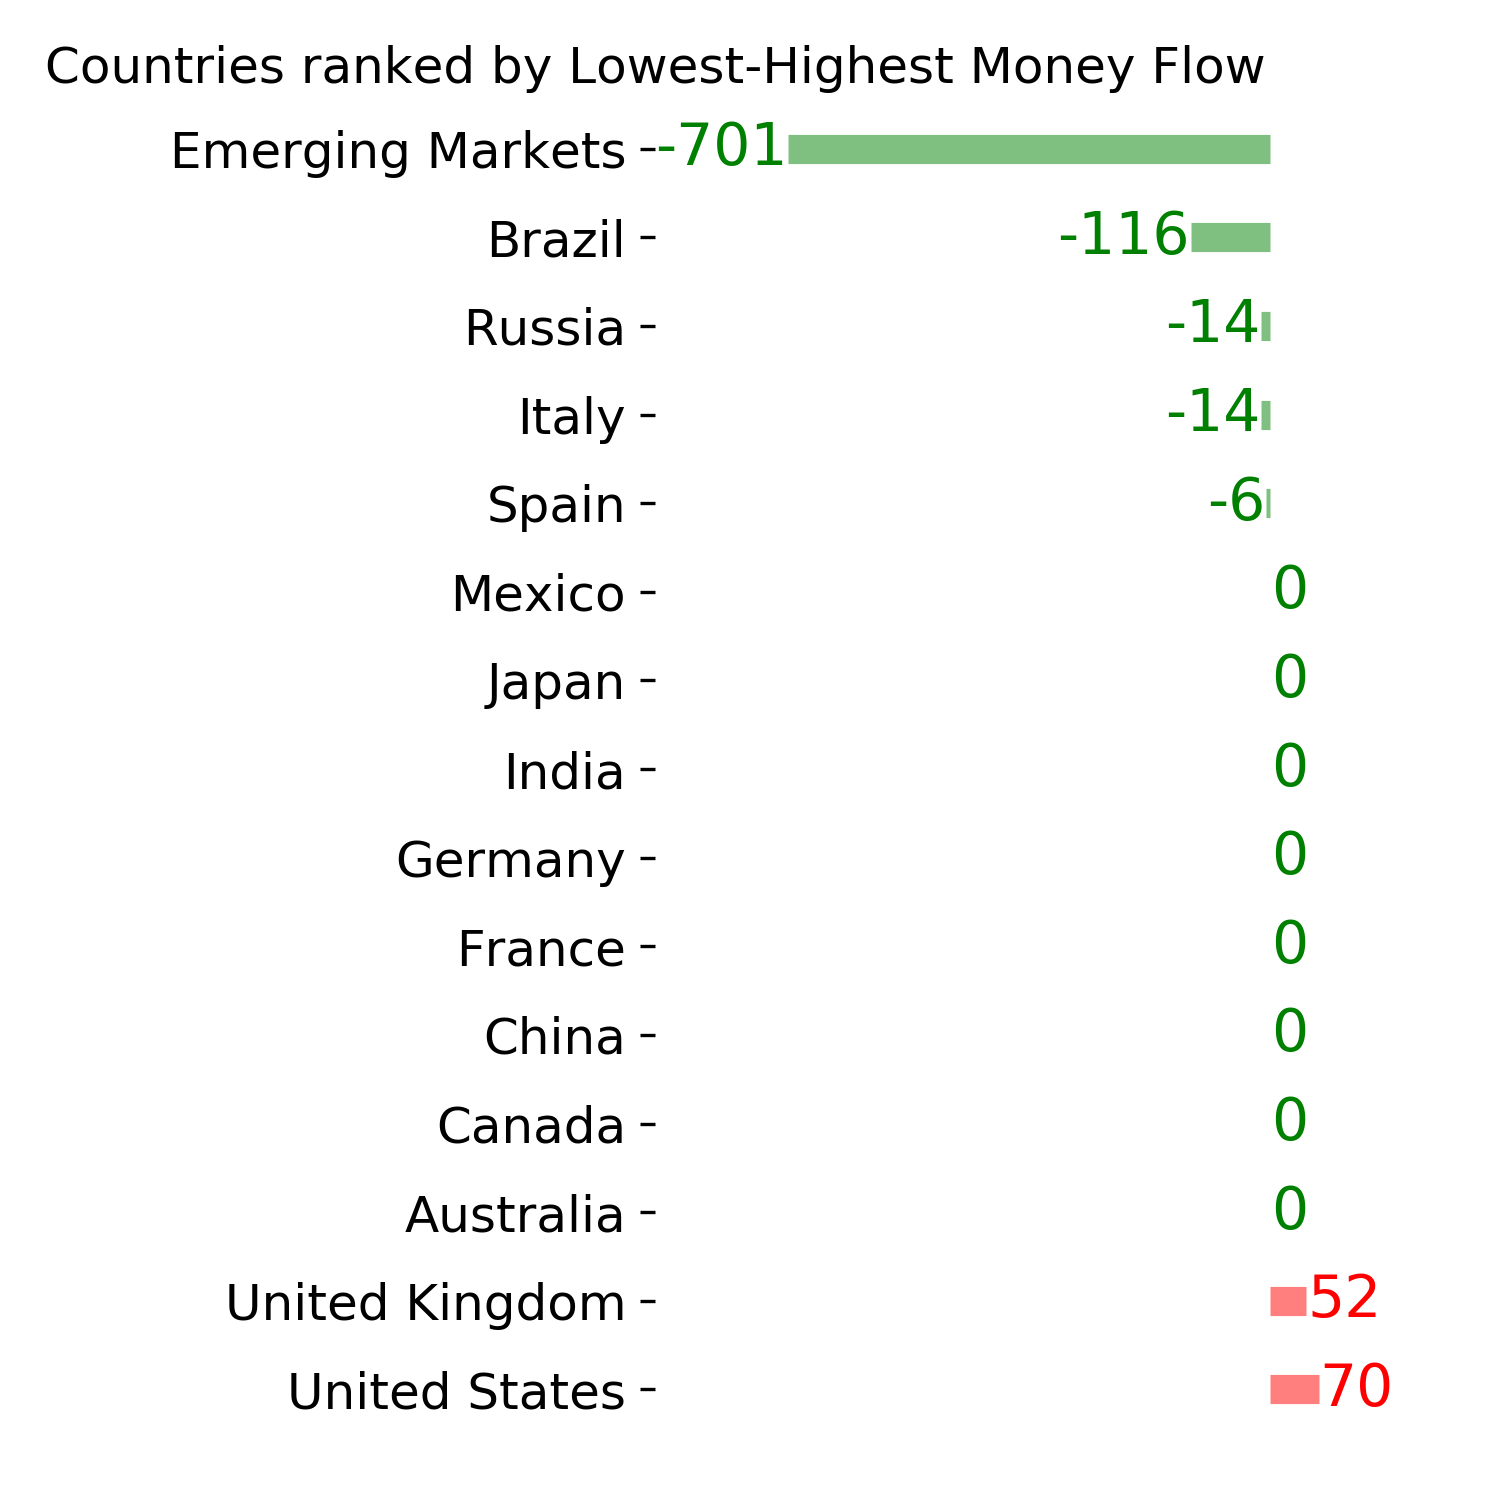
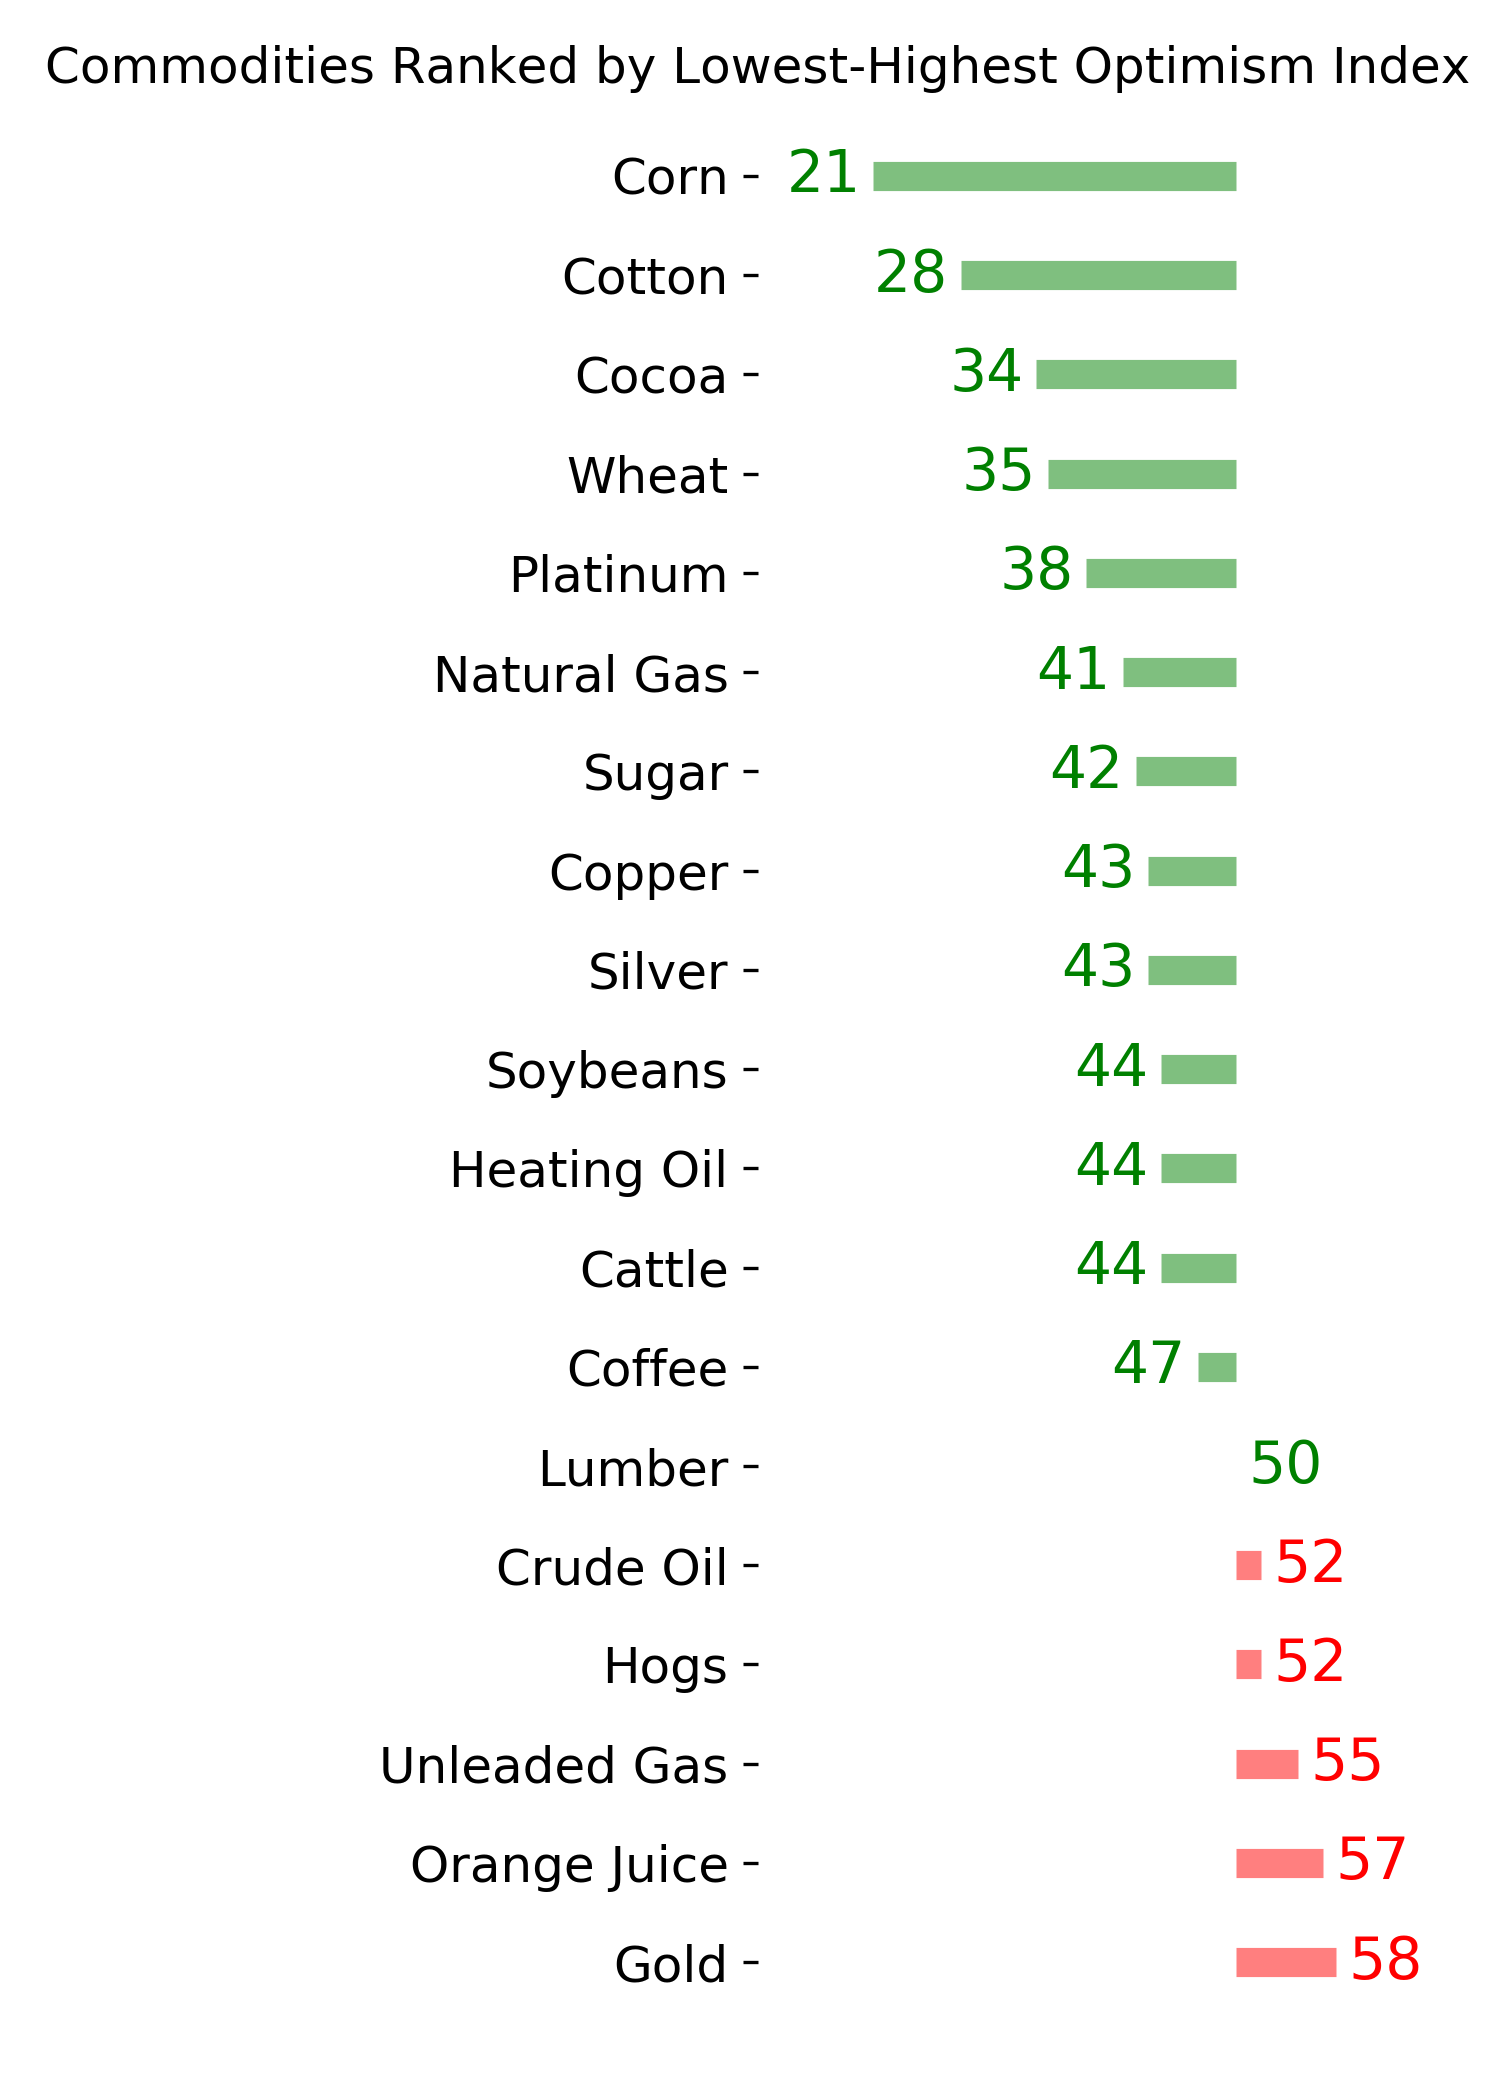
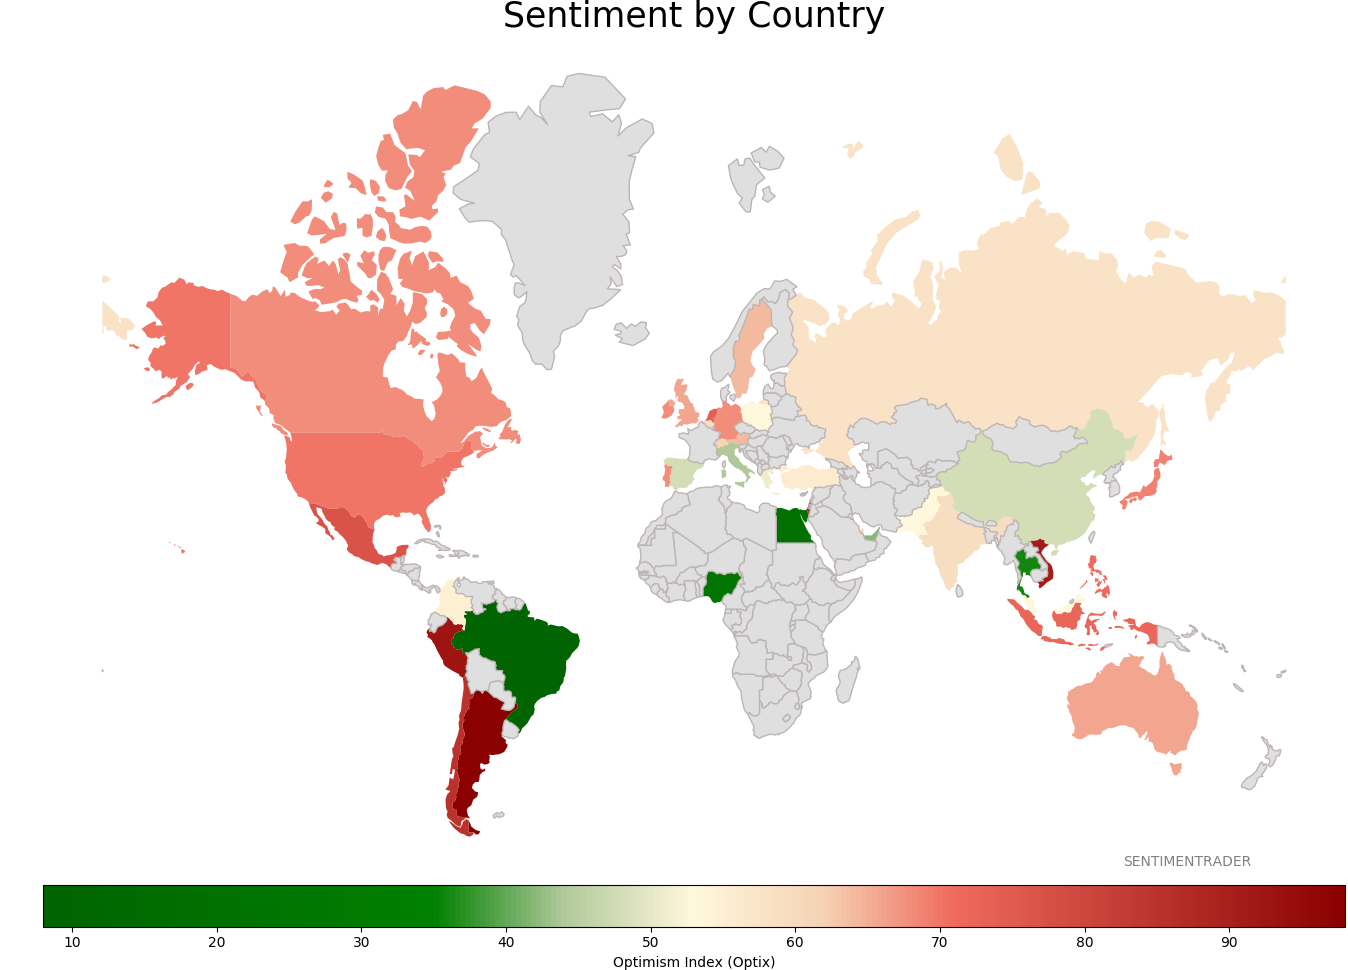
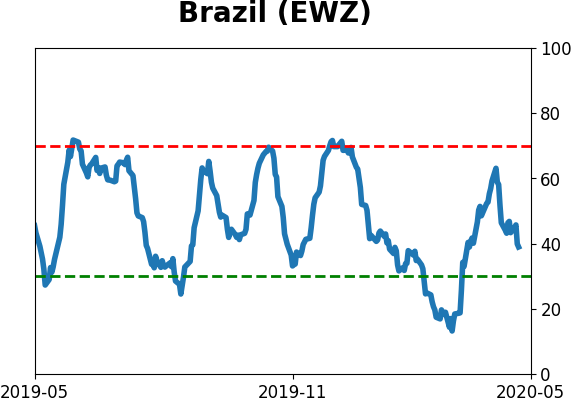
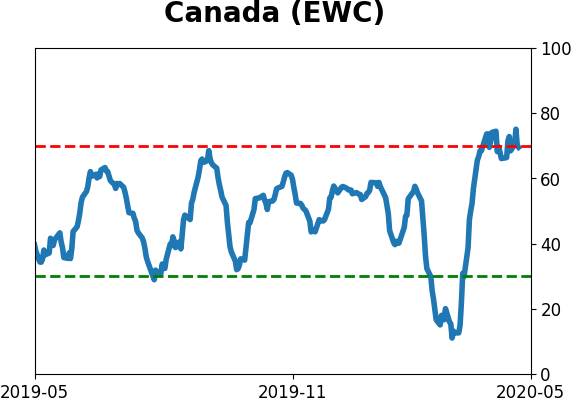
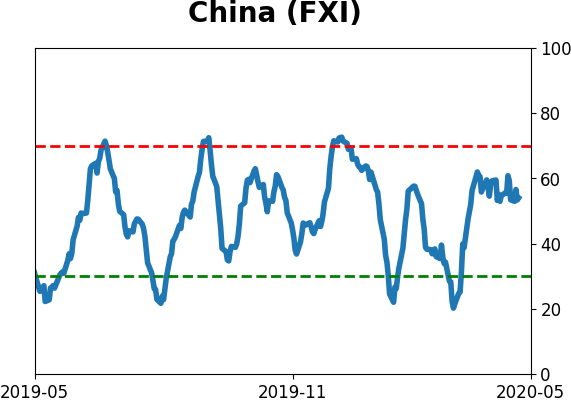
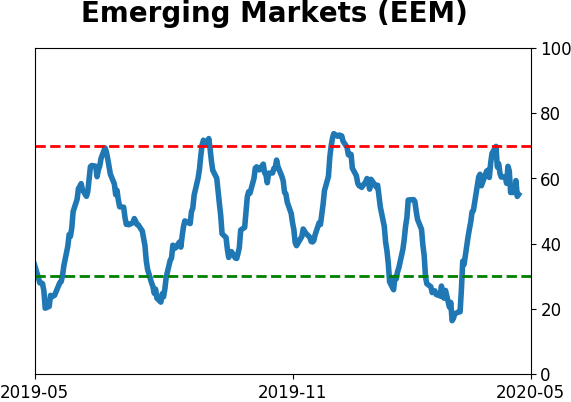
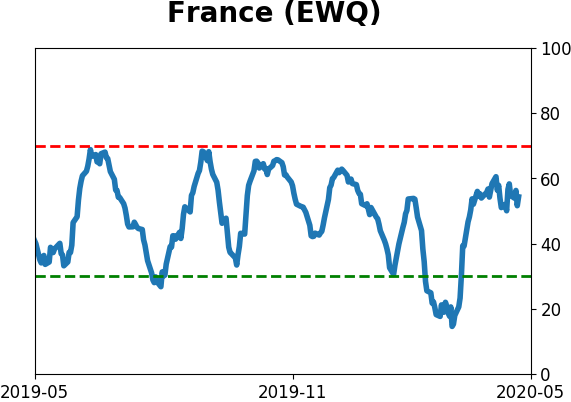
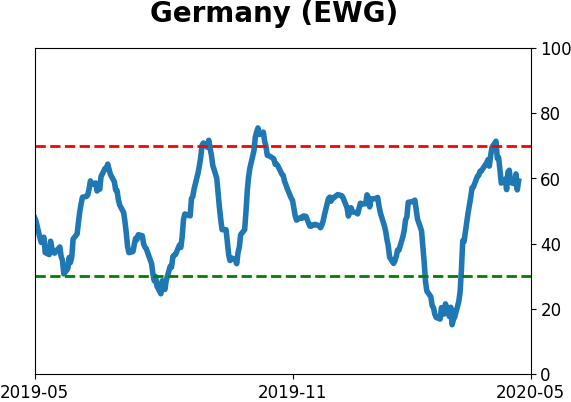
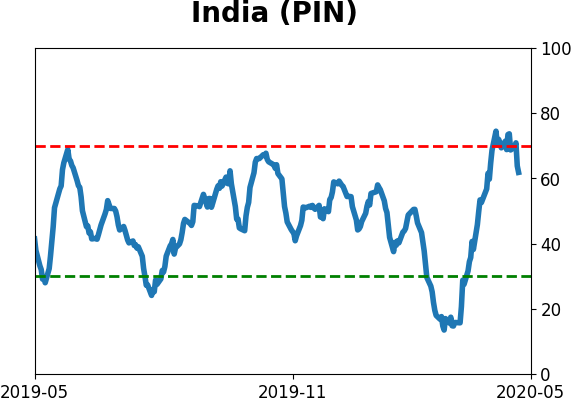
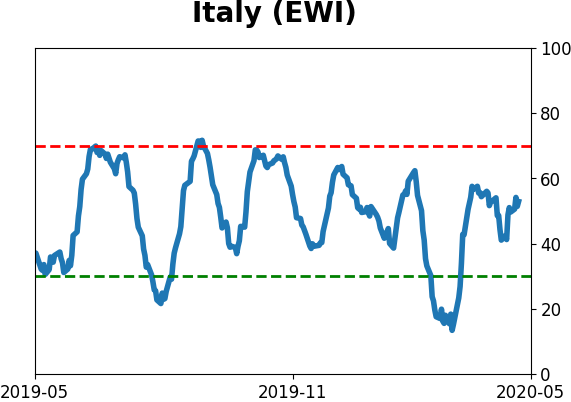
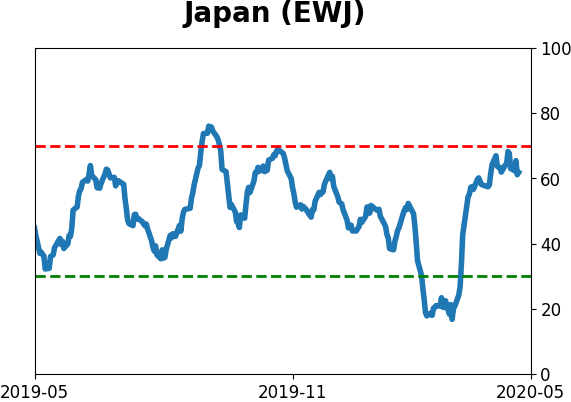
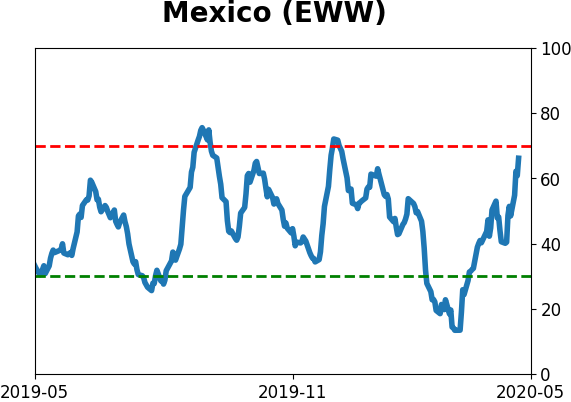
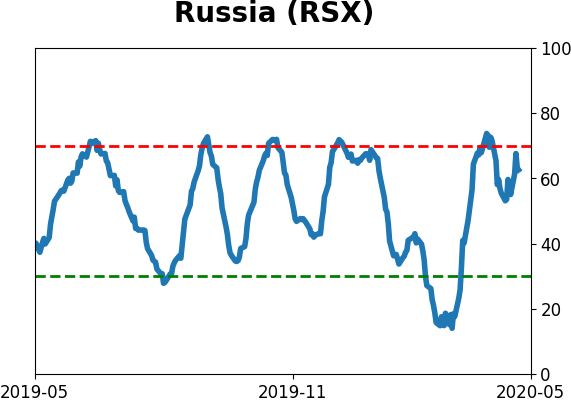
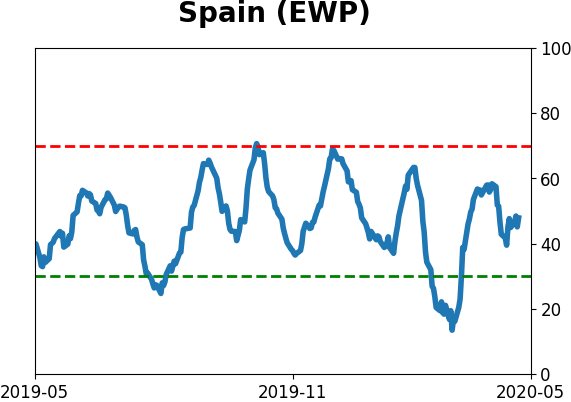
Sentiment Around The World
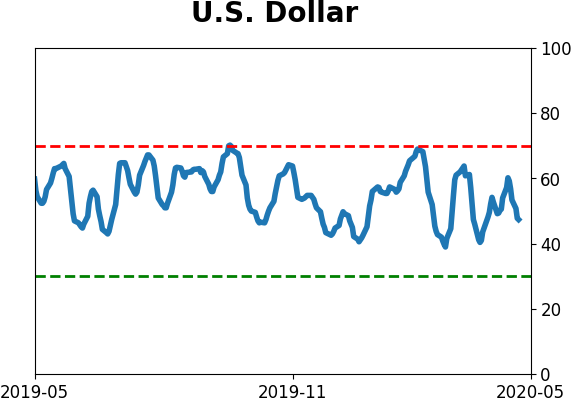
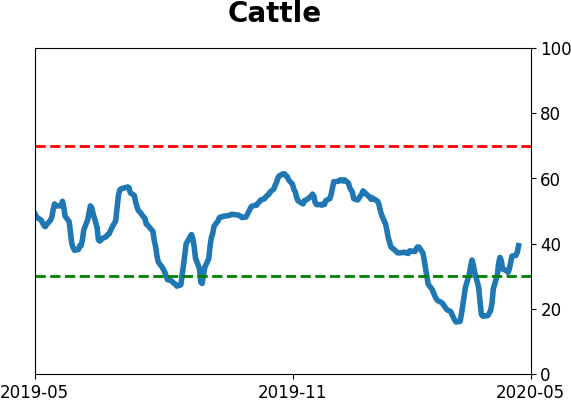
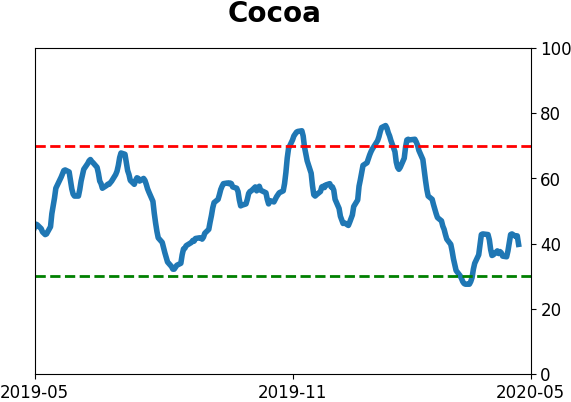
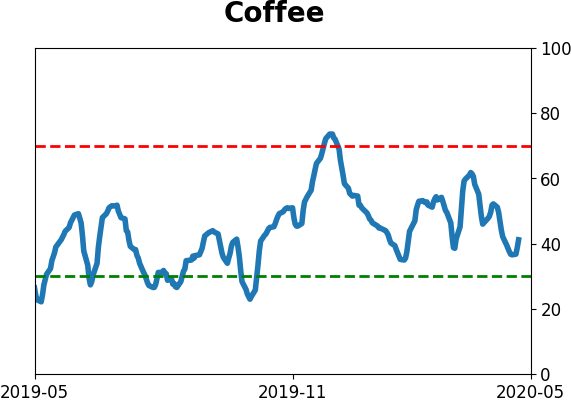
Optimism Index Thumbnails
|
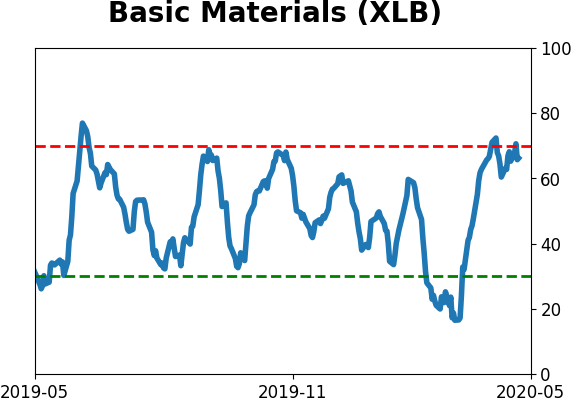
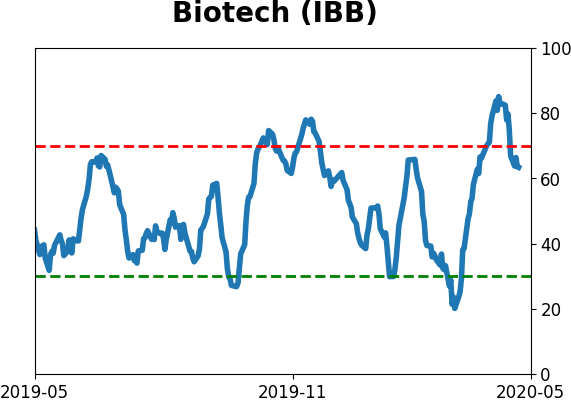
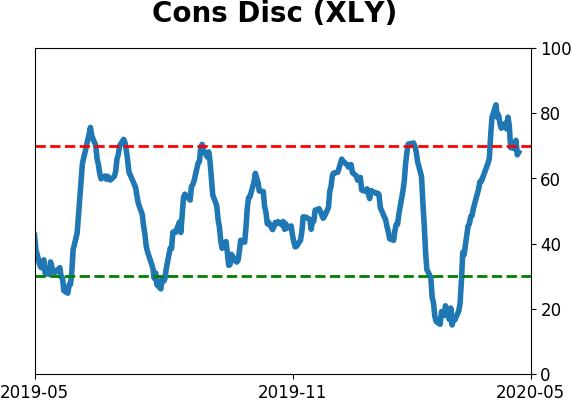
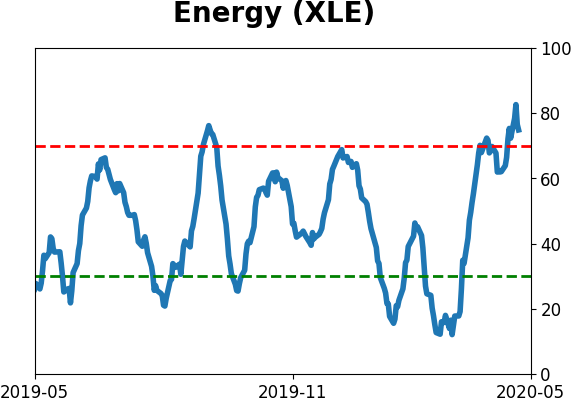
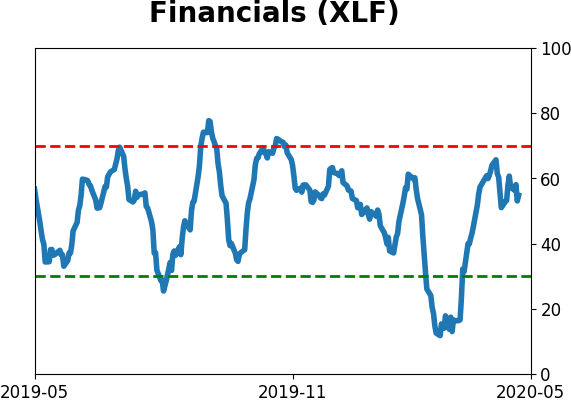
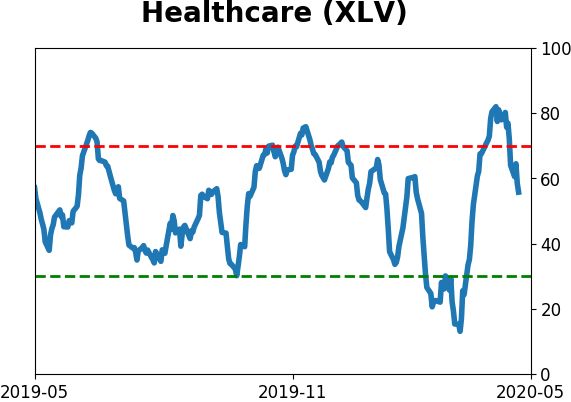
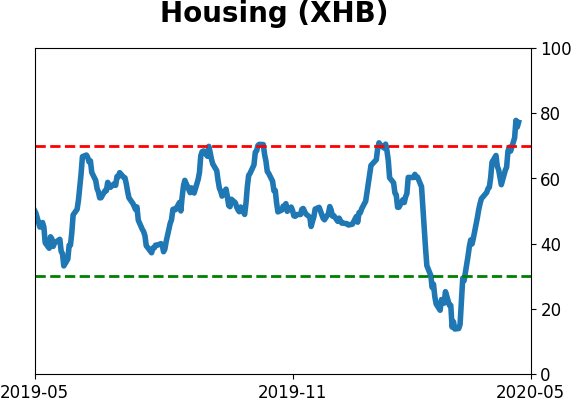
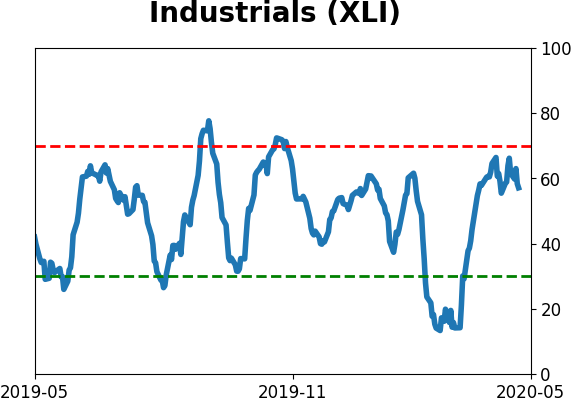
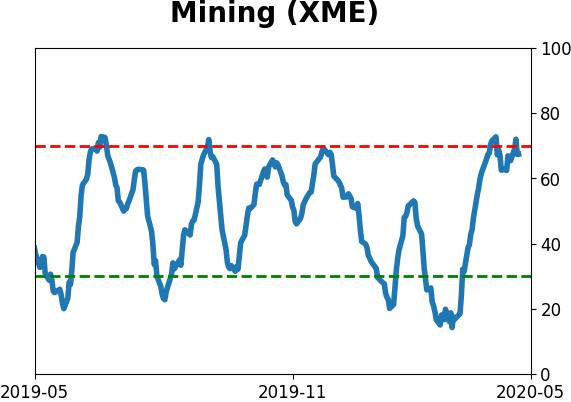
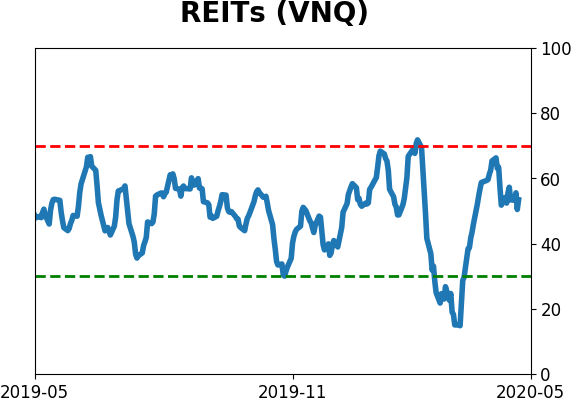
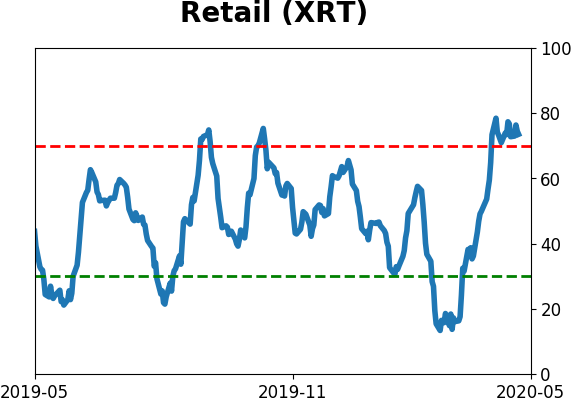
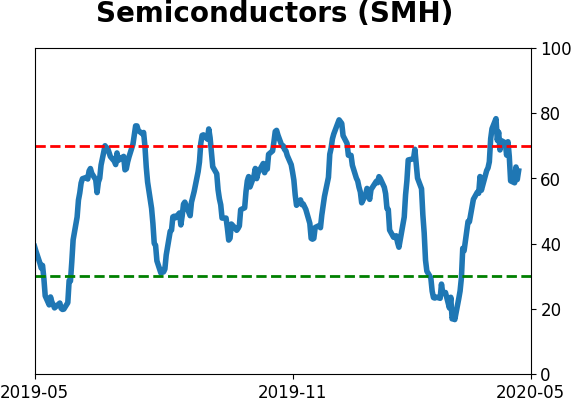
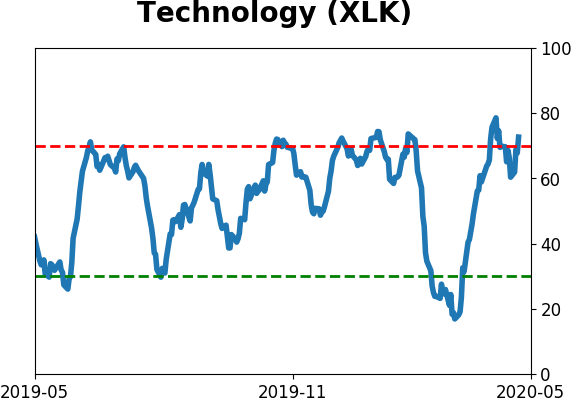
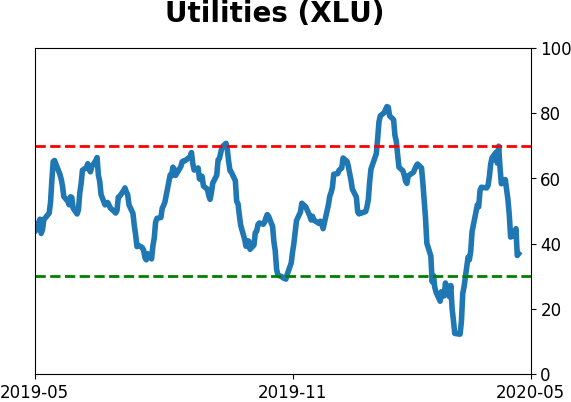
Sector ETF's - 10-Day Moving Average
|
|
|
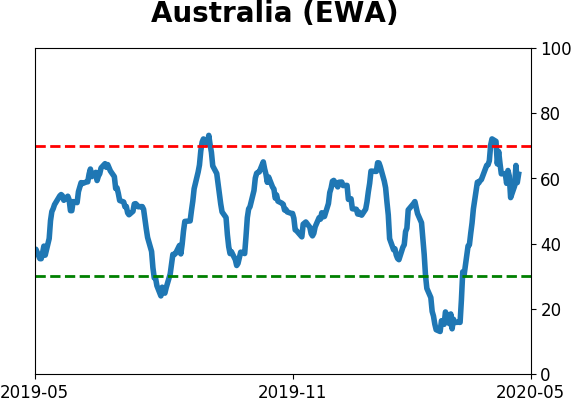
Country ETF's - 10-Day Moving Average
|
|
|
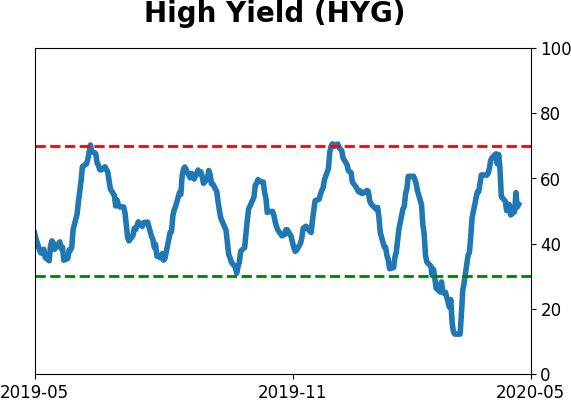
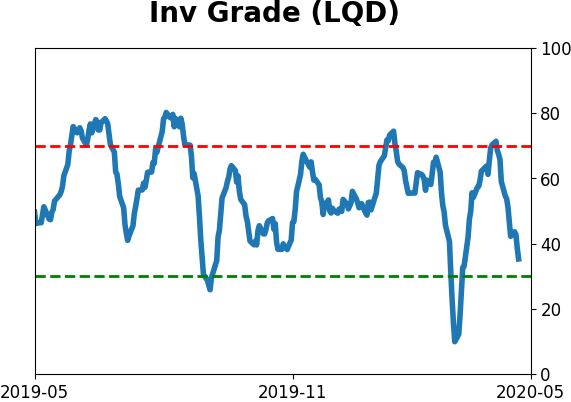
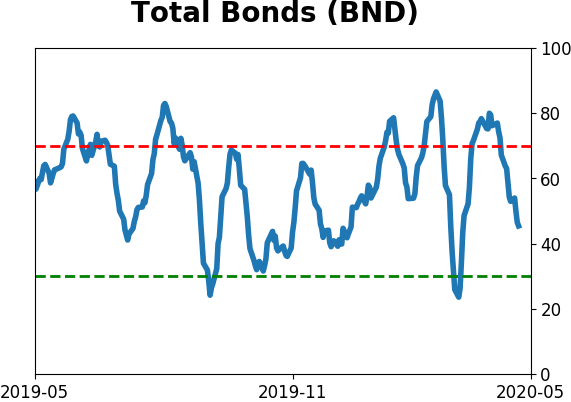
Bond ETF's - 10-Day Moving Average
|
|
|
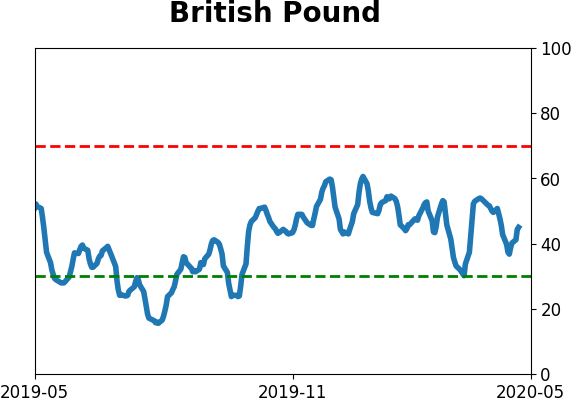
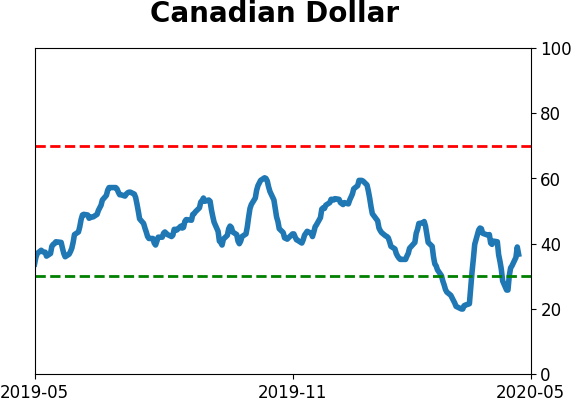
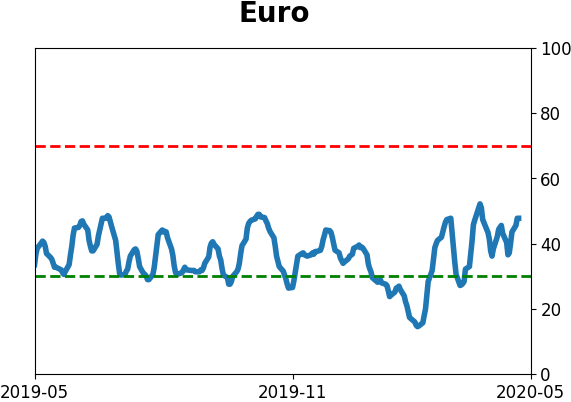
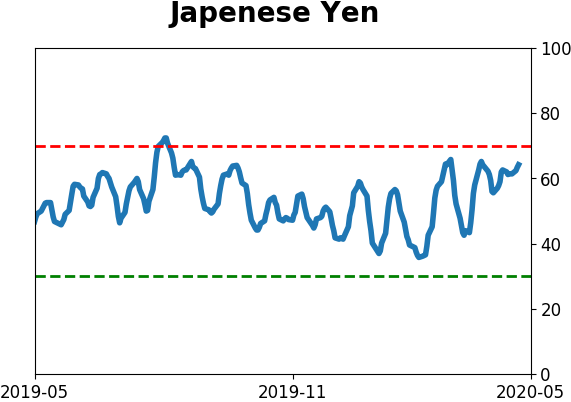
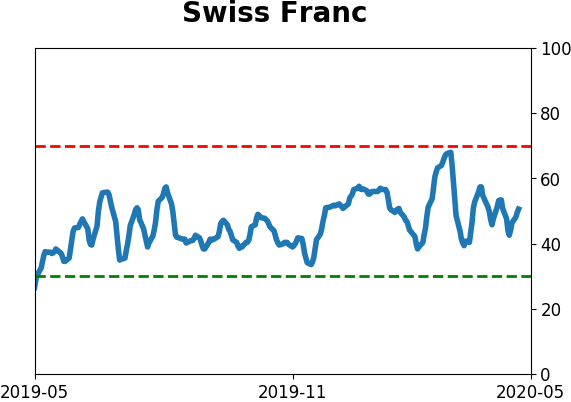
Currency ETF's - 5-Day Moving Average
|
|
|
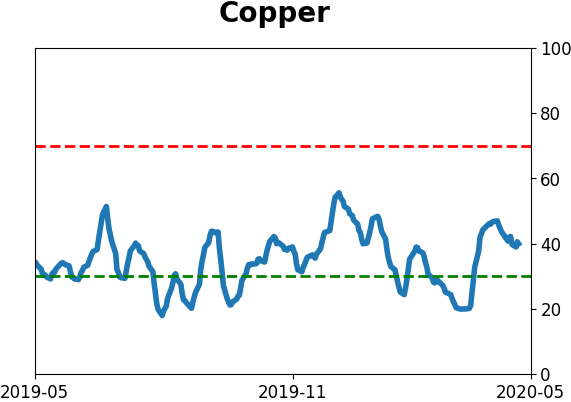
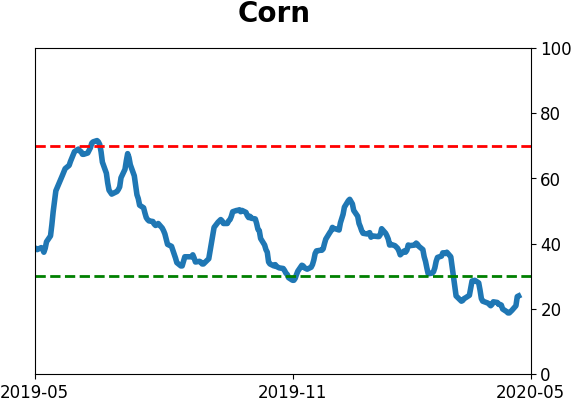
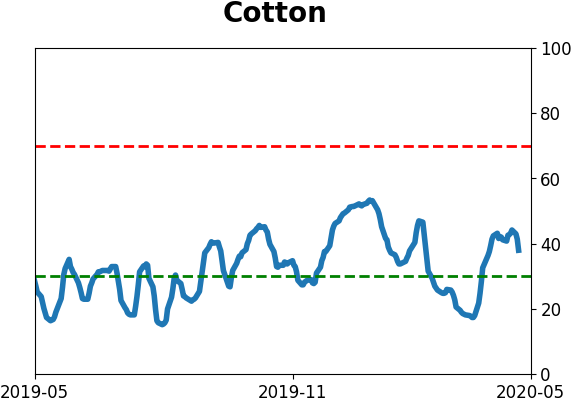
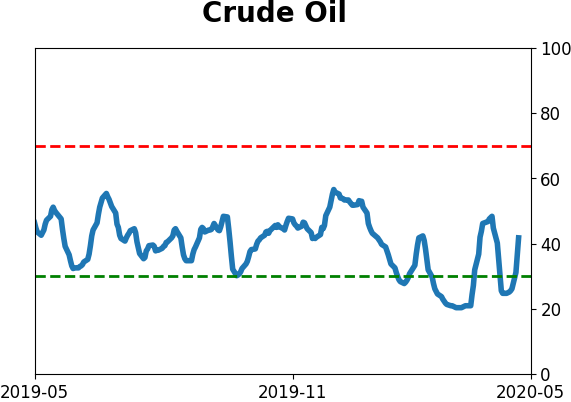
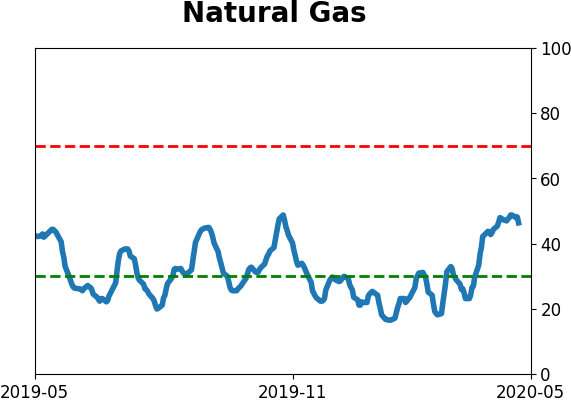
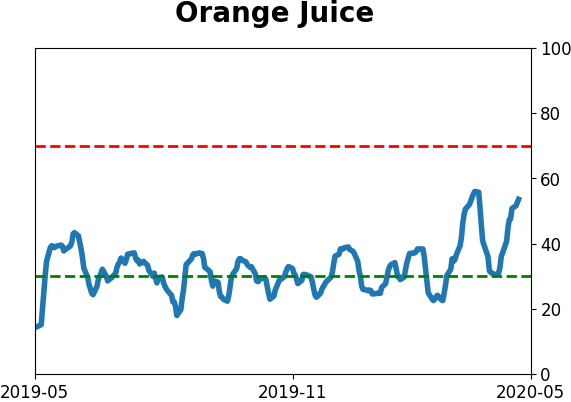
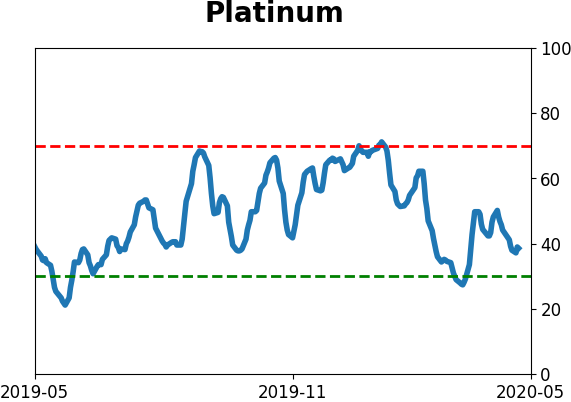
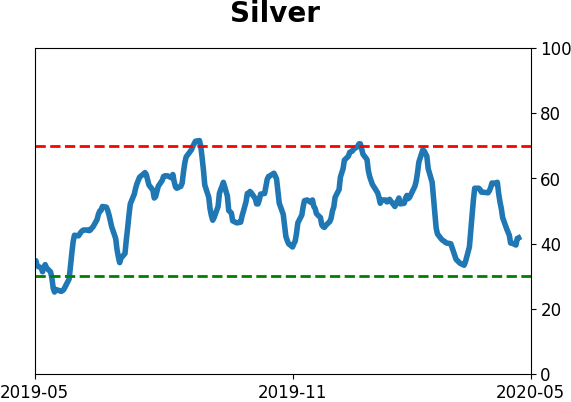
Commodity ETF's - 5-Day Moving Average
|
|