Headlines
|
|
Commodity Bulls Hope for a 1973 Repeat:
So far in 2021, commodities have been on a tear. Going back to 1933, there have been 9 other years that had a high 4-month correlation to the start of the year. Most of them saw a multi-month pause, with one major exception.
Hindenburg sighted: On April 20, the Nasdaq triggered a Titanic Syndrome technical warning sign. Further deterioration triggered a Hindenburg Omen on Thursday, the first since February 10, 2020. During the last decade of a massive bull market, there have been 45 of these signals. The Backtest Engine shows that the Nasdaq 100 was higher a month later after only 14 of them (a 31% win rate), averaging -2.3%. These types of warnings tend to be more consistent when we see a cluster of them, especially on both the NYSE and Nasdaq. So far, there have been only isolated signals and only on the Nasdaq.
Bottom Line:
See the Outlook & Allocations page for more details on these summaries STOCKS: Weak sell
The extreme speculation registered in January and February is starting to get wrung out. Internal dynamics have mostly held up, so a return to neutral sentiment conditions would improve the forward risk/reward profile substantially. We're still a ways off from that. BONDS: Weak buy
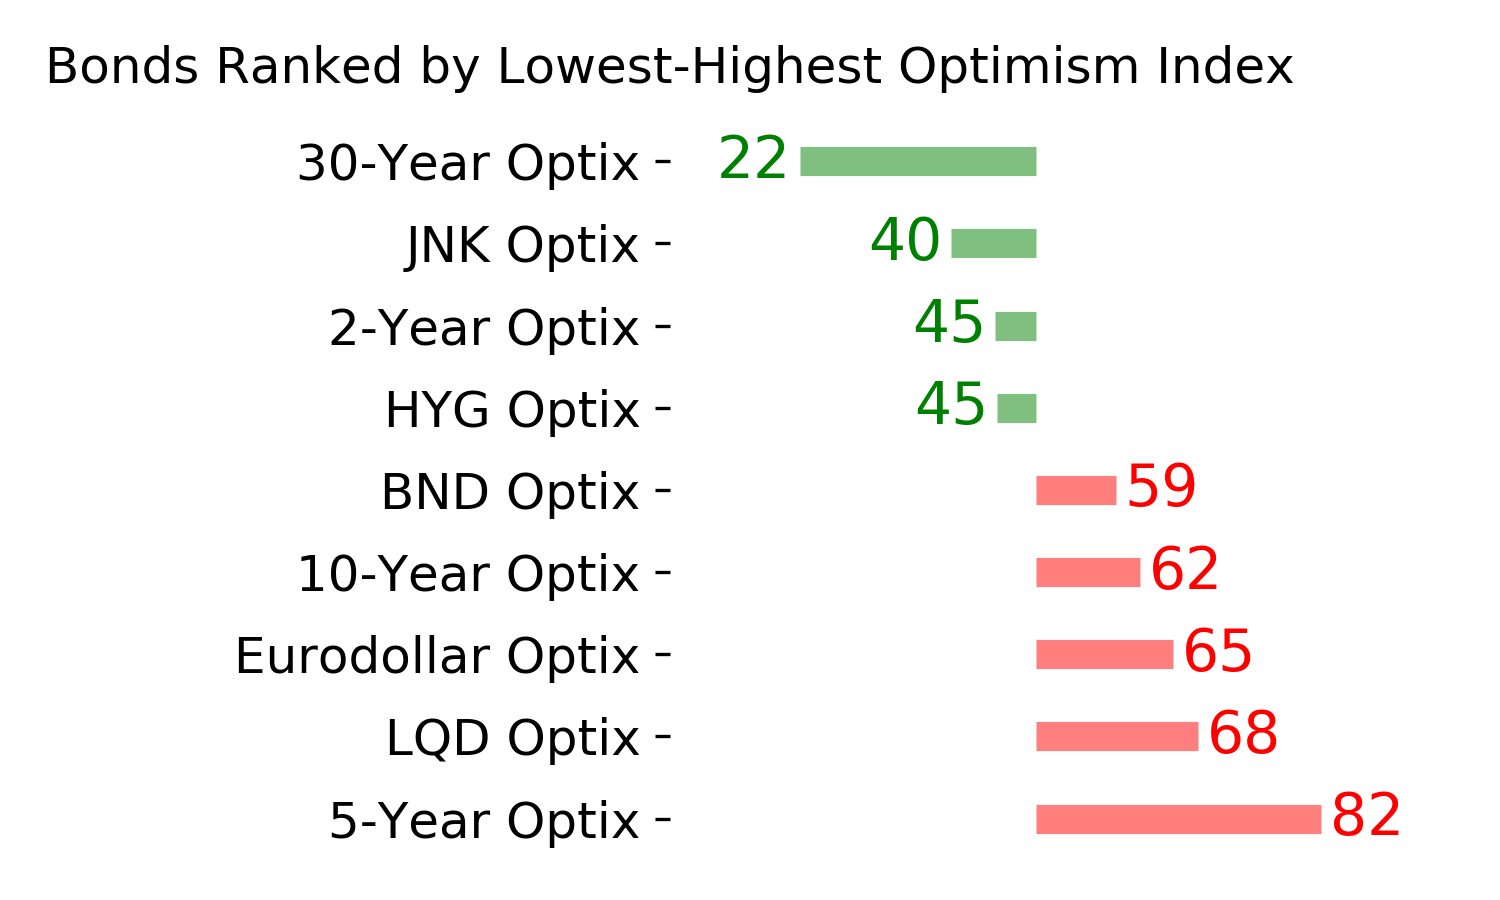
Various parts of the market have been hit in recent weeks, with mild oversold conditions. The Bond Optimism Index is now about as low as it gets during healthy bond market environments. Fixed income isn't responding well, so that needs to be monitored in case it's transitioning to a longer-term negative market environment. GOLD: Weak buy
A dollar trying to rebound from a severe short position has weighed on gold and miners. The types of signals they've given in recent weeks, within the context of their recent surge, have usually resulted in higher prices over a medium- to long-term time frame. Like bonds, gold and miners aren't responding very well, and this needs to be monitored.
|
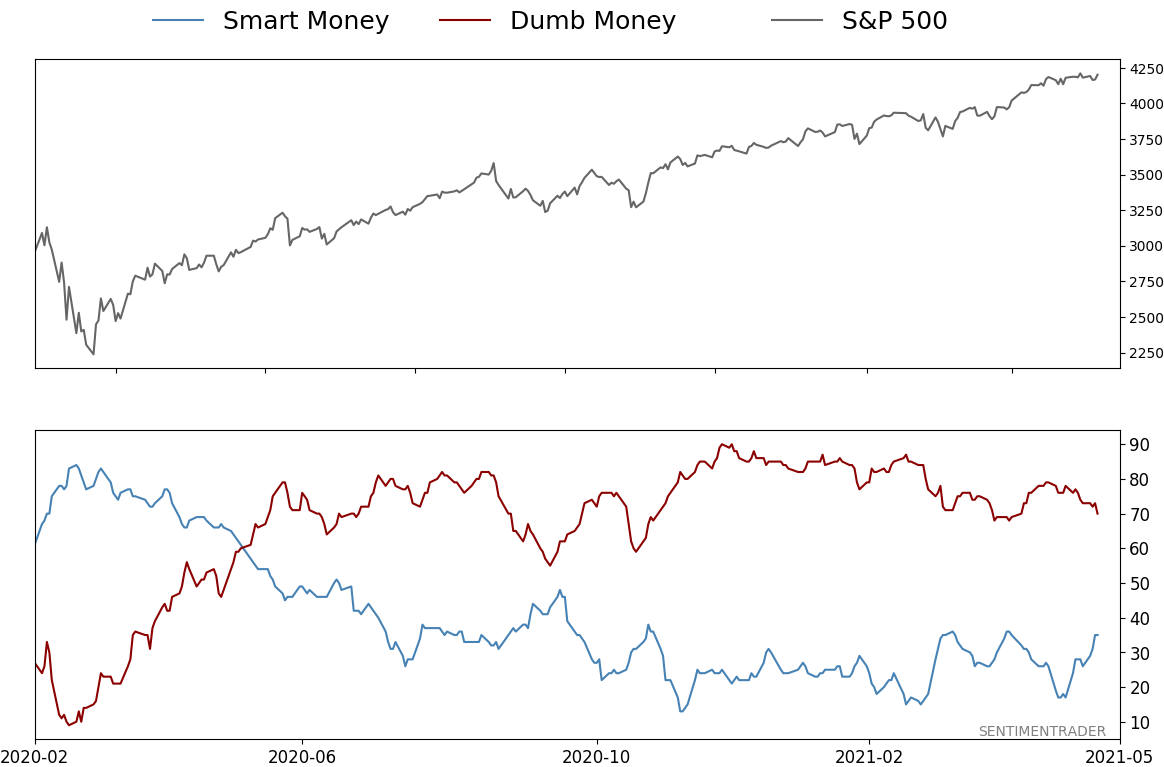
Smart / Dumb Money Confidence
|
Smart Money Confidence: 35%
Dumb Money Confidence: 70%
|
|
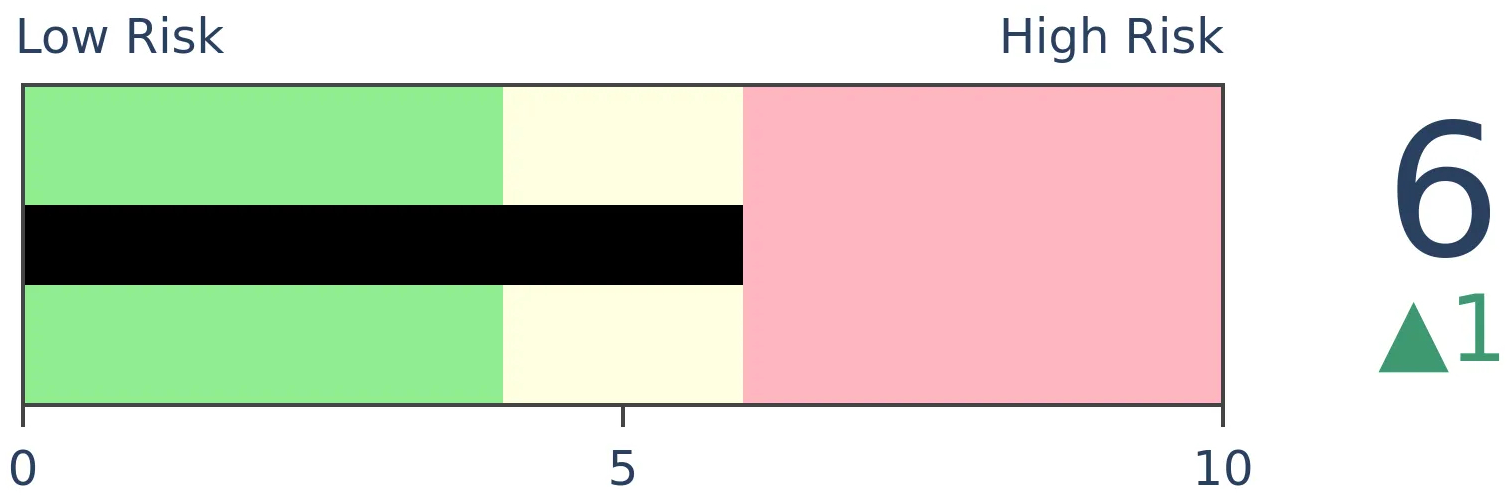
Risk Levels
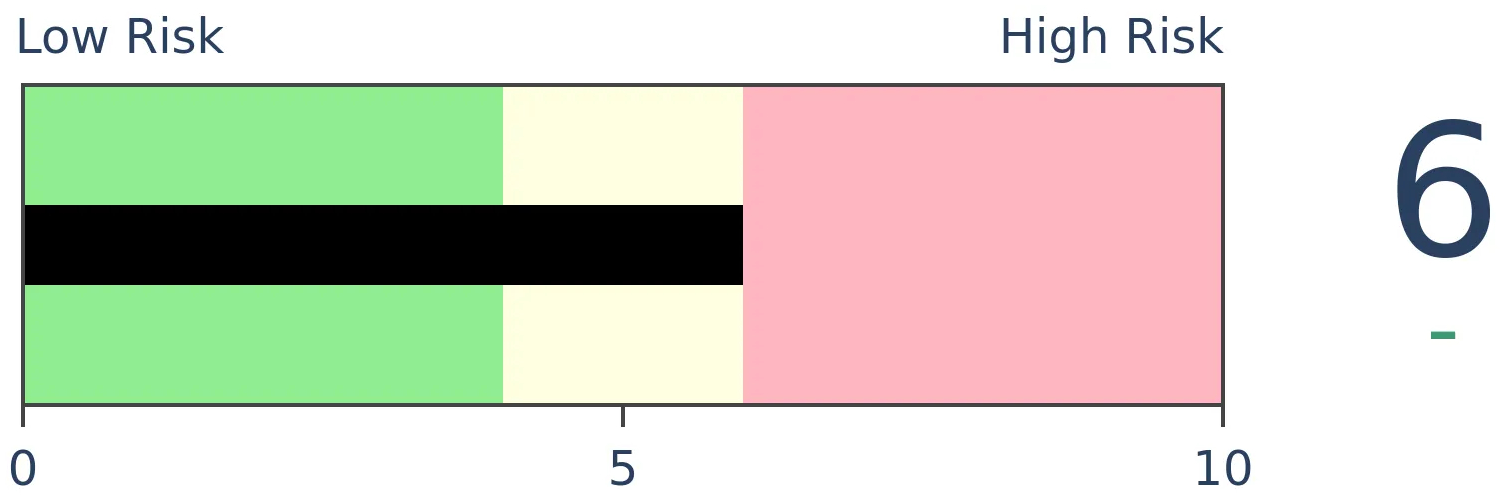
Stocks Short-Term
|
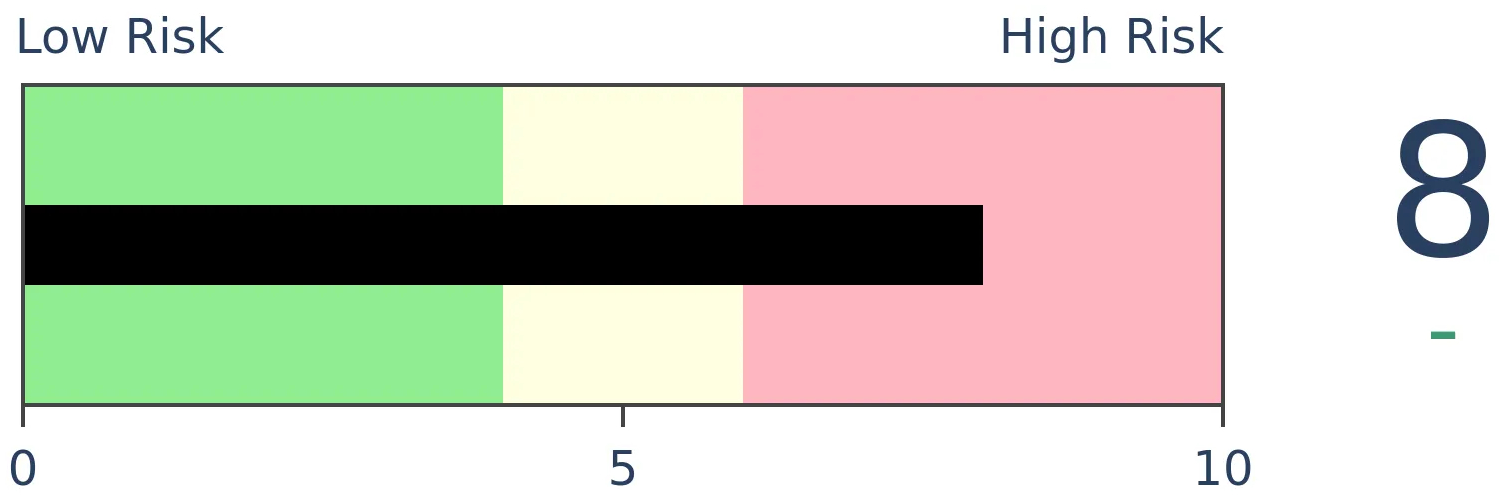
Stocks Medium-Term

|
|
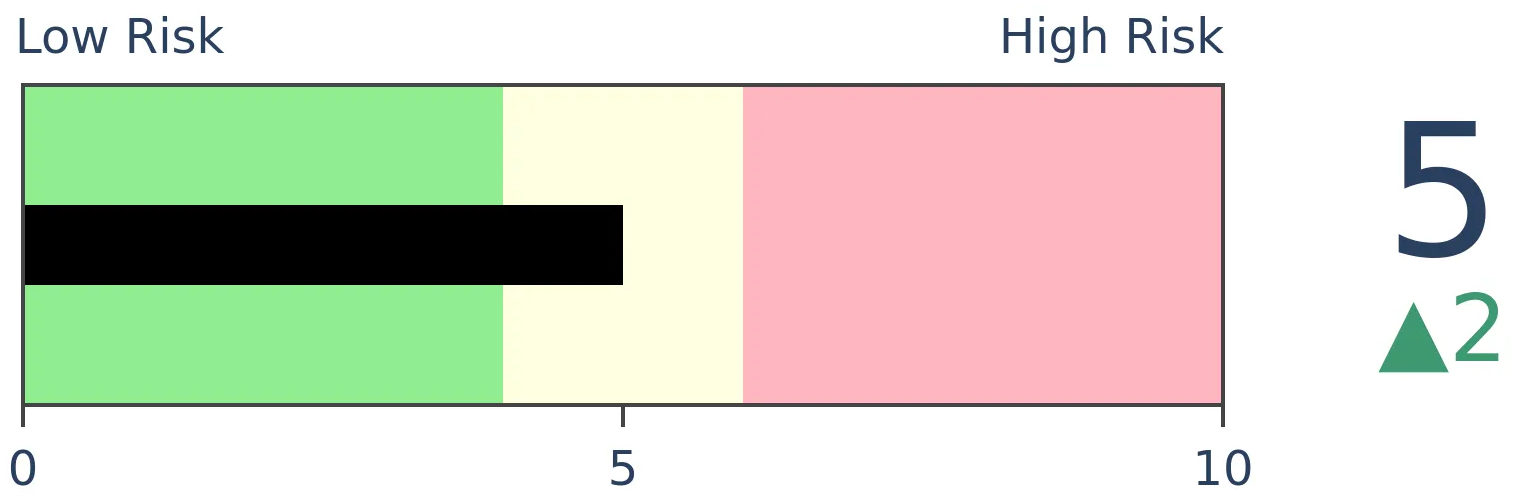
Bonds
|
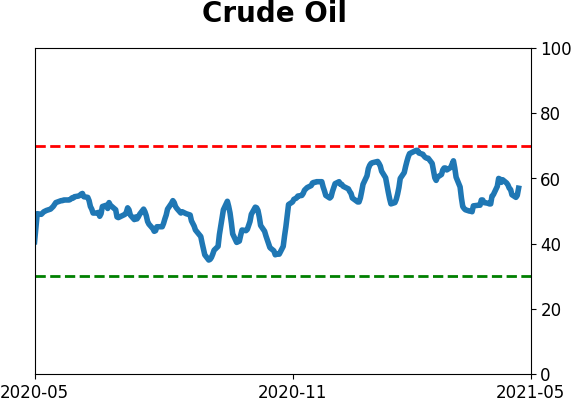
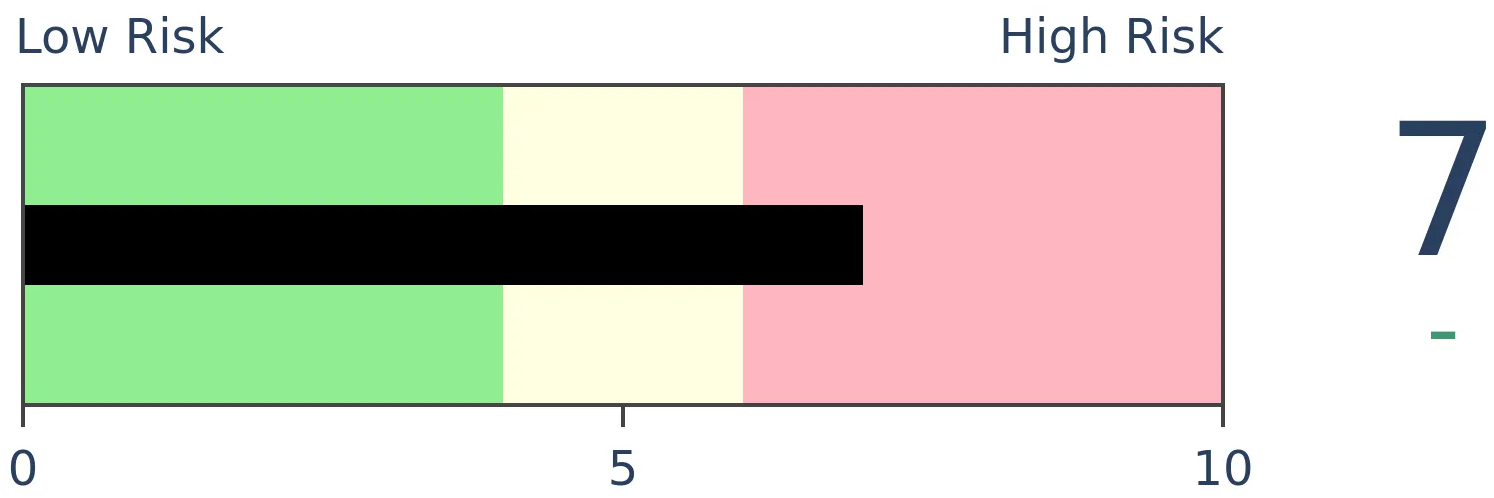
Crude Oil
|
|
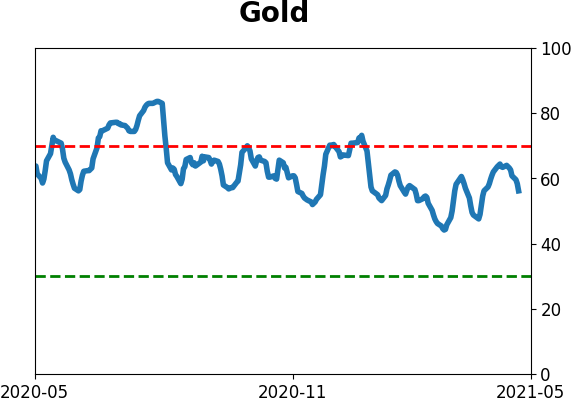
Gold
|
Agriculture
|
|
Research
BOTTOM LINE
So far in 2021, commodities have been on a tear. Going back to 1933, there have been 9 other years that had a high 4-month correlation to the start of the year. Most of them saw a multi-month pause, with one major exception.
FORECAST / TIMEFRAME
None
|
On Tuesday, we saw that the 4-month start to stocks this year has had some impressive precedents. While most of the similar years witnessed some consolidation during the summer months, the long-term implications were positive.
Commodities have arguably had an even more impressive start. The long-term trend in stocks is well-documented to be higher as companies innovate and produce profits, but commodities are much more cyclical. As prices rise, farmers plant more crops, or miners dig more stuff out of the ground, and prices go down. It's hard to sustain uptrends except when there is a massive supply/demand imbalance.
MOST SIMILAR 4-MONTH STARTS FOR COMMODITIES
Through late April, the Bloomberg Commodity Index showed a gain well into the double-digits, and it has only added to them since then. Using the same methodology we used for stocks, we see that 9 other years had a correlation greater than +0.7 (on a scale of -1.0 to +1.0) through the first 4 months of the year.
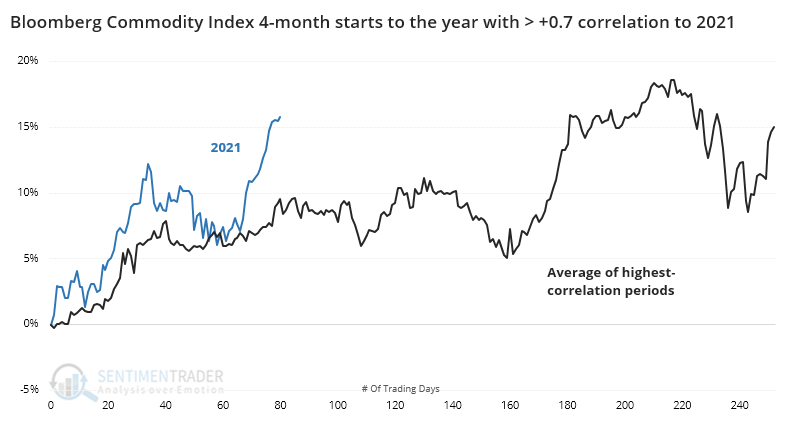
The years all showed gains through April and enjoyed a roughly similar path to get there, but the only year with a better 4-month beginning was 1973. Commodity bulls would love to see a repeat, as it preceded massive additional gains.
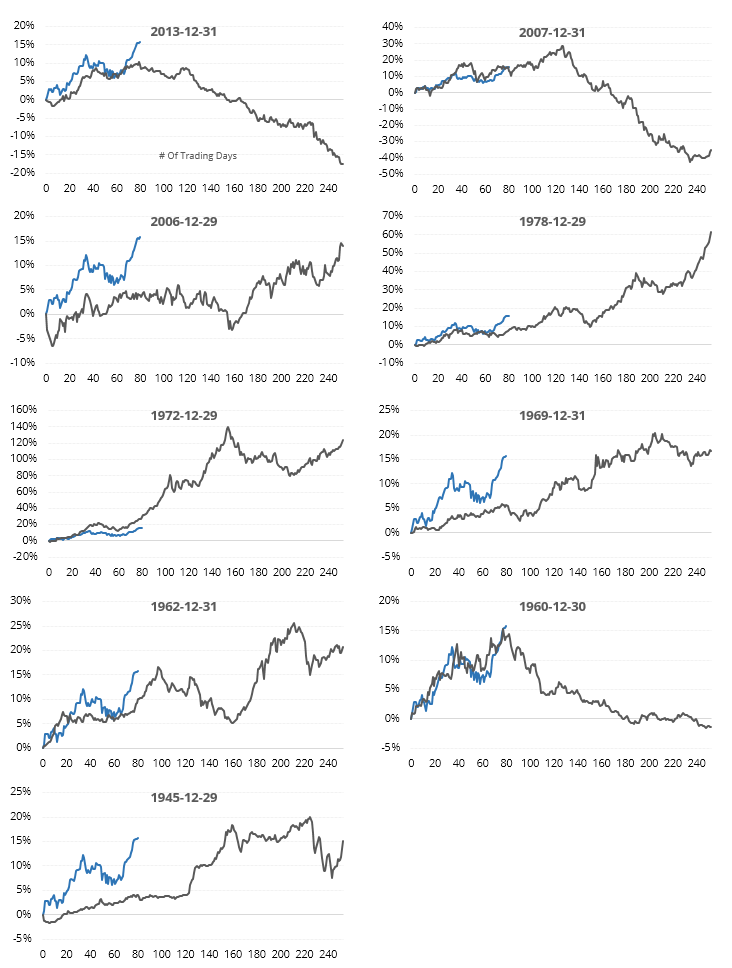
Even though their correlations to 2021 were all highly positive, there was still quite a bit of variability among the samples, especially in terms of magnitude. There was a general tendency to see commodities peak at about this point in the year, though.
WHAT GOOD STARTS MEAN FOR THE REST OF THE YEAR
The table below shows future returns in the index from the end of April for those years with the highest correlation to 2021.
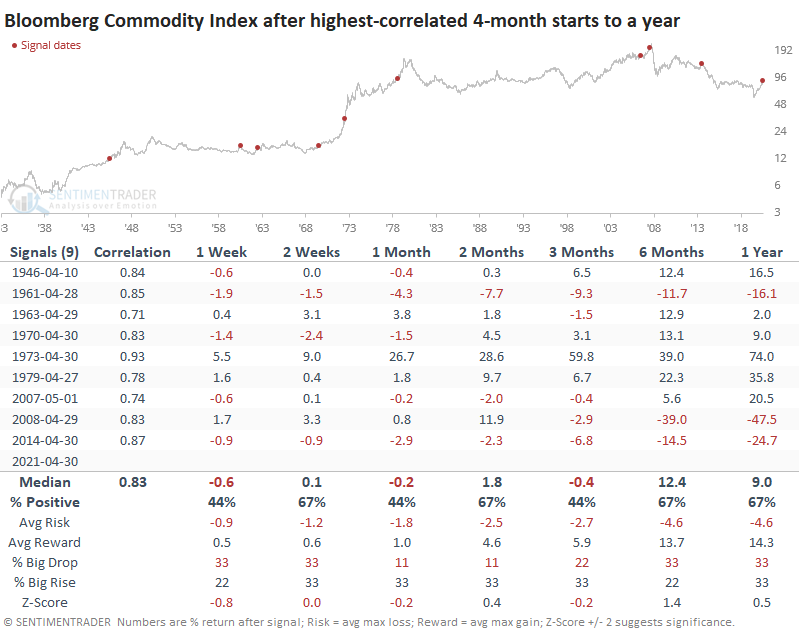
The year with the highest correlation was 1973, and there was virtually no letup as it preceded massive and sustained gains in the index. Among the others, only 1979 saw no negative returns across all time frames.
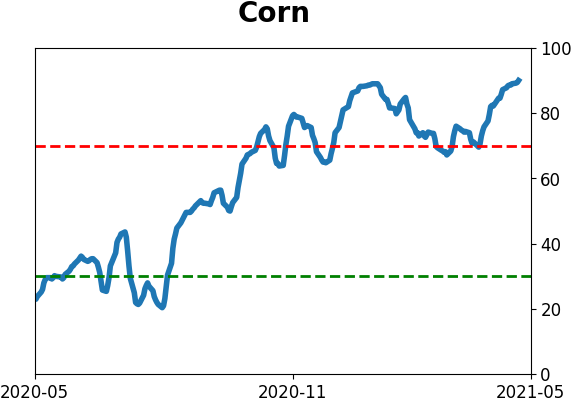
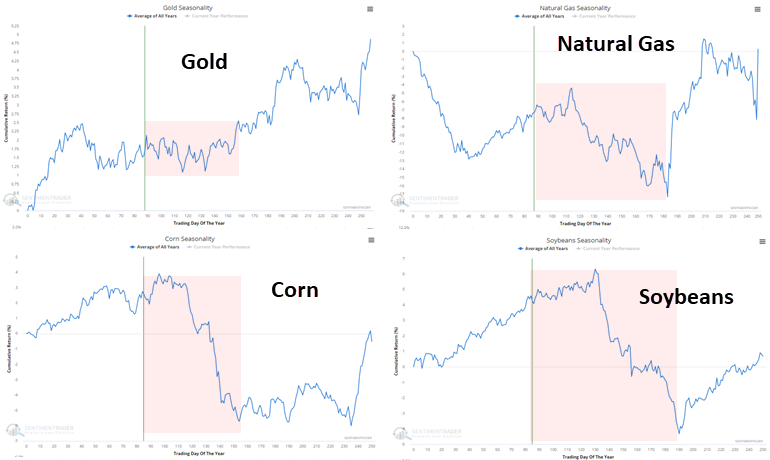
There are some shorter-term challenges to those precedents. The chart above clearly shows that the summer months preceded some choppy trading for commodities. Among some of the largest influences on the Bloomberg Commodity Index, the seasonal windows for gold, natural gas, corn, and soybeans are questionable.
Likewise, when we looked at the rates of change in commodities in March and April, we saw just how tough it has been for this market to sustain massive gains over the medium-term.
So, commodities should pause over the next few months and digest their recent gains. As always, a market that doesn't do what it should gives us a strong hint that something structural has changed, and this market has already done that to some degree. If commodities follow the 1973 playbook, then we won't see much, if any, weakness in the weeks and months to come. But it will have to fight historical analogs, seasonality, momentum, and sentiment, all pointing to a pause.
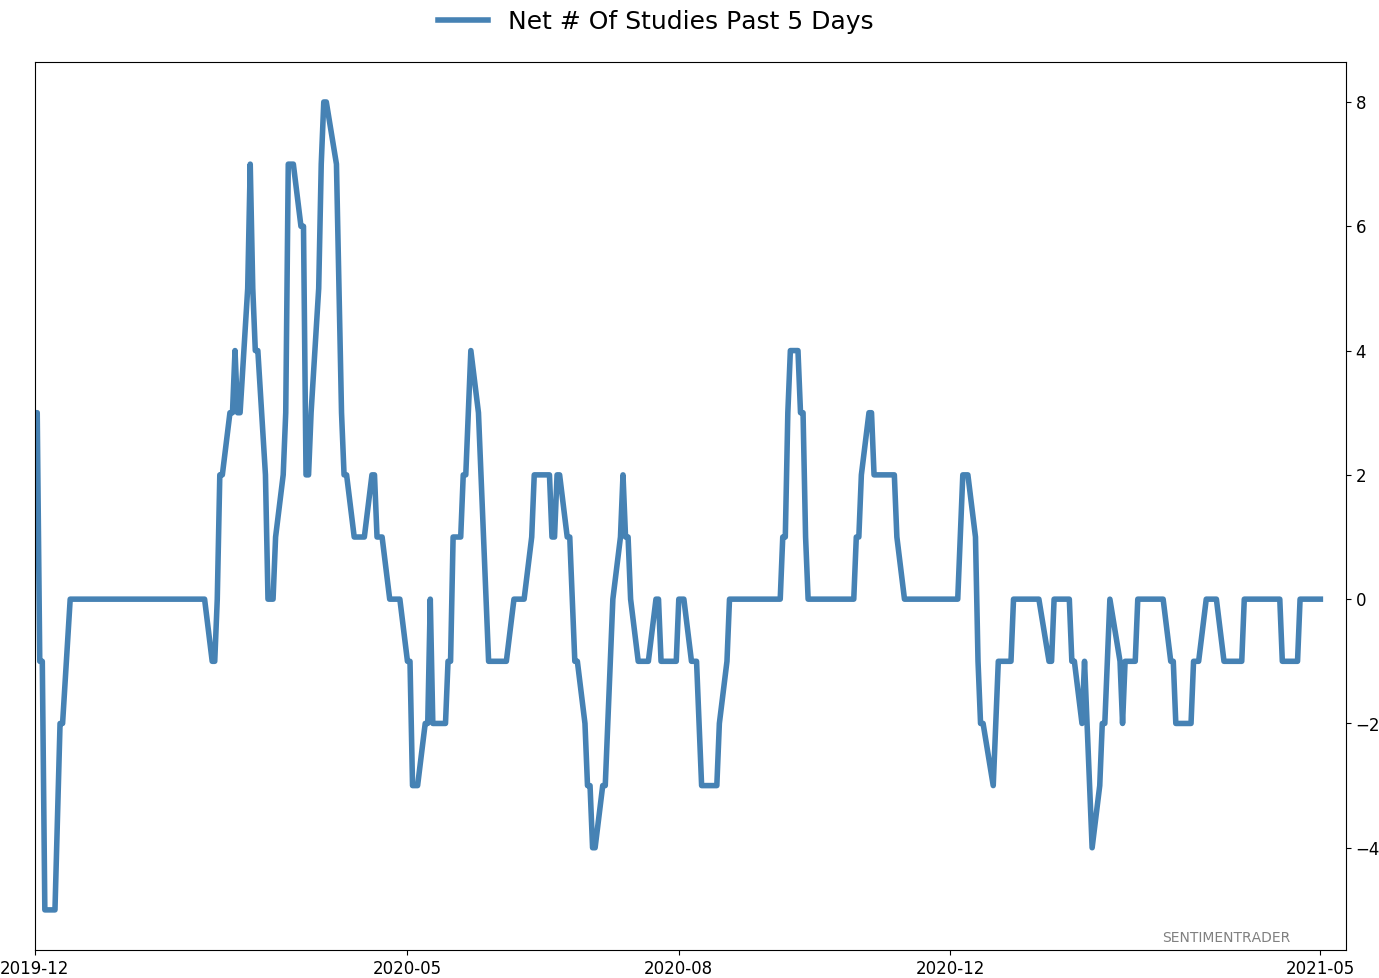
Active Studies
| Time Frame | Bullish | Bearish | | Short-Term | 0 | 0 | | Medium-Term | 1 | 11 | | Long-Term | 11 | 4 |
|
Indicators at Extremes
Portfolio
| Position | Description | Weight % | Added / Reduced | Date | | Stocks | RSP | 0.0 | Reduced 4.9% | 2021-04-22 | | Bonds | 30.0% BND, 8.8% SCHP | 37.9 | Added 15.1% | 2021-02-18 | | Commodities | GCC | 2.5 | Reduced 2.1%
| 2020-09-04 | | Precious Metals | GDX | 9.8 | Added 0.1% | 2021-02-18 | | Special Situations | 4.3% XLE, 2.2% PSCE | 6.5 | Reduced 5.6% | 2021-04-22 | | Cash | | 43.3 | | |
|
Updates (Changes made today are underlined)
I've made no adjustments for months, as the situation remained essentially stuck - energy was doing what it should, sentiment in the broader market was ridiculously stretched but with no major warning signs, and sentiment toward gold and bonds appeared overdone on the pessimistic side. Those conditions have started to reverse a bit, so I further reduced my risk. There are still no major warning signs, but I'm getting increasingly uncomfortable and would prefer to sit safely in cash and wait for better risk/reward opportunities. RETURN YTD: 8.3% 2020: 8.1%, 2019: 12.6%, 2018: 0.6%, 2017: 3.8%, 2016: 17.1%, 2015: 9.2%, 2014: 14.5%, 2013: 2.2%, 2012: 10.8%, 2011: 16.5%, 2010: 15.3%, 2009: 23.9%, 2008: 16.2%, 2007: 7.8%
|
|
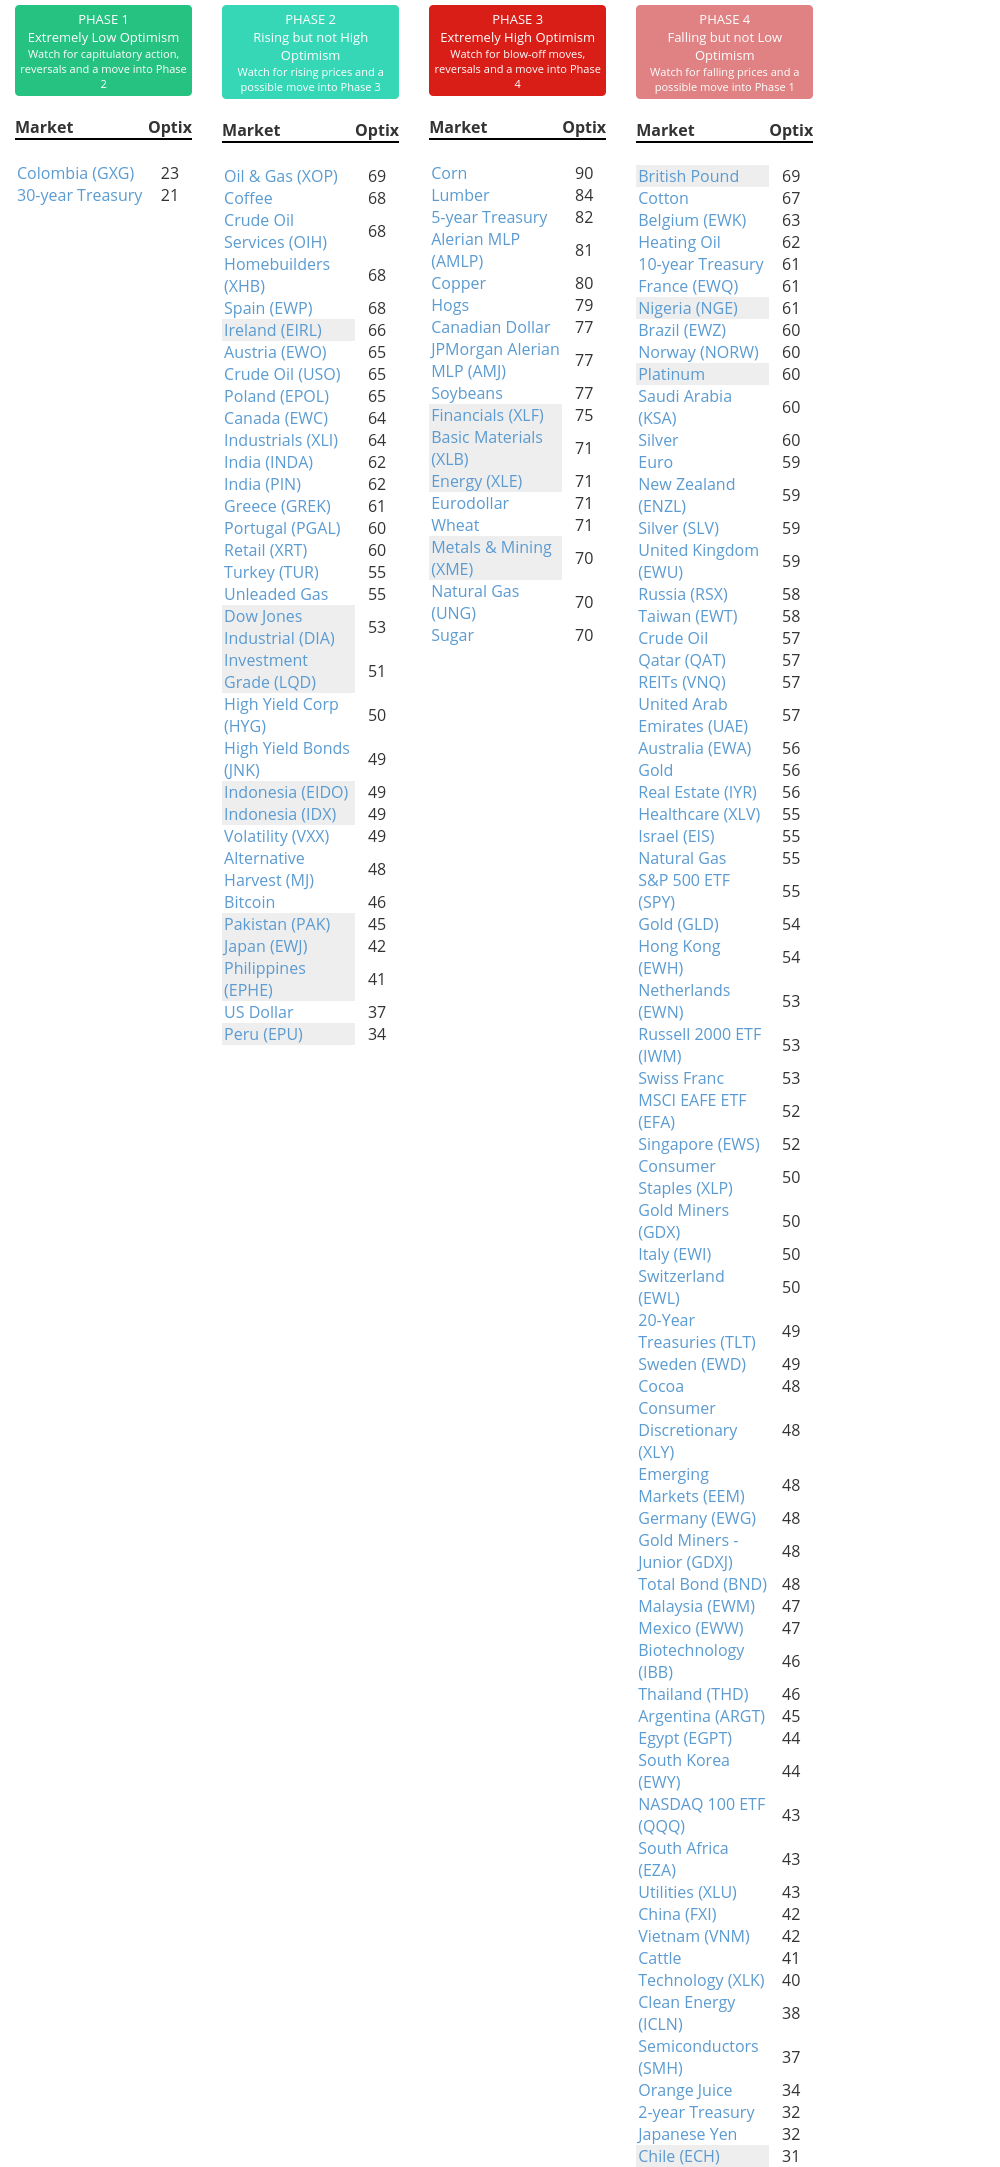
Phase Table
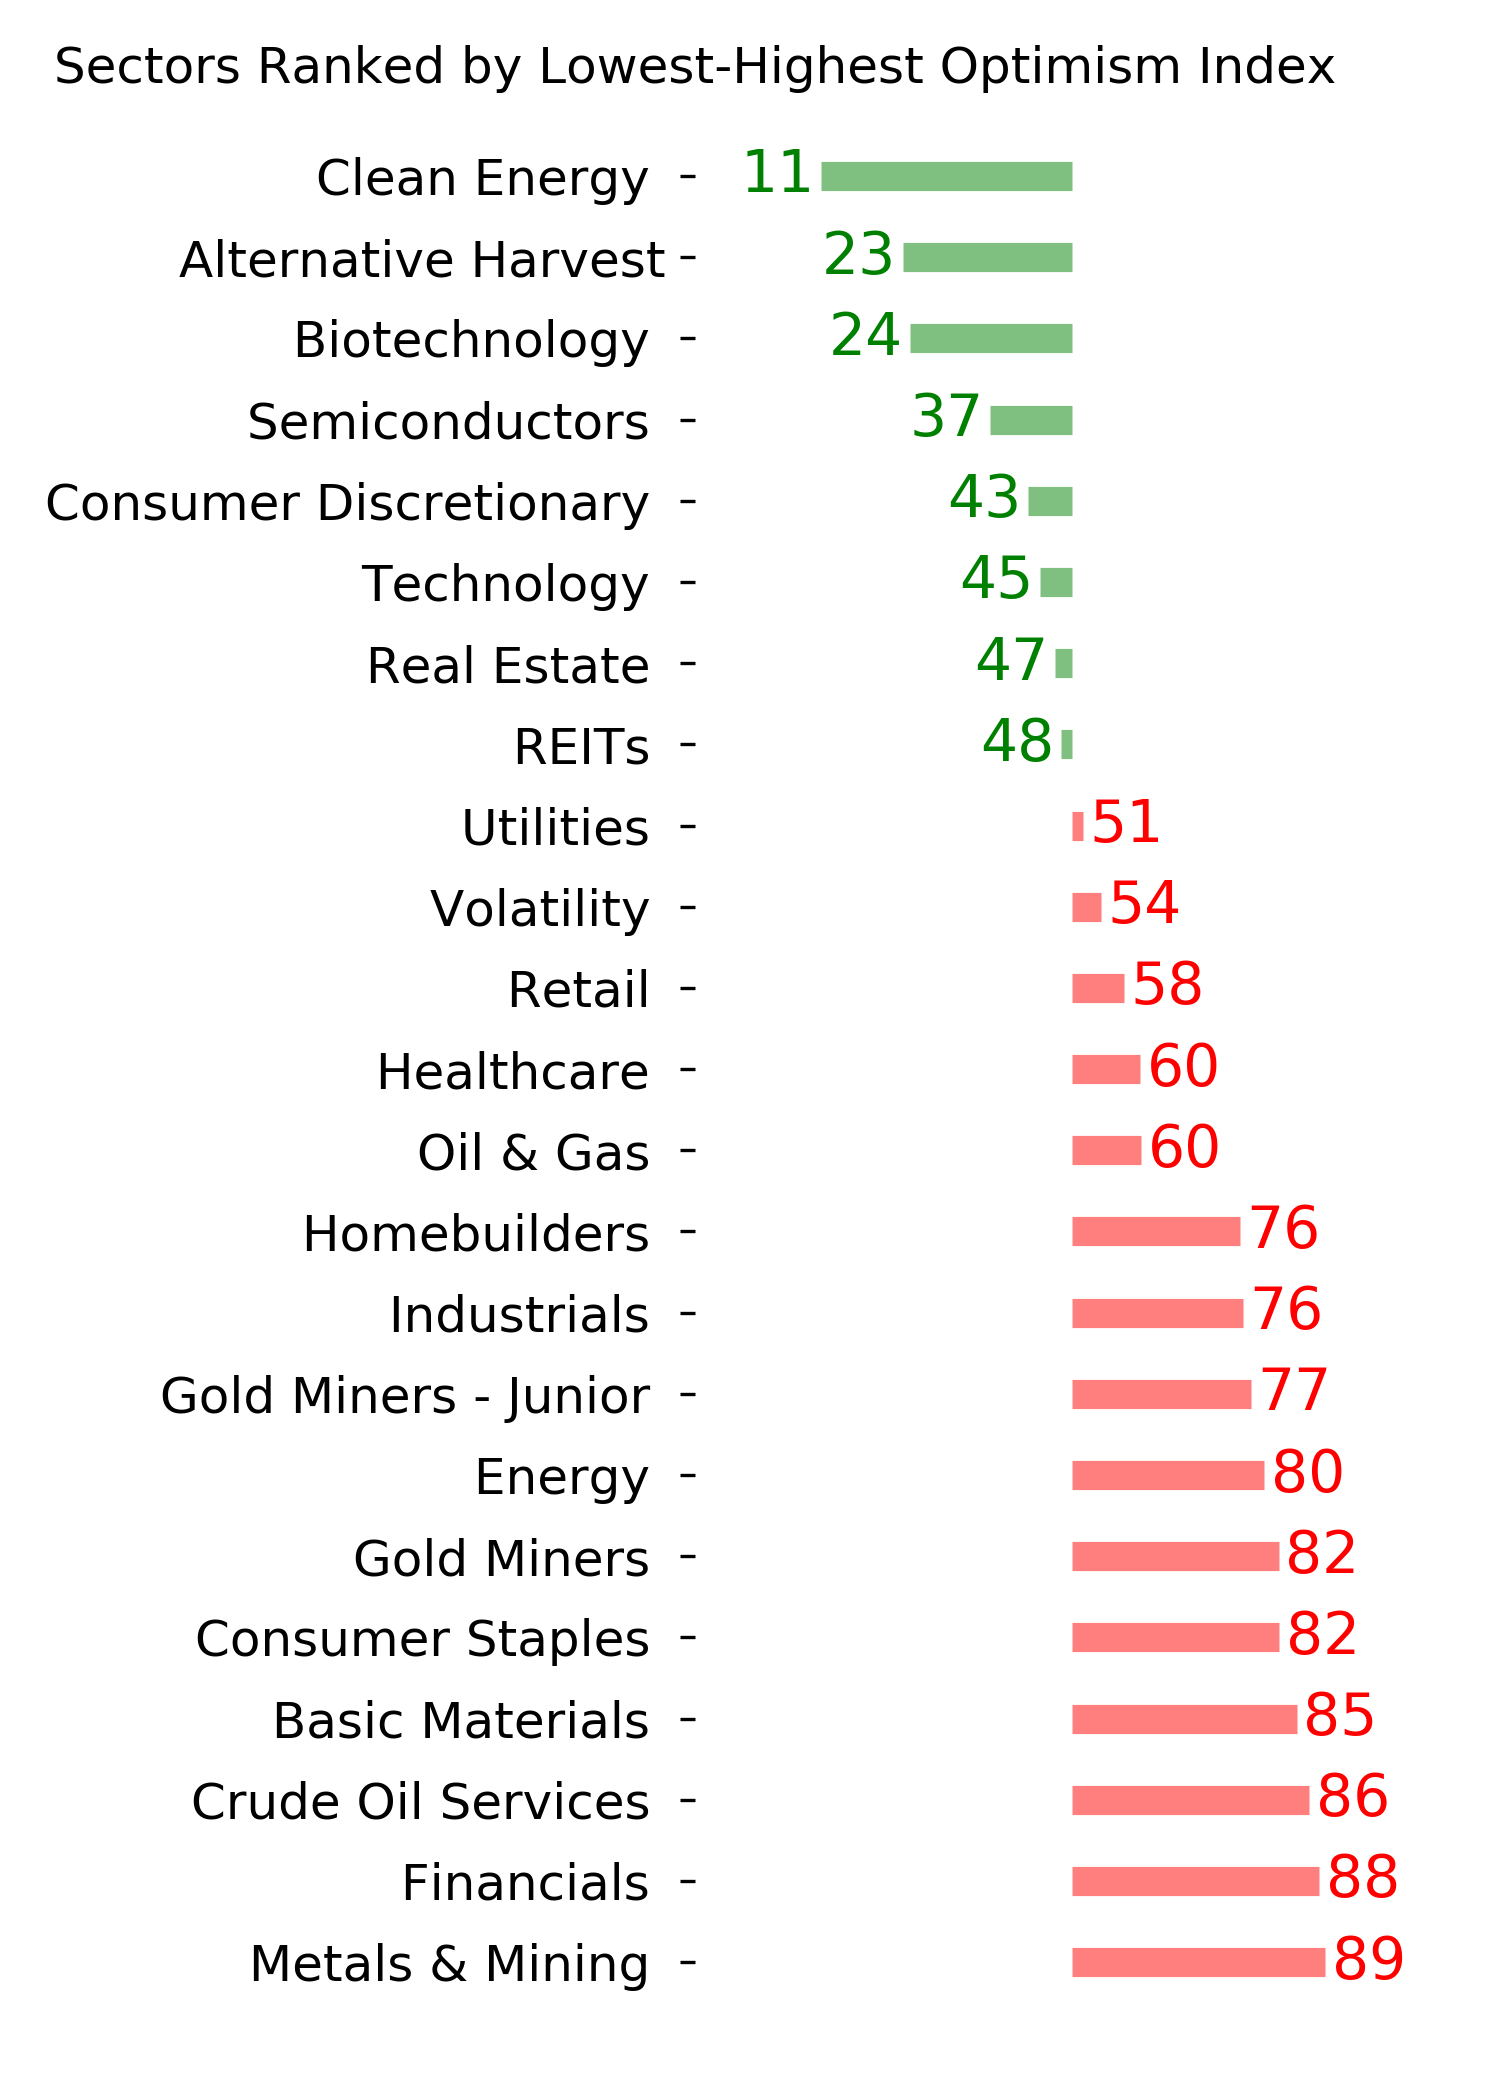
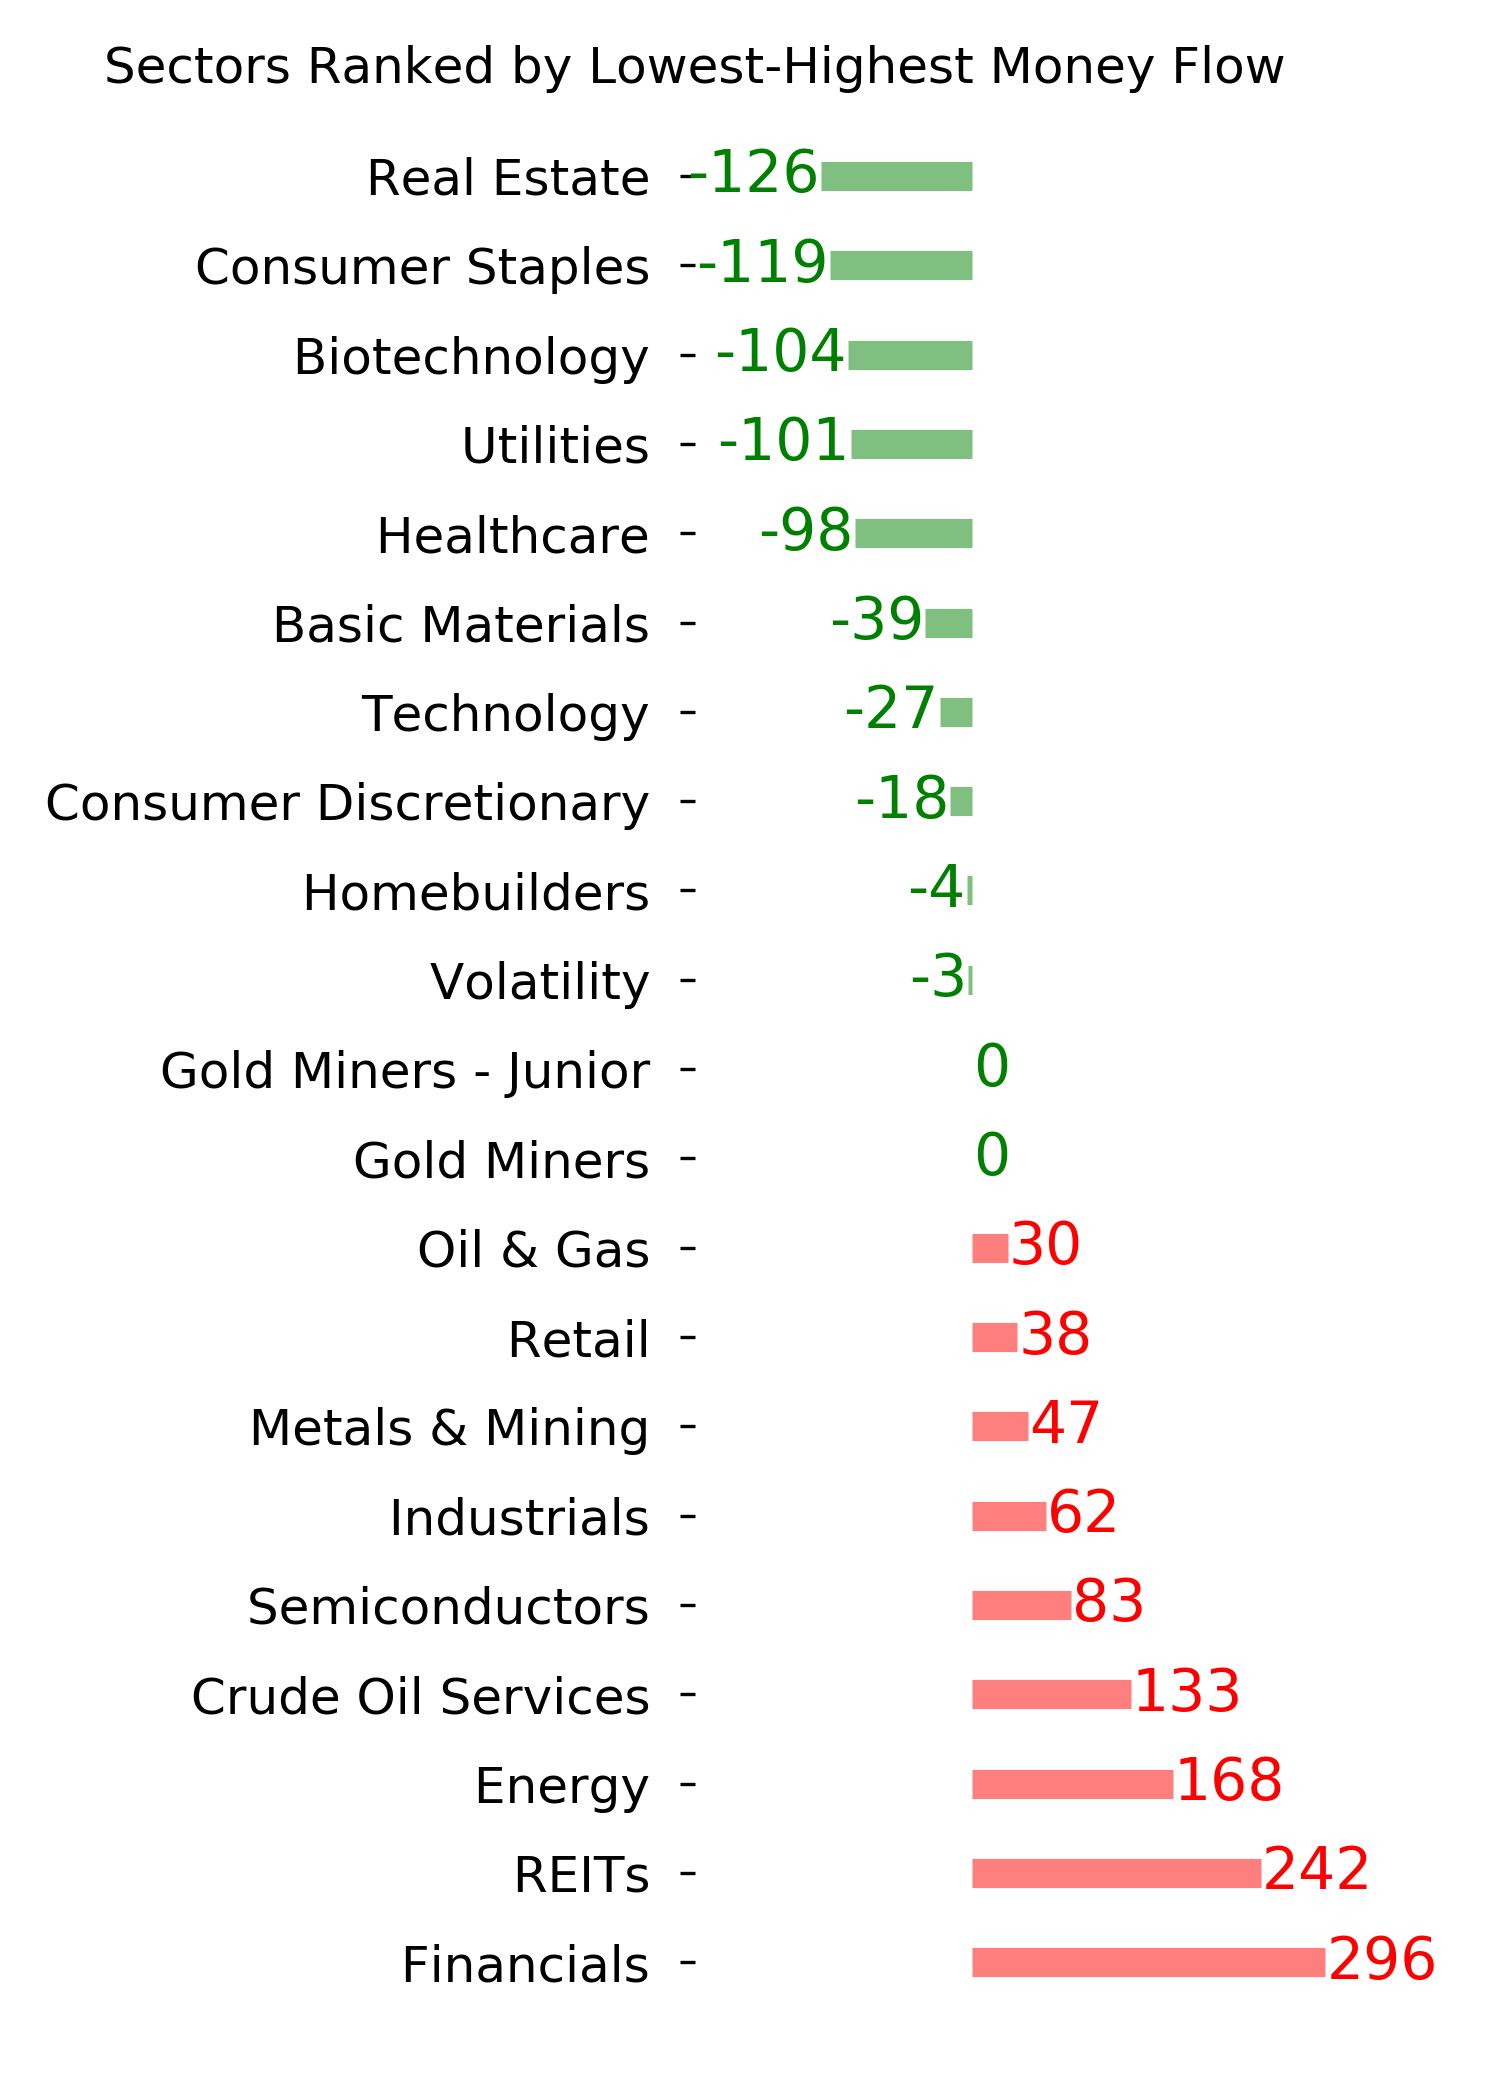
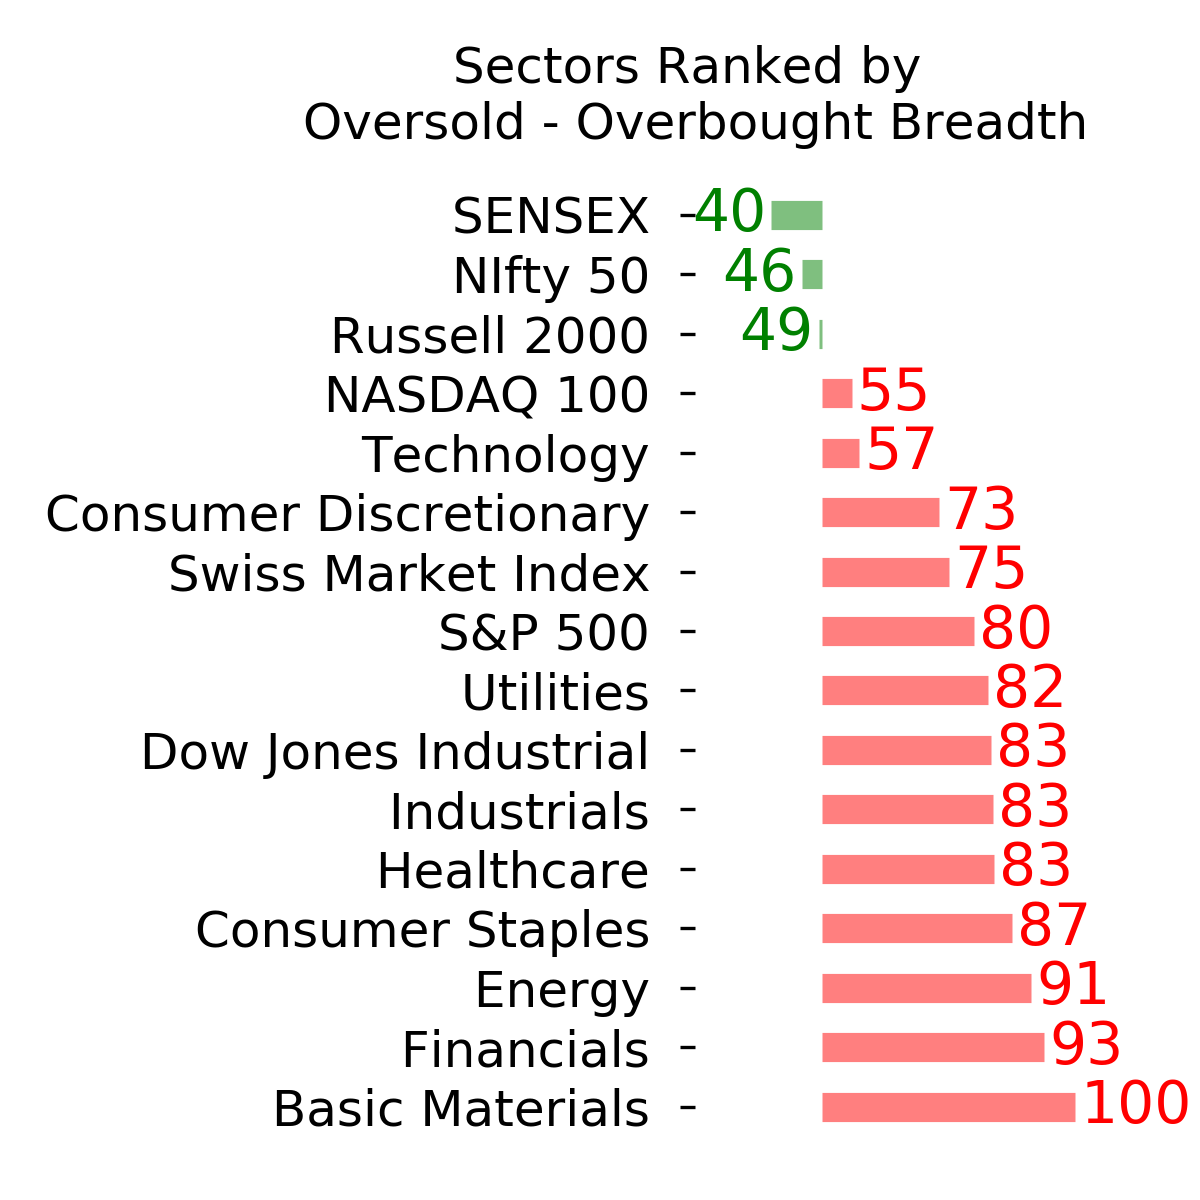
Ranks
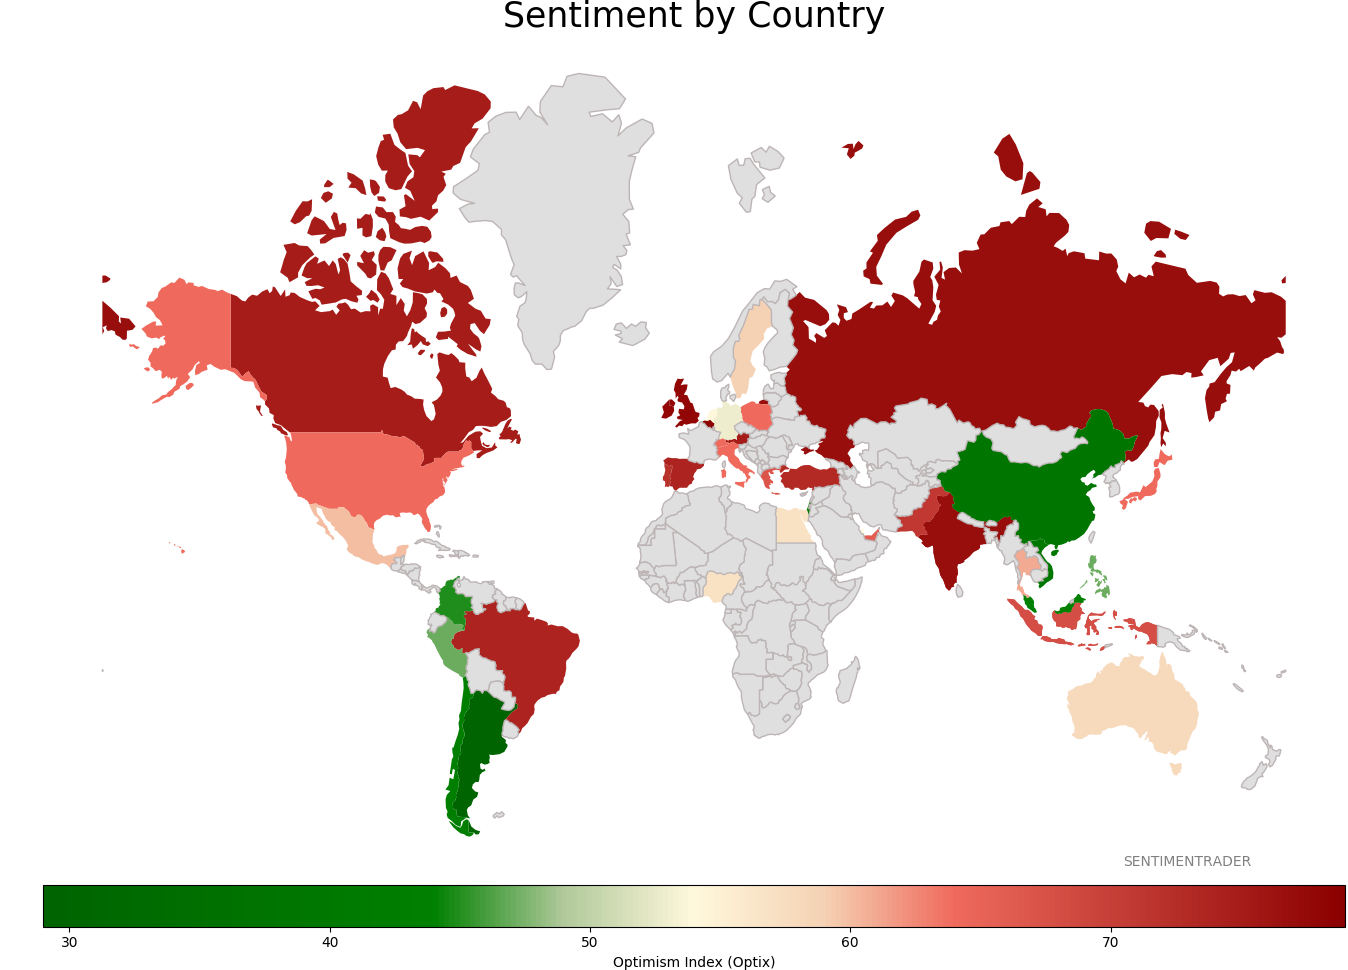
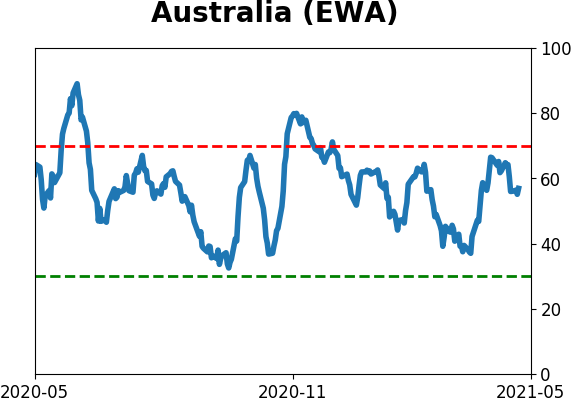
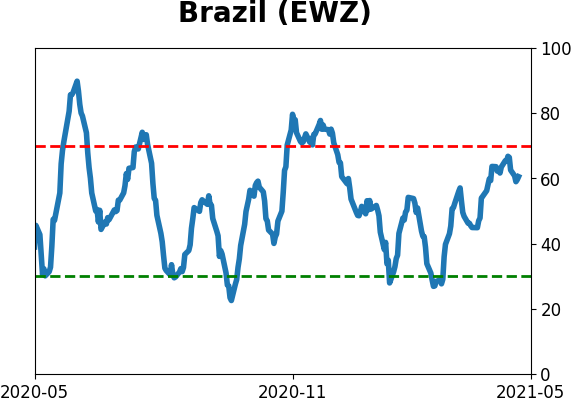
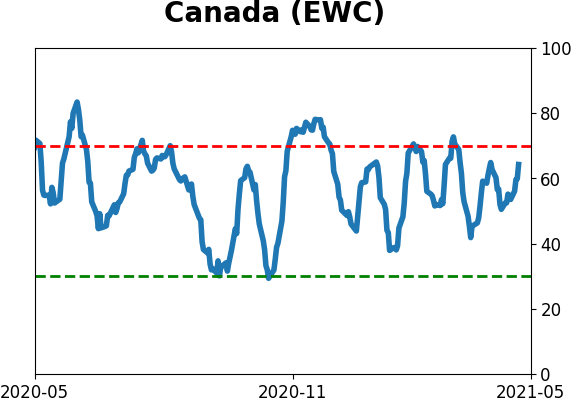
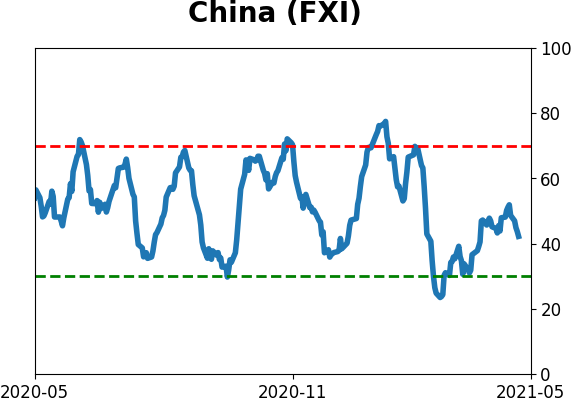
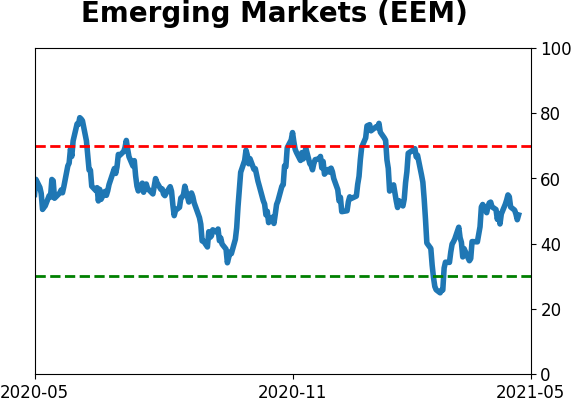
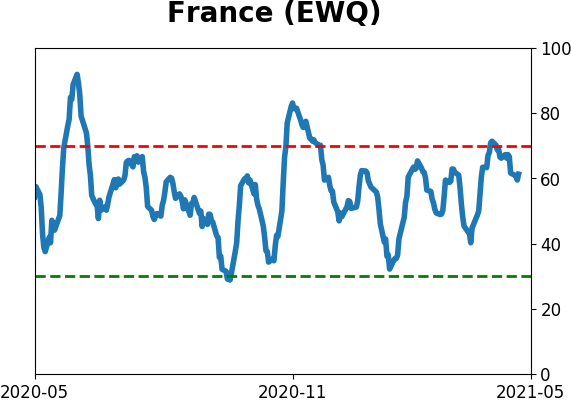
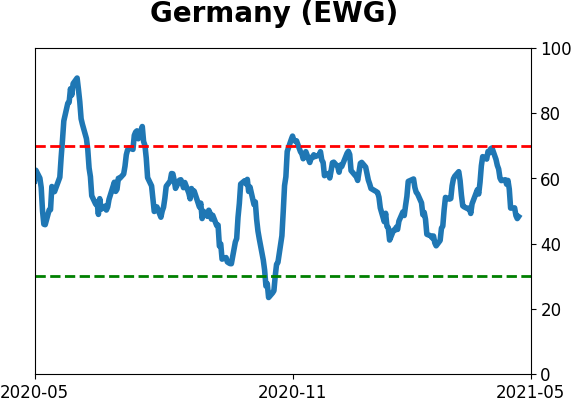
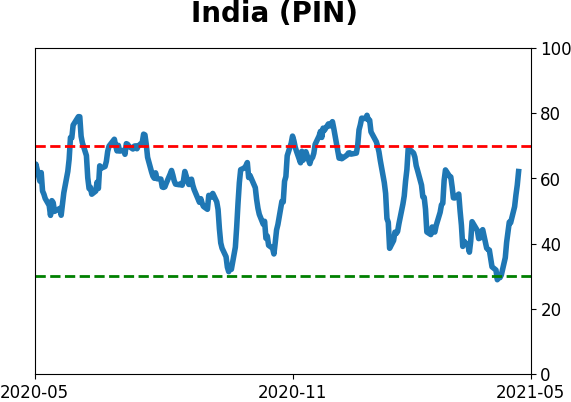
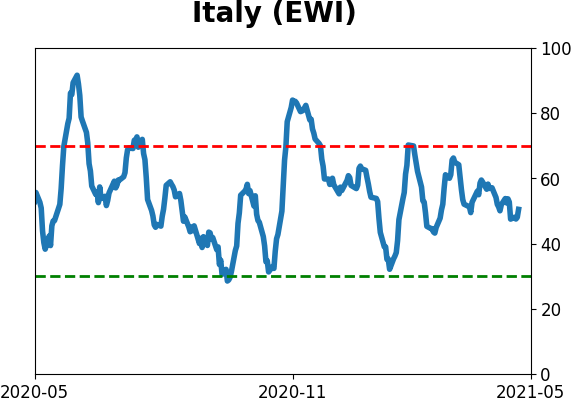
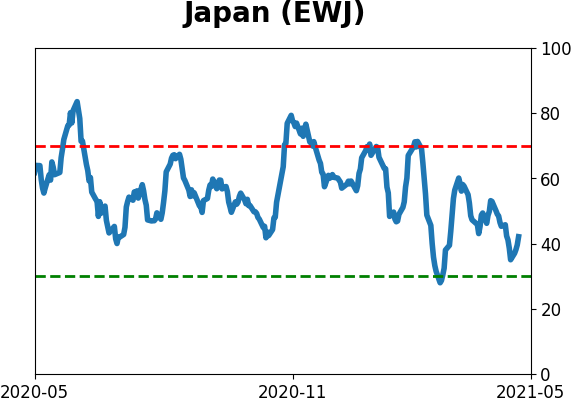
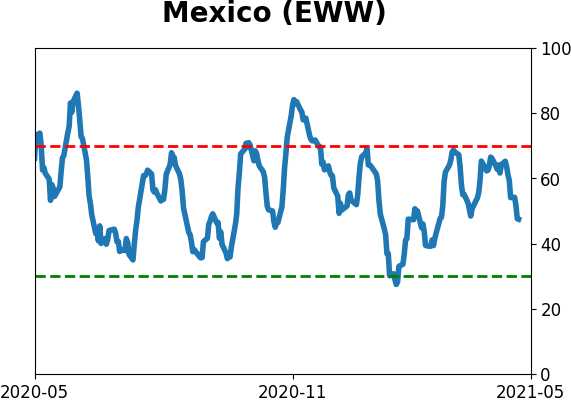
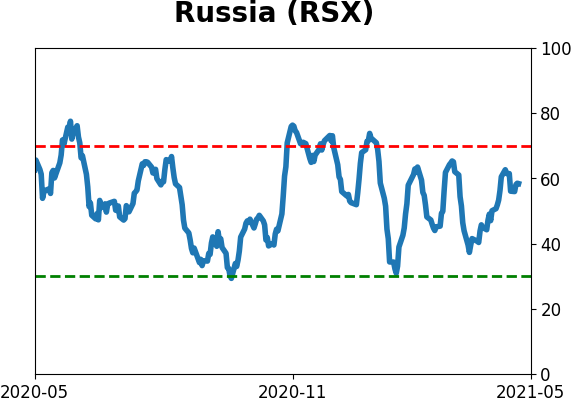
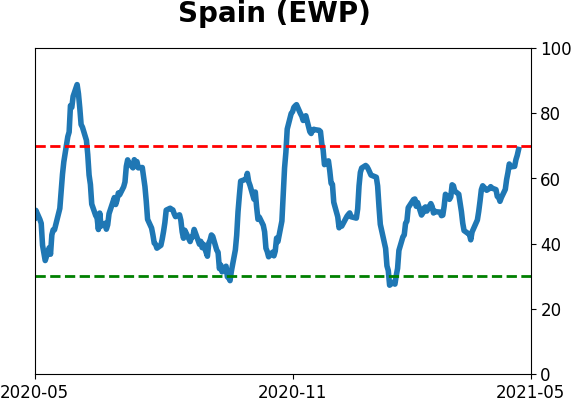
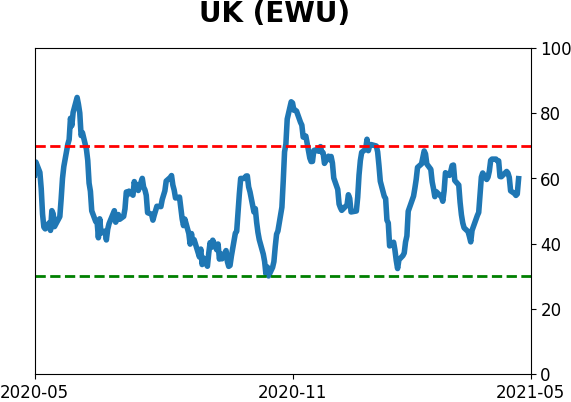
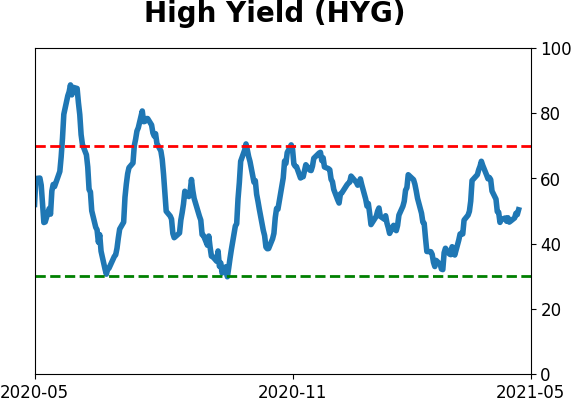
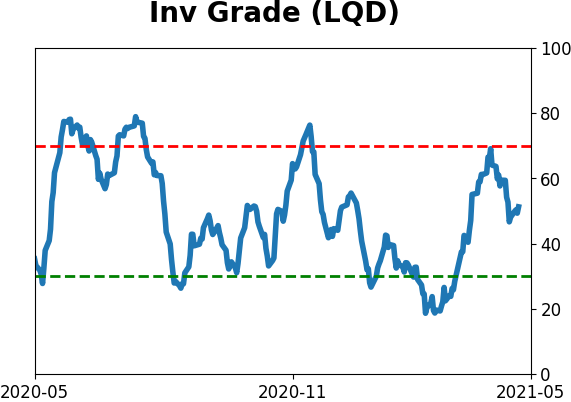
Sentiment Around The World
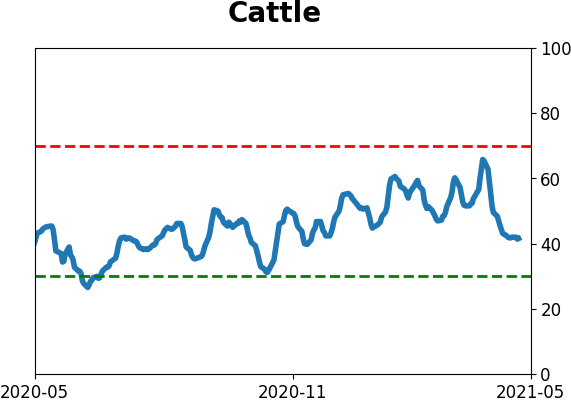
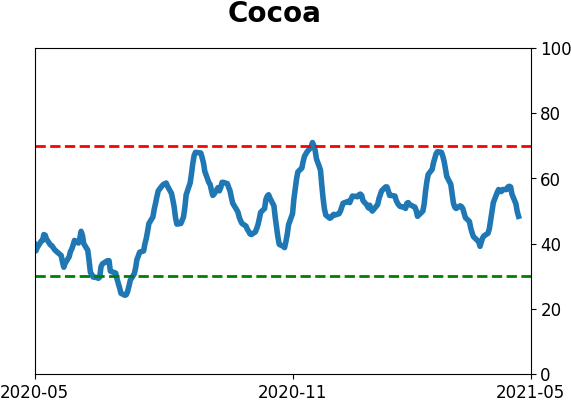
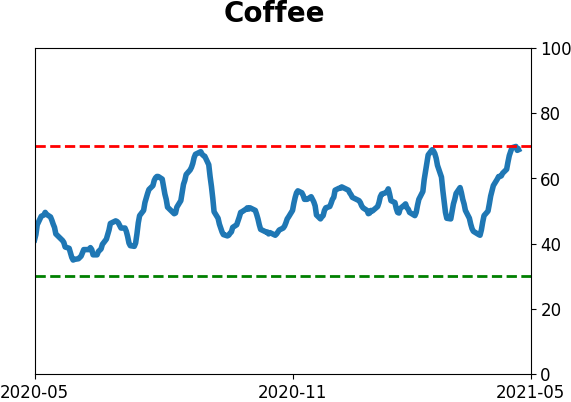
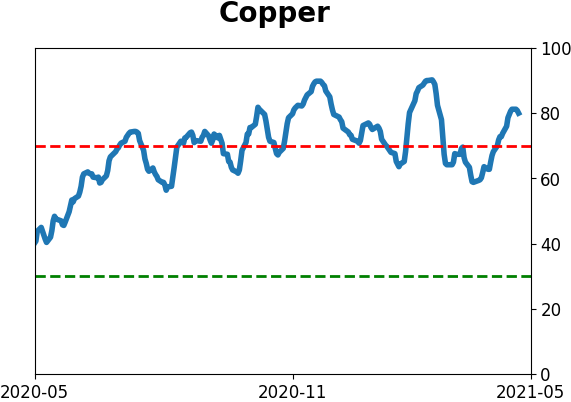
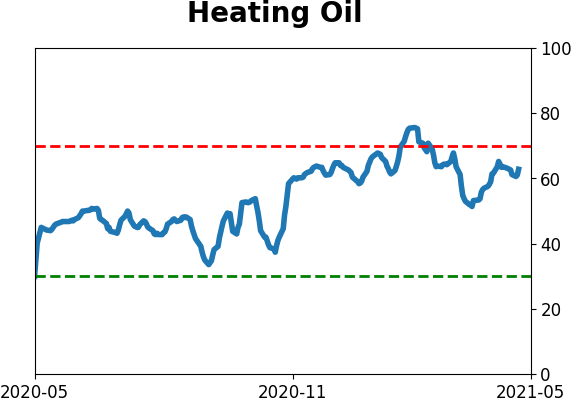
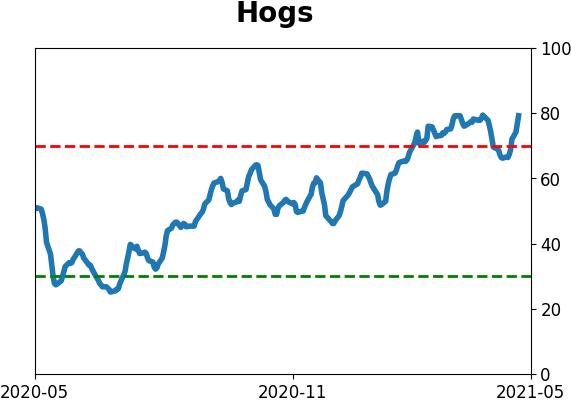
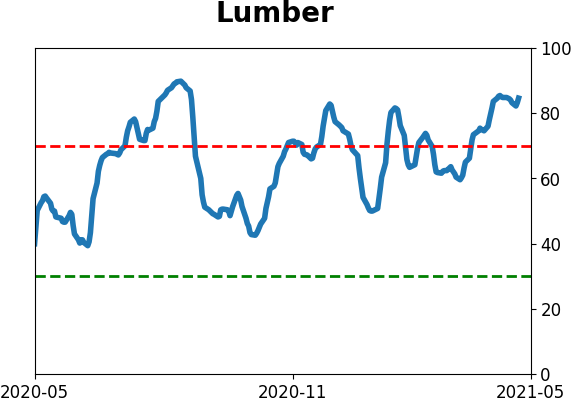
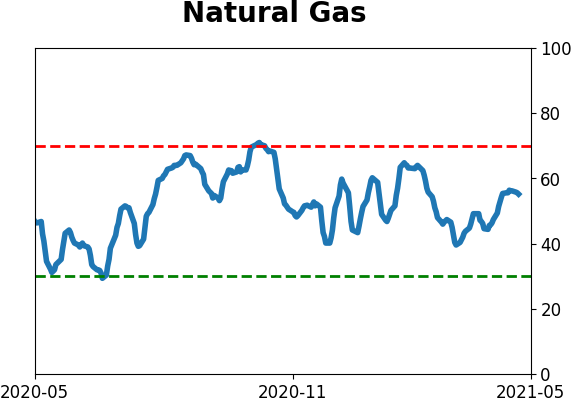
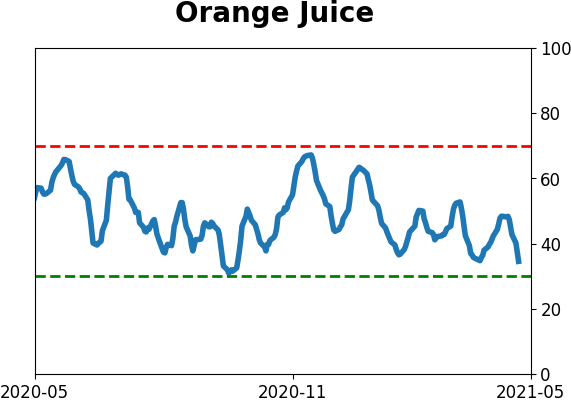
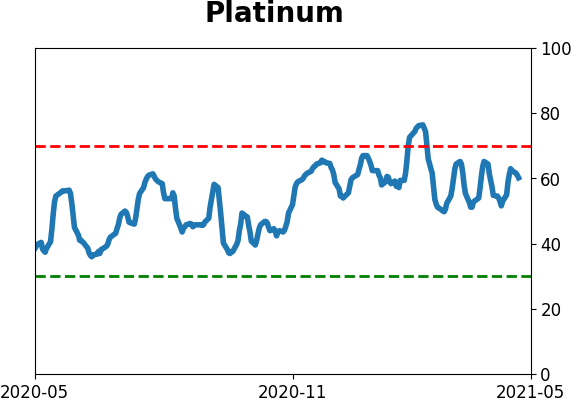
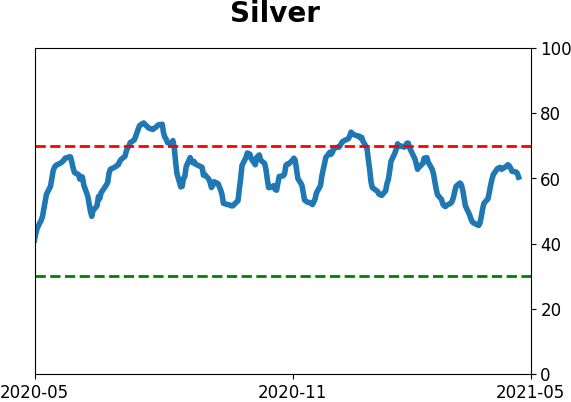
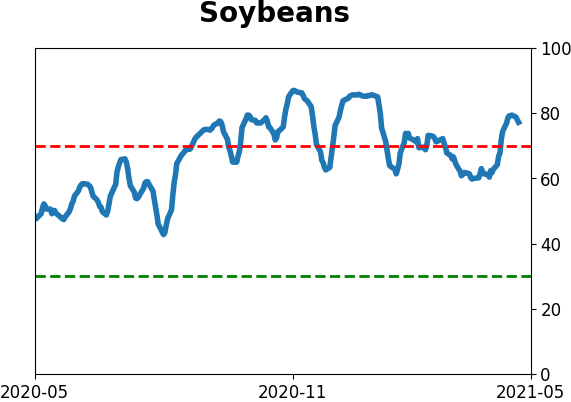
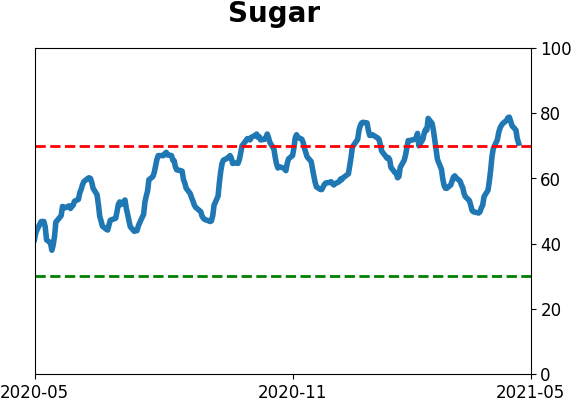
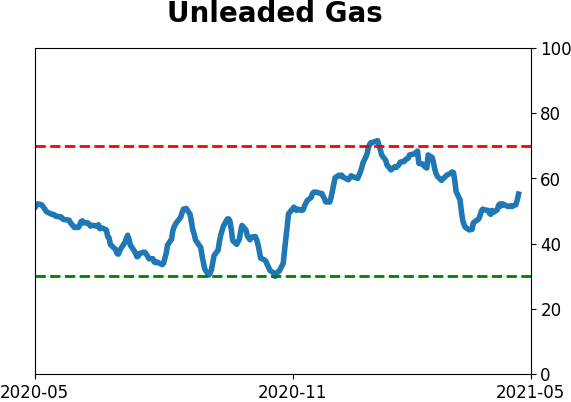
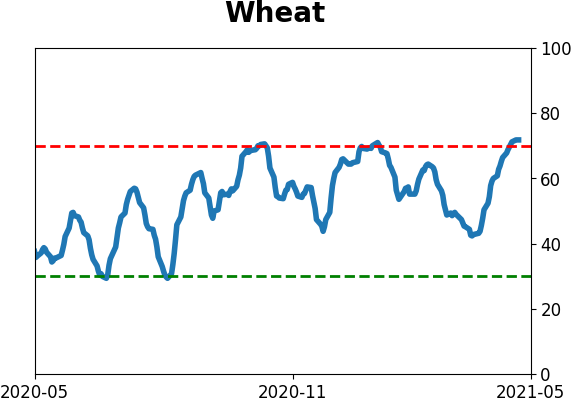
Optimism Index Thumbnails
|
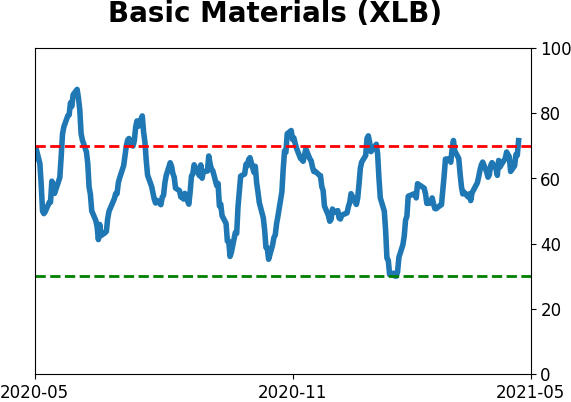
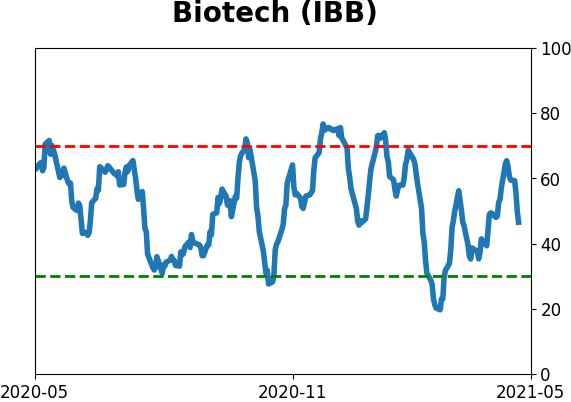
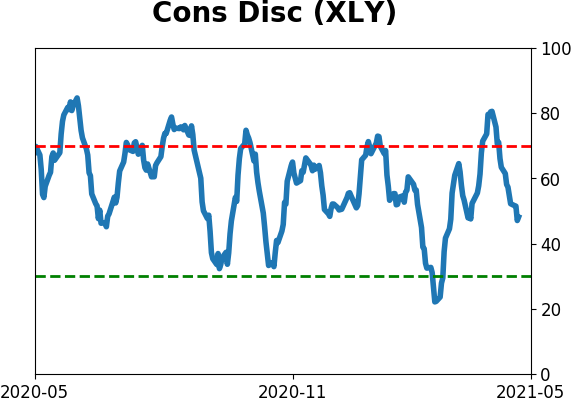
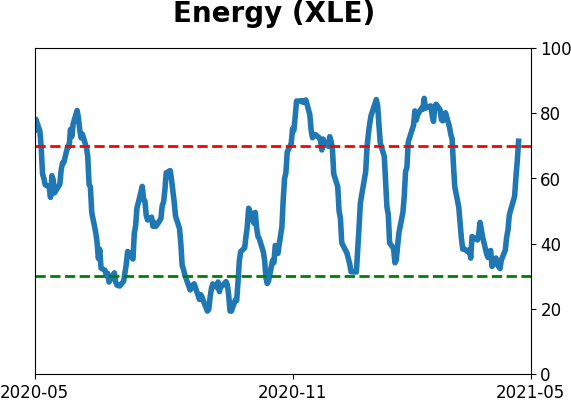
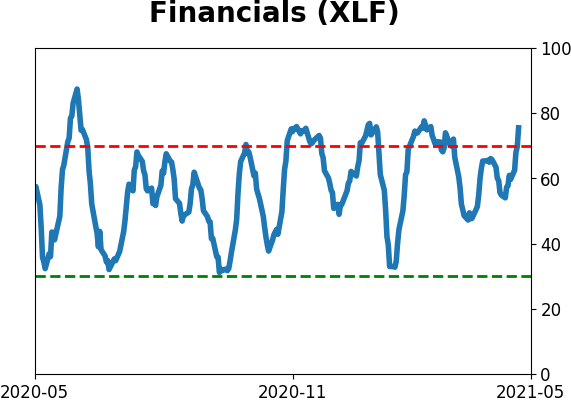
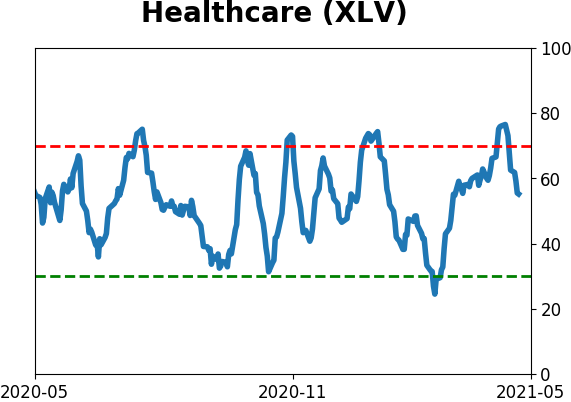
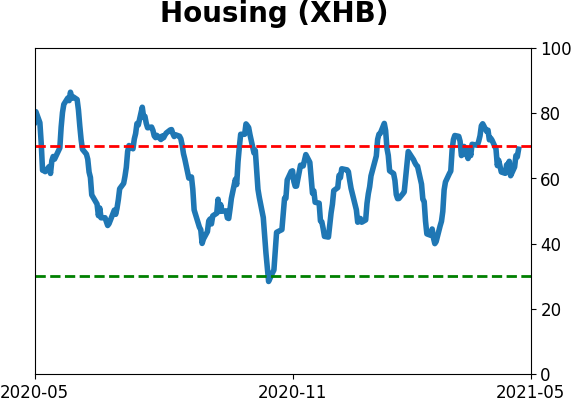
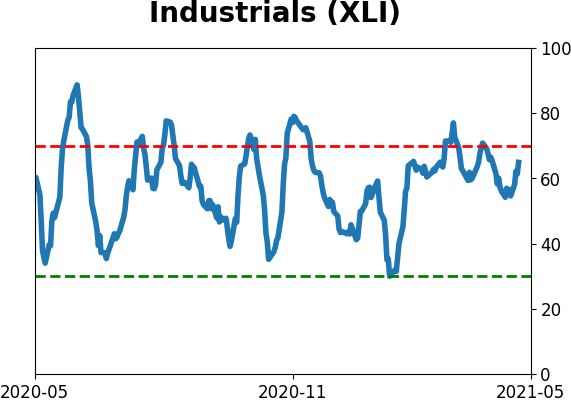
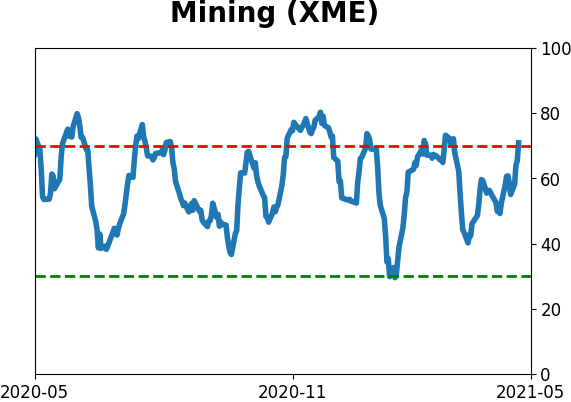
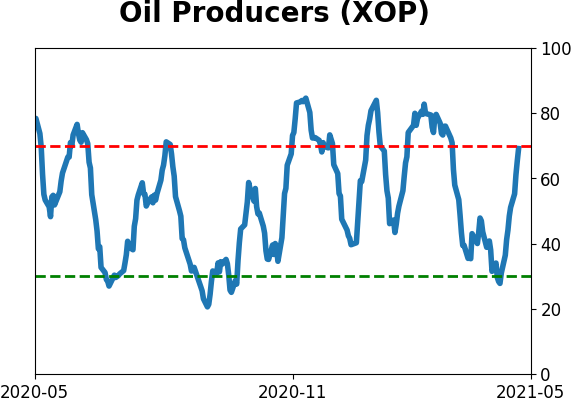
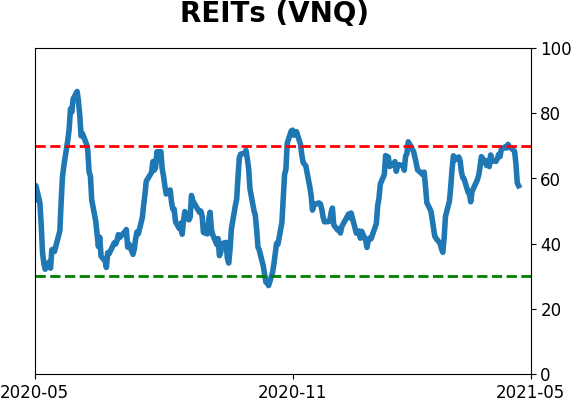
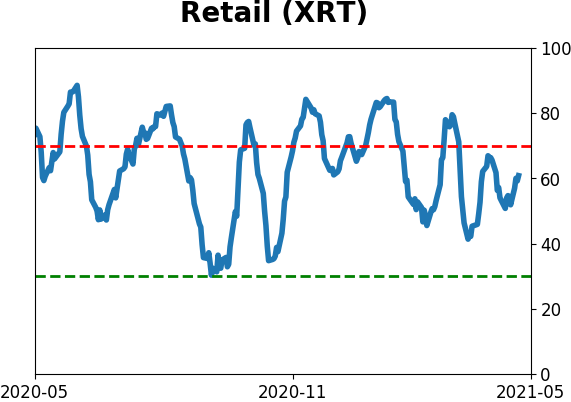
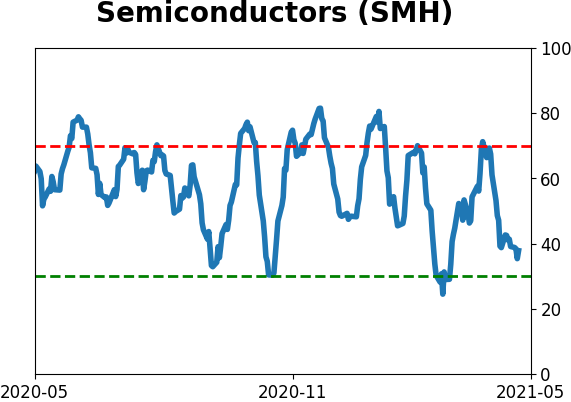
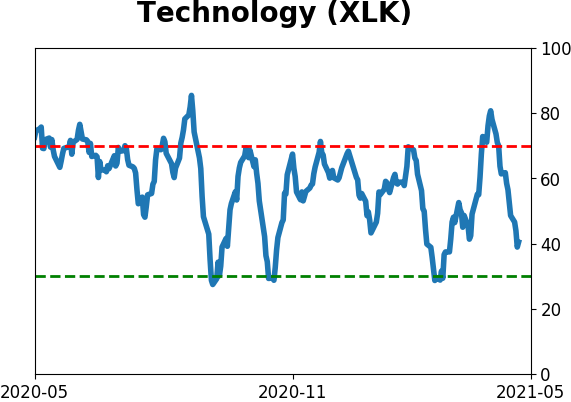
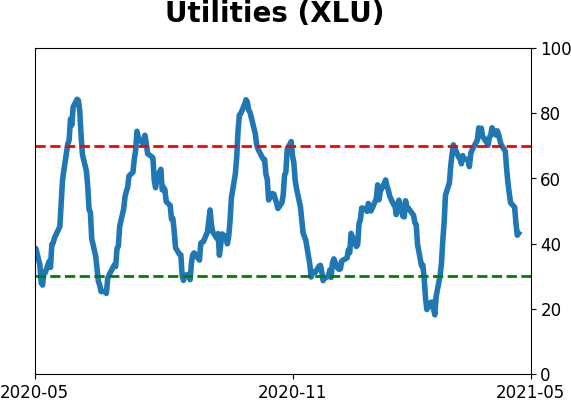
Sector ETF's - 10-Day Moving Average
|
|
|
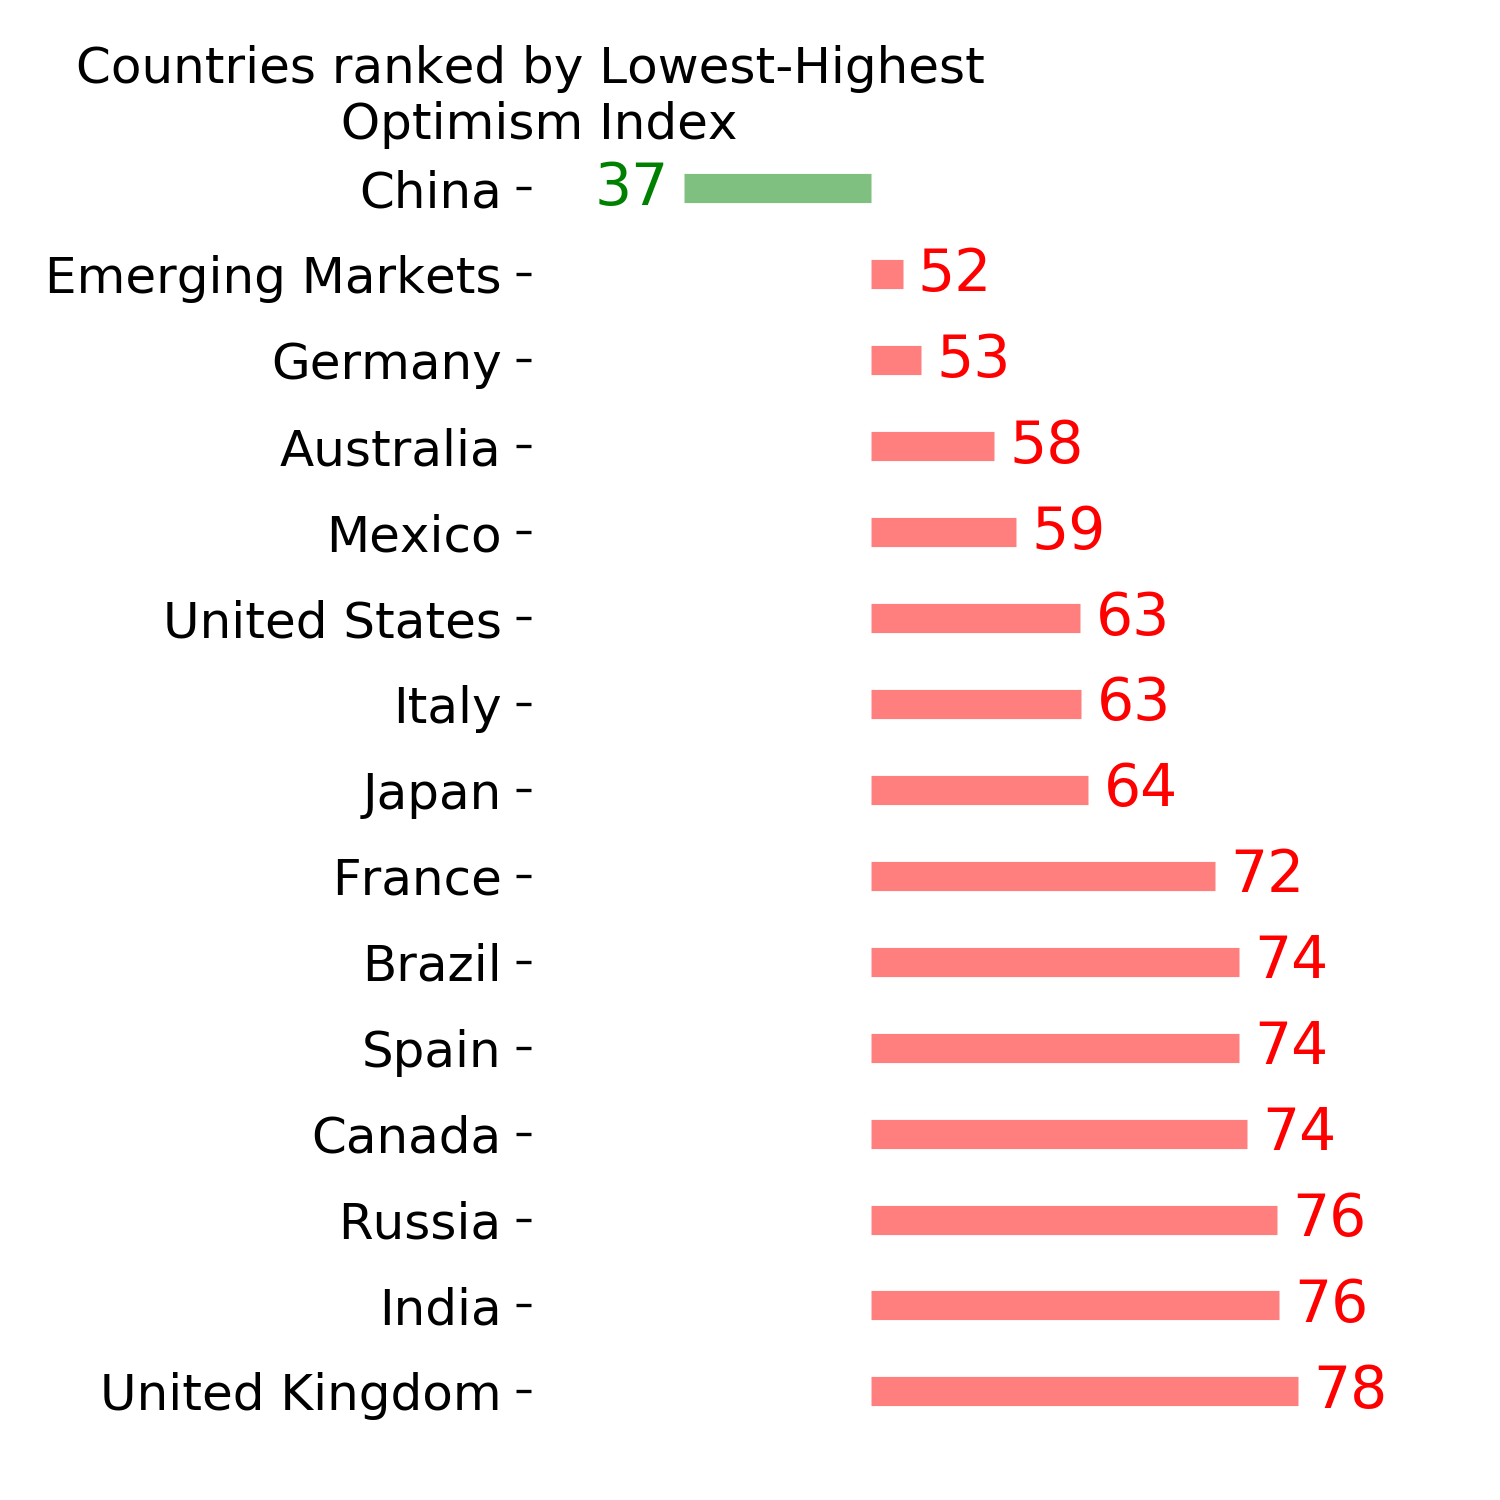
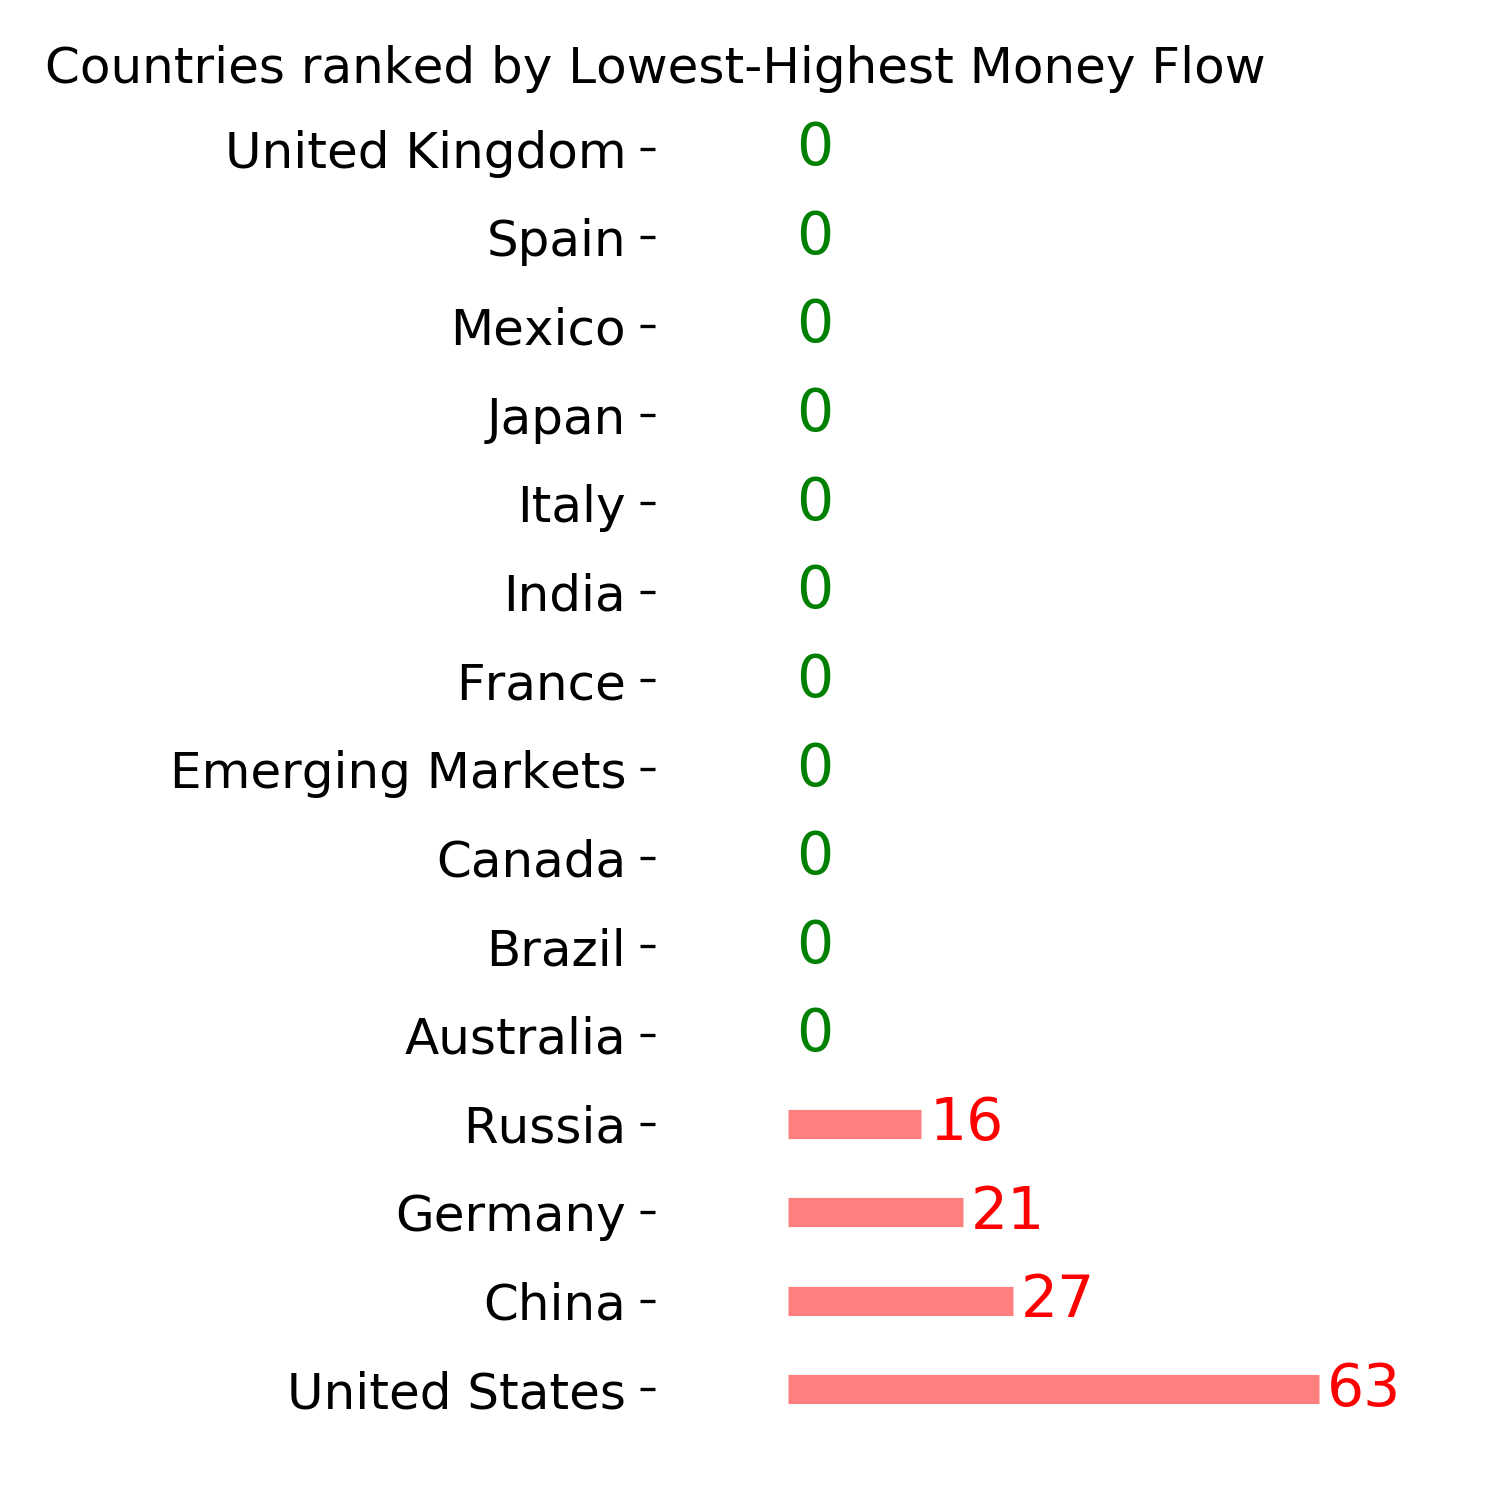
Country ETF's - 10-Day Moving Average
|
|
|
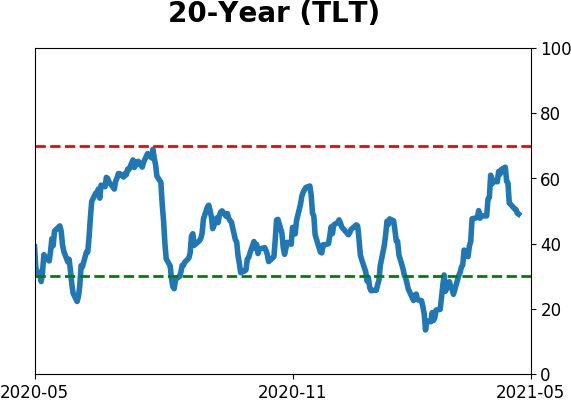
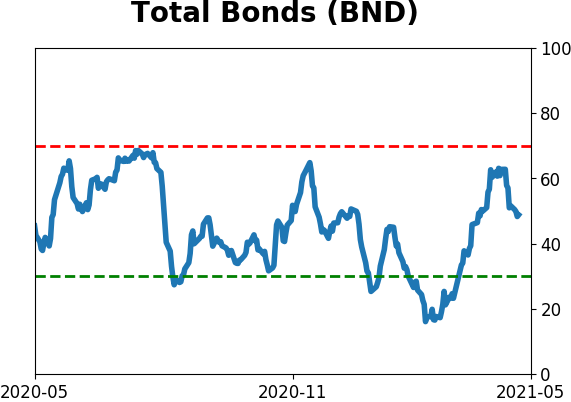
Bond ETF's - 10-Day Moving Average
|
|
|
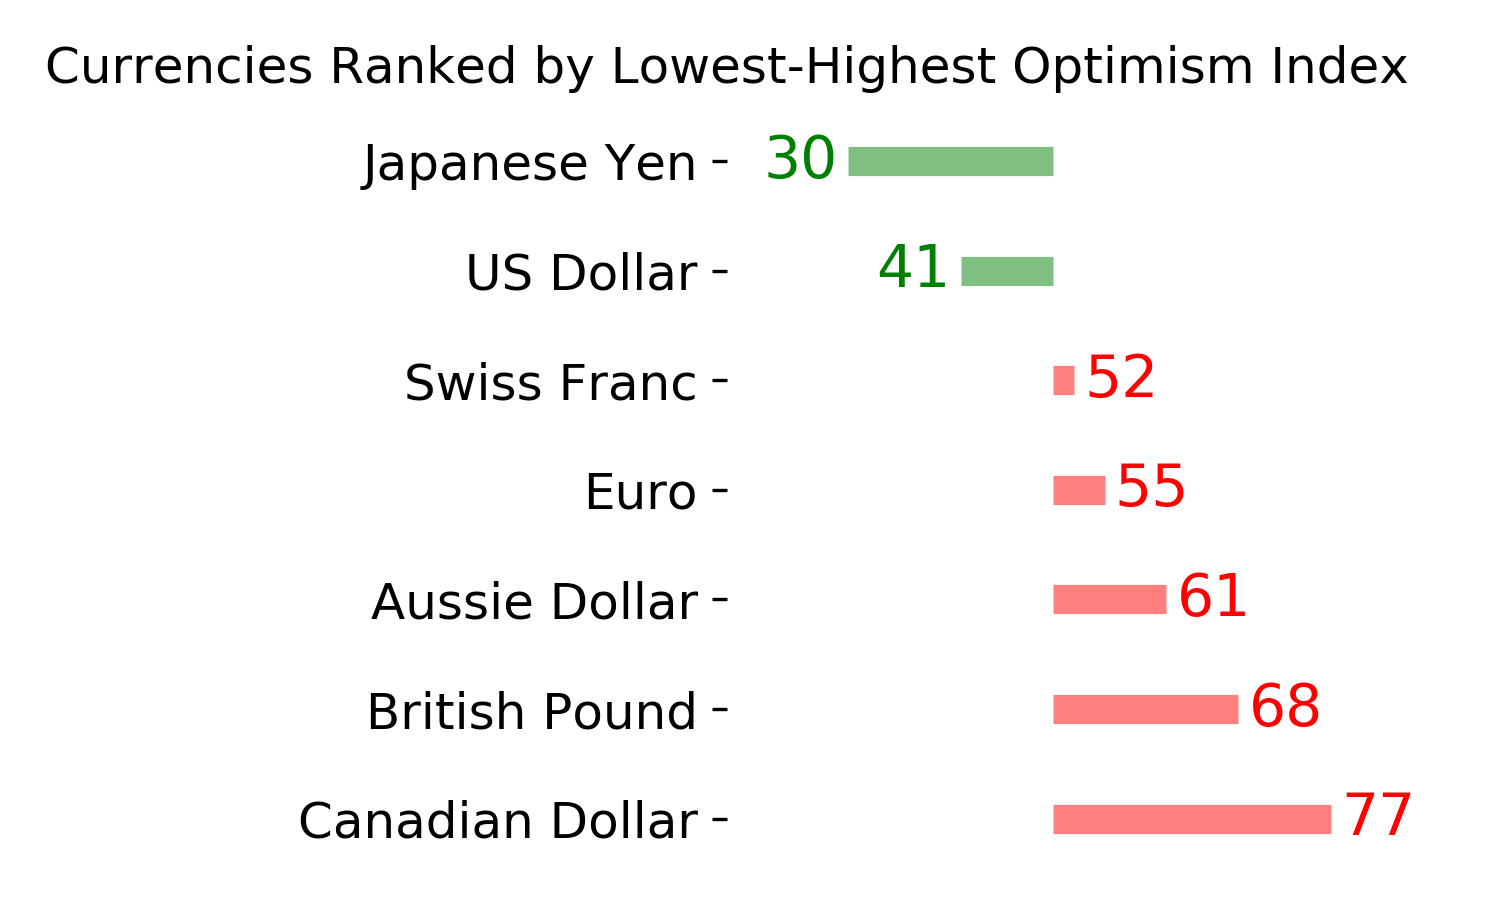
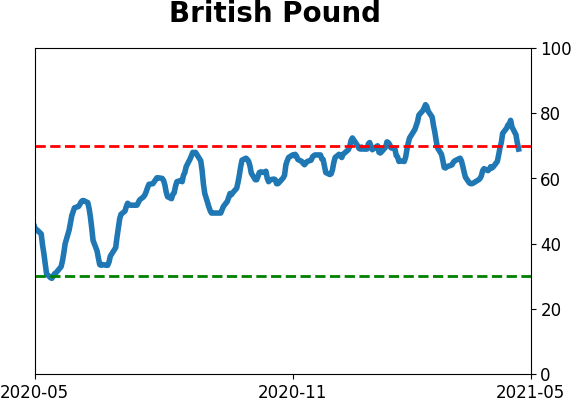
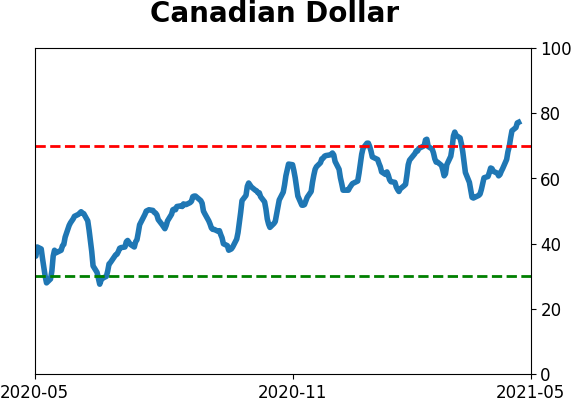
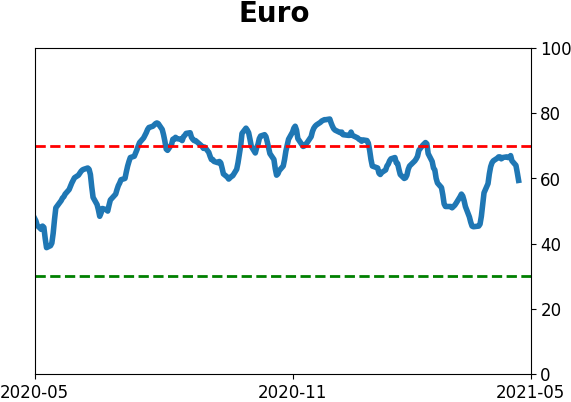
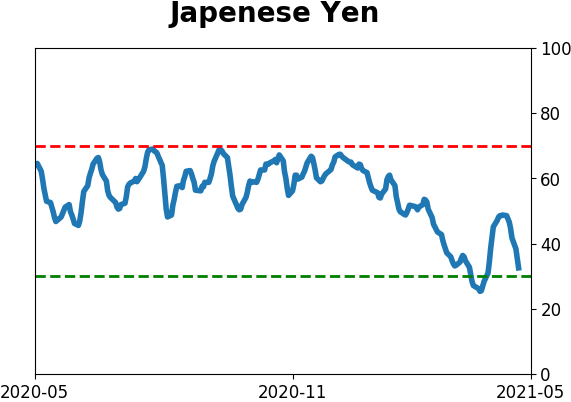
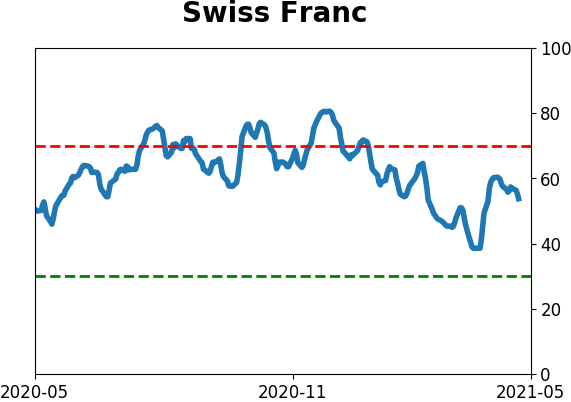
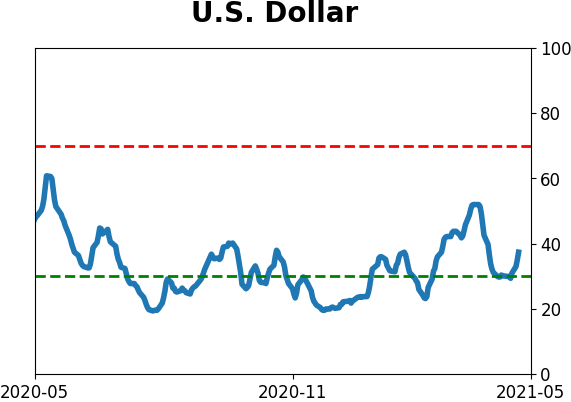
Currency ETF's - 5-Day Moving Average
|
|
|
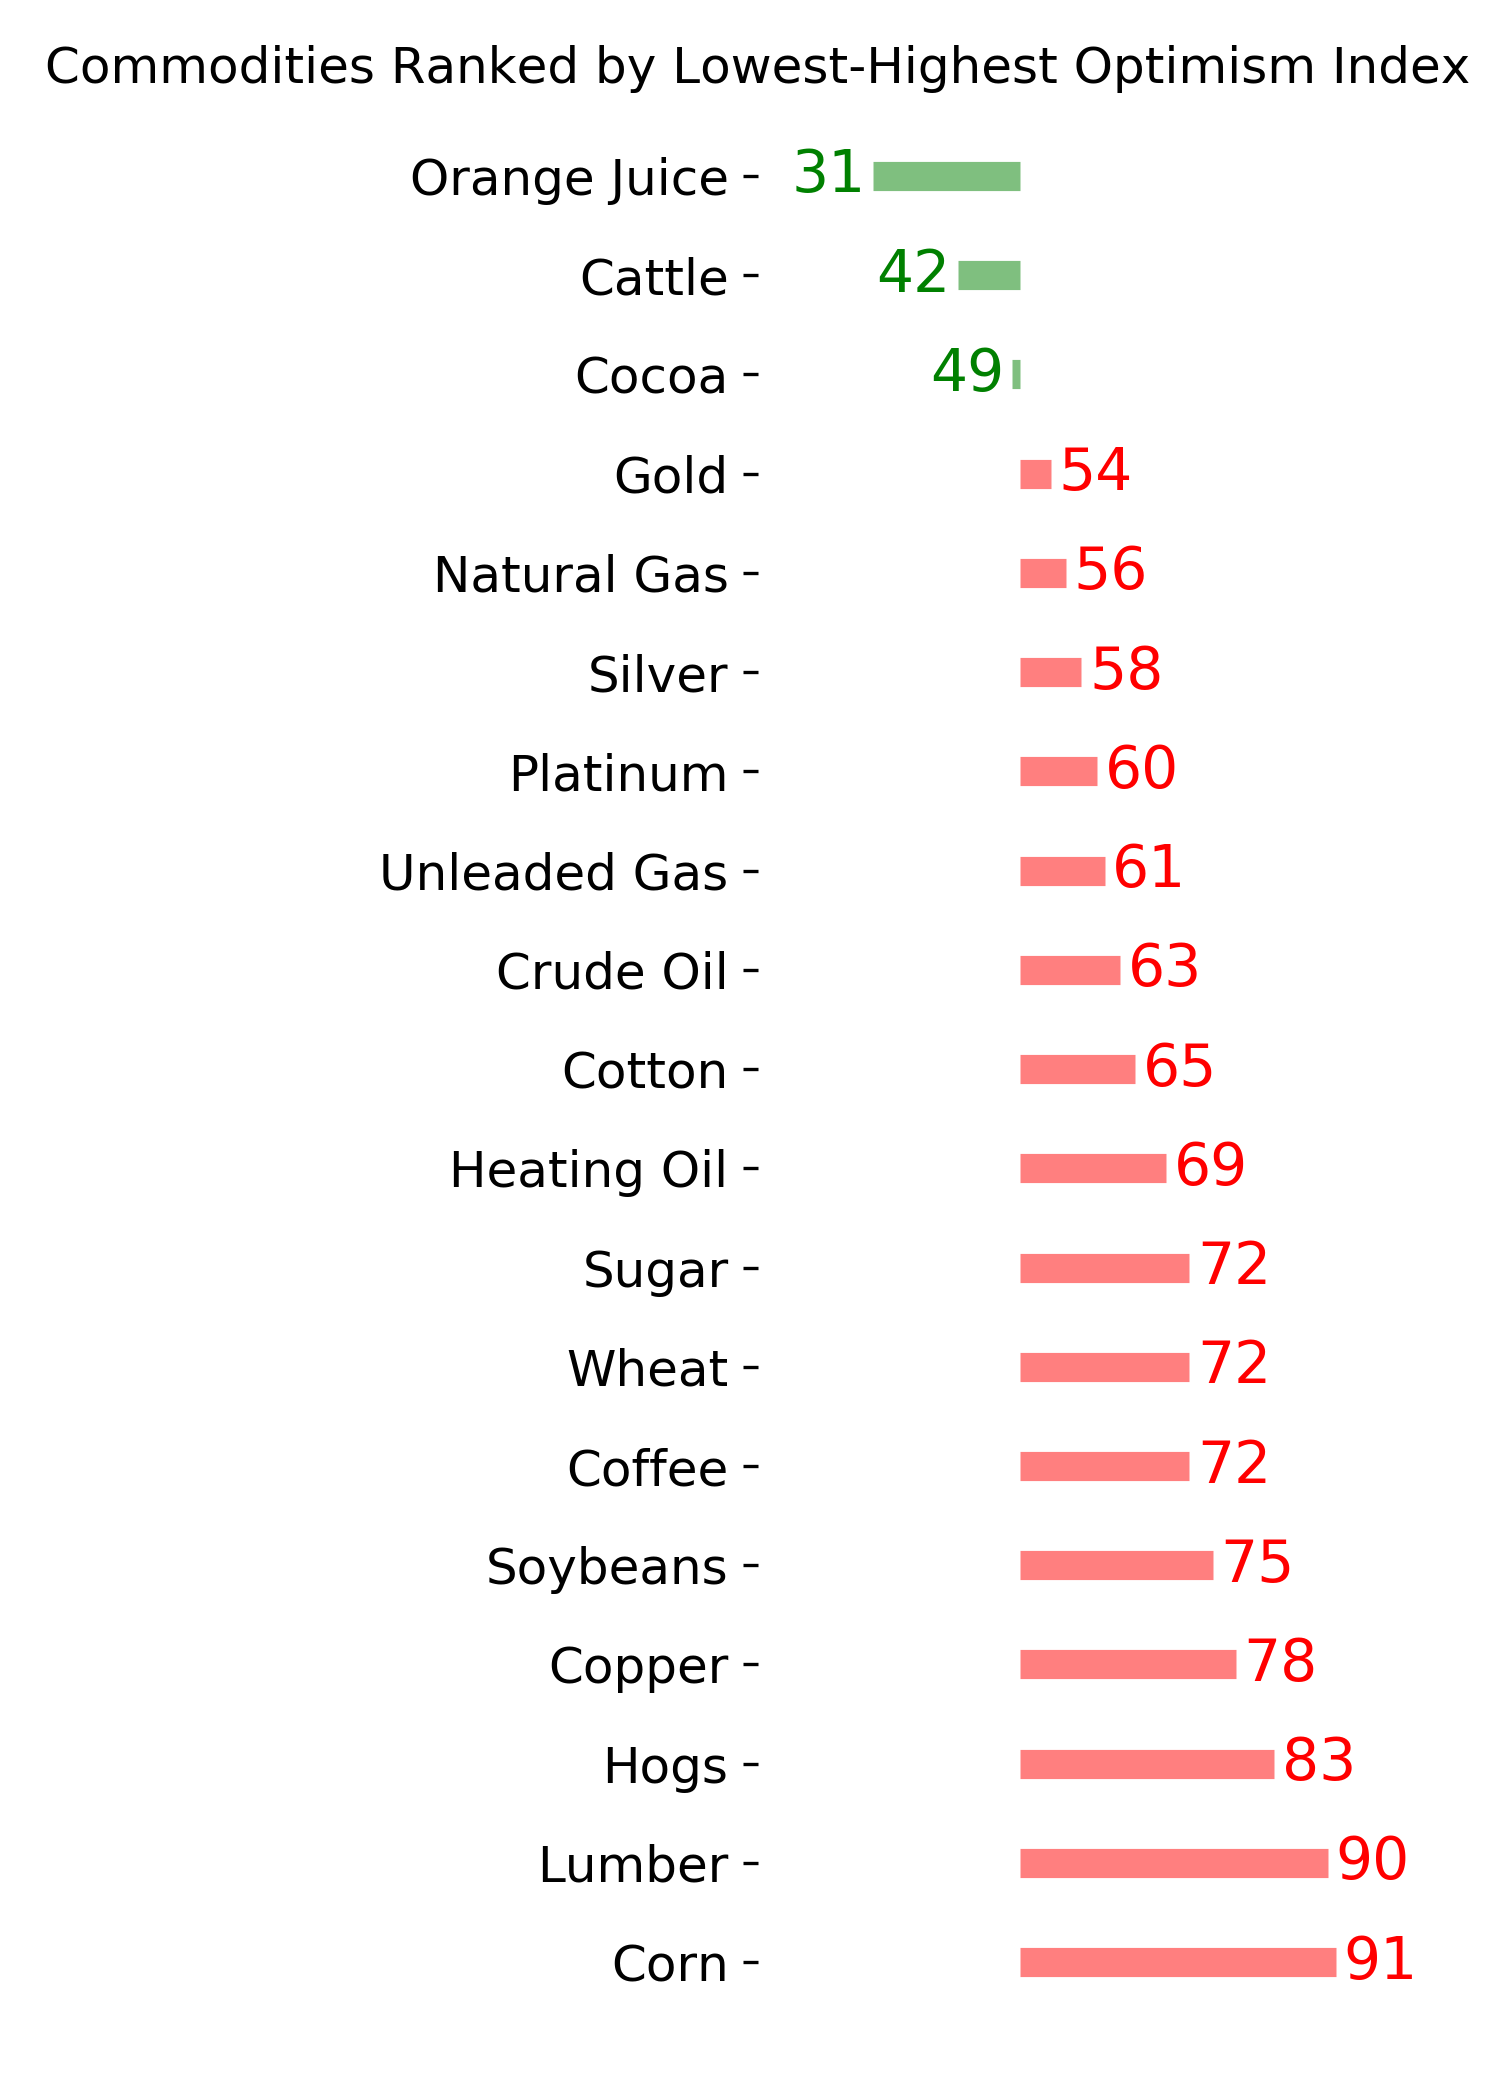
Commodity ETF's - 5-Day Moving Average
|
|