Headlines
|
|
A front-loaded rally as gains peter out:
In the 30 days that stocks have rallied from the March low, gains have been large - historic, even. But almost all of them came during the first 15 days of the rally. In the second 15 days, the S&P 500 has made barely any progress. That raises the potential that buyers have become exhausted. Historically, front-loaded rallies have not performed worse than ones that were more back-loaded.
Gold miners soar while financials slide:
Gold mining stocks have soared relative to the broader stock market, with the NYSE Arca Gold Miner index reaching new 52-week highs relative to the S&P 500. At the same time, the S&P 500 Financials index has slid close to a 52-week low. That kind of divergence seems like it should be an ominous sign, but its record has been mixed over the past 35 years.
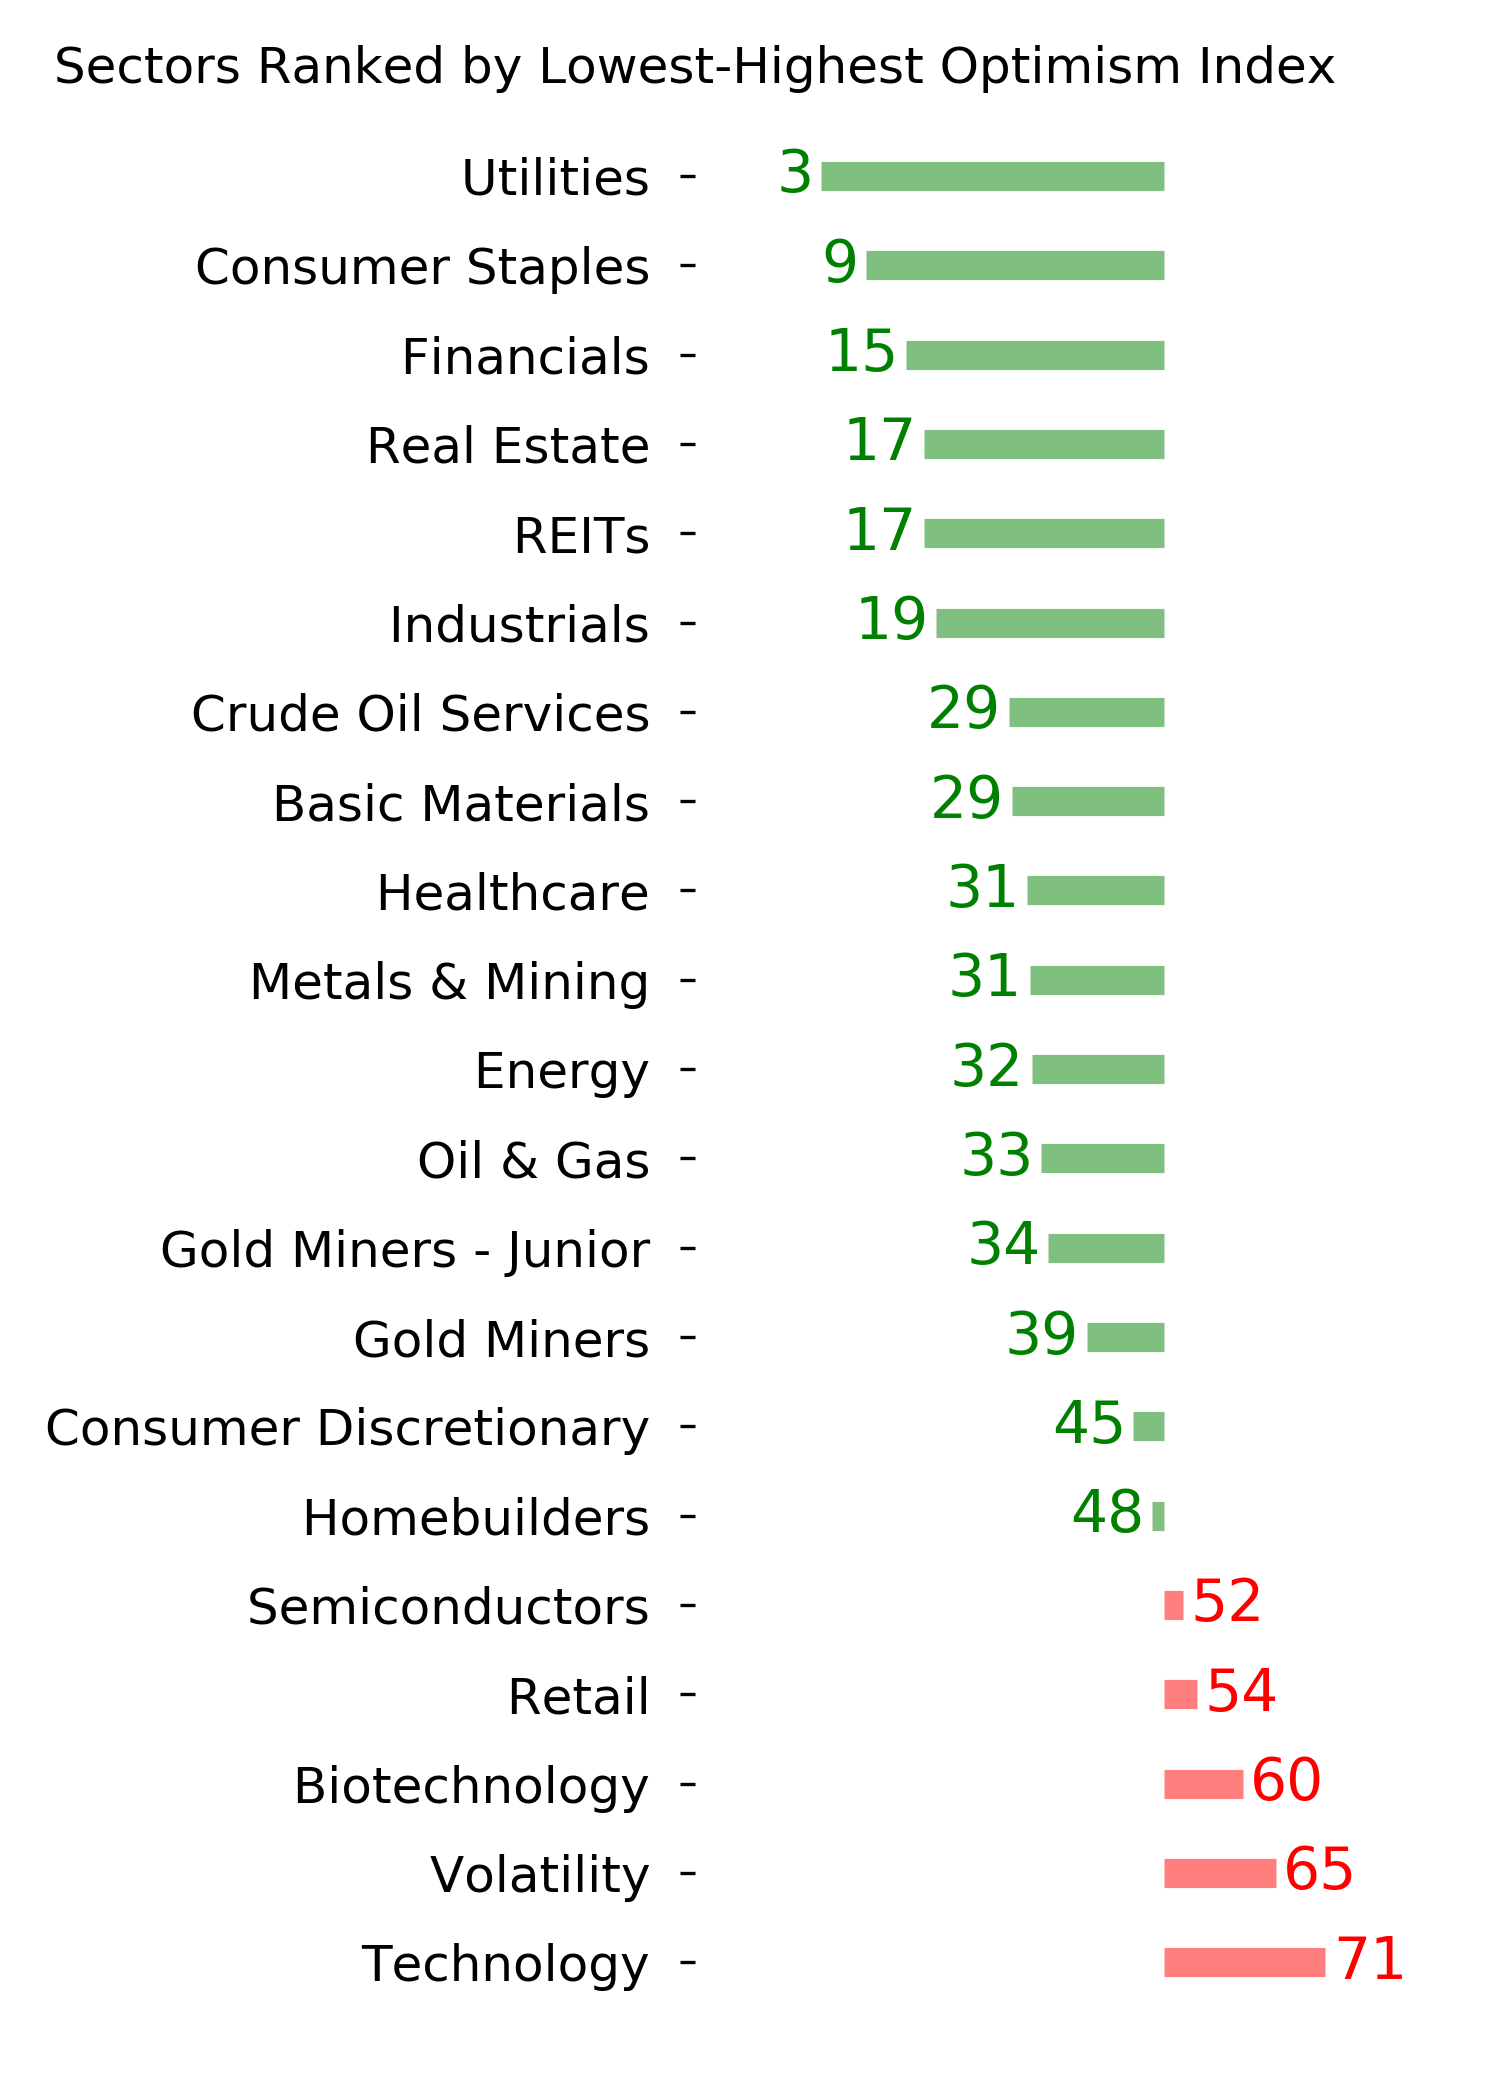
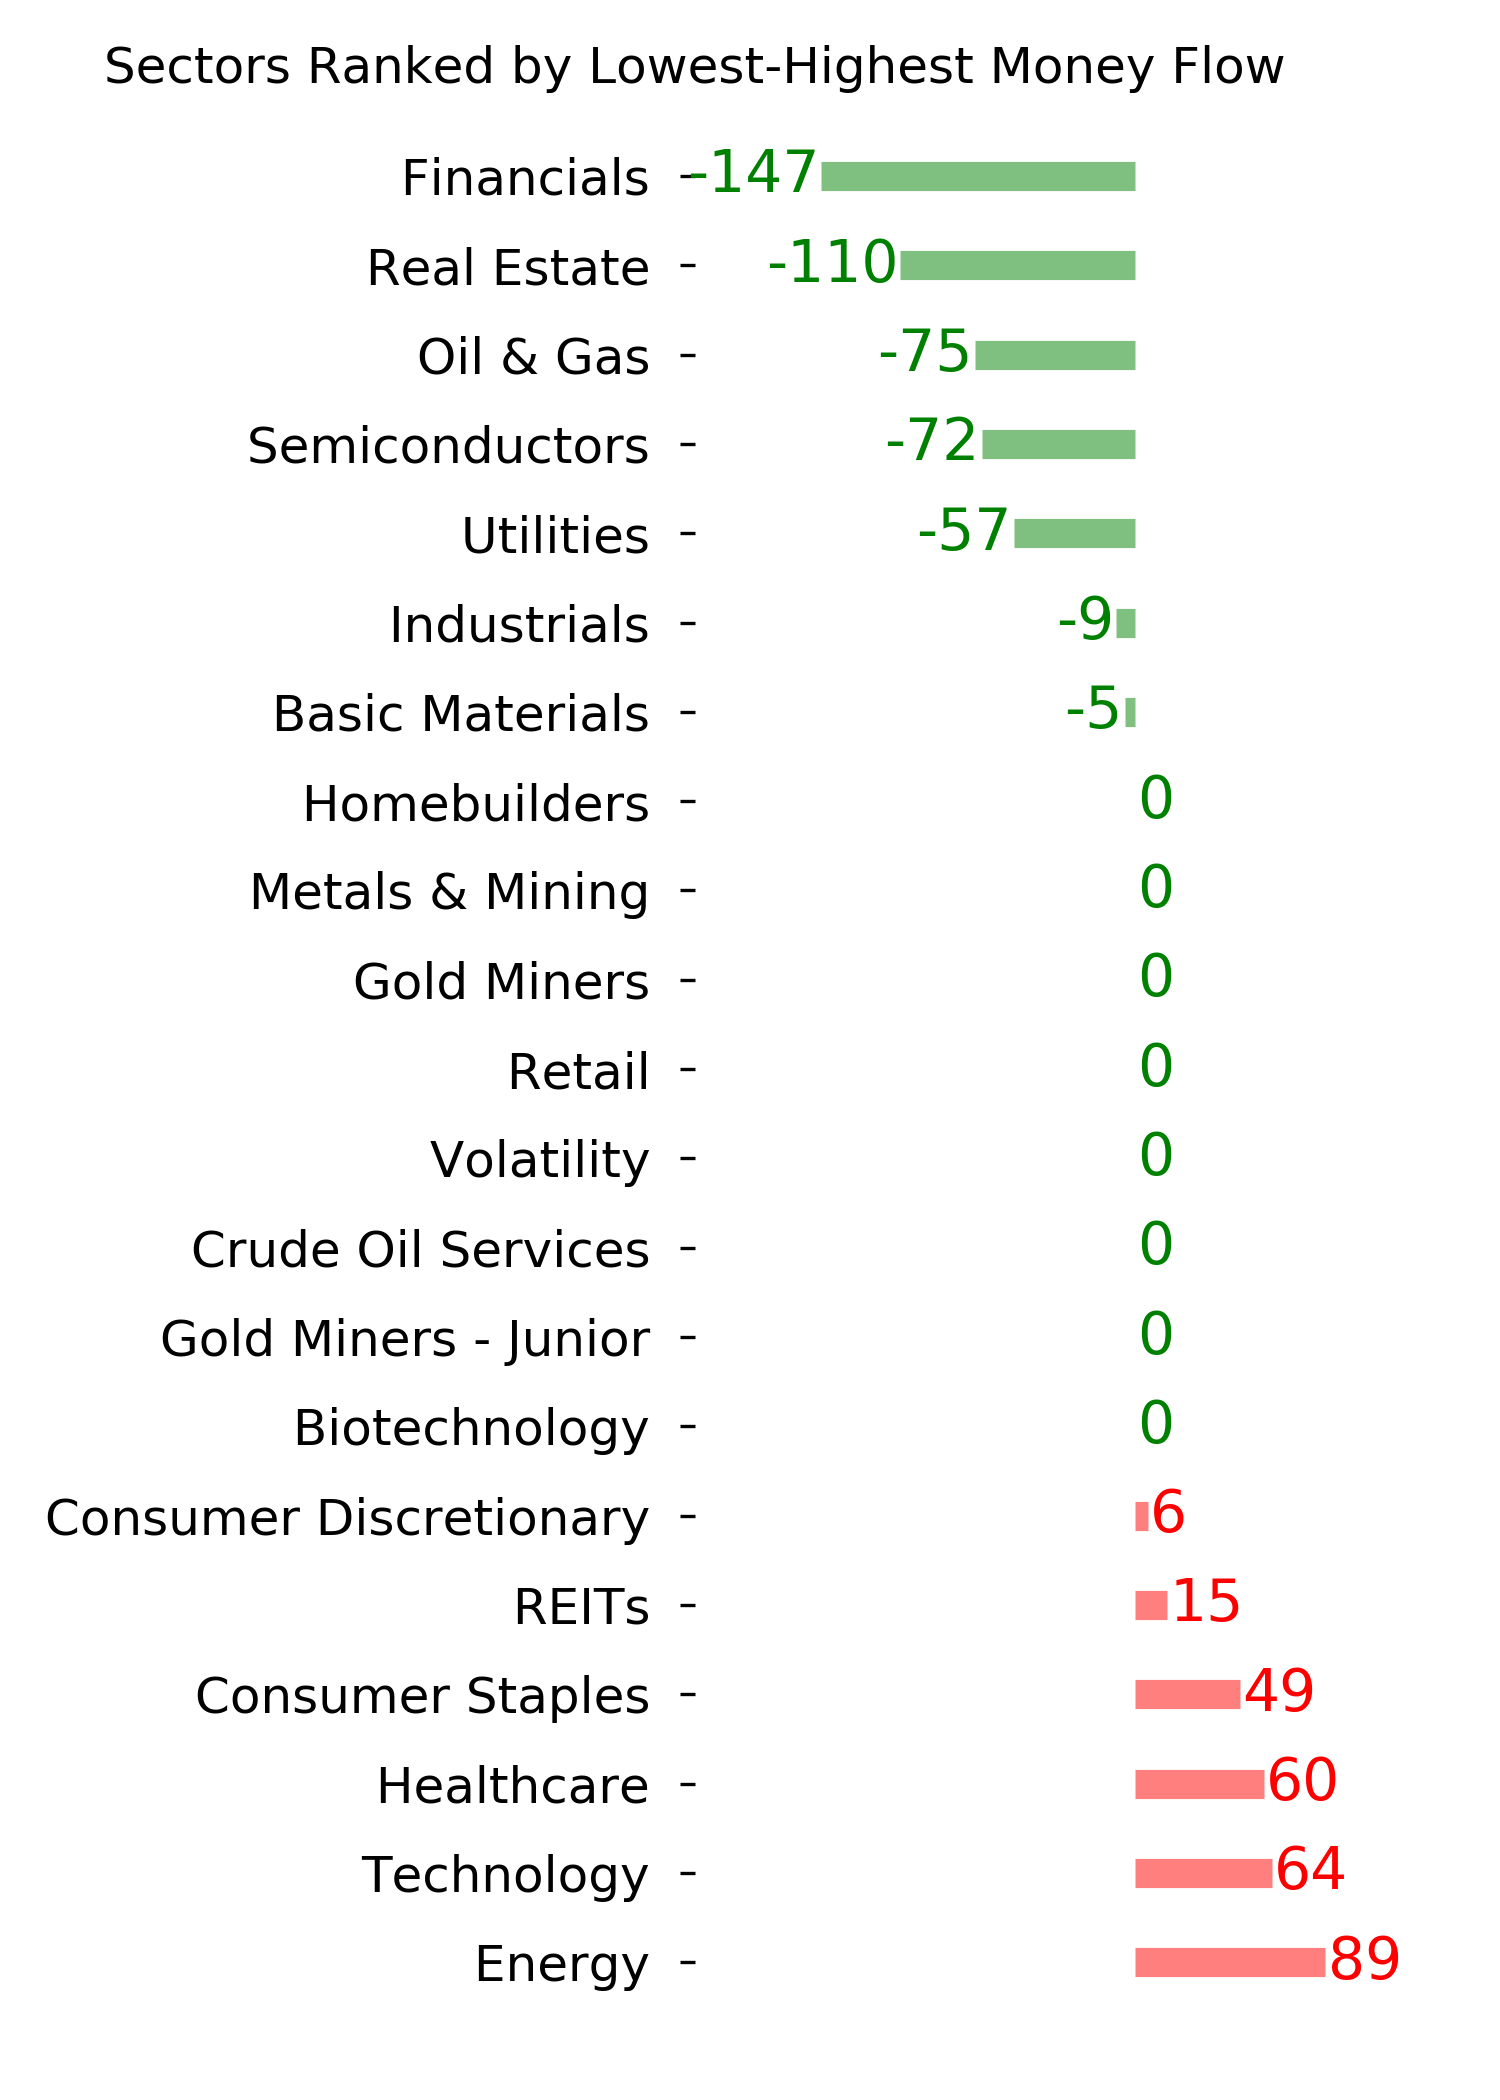
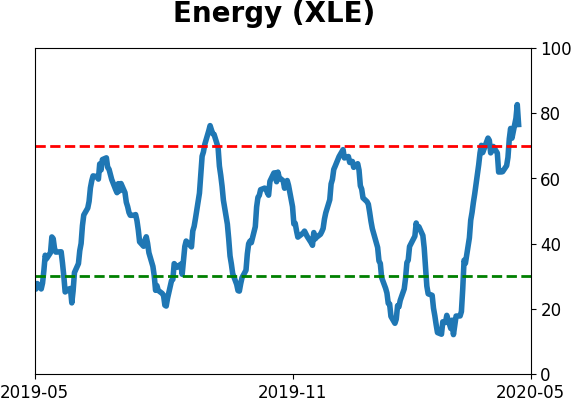
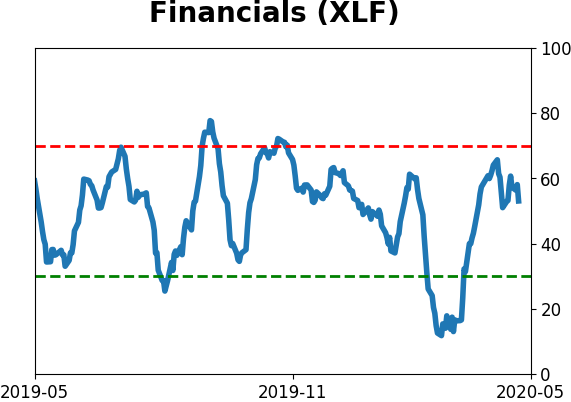
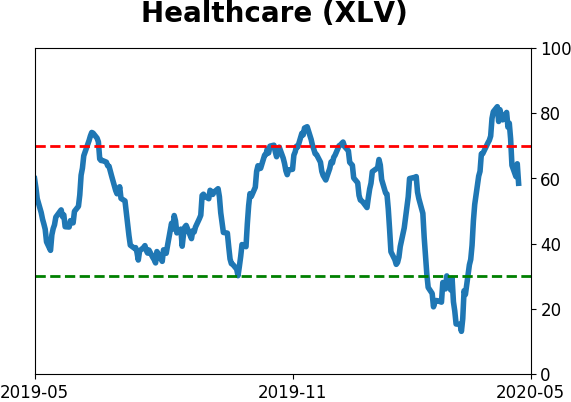
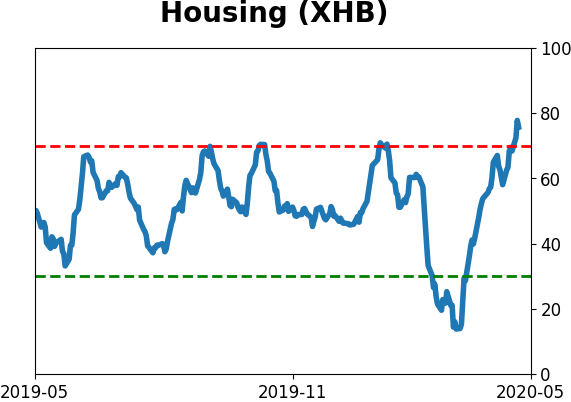
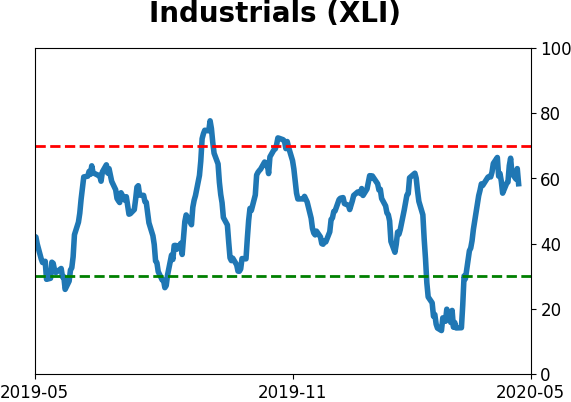
Extended sectors: Optimism on an increasing number of sectors has become extended. The 10-day Optimism Index on the popular energy fund, XLE, has crossed above 80 as Troy mentioned in a premium note. According to the Backtest Engine, there have been 12 days since 1999 when it was this high, and two weeks later XLE added to its gains only 1 time (and that was by 0.3%). Even after backing off on Wednesday, it has usually taken more time for sector optimism like this to wear off.
|
Smart / Dumb Money Confidence
|
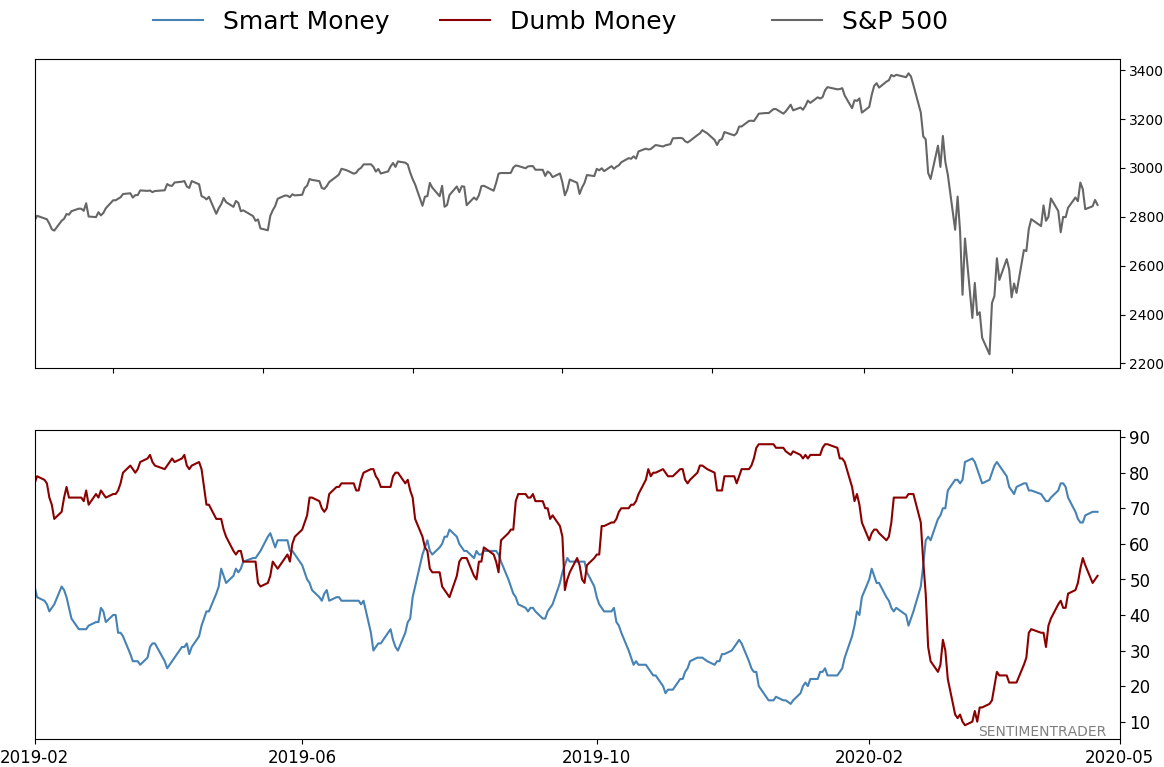
Smart Money Confidence: 69%
Dumb Money Confidence: 51%
|
|
Risk Levels
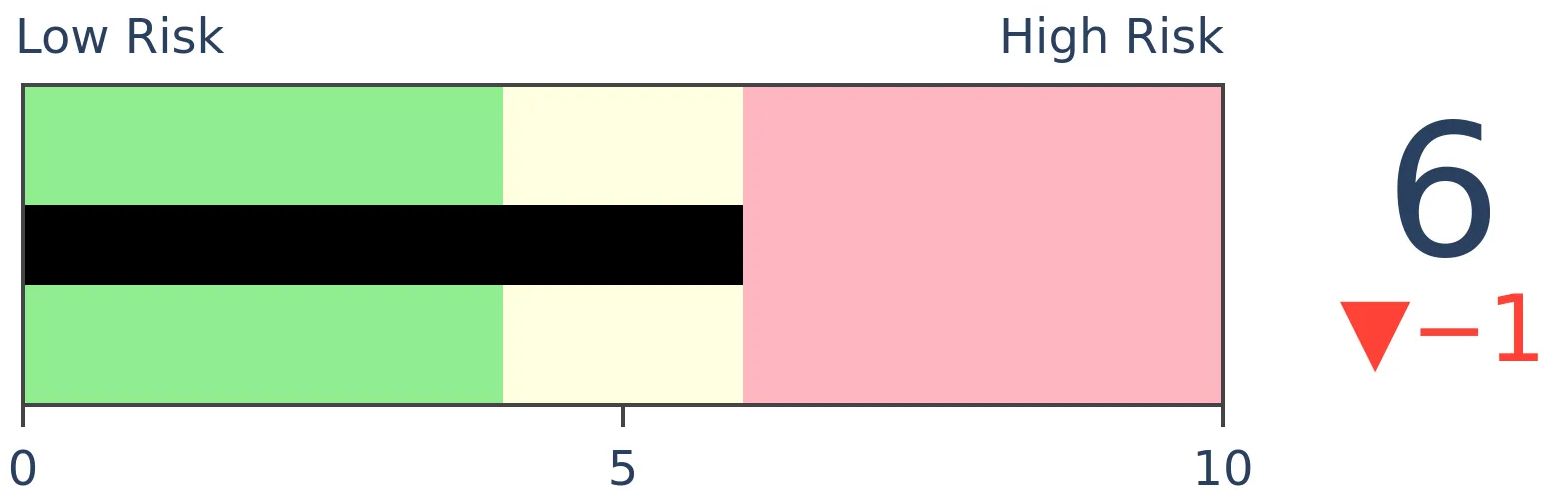
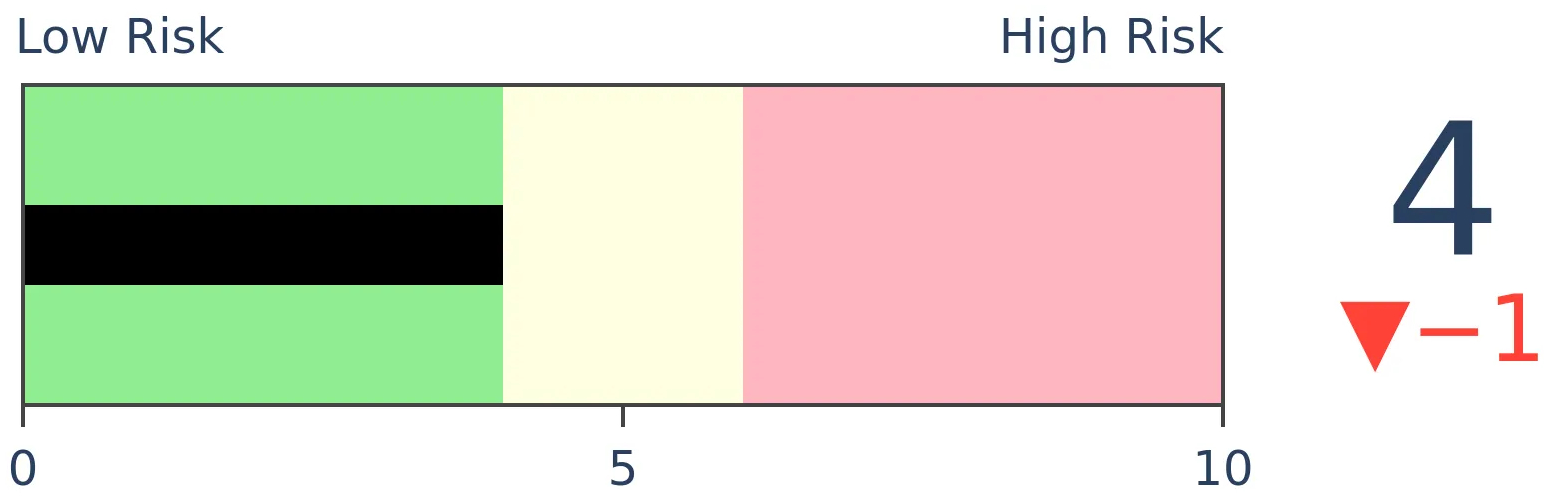
Stocks Short-Term
|
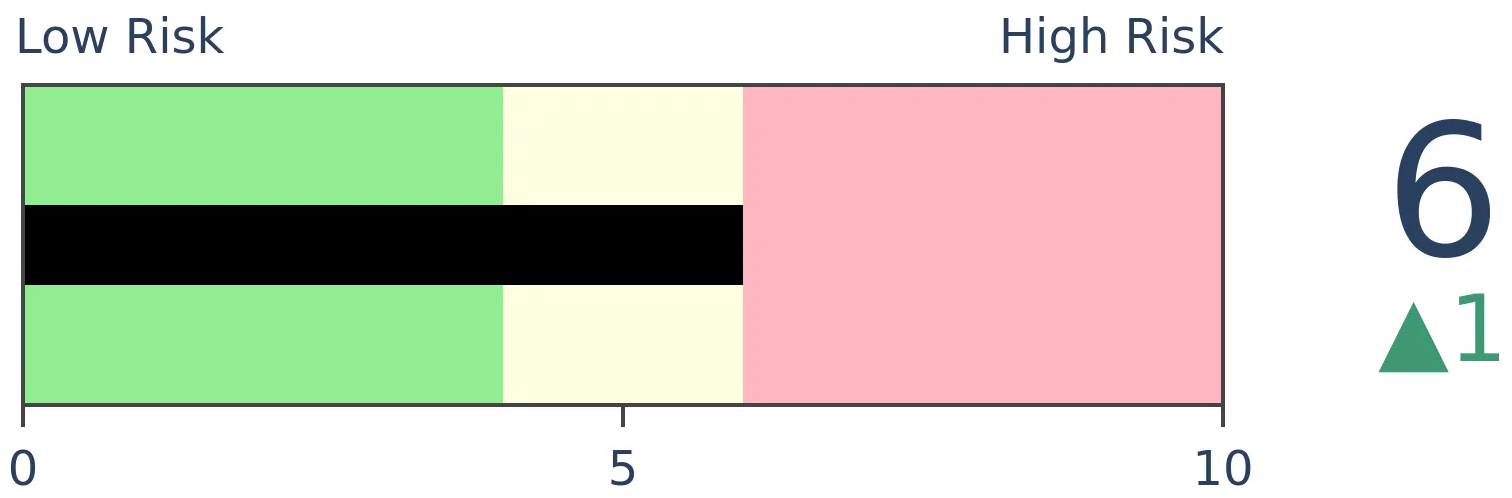
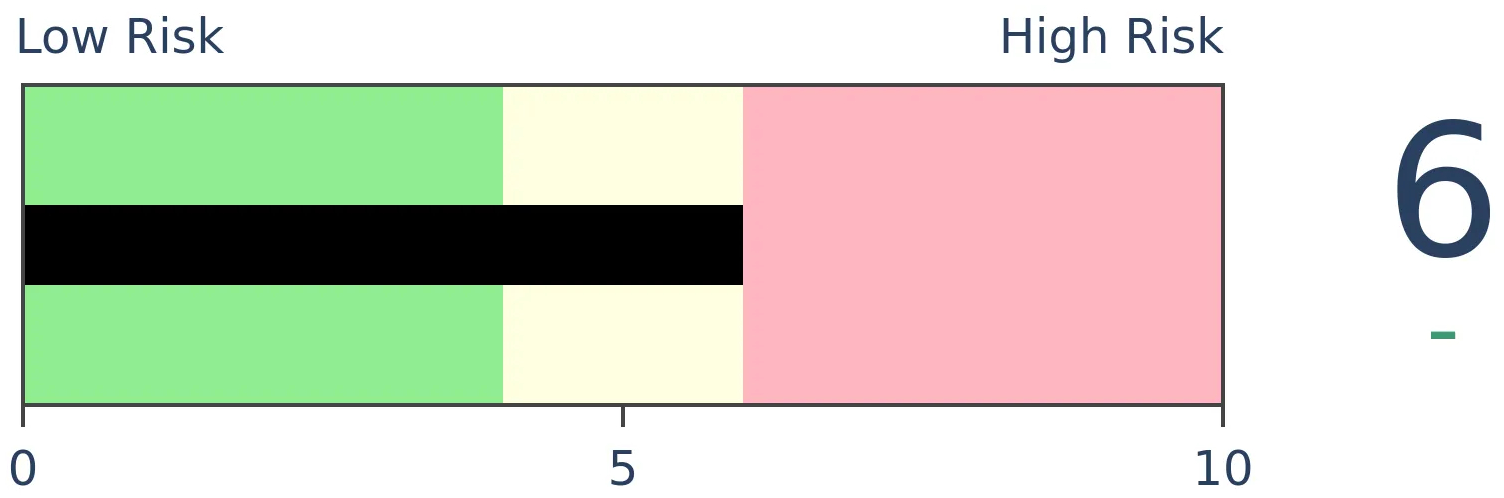
Stocks Medium-Term
|
|
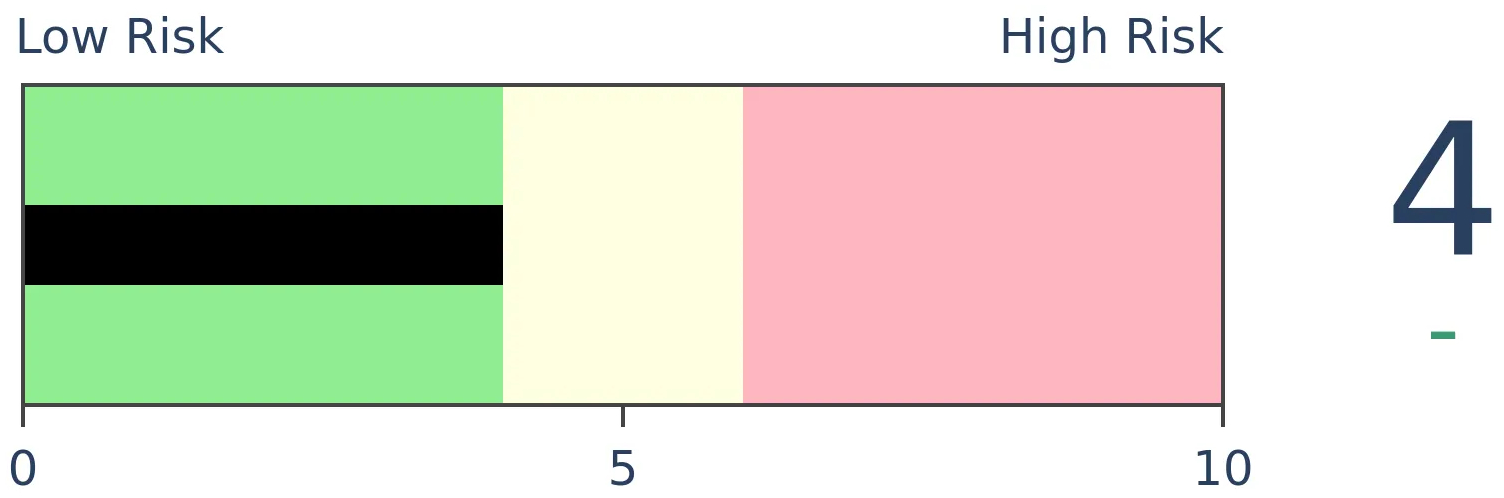
Bonds
|
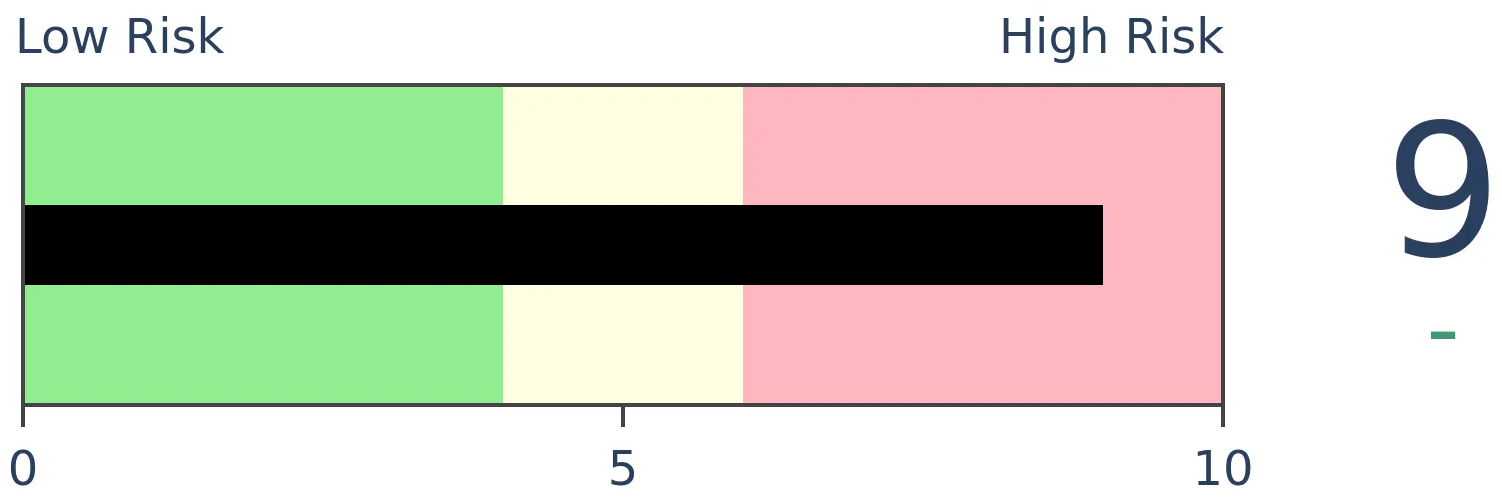
Crude Oil
|
|
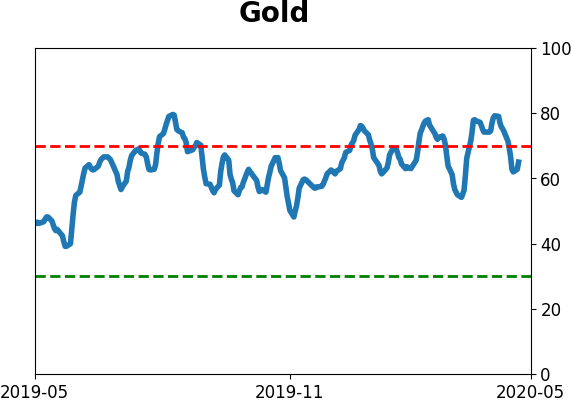
Gold
|
Agriculture
|
|
Research
BOTTOM LINE
In the 30 days that stocks have rallied from the March low, gains have been large - historic, even. But almost all of them came during the first 15 days of the rally. In the second 15 days, the S&P 500 has made barely any progress. That raises the potential that buyers have become exhausted. Historically, front-loaded rallies have not performed worse than ones that were more back-loaded.
FORECAST / TIMEFRAME
None
|
Since stocks bottomed on March 23, they've shown impressive gains. After 30 days, the S&P 500 was still showing a gain of nearly 30% from its lows.
The trouble (maybe) is that that the rally has been so front-loaded. The first 15 days of the 30-day rally generated virtually all of the gains. While the second 15 days have shown a gain, it was barely positive.
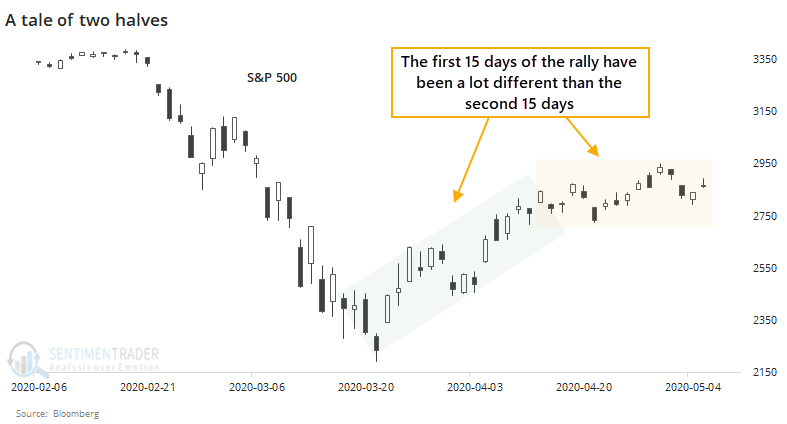
No matter what markets do, there are always boo-birds suggesting that things will fall apart. They're using this first-half, back-half argument now to spin the idea that buyers have run out of juice and we're about to roll over.
So, let's check.
We'll go back to 1928 and look for every time the S&P 500 set a 52-week low, then rallied for 30 days. The gain during the first 15 days of the rally must be at least 3 times greater than the gain during the second 15 days.
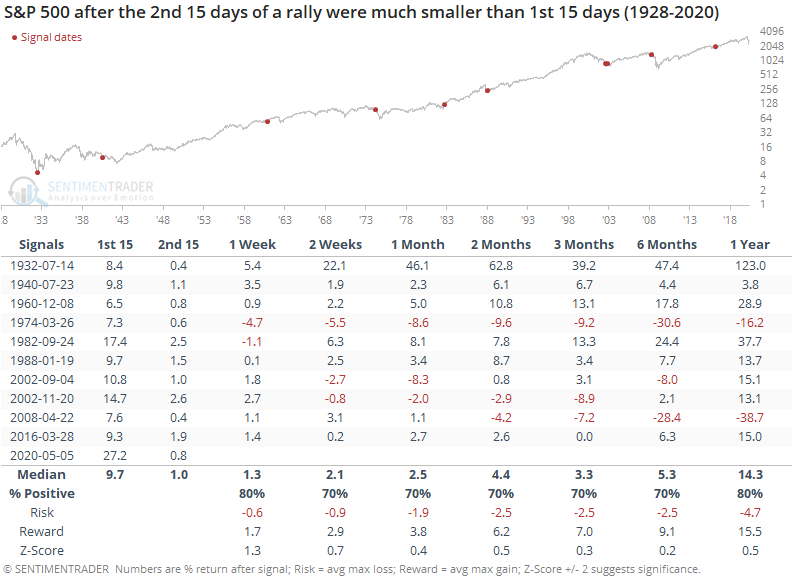
Returns were okay most of the time, but there were two big losers over the next 6-12 months. If the S&P fell back and showed a loss or only a small gain over the next month or so, then that weakness tended to bleed over into longer-term returns as well. Part of that makes sense because the one-year returns include returns during the first month, but there was a long-term difference between the rallies that saw renewed buying interest over the next month and those that didn't.
Now let's look at those 30-day rallies off a low when the second 15 days were more comparable to the first 15 days.

It's rare to see bigger gains in the second half of a 30-day rally than the first half. And even when we did, it didn't really matter, at least across most time frames.
Over the next two months, the rallies with a weak back half tended to do quite a bit better than the rallies with a more robust second half. The biggest difference was a year later when the rallies with a strong second 15 days averaged nearly 22% and had only a single loss (though that loss was large, from 2001).
Overall, there isn't anything in the pattern to suggest an investor should become more defensive just because the gains have petered out. The biggest caveat would be that if we do roll over from here and show losses over the next 1-2 months, it would usher in some of the more unpleasant longer-term precedents.
BOTTOM LINE
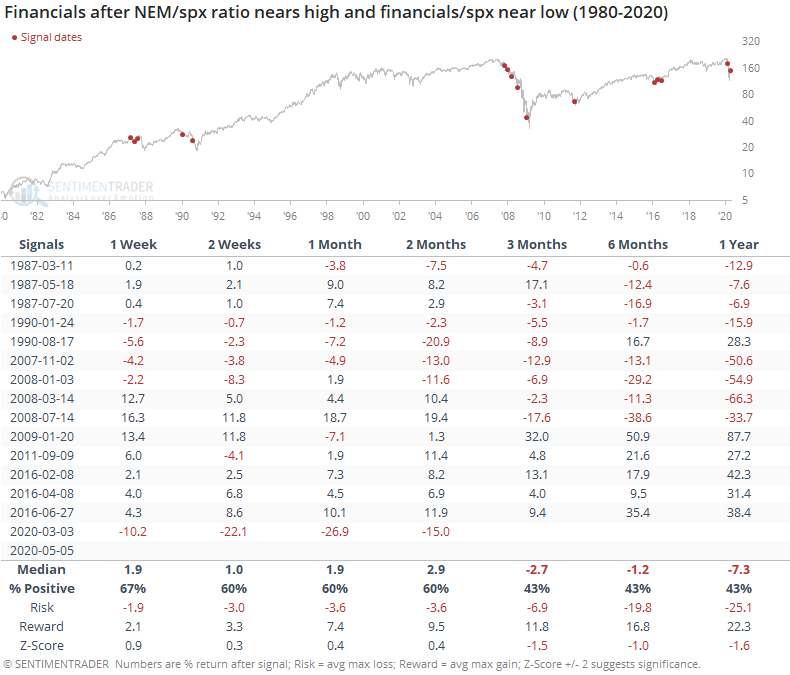
Gold mining stocks have soared relative to the broader stock market, with the NYSE Arca Gold Miner index reaching new 52-week highs relative to the S&P 500. At the same time, the S&P 500 Financials index has slid close to a 52-week low. That kind of divergence seems like it should be an ominous sign, but its record has been mixed over the past 35 years.
FORECAST / TIMEFRAME
None
|
Lately, gold has been holding up and gold mining stocks have been rocketing higher. At the same time, financials have been barely holding water.
Relative to the S&P 500 index, the NYSE Arca Gold Miners index has made consistent new highs, while the S&P 500 Financials index has been mired near its lows.
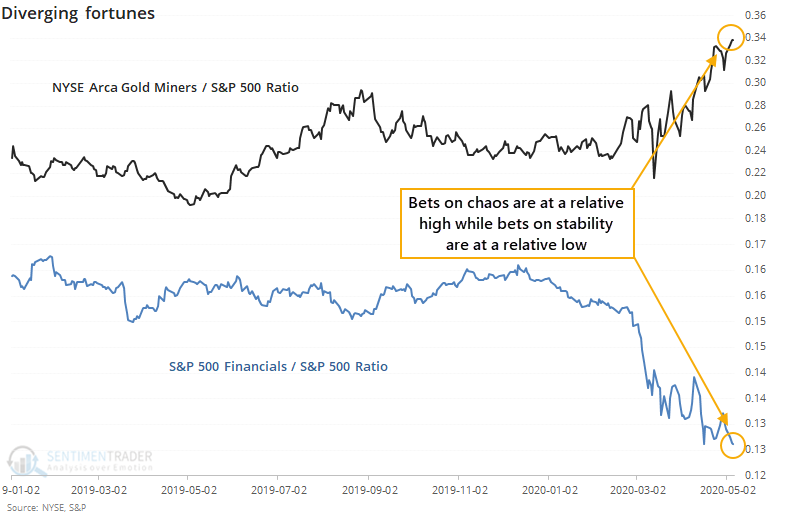
This does not seem like an auspicious setup for the broader market. Bets on gold mining stocks are commonly taken as a bet on general chaos, while bets on financials are a bet on economic growth and stability. The fact that the former is at a new and the latter is at a low seems troubling.
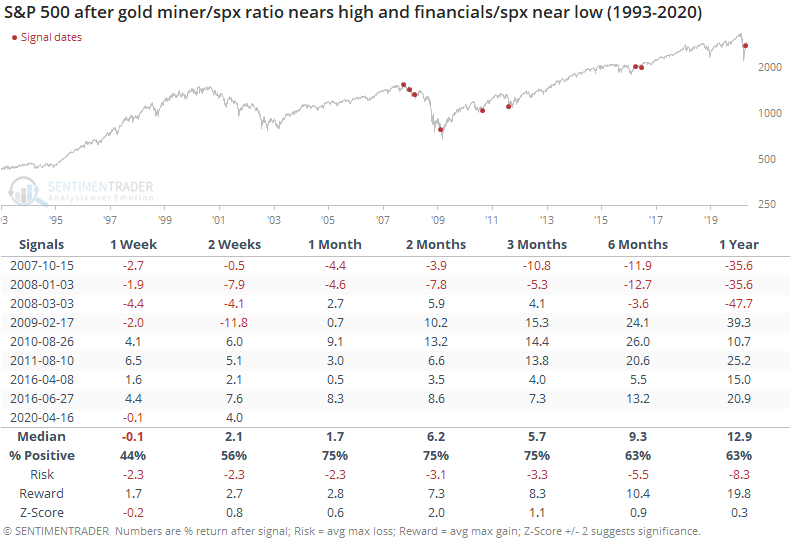
Like a lot of things market-related that sound good in theory, there is maybe a shred of truth in it but overall it's not a consistent factor. When the ratio of gold miners to the S&P was within 0.5% of a 52-week high and financials to the S&P within 0.5% of a 52-week low, it was a major warning in late 2007 - early 2008, but after that, not so much.
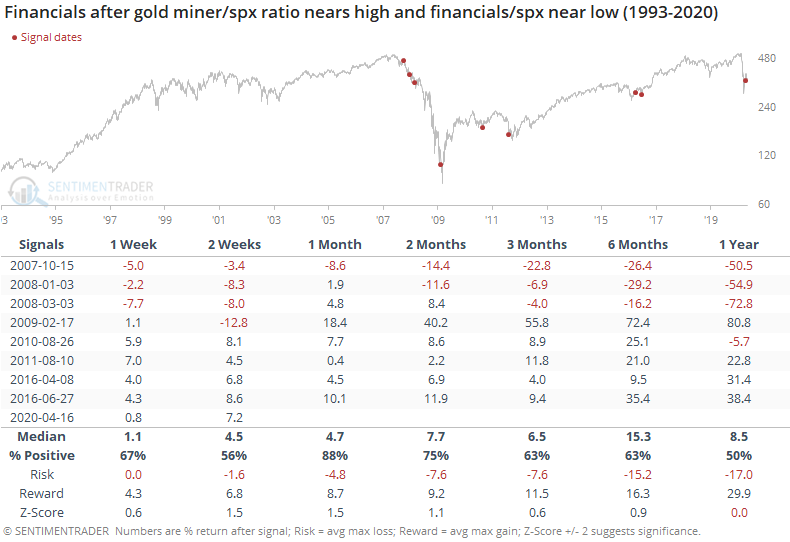
For financials, there was that massive drop in 2008, but gains since then as it triggered near a few medium-term lows.
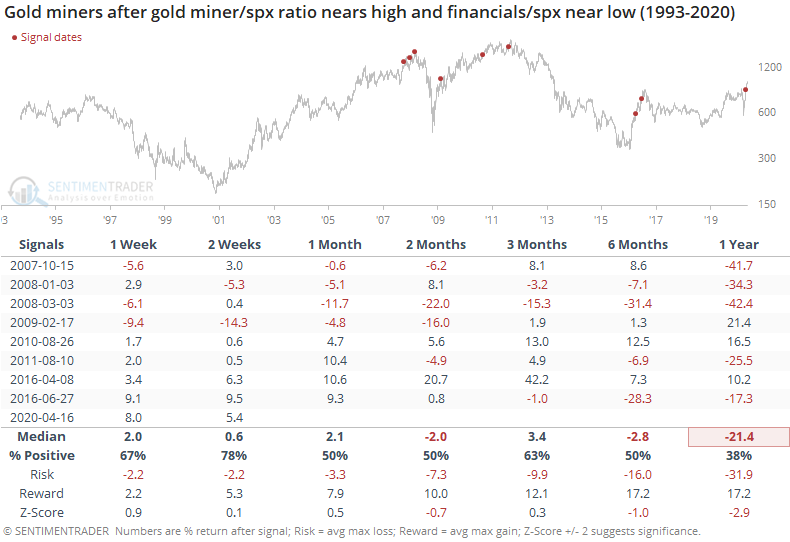
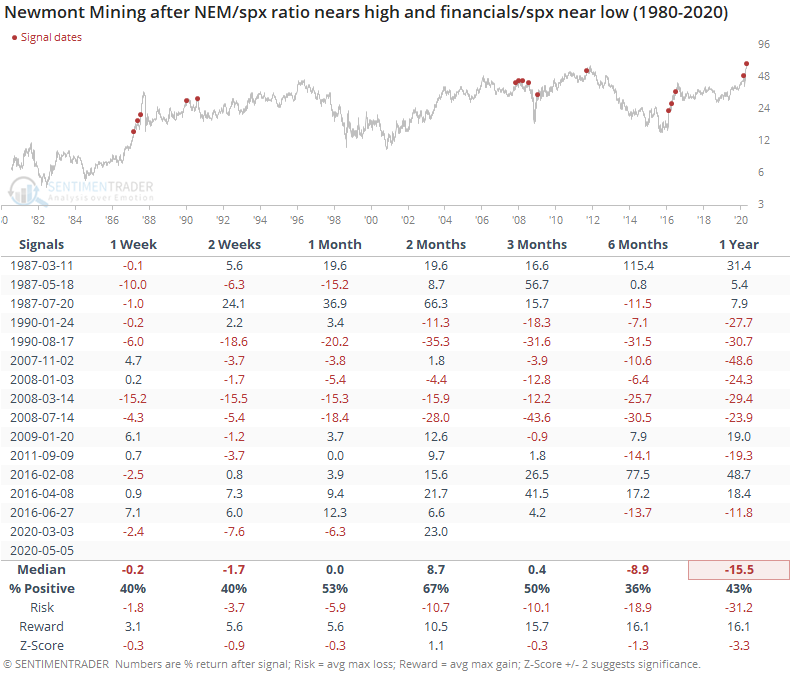
For gold miners, it was inconsistent. The overall trend over the past decade has been down, so longer-term returns were negative. Shorter time frames showed mixed results.
That gold mining index only goes back to 1993, so if we use the largest mining stock with the most history, Newmont Mining, we can get another 13 years of history. That stock has a 0.88 correlation to the NYSE Arca Gold Miner index, so it's a relatively good proxy.

Prior to the last decade or so, the only time period that saw a divergence between the two sectors like this was in 1987 and 1990. Neither one was much of a good sign for stocks, or for financials in particular.
Newmont soared in 1987 but then fell back after the 1990 signals.
Overall, the divergence in fortunes between gold miners and financials seems like a major warning for the broader market going forward. Historically, though, the evidence is mixed. It was an effective yellow flag up to the past decade but has triggered several times since then with no ill effects.
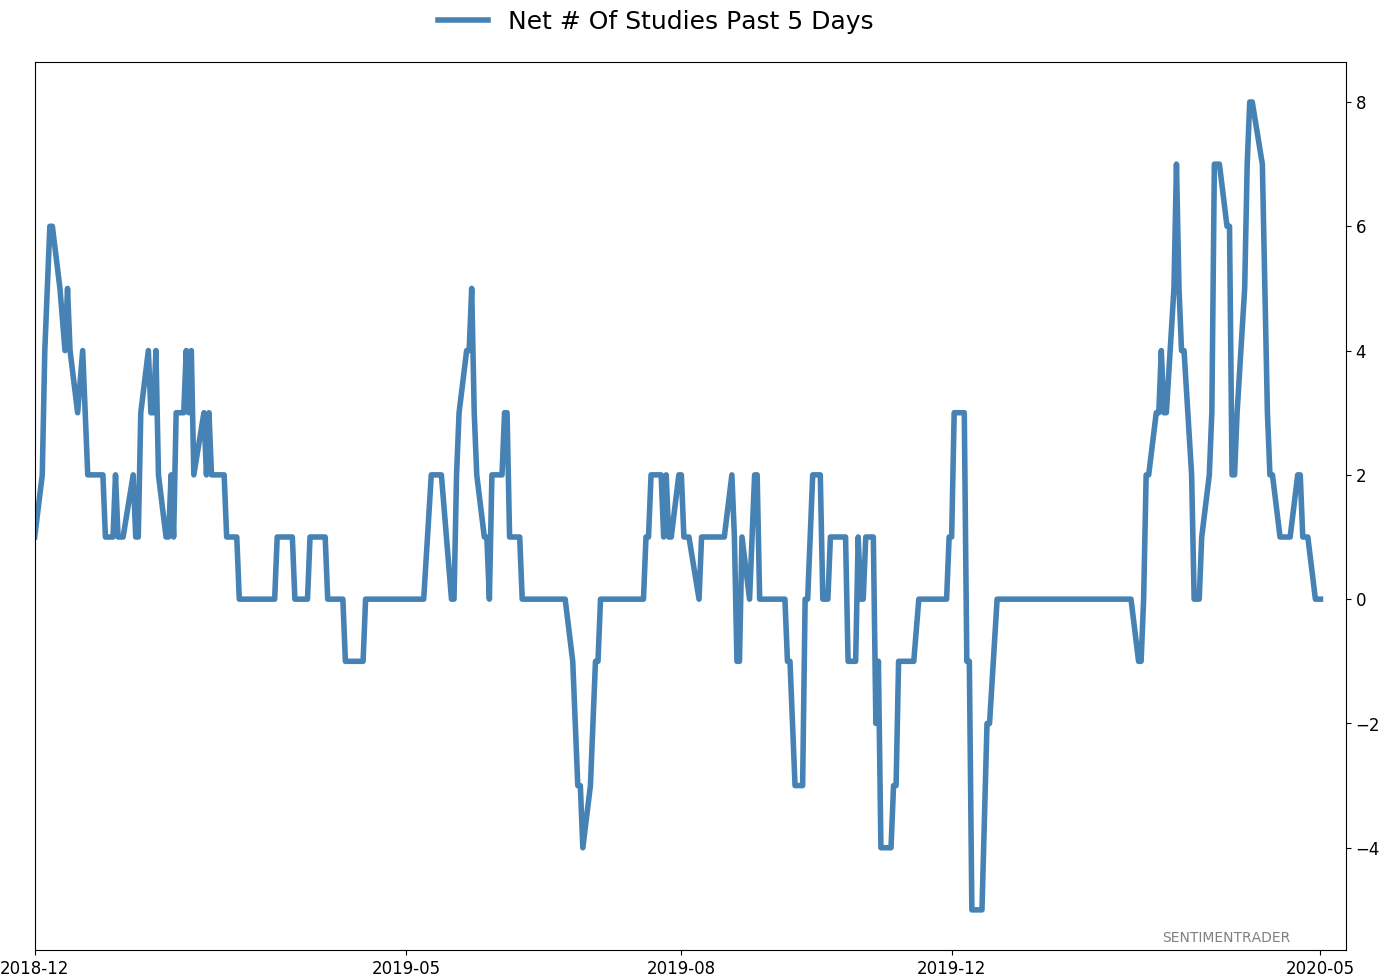
Active Studies
| Time Frame | Bullish | Bearish | | Short-Term | 0 | 6 | | Medium-Term | 12 | 0 | | Long-Term | 37 | 3 |
|
Indicators at Extremes
Portfolio
| Position | Weight % | Added / Reduced | Date | | Stocks | 49.9 | Reduced 10.3% | 2020-04-23 | | Bonds | 0.0 | Reduced 6.7% | 2020-02-28 | | Commodities | 5.1 | Added 2.4%
| 2020-02-28 | | Precious Metals | 0.0 | Reduced 3.6% | 2020-02-28 | | Special Situations | 0.0 | Reduced 31.9% | 2020-03-17 | | Cash | 45.0 | | |
|
Updates (Changes made today are underlined)
In the first months of the year, we saw manic trading activity. From big jumps in specific stocks to historic highs in retail trading activity to record highs in household confidence to almost unbelievable confidence among options traders. All of that came amid a market where the average stock couldn't keep up with their indexes. There were signs of waning momentum in stocks underlying the major averages, which started triggering technical warning signs in late January. The kinds of extremes we saw in December and January typically take months to wear away, but the type of selling in March went a long way toward getting there. When we place the kind of moves we saw into March 23 into the context of coming off an all-time high, there has been a high probability of a multi-month rebound. After stocks bottomed on the 23rd, they enjoyed a historic buying thrust and retraced a larger amount of the decline than "just a bear market rally" tends to. While other signs are mixed that panic is subsiding, those thrusts are the most encouraging sign we've seen in years. Shorter-term, there have been some warning signs popping up and our studies have stopped showing as positively skewed returns. I reduced my exposure some in late April and will consider further reducing it if we start to see some lower highs and lower lows. Long-term suggestions from the studies remain robust, but shorter-term ones are significantly less so, and stocks still have to prove that we're in something other than a protracted, recessionary bear market.
RETURN YTD: -9.7% 2019: 12.6%, 2018: 0.6%, 2017: 3.8%, 2016: 17.1%, 2015: 9.2%, 2014: 14.5%, 2013: 2.2%, 2012: 10.8%, 2011: 16.5%, 2010: 15.3%, 2009: 23.9%, 2008: 16.2%, 2007: 7.8%
|
|
Phase Table
Ranks
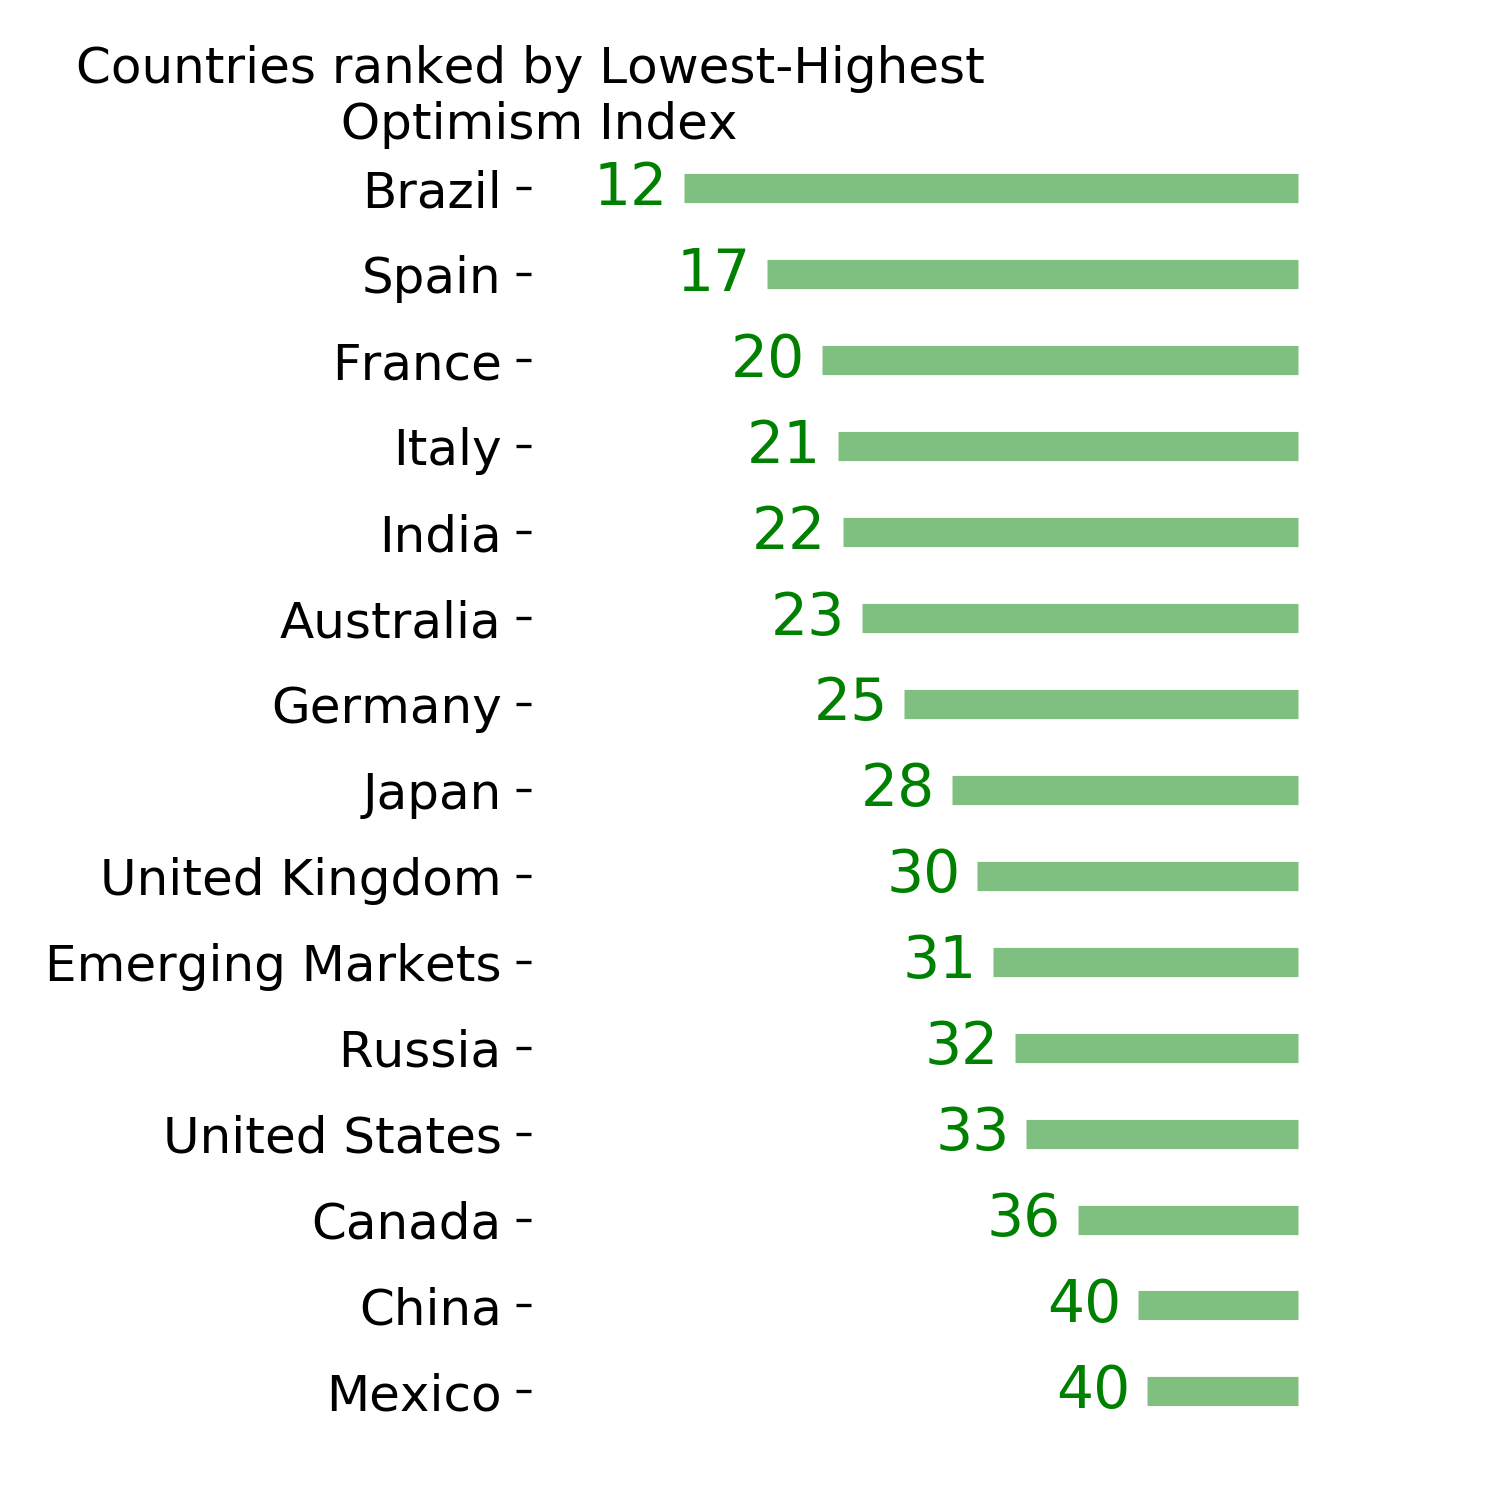
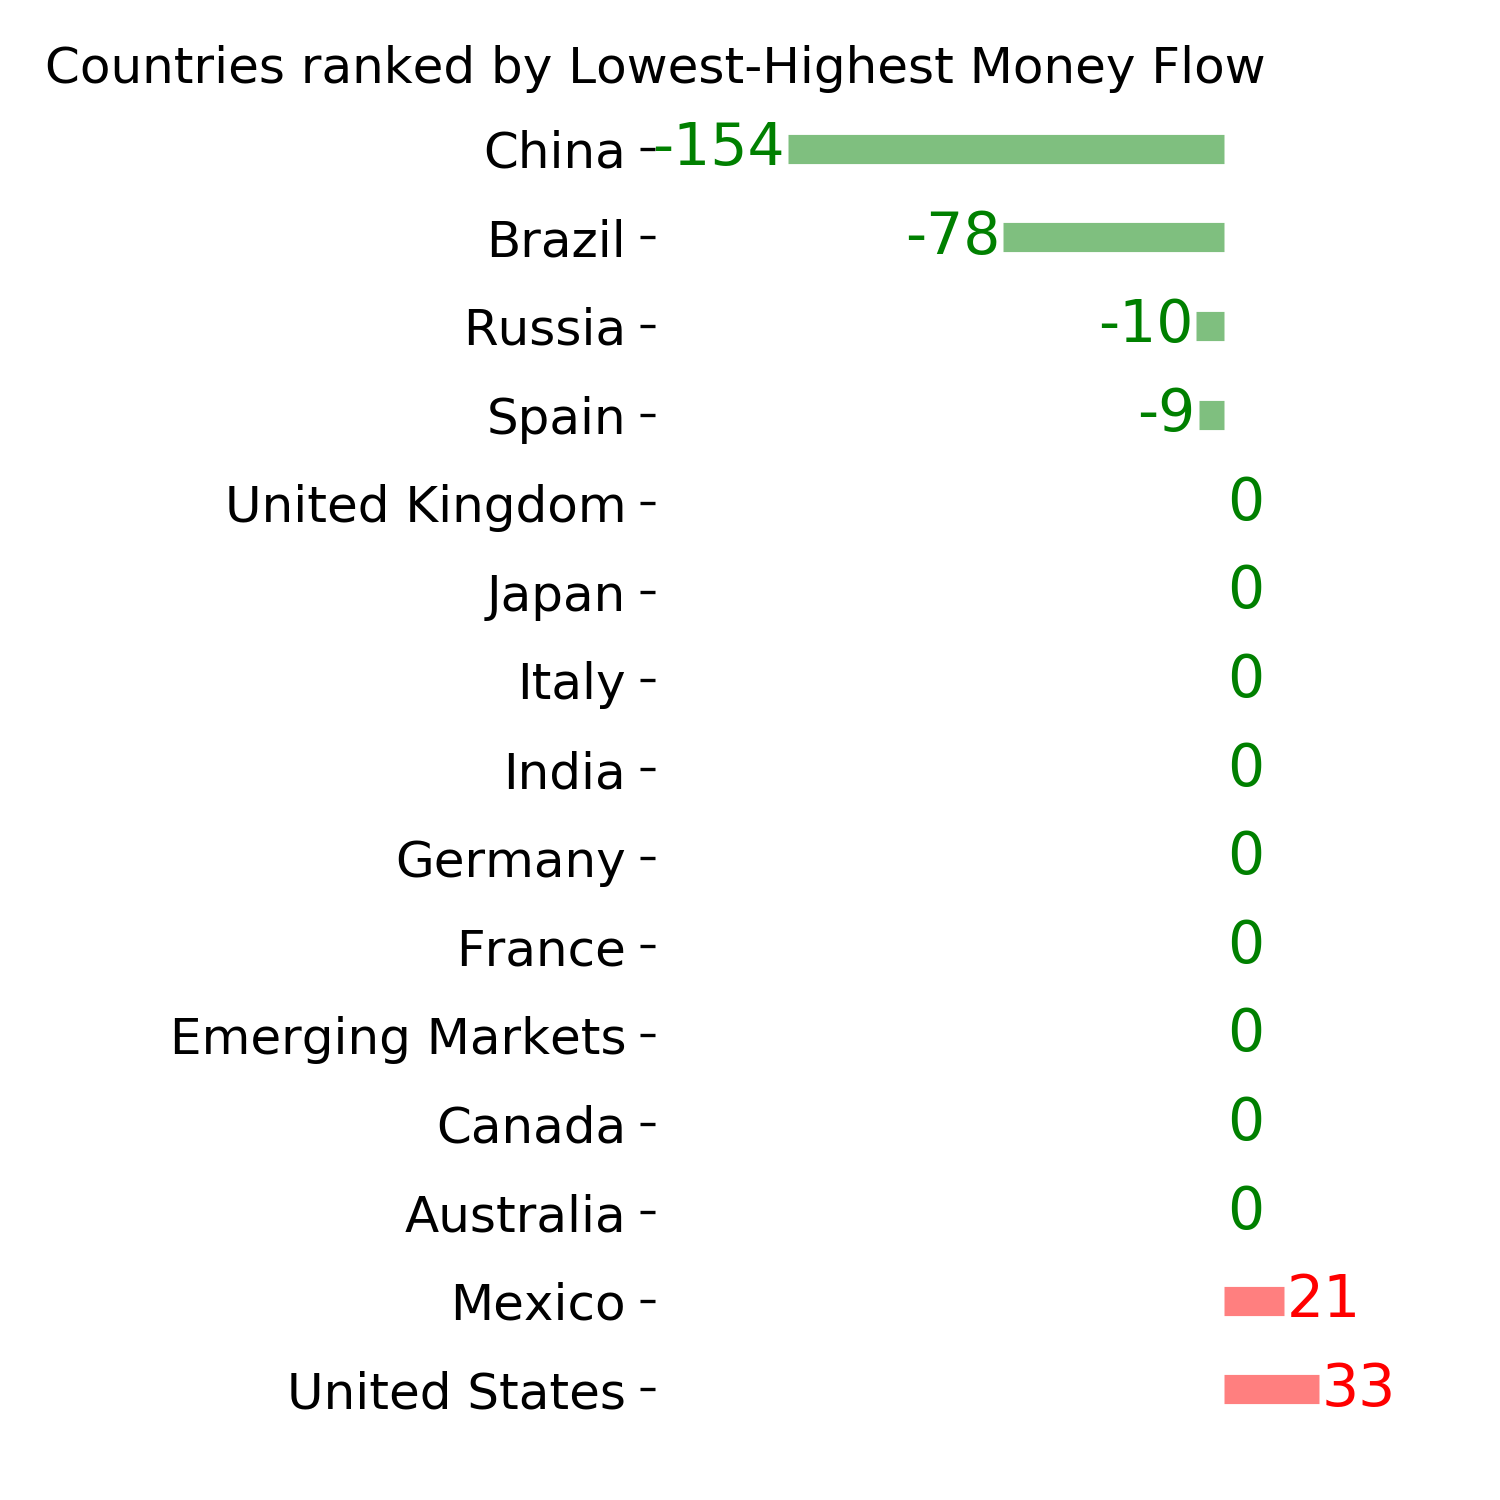
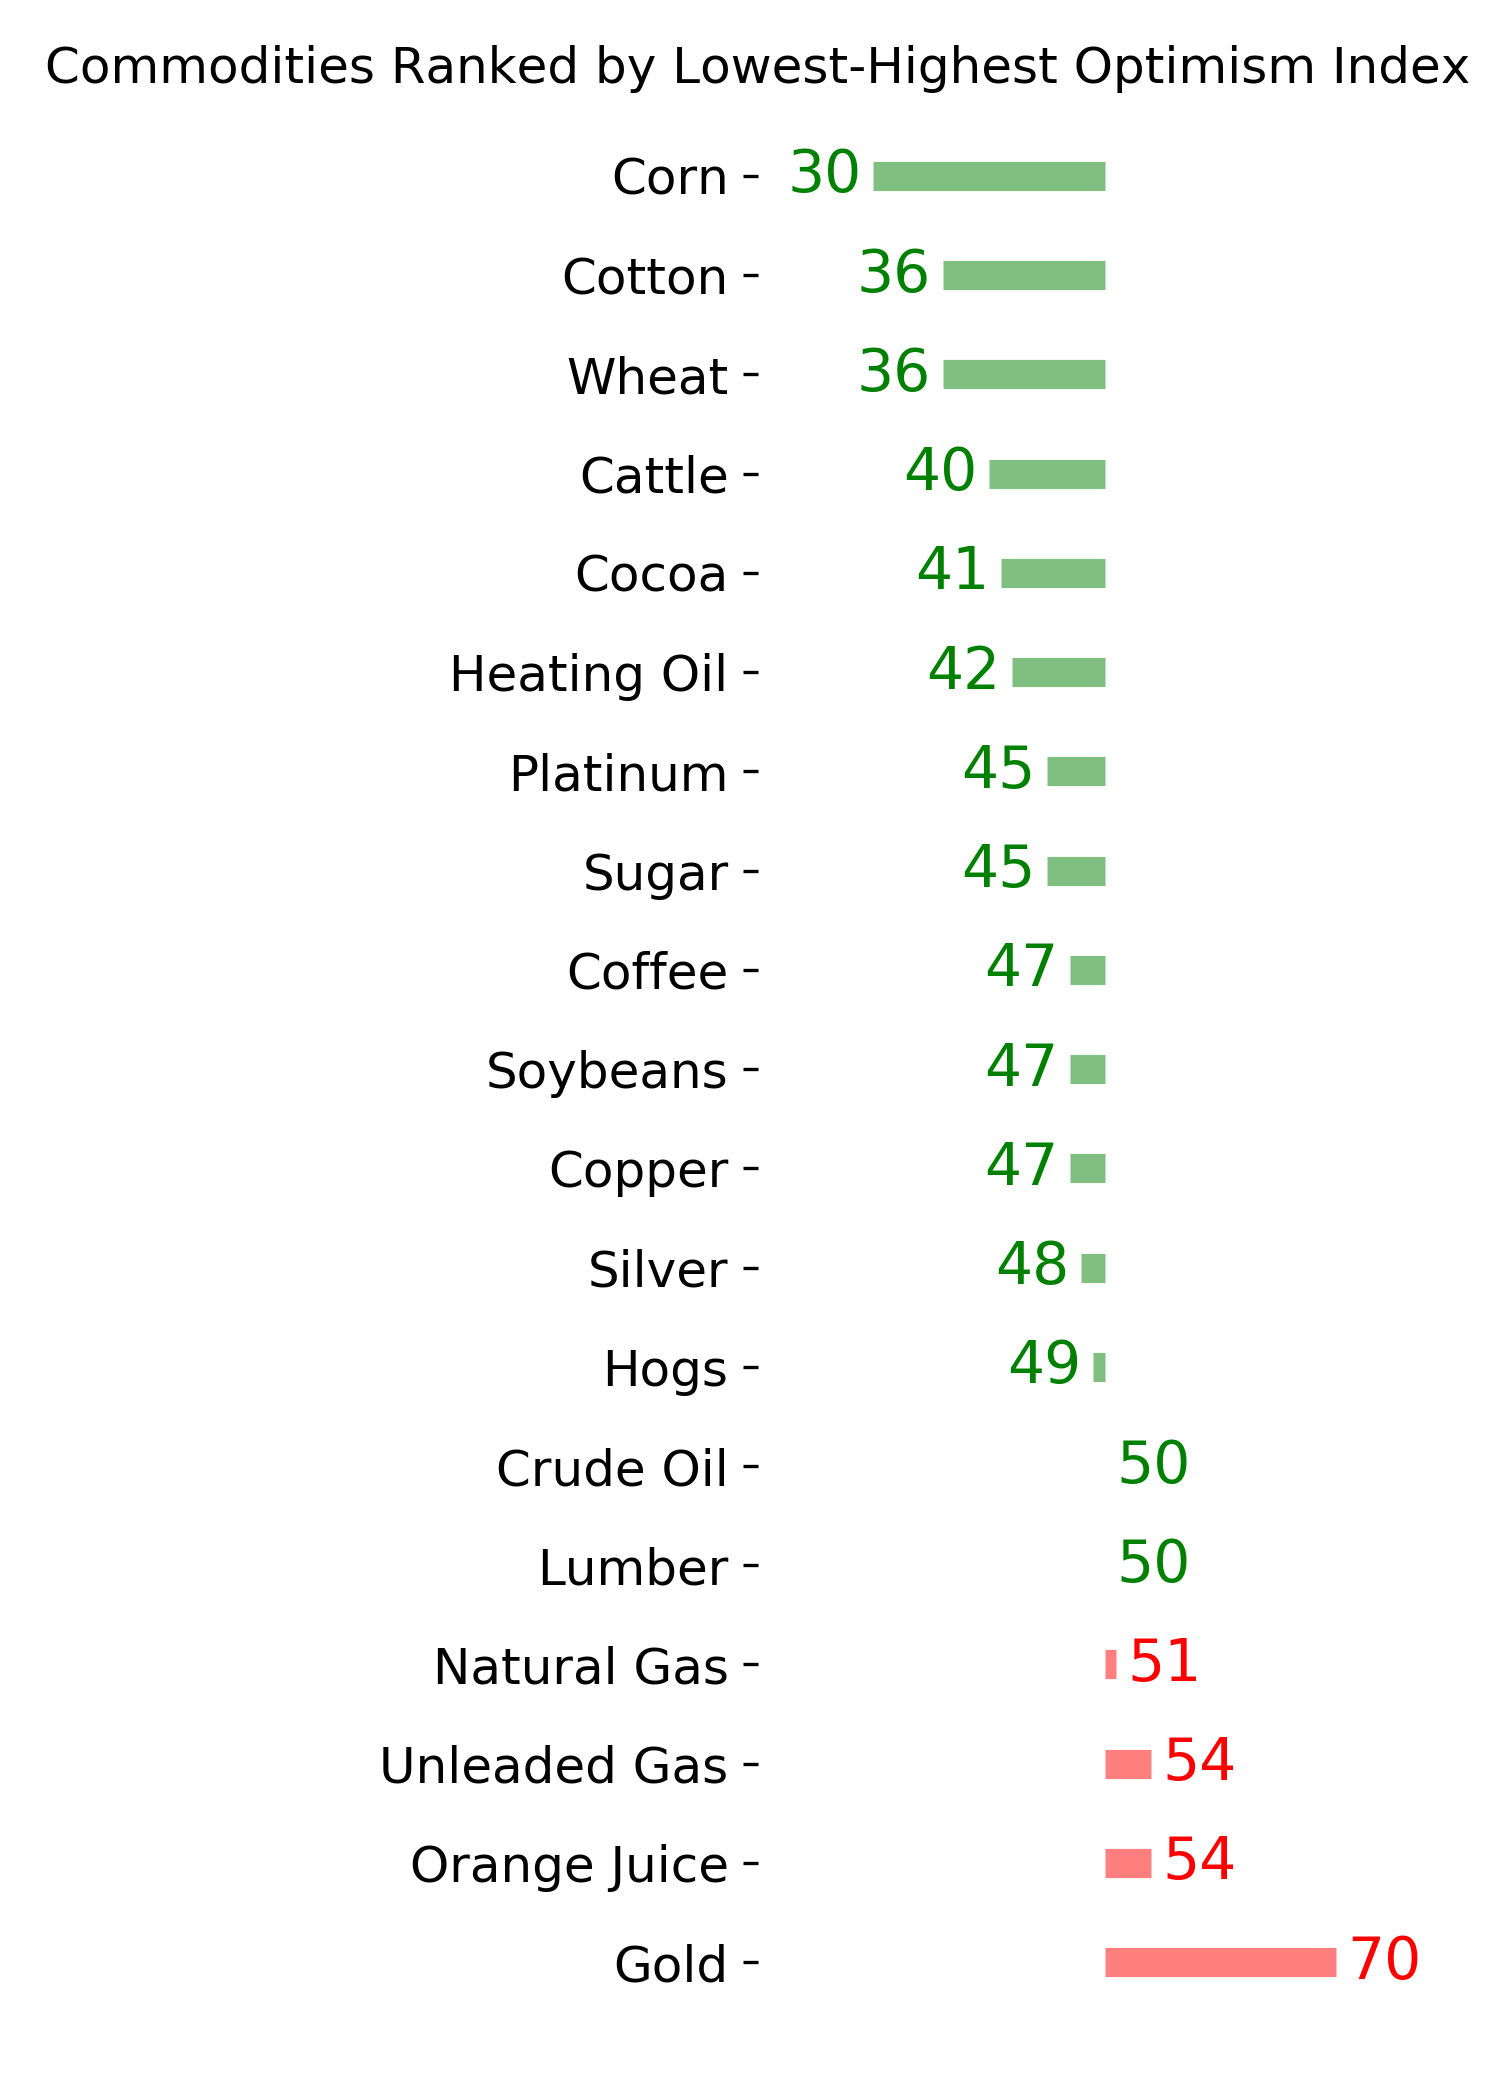
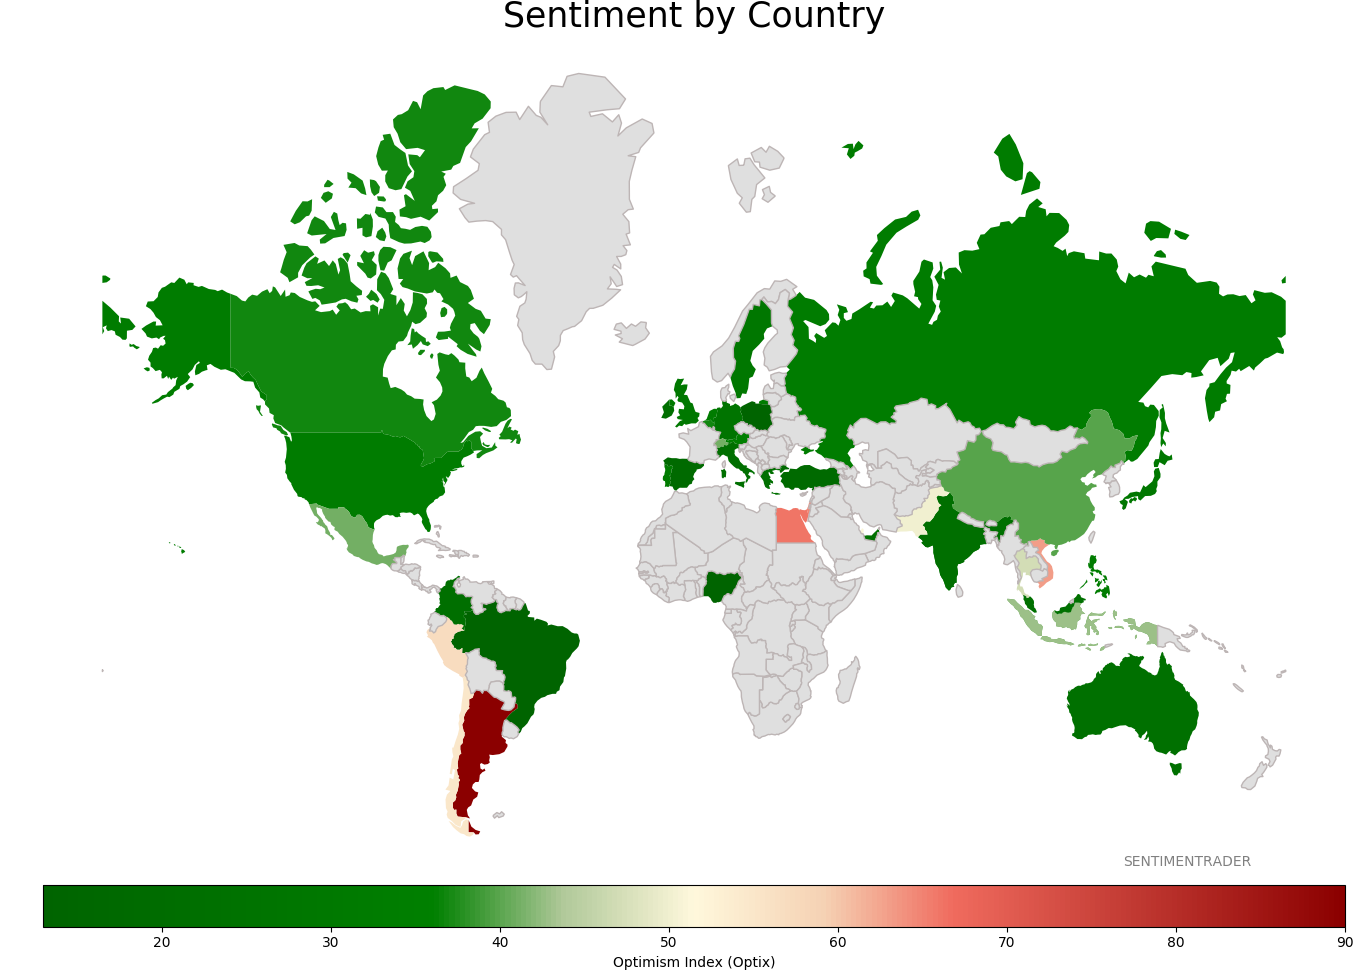
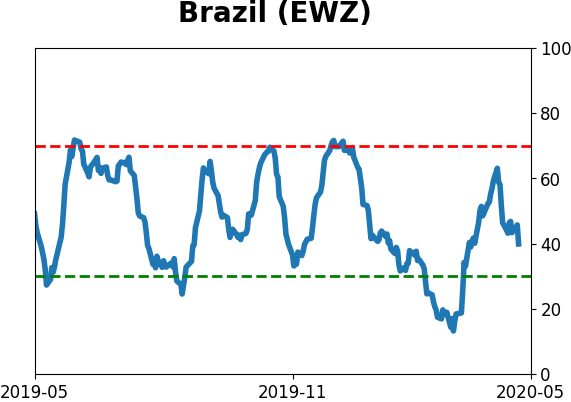
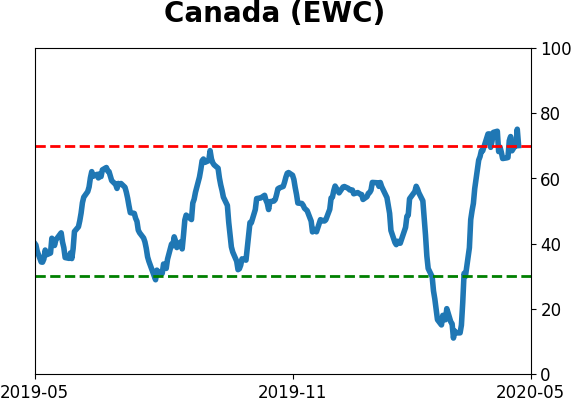
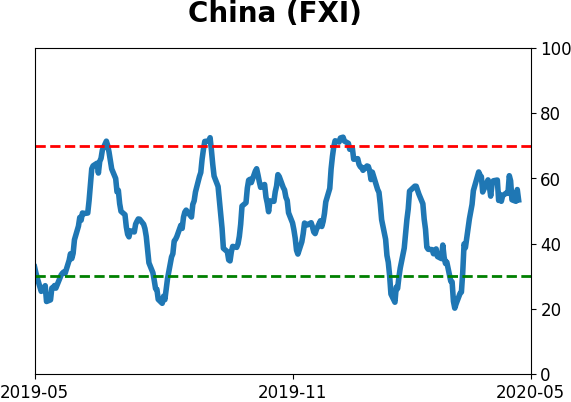
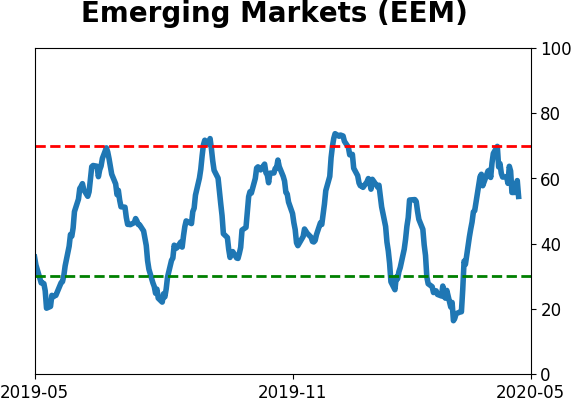
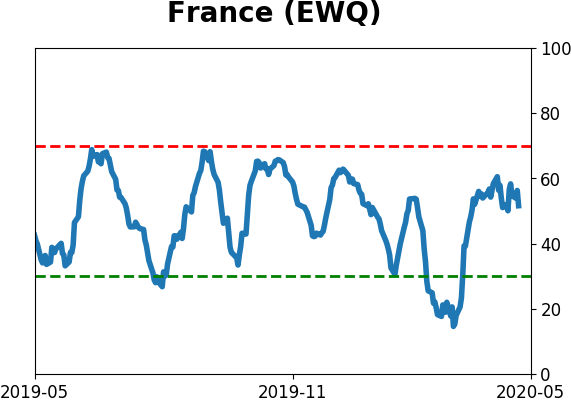
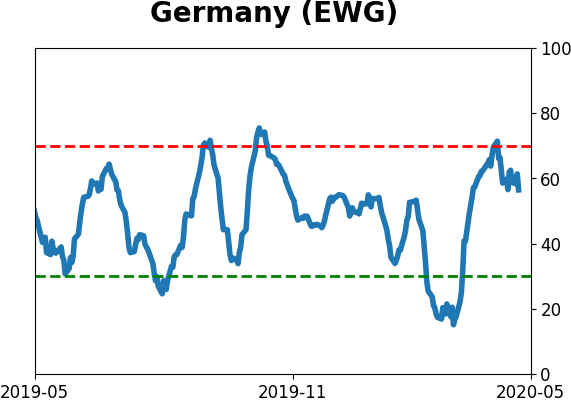
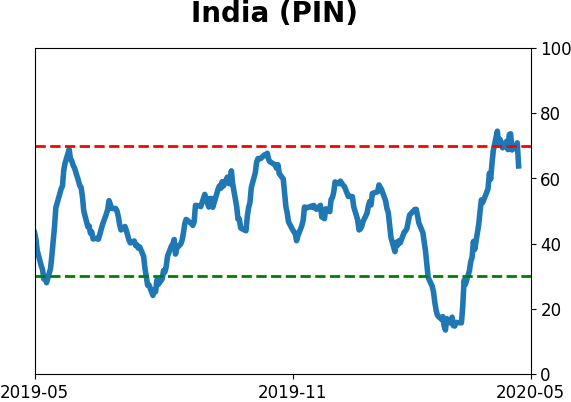
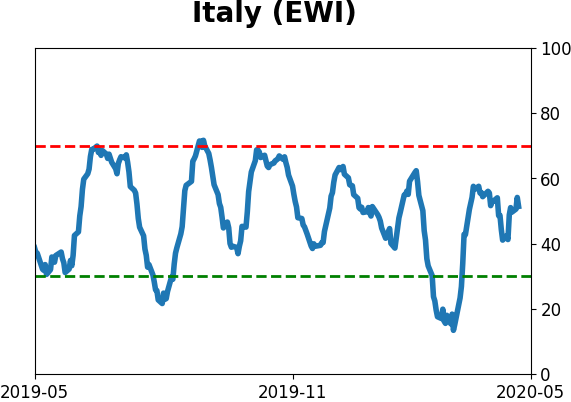
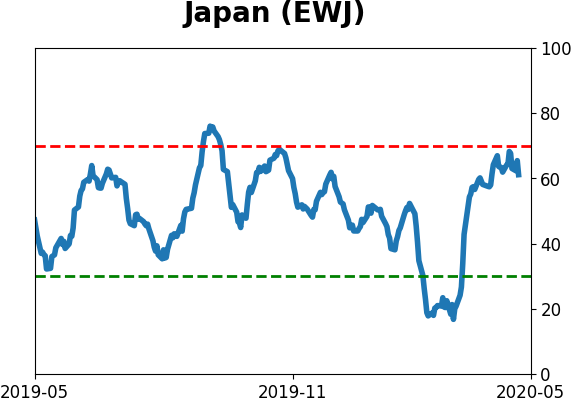
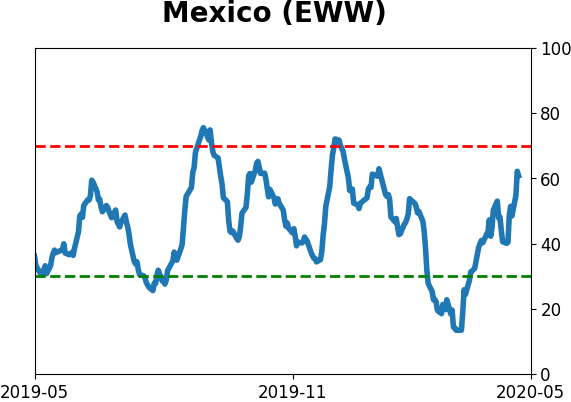
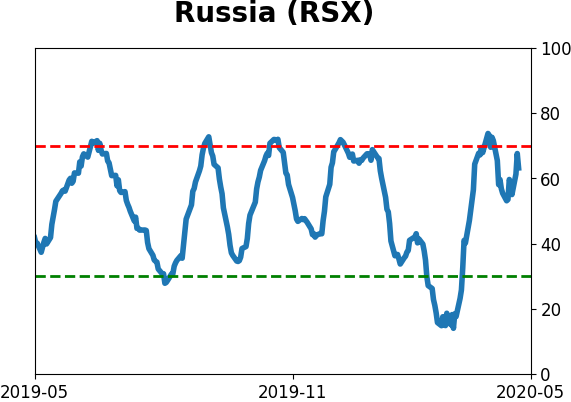
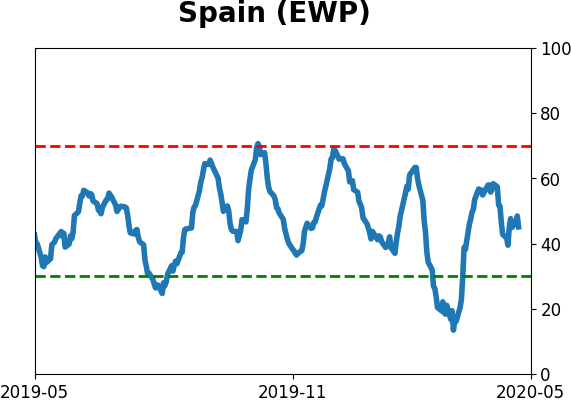
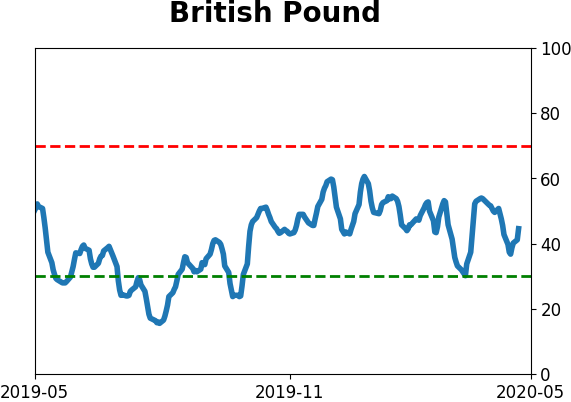
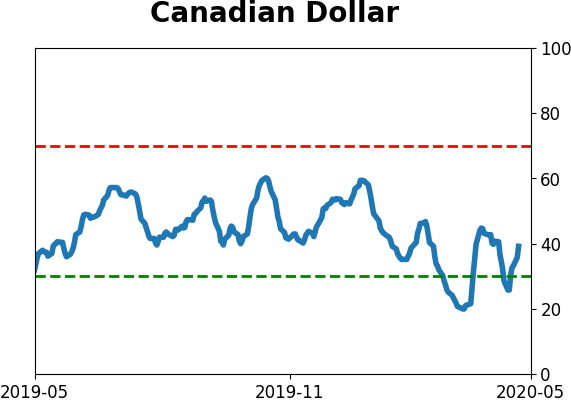
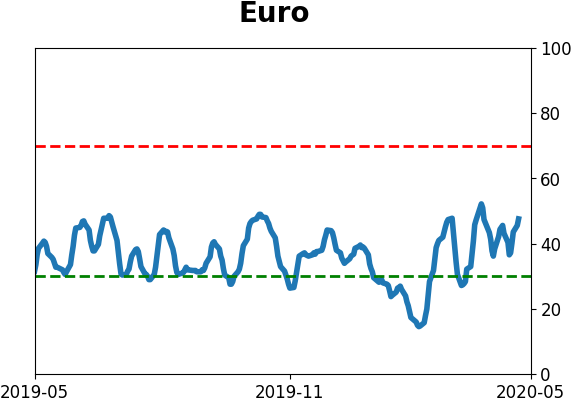
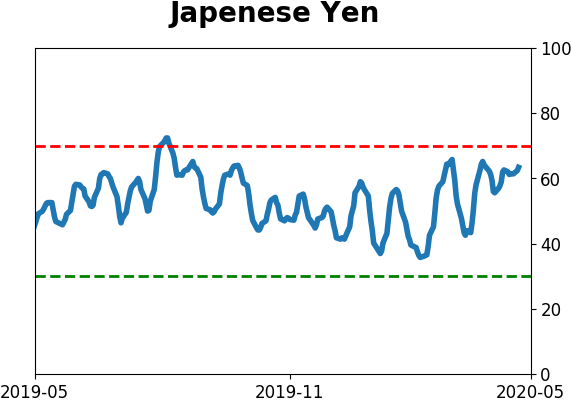
Sentiment Around The World
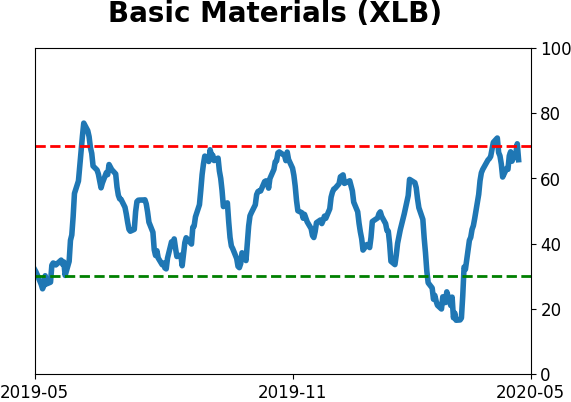
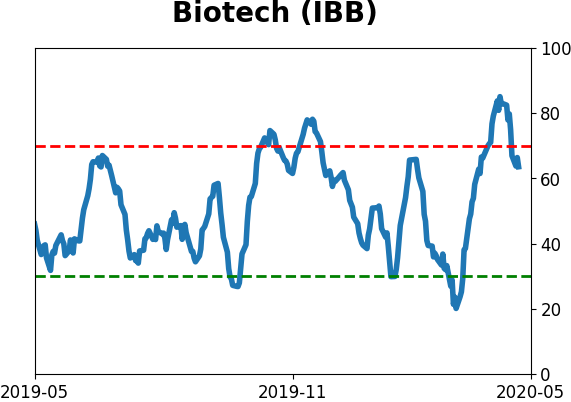
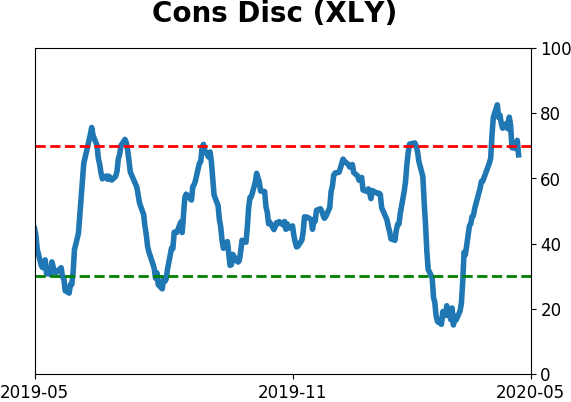
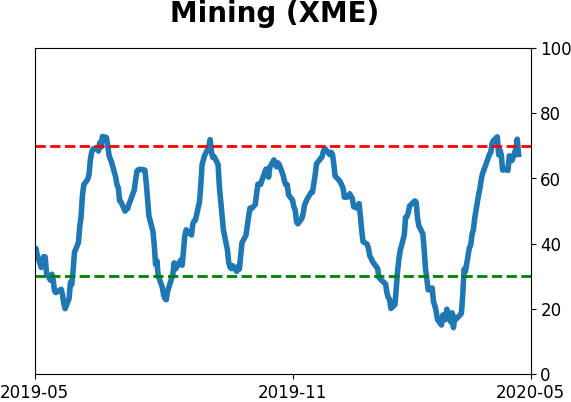
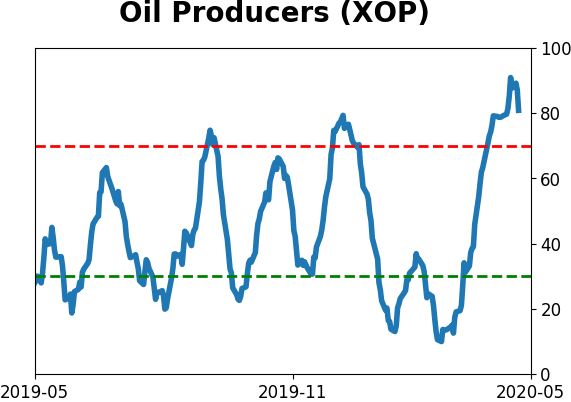
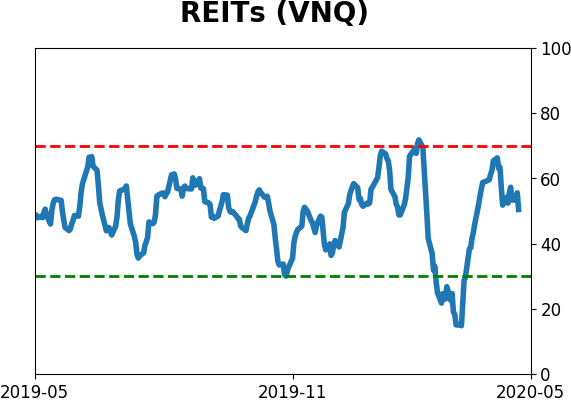
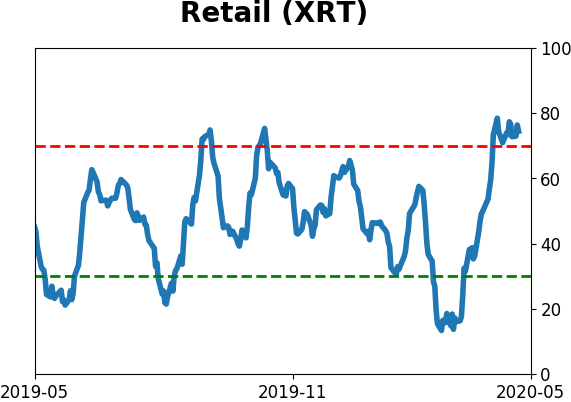
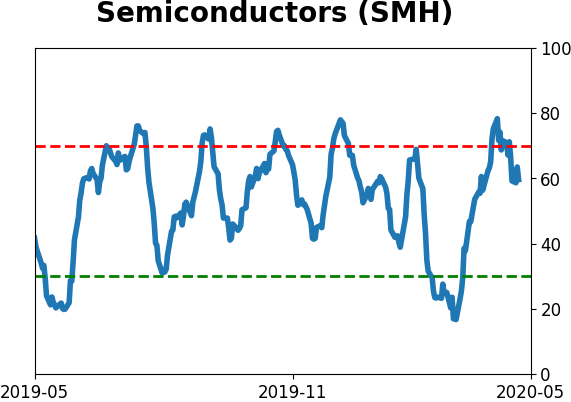
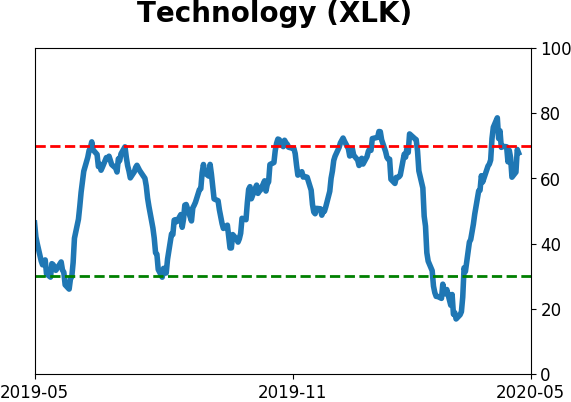
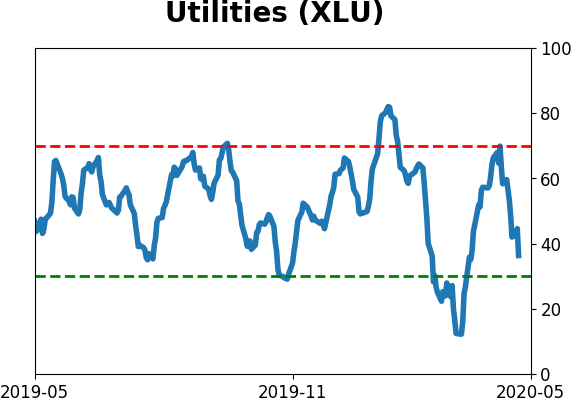
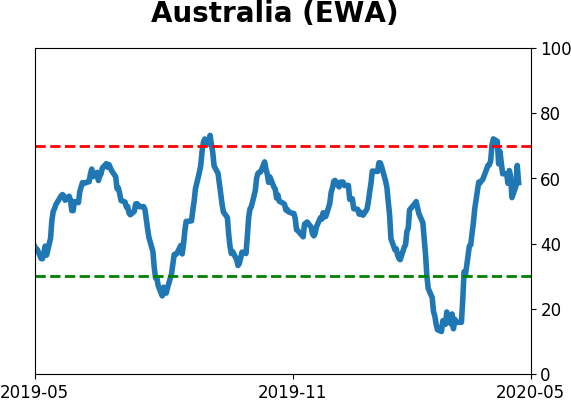
Optimism Index Thumbnails
|
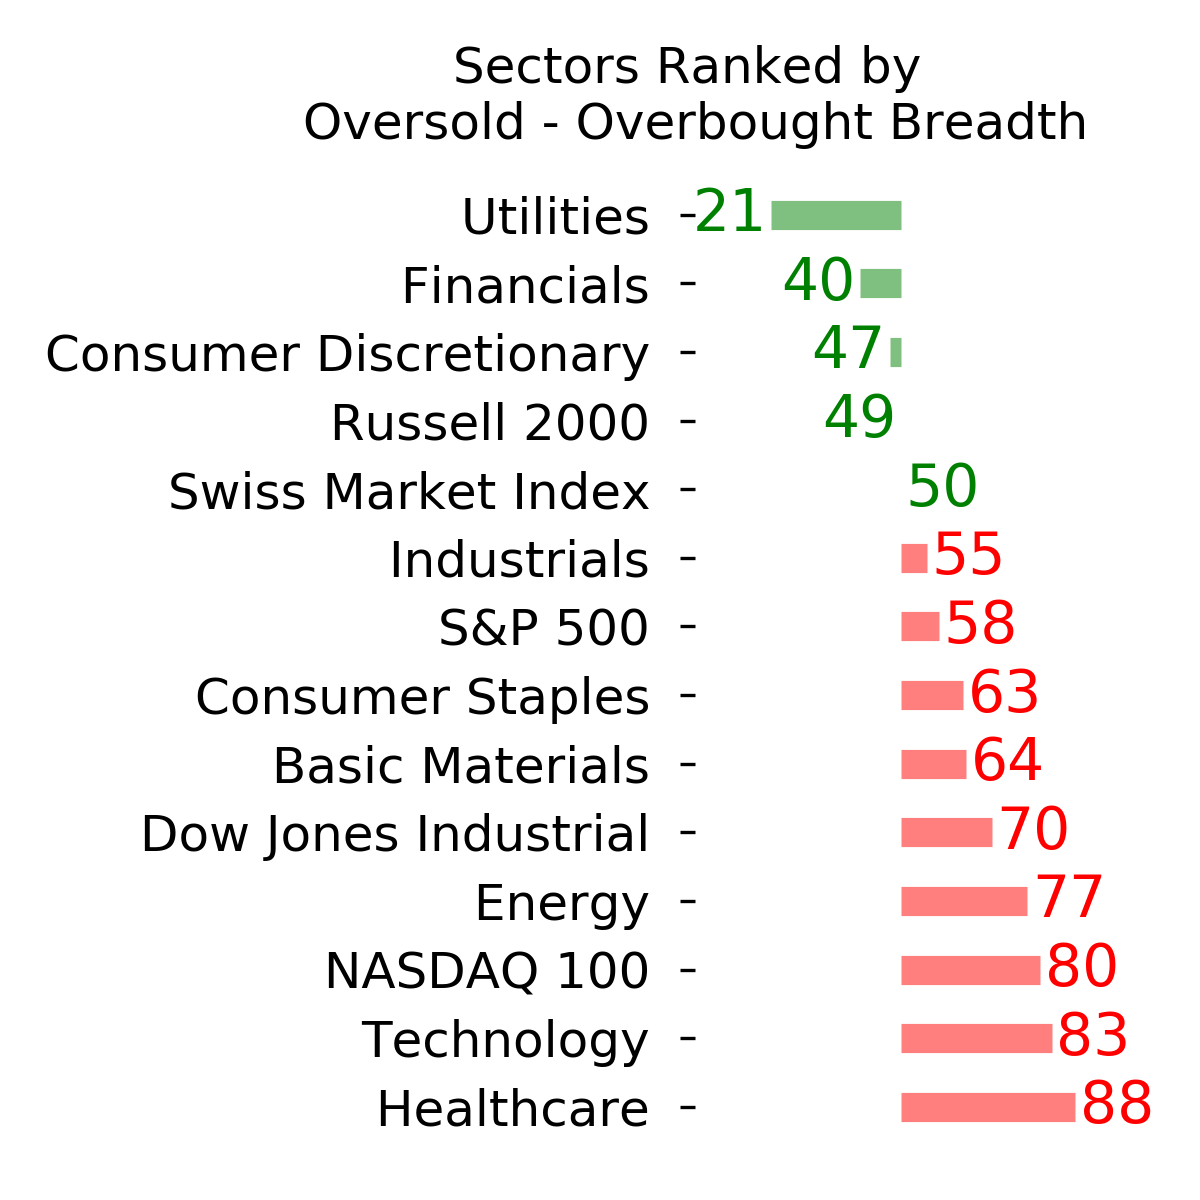
Sector ETF's - 10-Day Moving Average
|
|
|
Country ETF's - 10-Day Moving Average
|
|
|
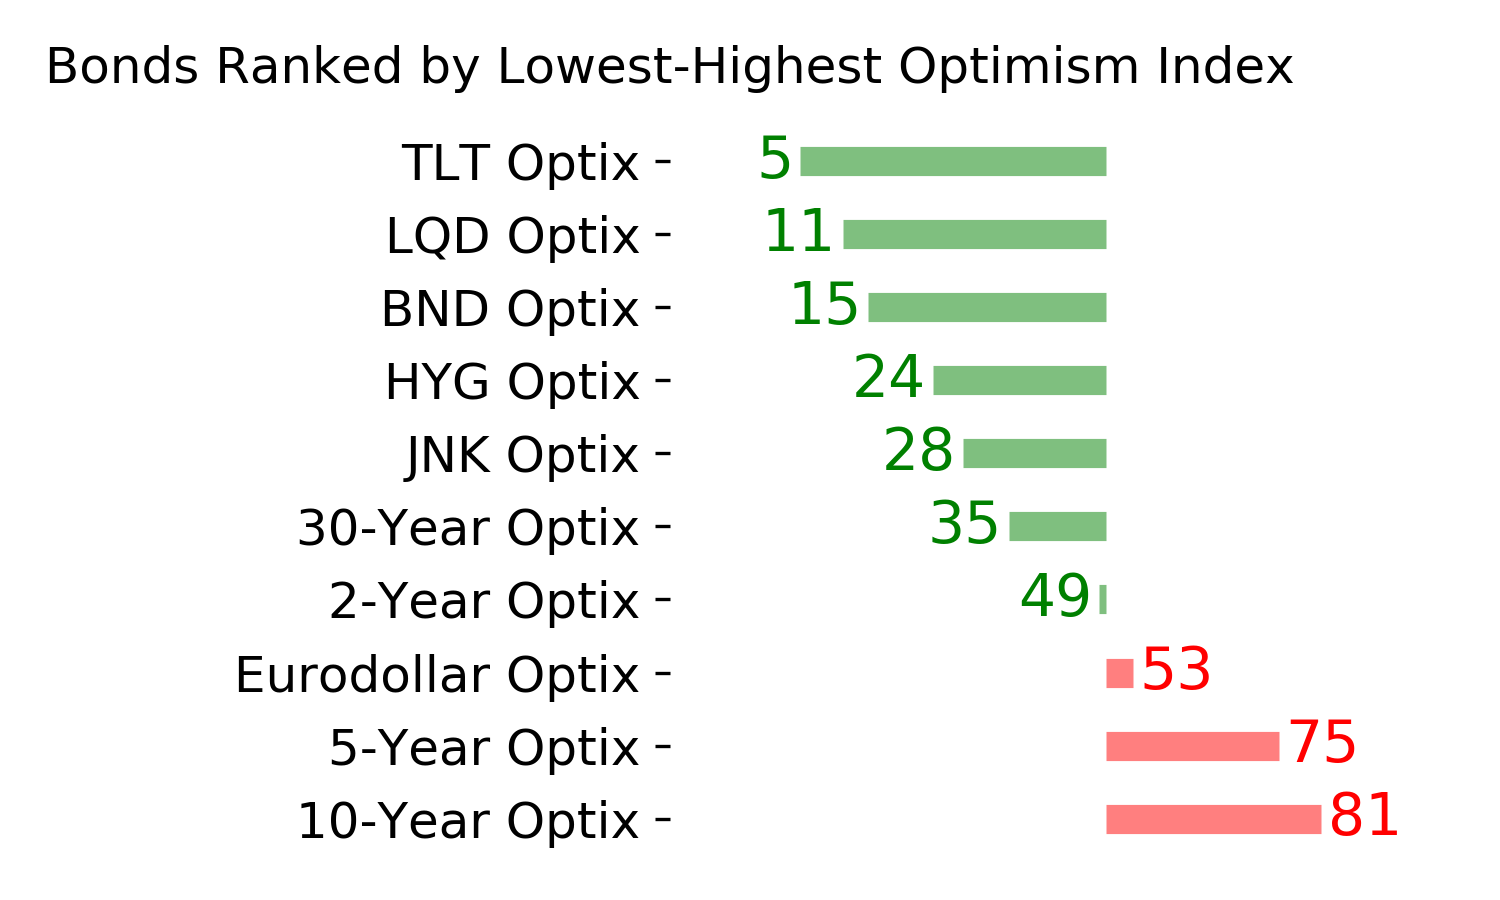
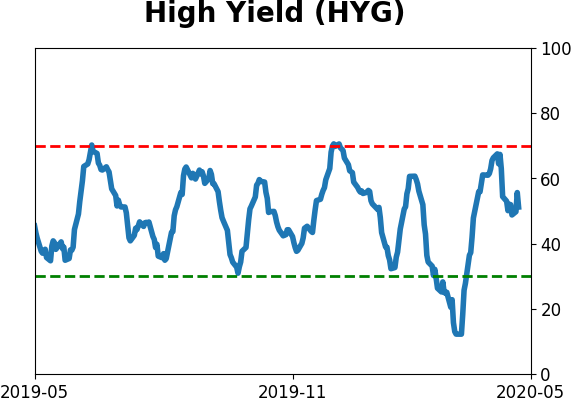
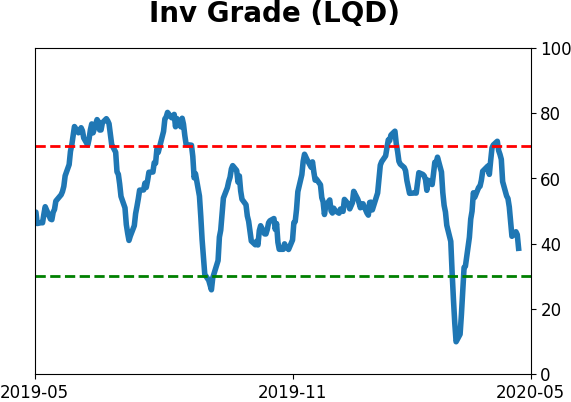
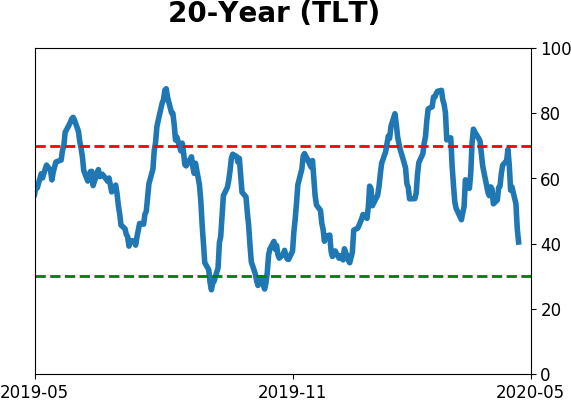
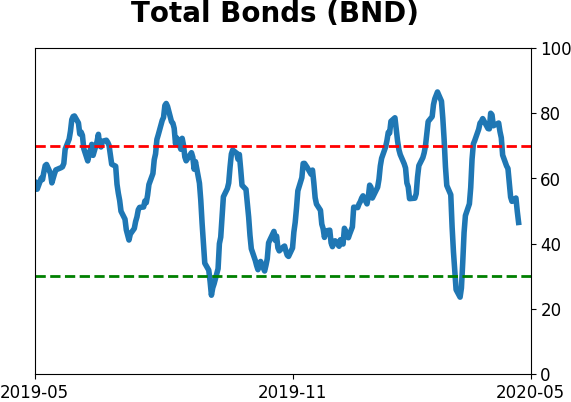
Bond ETF's - 10-Day Moving Average
|
|
|
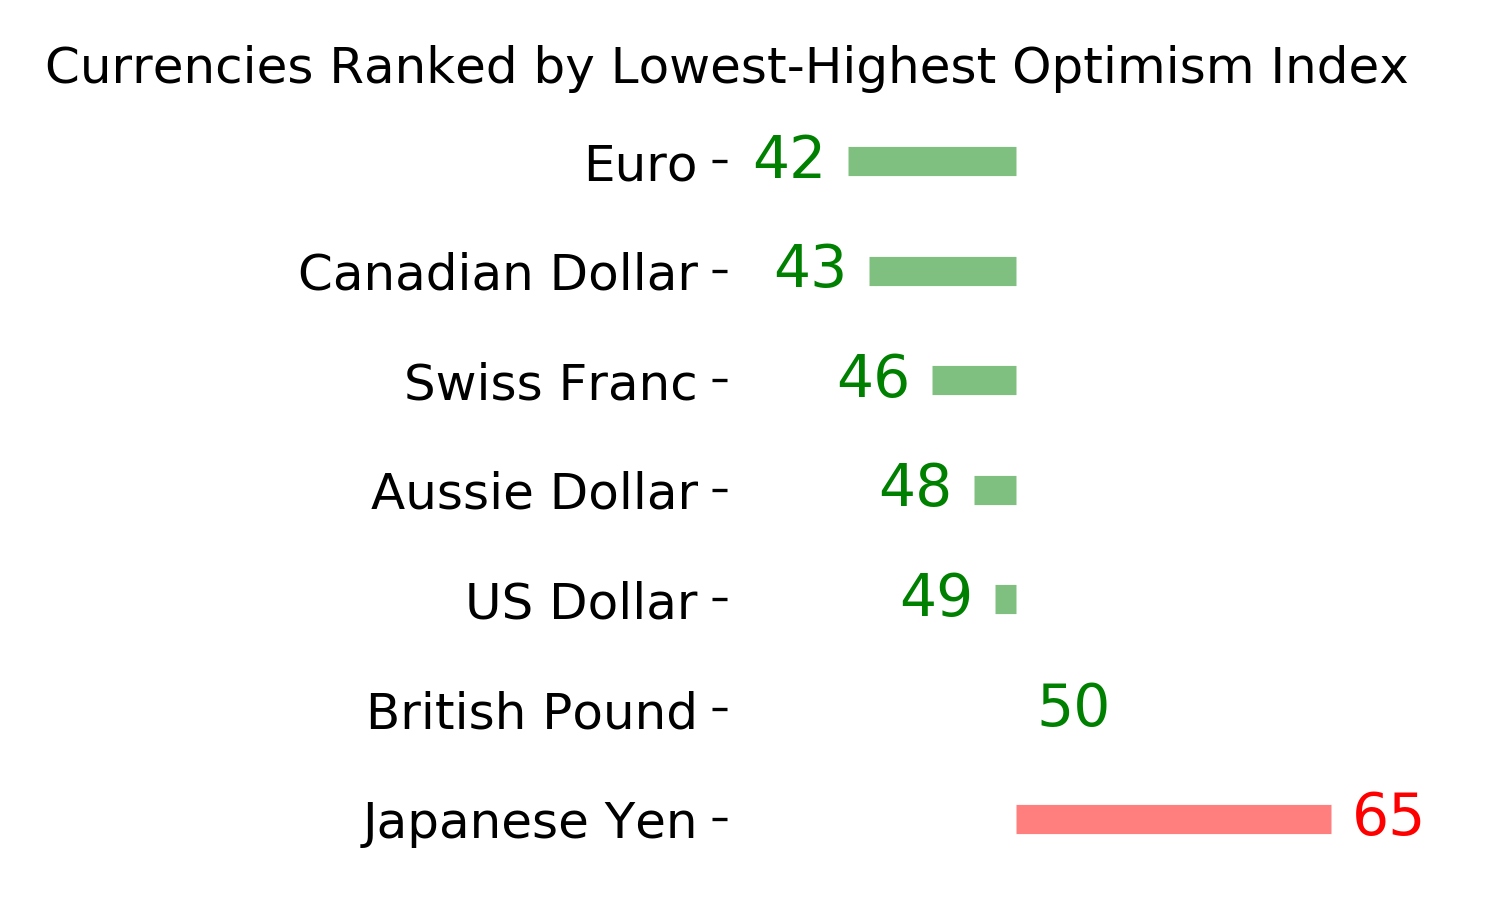
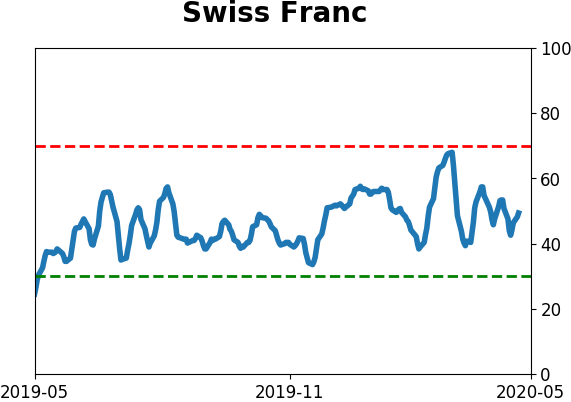
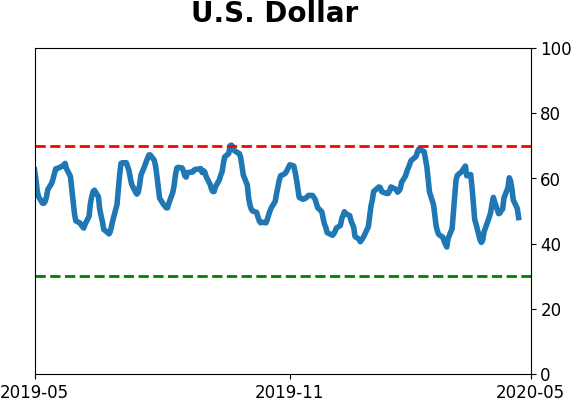
Currency ETF's - 5-Day Moving Average
|
|
|
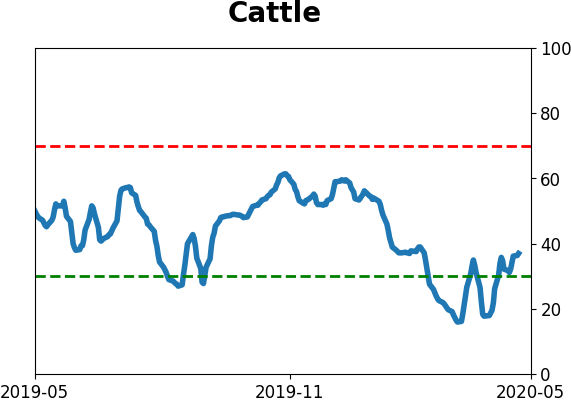
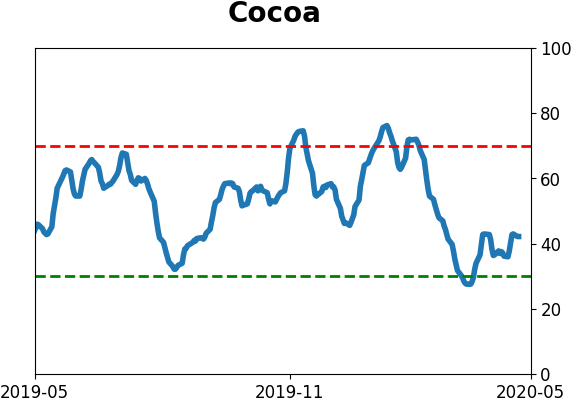
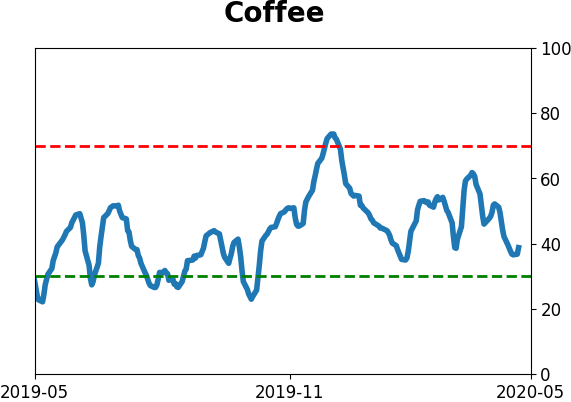
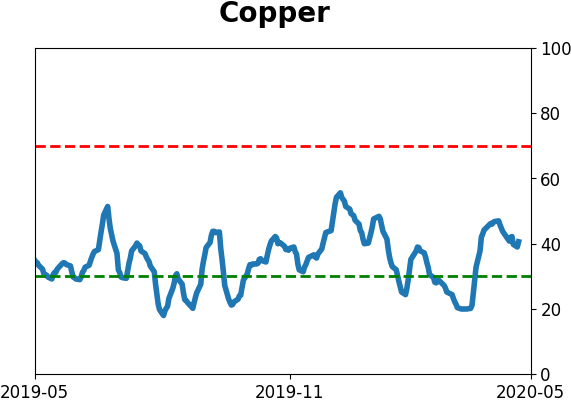
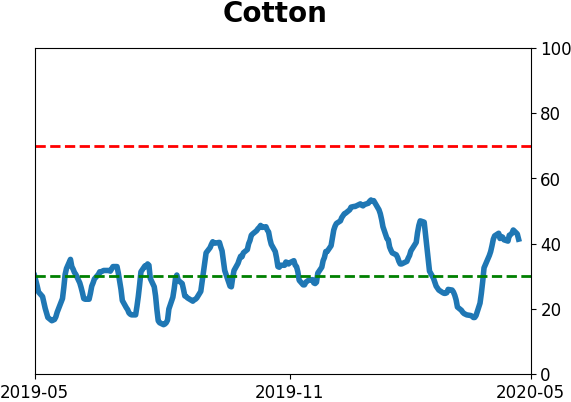
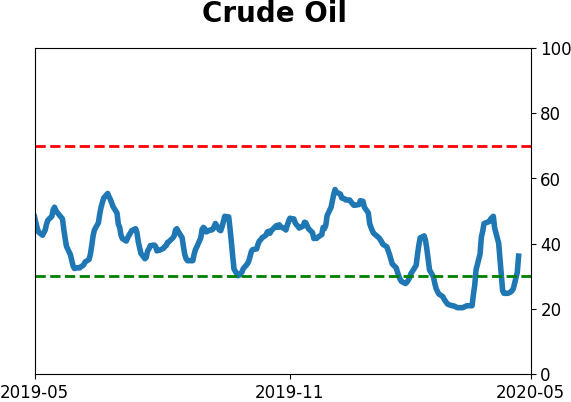
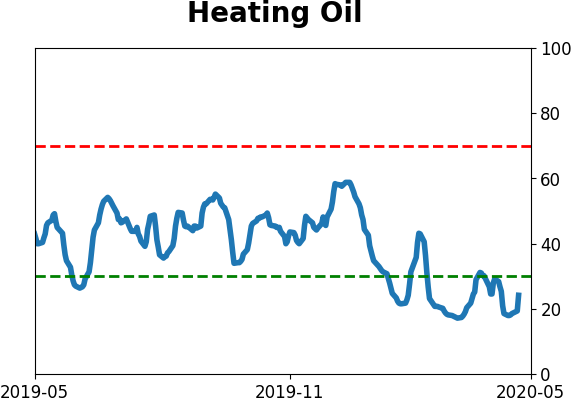
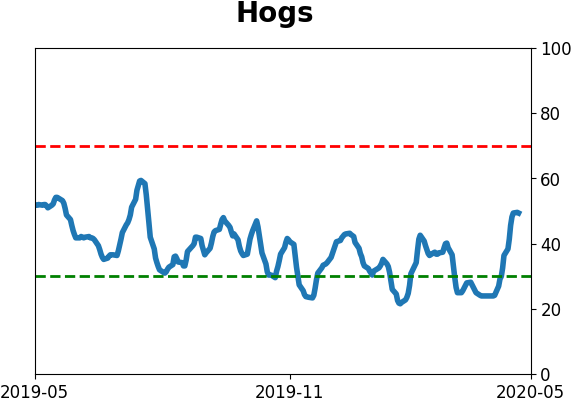
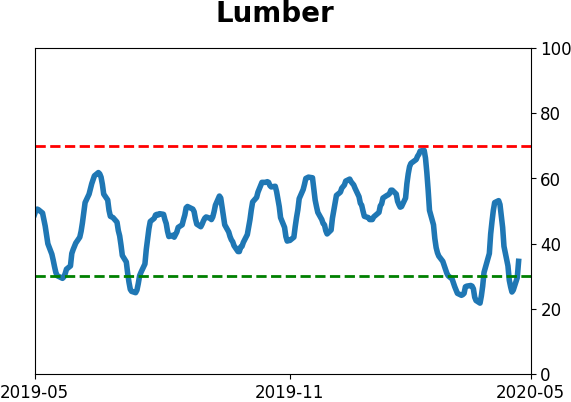
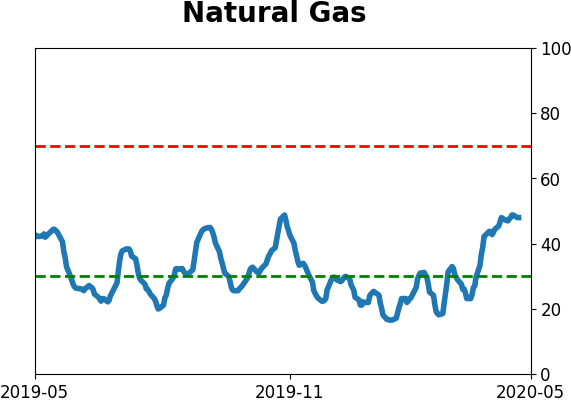
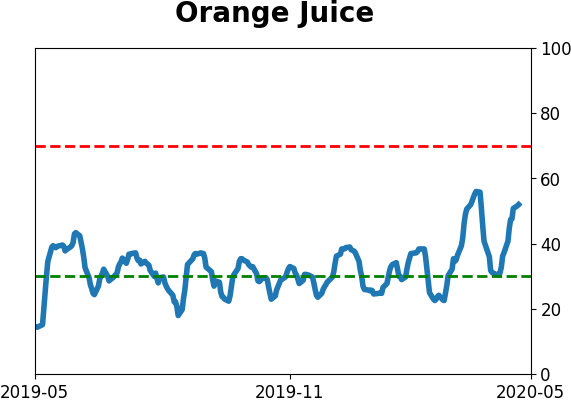
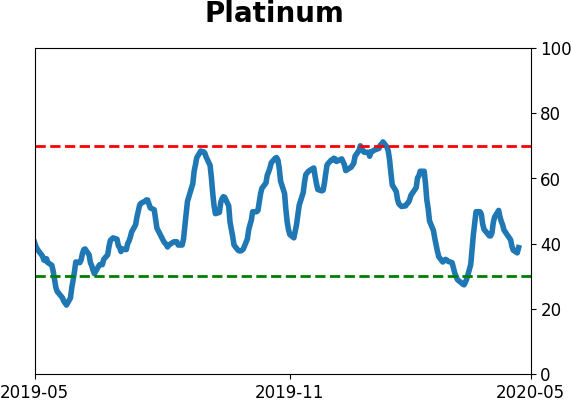
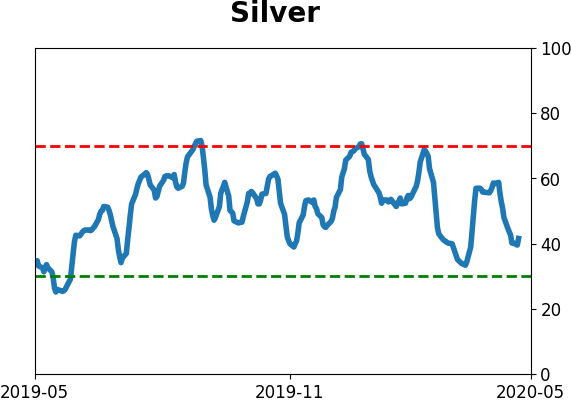
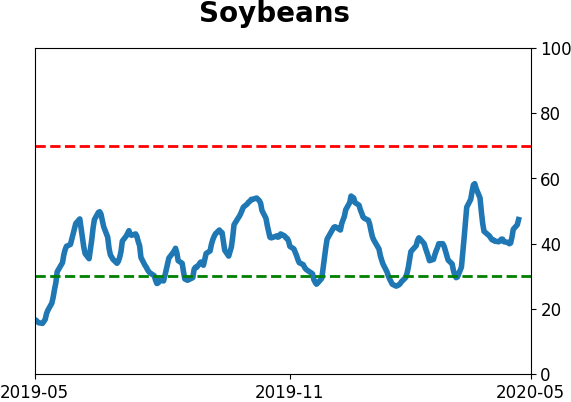
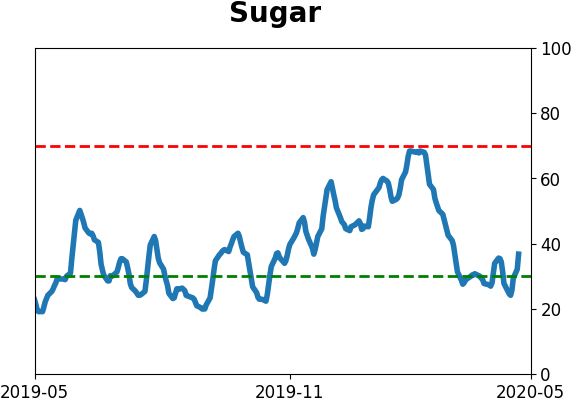
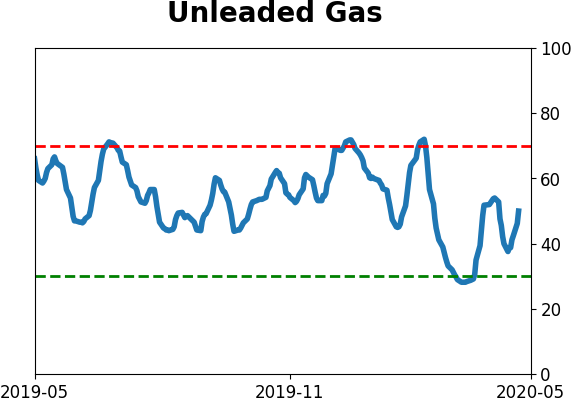
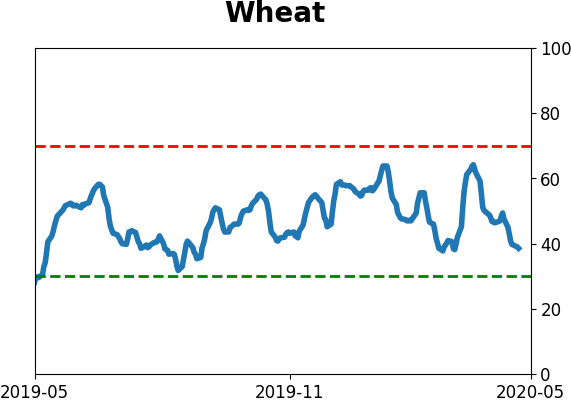
Commodity ETF's - 5-Day Moving Average
|
|