Headlines
|
|
Why April Was One of the Best Months Ever, and What It Means:
April 2021 recorded some of the best breadth readings among S&P 500 stocks since 1928. For the entire month, trends in stocks across short-, medium-, and long-term time frames were among the best months ever. After similar monthly thrusts, stocks rarely lost much ground.
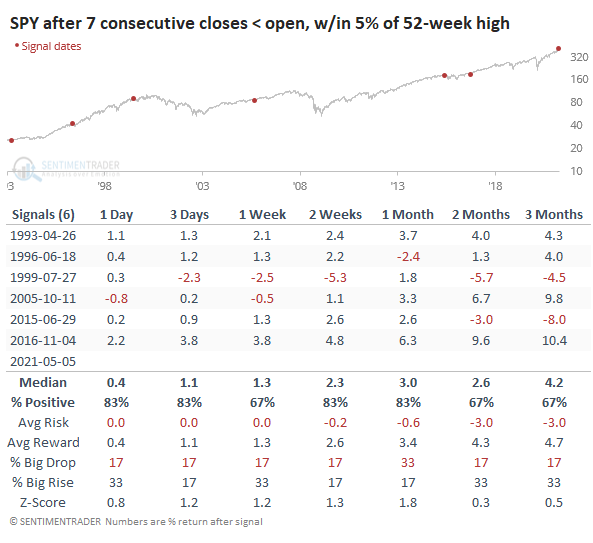
Intraday selling: While weakness during the day isn't anything new, the last 7 days have seen buyers step back from the open. Each of the past 7 sessions has seen the S&P 500 tracking fund, SPY, trade lower from the open to the close. That's just off the record of 10 straight days. It's tempting to assume that it means buyers are exhausted, but the few precedents don't show a lot of support. Of the 6 signals, 4 showed some weakness between 1-8 weeks later, but overall it wasn't exactly a bell-ringer of a top signal.
Bottom Line:
See the Outlook & Allocations page for more details on these summaries STOCKS: Weak sell
The extreme speculation registered in January and February is starting to get wrung out. Internal dynamics have mostly held up, so a return to neutral sentiment conditions would improve the forward risk/reward profile substantially. We're still a ways off from that. BONDS: Weak buy
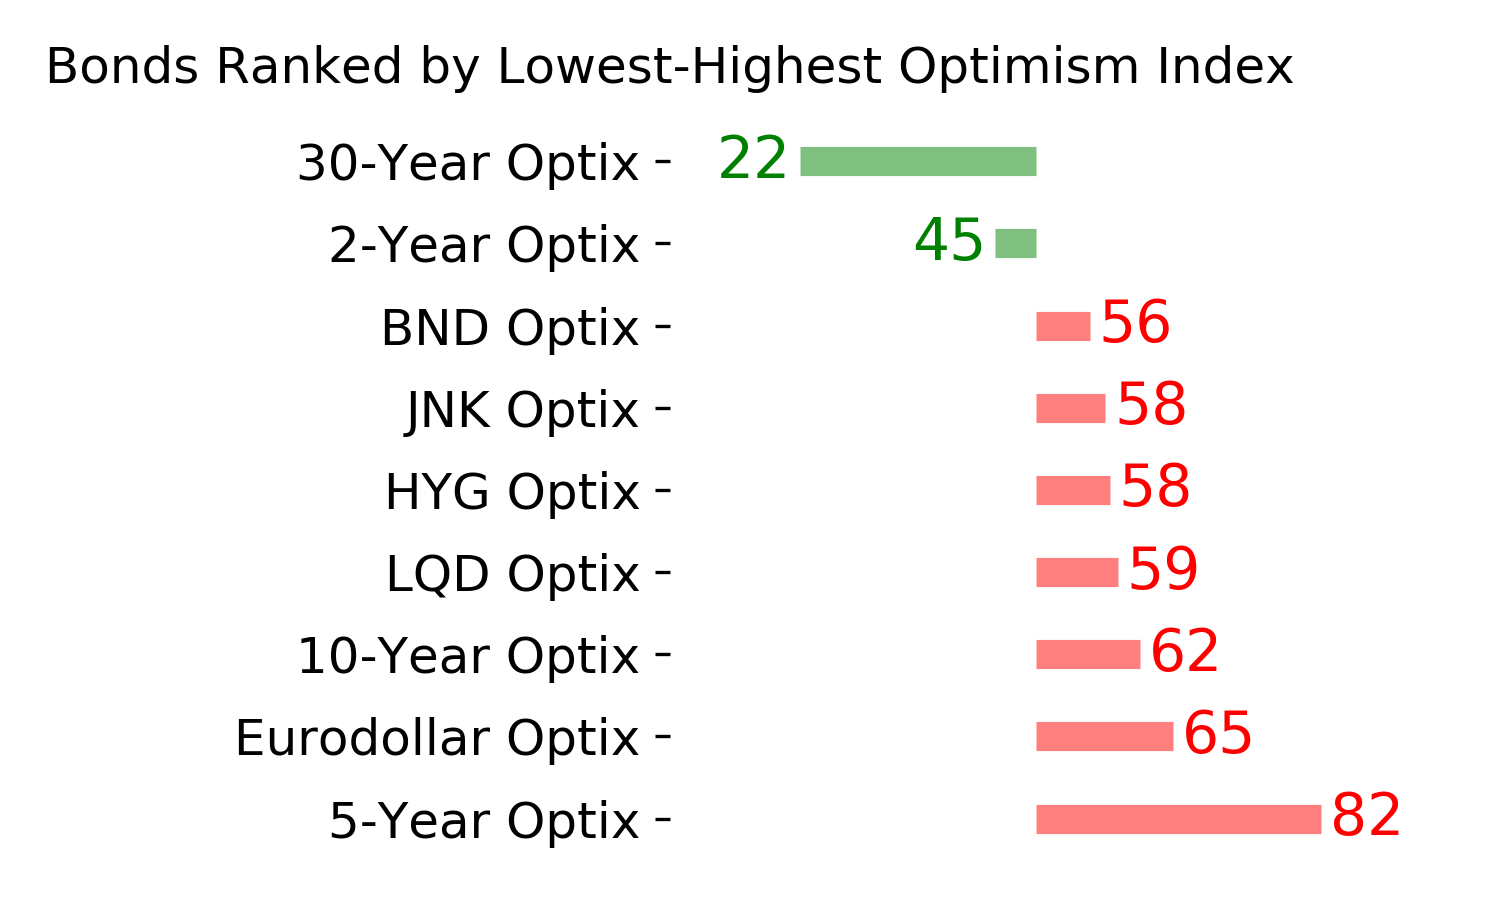
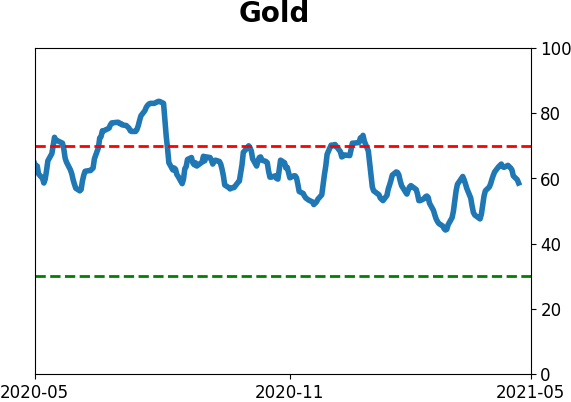
Various parts of the market have been hit in recent weeks, with mild oversold conditions. The Bond Optimism Index is now about as low as it gets during healthy bond market environments. Fixed income isn't responding well, so that needs to be monitored in case it's transitioning to a longer-term negative market environment. GOLD: Weak buy
A dollar trying to rebound from a severe short position has weighed on gold and miners. The types of signals they've given in recent weeks, within the context of their recent surge, have usually resulted in higher prices over a medium- to long-term time frame. Like bonds, gold and miners aren't responding very well, and this needs to be monitored.
|
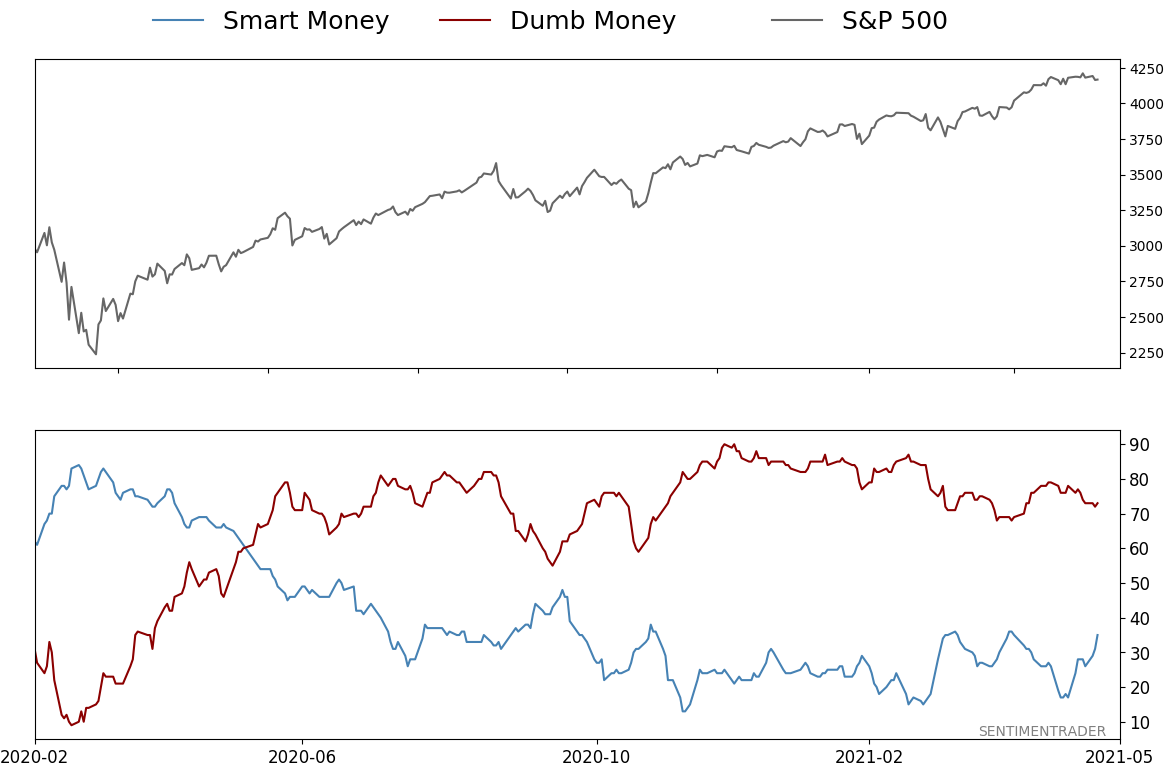
Smart / Dumb Money Confidence
|
Smart Money Confidence: 35%
Dumb Money Confidence: 73%
|
|
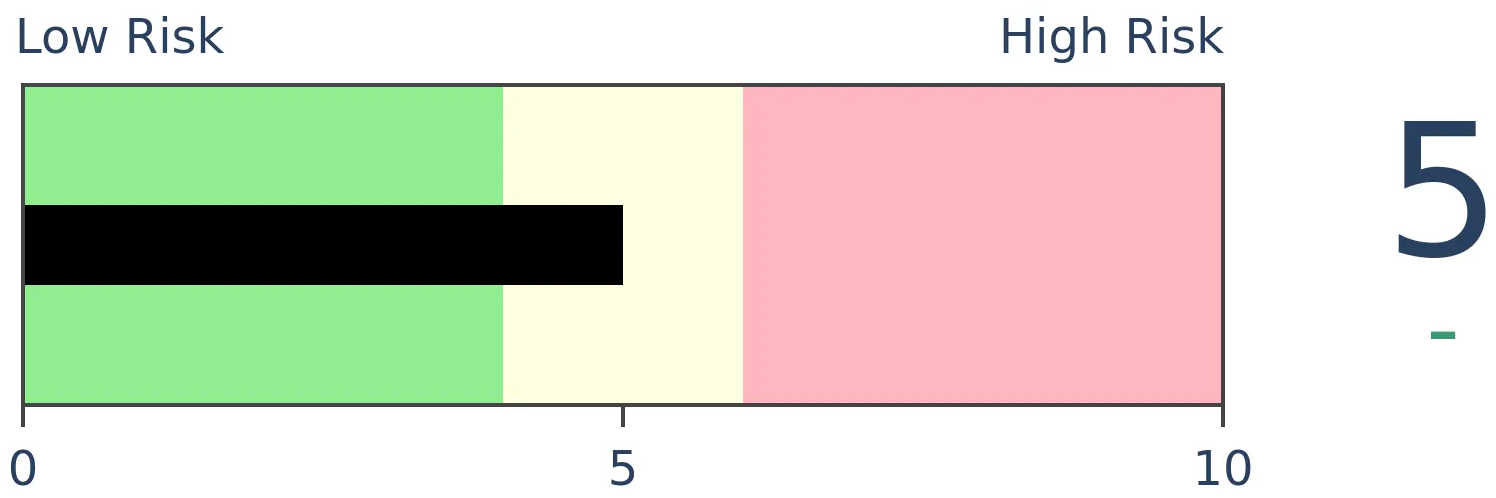
Risk Levels
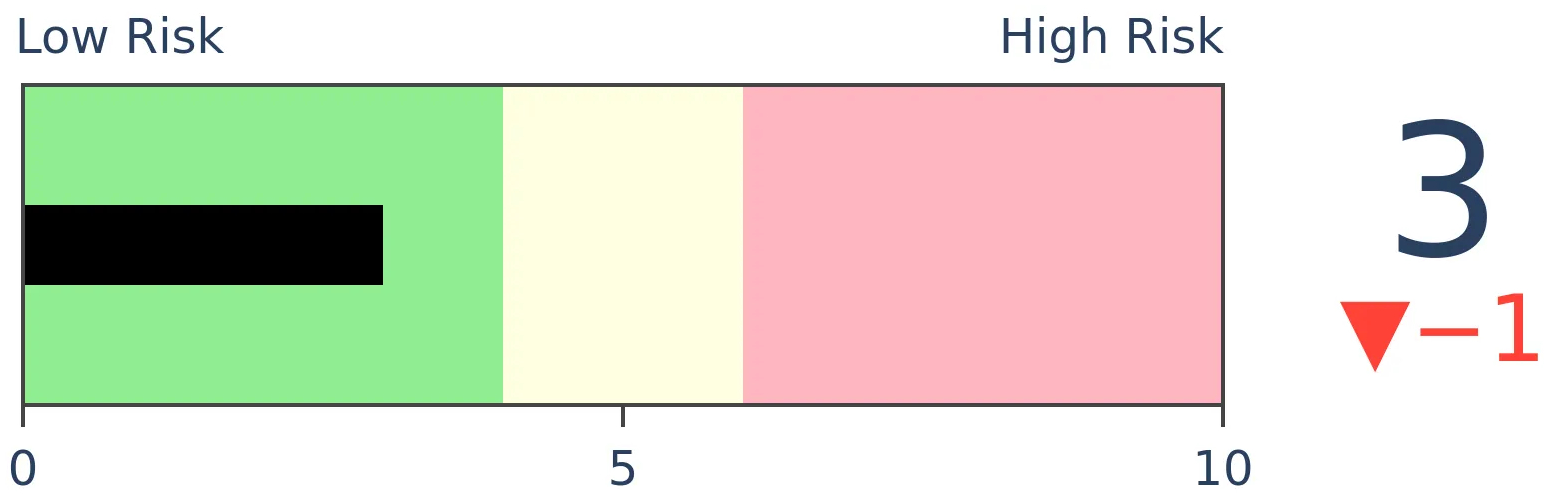
Stocks Short-Term
|
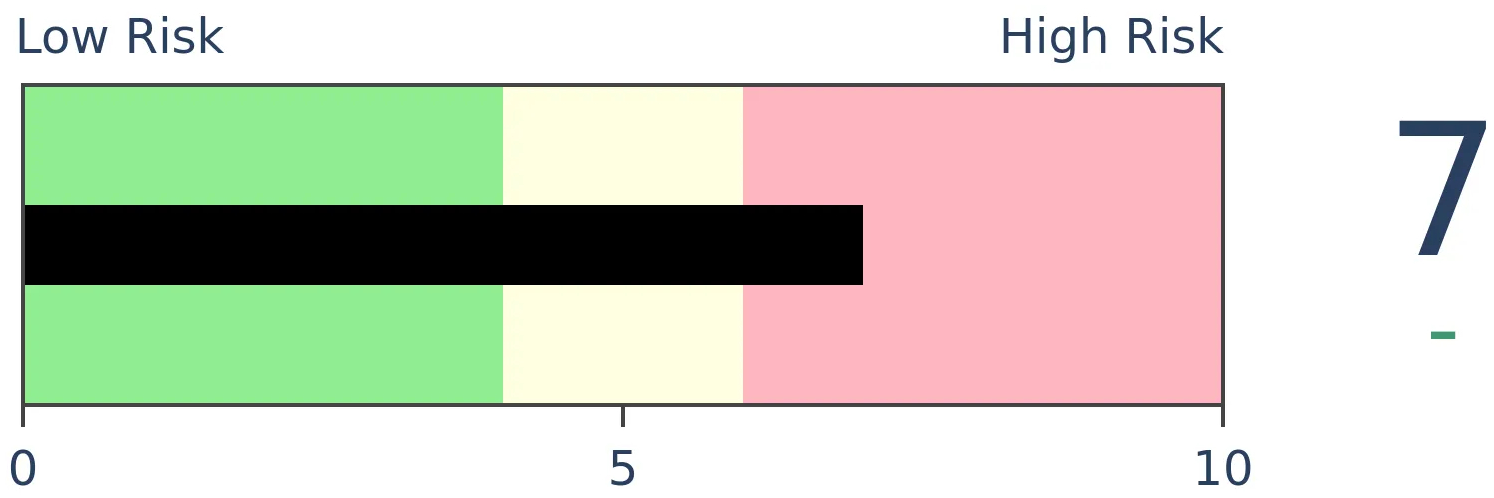
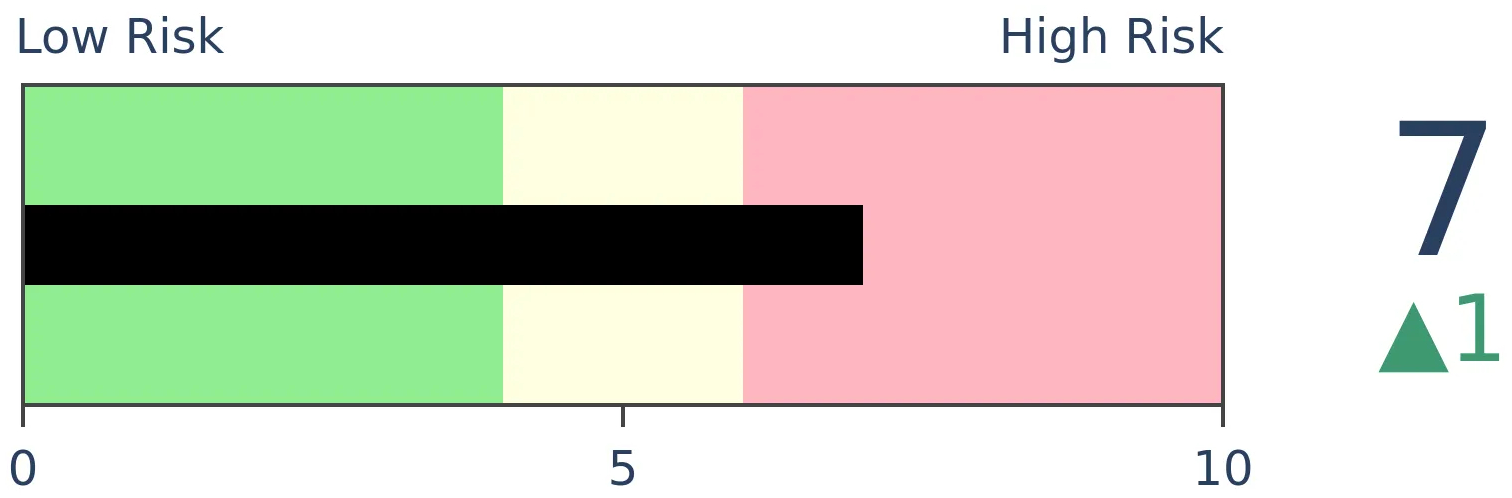
Stocks Medium-Term
|
|
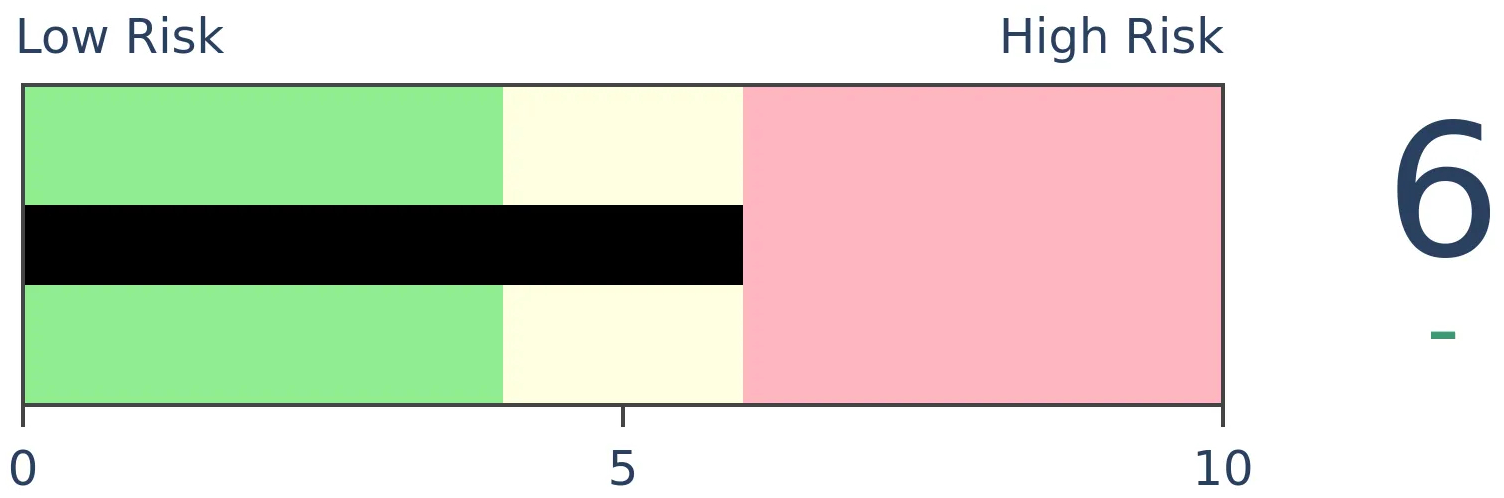
Bonds
|
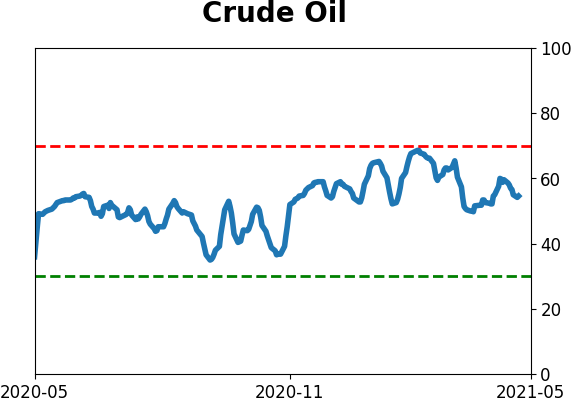
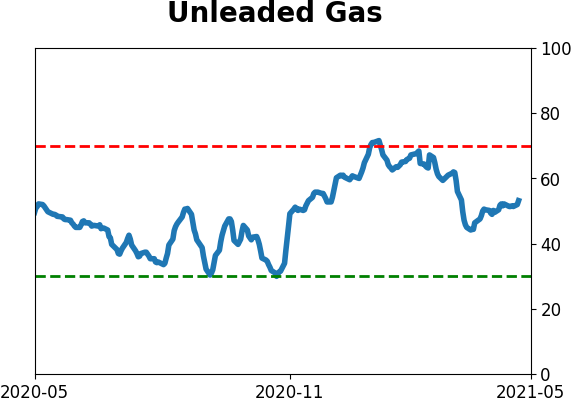
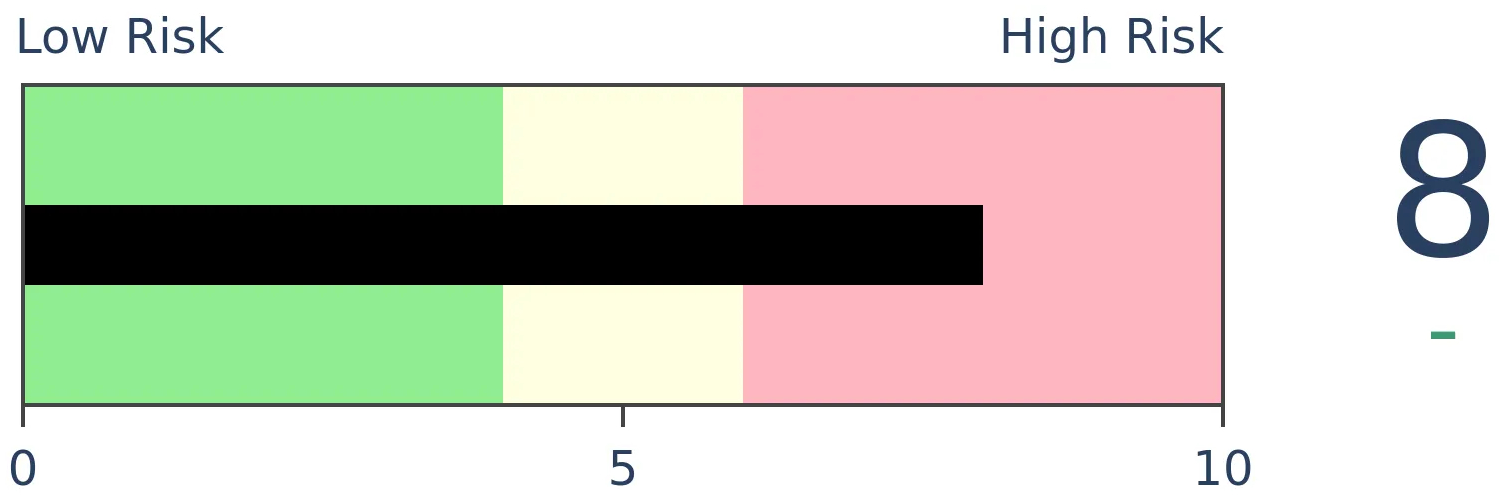
Crude Oil
|
|
Gold
|
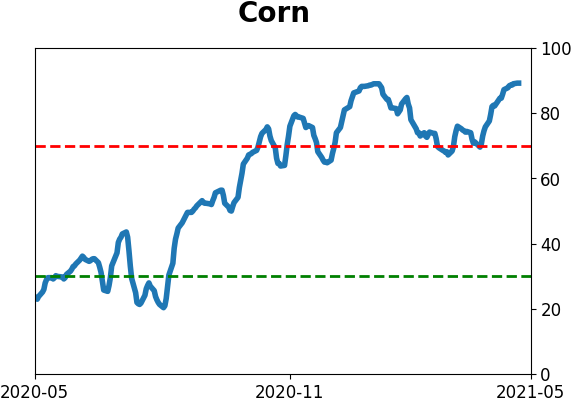
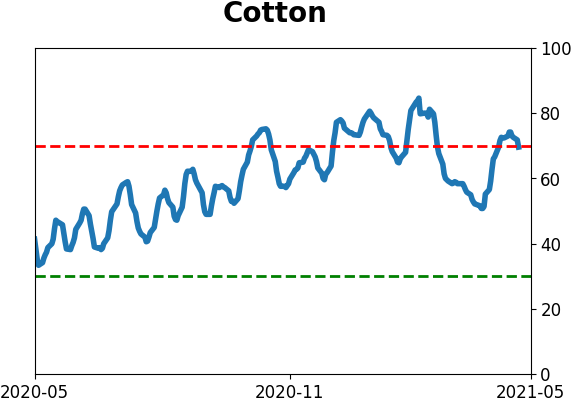
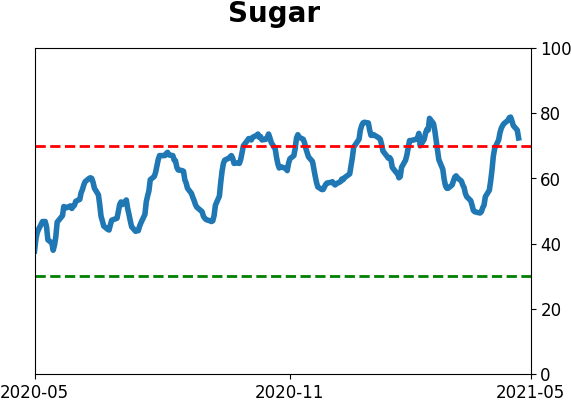
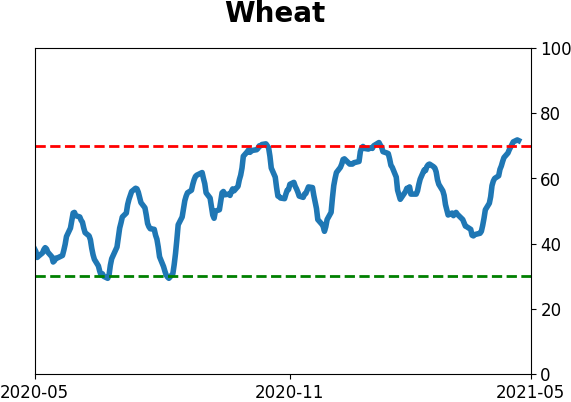
Agriculture
|
|
Research
BOTTOM LINE
April 2021 recorded some of the best breadth readings among S&P 500 stocks since 1928. For the entire month, trends in stocks across short-, medium-, and long-term time frames were among the best months ever. After similar monthly thrusts, stocks rarely lost much ground.
FORECAST / TIMEFRAME
SPY -- Up, Medium-Term
|
Since at least December, there have been two competing forces at work. They've both been so extreme and at opposite ends of the spectrum that we've never really seen the tension quite so high before.
Those two forces are sentiment and momentum. While they are often in conflict, what's unusual about the last few months is that we've seen the type of sentiment normally witnessed near the ends of bull markets. At the same time, we've seen momentum and thrusts normally witnessed at the beginnings of them.
It's all very odd, and there's no good way to reconcile them because there aren't any good historical precedents.
The momentum we've discussed isn't just the price gains in major averages. It's mostly the internal health of the moves, especially since October. Participation among stocks, industries, sectors, and even countries has been stellar - even record-breaking.
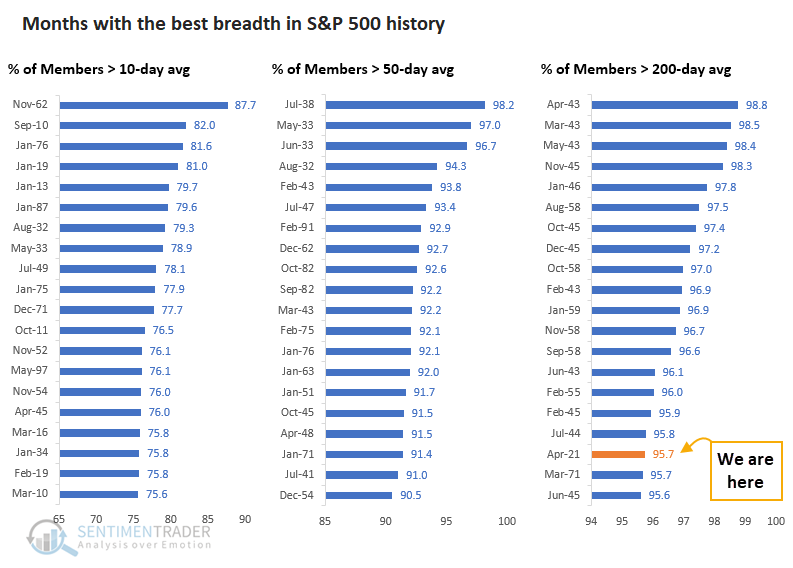
Bloomberg notes that April 2021 was the best month in history for one common indicator of market breadth. No other month had seen so many stocks hover above their 200-day moving averages.
"During 18 sessions this month through trading on Thursday, 95% or more of the index's members traded above their 200-day moving average. That's the most days ever observed in a single calendar month and double the previous high of nine days in September 2009." - Bloomberg
The Bloomberg article highlighted the percentage of S&P 500 members trading above their 200-day moving averages. But last month stands out for showing among the best trends ever across short-, medium-, and long-term time frames.
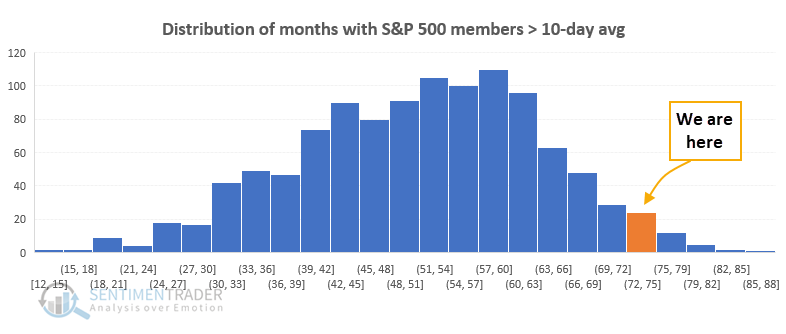
During the entire month of April, 73% of S&P members traded above their 10-day moving averages on an average day. That puts last month near the far right on the distribution curve of all months.
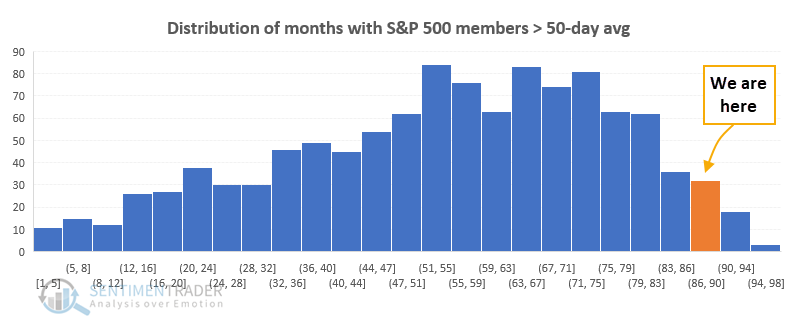
Looking at a medium-term time frame, last month 88% of S&P members traded above their 50-day moving averages on an average day. That puts us even further out on the right side of the curve.
And on a long time frame, 96% of S&P members traded above their 200-day moving averages on an average day last month. That ranks among the greatest of all months since 1928.
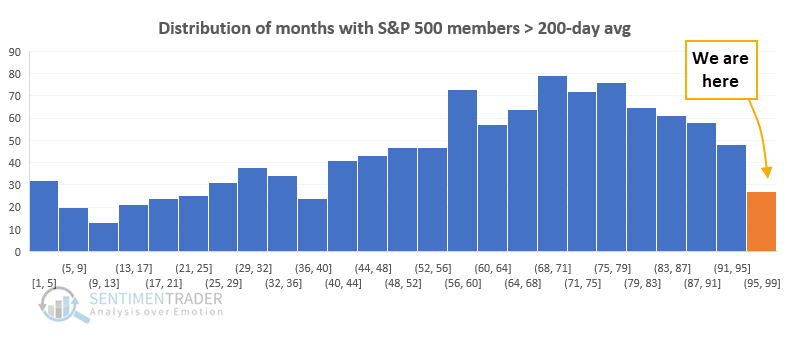
Looking at all three time frames, April 2021 made the top 20 months only with the percentage trading above their 200-day averages.
Even so, last month ranked relatively high on all 3 metrics, as we could see from the distribution graphs above. When we average all 3 together, April 2021 ranked as the 7th best breadth month ever.
We can see the S&P's future returns after the 20 best months across all 3 breadth metrics.

Almost all of these monthly breadth thrusts triggered in the first year or so of a bull market following a protracted or sharp decline. Here's the kicker and the reason we've been struggling so much with the sentiment vs. momentum tension in recent months...on average, the S&P 500 was 39% below its all-time high when these thrusts triggered.
Only 2 months saw a monthly thrust when the S&P was within 5% of its high, last month and December 1954. We can see in the table above that the latter saw a shorter-term dip then choppy upside over the next few months before taking off again.
Three others triggered when the S&P was within 5% - 10% of its peak:
- January 1963 - choppy first couple of months, then nice rally
- October 1982 - massive, sustained rally from the get-go
- January 2013 - modest shorter-term gains, sustained through the year
The incredible trends from April were historic. Not just the magnitude but also the context. There have been few precedents in history, which makes relying on historical behaviors...challenging.
Overall, stocks held up well after other thrusts, especially over the next 2-3 months. The biggest issue now is that the few other times these kinds of thrusts triggered when stocks were relatively close to their highs, only once did we see large, sustained gains right away (in 1982). Also, we have the seasonality/sentiment issues noted on Tuesday.
The biggest takeaway here is that other than some long-ago exceptions, these displays of broad participation have typically not led to large, sustained declines, especially over a multi-month time frame. That's a warning against becoming overly bearish.
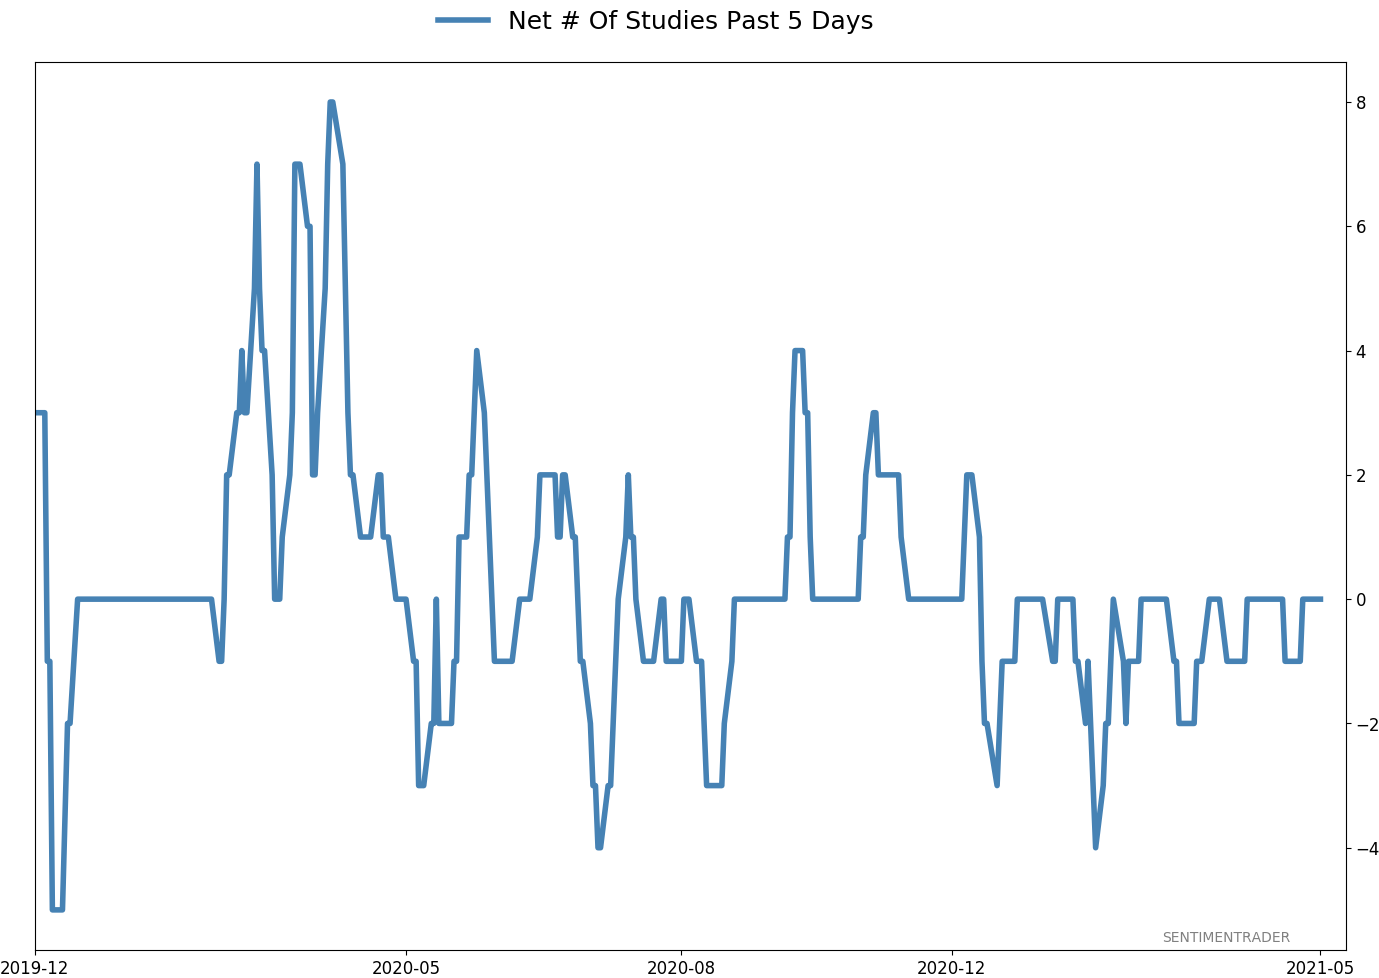
Active Studies
| Time Frame | Bullish | Bearish | | Short-Term | 0 | 0 | | Medium-Term | 1 | 11 | | Long-Term | 11 | 4 |
|
Indicators at Extremes
Portfolio
| Position | Description | Weight % | Added / Reduced | Date | | Stocks | RSP | 0.0 | Reduced 4.9% | 2021-04-22 | | Bonds | 30.0% BND, 8.8% SCHP | 37.9 | Added 15.1% | 2021-02-18 | | Commodities | GCC | 2.5 | Reduced 2.1%
| 2020-09-04 | | Precious Metals | GDX | 9.8 | Added 0.1% | 2021-02-18 | | Special Situations | 4.3% XLE, 2.2% PSCE | 6.5 | Reduced 5.6% | 2021-04-22 | | Cash | | 43.3 | | |
|
Updates (Changes made today are underlined)
I've made no adjustments for months, as the situation remained essentially stuck - energy was doing what it should, sentiment in the broader market was ridiculously stretched but with no major warning signs, and sentiment toward gold and bonds appeared overdone on the pessimistic side. Those conditions have started to reverse a bit, so I further reduced my risk. There are still no major warning signs, but I'm getting increasingly uncomfortable and would prefer to sit safely in cash and wait for better risk/reward opportunities. RETURN YTD: 8.0% 2020: 8.1%, 2019: 12.6%, 2018: 0.6%, 2017: 3.8%, 2016: 17.1%, 2015: 9.2%, 2014: 14.5%, 2013: 2.2%, 2012: 10.8%, 2011: 16.5%, 2010: 15.3%, 2009: 23.9%, 2008: 16.2%, 2007: 7.8%
|
|
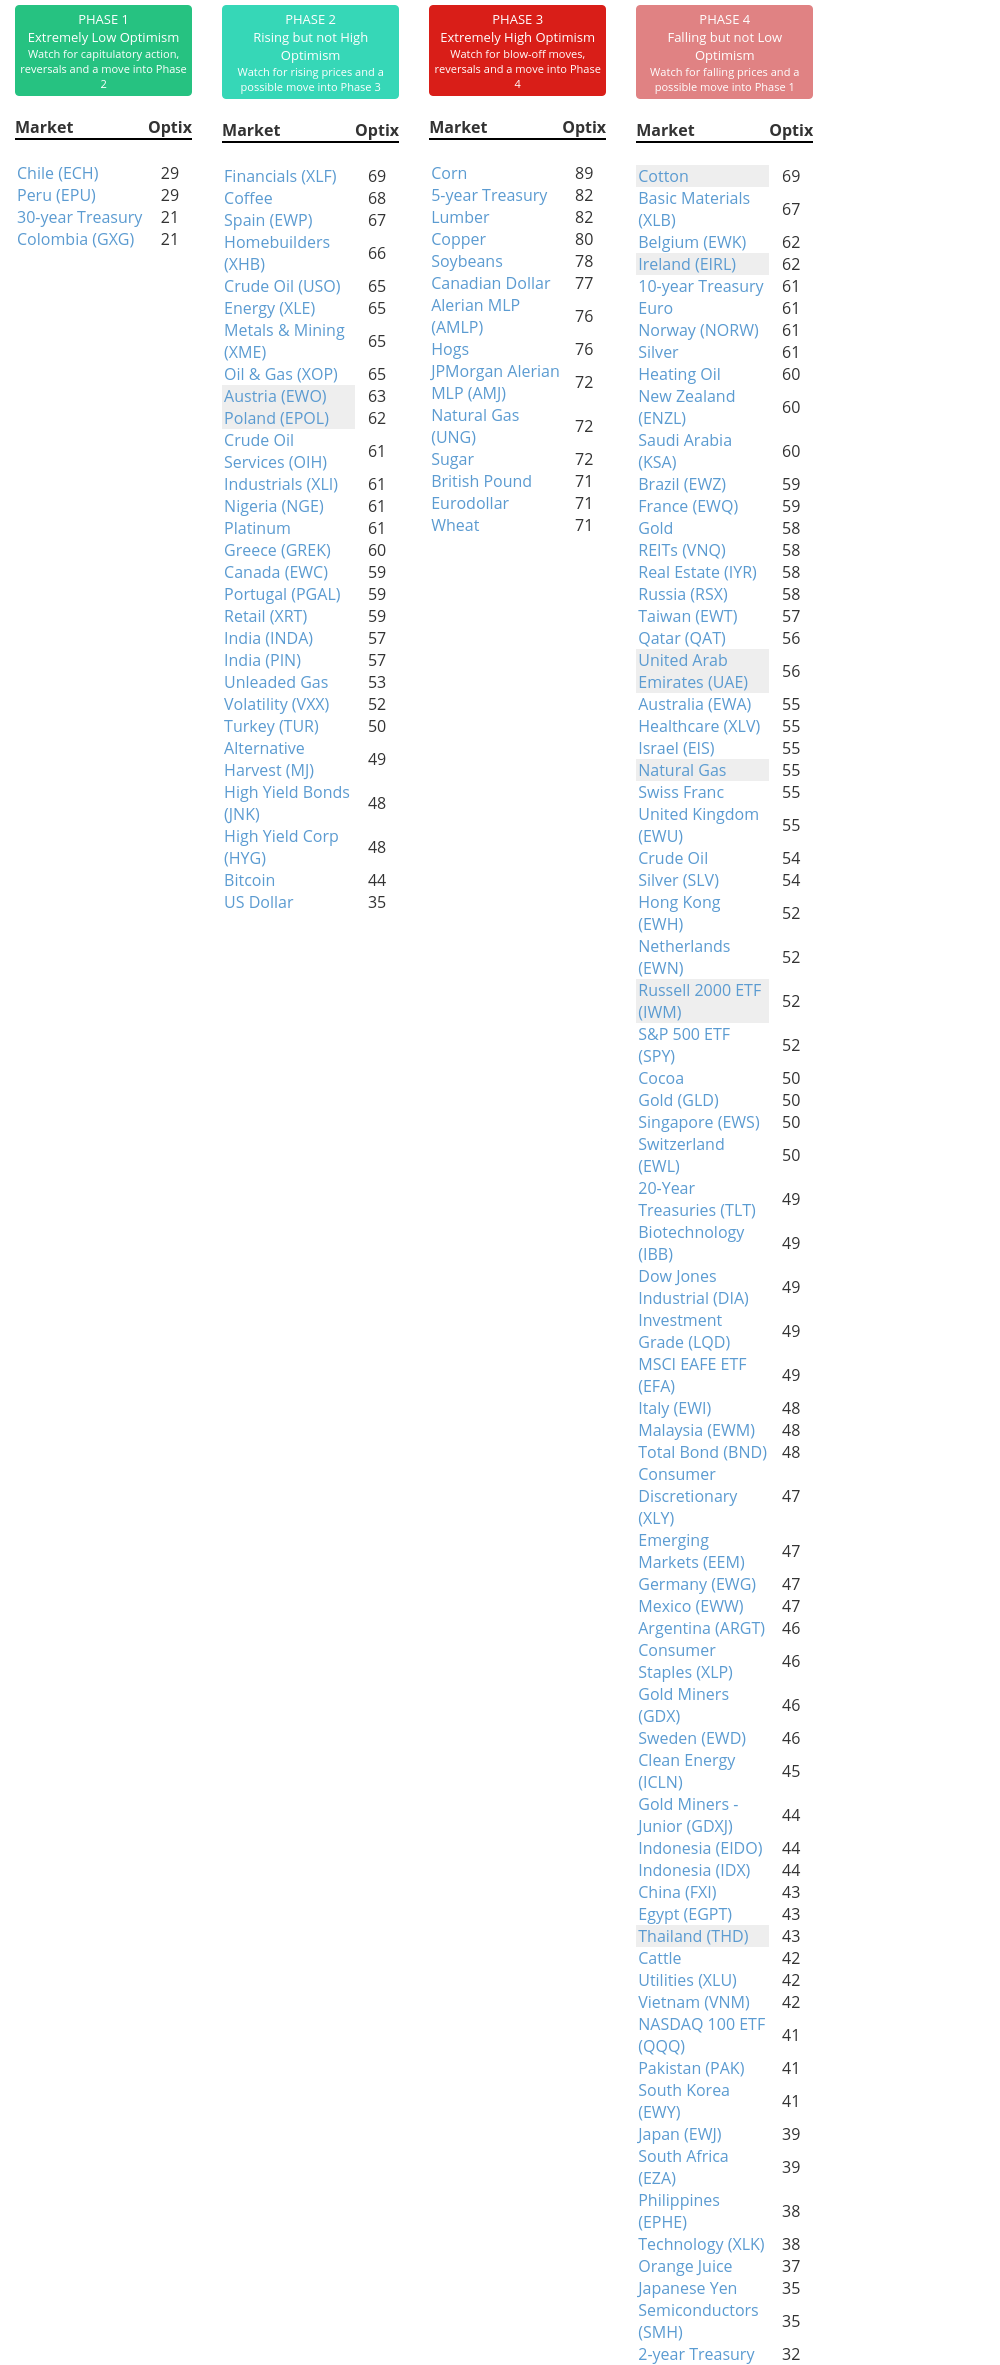
Phase Table
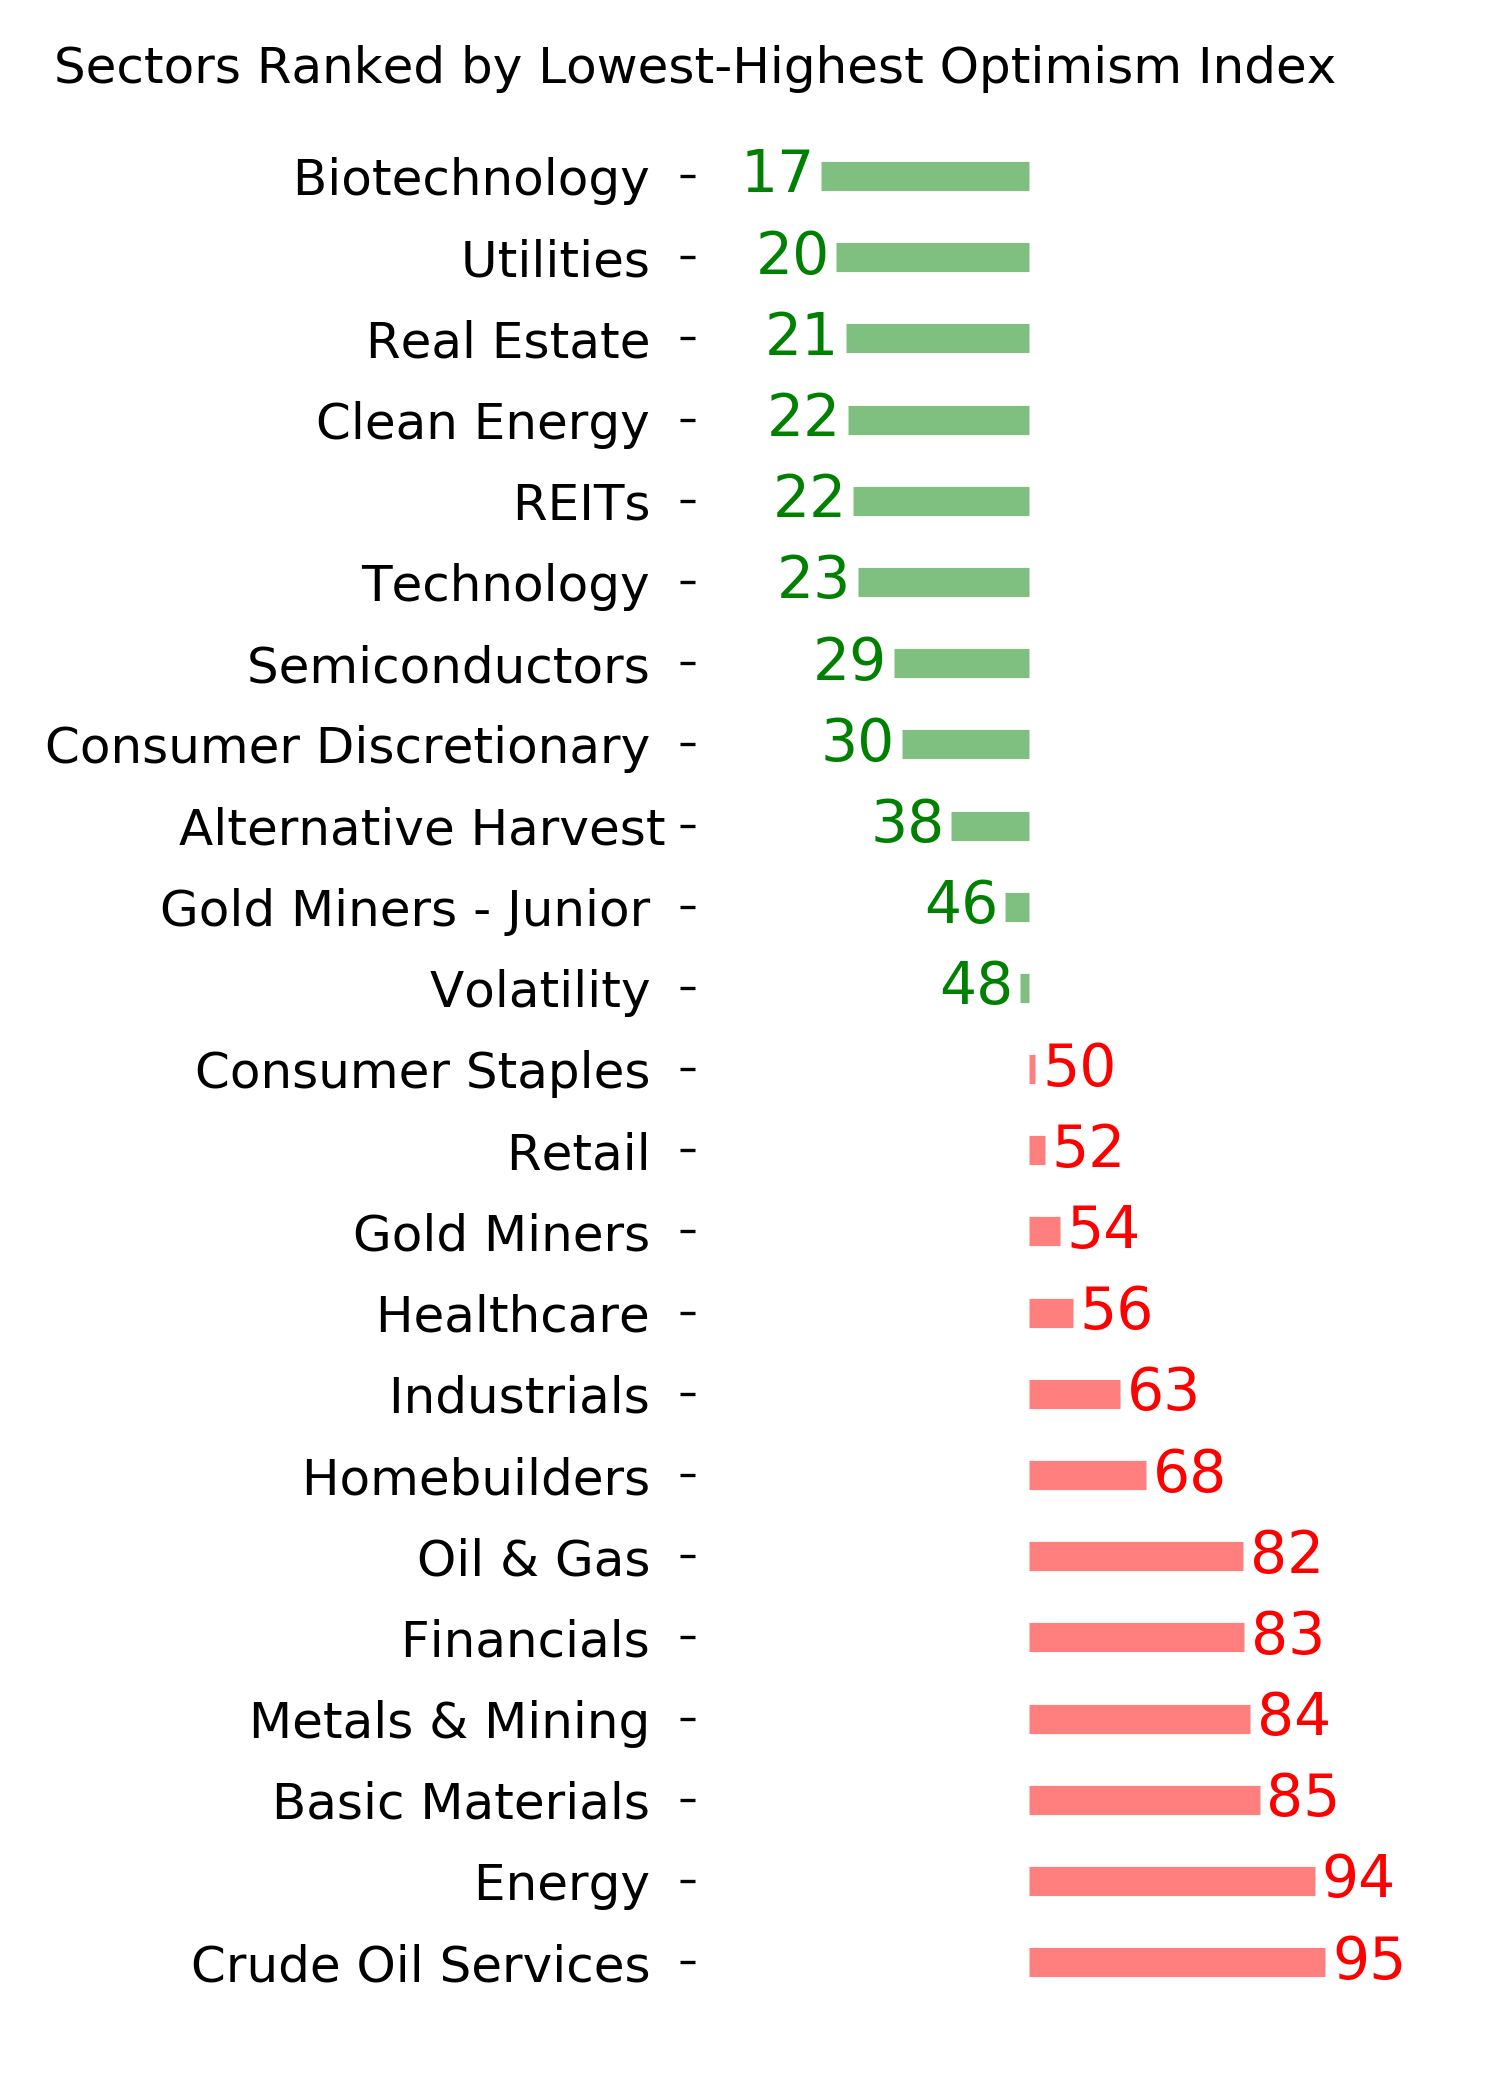
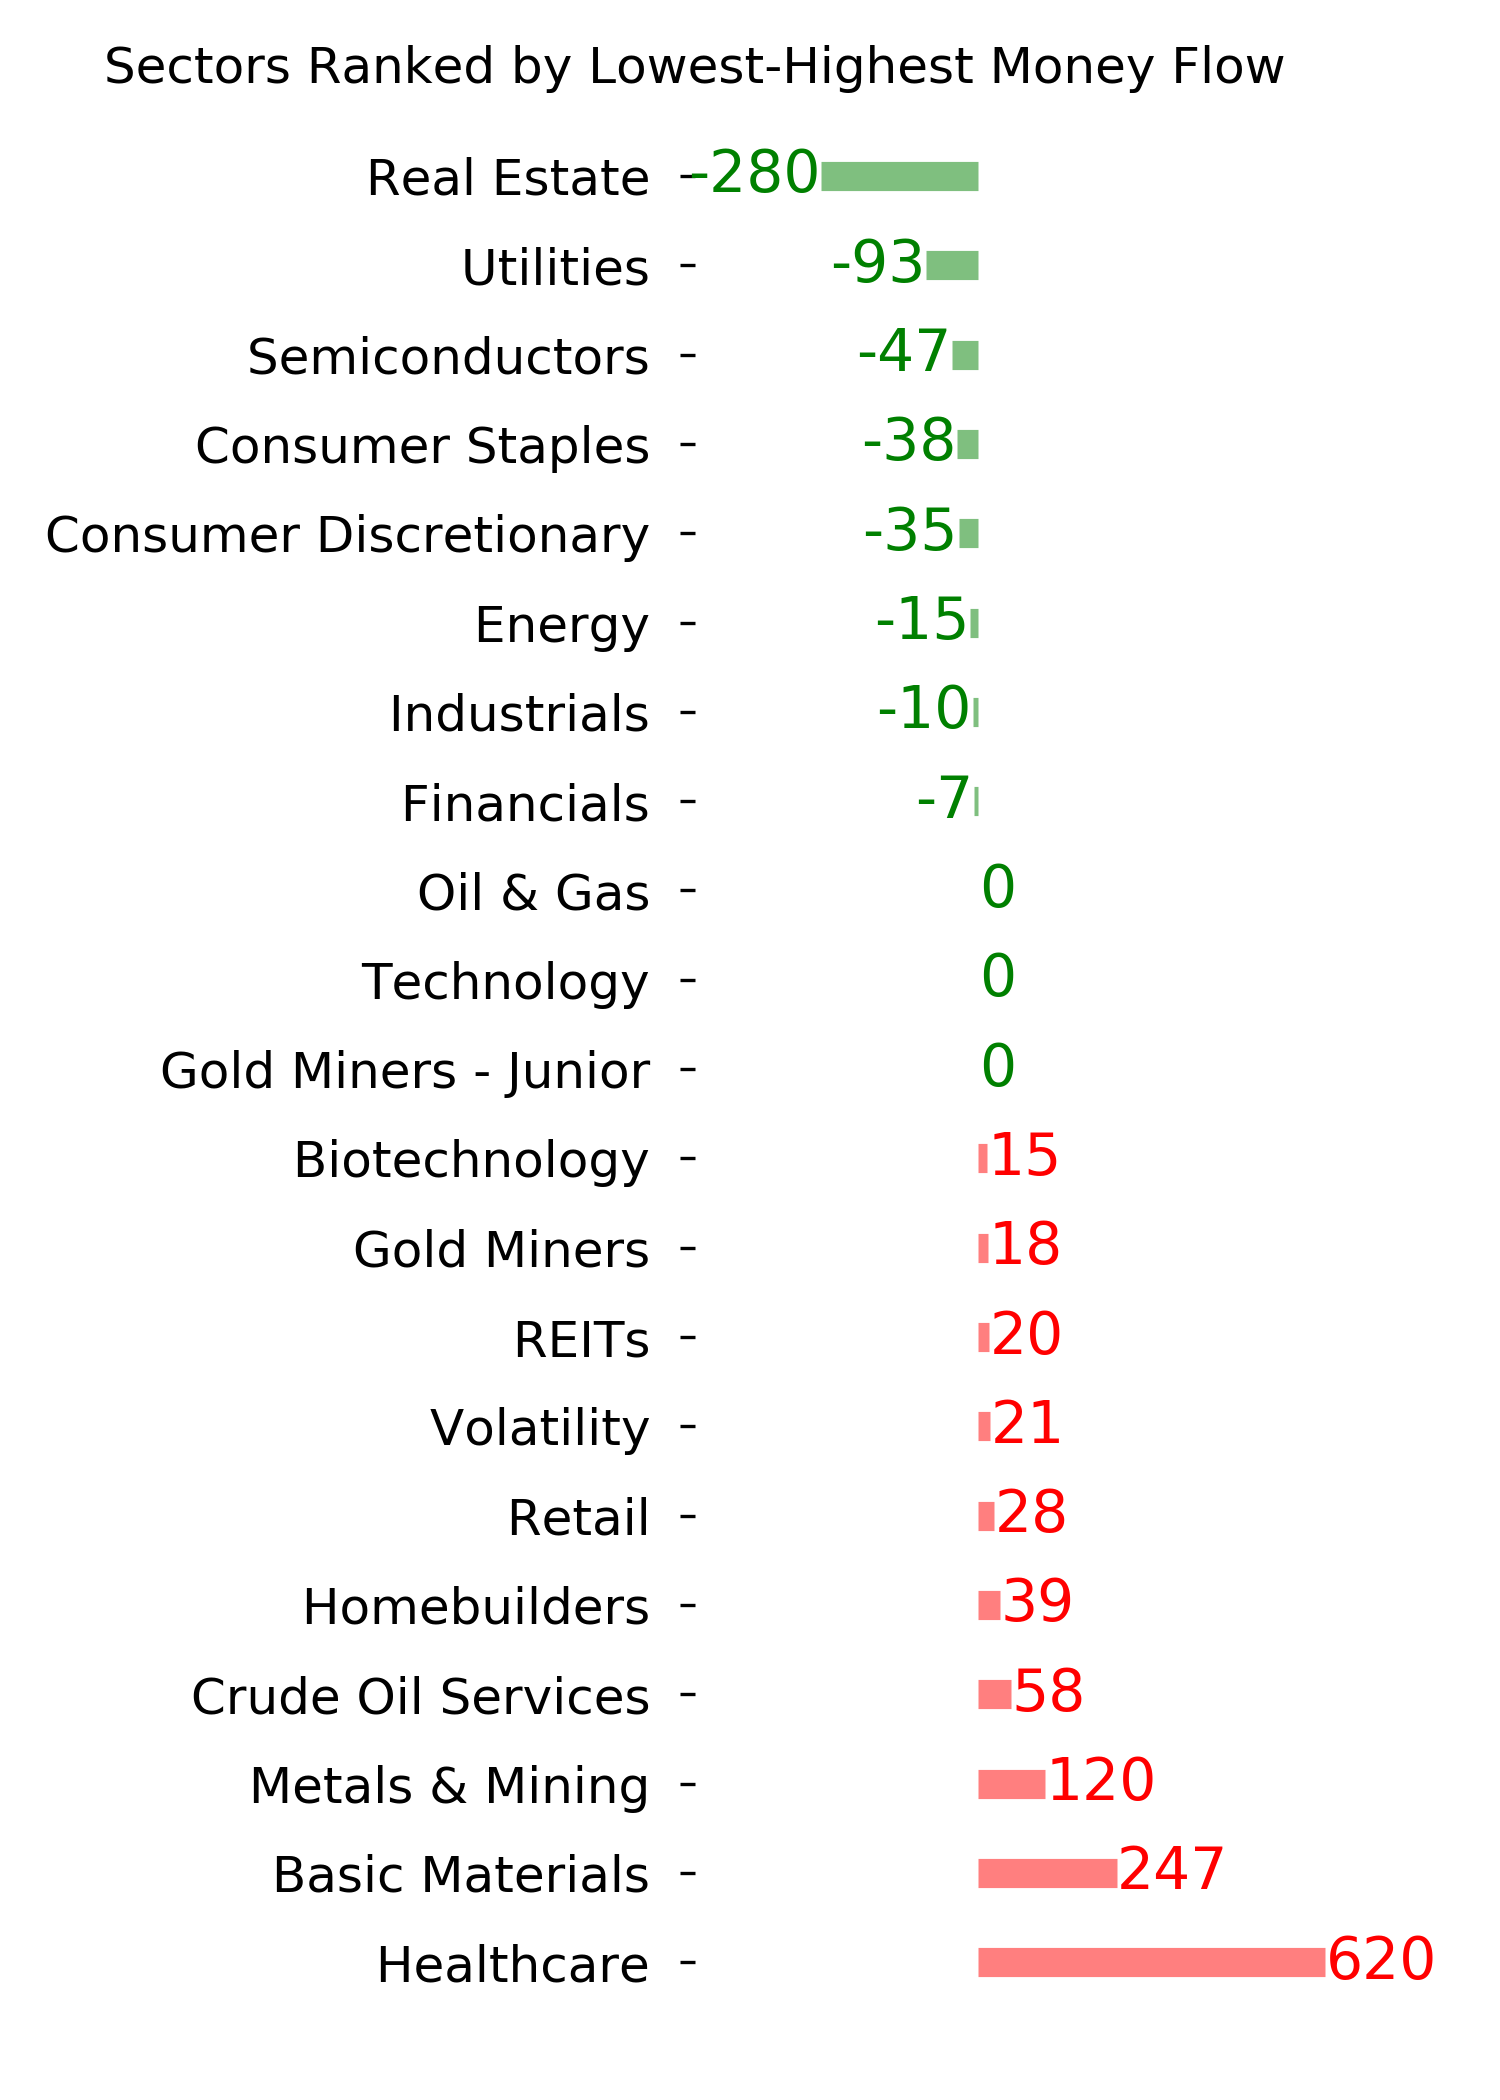
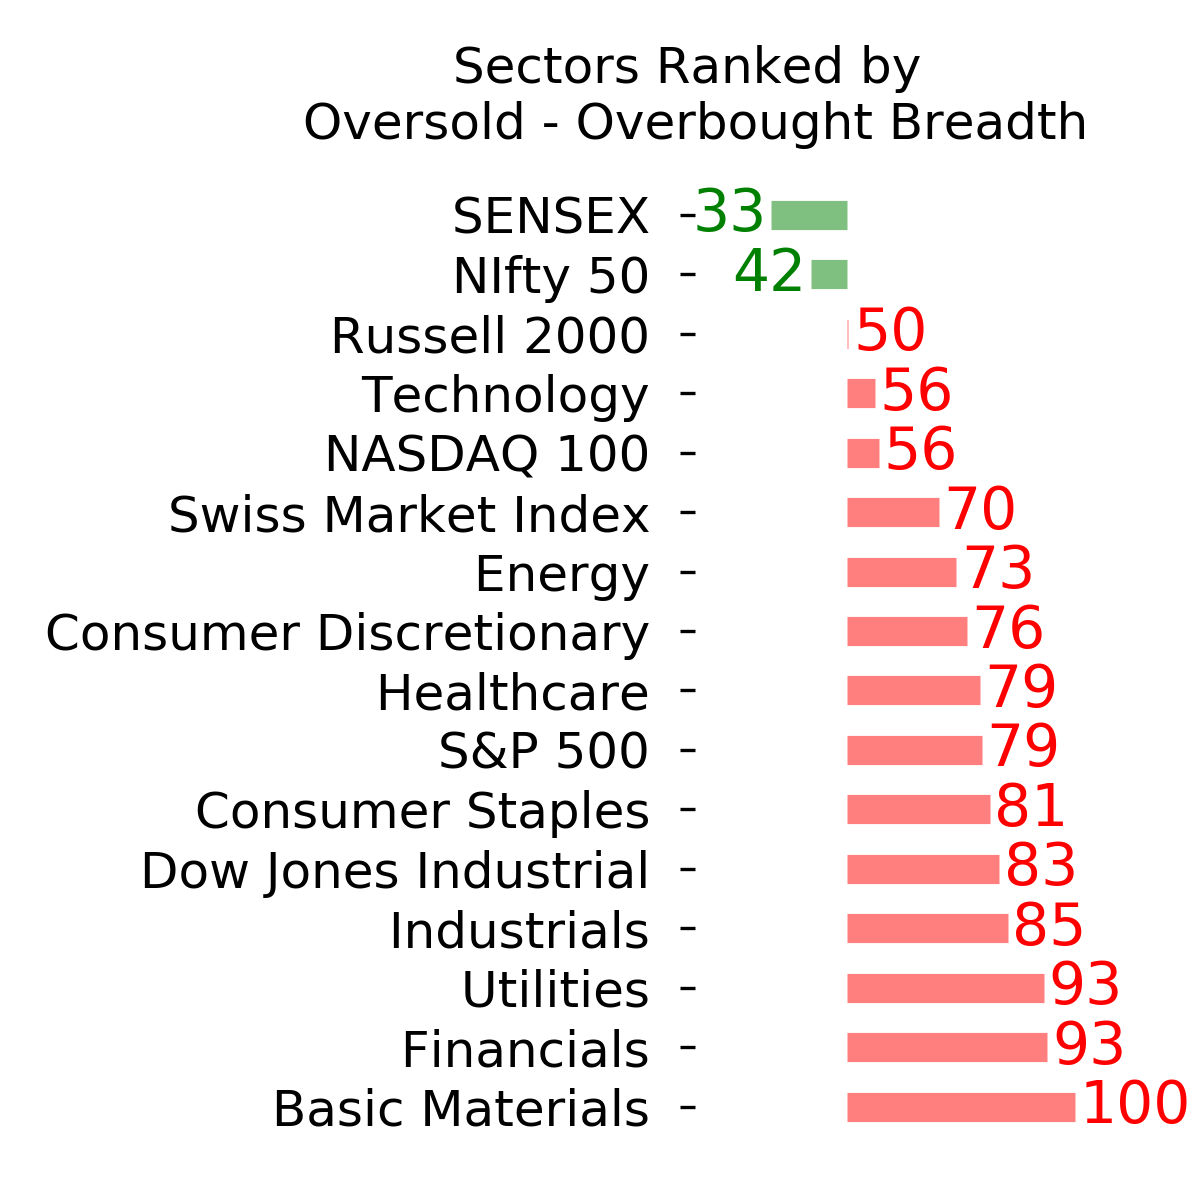
Ranks
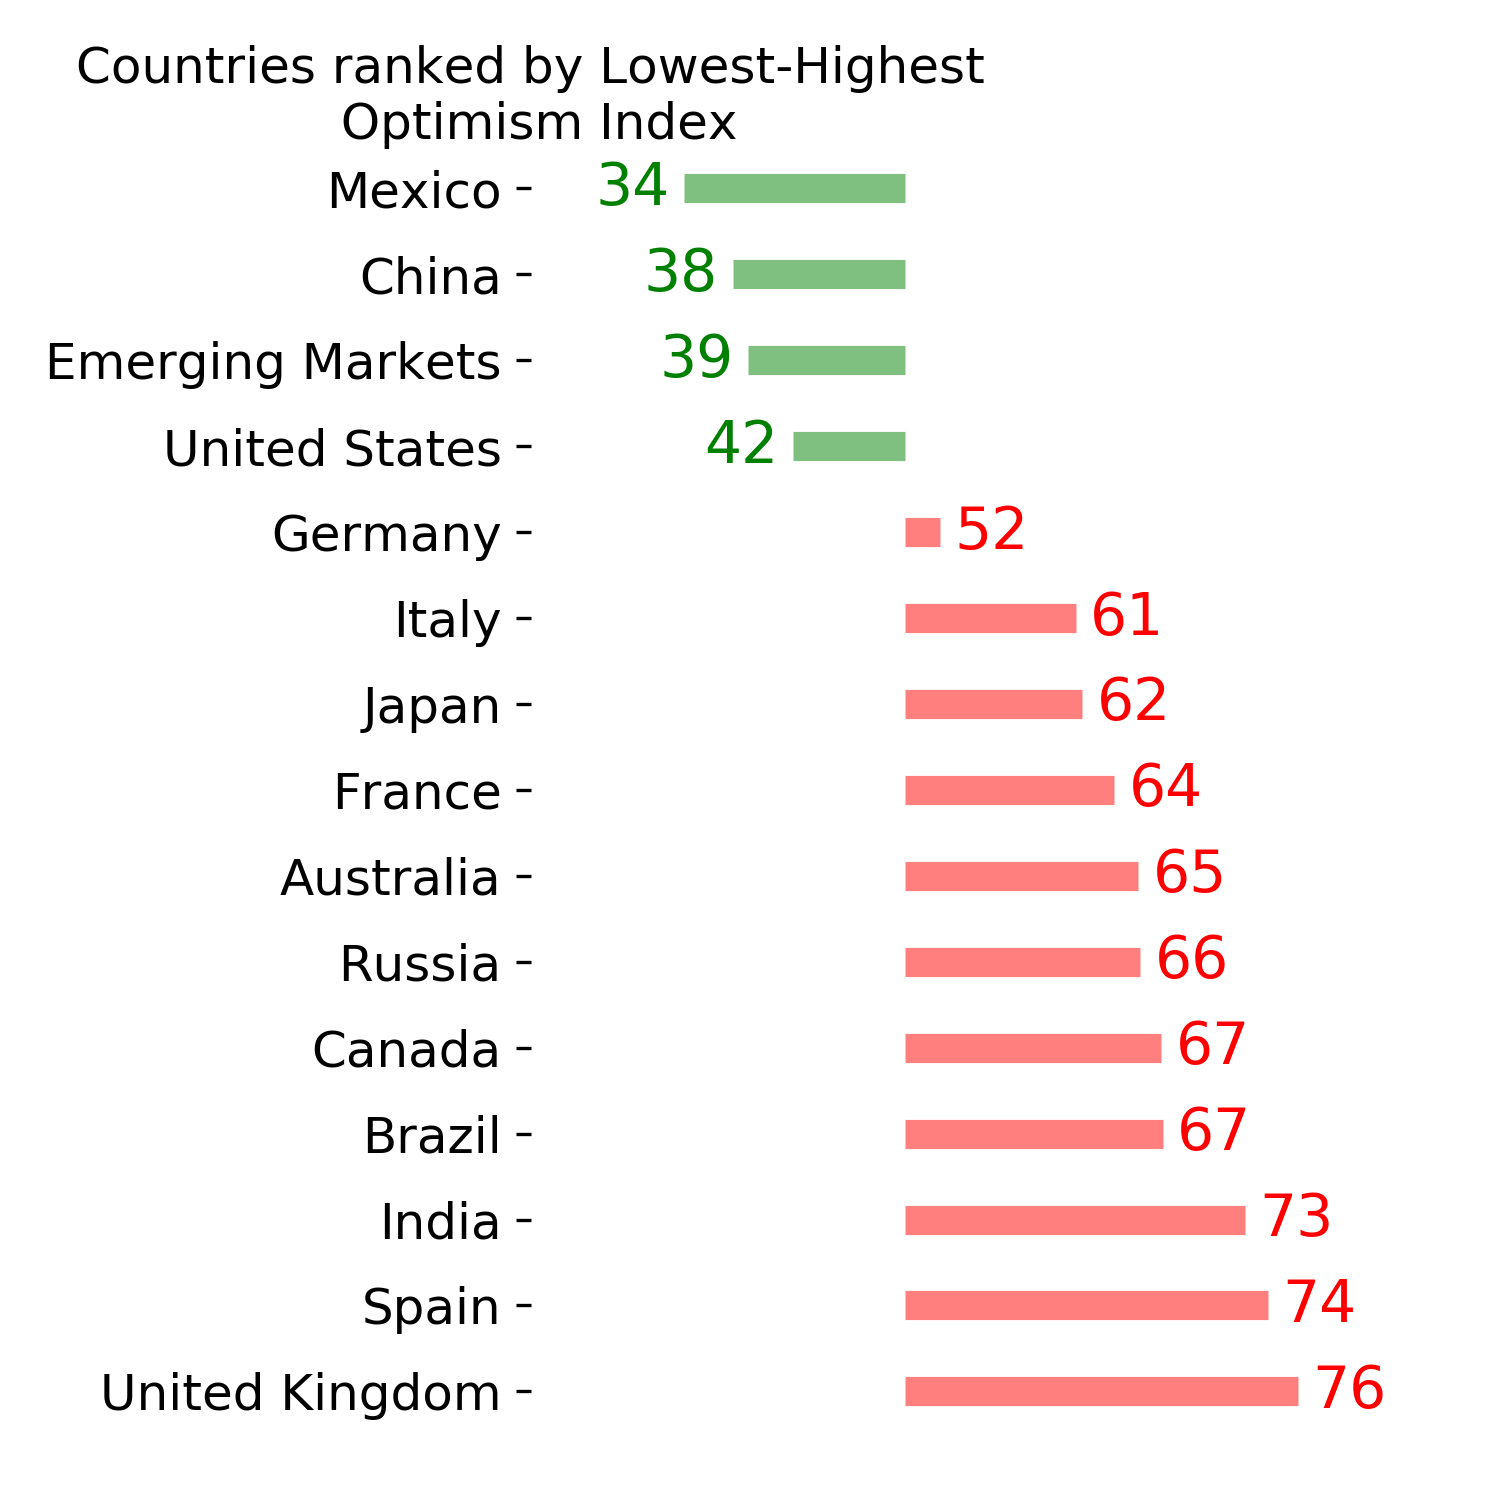
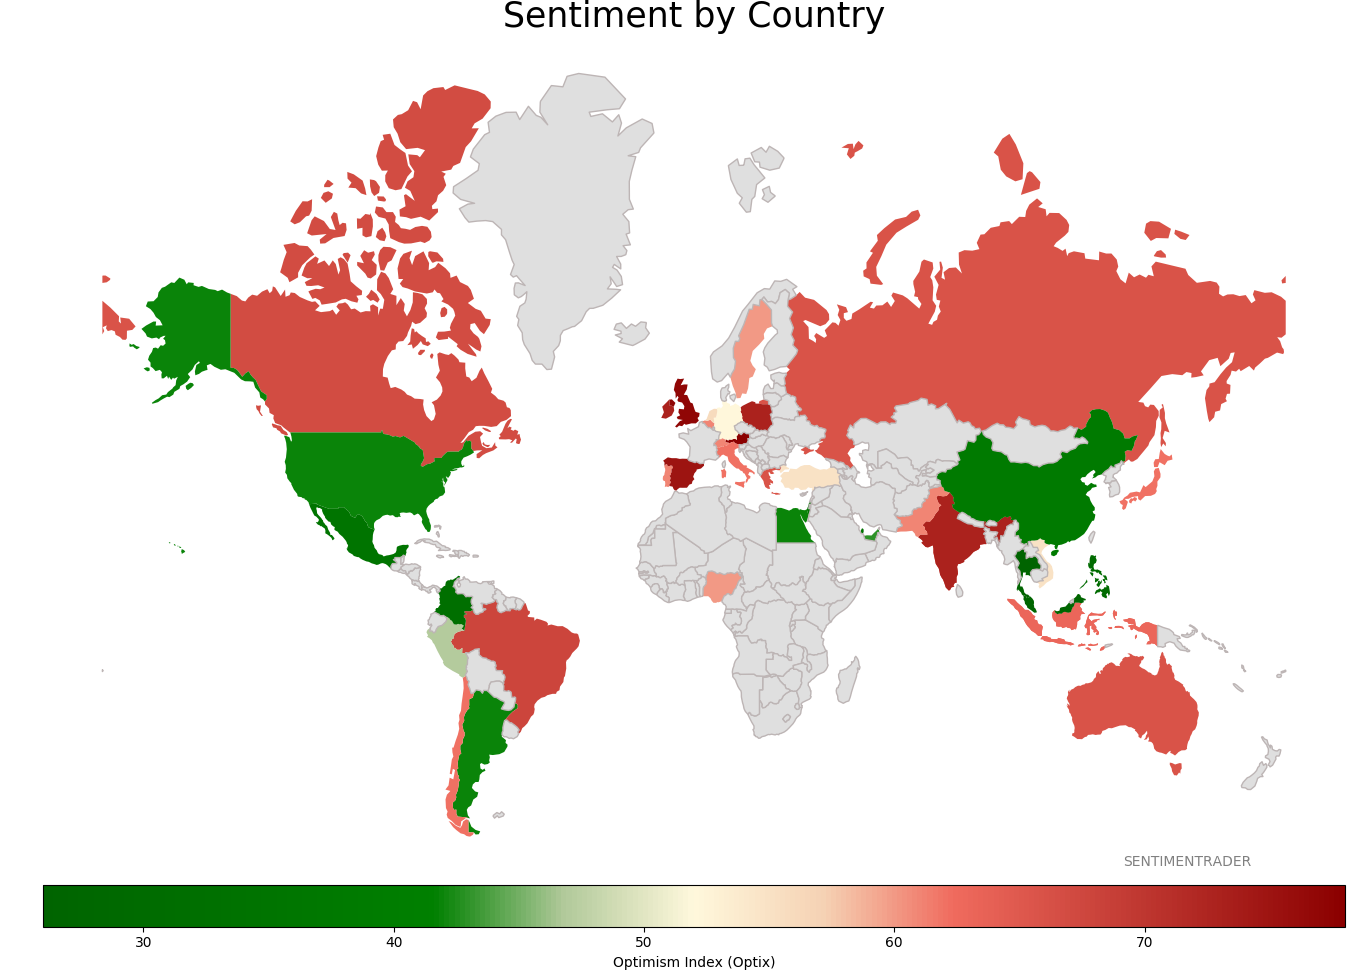
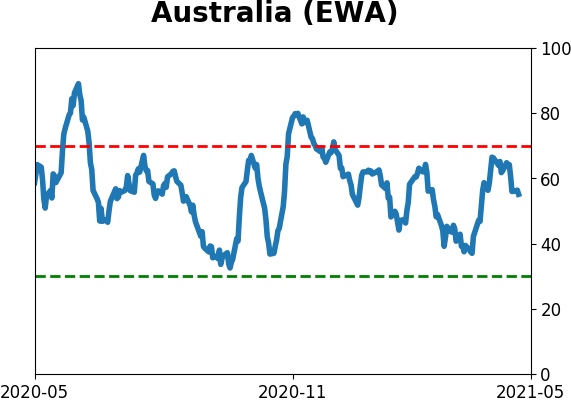
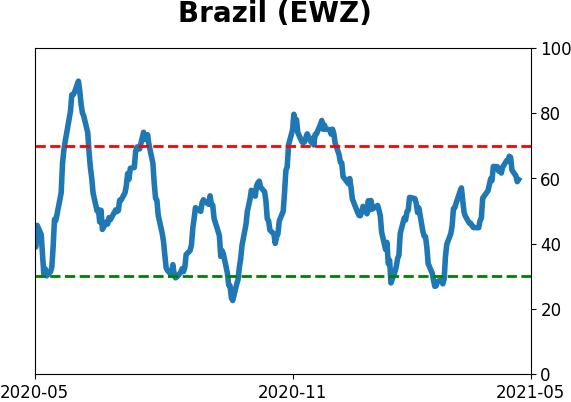
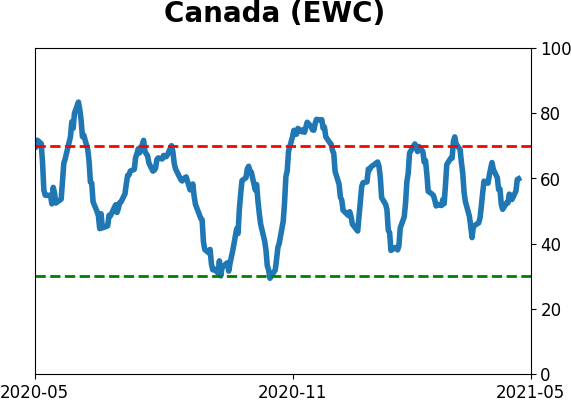
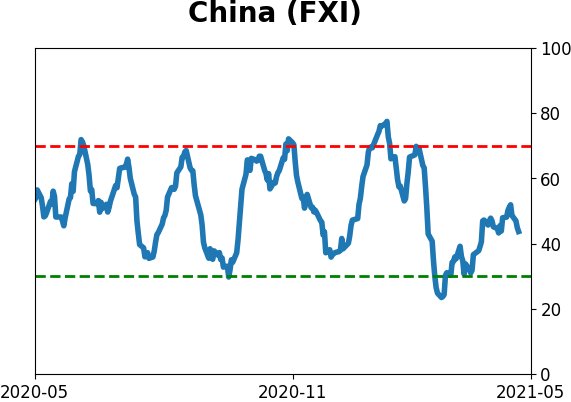
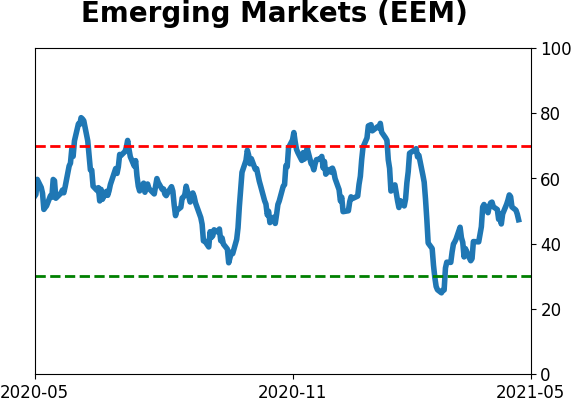
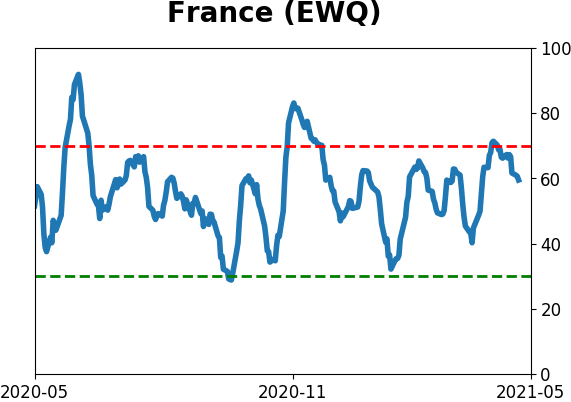
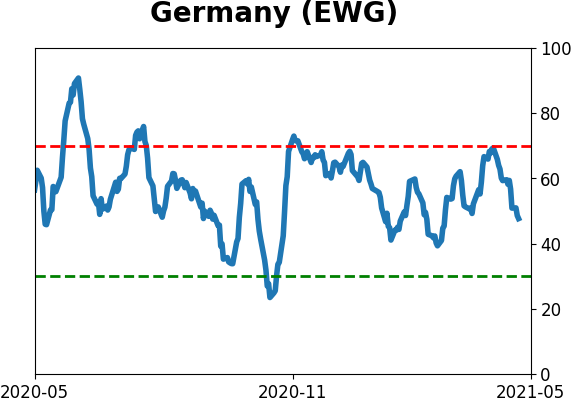
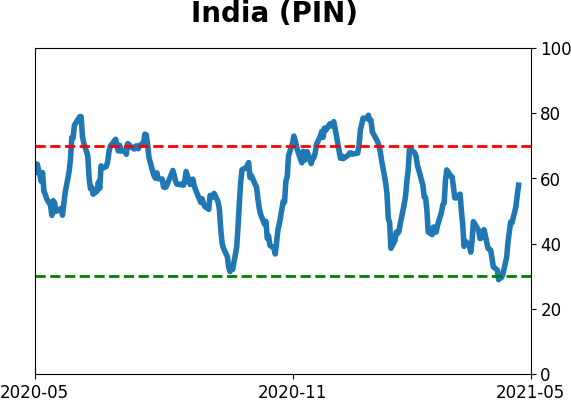
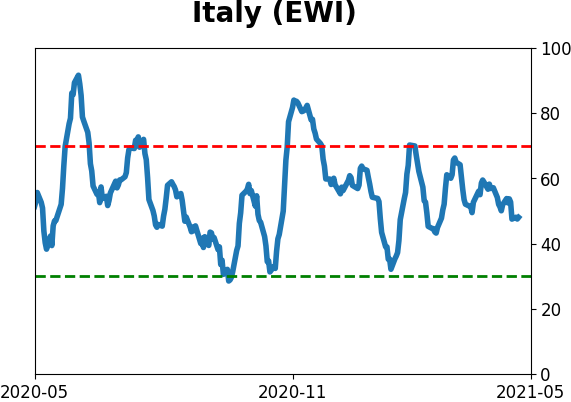
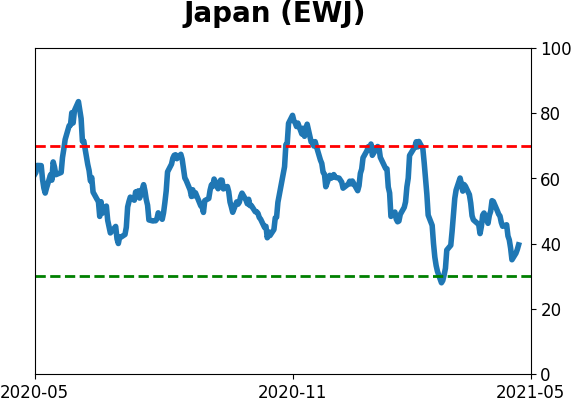
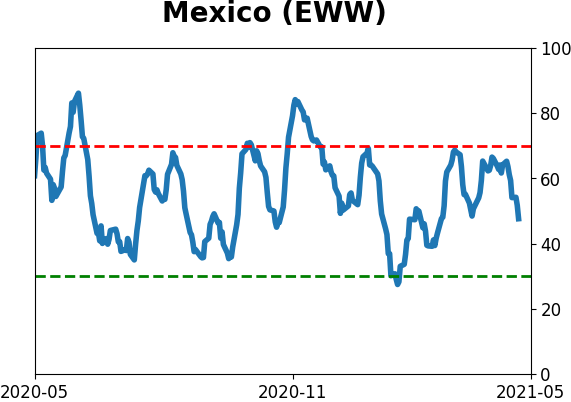
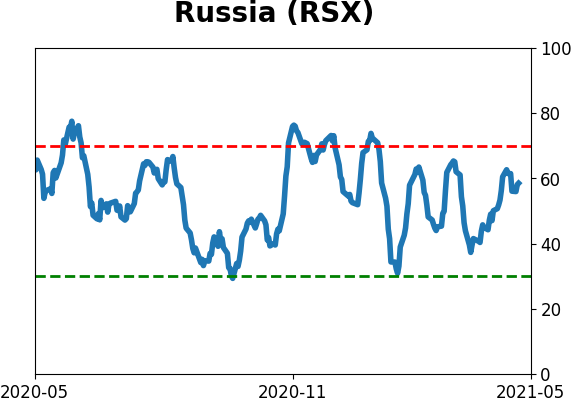
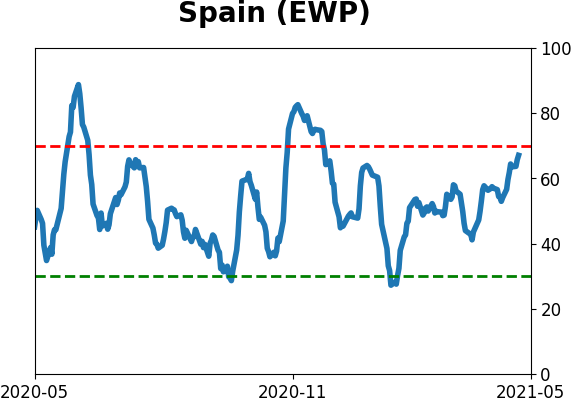
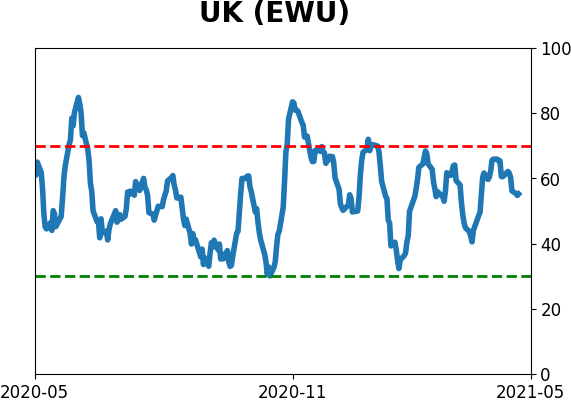
Sentiment Around The World
Optimism Index Thumbnails
|
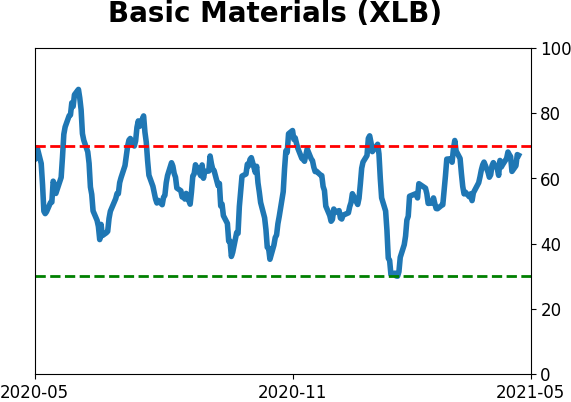
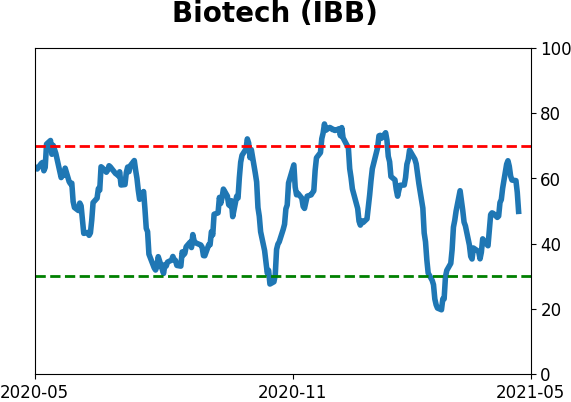
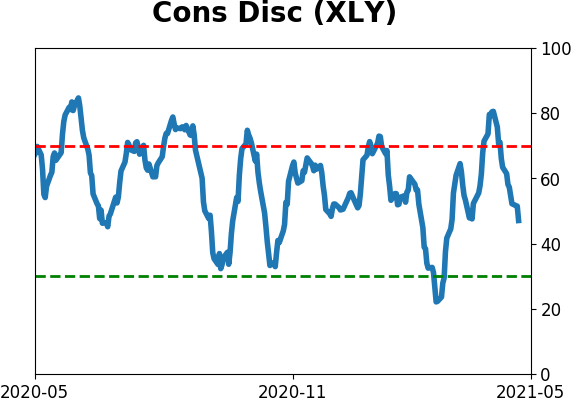
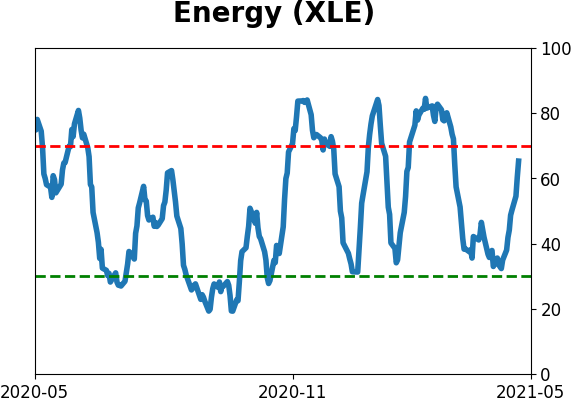
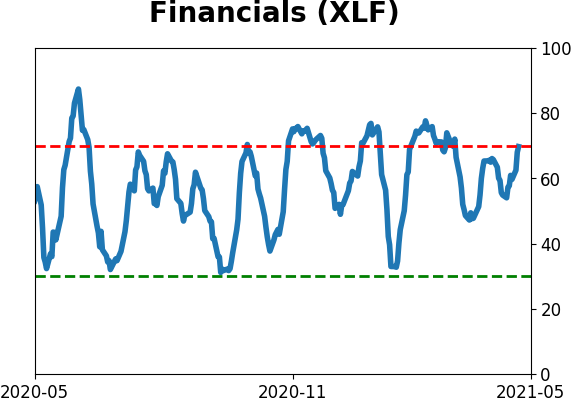
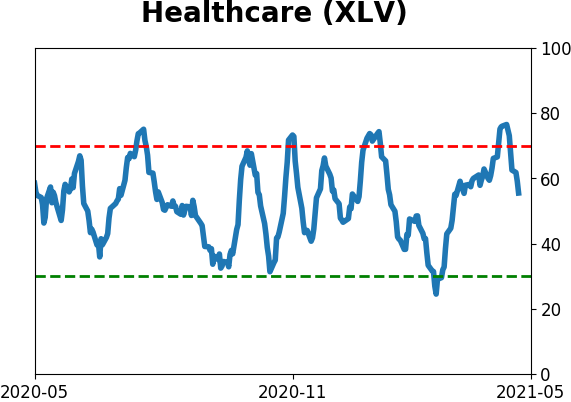
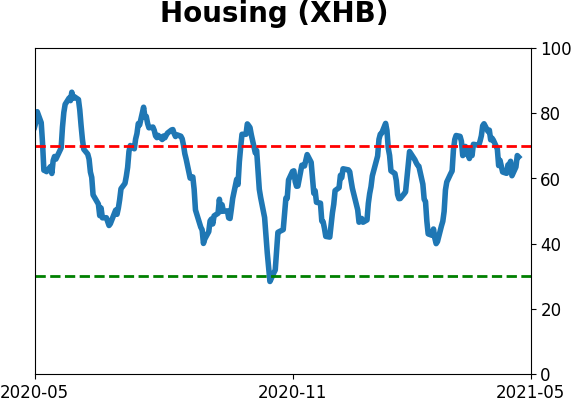
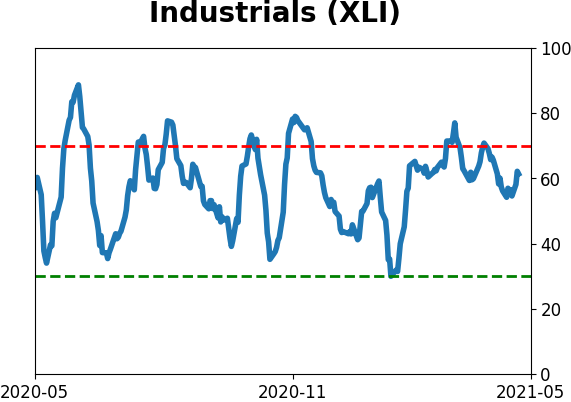
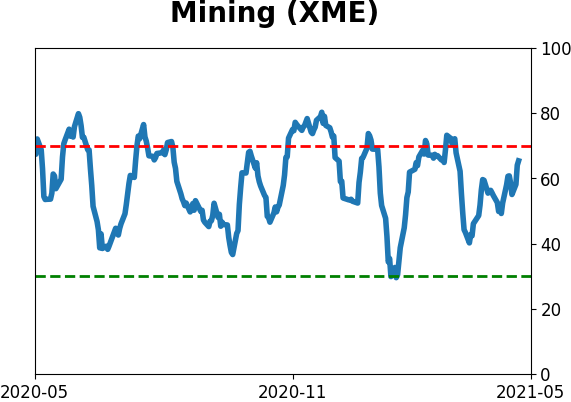
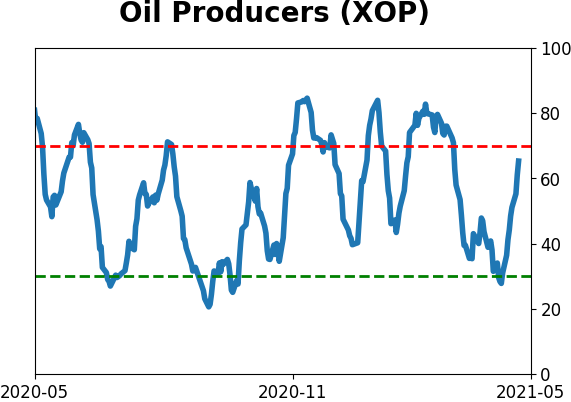
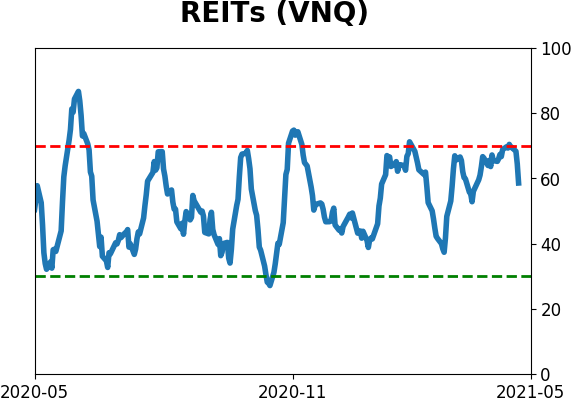
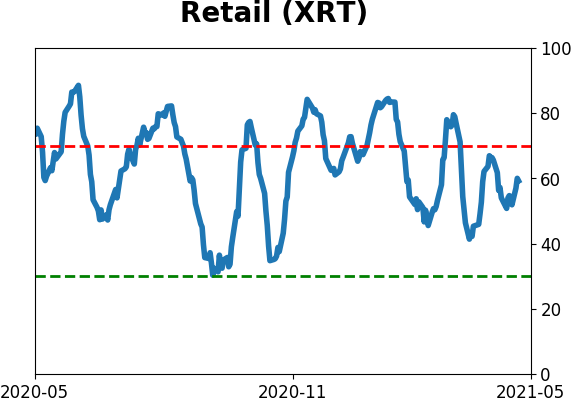
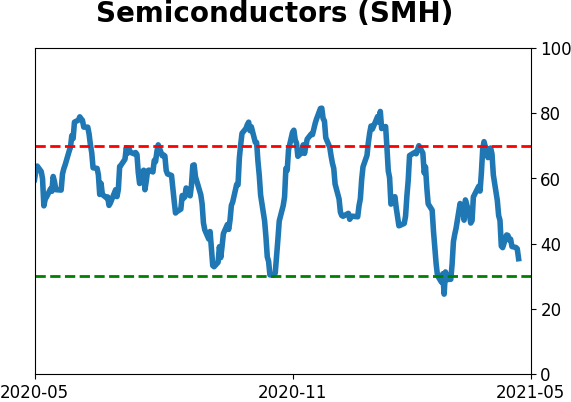
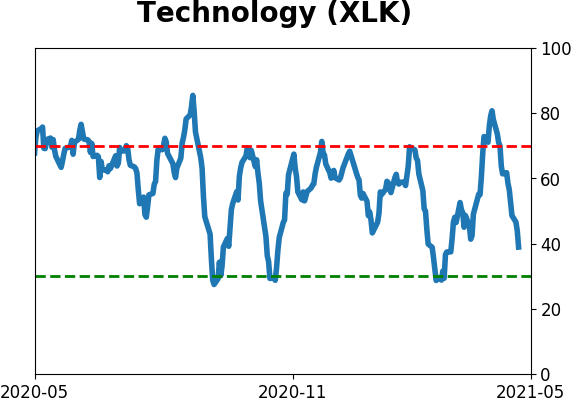
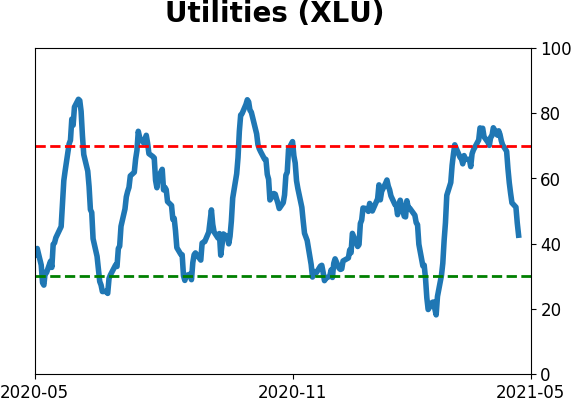
Sector ETF's - 10-Day Moving Average
|
|
|
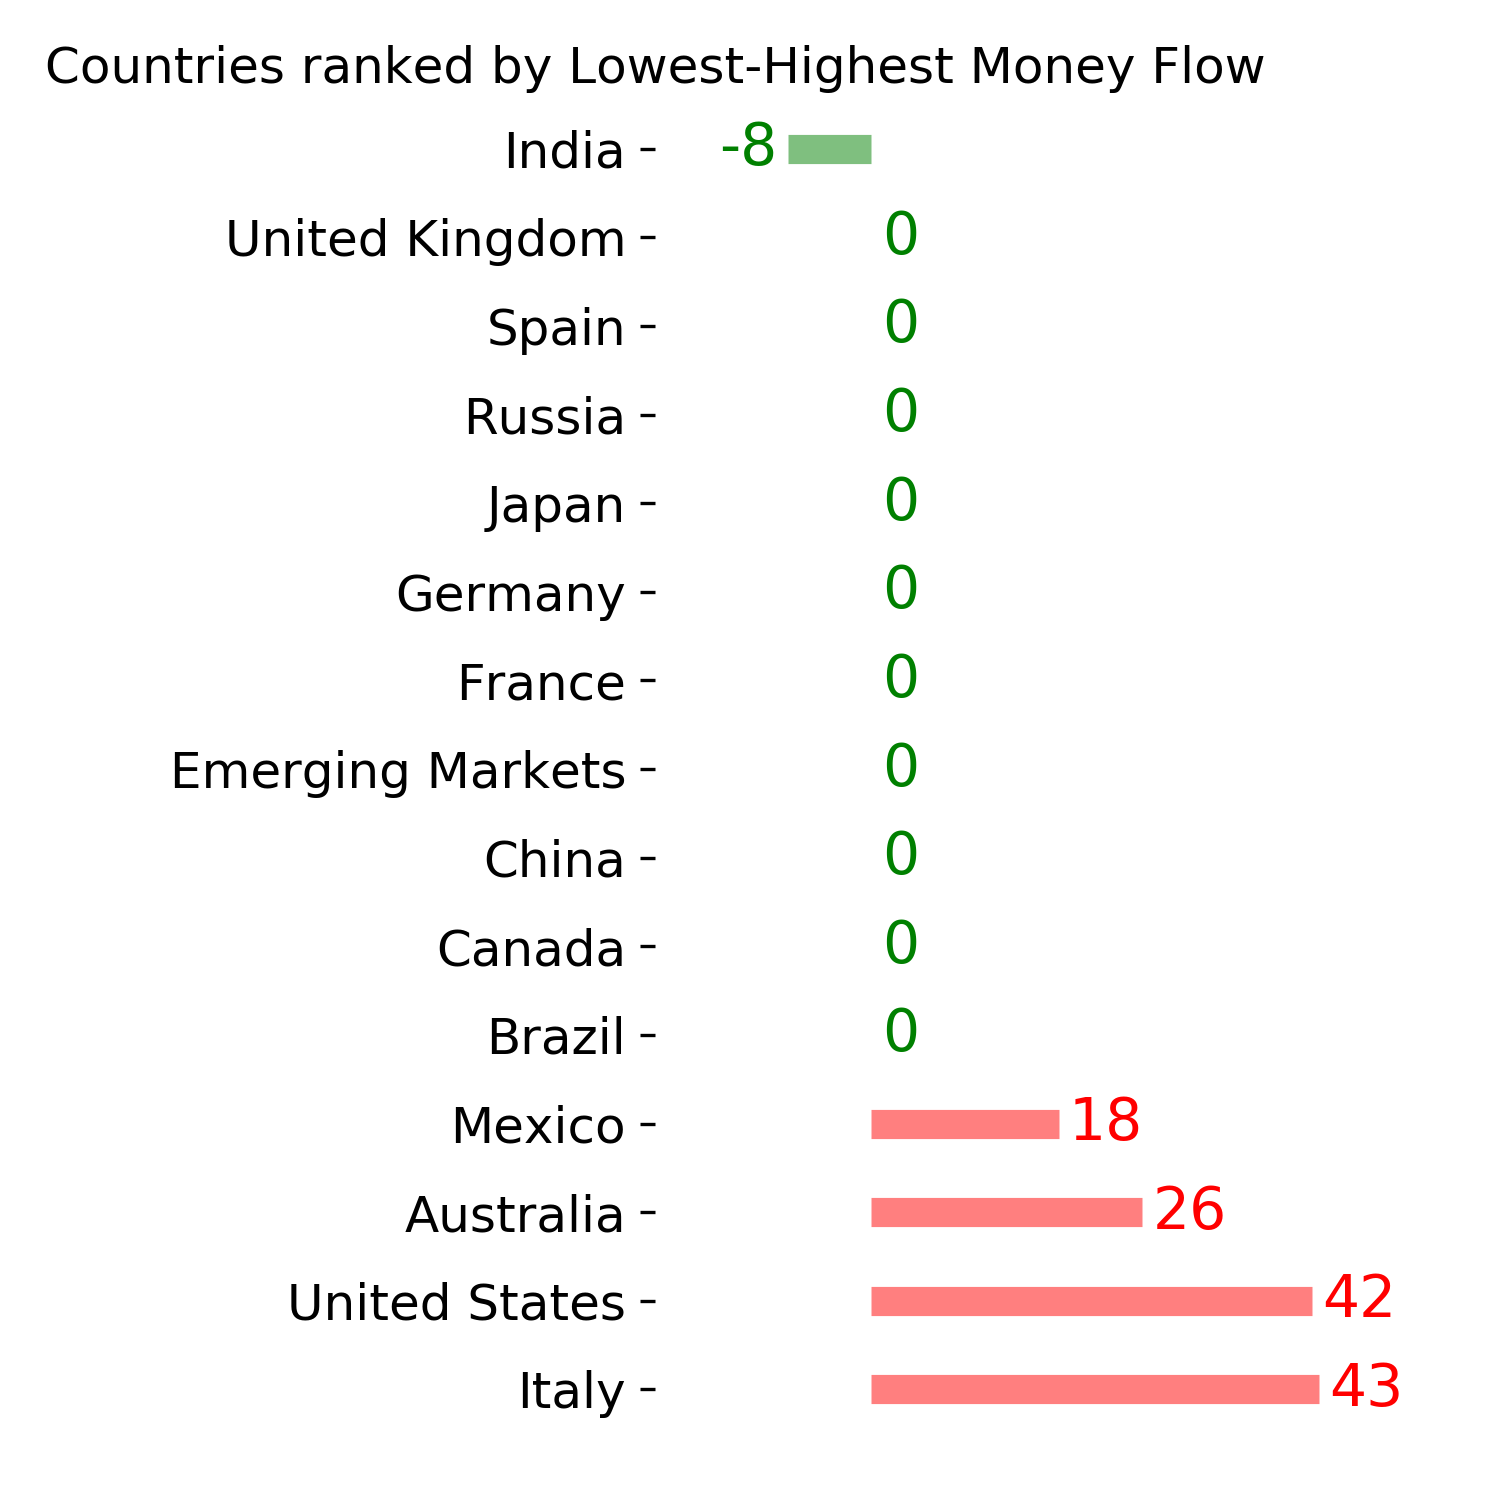
Country ETF's - 10-Day Moving Average
|
|
|
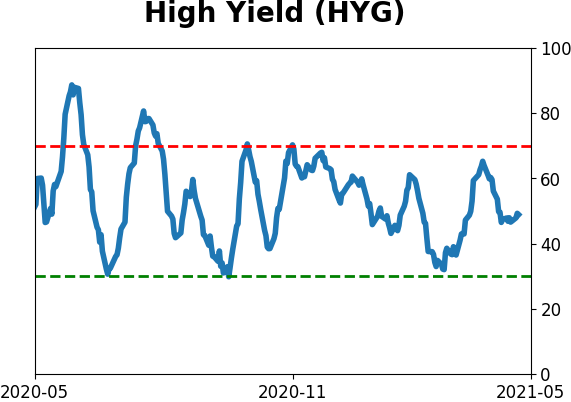
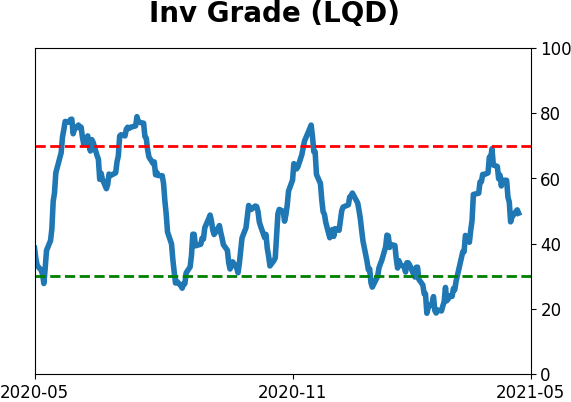
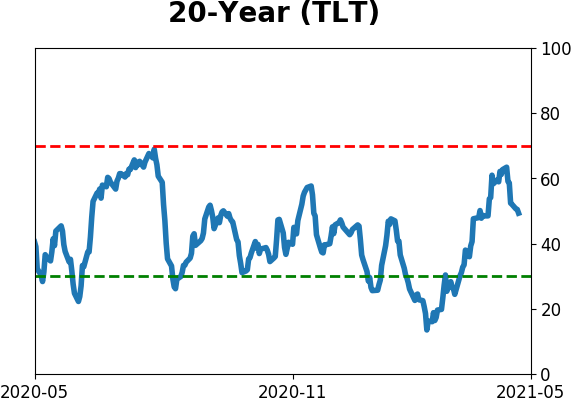
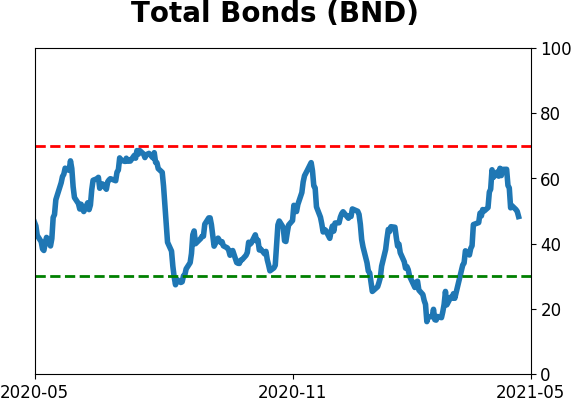
Bond ETF's - 10-Day Moving Average
|
|
|
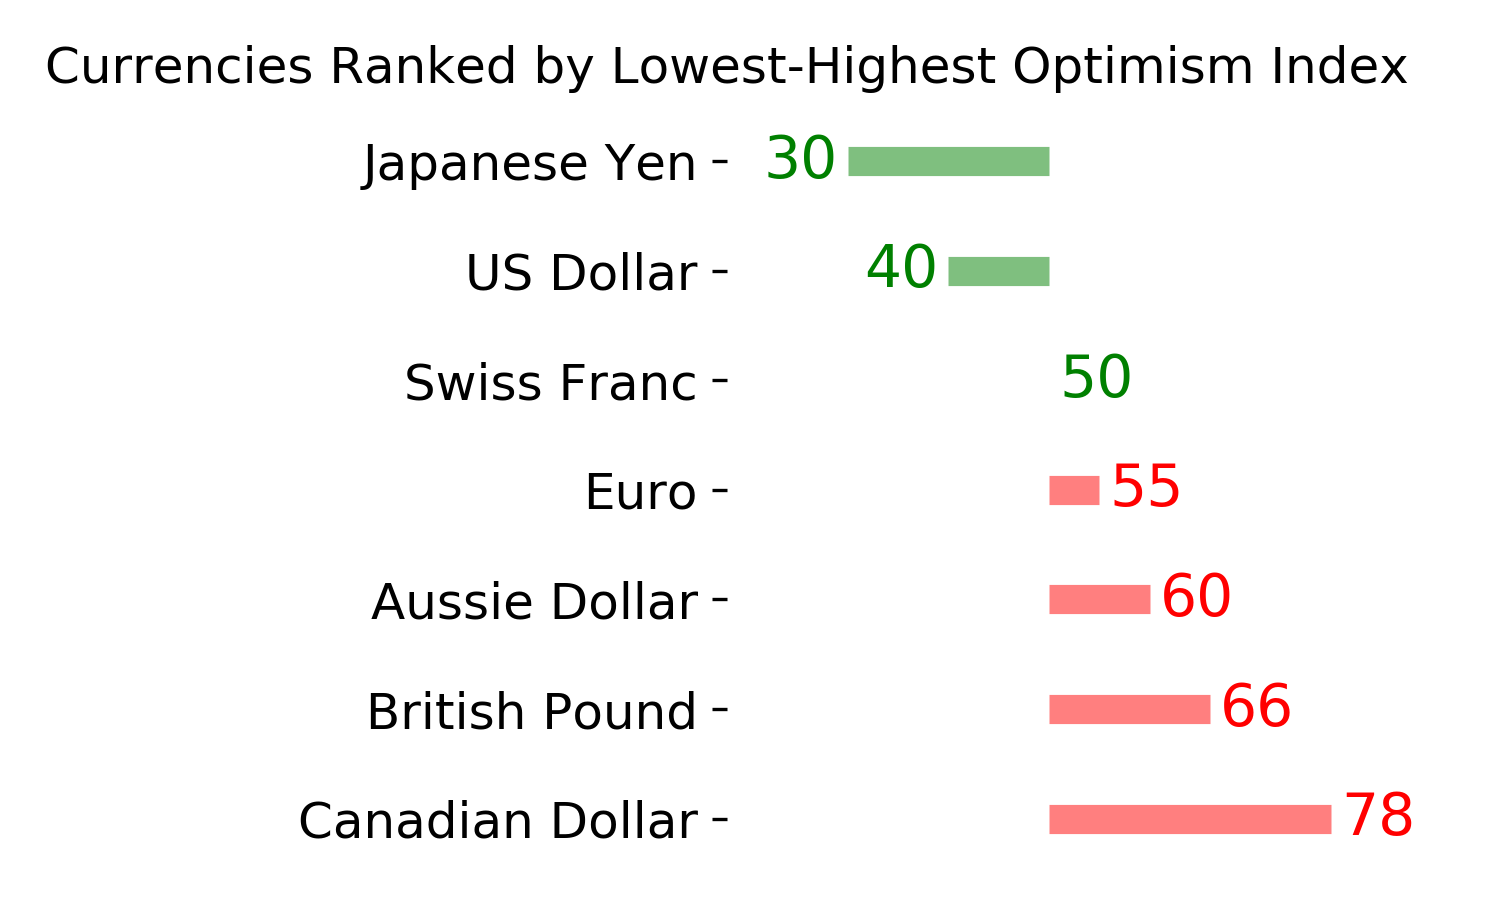
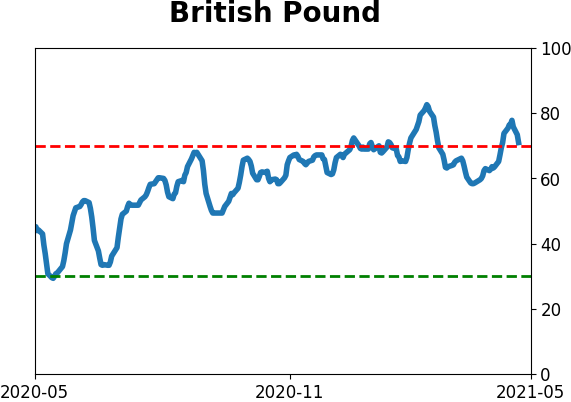
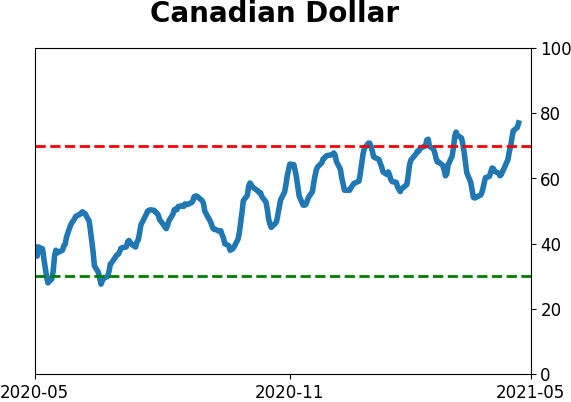
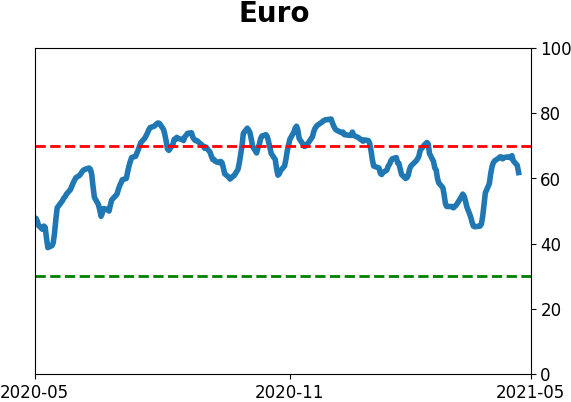
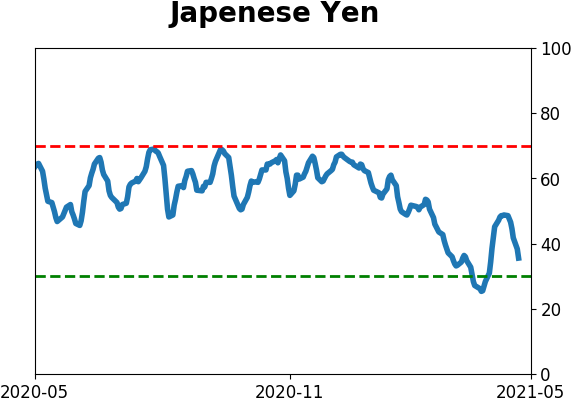
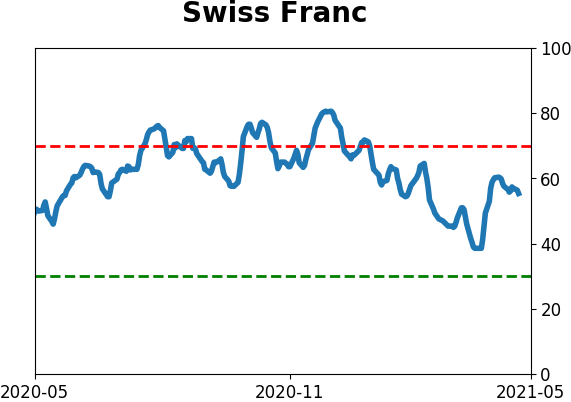
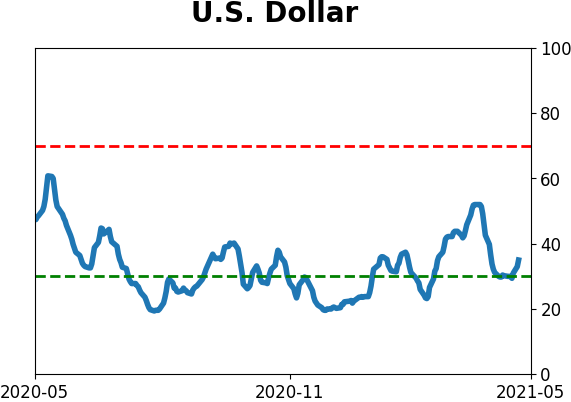
Currency ETF's - 5-Day Moving Average
|
|
|
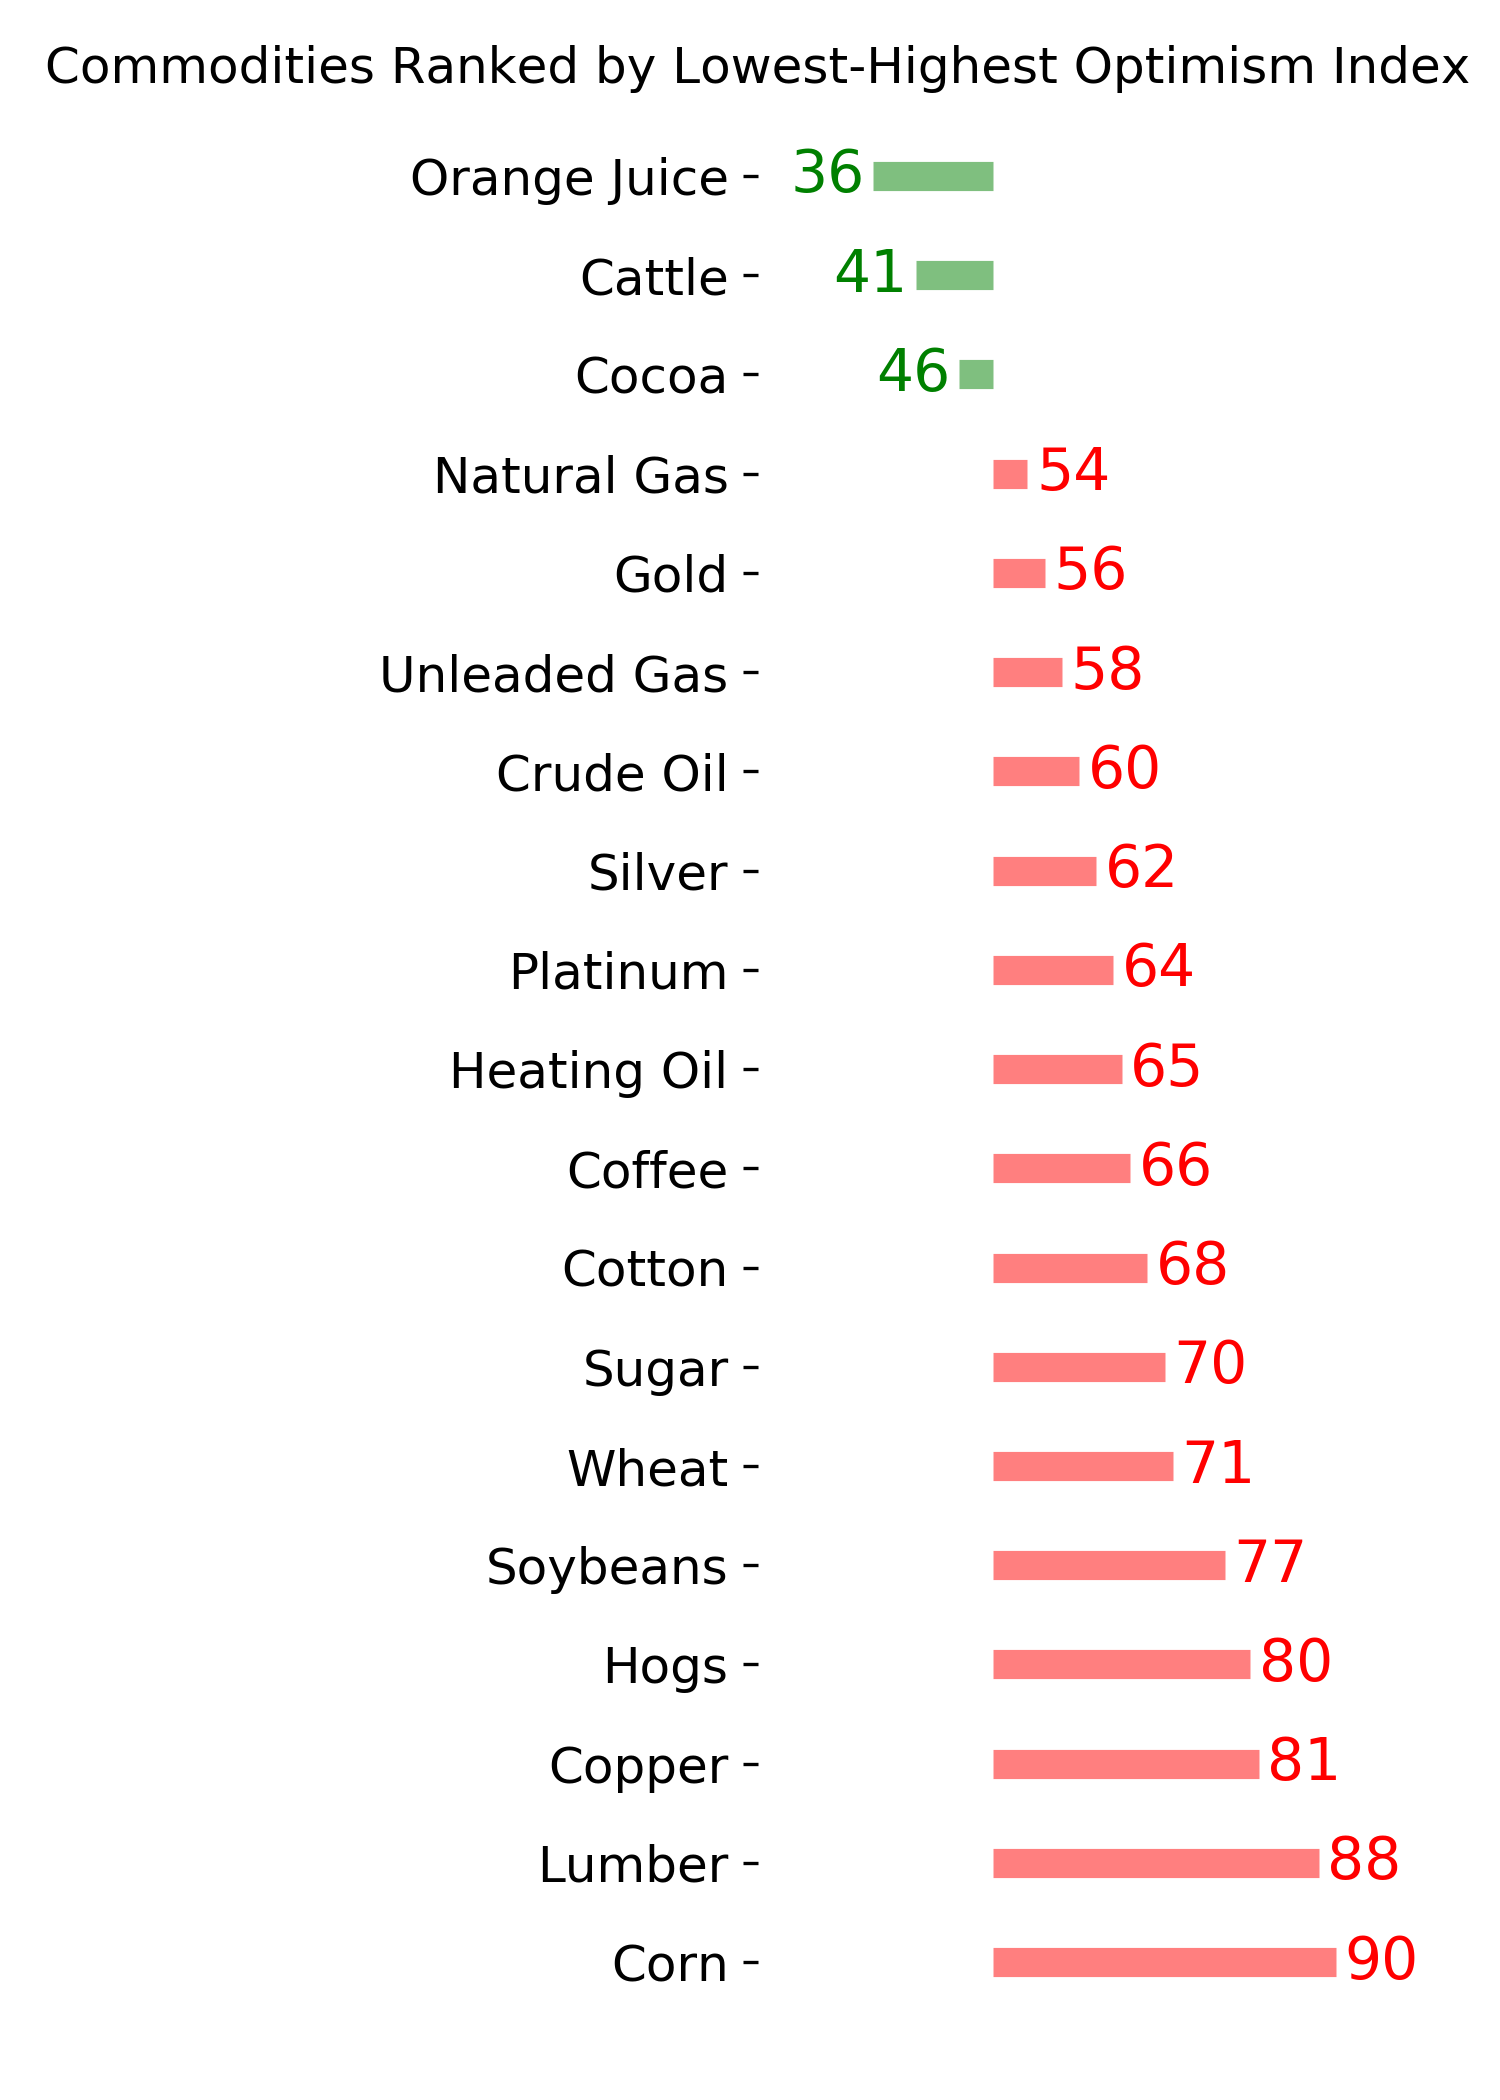
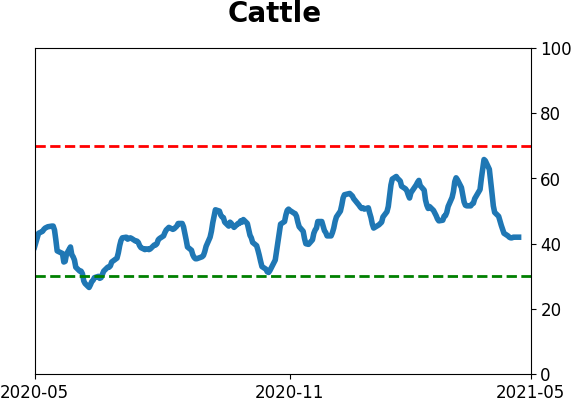
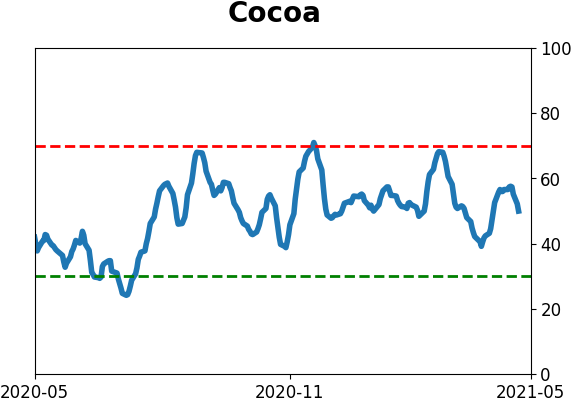
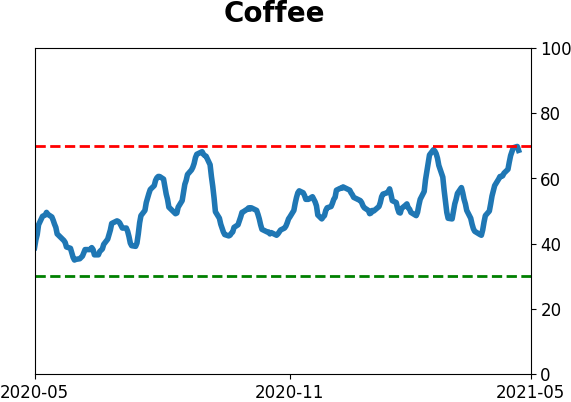
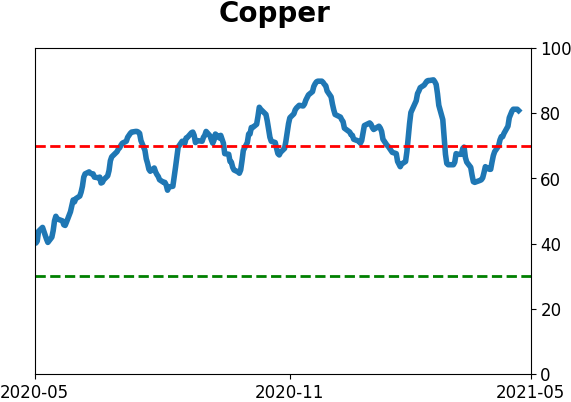
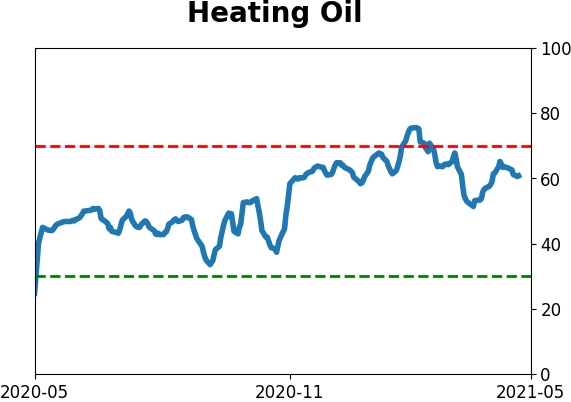
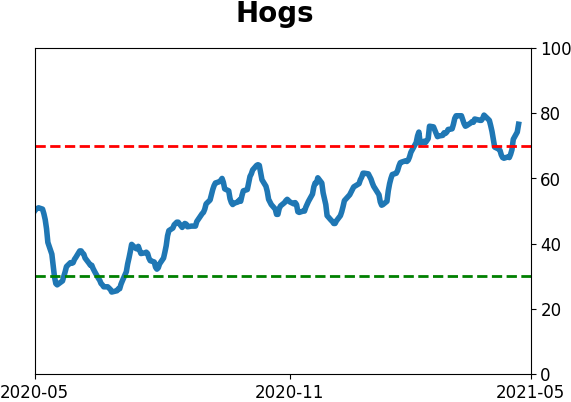
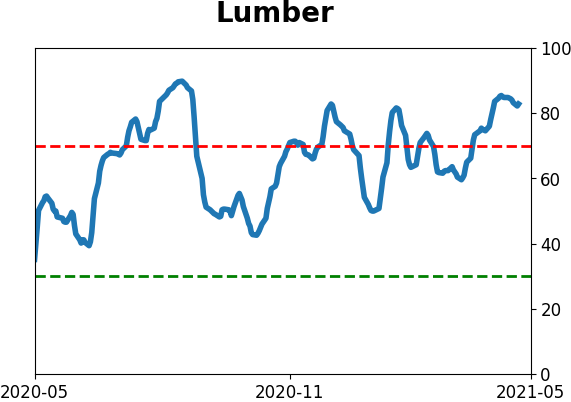
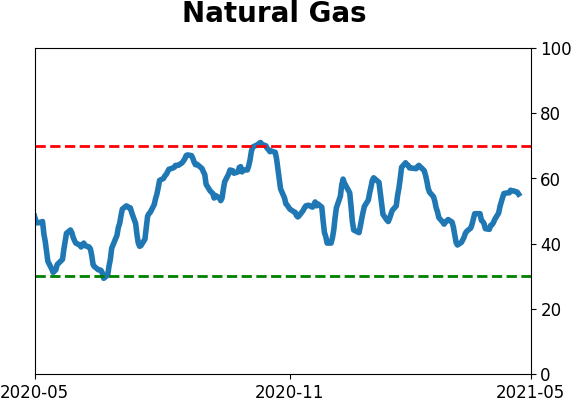
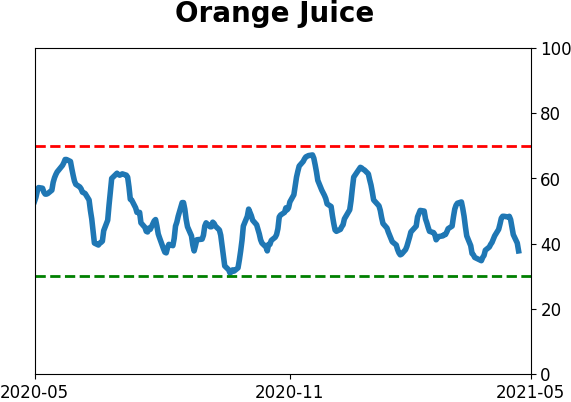
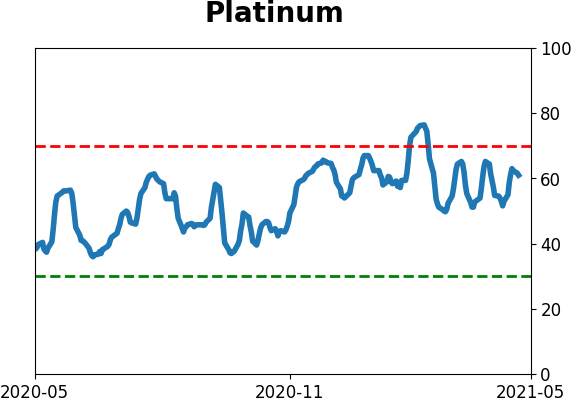
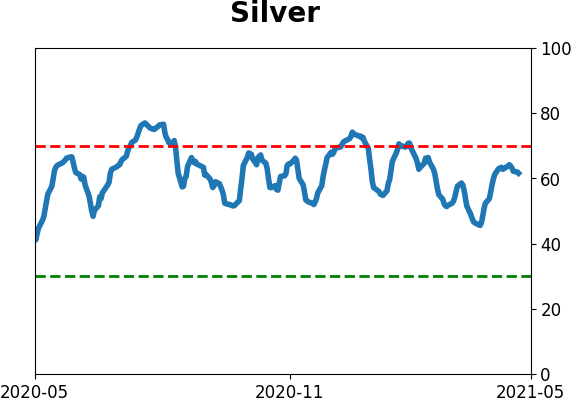
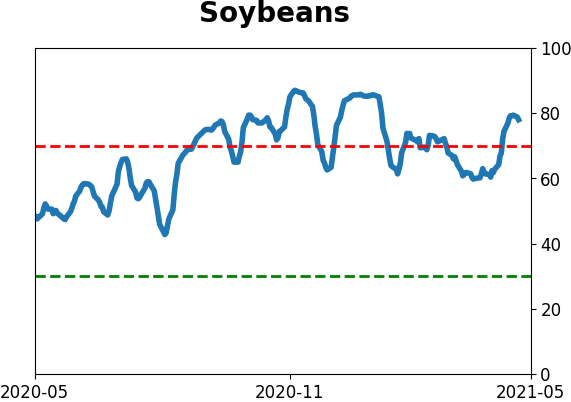
Commodity ETF's - 5-Day Moving Average
|
|