Headlines
|
|
Is it a "V", a "U", or something else entirely?:
Opinions abound on what kind of recovery the economy and stock market will see in the year(s) ahead, assuming we will indeed recover. Most of the focus in news articles is on the potential for a v-shaped bottom, or rather the probability it won't occur. There have been 3 times as many articles about v-shaped recoveries as u-shaped ones.
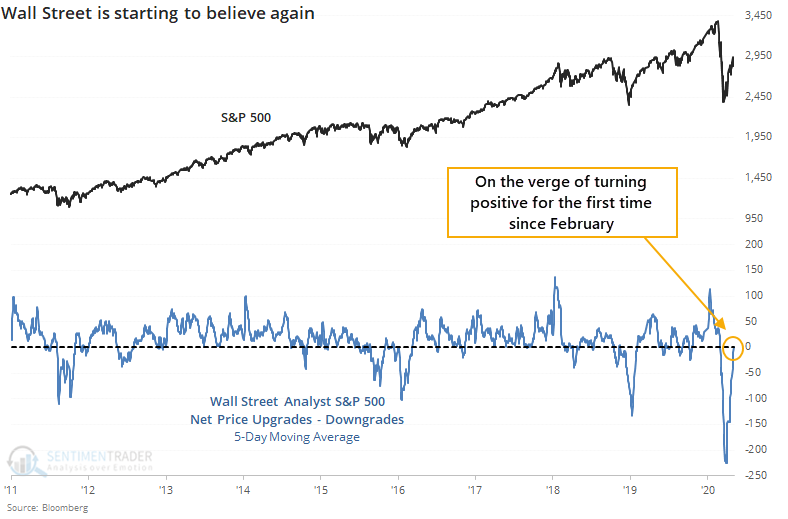
Wall Street analysts turn positive after record downgrades:
For the first time in almost two months, Wall Street analysts are upgrading the price targets on more S&P 500 stocks than they're downgrading. That's a big shift in sentiment from what they were doing a month ago.
|
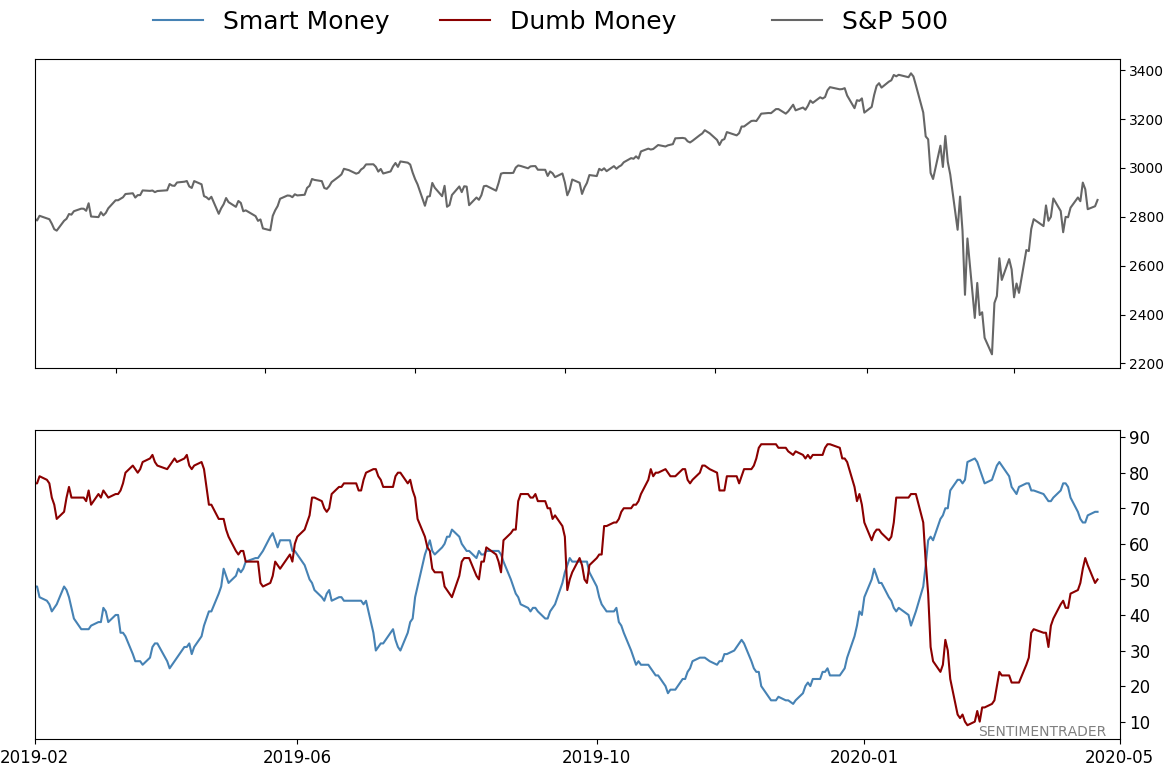
Smart / Dumb Money Confidence
|
Smart Money Confidence: 69%
Dumb Money Confidence: 50%
|
|
Risk Levels
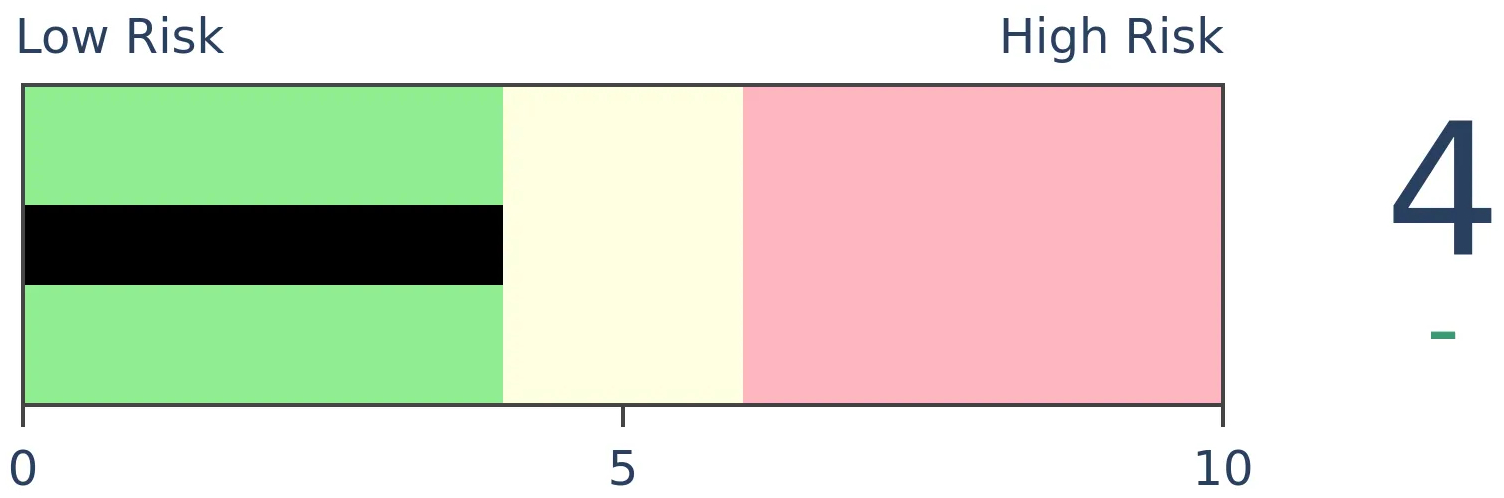
Stocks Short-Term
|
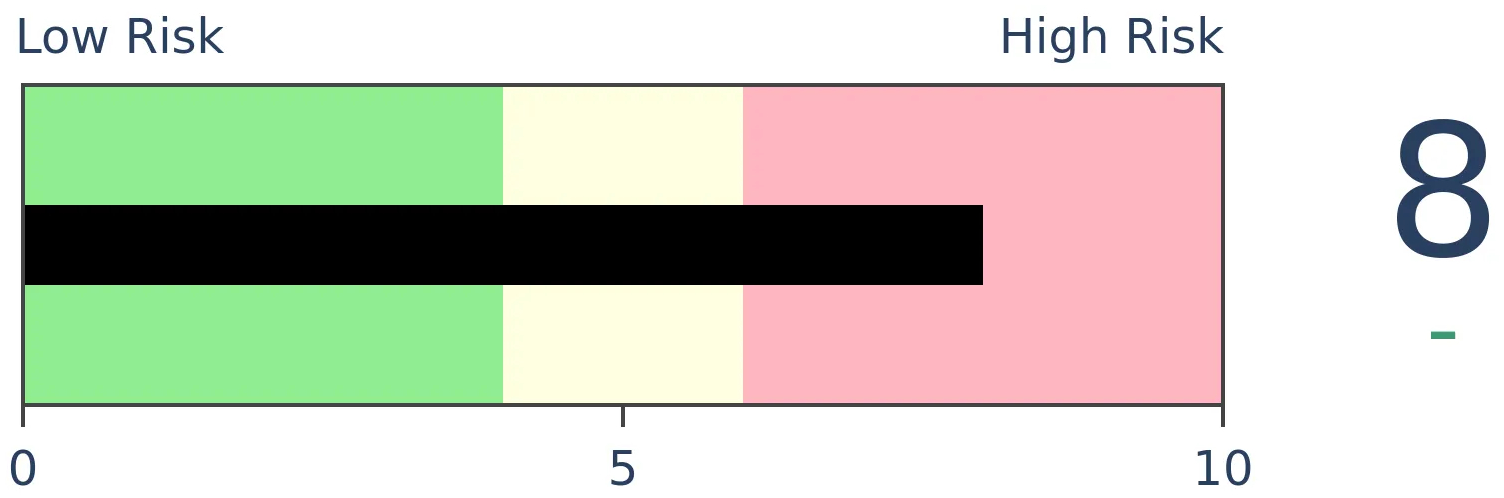
Stocks Medium-Term
|
|
Bonds
|
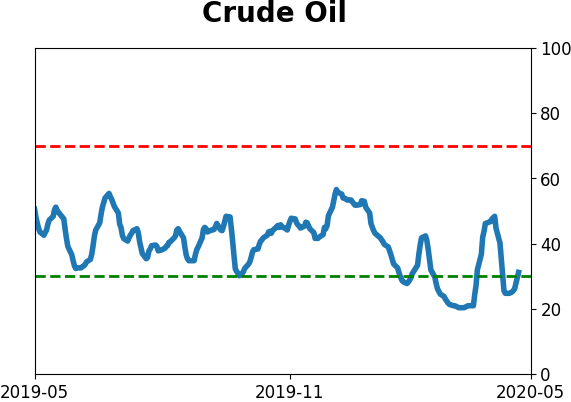
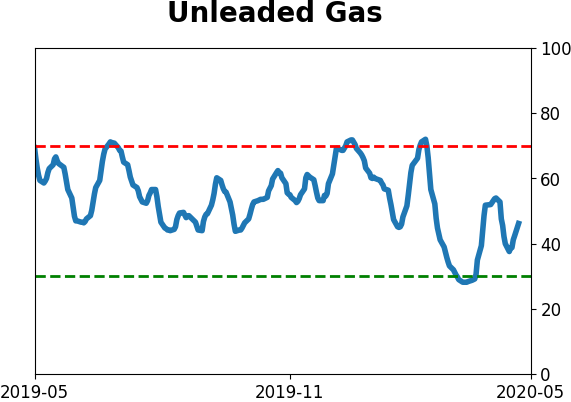
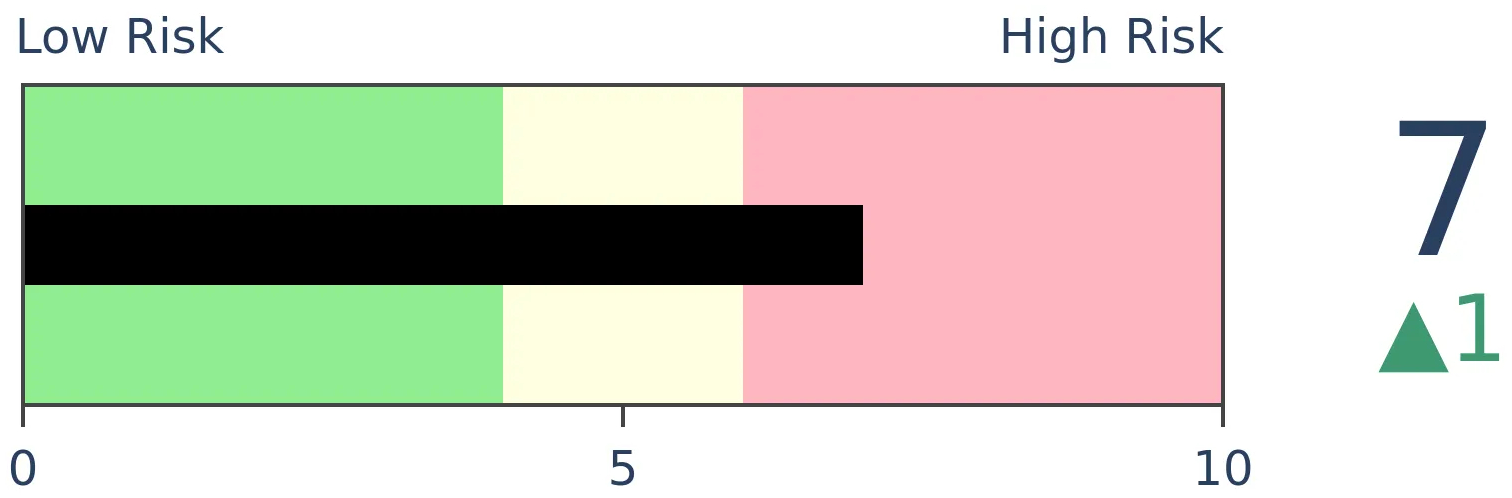
Crude Oil
|
|
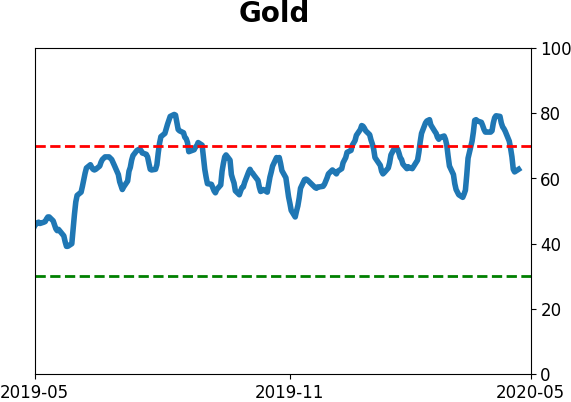
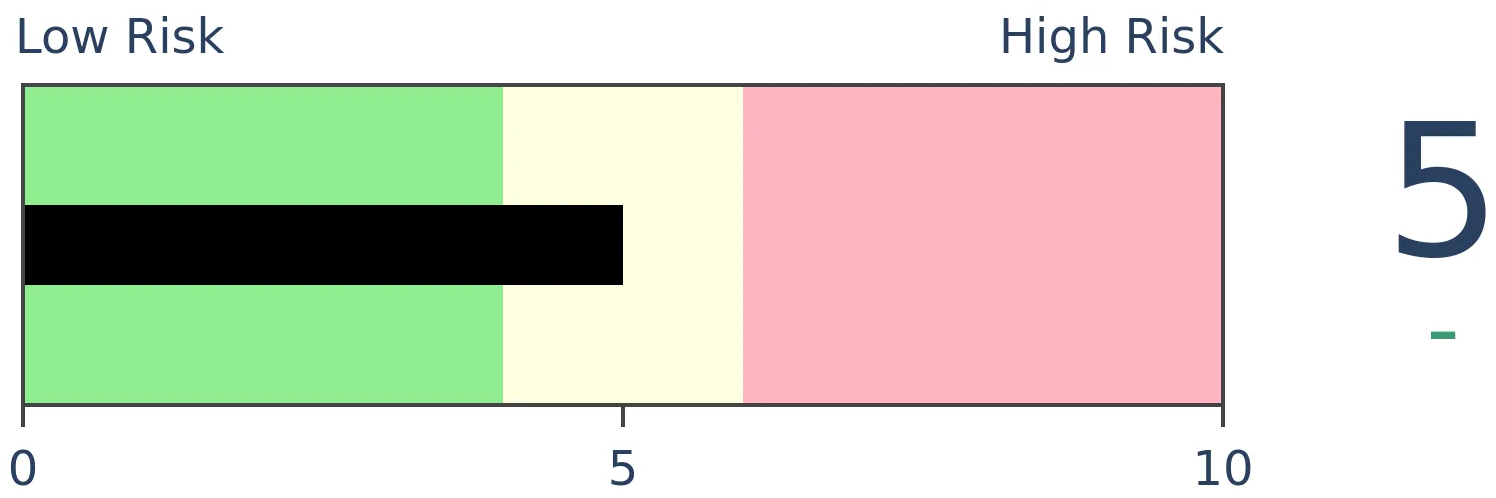
Gold
|
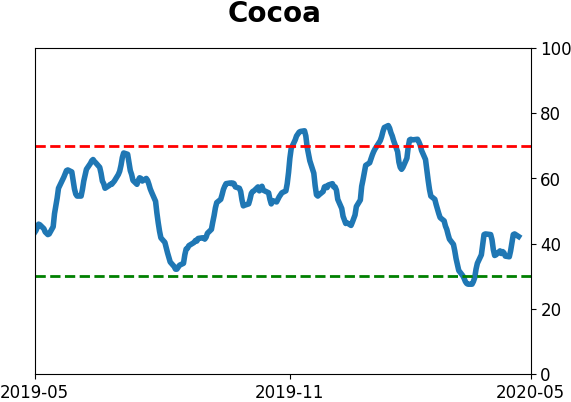
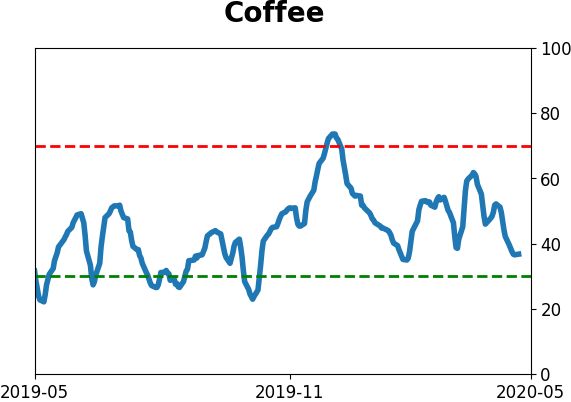
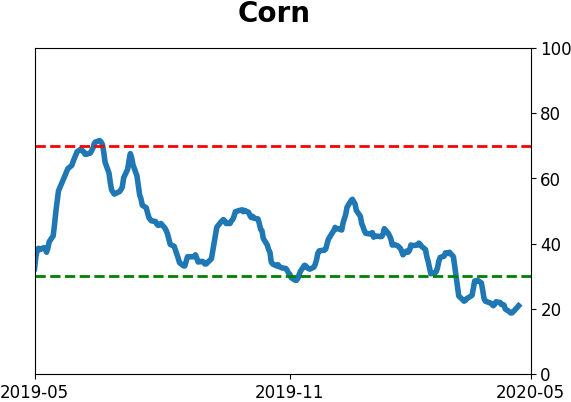
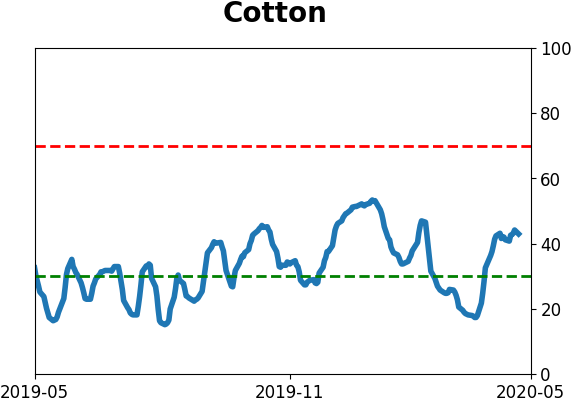
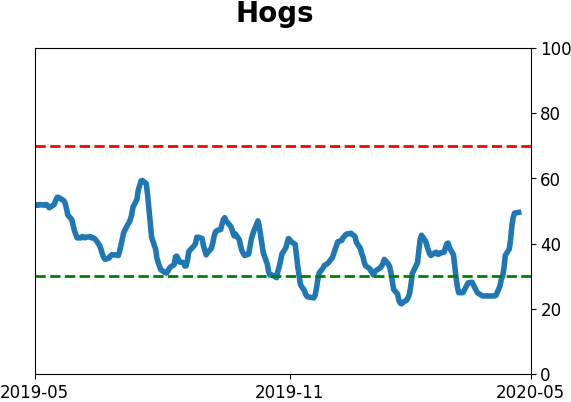
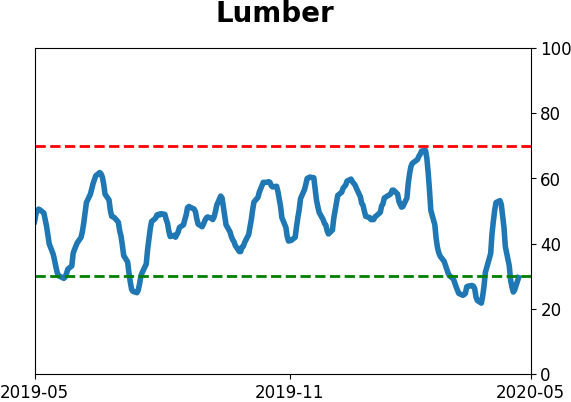
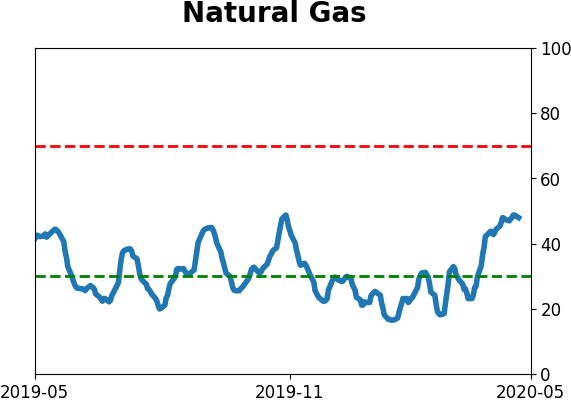
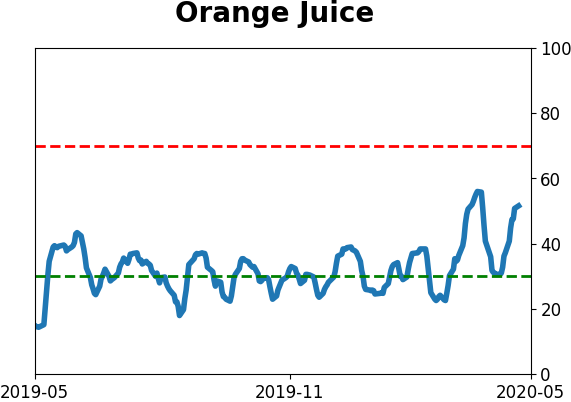
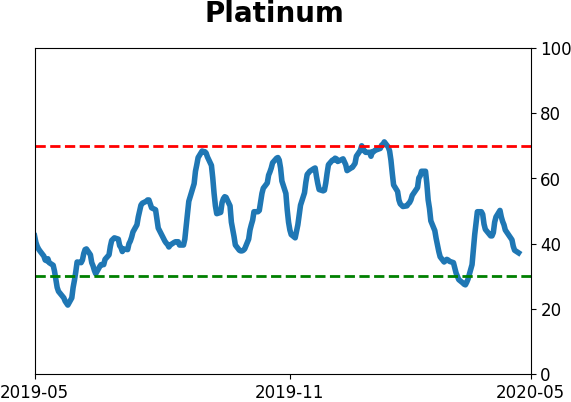
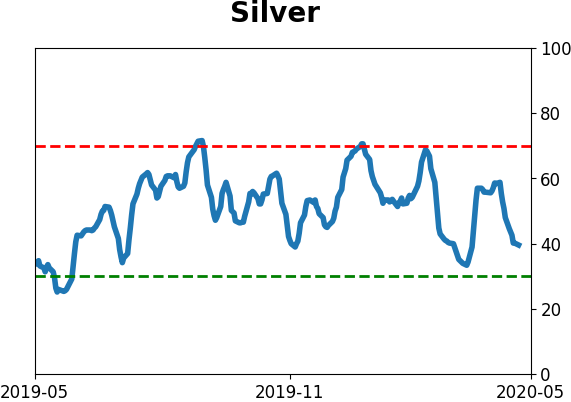
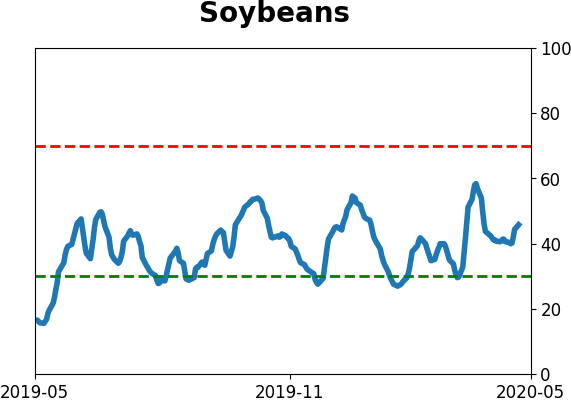
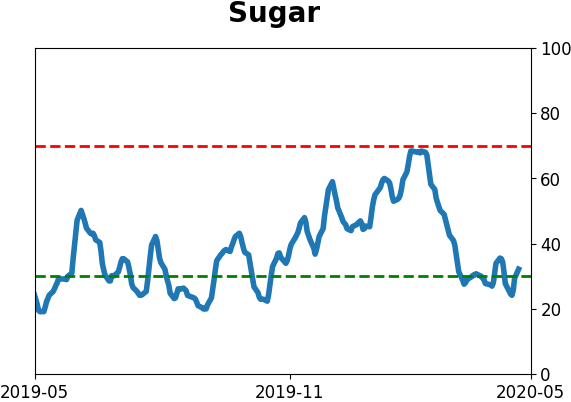
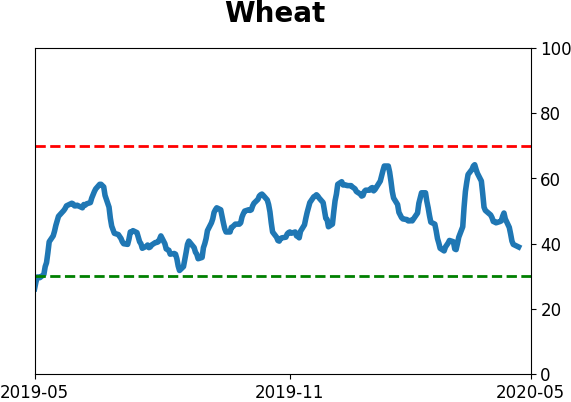
Agriculture

|
|
Research
BOTTOM LINE
Opinions abound on what kind of recovery the economy and stock market will see in the year(s) ahead, assuming we will indeed recover. Most of the focus in news articles is on the potential for a v-shaped bottom, or rather the probability it won't occur. There have been 3 times as many articles about v-shaped recoveries as u-shaped ones.
FORECAST / TIMEFRAME
None
|
These days, it seems everyone has an opinion on the shape that the economy, and by extension the stock market, is likely to form over the coming months.
So far, it has been v-shaped in the major stock indexes, with a sharp fall followed by a sharp recovery.
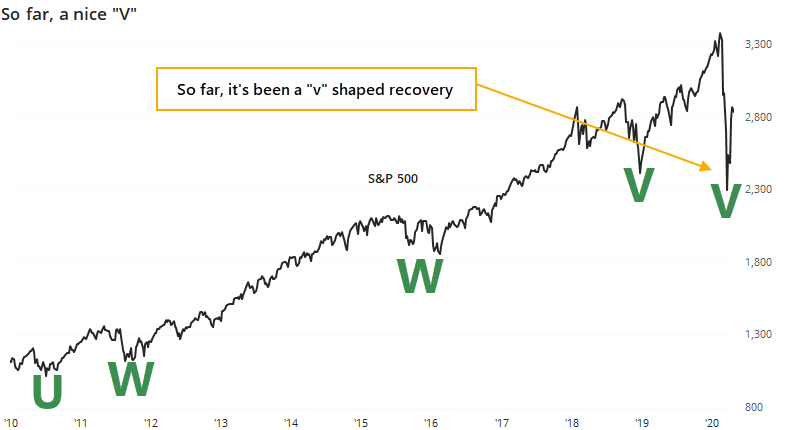
This is fairly atypical, but we went over multiple reasons why it could persist in March, mainly the types of breadth thrusts we were seeing, and the amount of decline the rally retraced. Those usually don't see a fall back to the lows, which would form more of a "U" or "W" kind of bottom.
Based on media mentions, most analysts expect a recovery to look like either a "U" or a "V".
But lately, a continued v-shaped recovery does not seem like a very popular opinion.

Maybe it's neither, and we'll see something else entirely.

There is a tendency to think that just because a v-shaped recovery might get a lot of attention, it's less likely to happen. It's hard to rely on this as an indicator, because most of it is anecdotal, and most of the articles mentioning that kind of sharp rebound are skeptical that it will happen.
If we take a more measured look, clearly it does get more attention, but it's also clear that it probably doesn't matter.
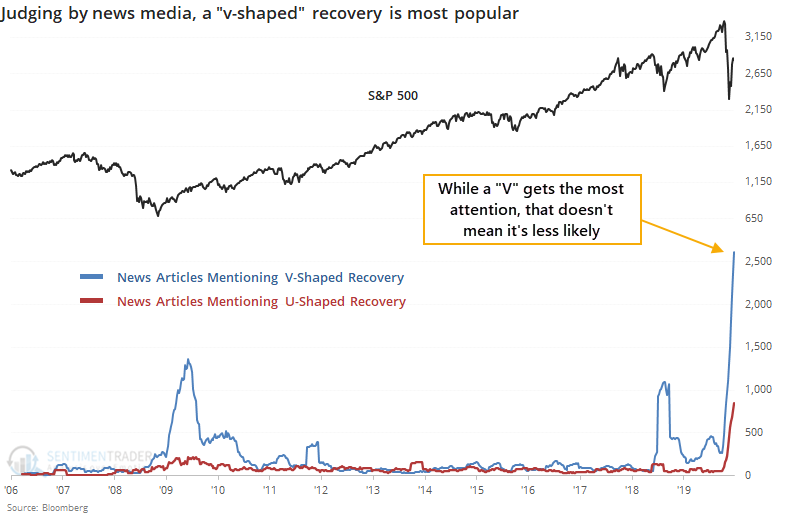
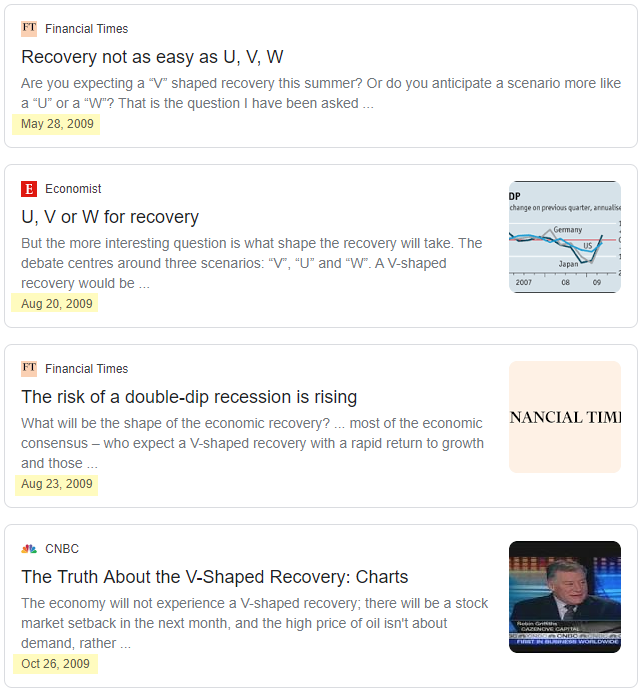
There has been a marked increase in articles mentioning other types of recoveries, but the "V" gets the most airtime. While we could be snarky and suggest that means it won't happen, there is no basis for that assumption. After all, in 2009 there was a spike in articles about a v-shaped recovery as well, and most of those were similarly skeptical.
In early 2019, stocks rebounded swiftly, there was an increasing number of articles about the v-shaped recovery (with almost no mentions of a "U") and stocks continued to power higher. On a relative basis, there were 25 times more articles about a "V" than a "U", more than we've seen lately.
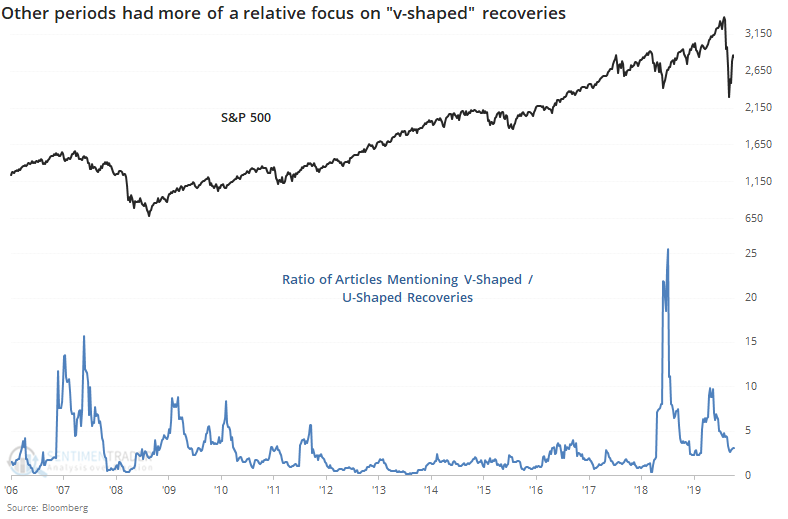
The ratio spiked in 2007, as well, but that was from a much lower base where even a handful of articles was able to skew the ratio. It also rose several times early in the post-2009 bull market, none of which meant that the "V" was going to fail.
Since the media is filled with talk about a v-shaped recovery, and most investors only skim the articles if they even click past the headline, there seems to be an assumption that most investors believe in that kind of recovery. They don't. It's probably a good thing that even though interest in a "V" is high, most of that interest is in dispelling it.
BOTTOM LINE
For the first time in almost two months, Wall Street analysts are upgrading the price targets on more S&P 500 stocks than they're downgrading. That's a big shift in sentiment from what they were doing a month ago.
FORECAST / TIMEFRAME
None
|
For the first time in almost two months, Wall Street is becoming a believer. During March, analysts were panicking, with a record number of price downgrades among S&P 500 stocks. That's a stark contrast to what they were doing in January.
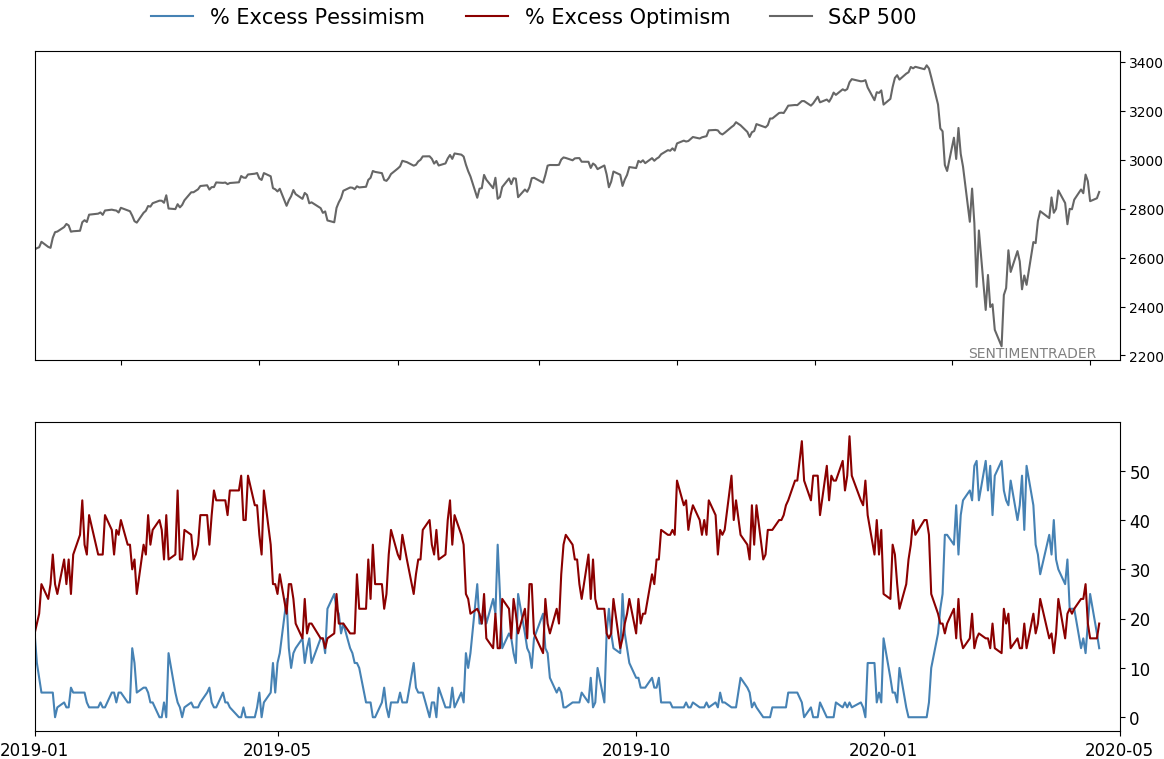
Over the past week, they've been upgrading the price targets on more stocks than they've been downgrading, a recovery from what had been their most negative sentiment in a decade.
At extremes, analyst behavior has been a very good contrary indicator. When they rush to upgrade price targets or earnings estimates, then stocks tend to fall in the months ahead. When they're busy downgrading, then stocks usually rise.
When they first turn positive after a prolonged period of pessimism, it has been less consistent as an indicator.
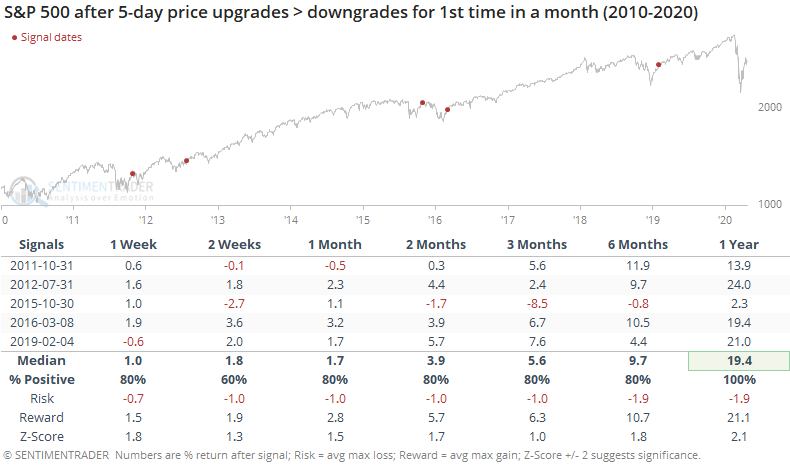
The past decade has been dominated by a bull market, so it's not a huge surprise that forward returns were mostly positive. The table doesn't quite tell the full story, though.
After each time that analyst sentiment recovered from a period of pessimism, stocks rose at some point, but each time, those gains also evaporated.
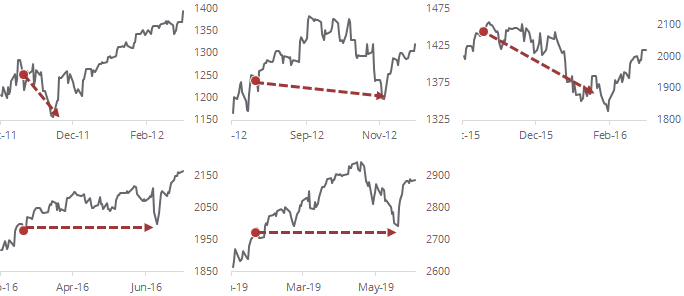
The time frames weren't consistent, and sometimes the interim gains were very impressive. It's a sign that while rising optimism is a good thing, we need to watch for a swing to the opposite extreme because net optimism from this group has not been a positive sign.
Active Studies
| Time Frame | Bullish | Bearish | | Short-Term | 0 | 6 | | Medium-Term | 12 | 0 | | Long-Term | 37 | 3 |
|
Indicators at Extremes
Portfolio
| Position | Weight % | Added / Reduced | Date | | Stocks | 49.9 | Reduced 10.3% | 2020-04-23 | | Bonds | 0.0 | Reduced 6.7% | 2020-02-28 | | Commodities | 5.1 | Added 2.4%
| 2020-02-28 | | Precious Metals | 0.0 | Reduced 3.6% | 2020-02-28 | | Special Situations | 0.0 | Reduced 31.9% | 2020-03-17 | | Cash | 45.0 | | |
|
Updates (Changes made today are underlined)
In the first months of the year, we saw manic trading activity. From big jumps in specific stocks to historic highs in retail trading activity to record highs in household confidence to almost unbelievable confidence among options traders. All of that came amid a market where the average stock couldn't keep up with their indexes. There were signs of waning momentum in stocks underlying the major averages, which started triggering technical warning signs in late January. The kinds of extremes we saw in December and January typically take months to wear away, but the type of selling in March went a long way toward getting there. When we place the kind of moves we saw into March 23 into the context of coming off an all-time high, there has been a high probability of a multi-month rebound. After stocks bottomed on the 23rd, they enjoyed a historic buying thrust and retraced a larger amount of the decline than "just a bear market rally" tends to. While other signs are mixed that panic is subsiding, those thrusts are the most encouraging sign we've seen in years. Shorter-term, there have been some warning signs popping up and our studies have stopped showing as positively skewed returns. I reduced my exposure some in late April and will consider further reducing it if we start to see some lower highs and lower lows. Long-term suggestions from the studies remain robust, but shorter-term ones are significantly less so, and stocks still have to prove that we're in something other than a protracted, recessionary bear market.
RETURN YTD: -9.3% 2019: 12.6%, 2018: 0.6%, 2017: 3.8%, 2016: 17.1%, 2015: 9.2%, 2014: 14.5%, 2013: 2.2%, 2012: 10.8%, 2011: 16.5%, 2010: 15.3%, 2009: 23.9%, 2008: 16.2%, 2007: 7.8%
|
|
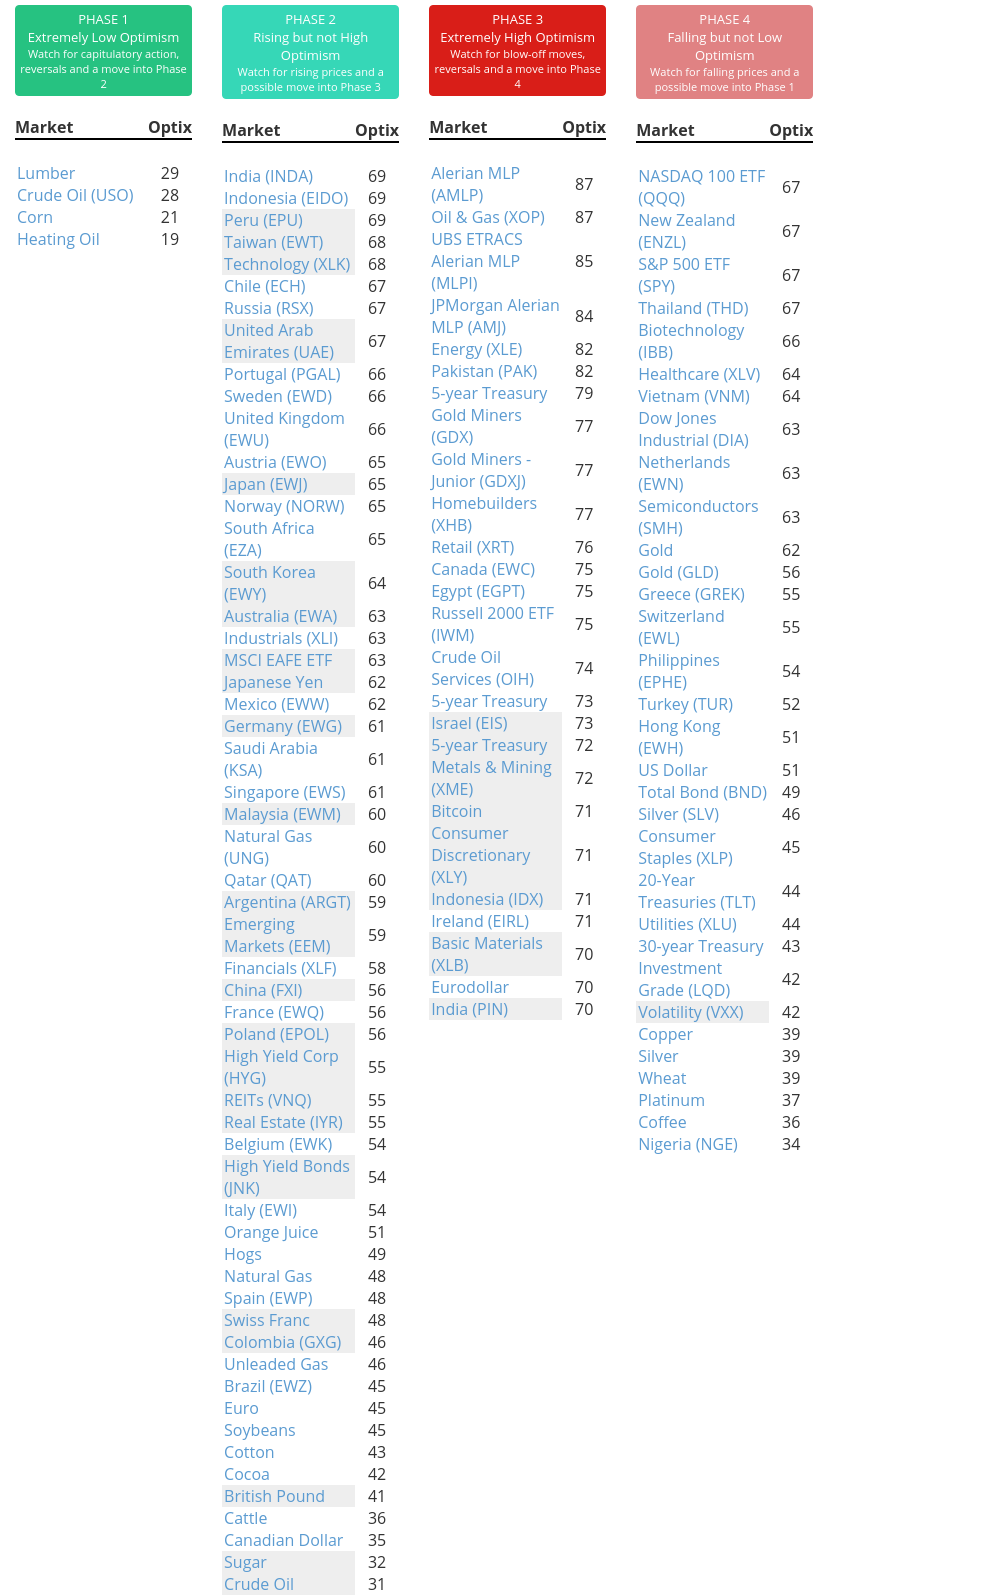
Phase Table
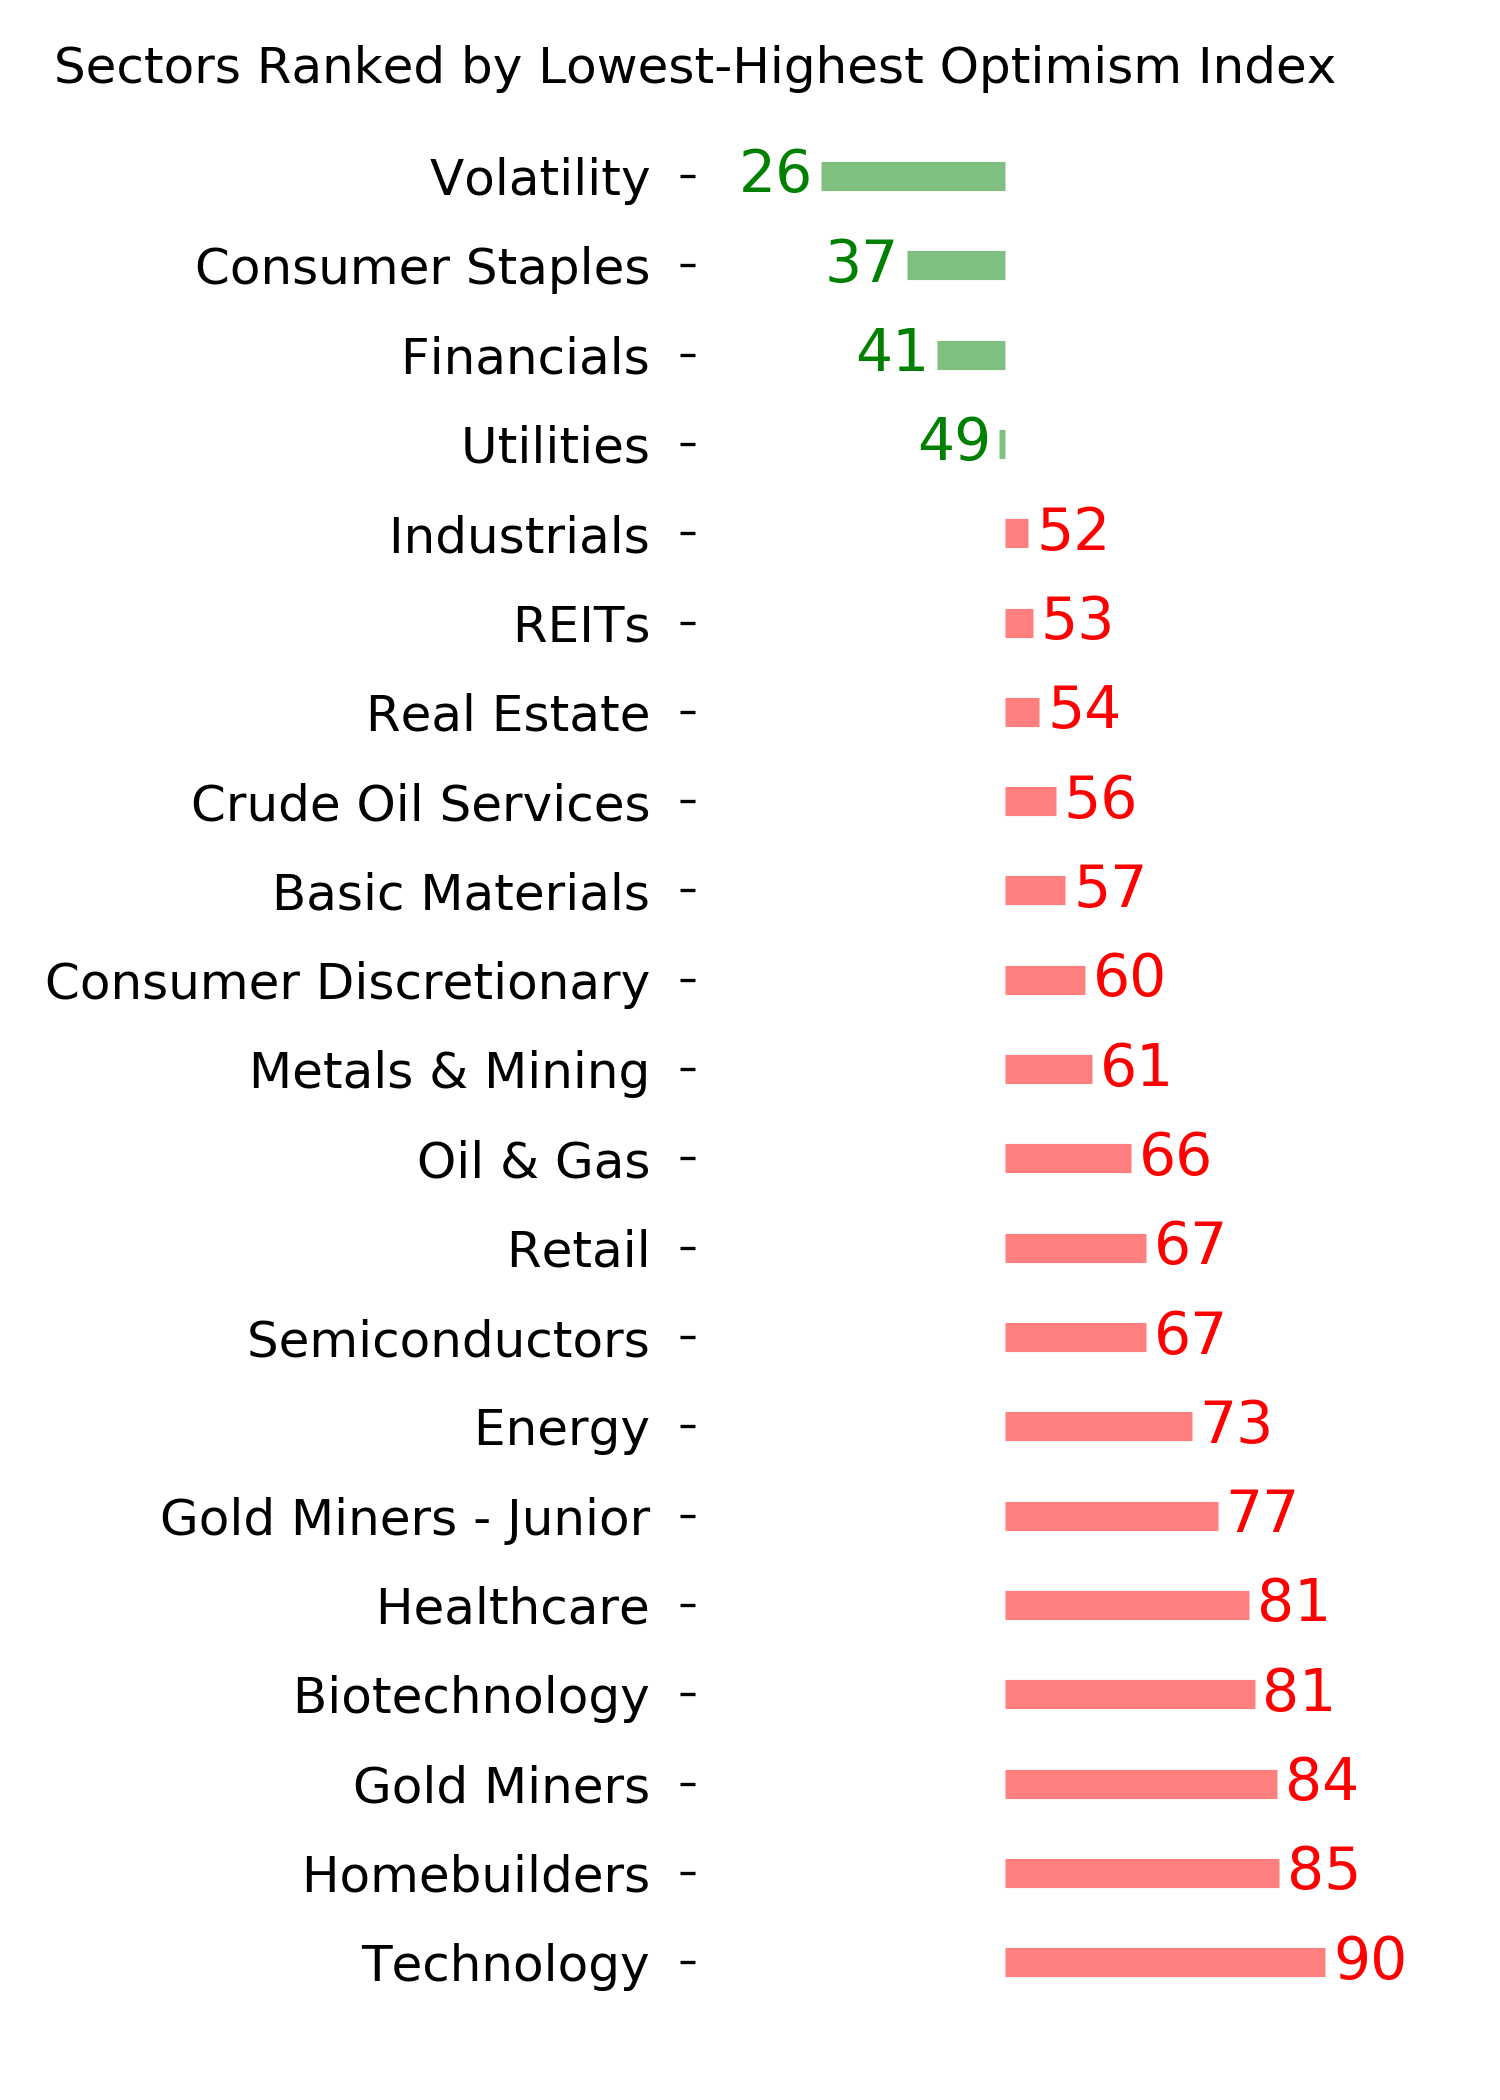
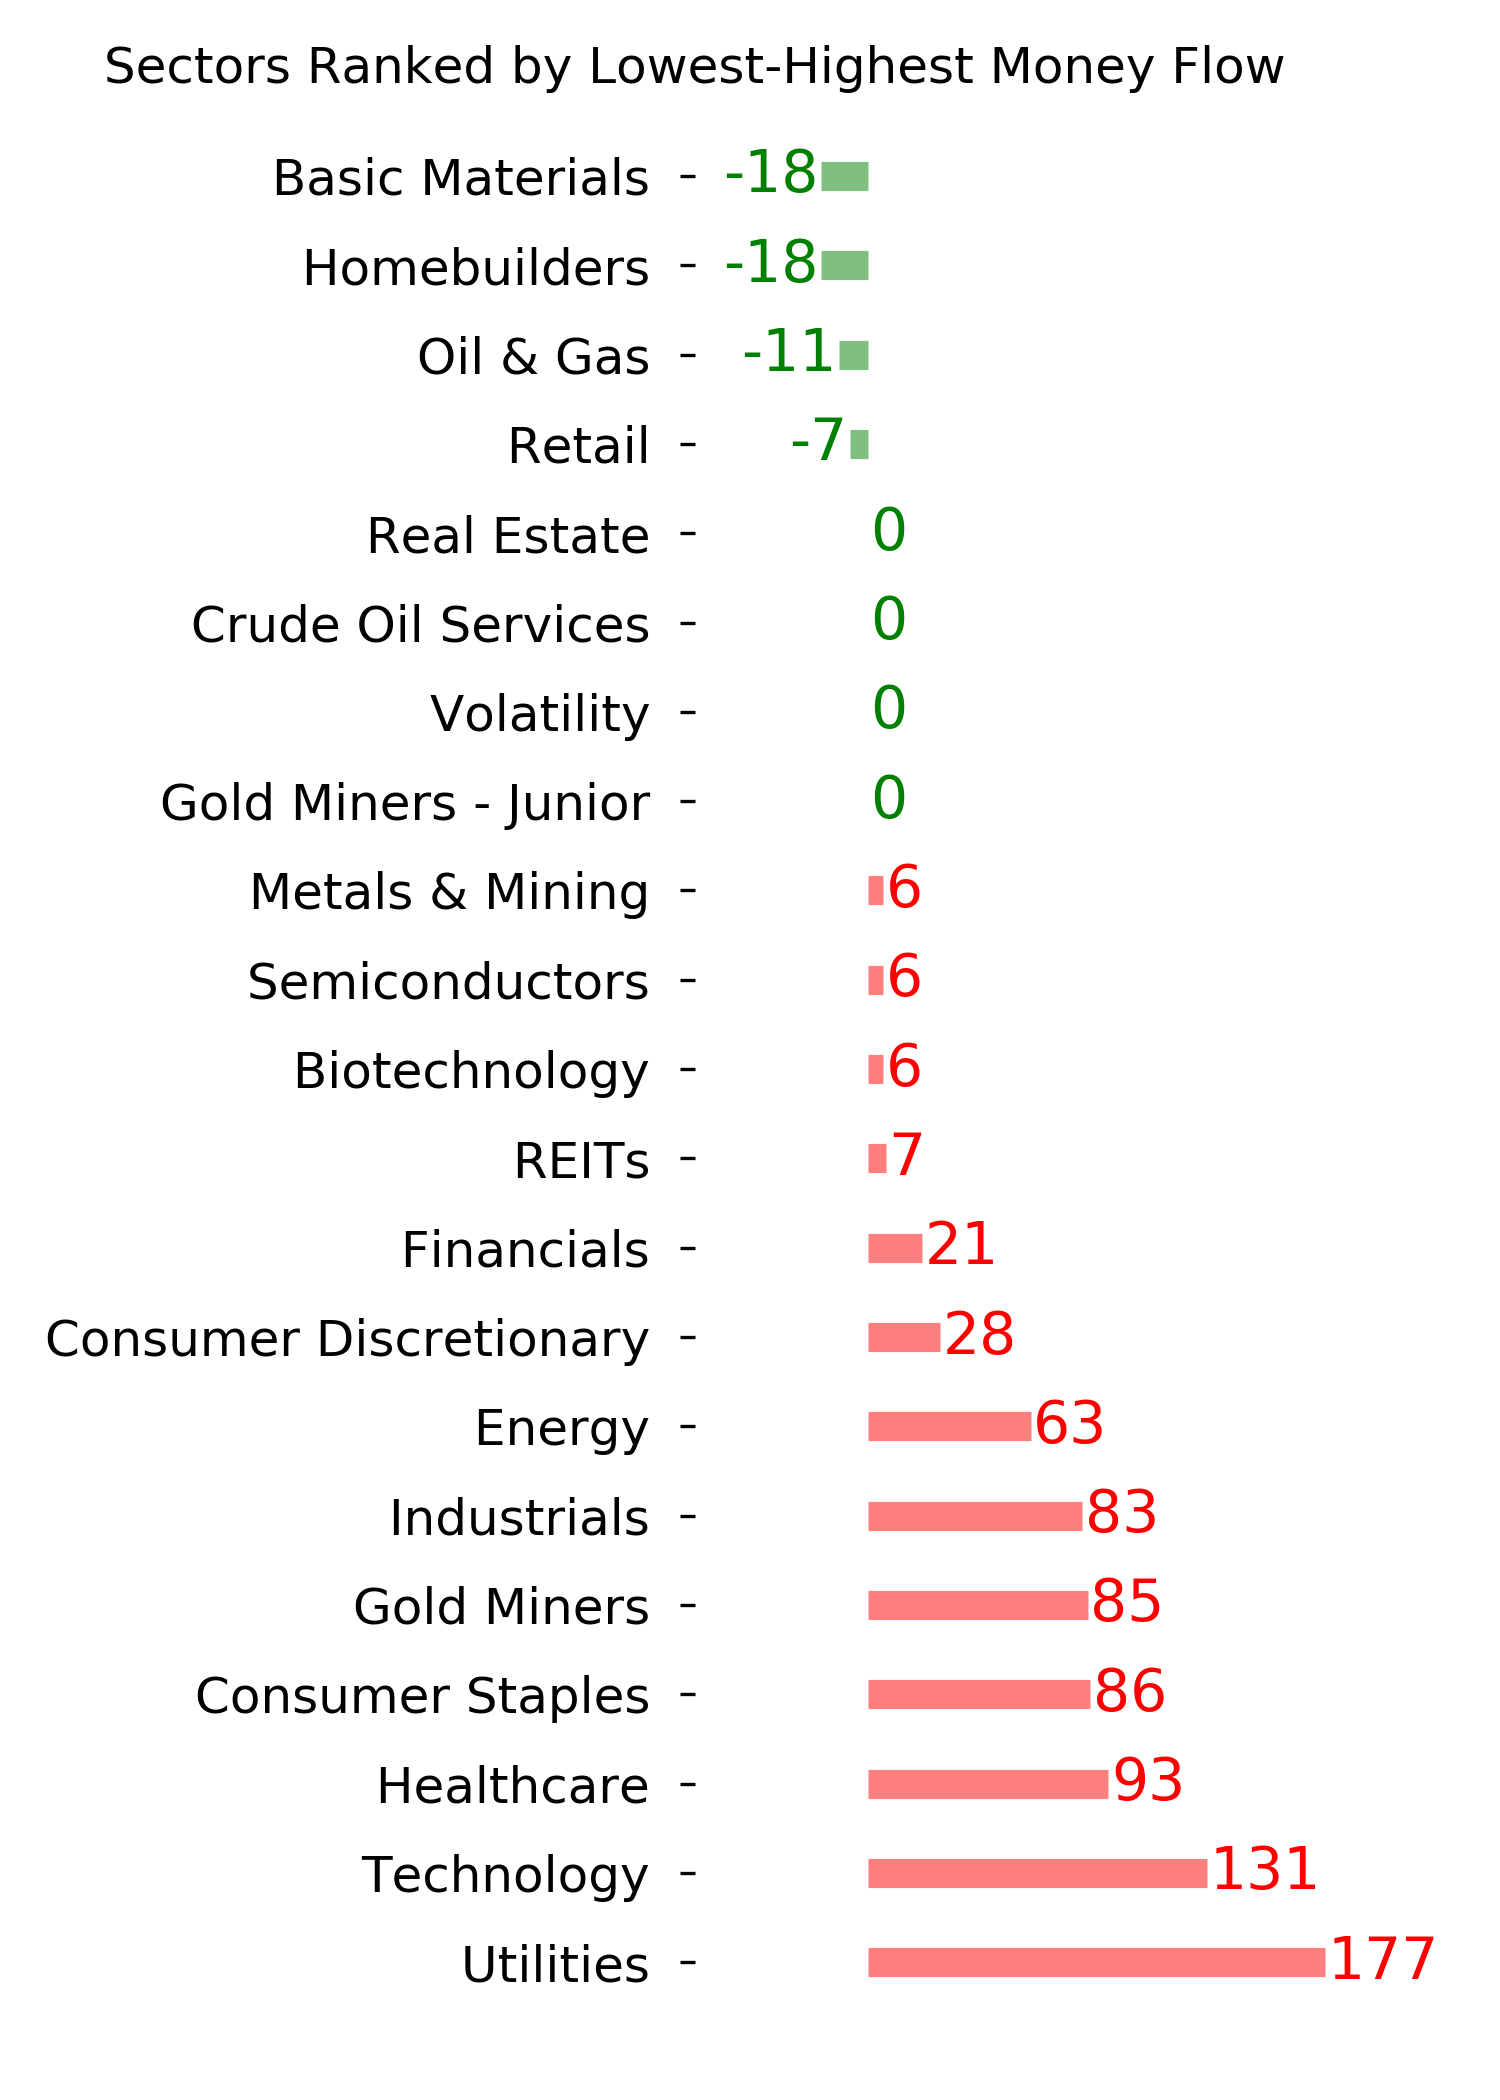
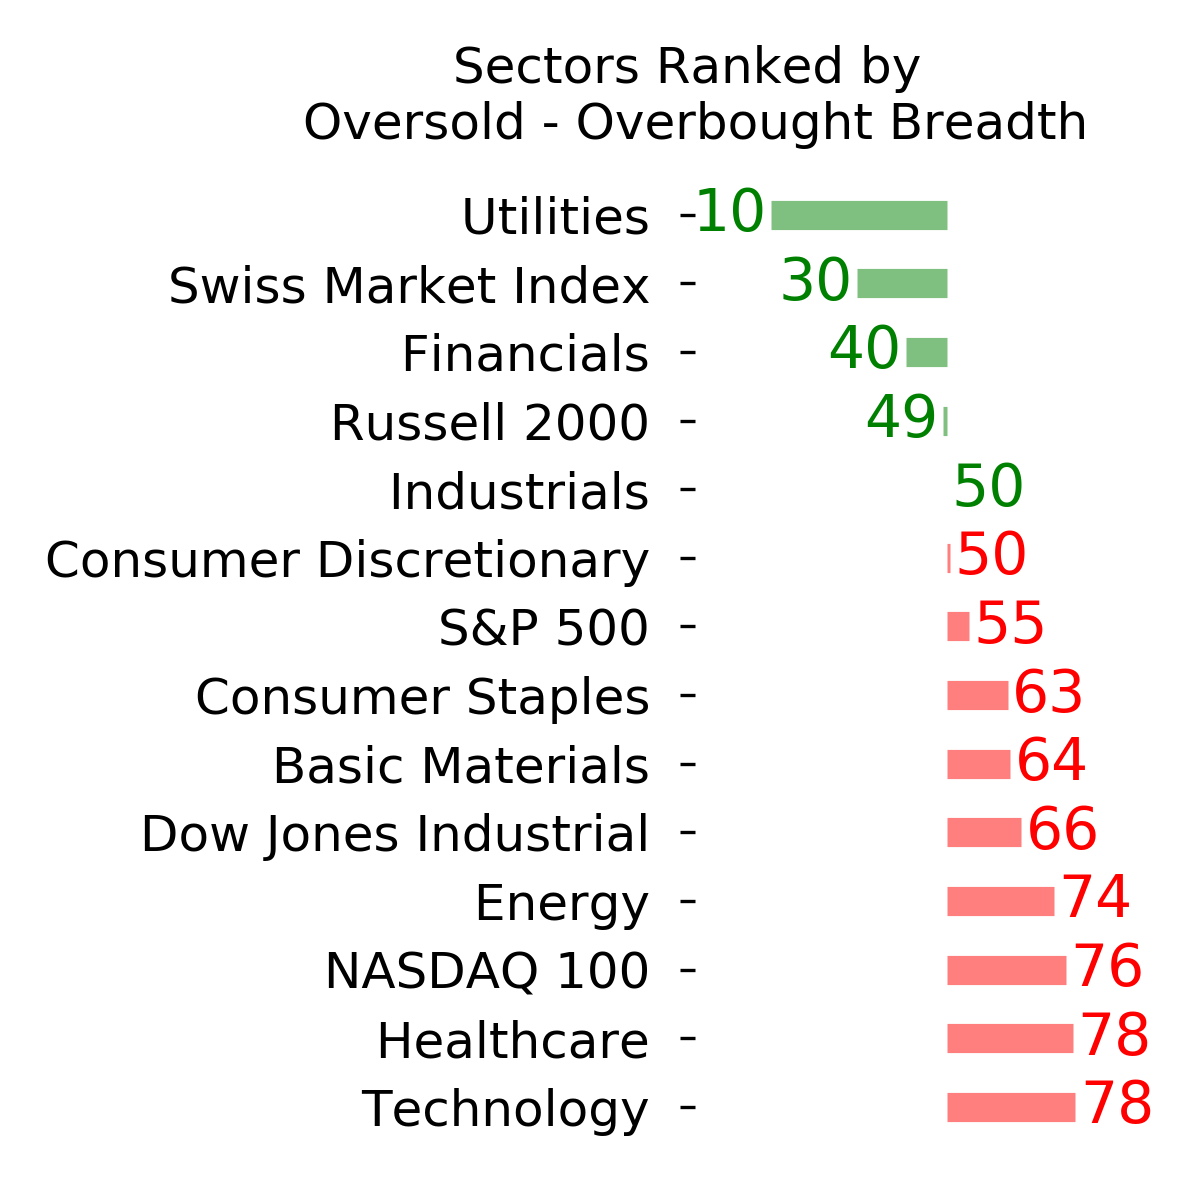
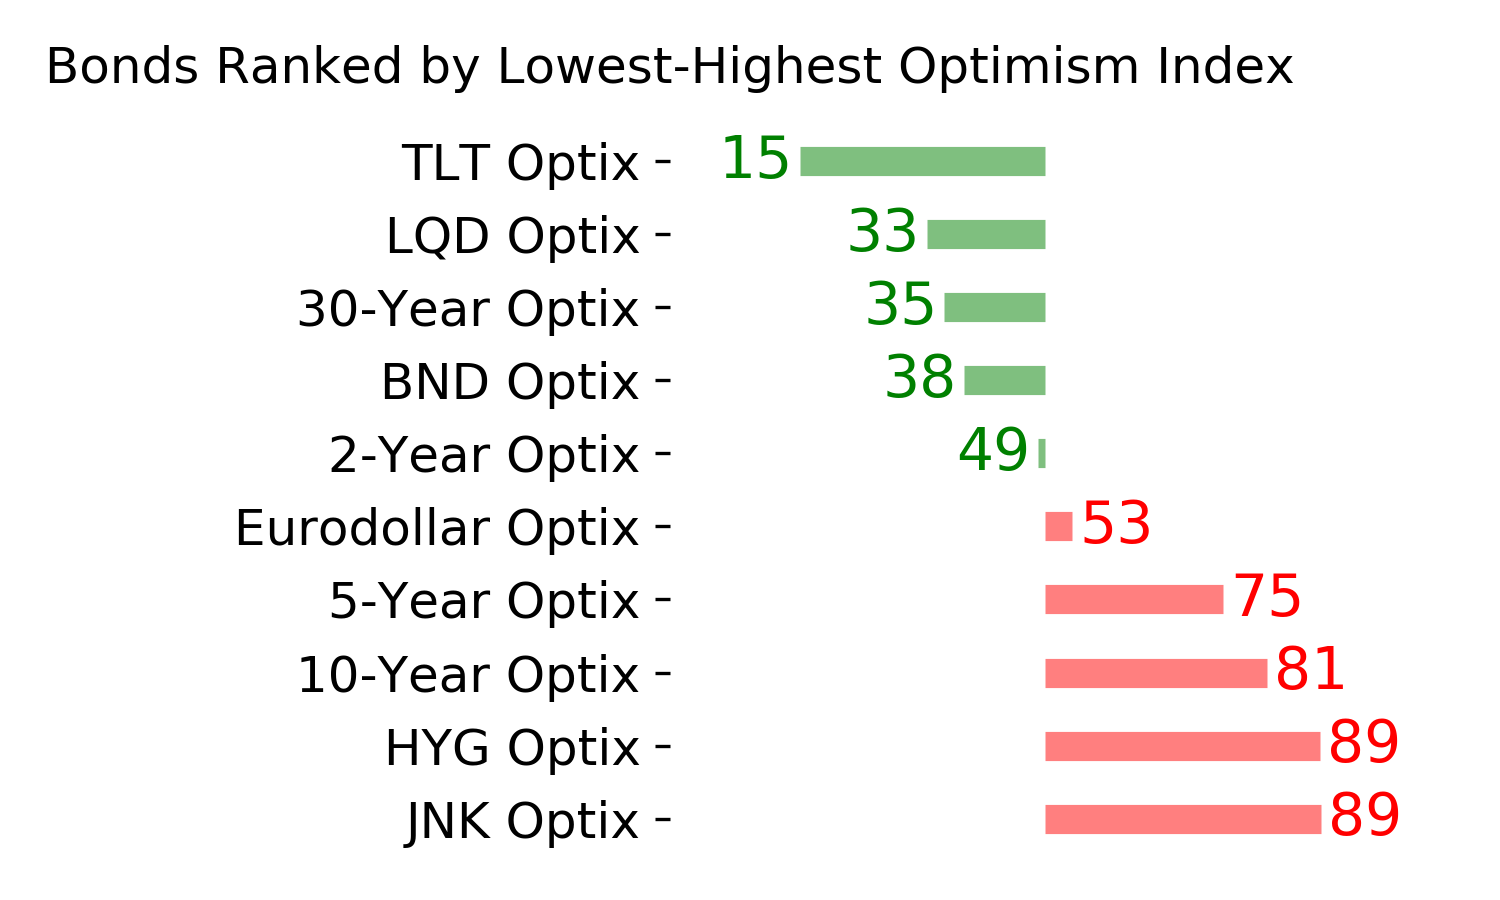
Ranks
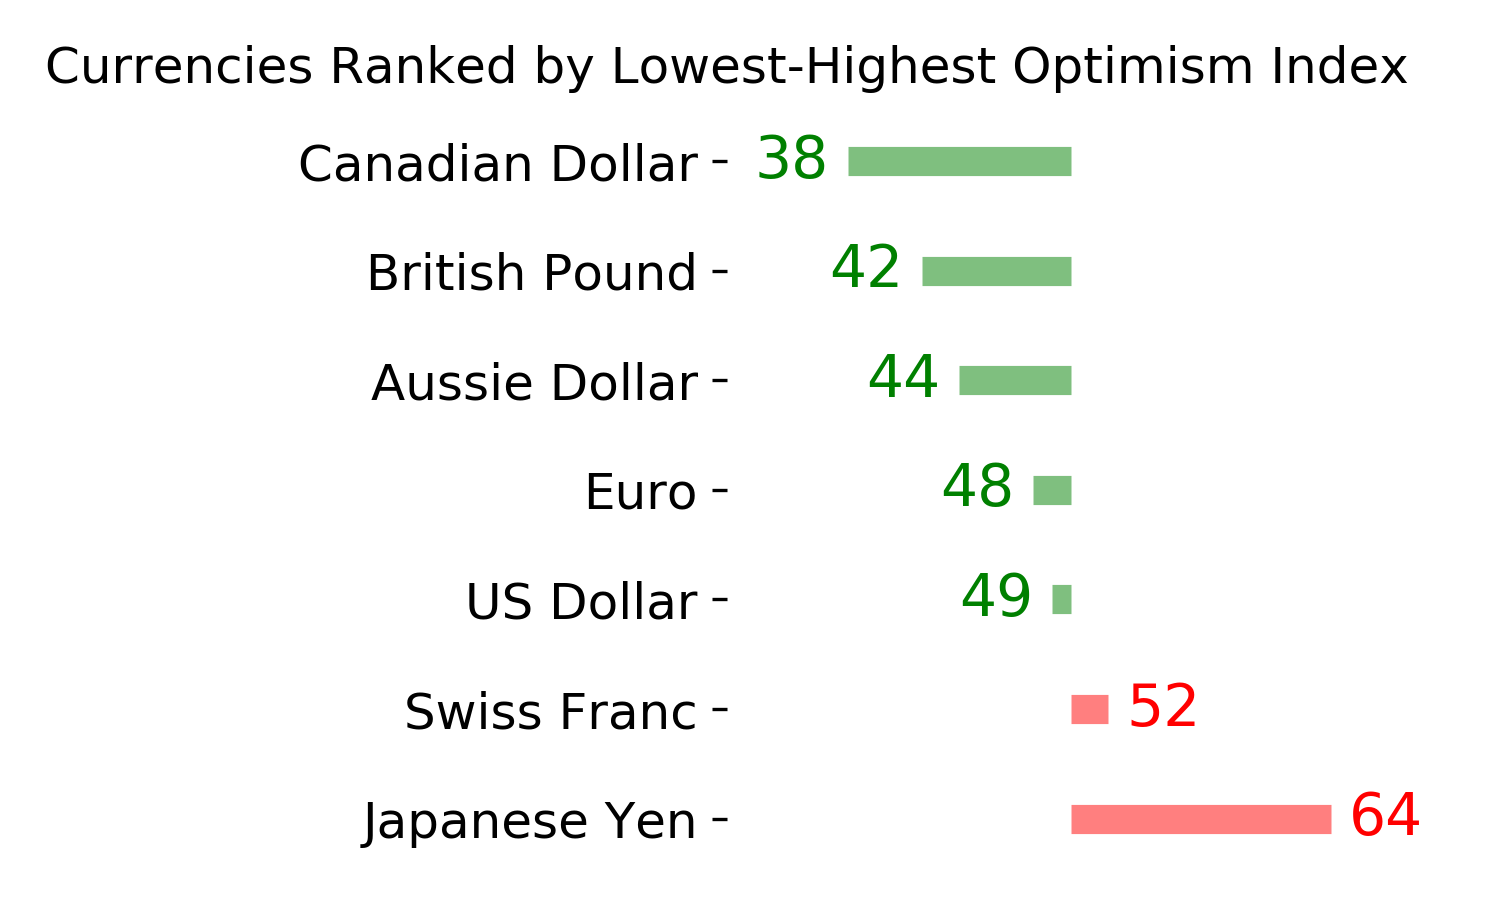
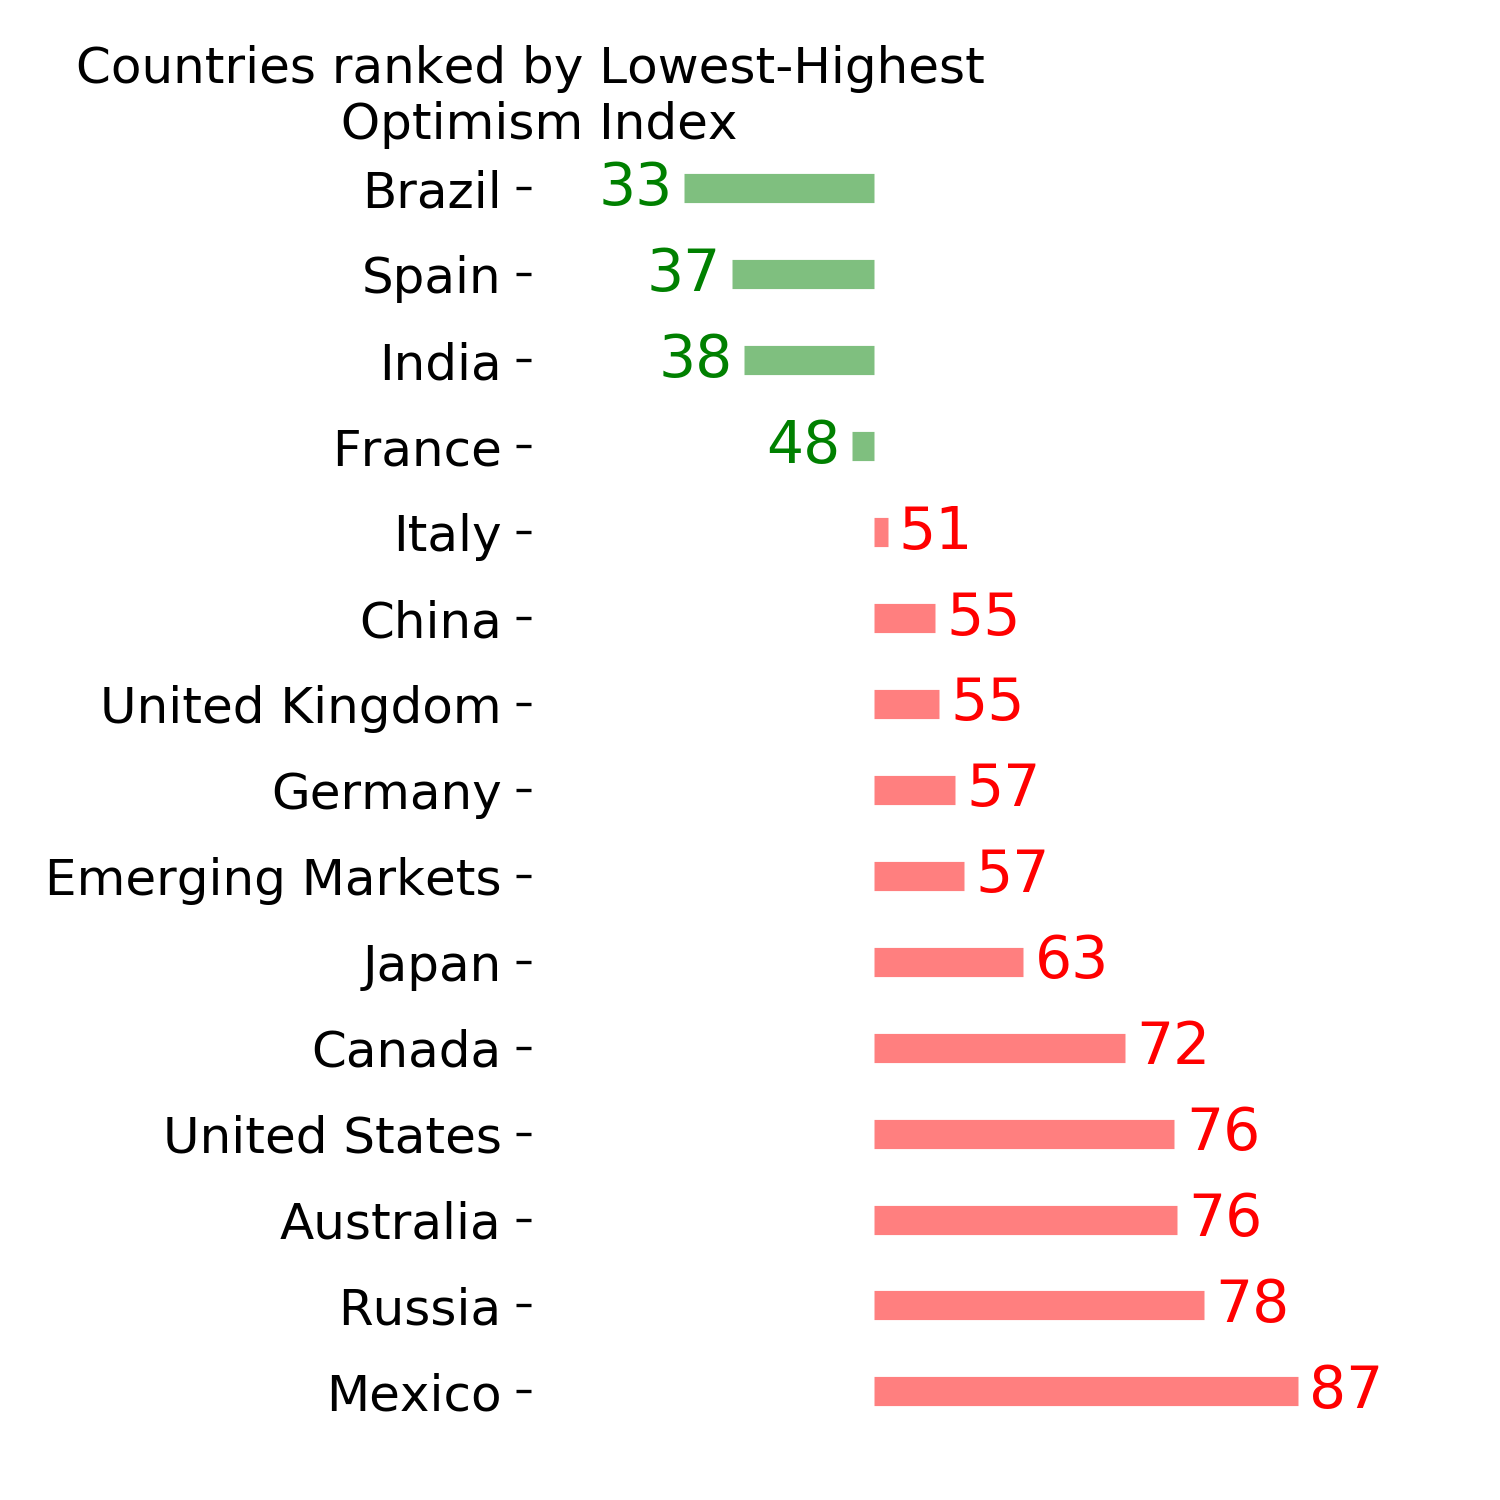
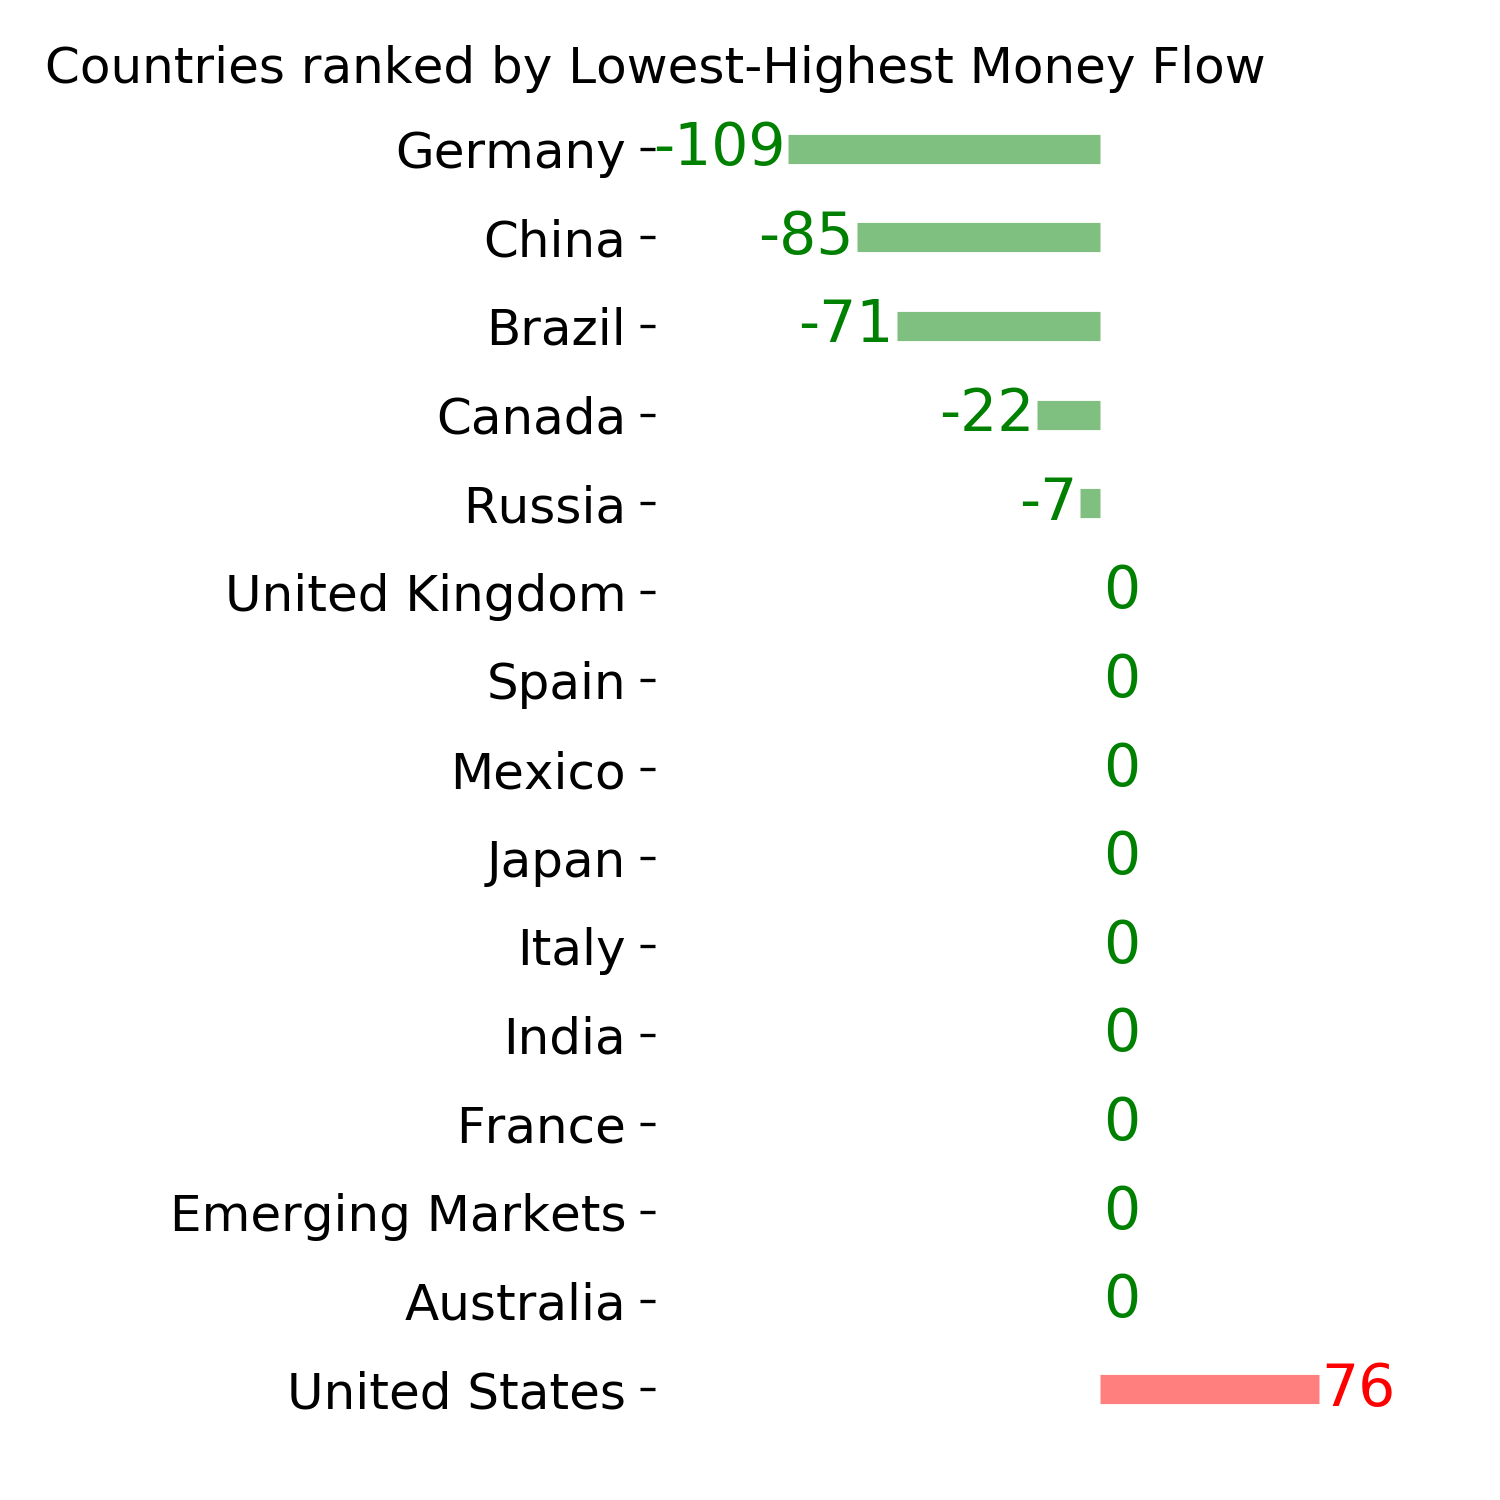
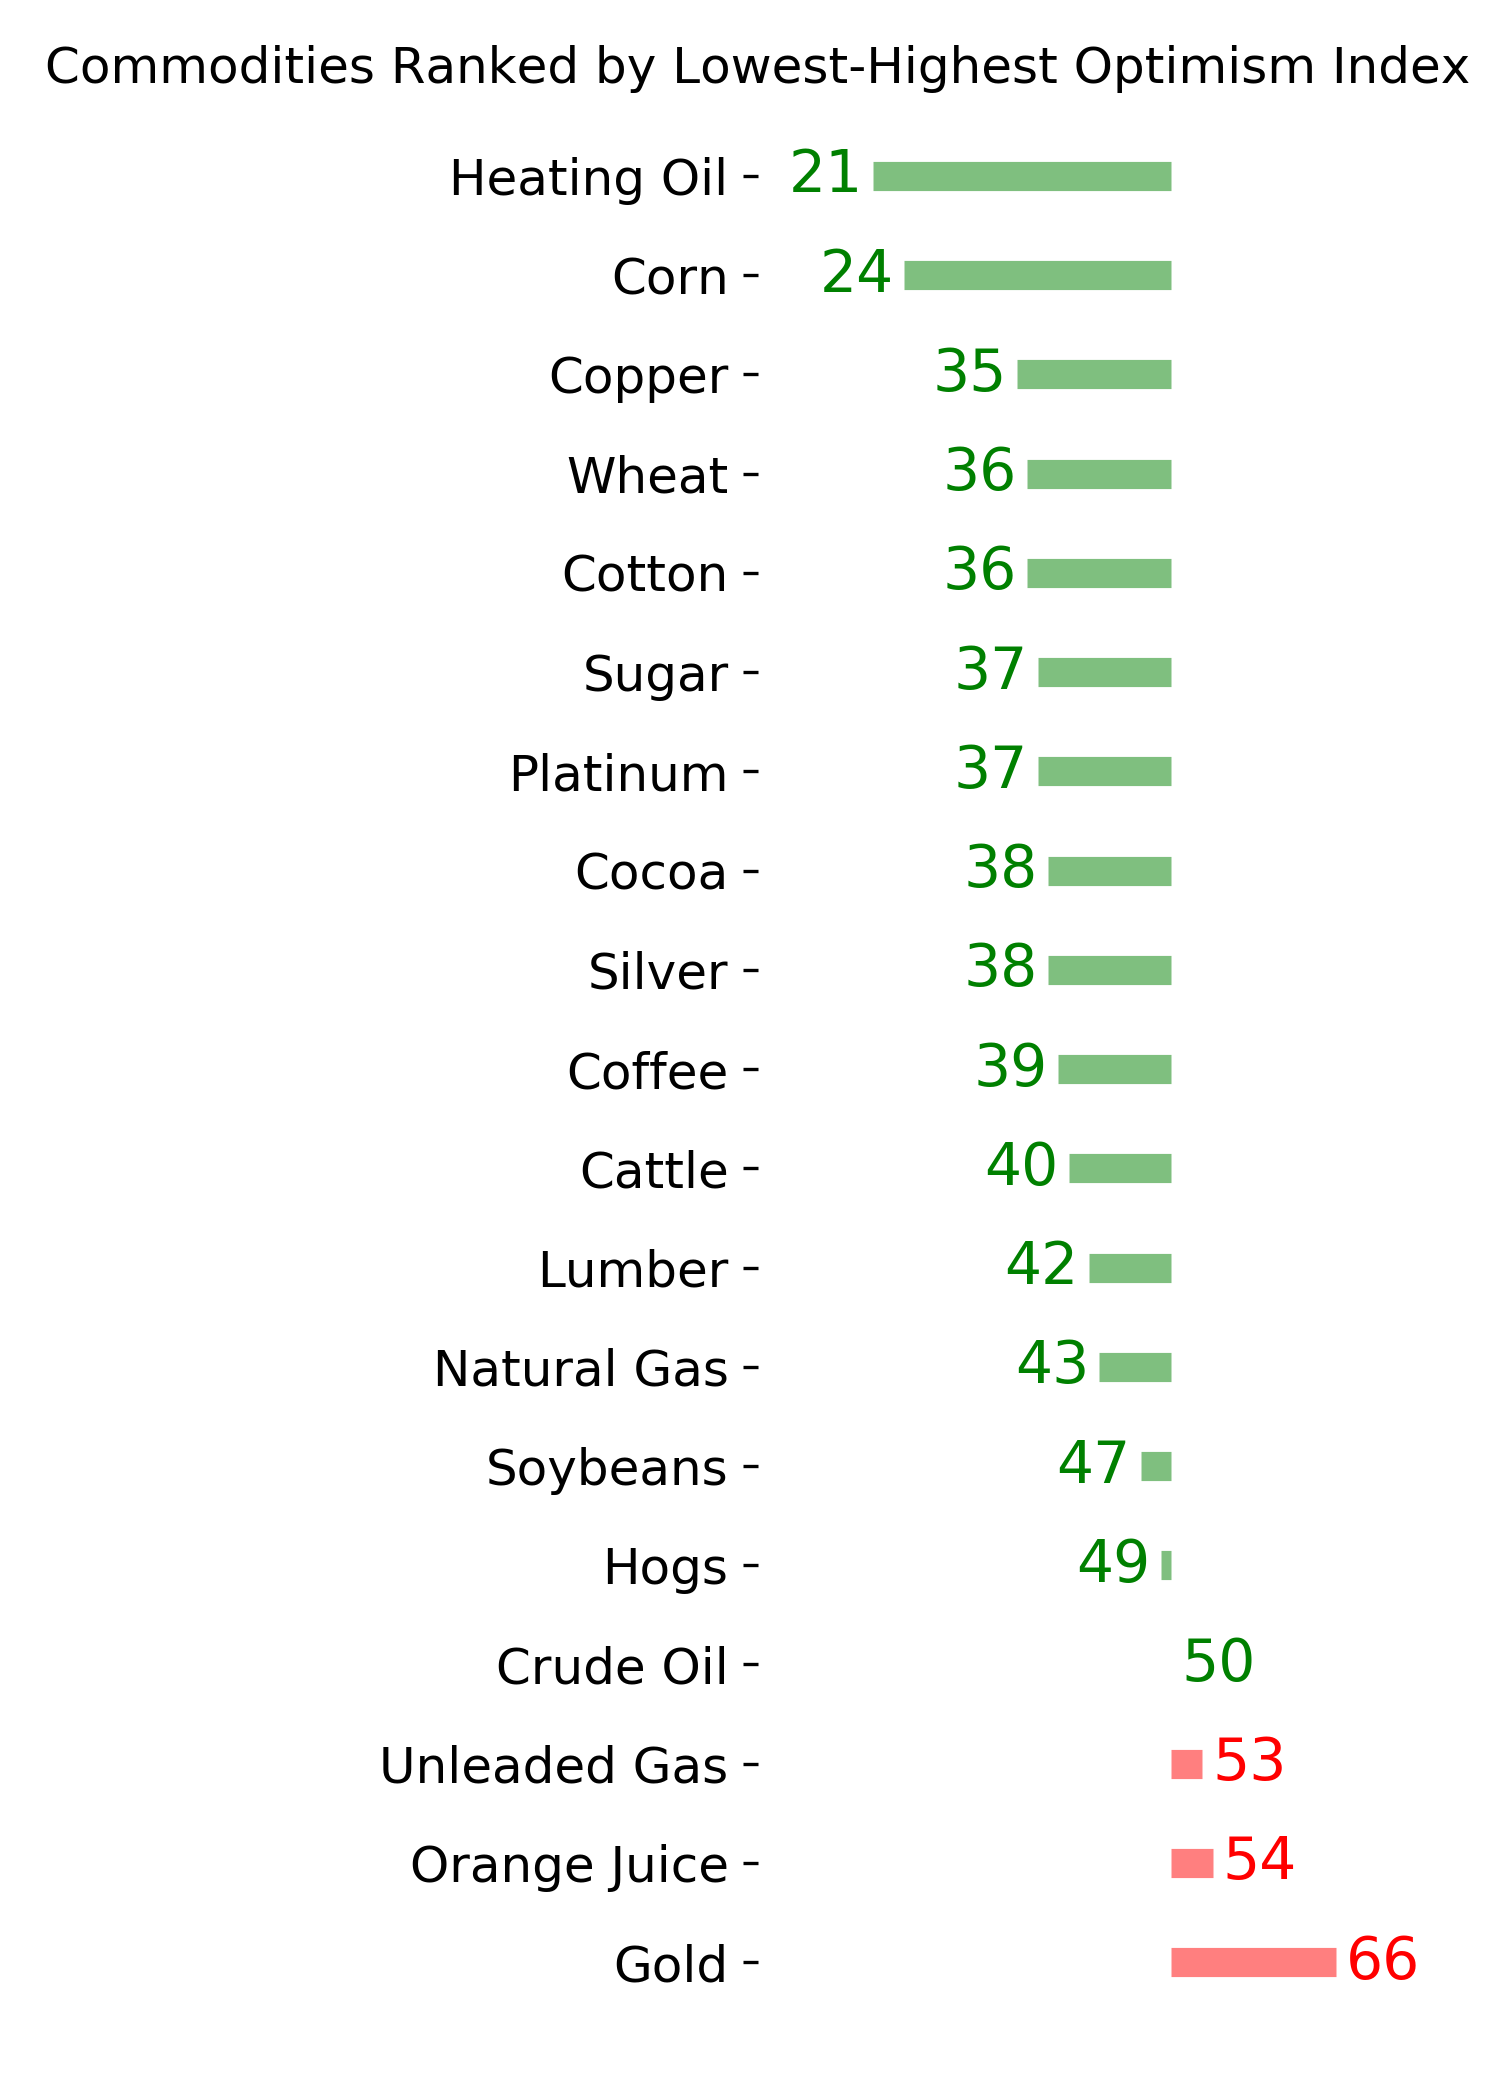
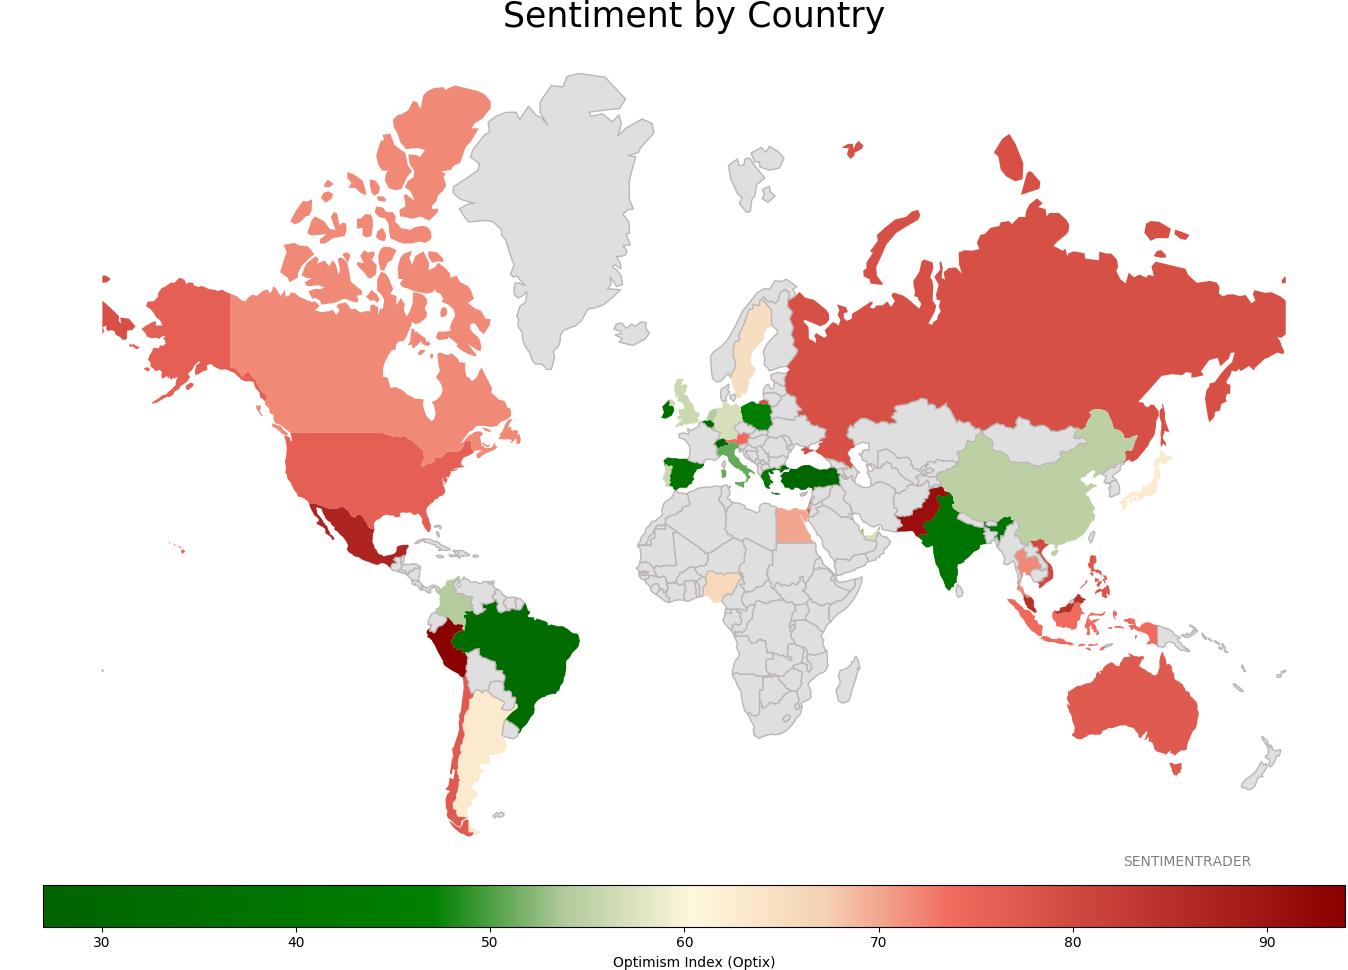
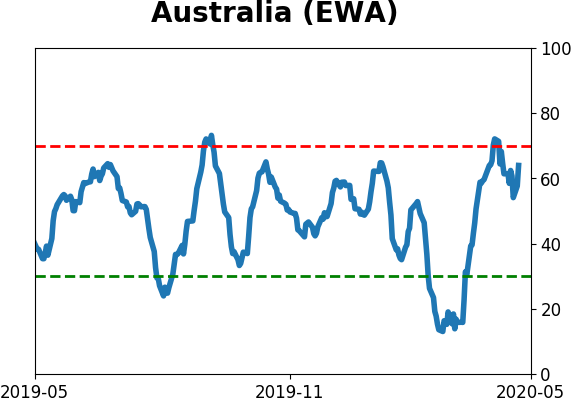
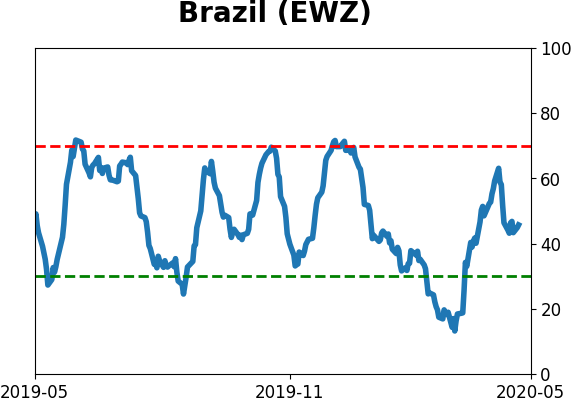
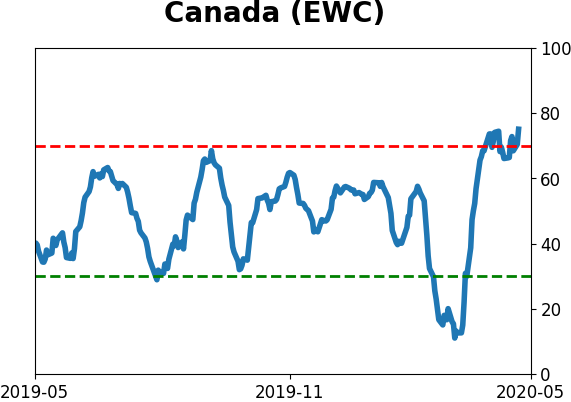
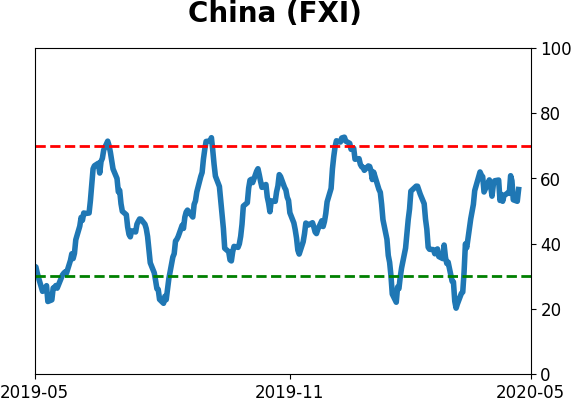
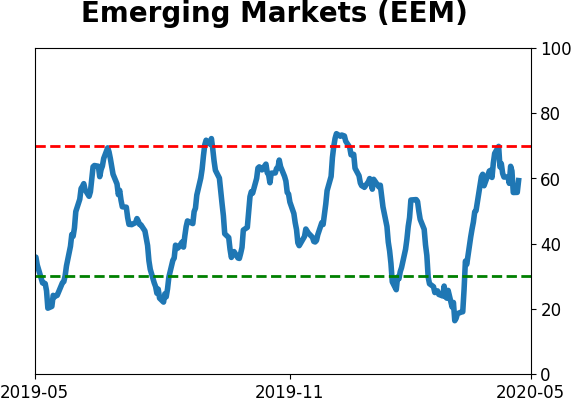
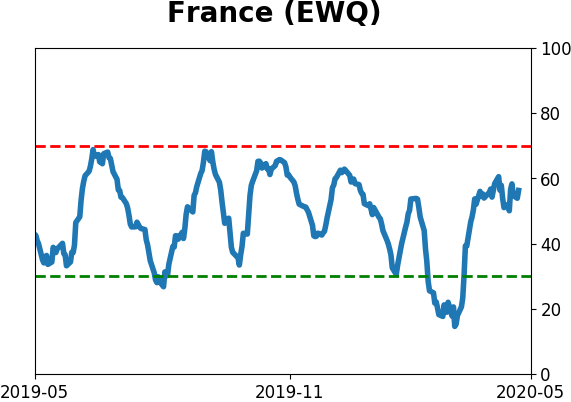
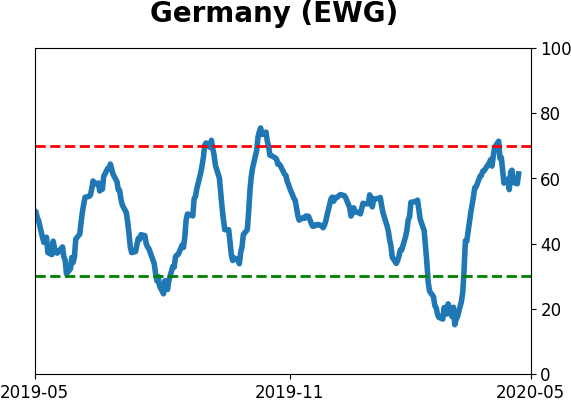
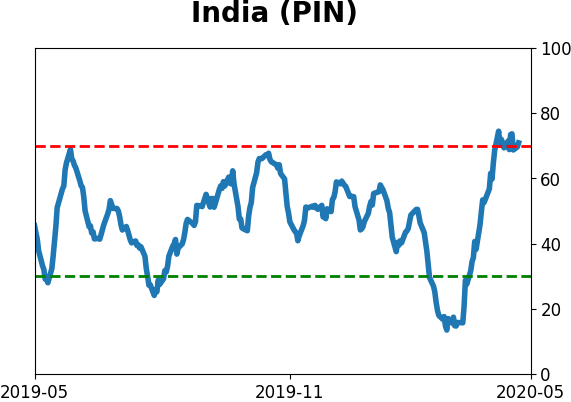
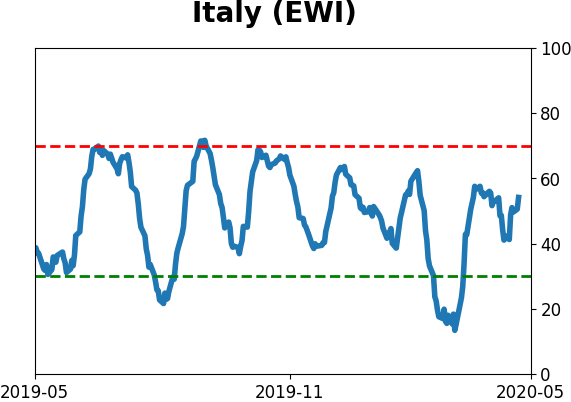
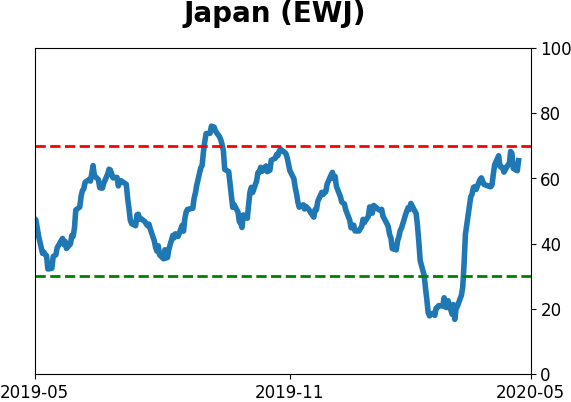
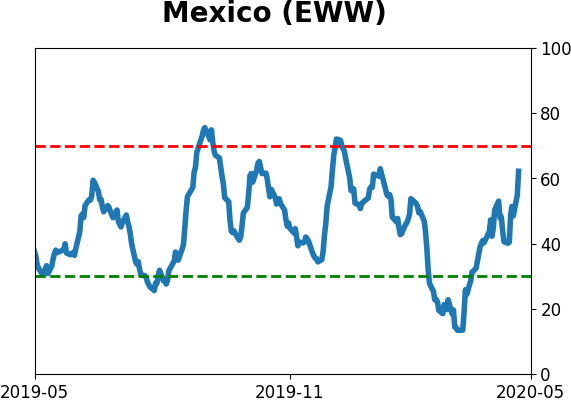
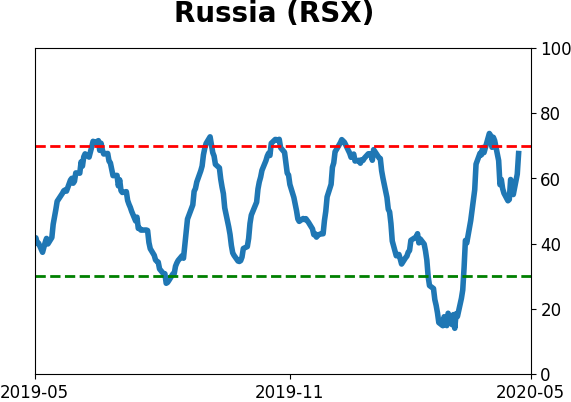
Sentiment Around The World
Optimism Index Thumbnails
|
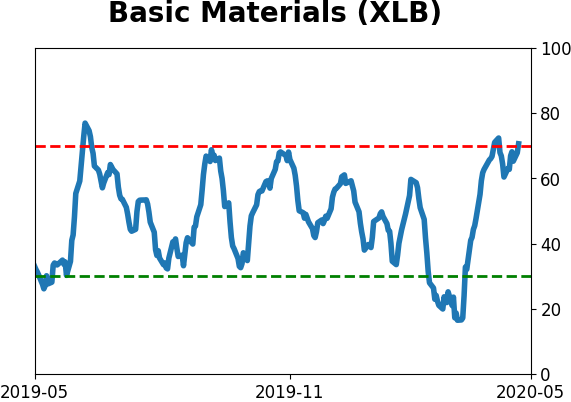
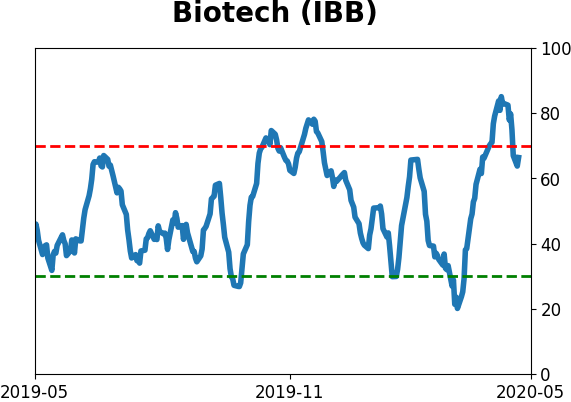
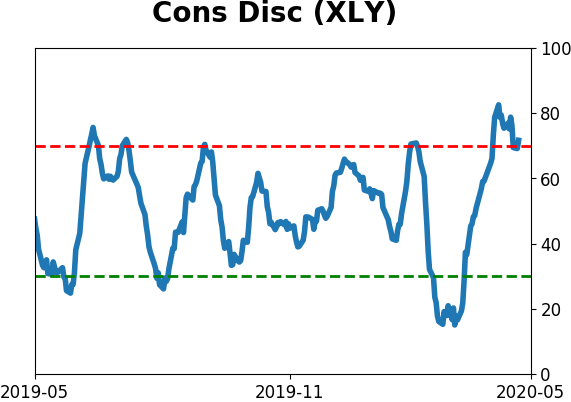
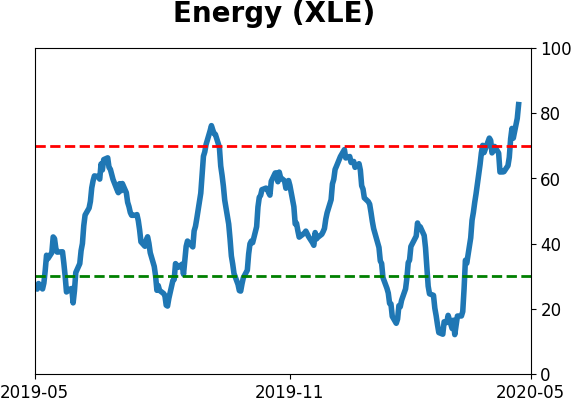
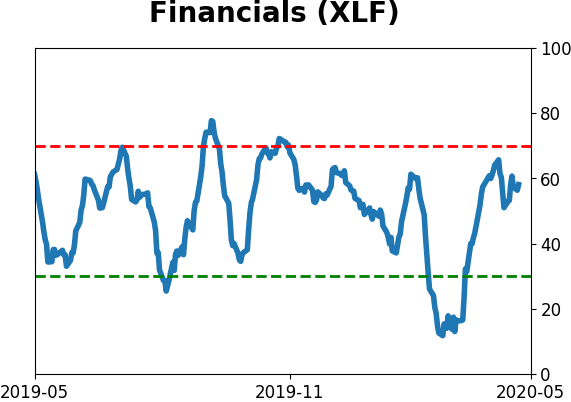
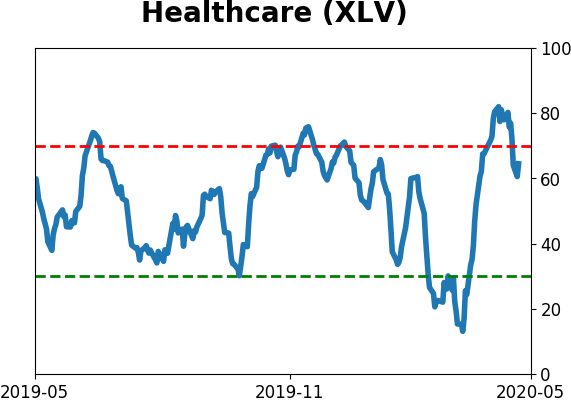
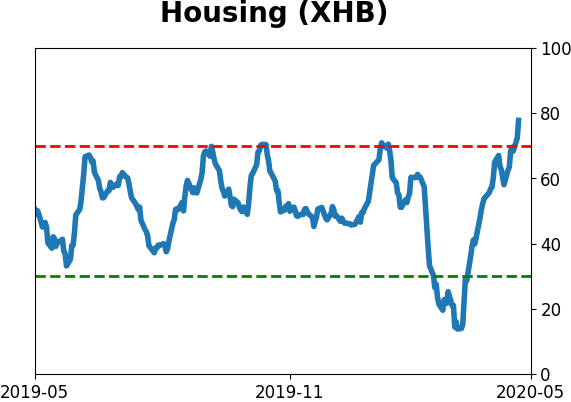
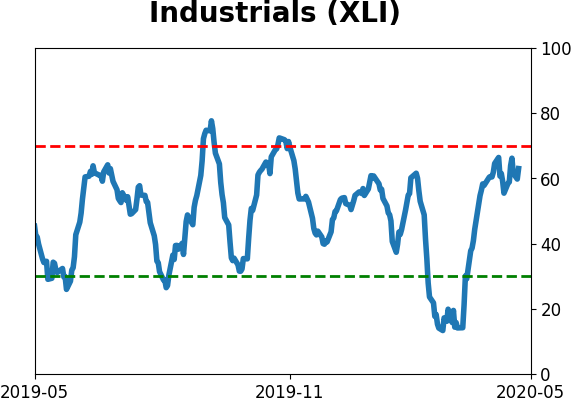
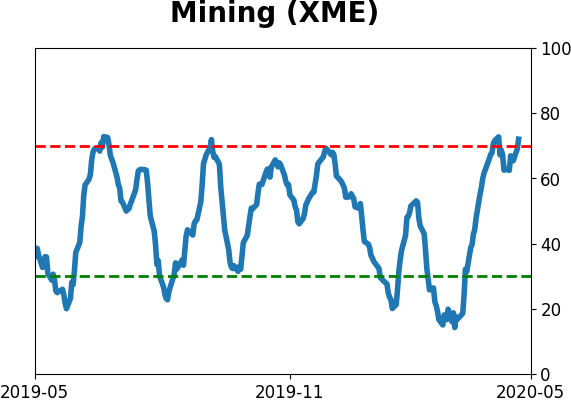
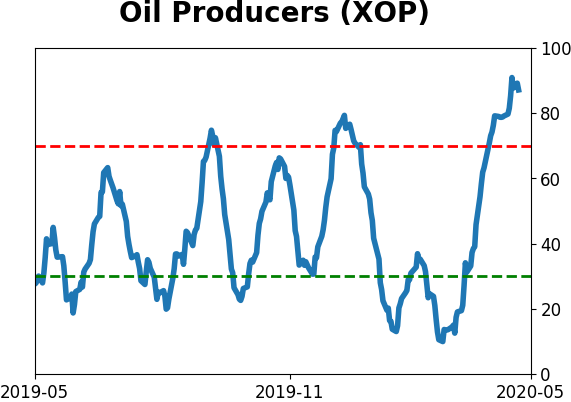
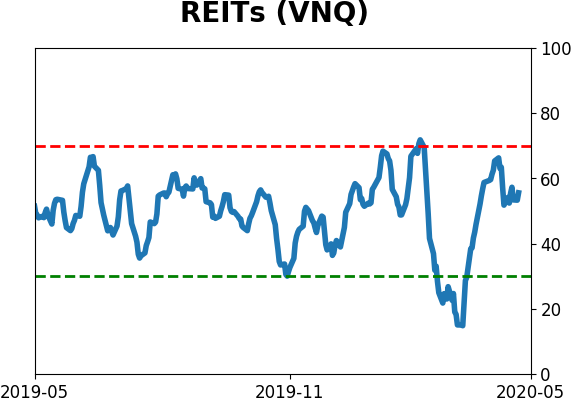
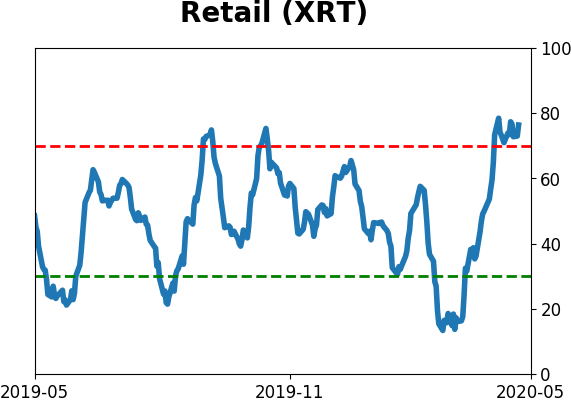
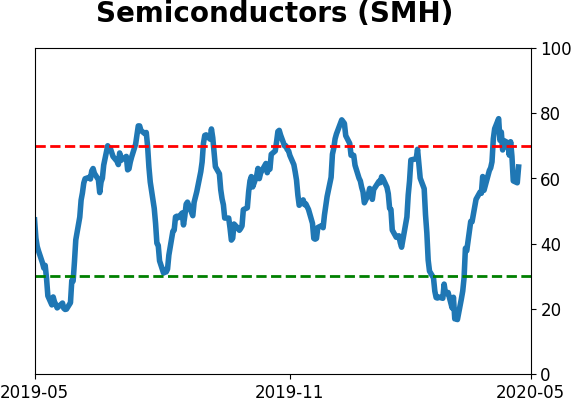
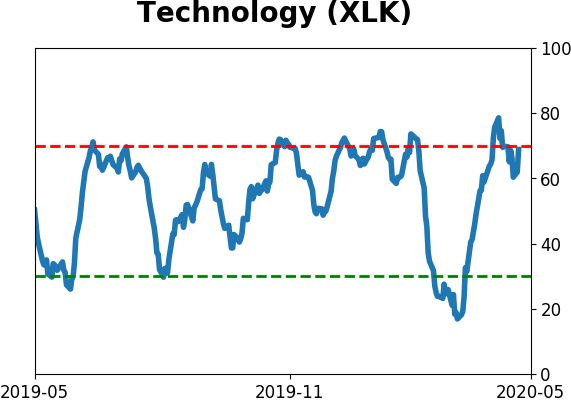
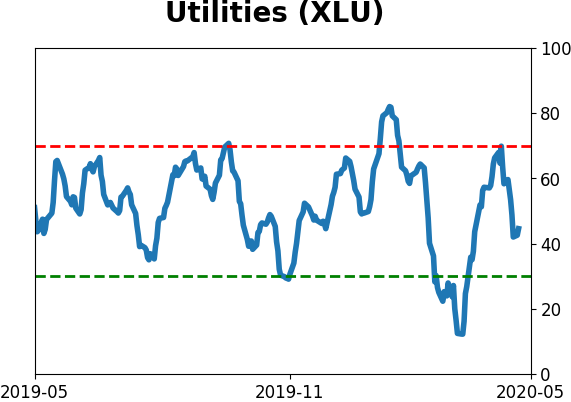
Sector ETF's - 10-Day Moving Average
|
|
|
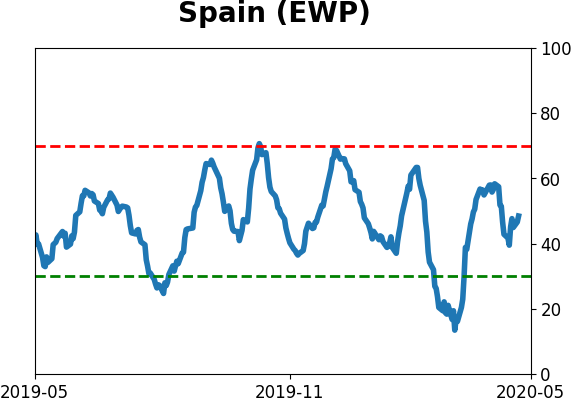
Country ETF's - 10-Day Moving Average
|
|
|
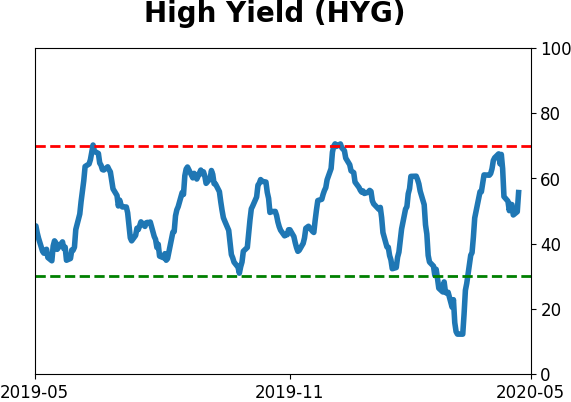
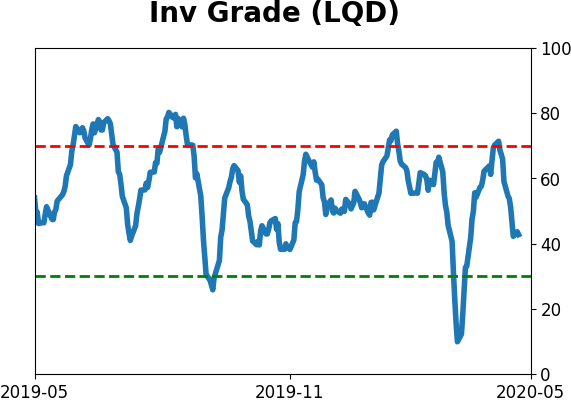
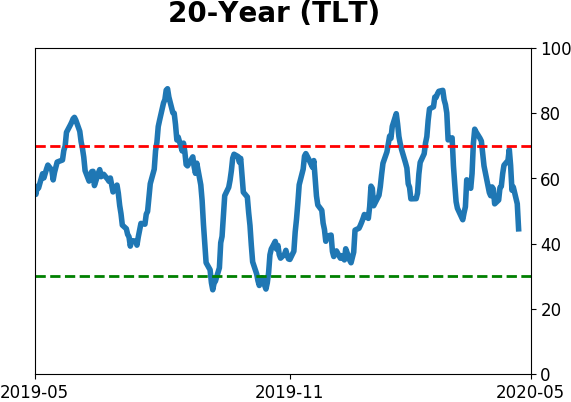
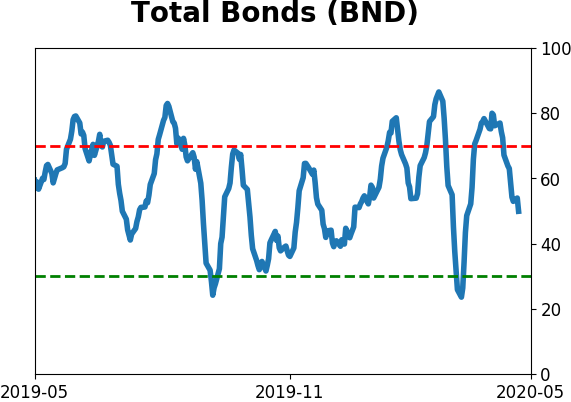
Bond ETF's - 10-Day Moving Average
|
|
|
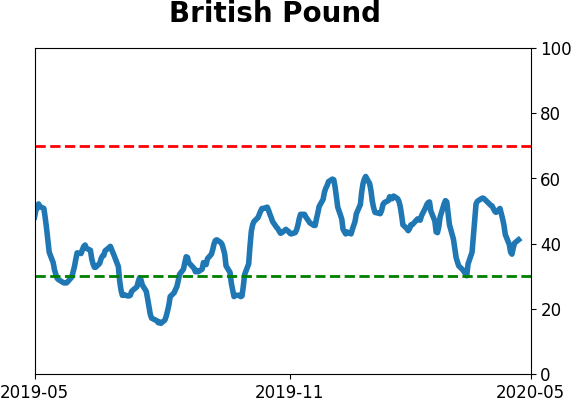
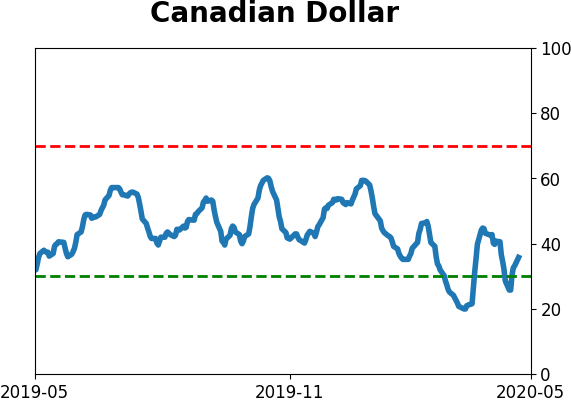
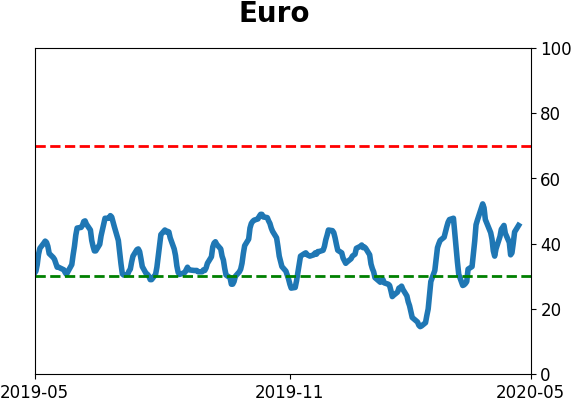
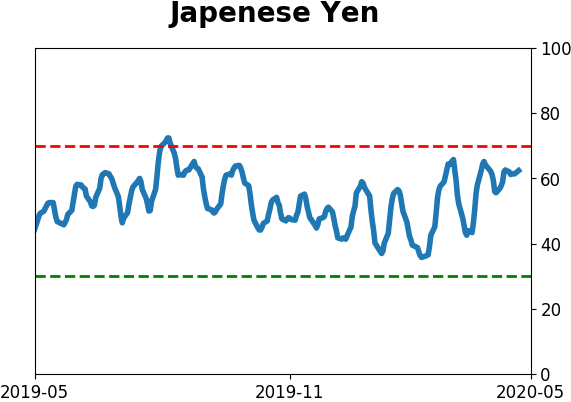
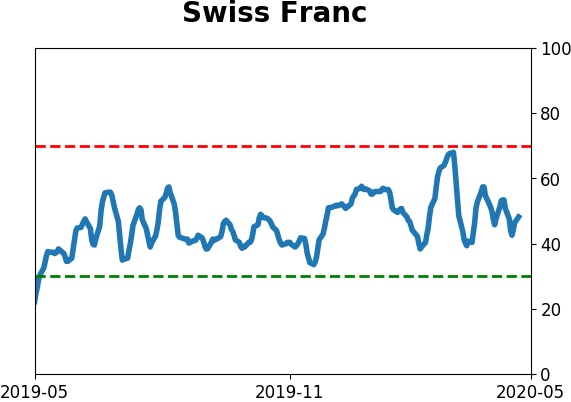
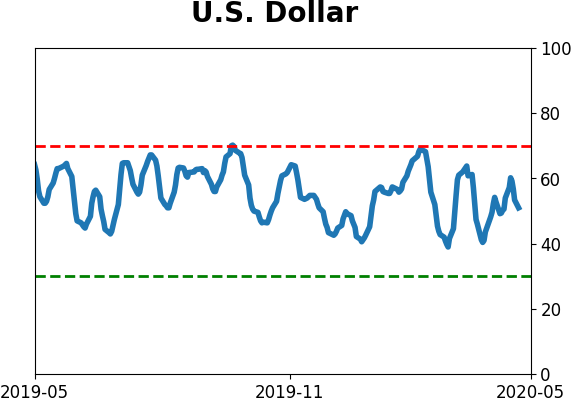
Currency ETF's - 5-Day Moving Average
|
|
|
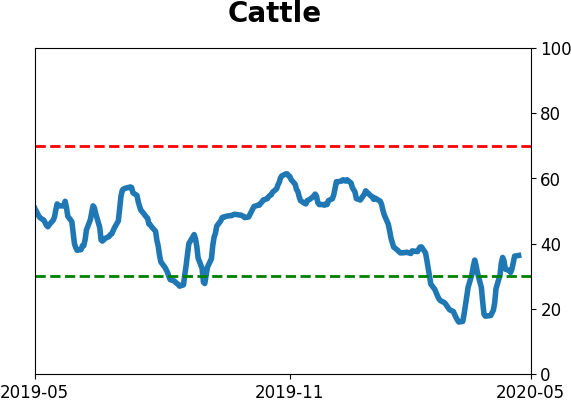
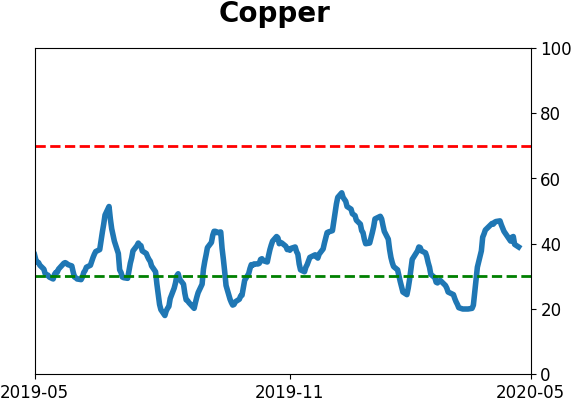
Commodity ETF's - 5-Day Moving Average
|
|