Headlines
|
|
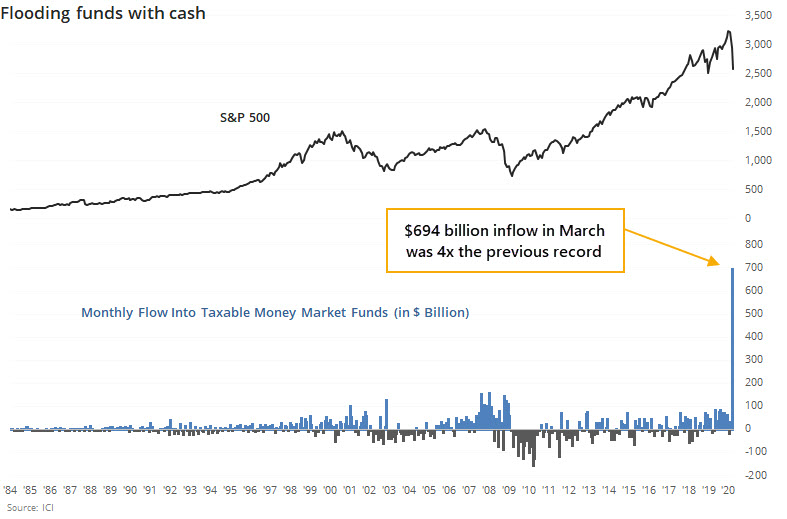
Investors across the board are hoarding cash:
There has been a surge of assets flooding into money market funds, among mom-and-pop investors, institutions, and mutual fund managers. Usually, this has occurred well before markets bottom, though.
Rally path given how sectors are reacting:
The price path since stocks bottomed on March 23 is still correlated most highly with major bottoms, as opposed to bear market rallies. The same goes for how sectors have performed during the rally. It's not a huge edge but does suggest a medium-term digestion period.
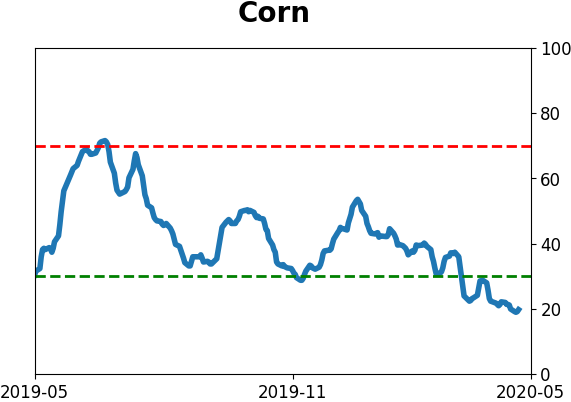
The latest Commitments of Traders report was released, covering positions through Tuesday: The latest report showed that "smart money" hedgers were still net short 10-year Treasury futures. The Backtest Engine shows that when hedgers were net short over the past decade, 10-year futures rose over the next 3 months only 20% of the time. That suggests a drop in bond prices, and a rise in yields. They increased their net longs in major stock index futures again, now back above $40 billion. They've continued to buy corn but their aggregate position in agricultural contracts hasn't yet reached a net long position.
|
Smart / Dumb Money Confidence
|
Smart Money Confidence: 68%
Dumb Money Confidence: 54%
|
|
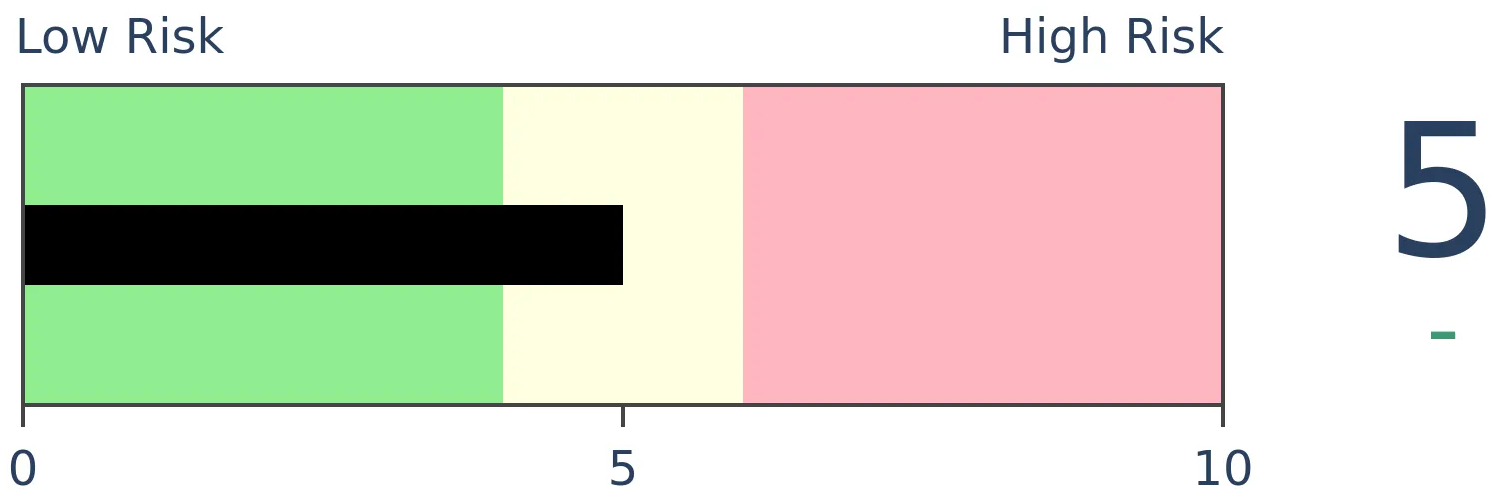
Risk Levels
Stocks Short-Term

|
Stocks Medium-Term
|
|
Bonds
|
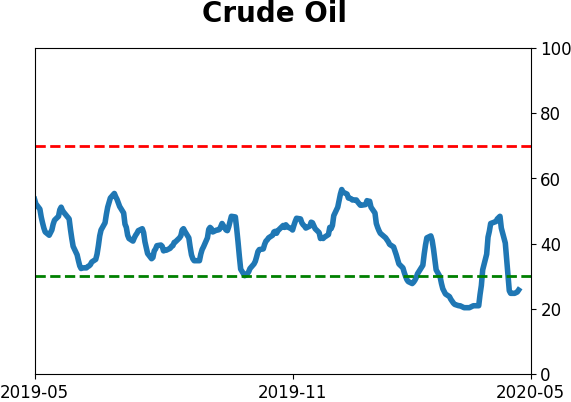
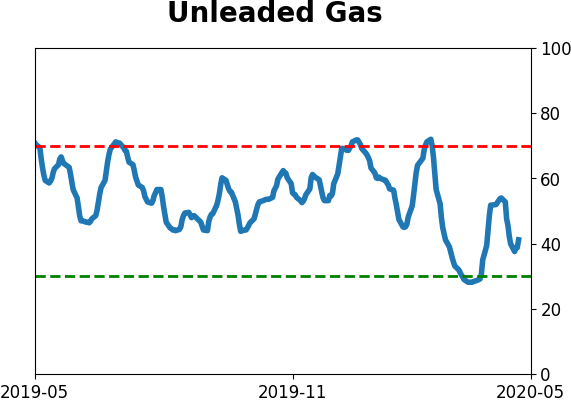
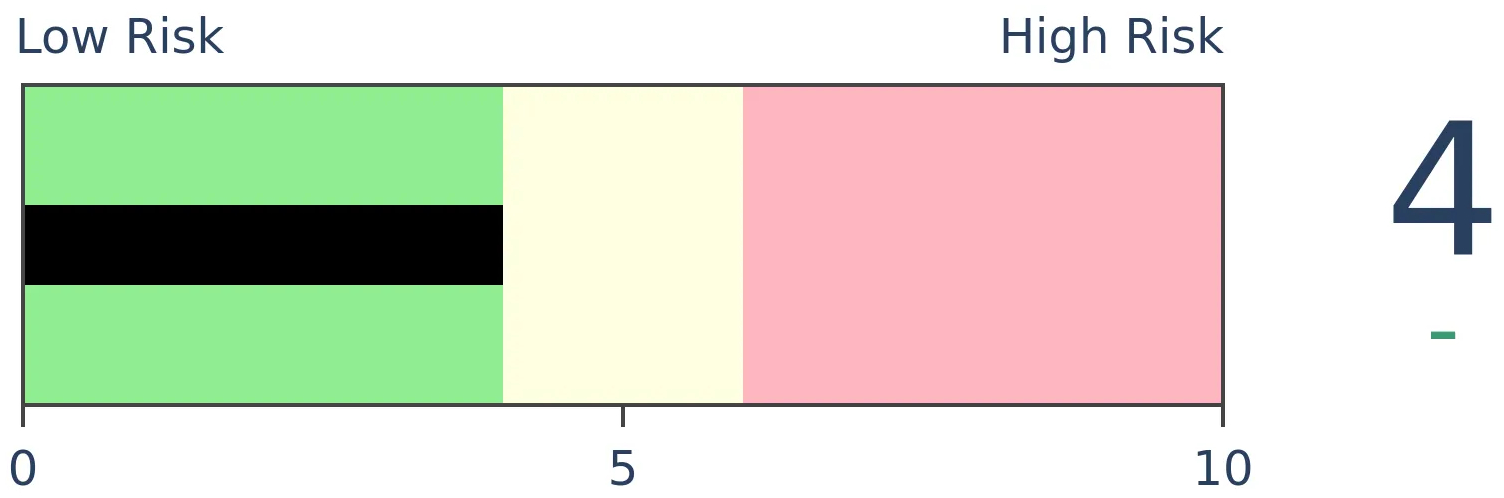
Crude Oil
|
|
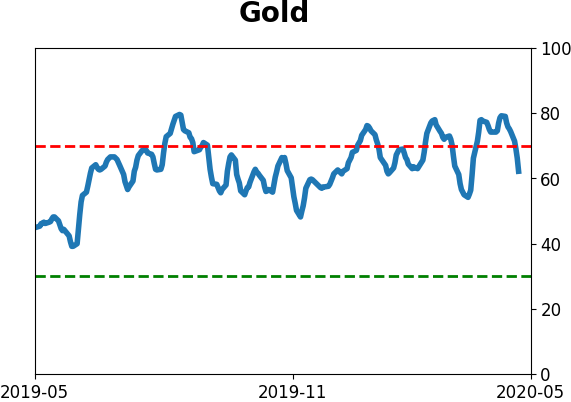
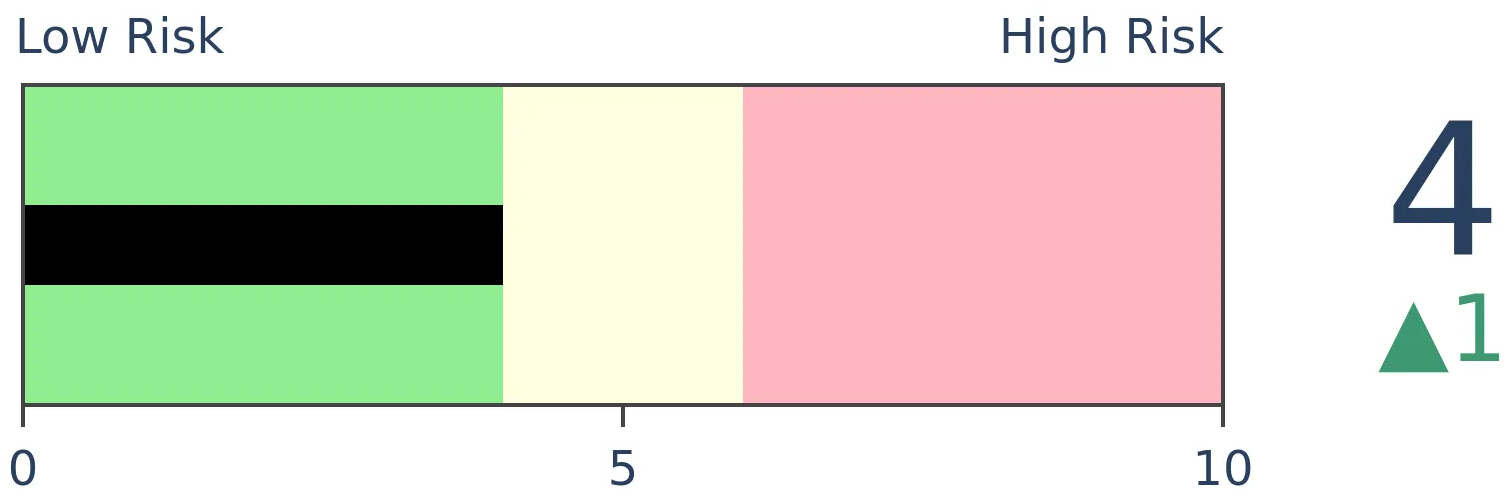
Gold
|
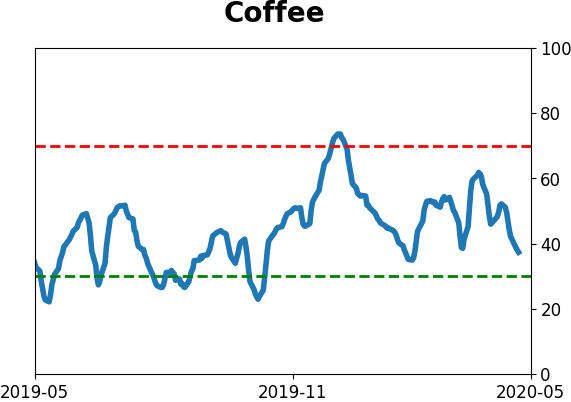
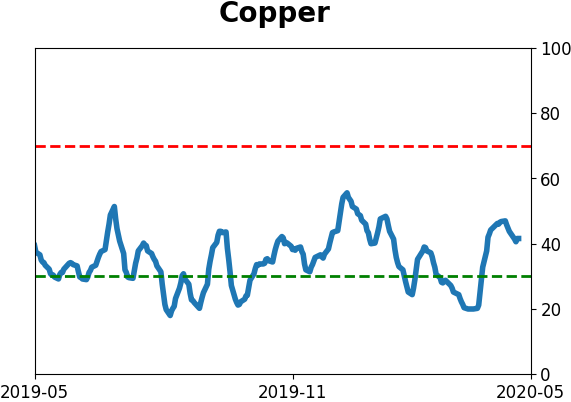
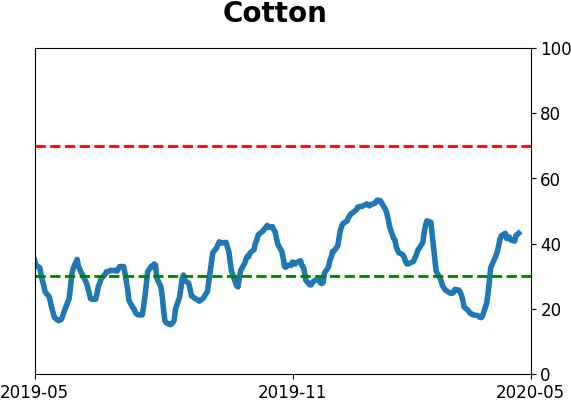
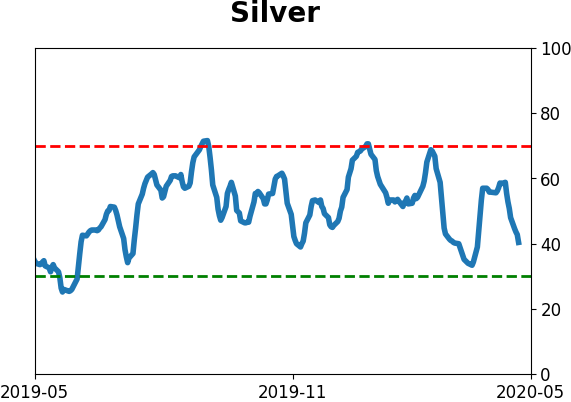
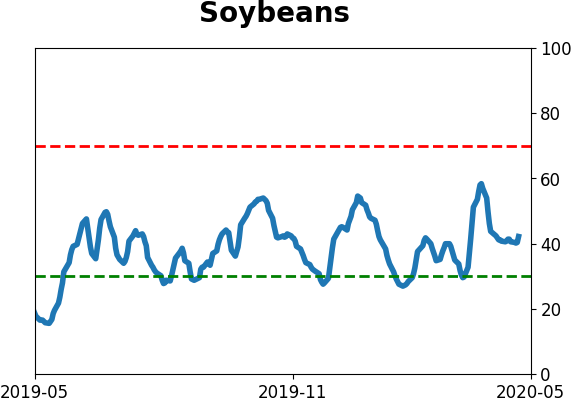
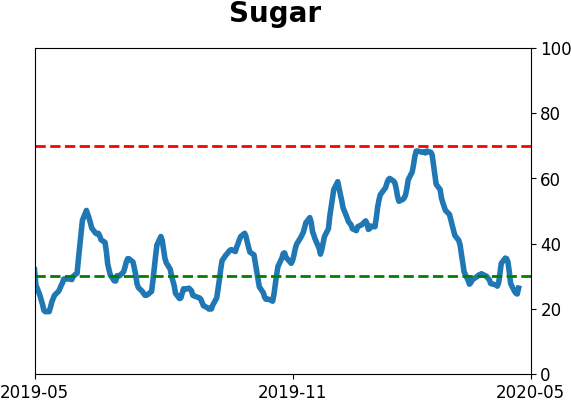
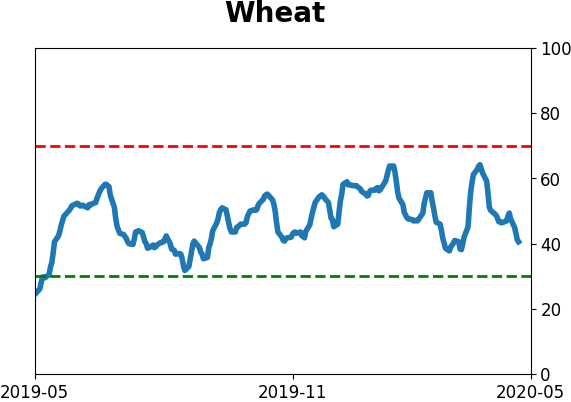
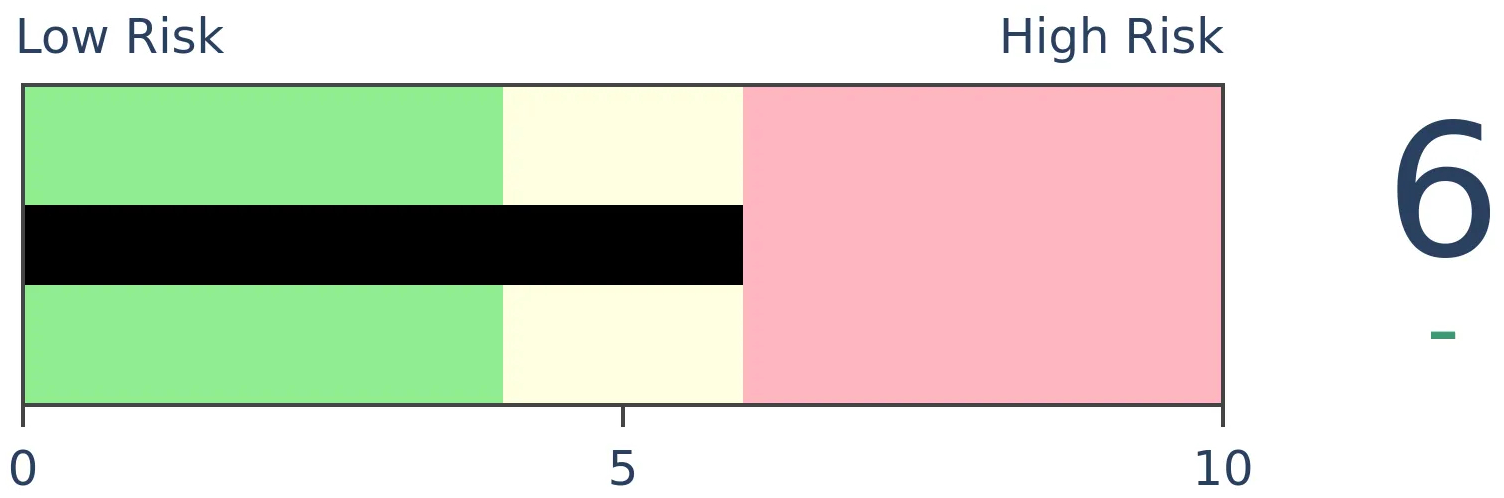
Agriculture

|
|
Research
BOTTOM LINE
There has been a surge of assets flooding into money market funds, among mom-and-pop investors, institutions, and mutual fund managers. Usually, this has occurred well before markets bottom, though.
FORECAST / TIMEFRAME
None
|
Investors have been shoving money into the safety of money markets on a scale never before seen. In March alone, they moved nearly $700 billion into these funds, more than four times any prior monthly inflow.
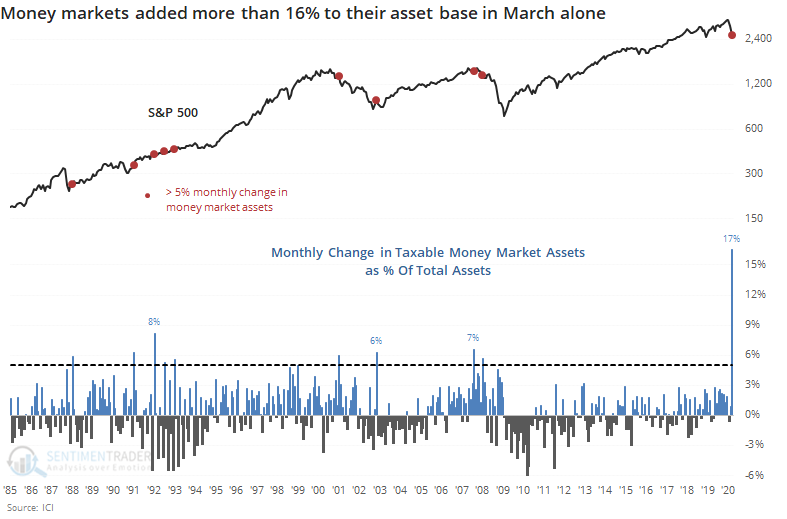
As a percentage of the asset base, the jump in March was still by far the most in 35 years.
The record of these flows is not consistent as a predictor. It led to universally higher prices prior to the last two bear markets, when it was woefully early.
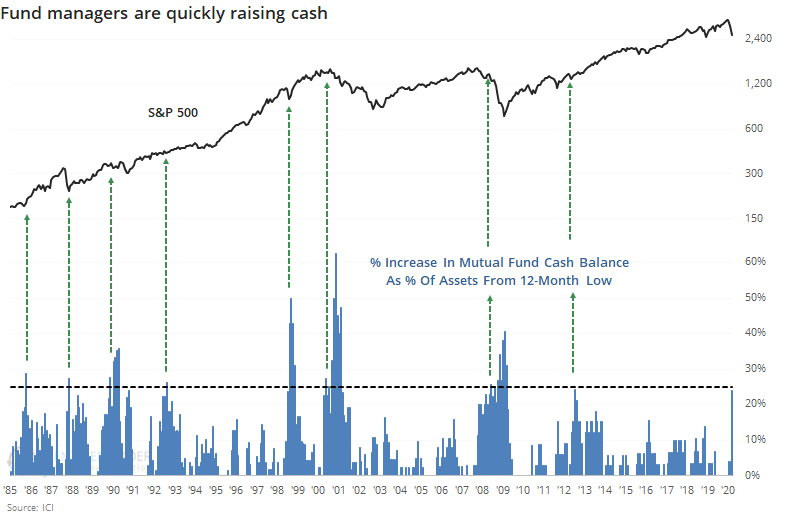
It's not just mom-and-pop investors. Institutions have been flooding money market funds, and mutual fund managers have raised the proportion of liquid assets in their funds. At 3.1% of total assets, it remains well below other periods of panic, even though the rate of change has been dramatic.
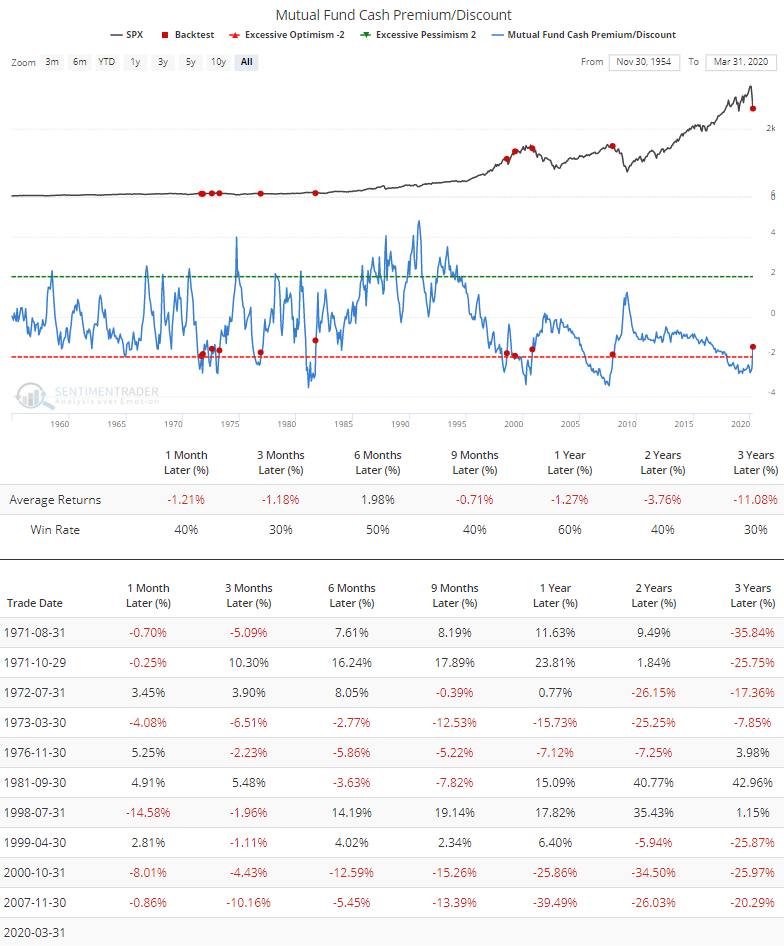
Because fund managers increased their liquid assets, and interest rates essentially went to zero, the Cash Premium/Discount improved dramatically from historic lows.
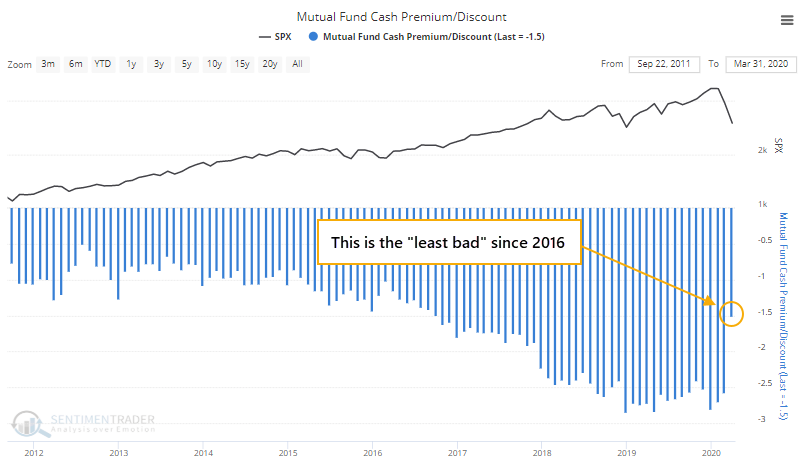
This is the start of being a good sign, with an emphasis on "start." According to the Backtest Engine, when this indicator has moved above -2, returns were unpleasant for quite a while.
As a result of the plunge in equity assets and major inflow to money market funds, the ratio of assets in equities versus money markets has cratered to the lowest since 2012.
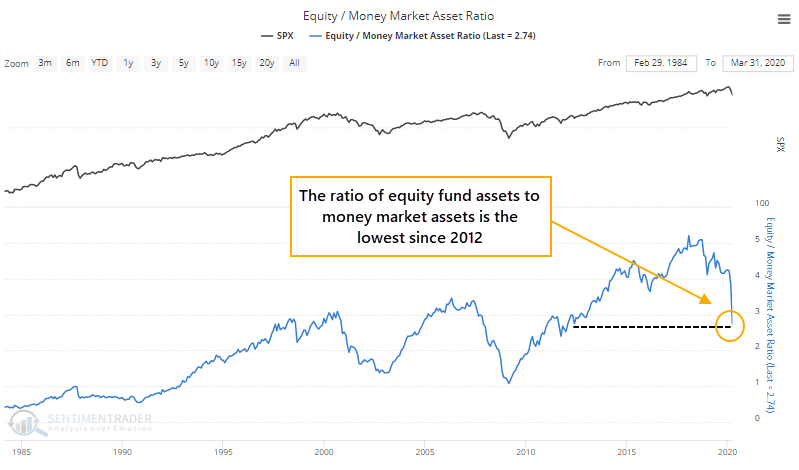
The percentage change in this ratio is dramatic, falling more than 40% from the peak. That's on par with the largest declines in 35 years.
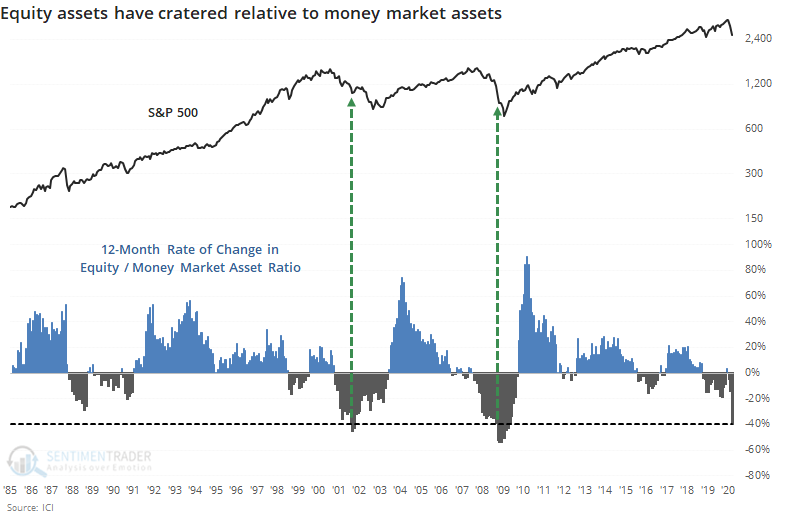
Just because the drop in the ratio has been historical doesn't necessarily mean it's a positive, at least right away. Both of the other times it declined by this month, stocks still had further to fall in the months ahead before finding a long-term bottom.
Most of the fundamental data points, and fiscal and monetary policy adjustments, are beyond what we saw near the ends of past bear markets. This decline happened so fast, though, that many investors are just catching up. So when we look at data like fund flows, especially those released with a lag, we're only seeing the kind of activity that previously triggered near the beginning of past bear markets. Based on this data in isolation, it's extreme, but not actionable. It would take more months of heavy outflows from stocks and inflows to money markets to equate to the kinds of readings we more commonly saw at or near the ends of other bear markets, especially the last two.
BOTTOM LINE
The price path since stocks bottomed on March 23 is still correlated most highly with major bottoms, as opposed to bear market rallies. The same goes for how sectors have performed during the rally. It's not a huge edge but does suggest a medium-term digestion period.
FORECAST / TIMEFRAME
None
|
One of the more popular ways to look at the rebound over the past month is how much it looks like other rallies. Does it seem more like a bull market kick-off, or just another bear market rally?
We've looked at it multiple ways since March, and the Wall Street Journal noted it again on Friday.
"In zoological terms, is the 34% rebound since the low of March 23 the start of a new bull market or merely a dead cat bounce we will all forget when the bear returns?"
The idea that we're going to enjoy a v-shaped recovery is being met with increased skepticism as the latest studies suggest a more prolonged misery than many have been expecting. So, let's revisit it in a couple of different ways. First, looking at the highest-correlated rebounds using pure price action, then according to which sectors have led and lagged.
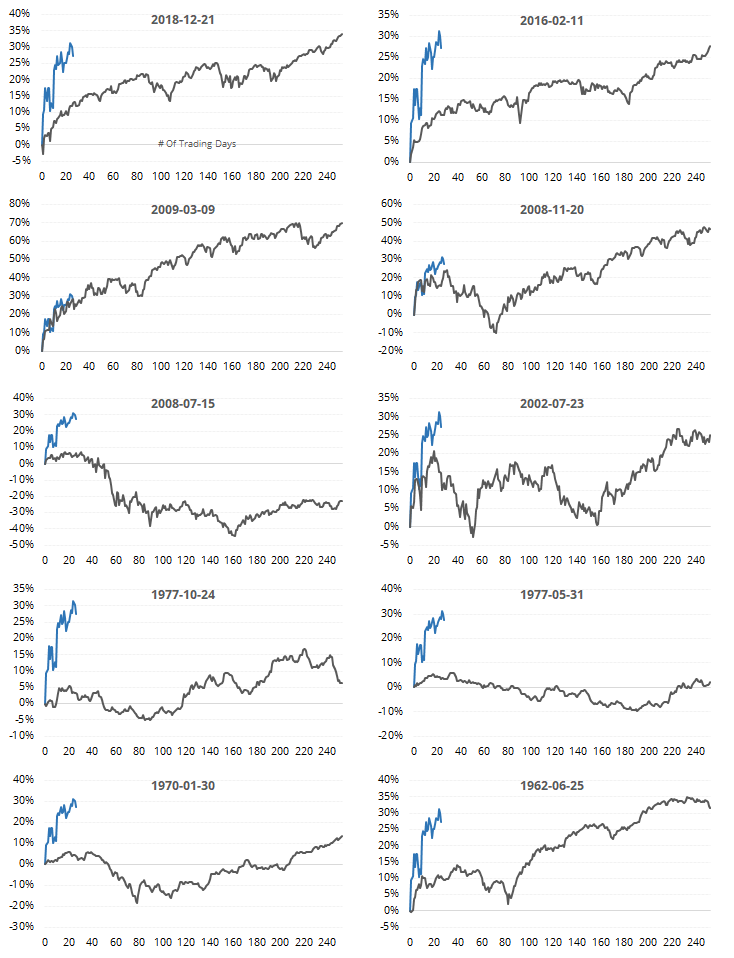
Using pure price action this many days into a rebound following a 52-week low, here is the price path among the 10 highest-correlated bounces.
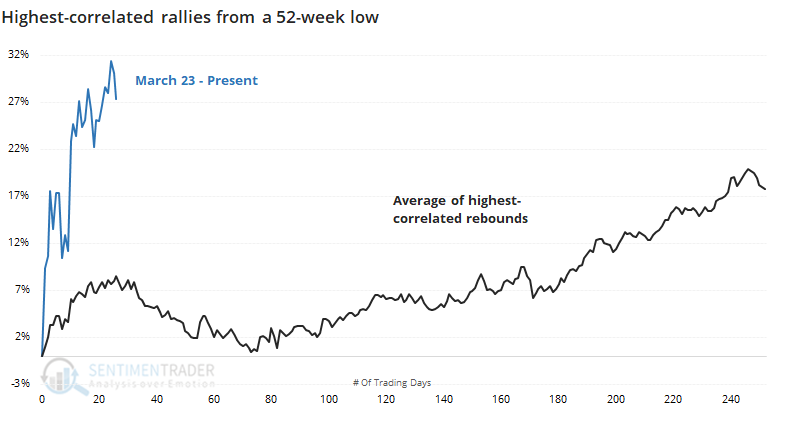
Most of them ran into some trouble, to put it mildly, right around now.
As the WSJ also noted:
"Furthermore, it has been a strange recovery. After energy stocks, the two best sectors in the S&P from the March low up to Friday were health care and utilities, defensive companies usually expected to prosper in bad times, not in a bounce back. Industrials, classic cyclical stocks that ought to do well when investors expect the economy to prosper, underperformed."
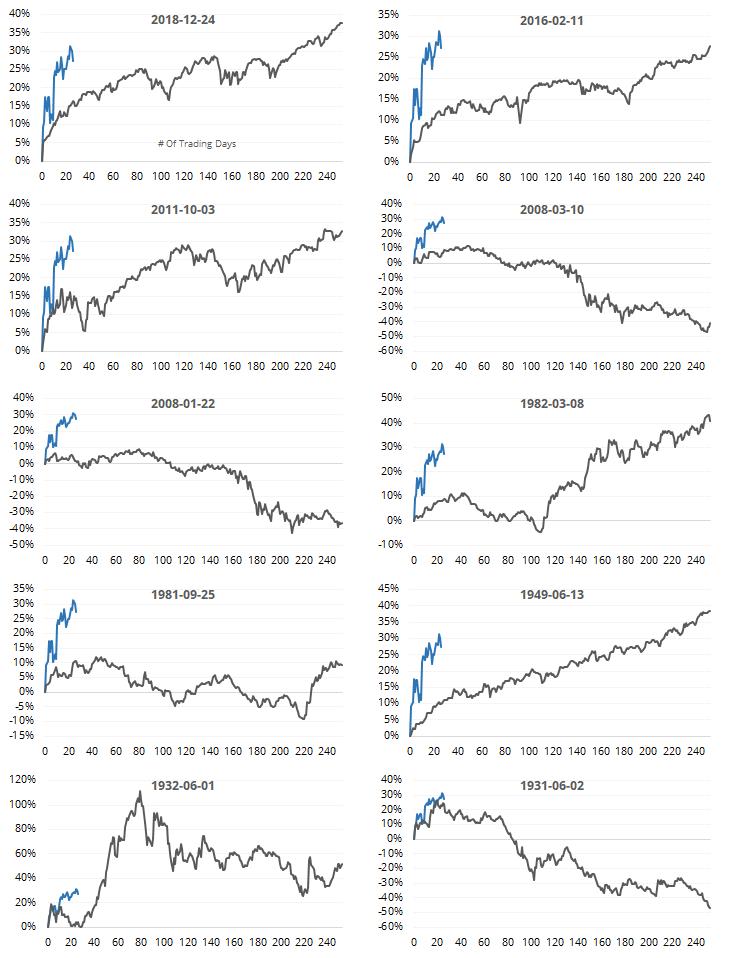
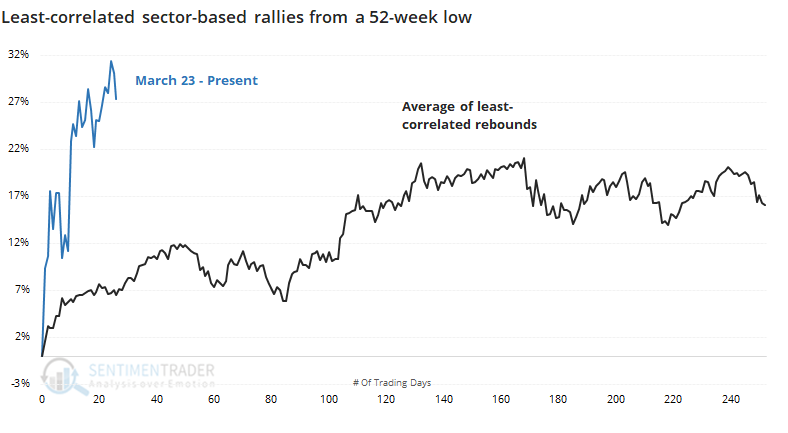
Instead of looking at action in the S&P 500 index itself, let's focus on performance among the 11 major sectors during the rally. Again, we'll look at the price path in the S&P following the rebounds with the sector returns that are most closely correlated to how sectors performed since the March 23 bottom.
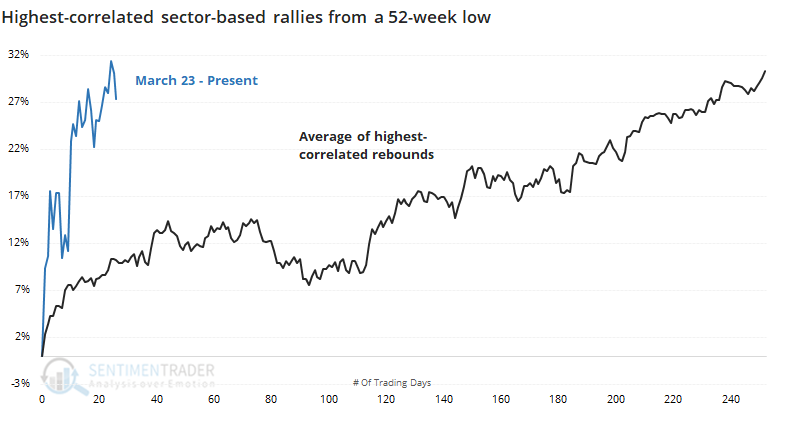
Again, the S&P tended to plateau around now, at least for a few months, though the pullbacks weren't as deep. Individually, there was wide variation in their paths going forward.
We often like to look also at counter-examples. If the highest-correlated ones show a certain pattern, and the least-correlated show the opposite pattern going forward, then it adds to the robustness of the study.
After rallies with the highest-correlated sector returns, the future path of the S&P vacillated from about now through approximately day 90, then took off again to the upside.
After rallies with the least-correlated sector returns, the digestion period tended to be shorter, but the ensuing longer-term rallies were weaker.
Between price action itself and the sectors that have been driving the rally, the probability continues to look more like a legitimate bull market beginning rather than just a bear market rally. It's not a slam dunk, though, and if this is the latter, then upside should be extremely limited from here on out. If we continue to see higher highs at some point, then the "bear market rally" idea loses almost any credibility.
Active Studies
| Time Frame | Bullish | Bearish | | Short-Term | 0 | 6 | | Medium-Term | 12 | 0 | | Long-Term | 37 | 3 |
|
Indicators at Extremes
Portfolio
| Position | Weight % | Added / Reduced | Date | | Stocks | 49.9 | Reduced 10.3% | 2020-04-23 | | Bonds | 0.0 | Reduced 6.7% | 2020-02-28 | | Commodities | 5.1 | Added 2.4%
| 2020-02-28 | | Precious Metals | 0.0 | Reduced 3.6% | 2020-02-28 | | Special Situations | 0.0 | Reduced 31.9% | 2020-03-17 | | Cash | 45.0 | | |
|
Updates (Changes made today are underlined)
In the first months of the year, we saw manic trading activity. From big jumps in specific stocks to historic highs in retail trading activity to record highs in household confidence to almost unbelievable confidence among options traders. All of that came amid a market where the average stock couldn't keep up with their indexes. There were signs of waning momentum in stocks underlying the major averages, which started triggering technical warning signs in late January. The kinds of extremes we saw in December and January typically take months to wear away, but the type of selling in March went a long way toward getting there. When we place the kind of moves we saw into March 23 into the context of coming off an all-time high, there has been a high probability of a multi-month rebound. After stocks bottomed on the 23rd, they enjoyed a historic buying thrust and retraced a larger amount of the decline than "just a bear market rally" tends to. While other signs are mixed that panic is subsiding, those thrusts are the most encouraging sign we've seen in years. Shorter-term, there have been some warning signs popping up and our studies have stopped showing as positively skewed returns. I reduced my exposure some on Monday and a little more on Thursday and will consider further reducing it if we drop below last week's lows on SPY. Long-term suggestions from the studies remain robust, but shorter-term ones are significantly less so, and stocks still have to prove that we're in something other than a protracted, recessionary bear market.
RETURN YTD: -9.9% 2019: 12.6%, 2018: 0.6%, 2017: 3.8%, 2016: 17.1%, 2015: 9.2%, 2014: 14.5%, 2013: 2.2%, 2012: 10.8%, 2011: 16.5%, 2010: 15.3%, 2009: 23.9%, 2008: 16.2%, 2007: 7.8%
|
|
Phase Table
Ranks
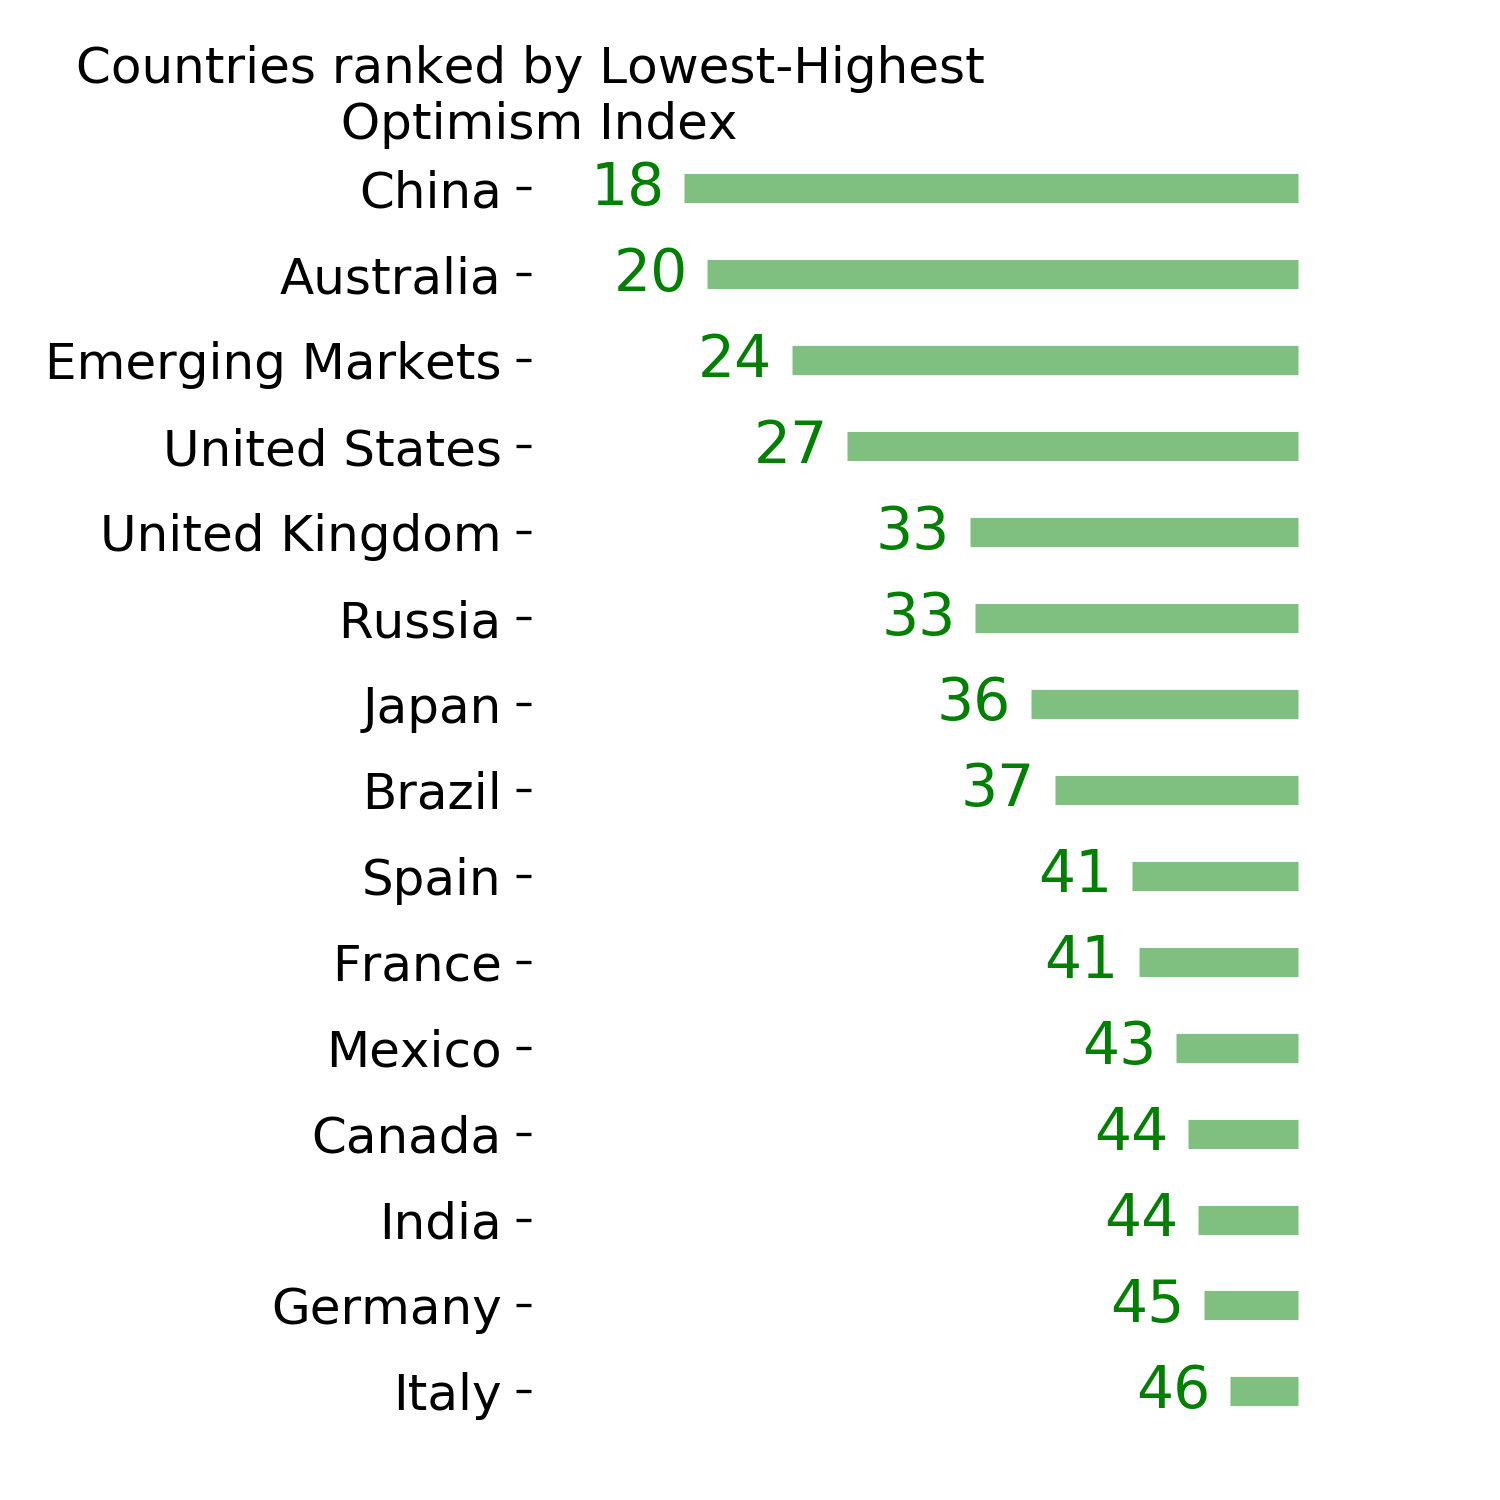
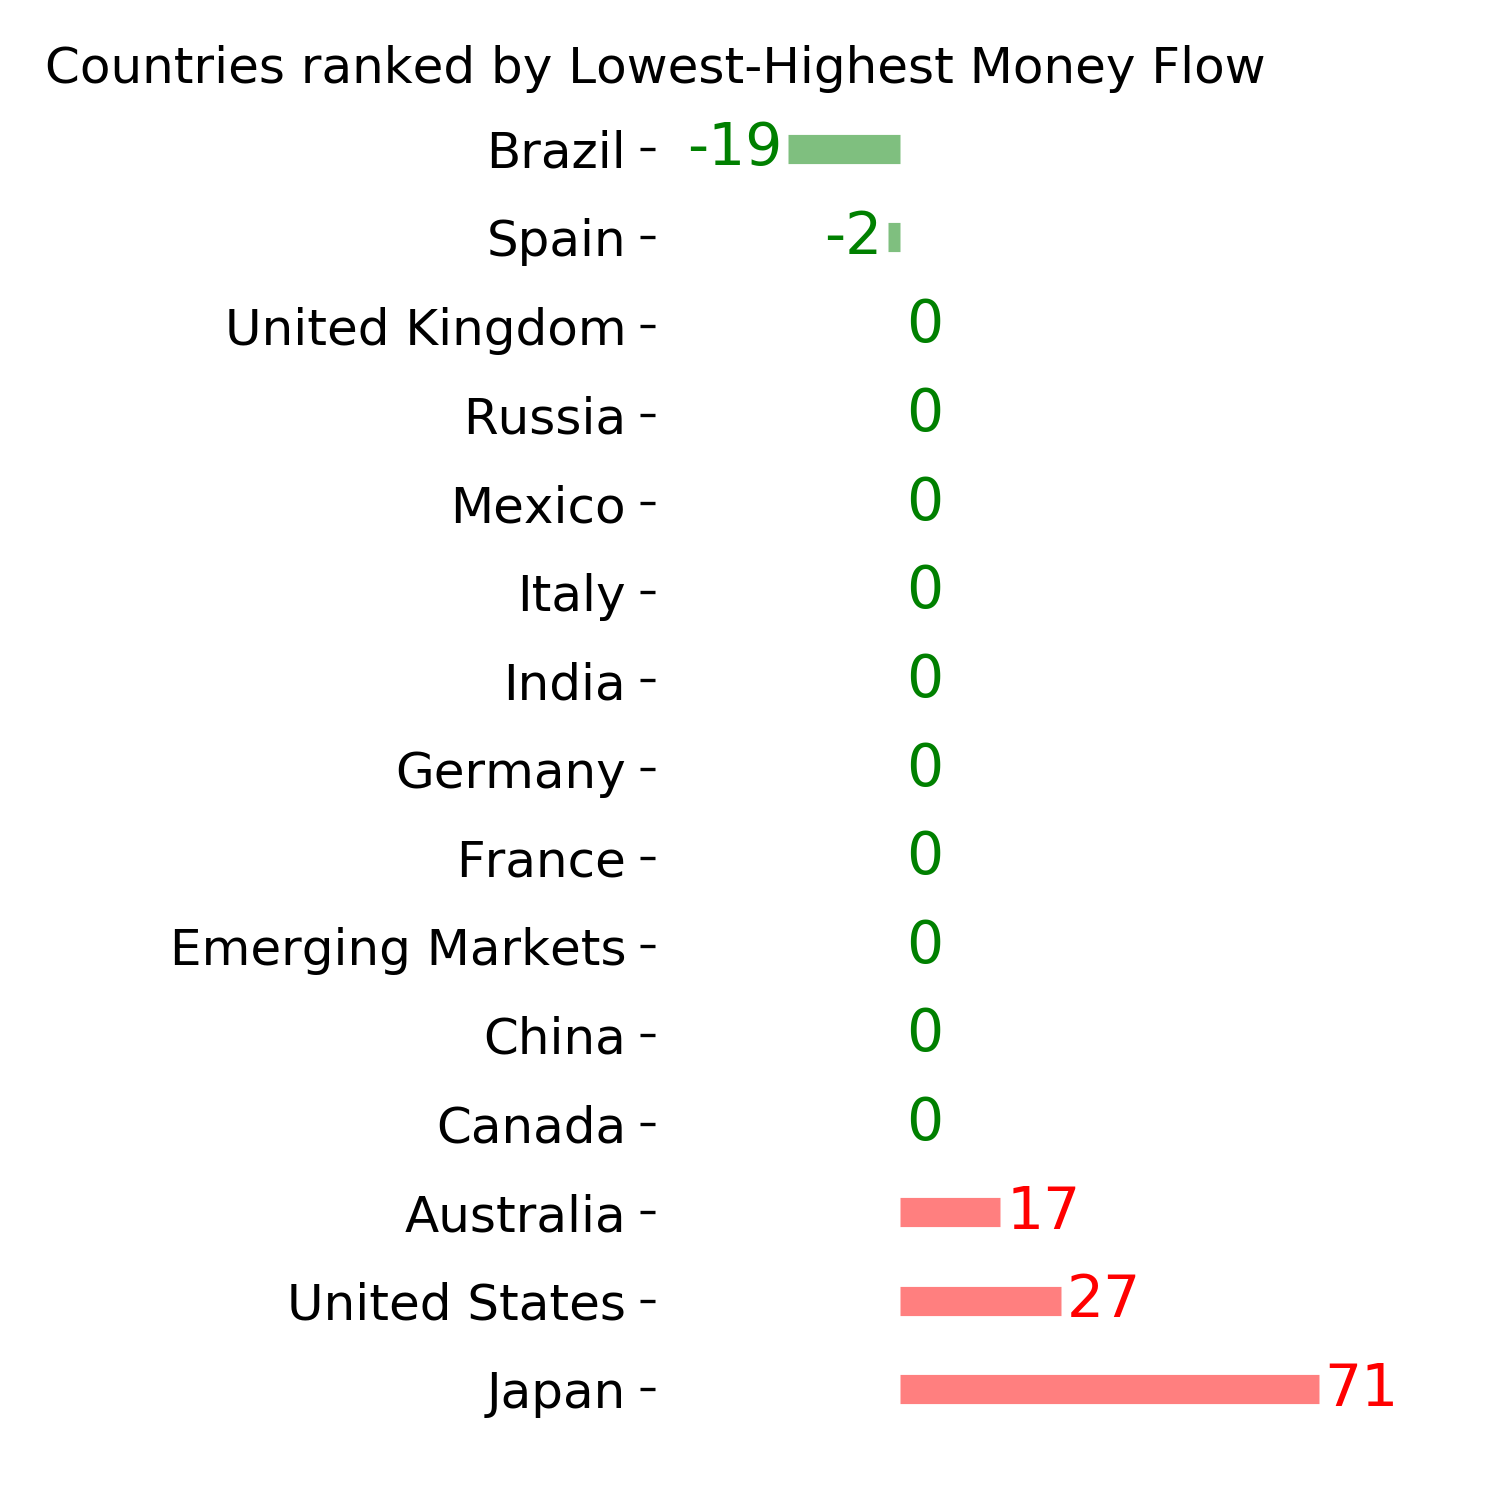
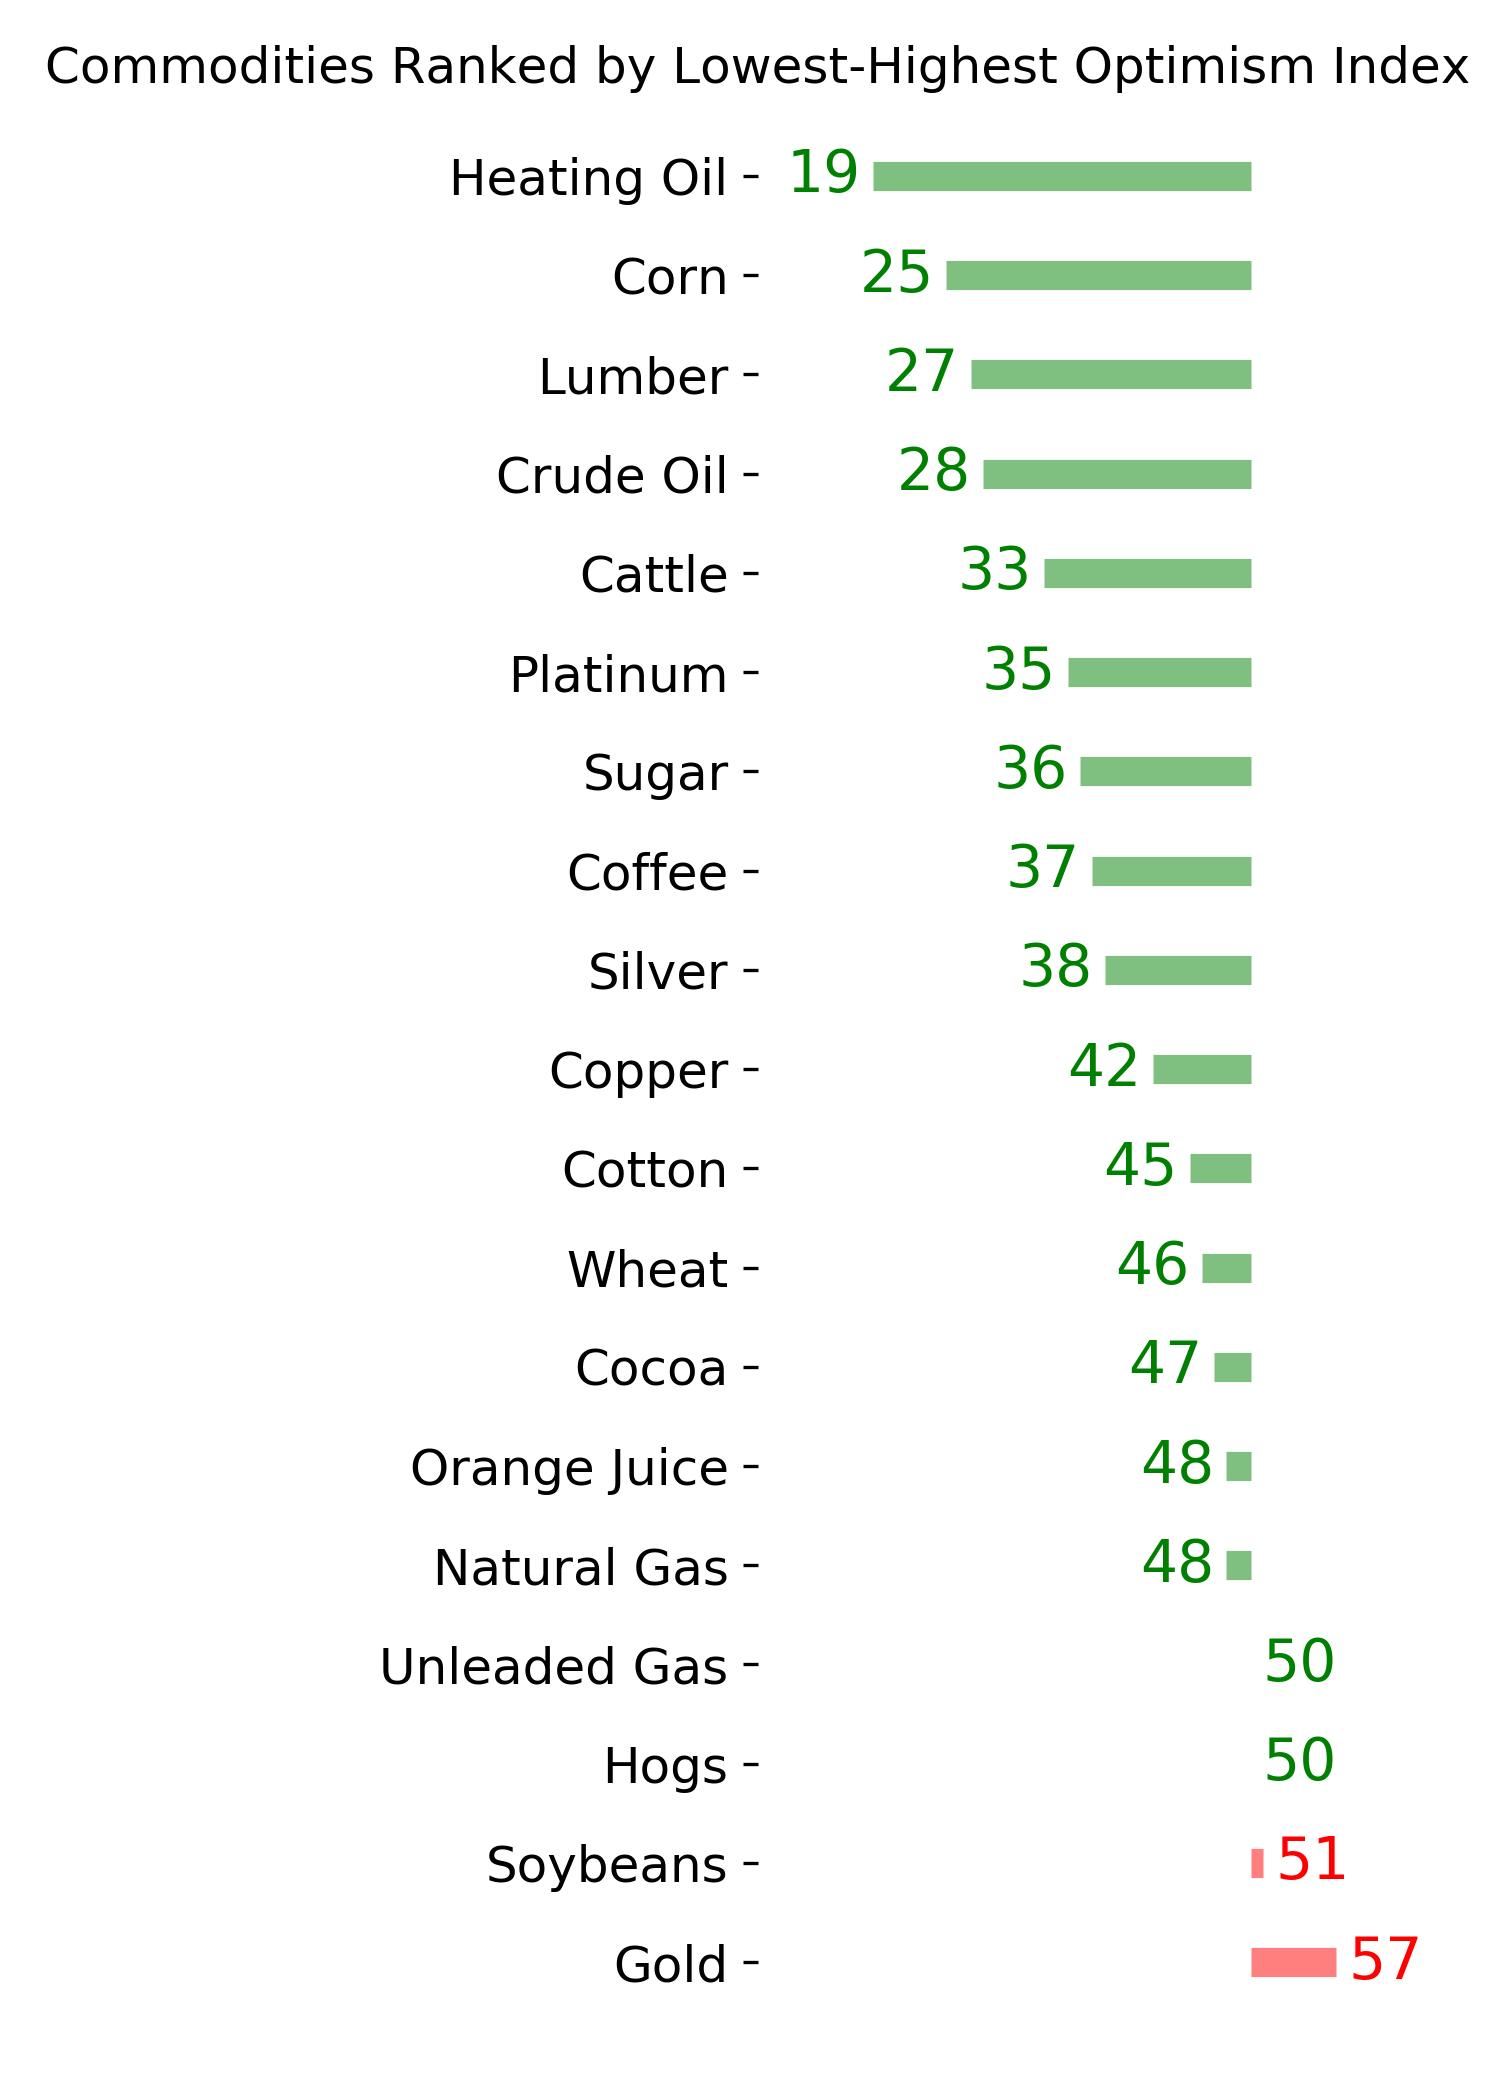
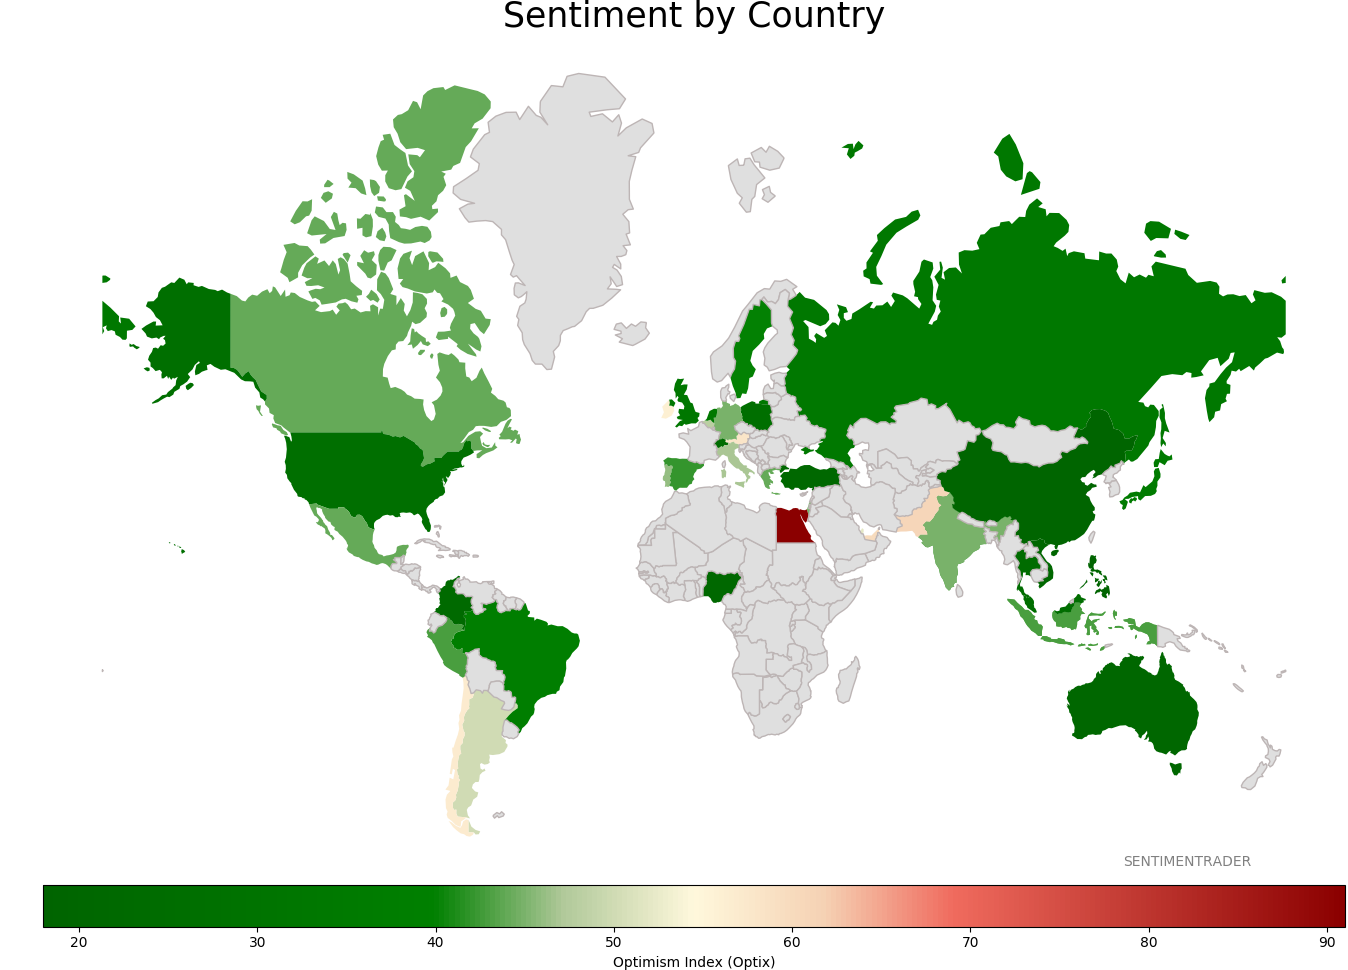
Sentiment Around The World
Optimism Index Thumbnails
|
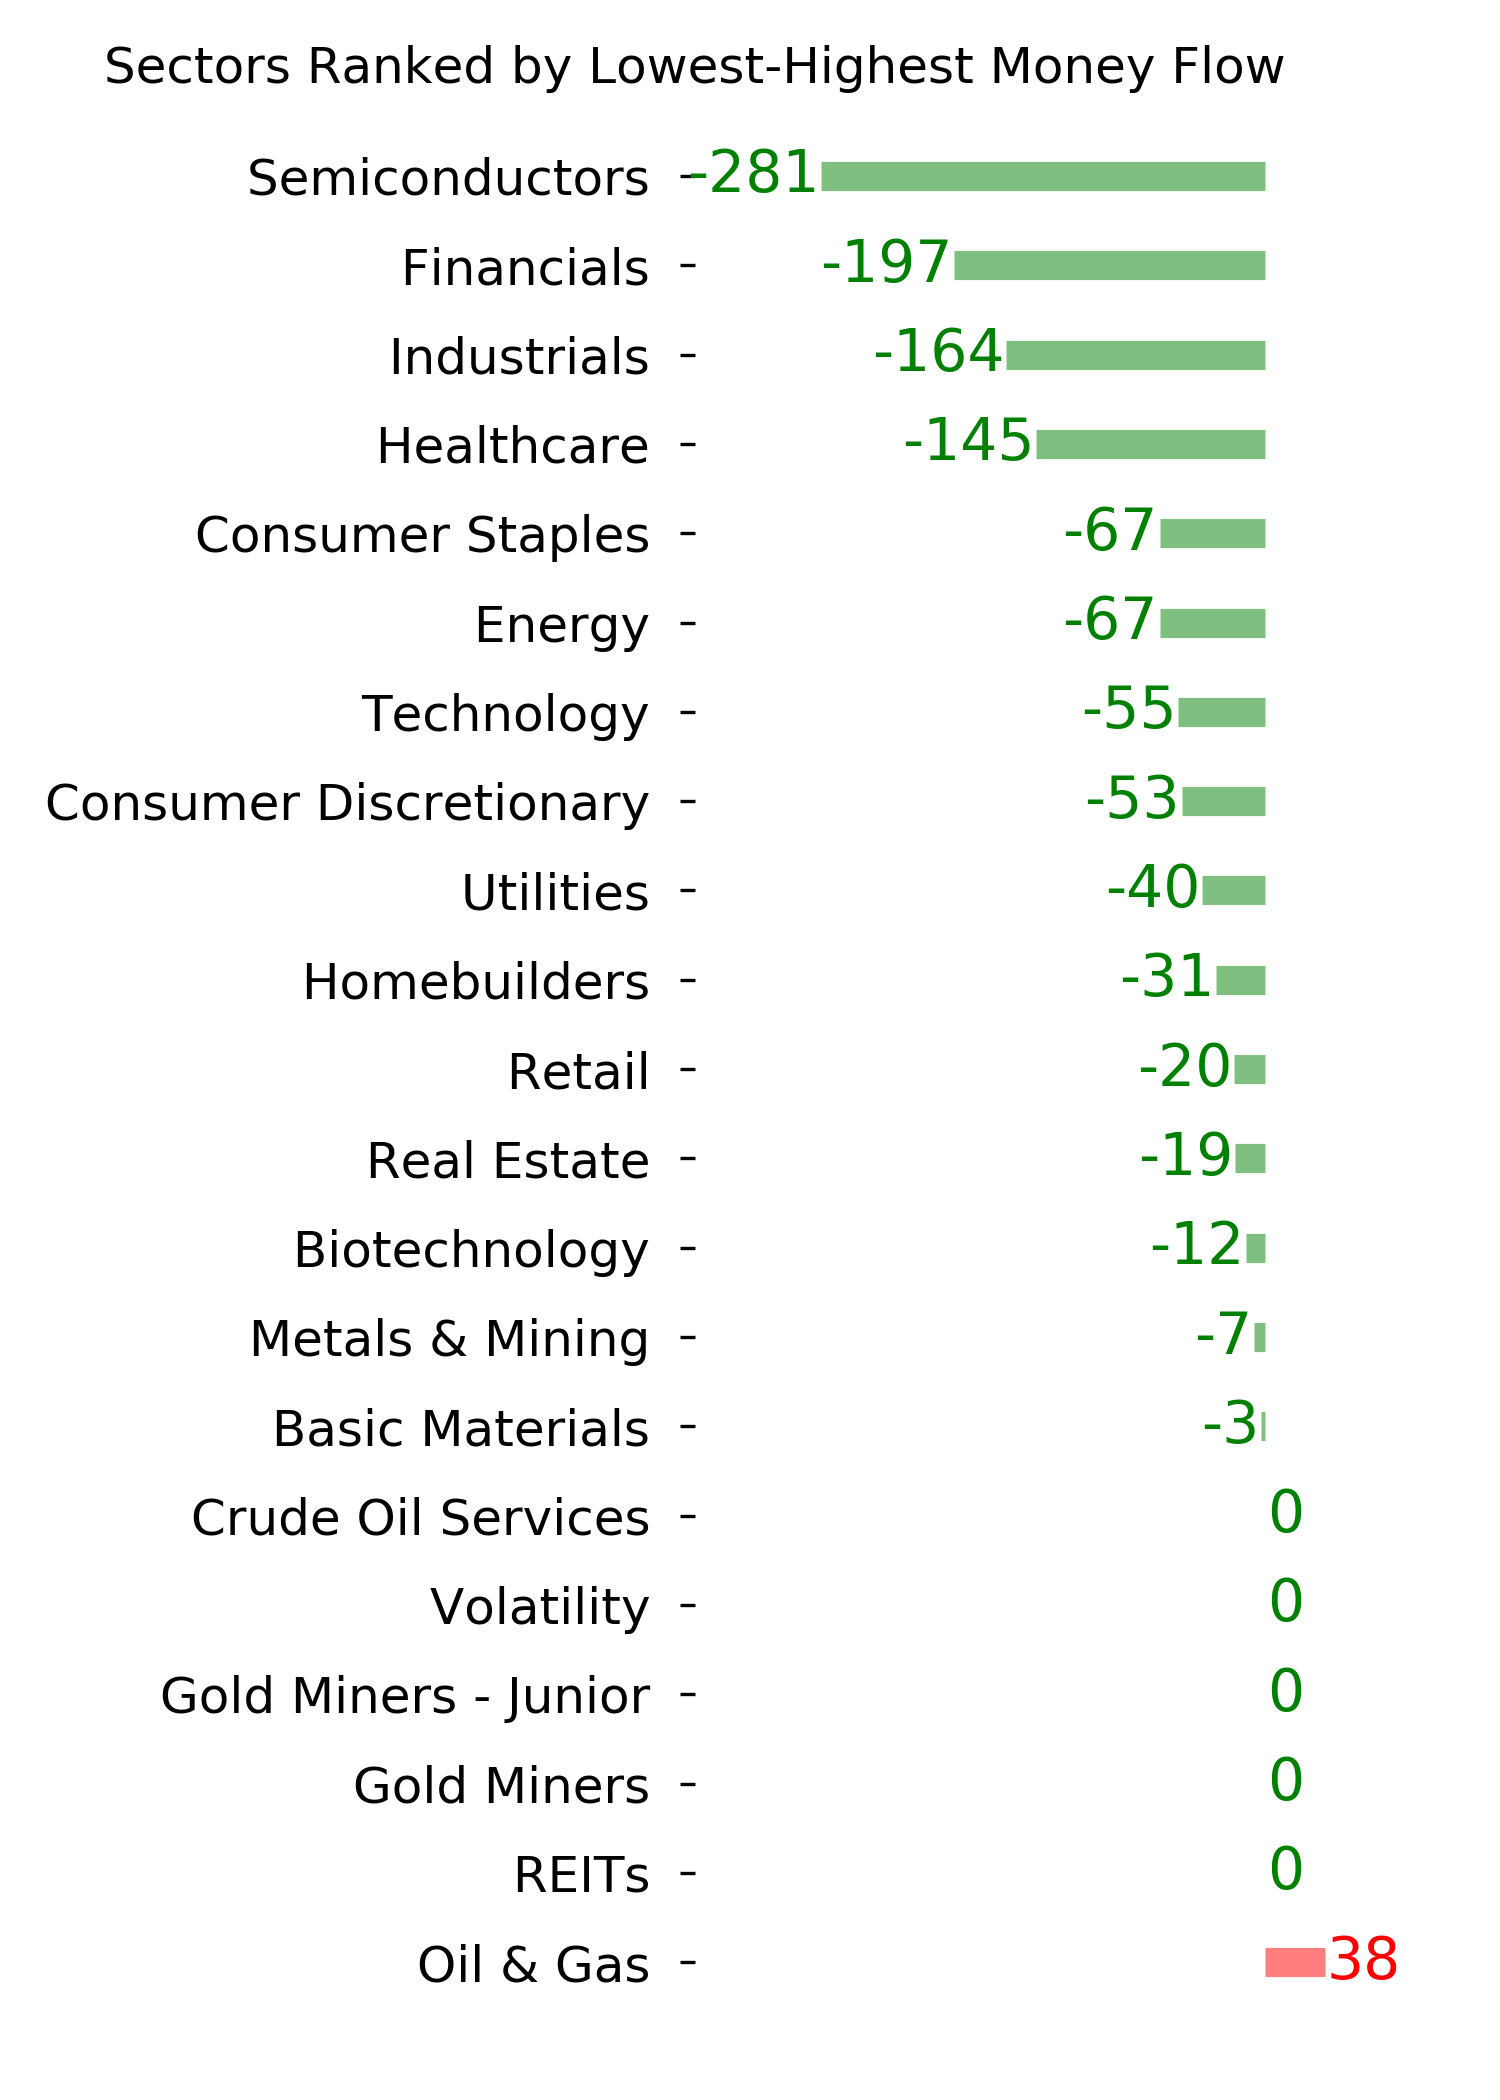
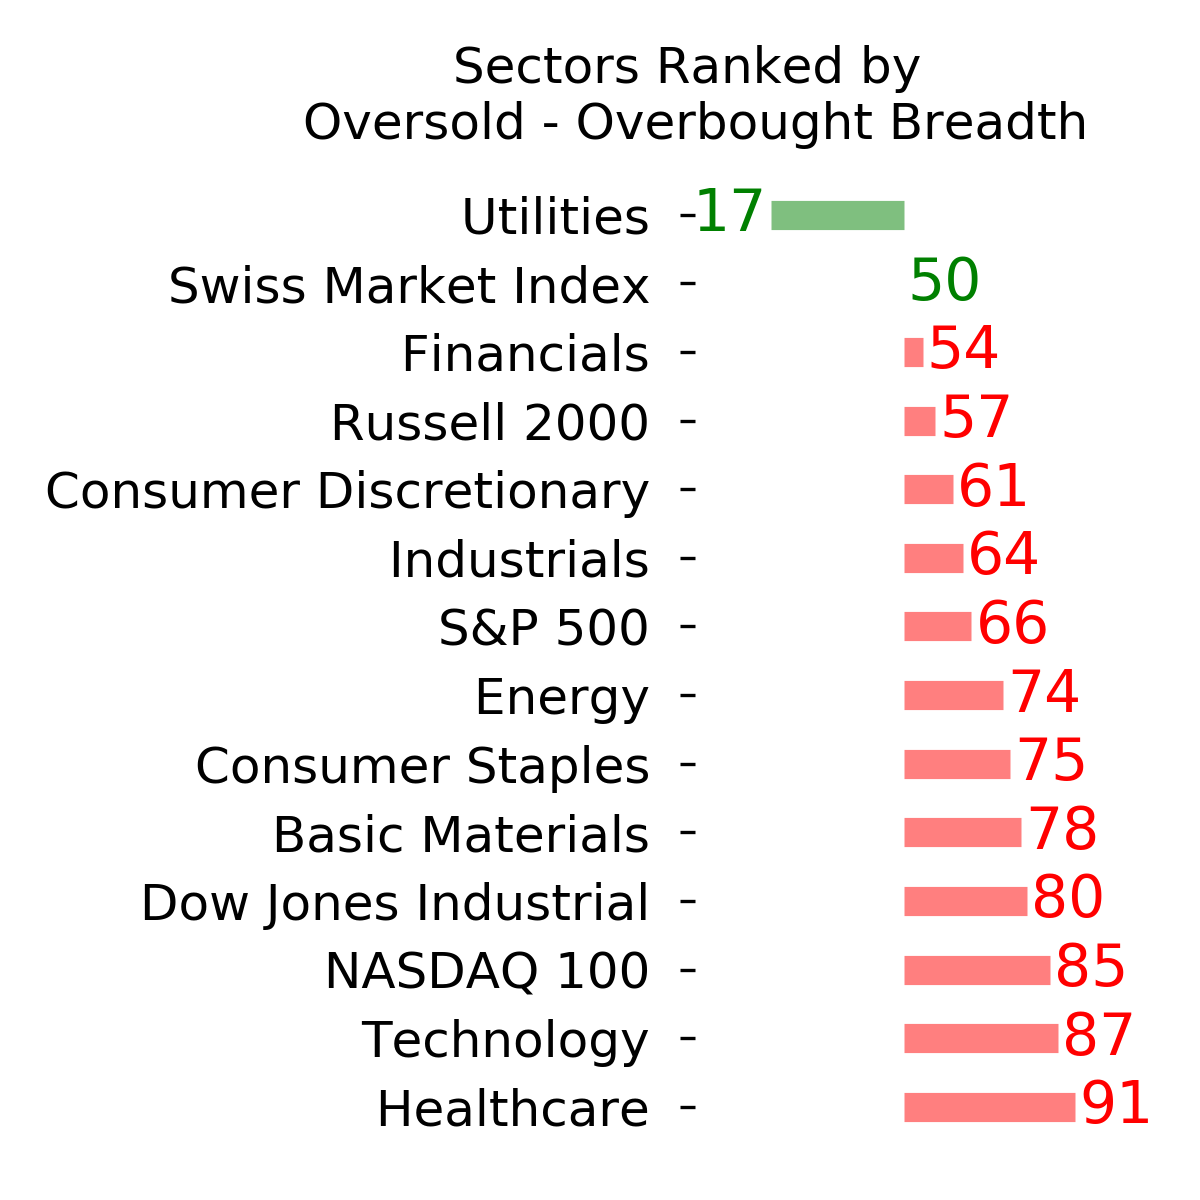
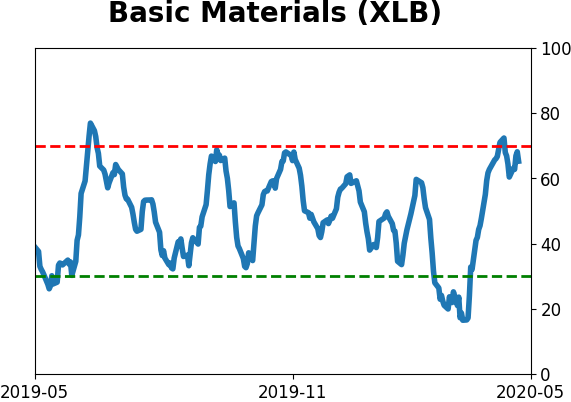
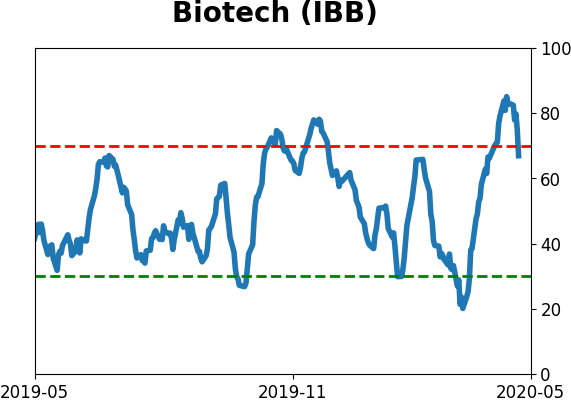
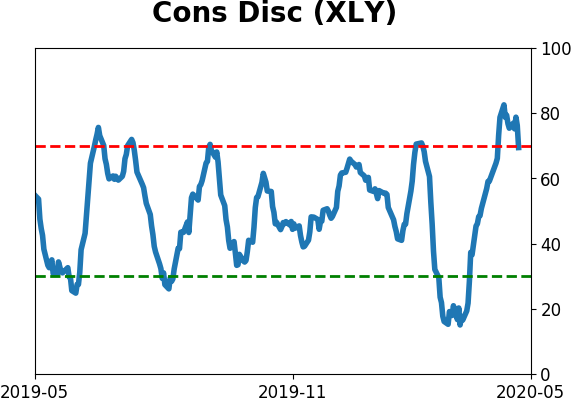
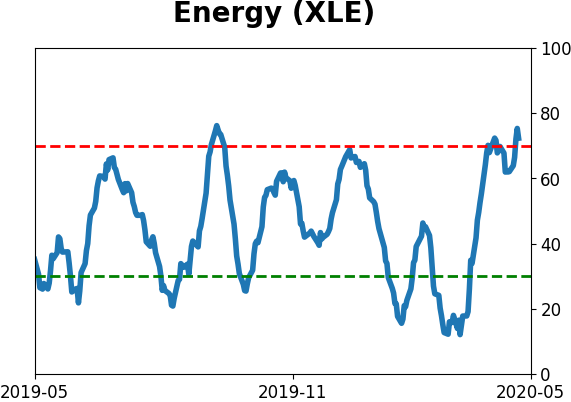
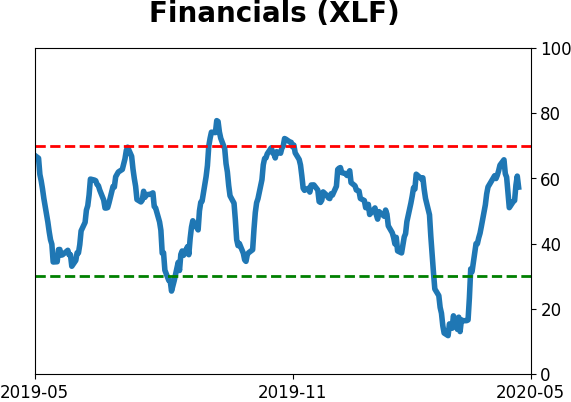
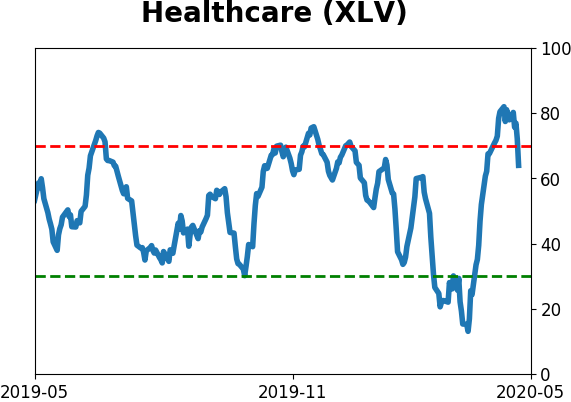
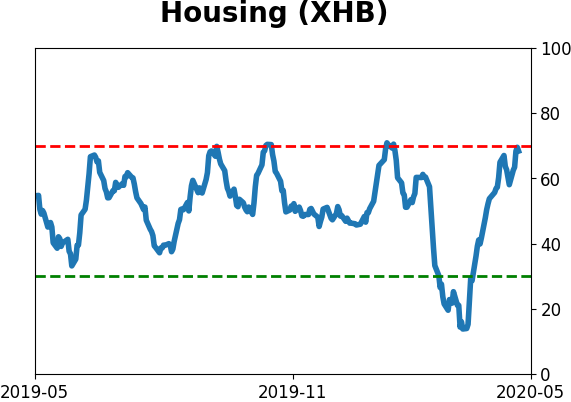
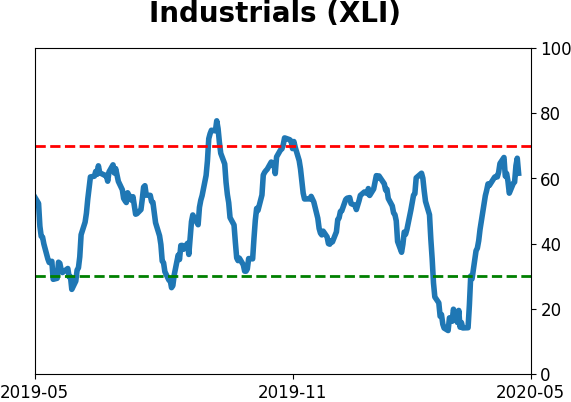
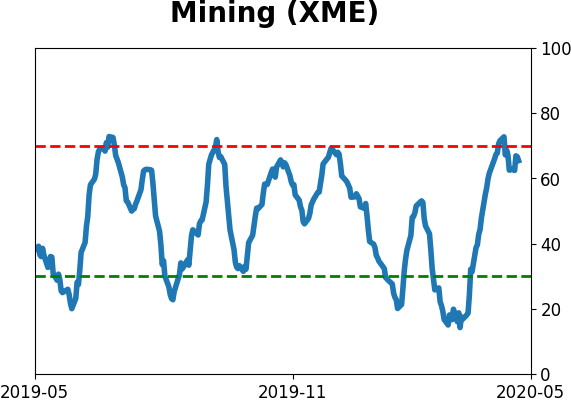
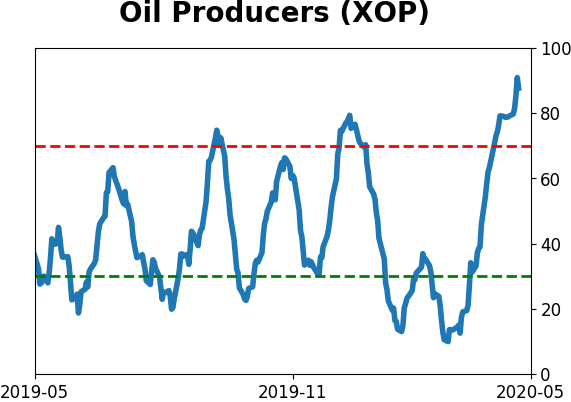
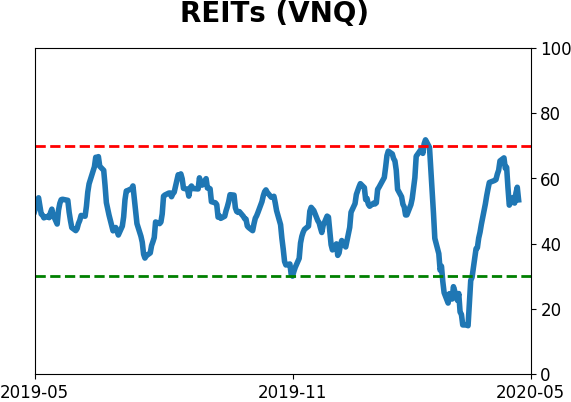
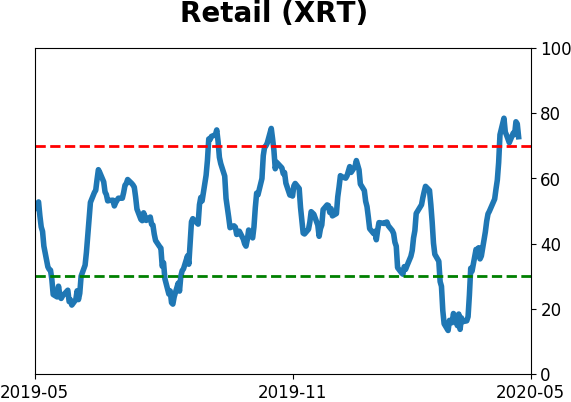
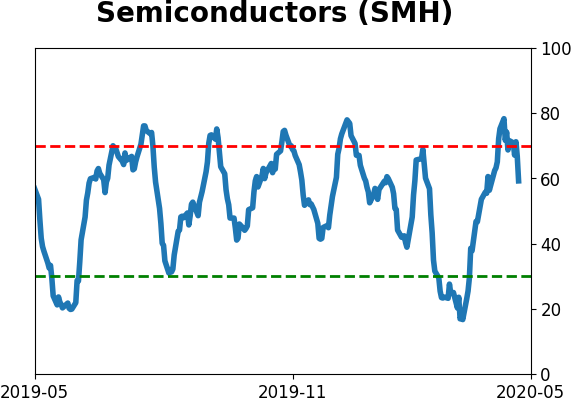
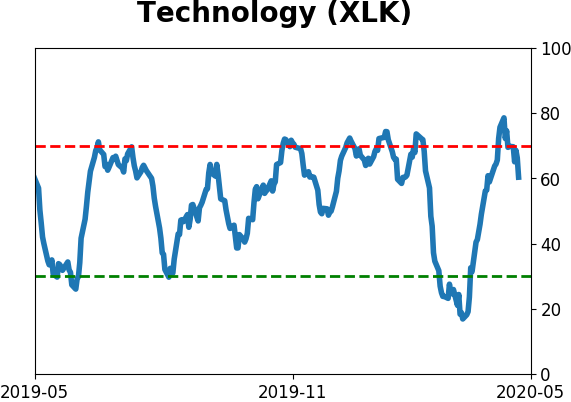
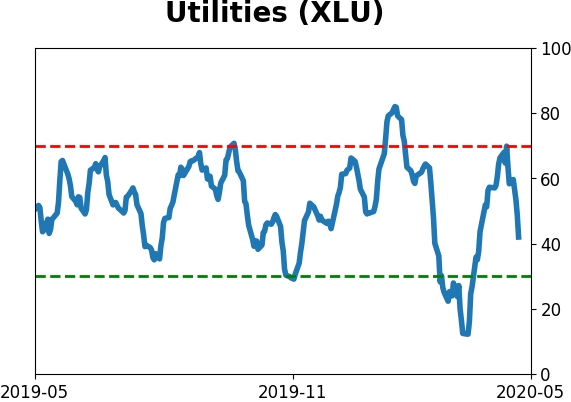
Sector ETF's - 10-Day Moving Average
|
|
|
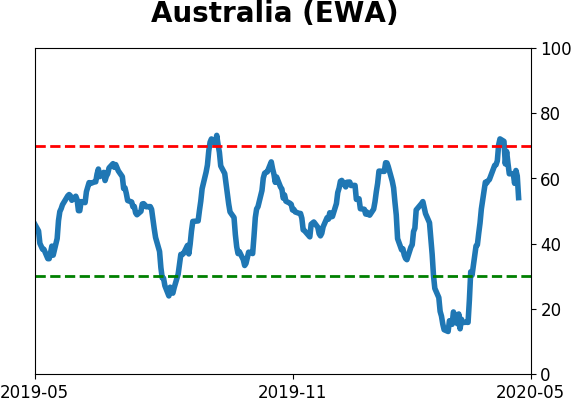
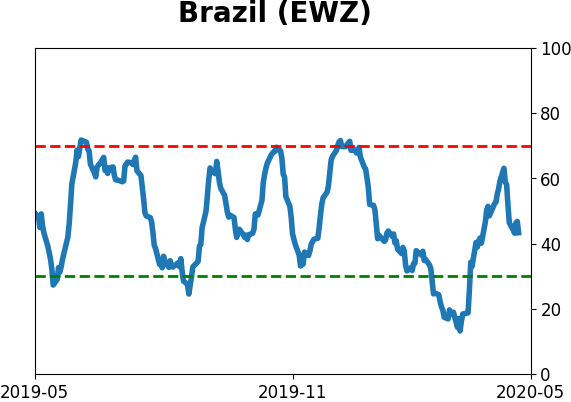
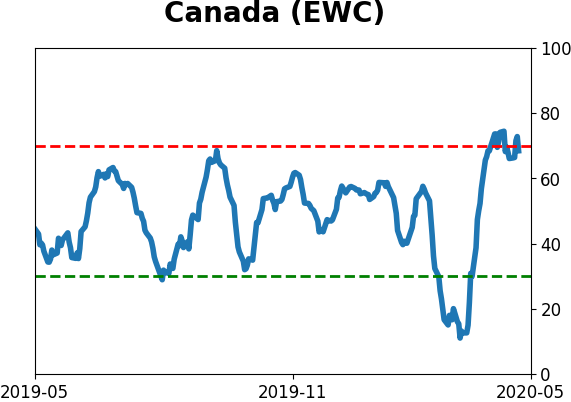
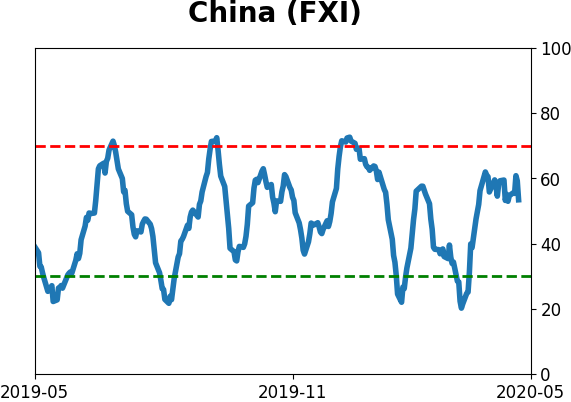
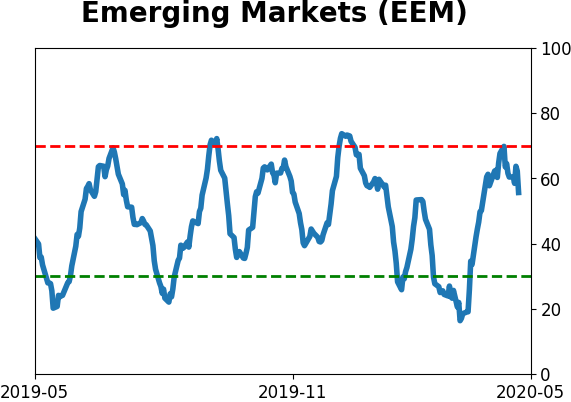
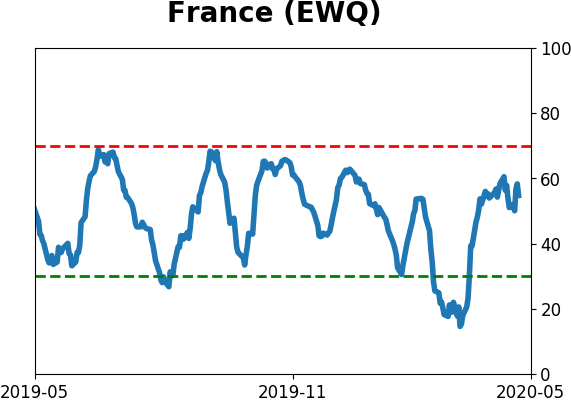
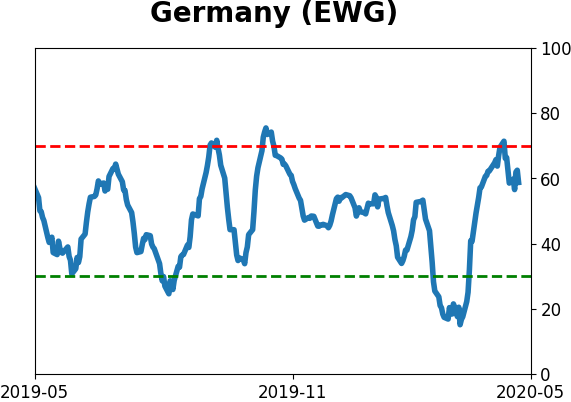
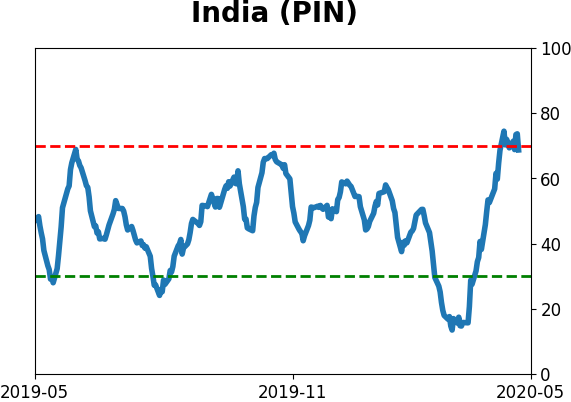
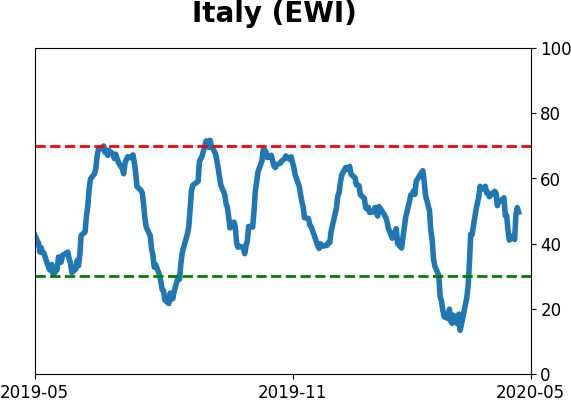
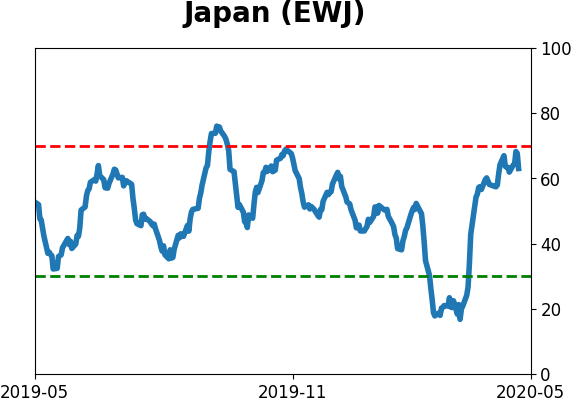
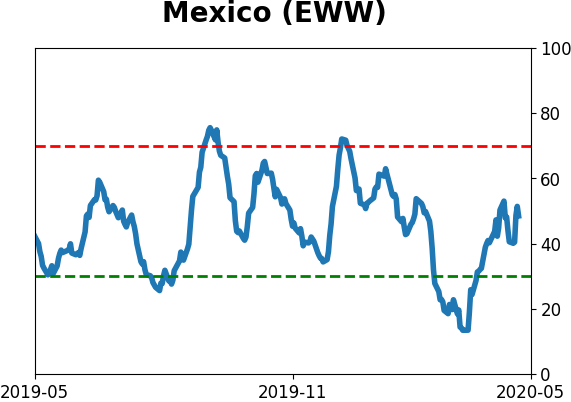
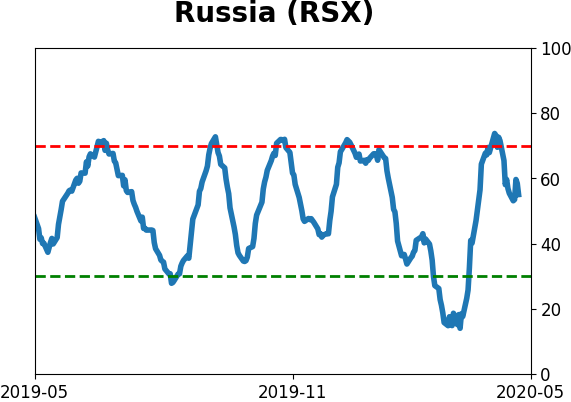
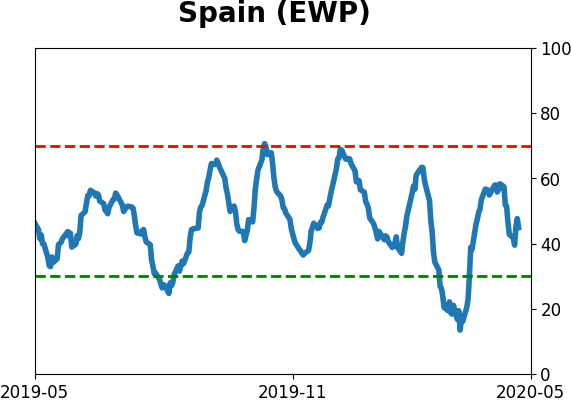
Country ETF's - 10-Day Moving Average
|
|
|
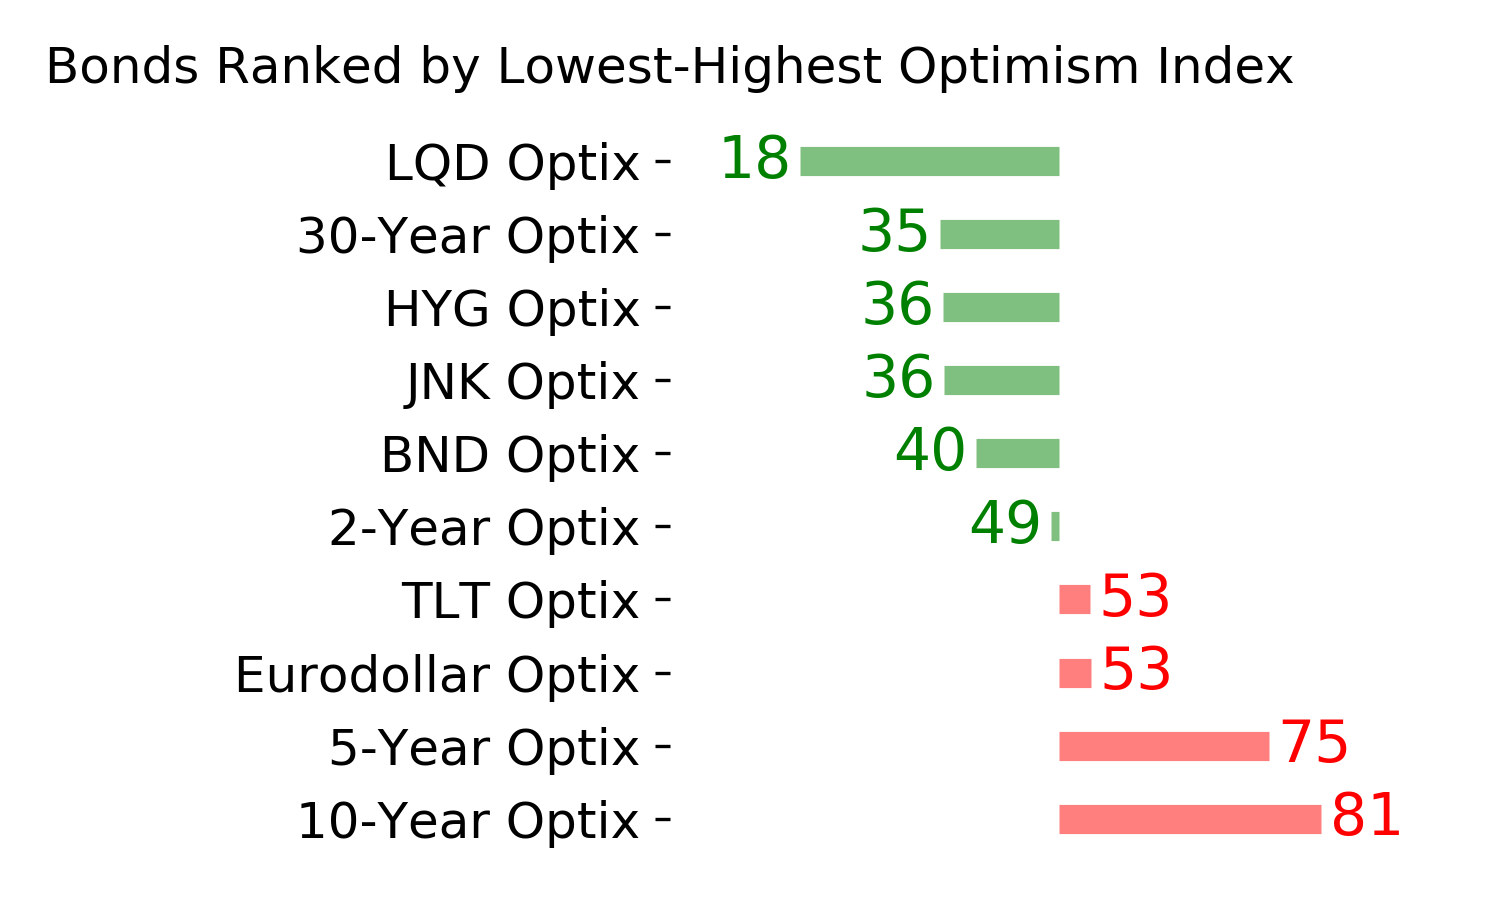
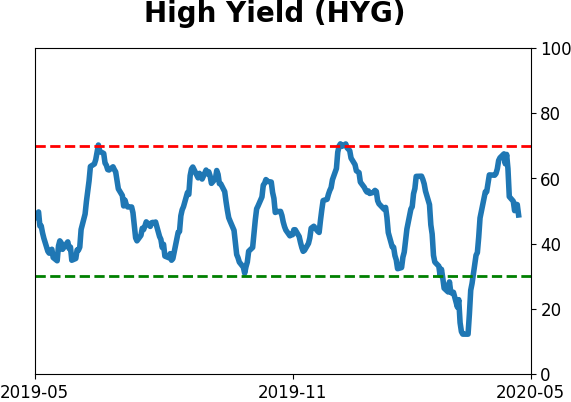
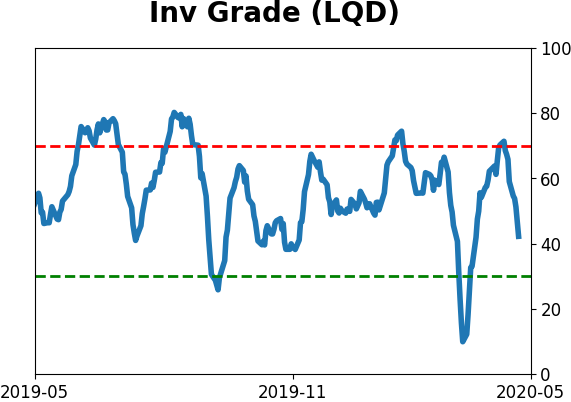
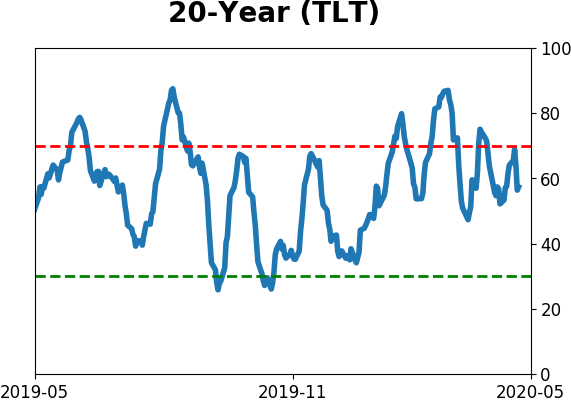
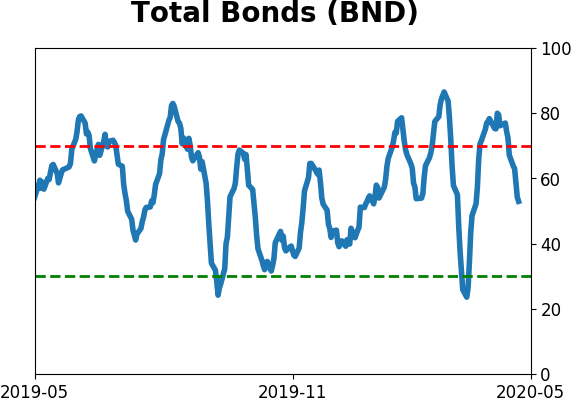
Bond ETF's - 10-Day Moving Average
|
|
|
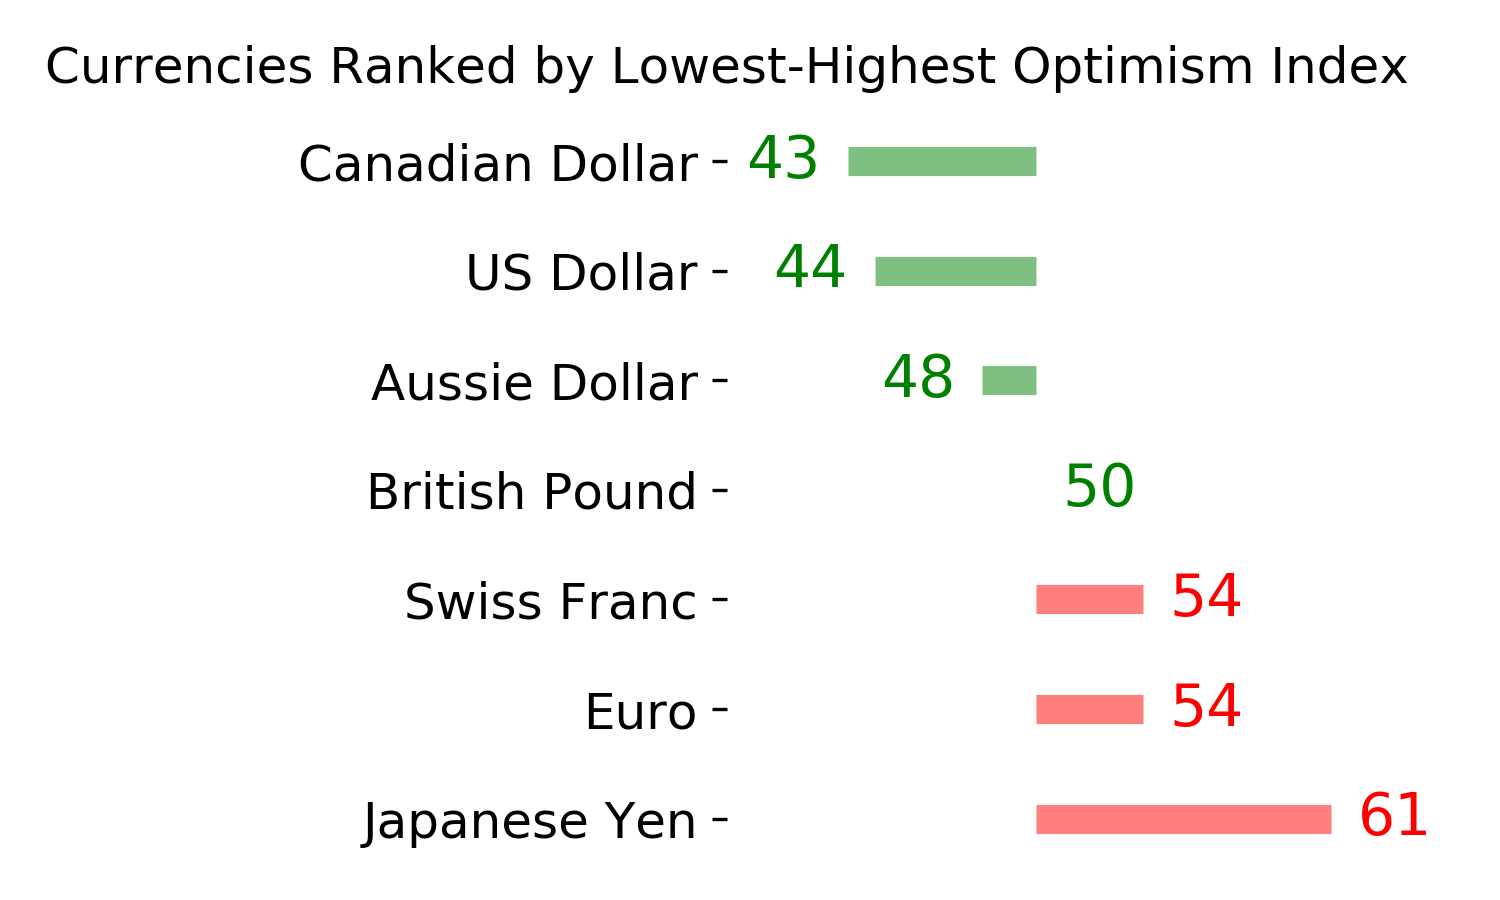
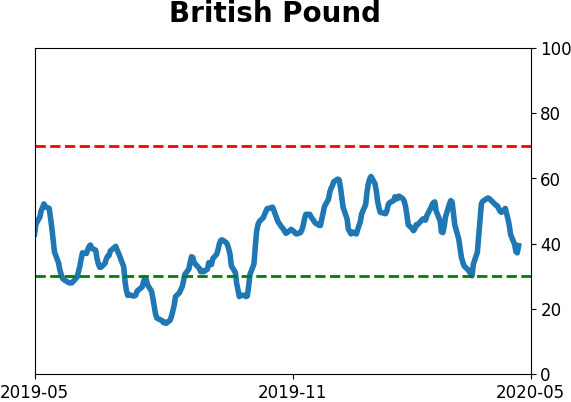
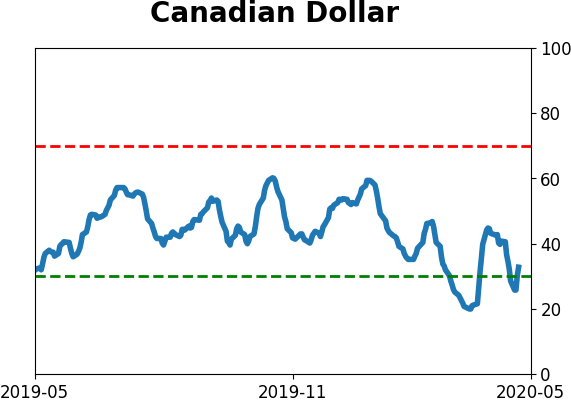
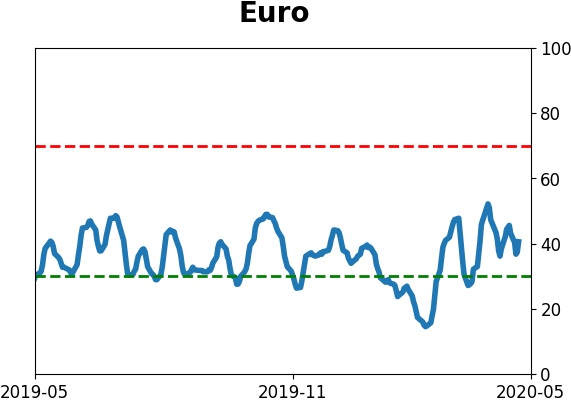
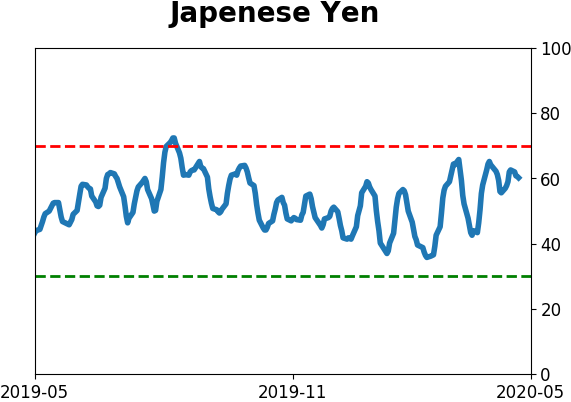
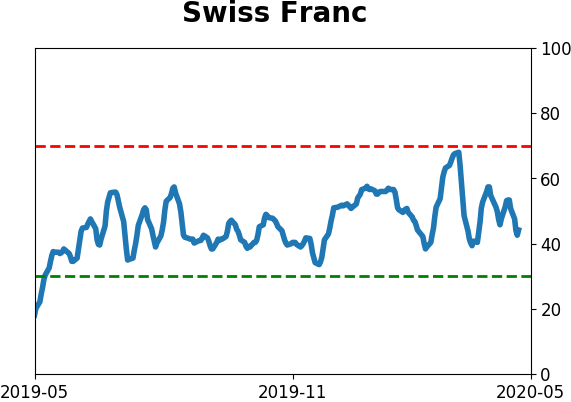
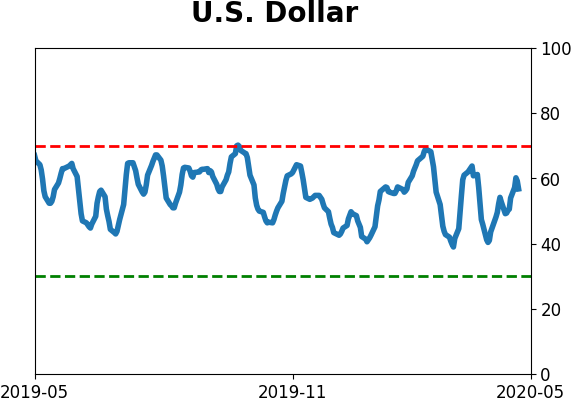
Currency ETF's - 5-Day Moving Average
|
|
|
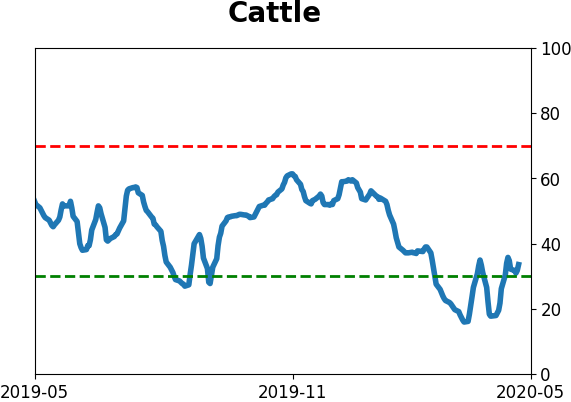
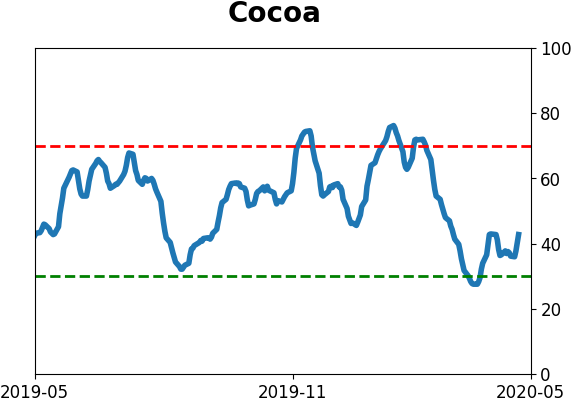
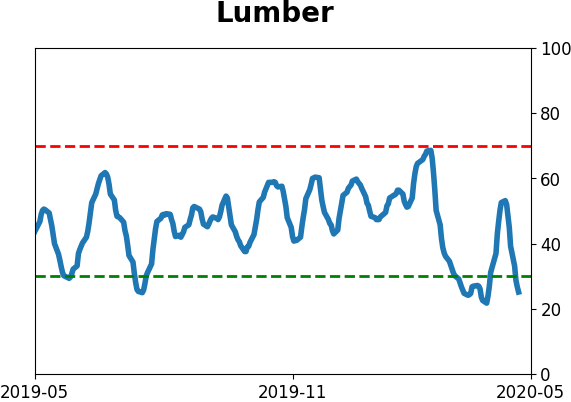
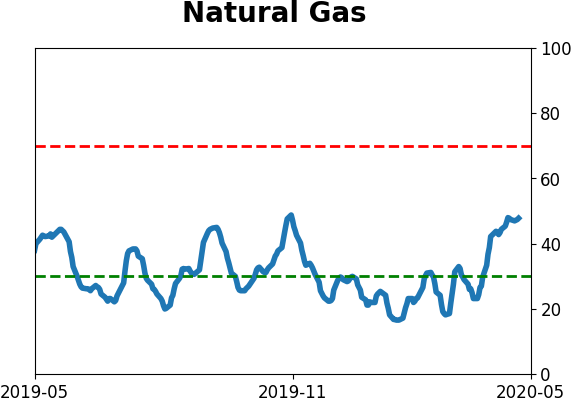
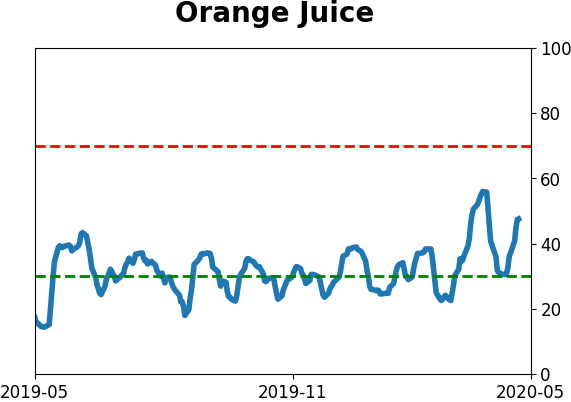
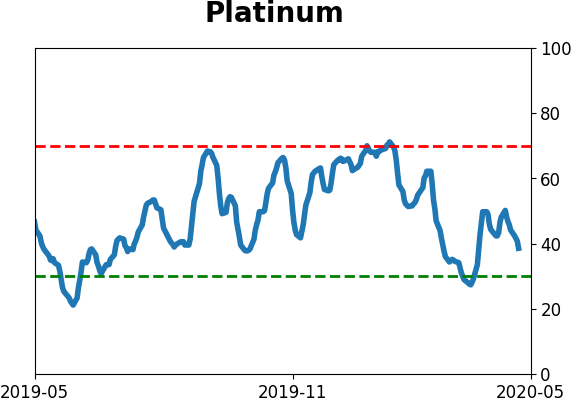
Commodity ETF's - 5-Day Moving Average
|
|