Headlines
|
|
A 'double' Zweig Breadth Thrust just as we hit the worst six months:
Over the past week, breadth has skewed heavily to the upside again, triggering another high reading in the 10-day Up Volume Ratio. This comes soon after a Zweig Breadth Thrust had triggered. When stocks enjoyed a double thrust, it usually signaled an important long-term continuation, but the next 6 months are questionable with a negative YTD return through April.
Looking backward, economic data plunge:
Economic data that are being released now show just how much devastation the pandemic wreaked on the economy. Both GDP and personal spending plunged by the most, or near-most, on record. But the economy is not the stock market, and by the time economic data showed big slowdowns, the market had already priced it in.
Investment managers betting on a rally: This week's survey from NAAIM shows that active investment managers are more than 70% net long stocks, a huge increase from a month ago. There have been 3 distinct times when managers were at least this exposed while the S&P 500 was below its 50-week moving average, according to the Backtest Engine. In January and May 2008, it led to almost immediate and substantial losses. In January 2019, it was the beginning of a v-shaped bottomed. Not a whole lot we can read into that other than perhaps that if stocks are able to shake off this optimism in the short-term, it bodes well longer-term.
A new record x 4: The latest data from ICI shows that investors moved nearly $700 billion into taxable money markets in March. This is a massive spike that is more than 4 times larger than the next-biggest inflow. The prior record of just over $100 billion was in January 2008, near the beginning of the bear market. One-month flows do not have a good track record at being contrary indicators.
|
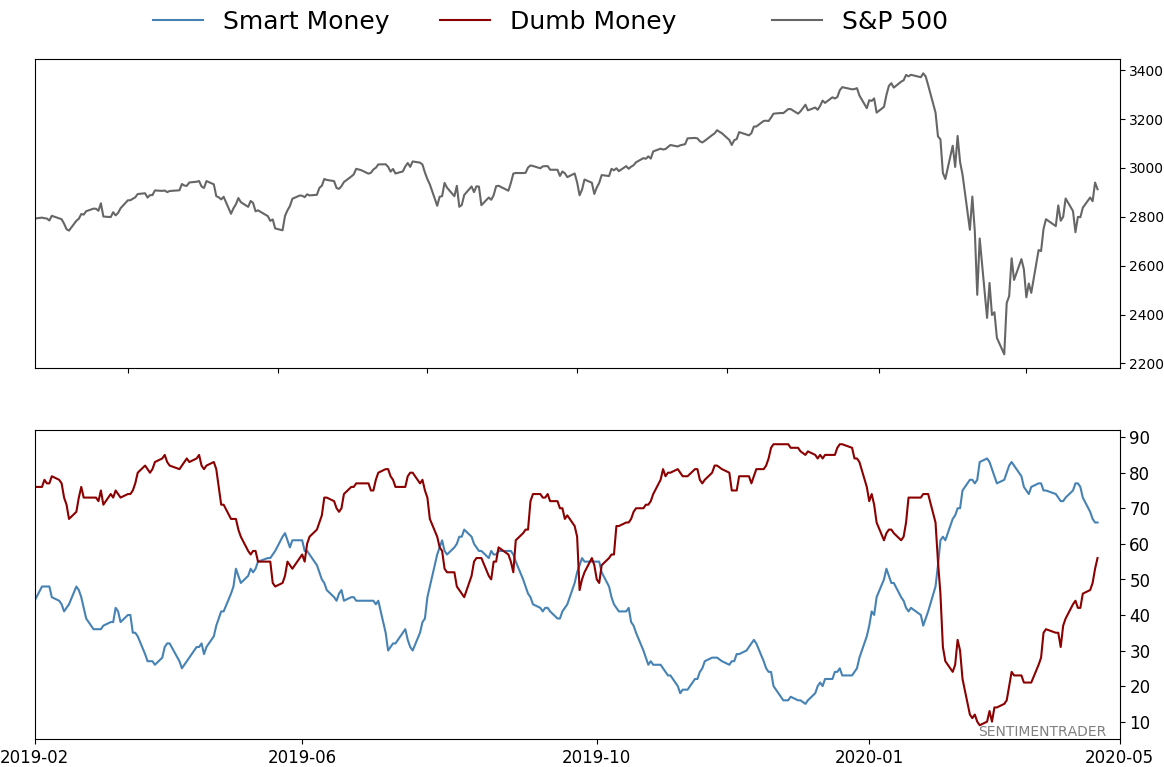
Smart / Dumb Money Confidence
|
Smart Money Confidence: 66%
Dumb Money Confidence: 56%
|
|
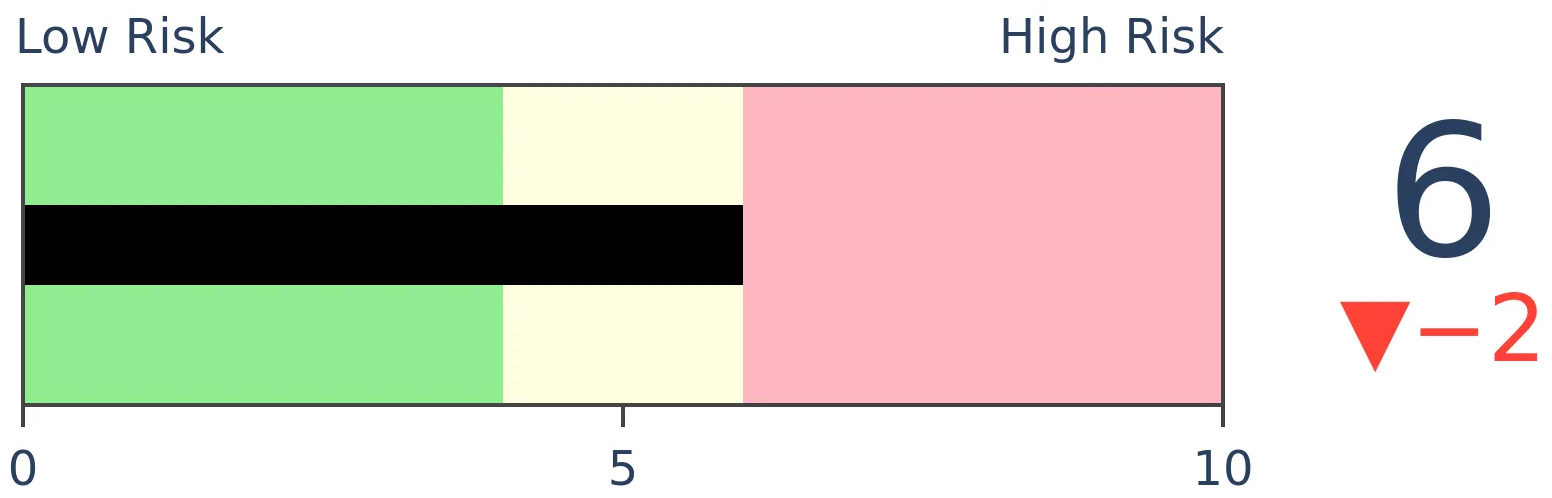
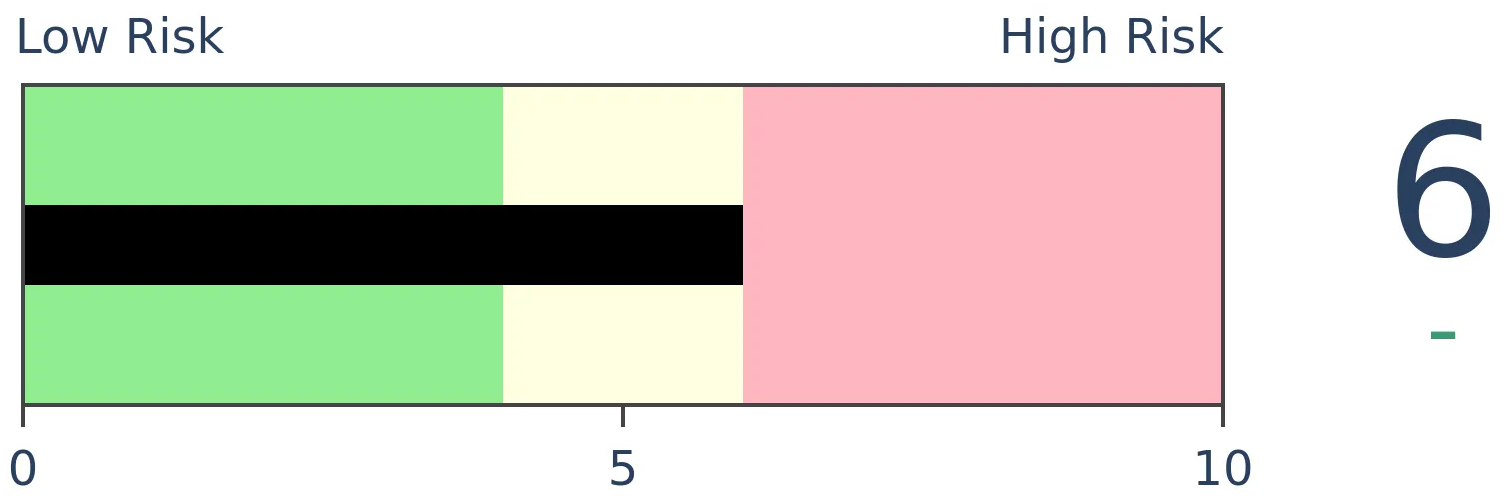
Risk Levels
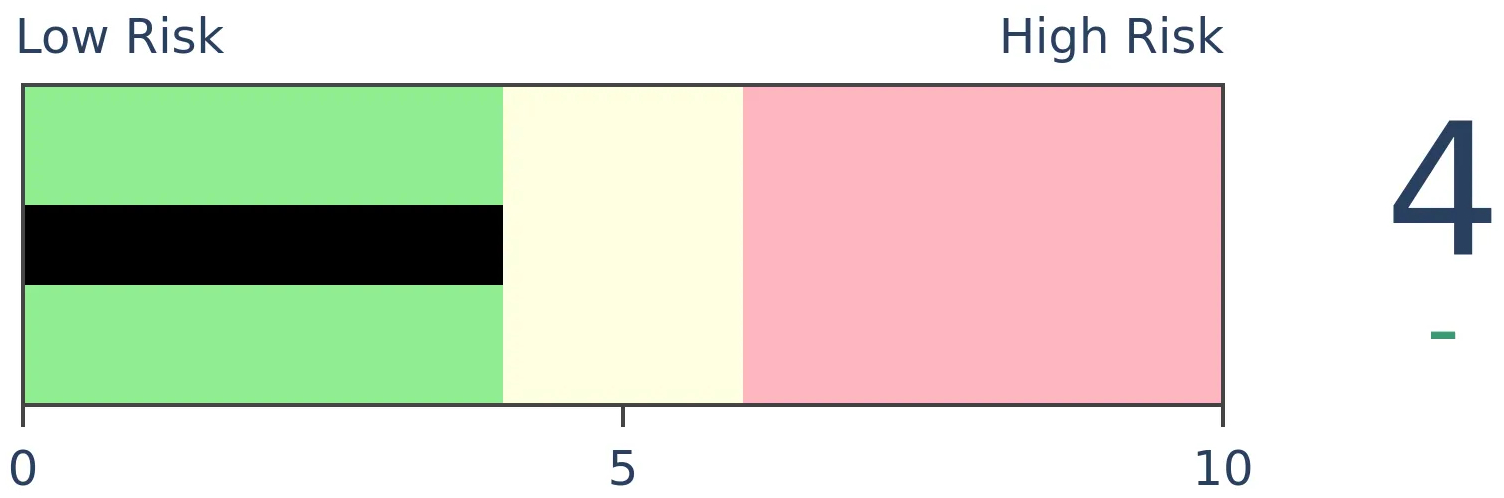
Stocks Short-Term
|
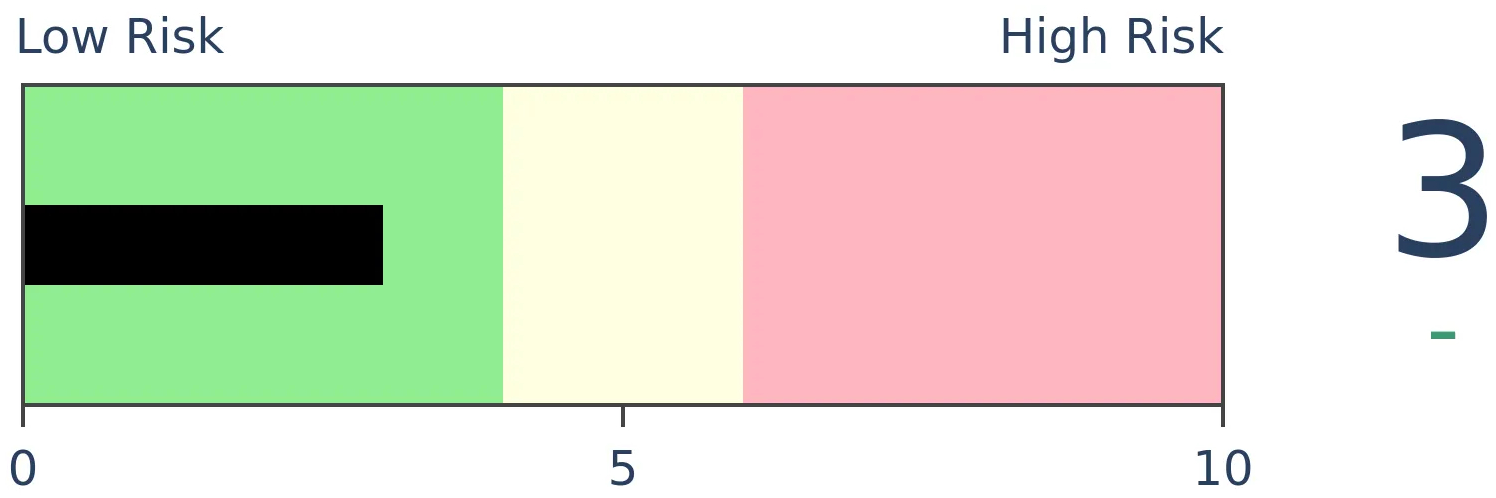
Stocks Medium-Term
|
|
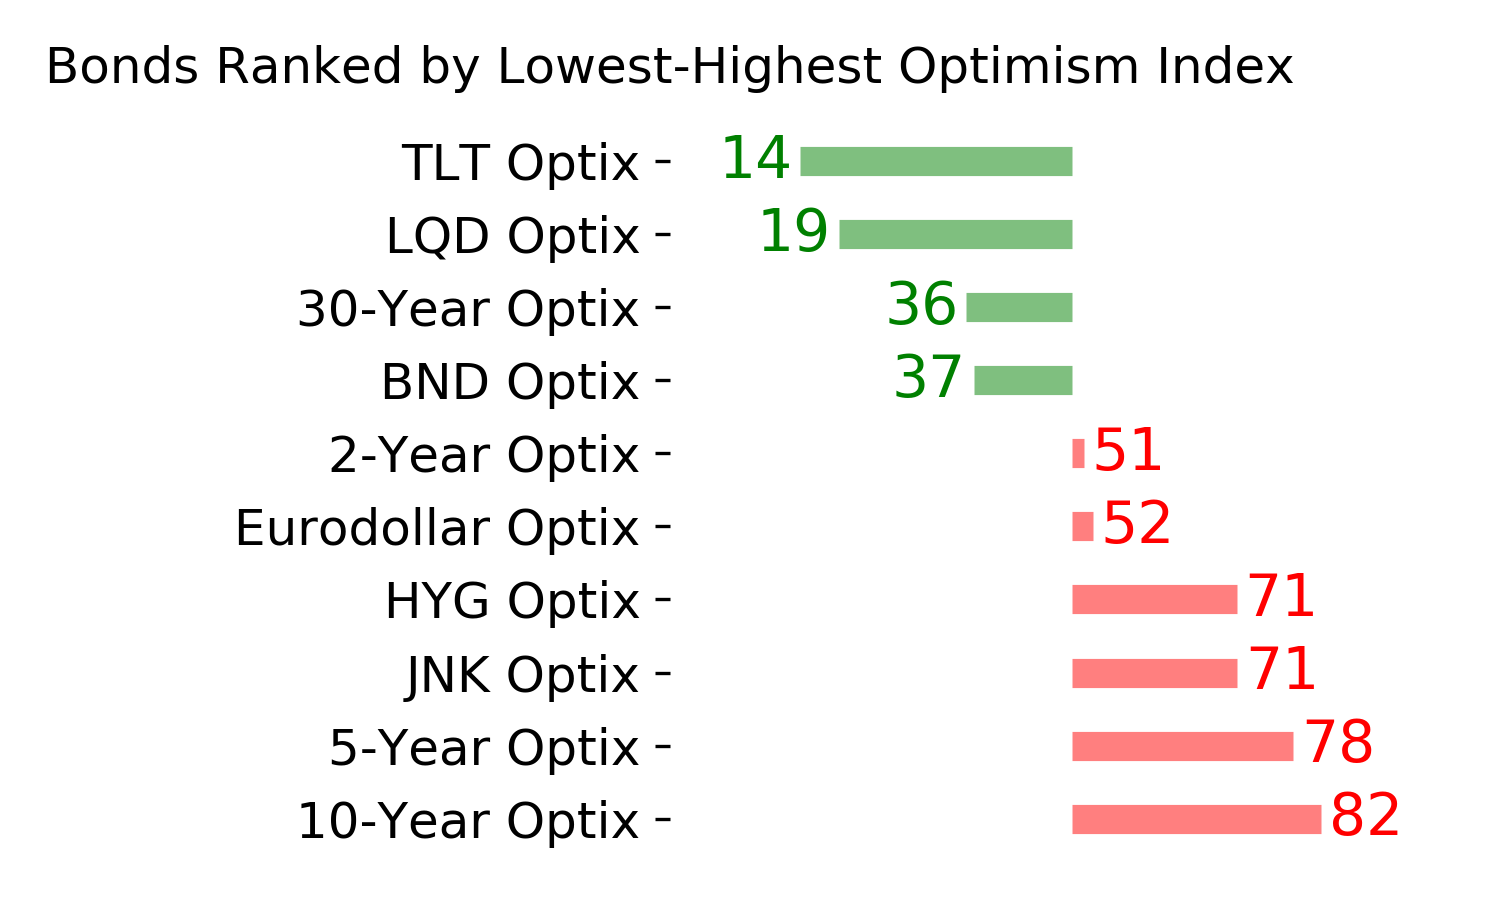
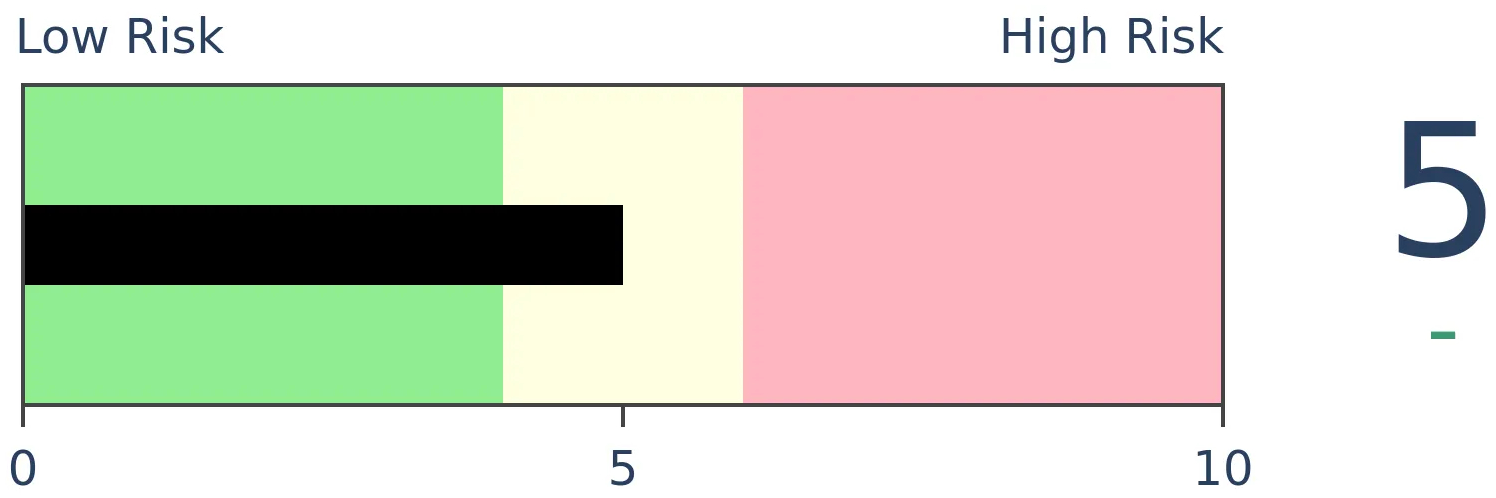
Bonds
|
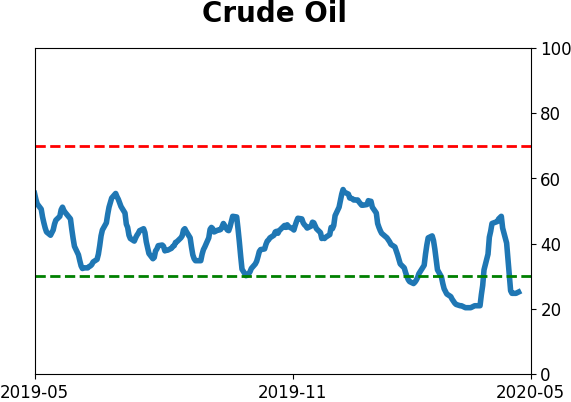
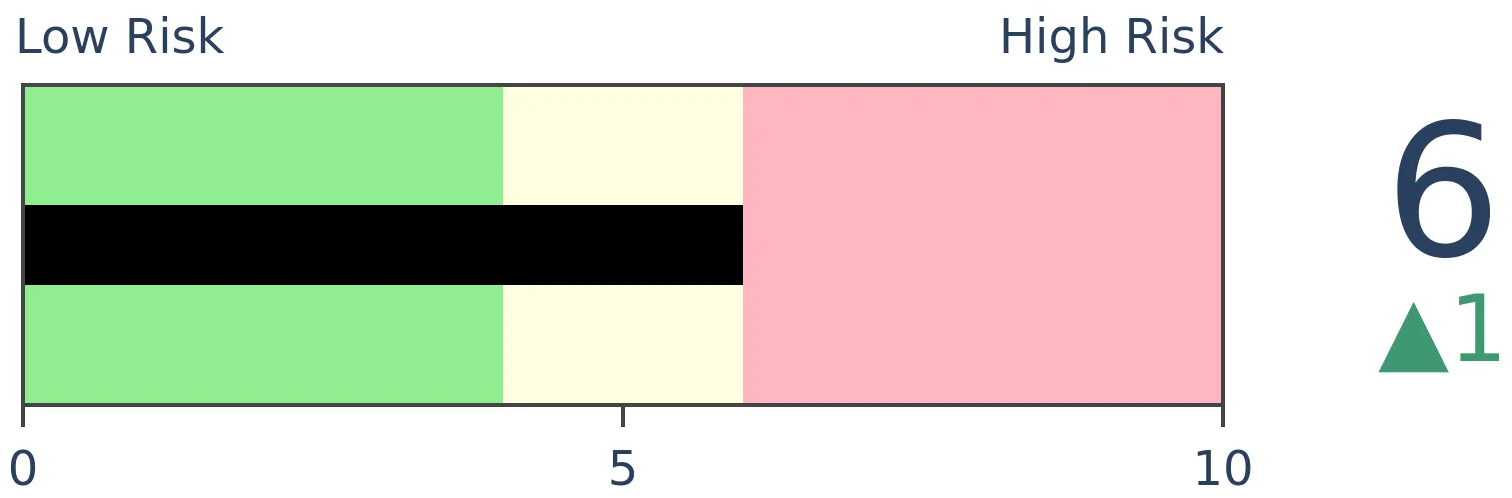
Crude Oil
|
|
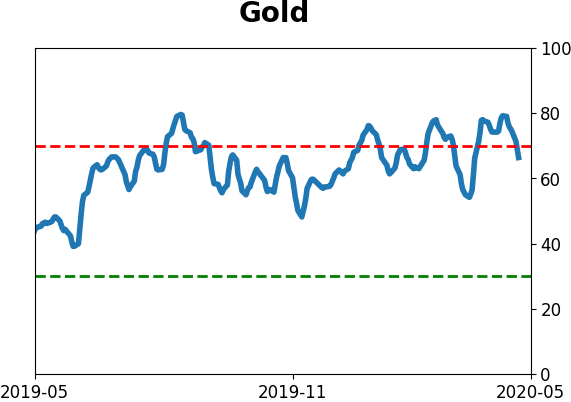
Gold
|
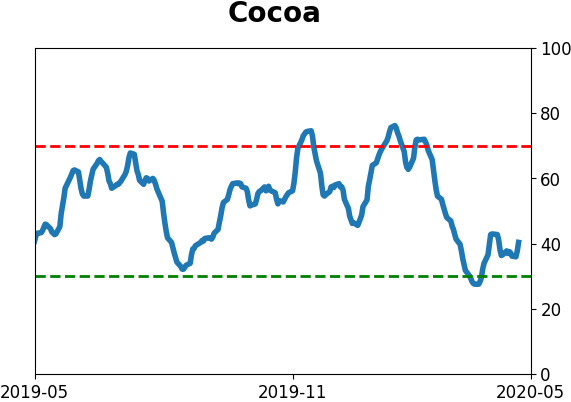
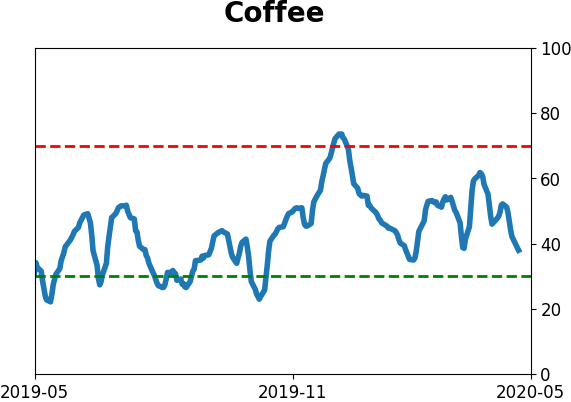
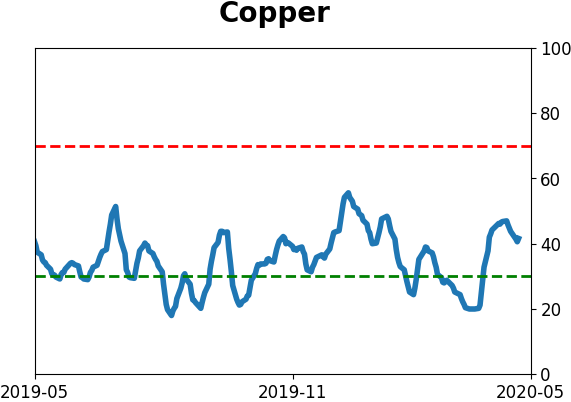
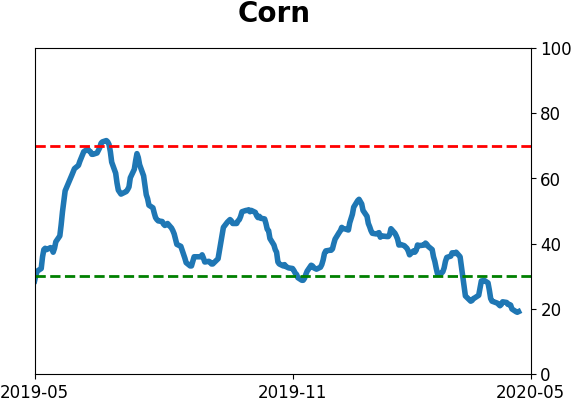
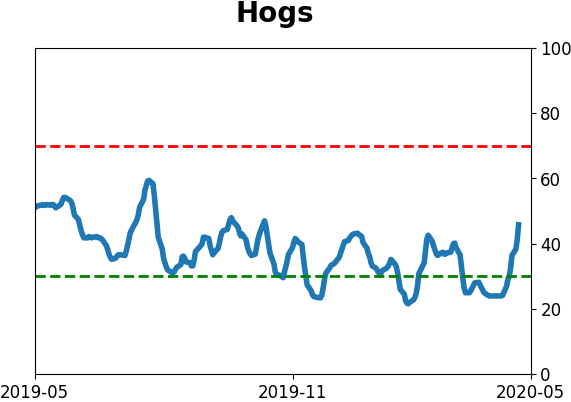
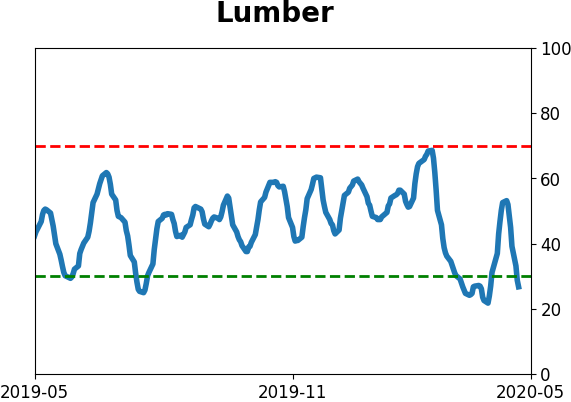
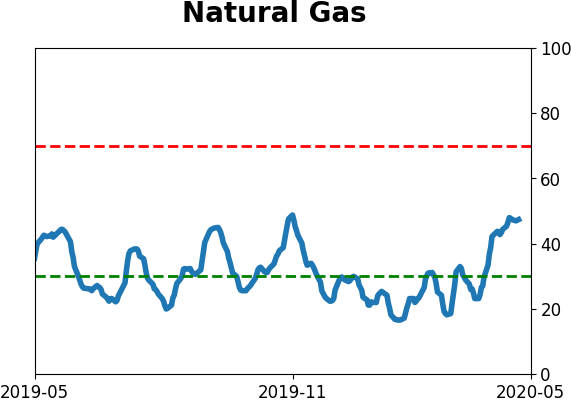
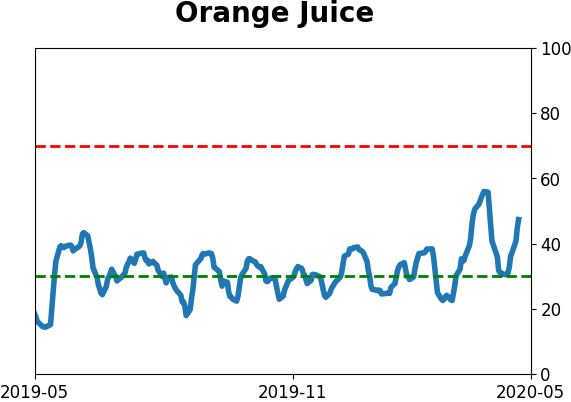
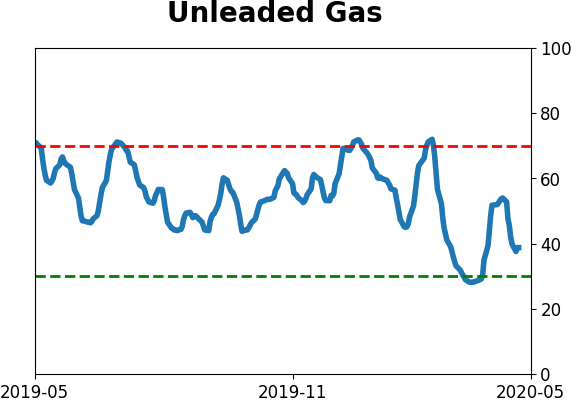
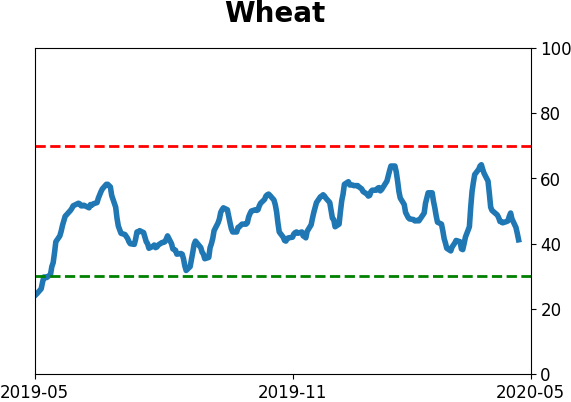
Agriculture
|
|
Research
BOTTOM LINE
Over the past week, breadth has skewed heavily to the upside again, triggering another high reading in the 10-day Up Volume Ratio. This comes soon after a Zweig Breadth Thrust had triggered. When stocks enjoyed a double thrust, it usually signaled an important long-term continuation, but the next 6 months are questionable with a negative YTD return through April.
FORECAST / TIMEFRAME
None
|
We spent a lot of time in March looking at the massive thrusts in buying pressure. Because of the historic volatility, the thrusts didn't necessarily meet the classic definitions of what a "breadth thrust" is supposed to be. As we saw at the time, it didn't matter that we didn't meet those optimized conditions. The simple fact that we were seeing massively skewed buying interest was a positive sign, especially longer-term.
Stocks have continued to rise, at least through Wednesday. And buying pressure has continued to be impressive. For the 2nd time in less than a month, the 10-day exponential moving average of the NYSE Up Volume Ratio, typically used to define a Zweig Breadth Thrust (ZBT), has moved above the upper threshold.
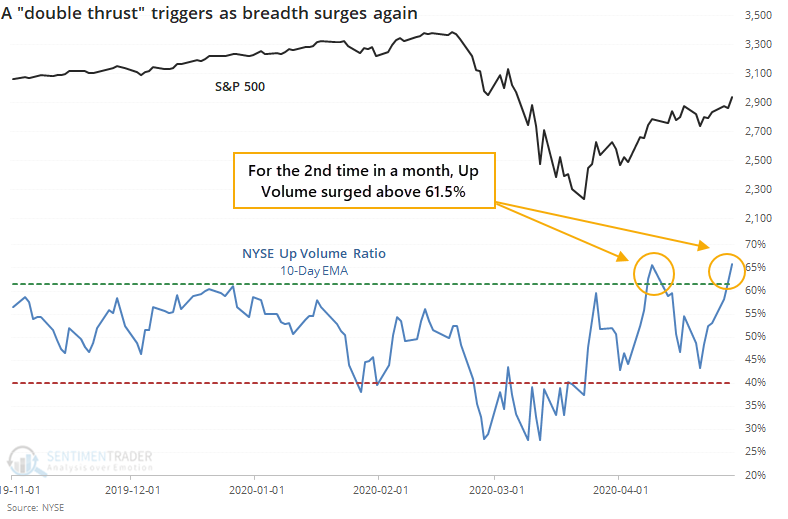
When we've seen a second surge in up volume after a ZBT was triggered has mostly served as confirmation that there was an important longer-term shift occurring, especially when it came after a protracted downtrend.
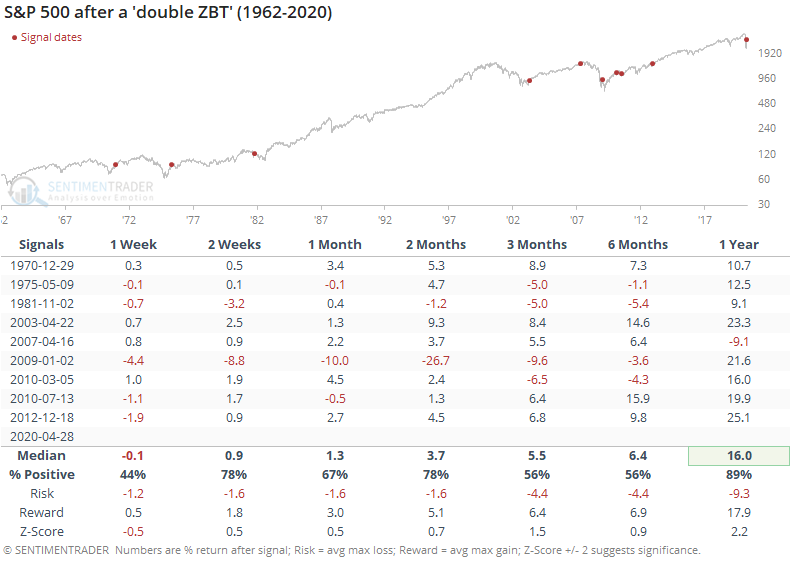
This triggered too early in the recovery in 1981 and 2009, even though long-term returns were still good. It led to a drop after it triggered in 2007, but that was when stocks were near a high, and not after a protracted downtrend.
This doesn't say much about the short- to medium-term, as stocks often had to digest all of that buying pressure. Even over the next 6 months, returns were mixed. But over the long-term of a year or more, this should be another positive sign.
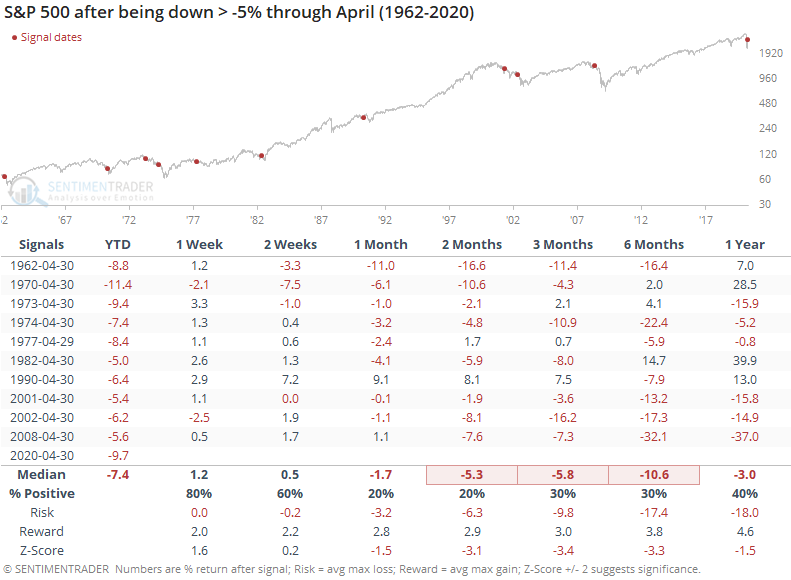
Those next 6 months could be a challenge based on the calendar. We've all heard about 'sell in May and go away' and it has been particularly acute during down years. When the S&P 500 was down at least 5% year-to-date through April, the months ahead were skewed more toward risk and less toward reward.
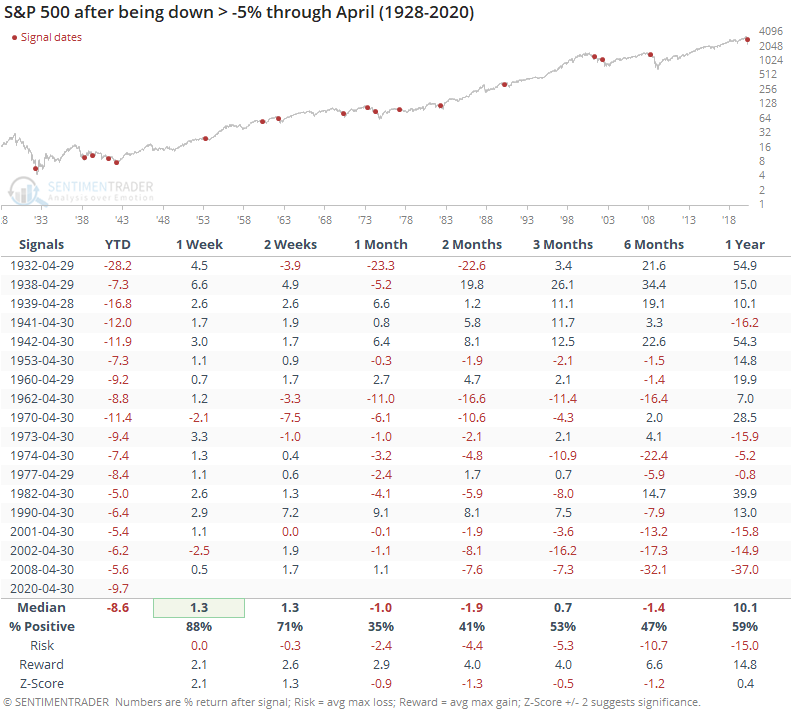
It has been particularly dastardly over the past 60 years. The next 2-6 months were not pleasant.
Contrast that to the returns during the 42 years when the S&P was up at least 5% through April.
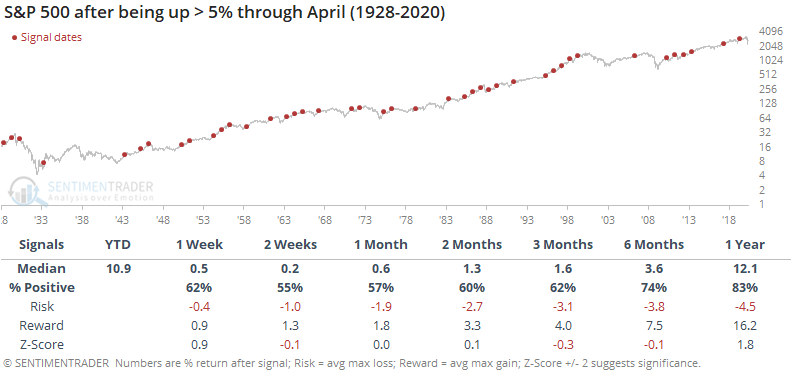
When the S&P was down 5% or more heading into the summer, the next 6 months averaged -1.4% with a 47% win rate, compared to an average of +3.6% and 74% win rate during up years.
We'd give much more weight to breadth than seasonality, but even the thrusts didn't lead to consistent upside within the next half year. It suggess that upside over the summer months might be hard to come by.
BOTTOM LINE
Economic data that are being released now show just how much devastation the pandemic wreaked on the economy. Both GDP and personal spending plunged by the most, or near-most, on record. But the economy is not the stock market, and by the time economic data showed big slowdowns, the market had already priced it in.
FORECAST / TIMEFRAME
SPY -- Up, Long-Term
|
The latest economic data sound terrible, and they have been. As the Wall Street Journal notes:
"Gross domestic product, the broadest measure of goods and services produced across the economy, contracted at a seasonally and inflation-adjusted annual rate of 4.8% in the first three months, the Commerce Department said Wednesday. The decline marks the beginning of a near-certain recession, economists say, and is the biggest drop in quarterly economic output since the fourth quarter of 2008."
Not only is this the biggest contraction since 2008, but it's also one of the largest on record, going back to the 1940s.
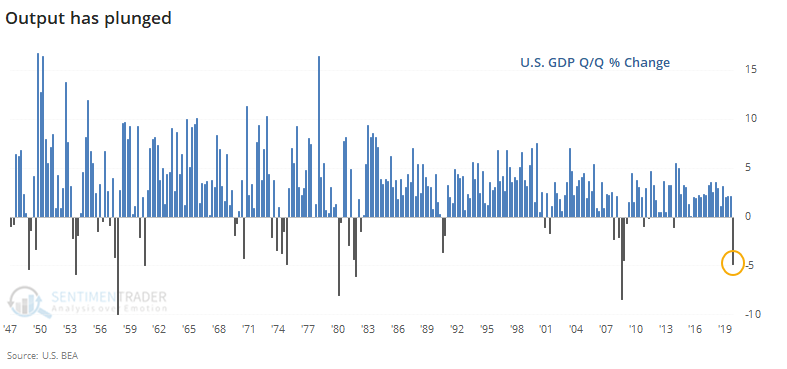
We've seen repeatedly over the years that the economy is not the stock market. More often than not, bad economic data leads to good returns in stocks, and vice-versa.
Below, we can see returns in the S&P 500 after GDP plunges 4% or more. The dates are moved forward one month to account for the lag in release times.
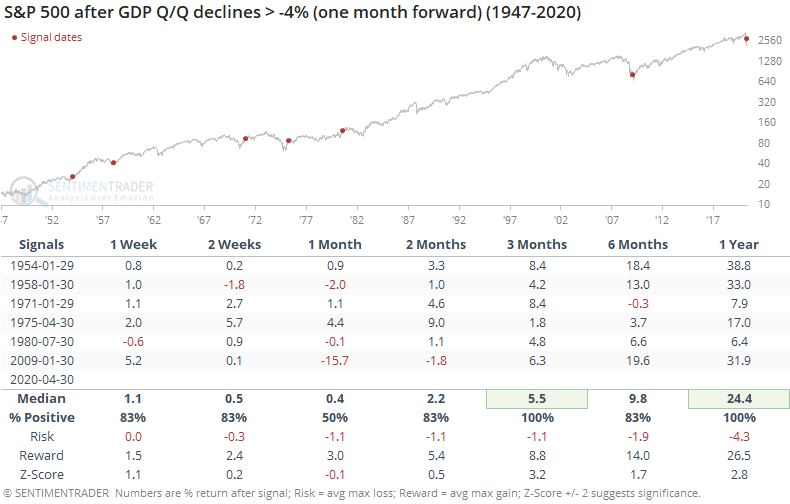
By the time the economy reflected such widespread damage, forward-looking investors had already priced it in. Over the next 3-12 months, stocks showed excellent returns, with extremely low risk relative to reward.
As both a cause and effect, the economic slowdown is being reflected in personal spending habits. Consumers pulled back on spending of almost all types, outside of necessities. The U.S. economy has never seen anything like this before.
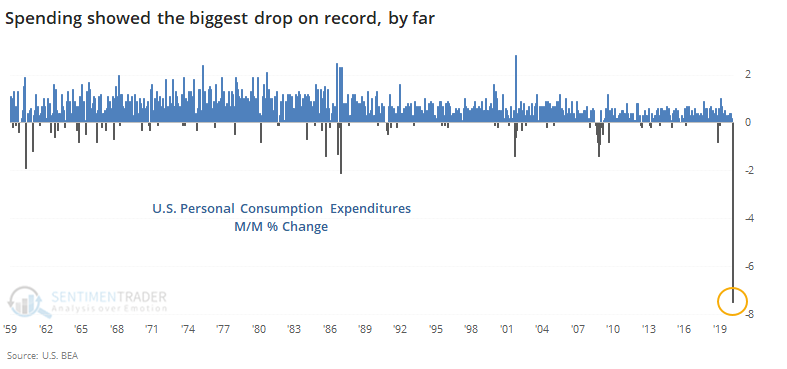
A monthly drop of even 0.5% is severe, at least since 1959. Below, we can see every time it dropped by that much or more, using only the first reading in a cluster and advancing it by one month to account for the delay in release time.
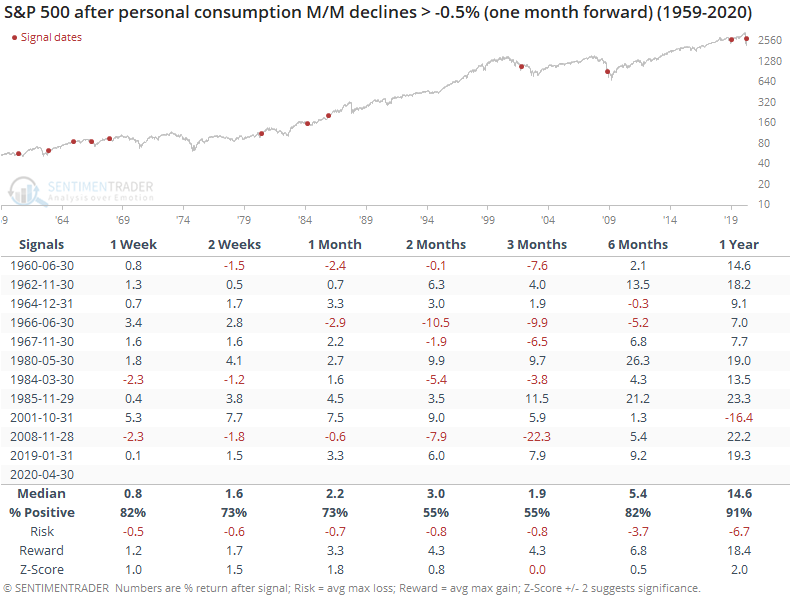
These spending stops led to more of a mixed result over the medium-term, but a year later there was only a single loss, and the overall risk/reward over the long-term was decent.
With anything related to stock movements or economic data during this cycle, there should be a blanket caveat that we've never seen anything quite like this in recorded human history, or at least since the popularization of auction markets. But if we can make the very general assumption that investors behave more or less consistently to terrible economic data, then these readings should be a long-term positive.
Active Studies
| Time Frame | Bullish | Bearish | | Short-Term | 0 | 6 | | Medium-Term | 12 | 0 | | Long-Term | 36 | 3 |
|
Indicators at Extremes
Portfolio
| Position | Weight % | Added / Reduced | Date | | Stocks | 49.9 | Reduced 10.3% | 2020-04-23 | | Bonds | 0.0 | Reduced 6.7% | 2020-02-28 | | Commodities | 5.1 | Added 2.4%
| 2020-02-28 | | Precious Metals | 0.0 | Reduced 3.6% | 2020-02-28 | | Special Situations | 0.0 | Reduced 31.9% | 2020-03-17 | | Cash | 45.0 | | |
|
Updates (Changes made today are underlined)
In the first months of the year, we saw manic trading activity. From big jumps in specific stocks to historic highs in retail trading activity to record highs in household confidence to almost unbelievable confidence among options traders. All of that came amid a market where the average stock couldn't keep up with their indexes. There were signs of waning momentum in stocks underlying the major averages, which started triggering technical warning signs in late January. The kinds of extremes we saw in December and January typically take months to wear away, but the type of selling in March went a long way toward getting there. When we place the kind of moves we saw into March 23 into the context of coming off an all-time high, there has been a high probability of a multi-month rebound. After stocks bottomed on the 23rd, they enjoyed a historic buying thrust and retraced a larger amount of the decline than "just a bear market rally" tends to. While other signs are mixed that panic is subsiding, those thrusts are the most encouraging sign we've seen in years. Shorter-term, there have been some warning signs popping up and our studies have stopped showing as positively skewed returns. I reduced my exposure some on Monday and a little more on Thursday and will consider further reducing it if we drop below last week's lows on SPY. Long-term suggestions from the studies remain robust, but shorter-term ones are significantly less so, and stocks still have to prove that we're in something other than a protracted, recessionary bear market.
RETURN YTD: -8.8% 2019: 12.6%, 2018: 0.6%, 2017: 3.8%, 2016: 17.1%, 2015: 9.2%, 2014: 14.5%, 2013: 2.2%, 2012: 10.8%, 2011: 16.5%, 2010: 15.3%, 2009: 23.9%, 2008: 16.2%, 2007: 7.8%
|
|
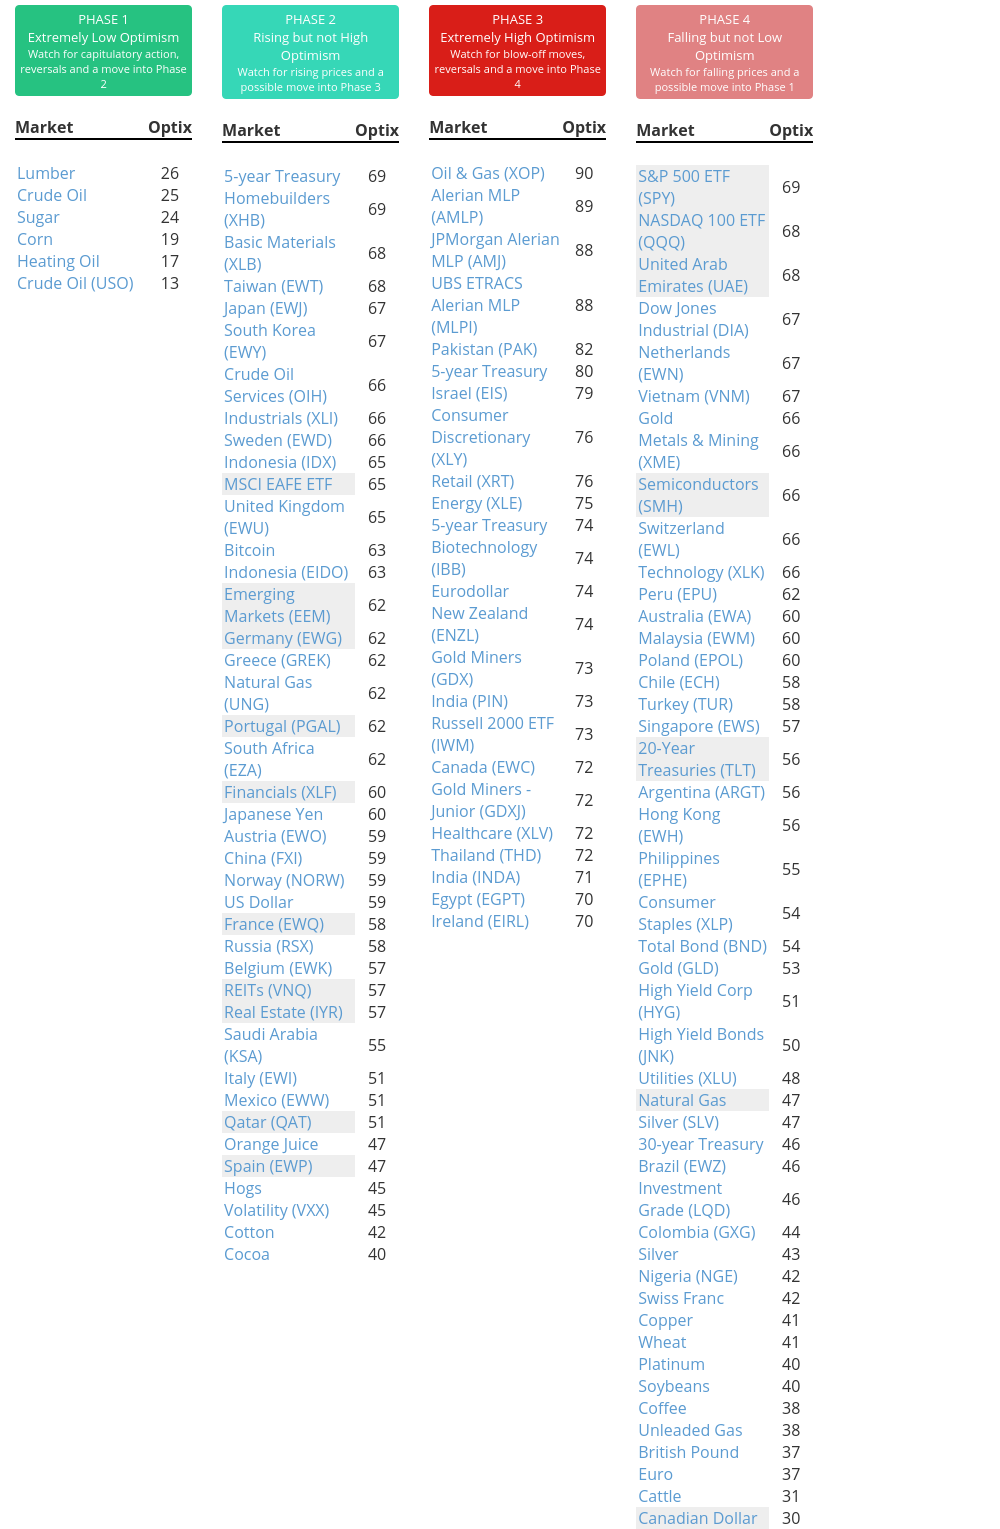
Phase Table
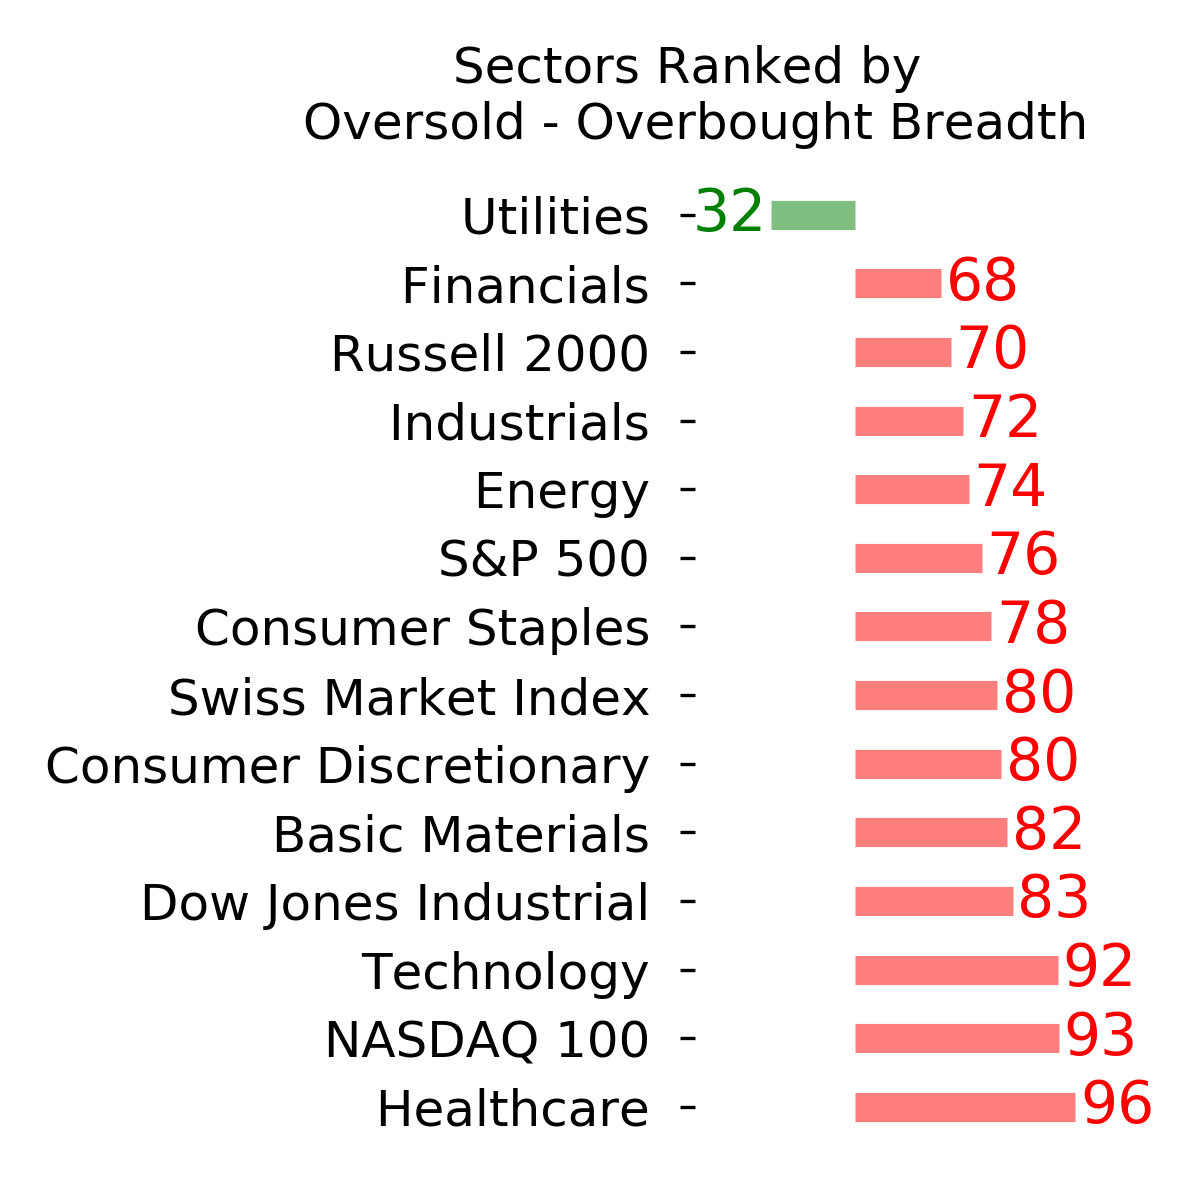
Ranks
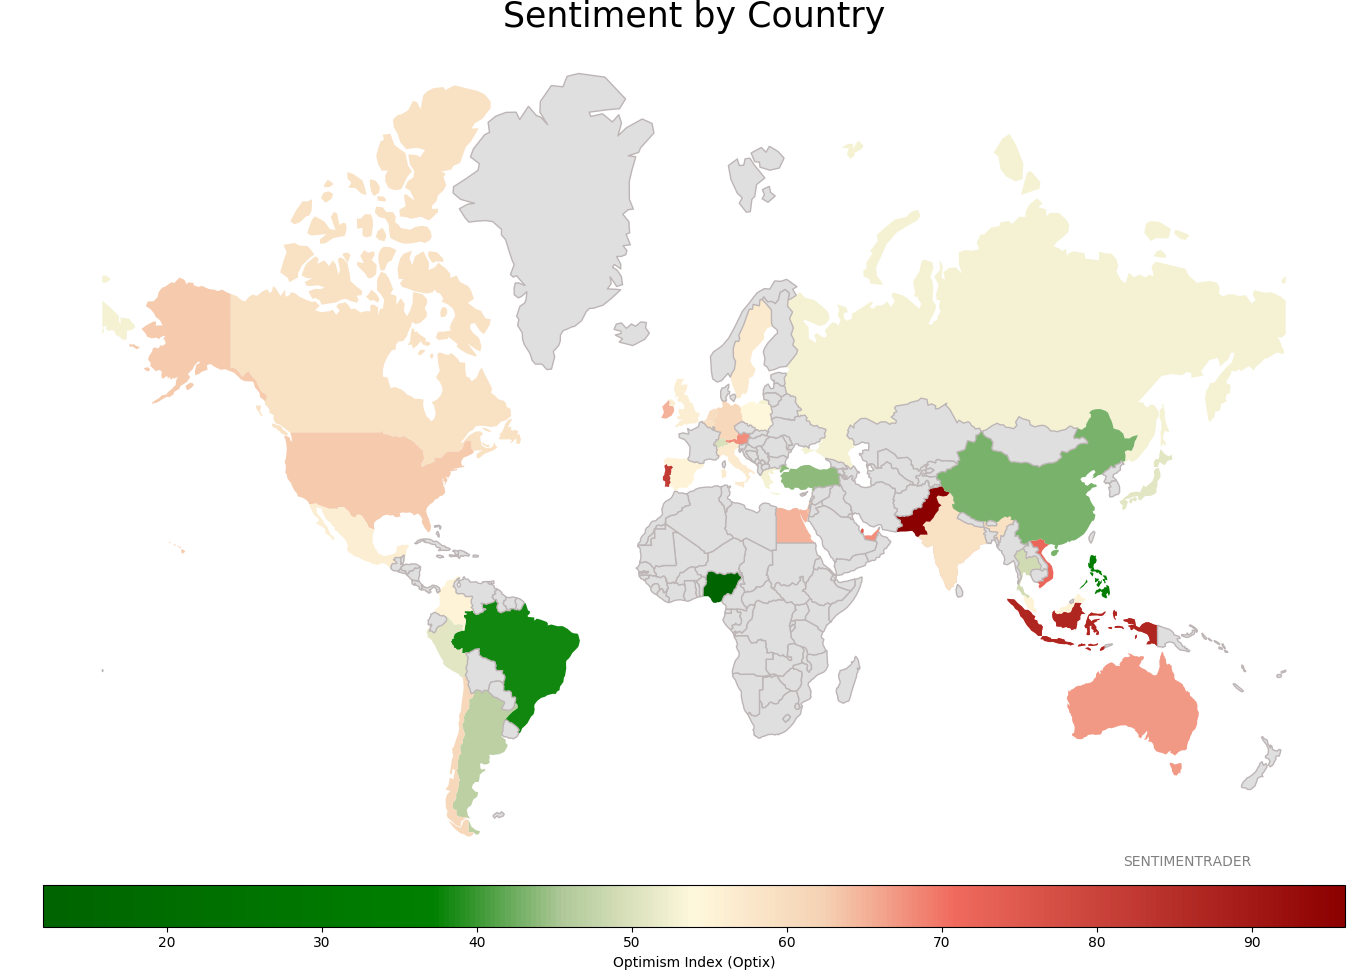
Sentiment Around The World
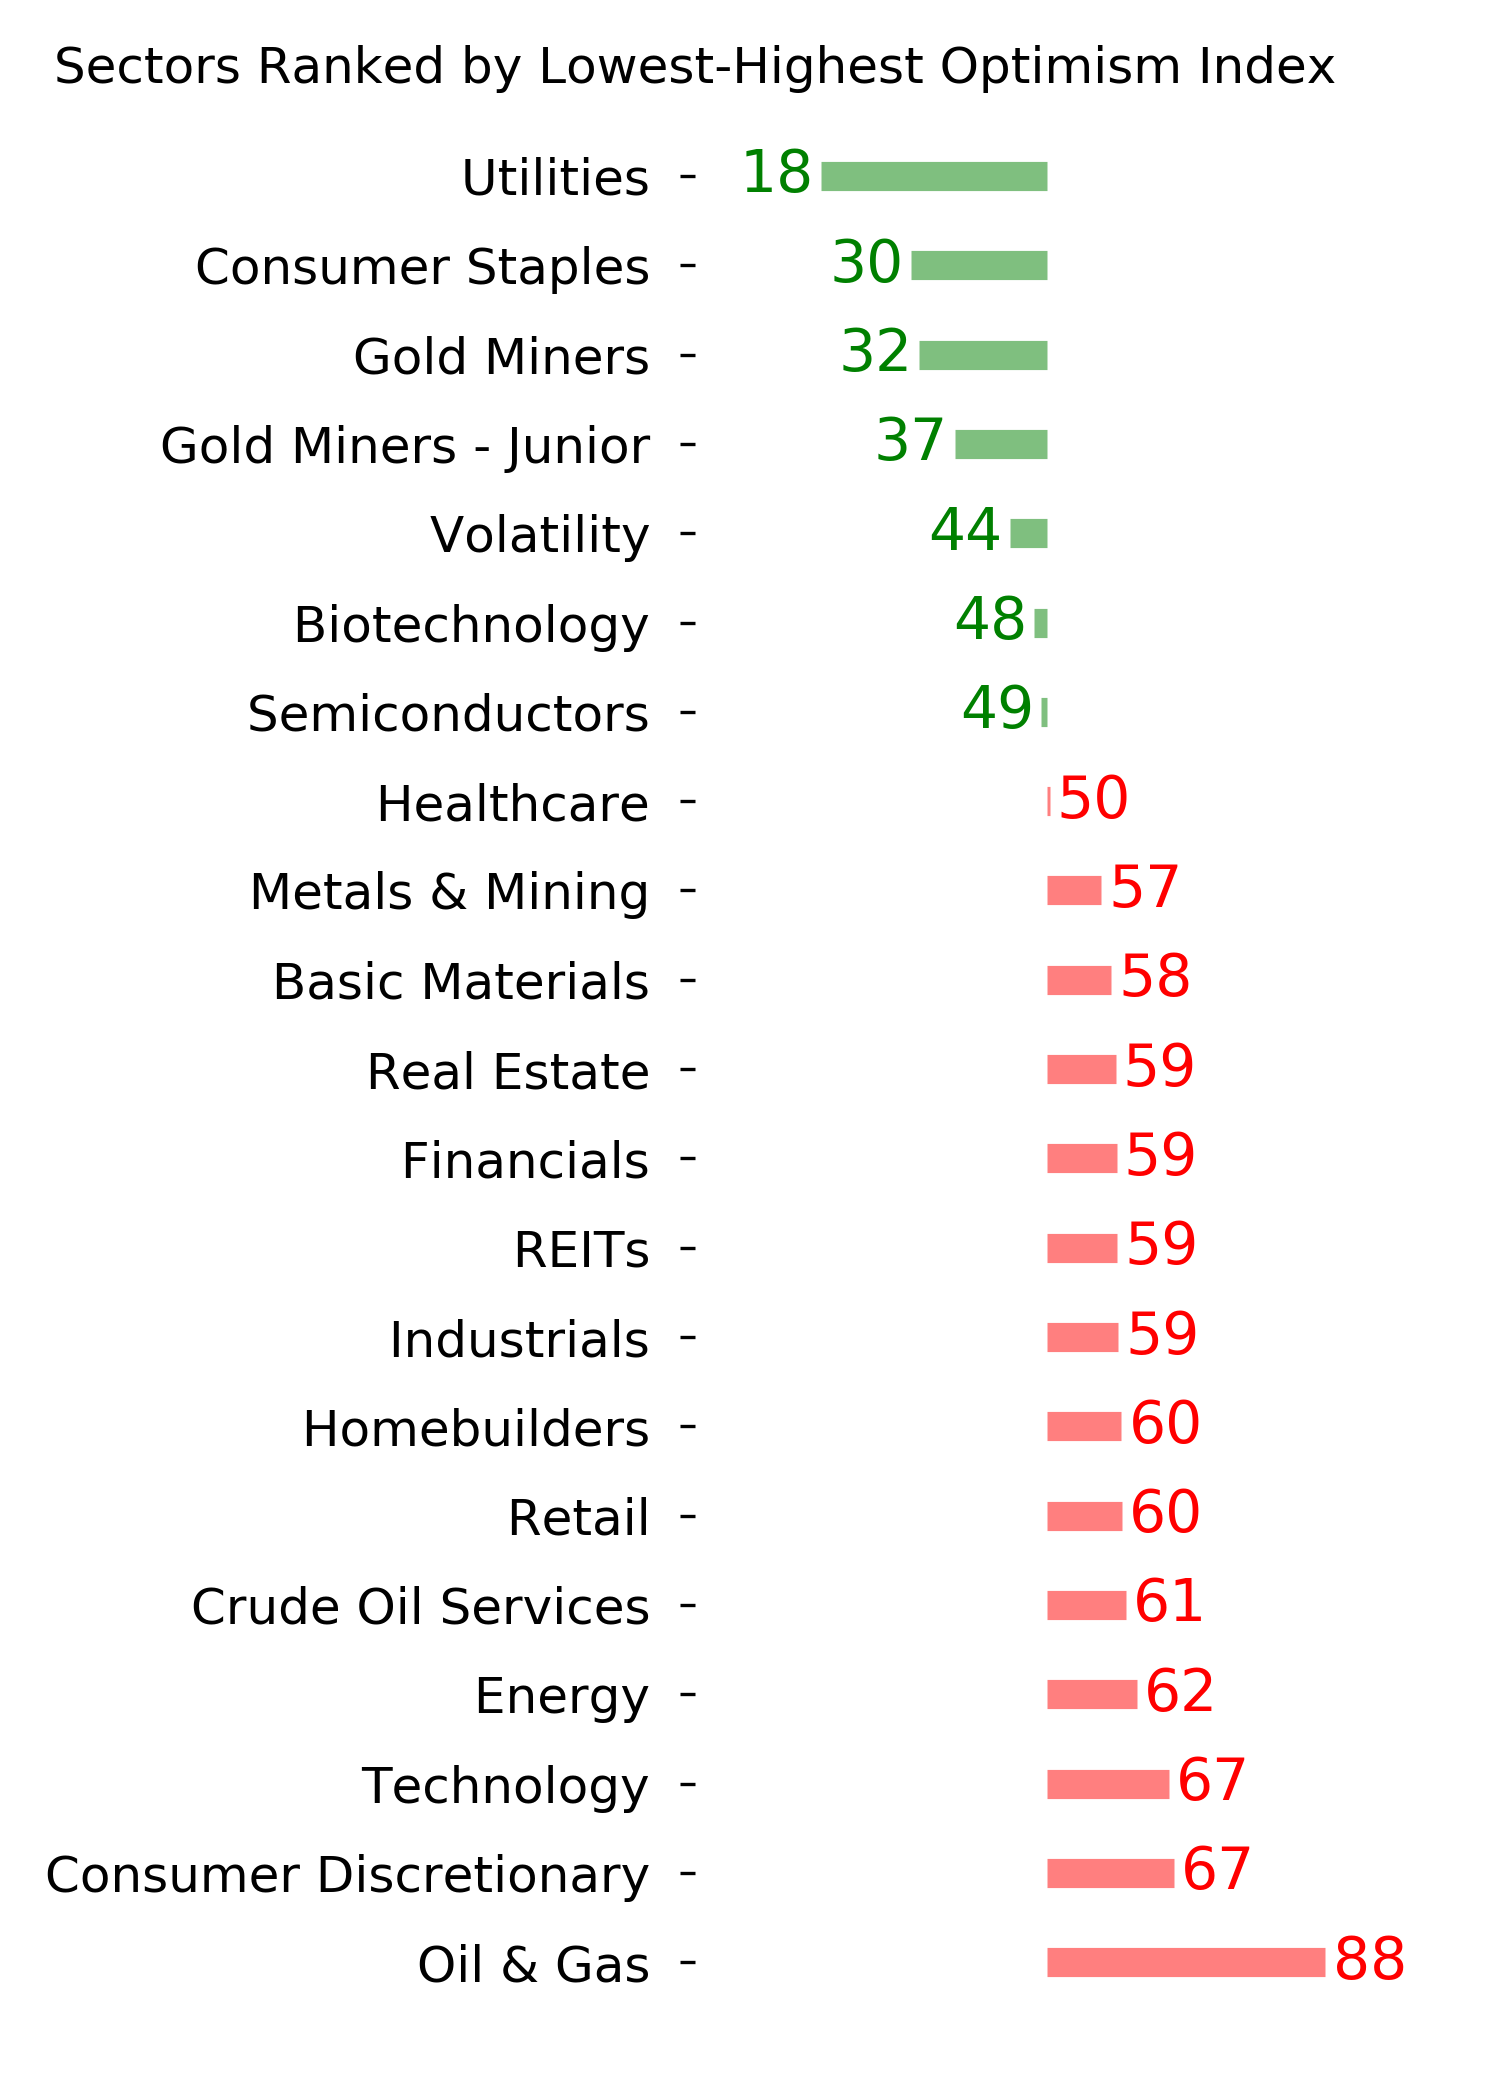
Optimism Index Thumbnails
|
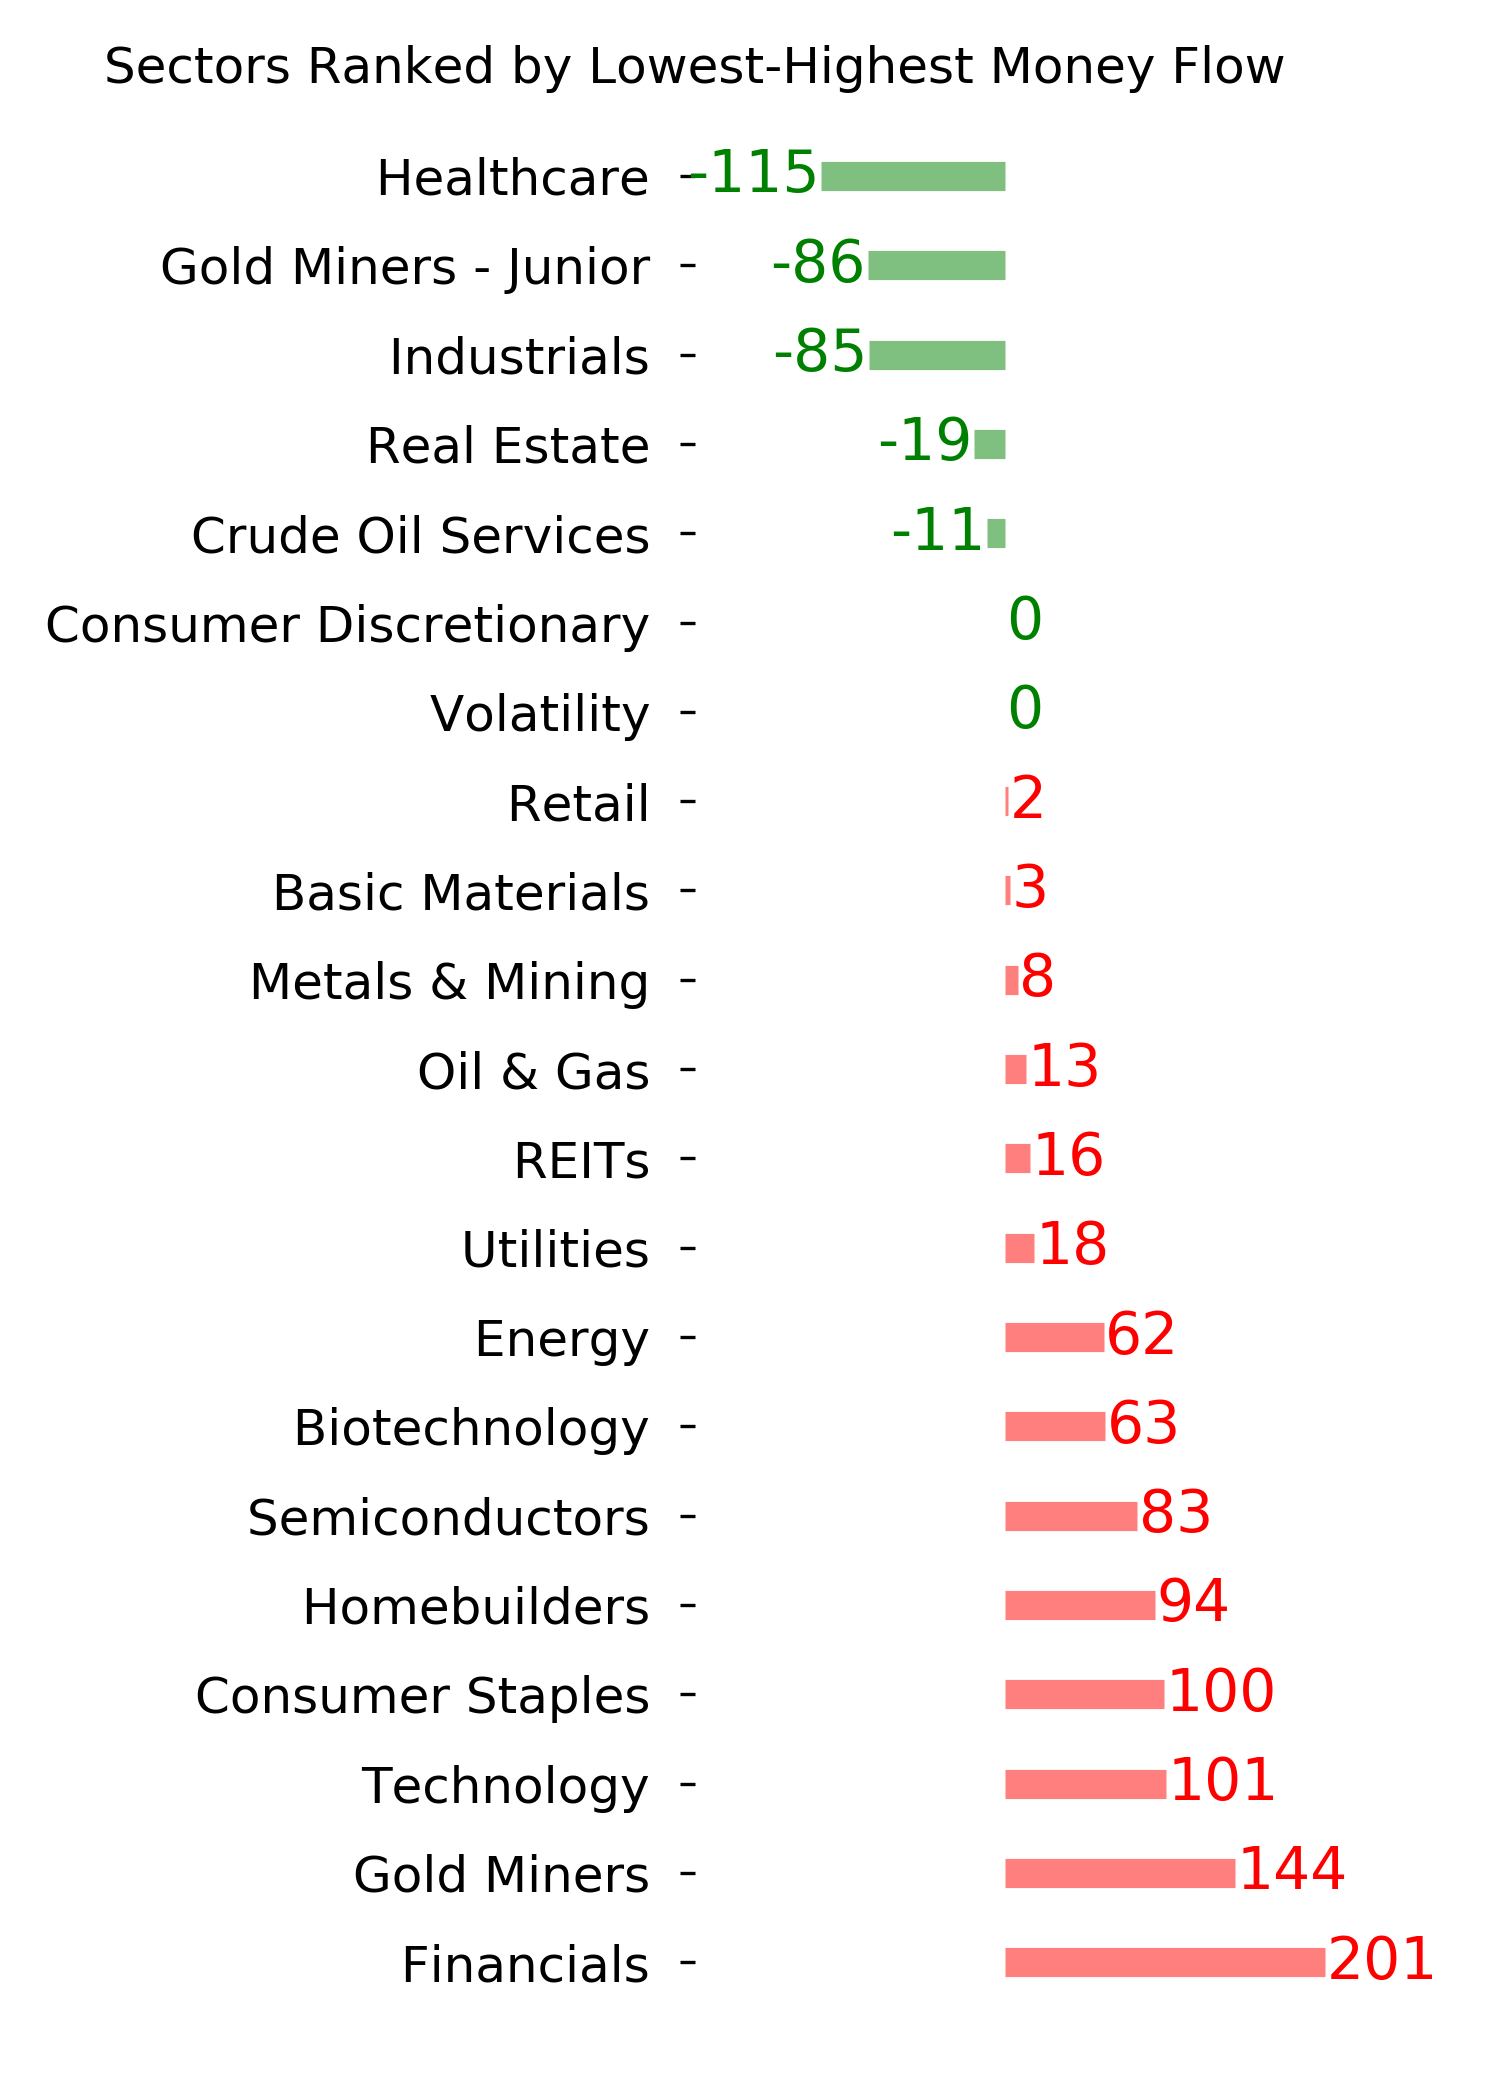
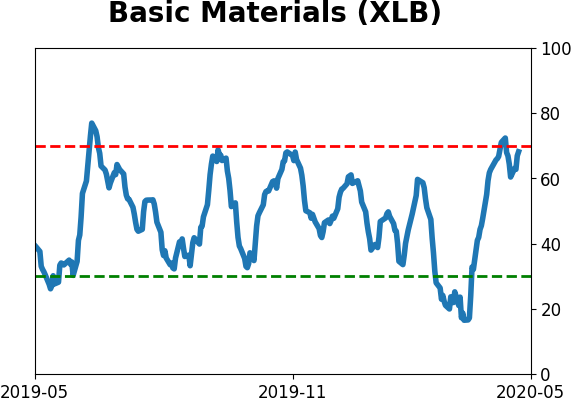
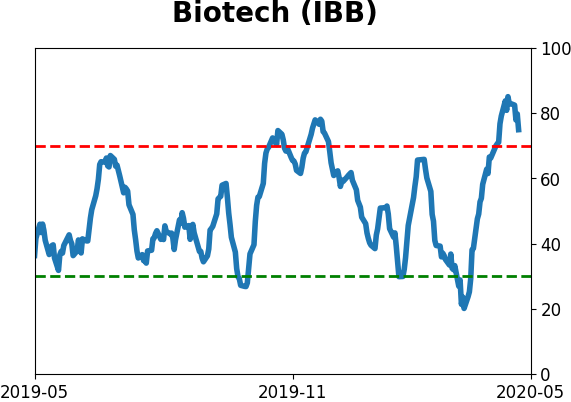
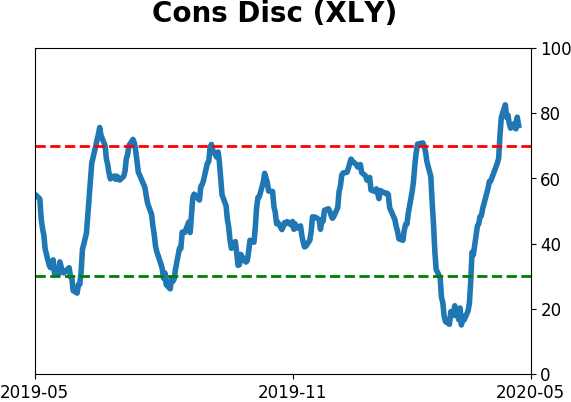
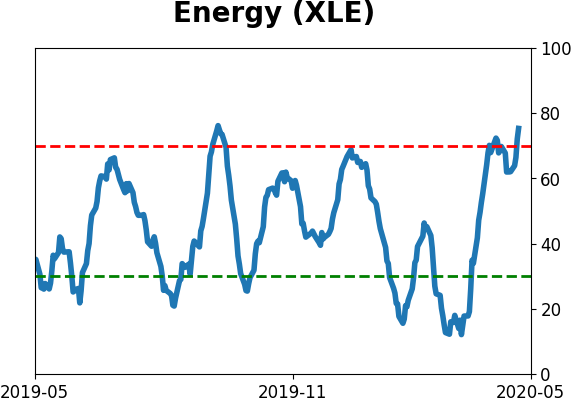
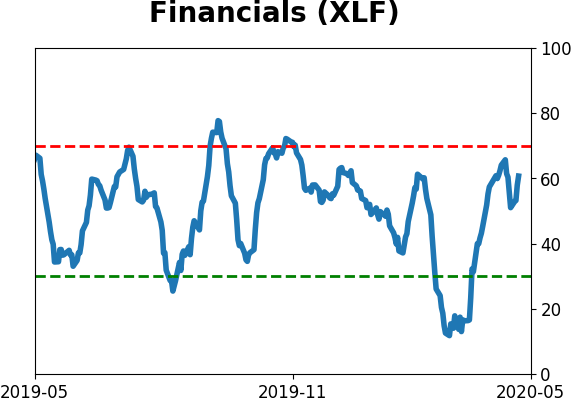
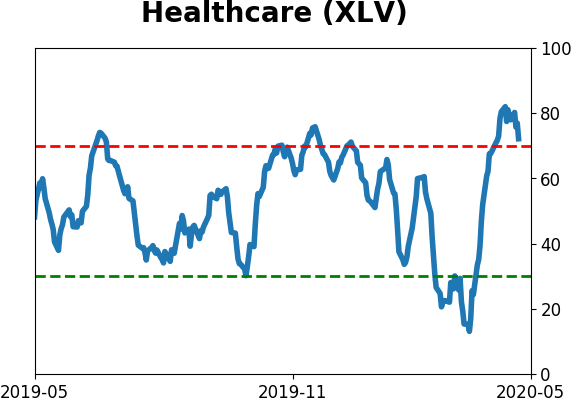
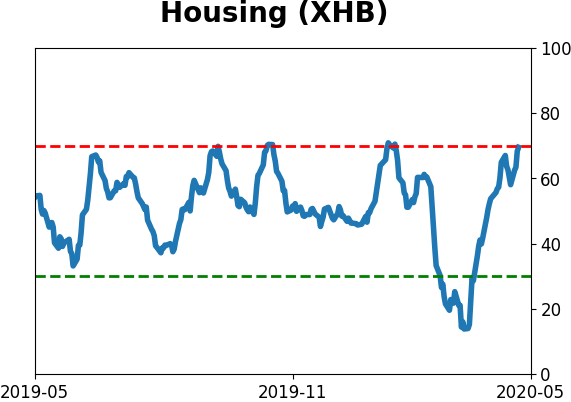
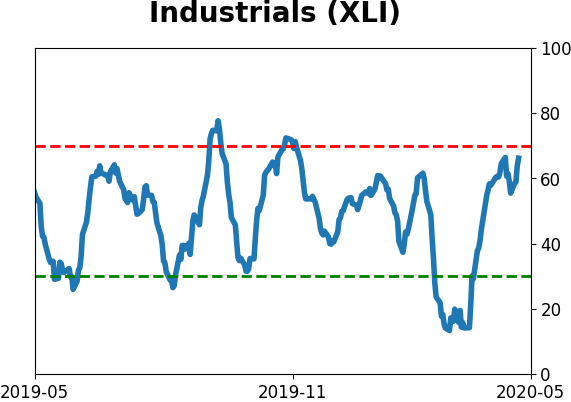
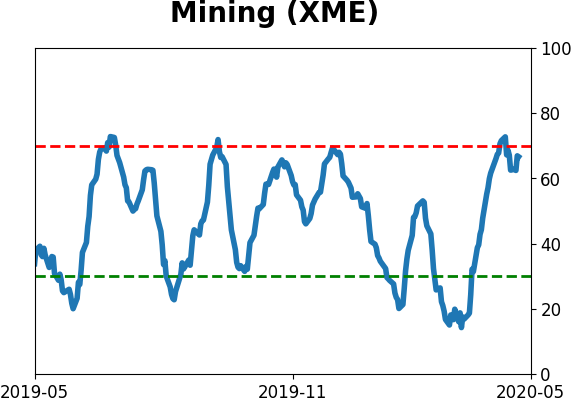
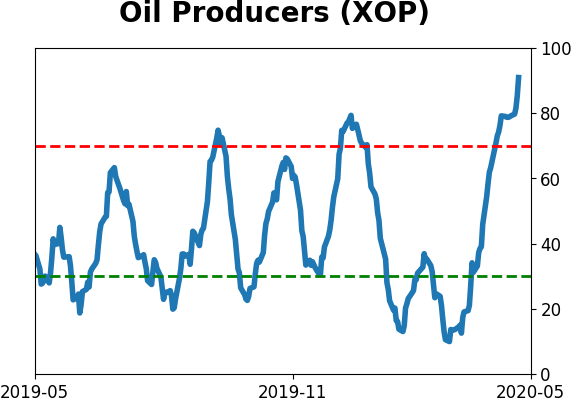
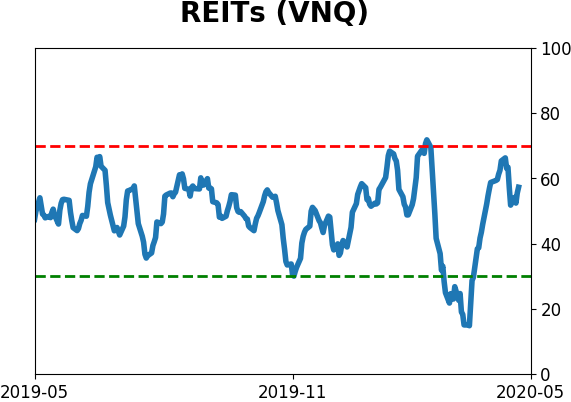
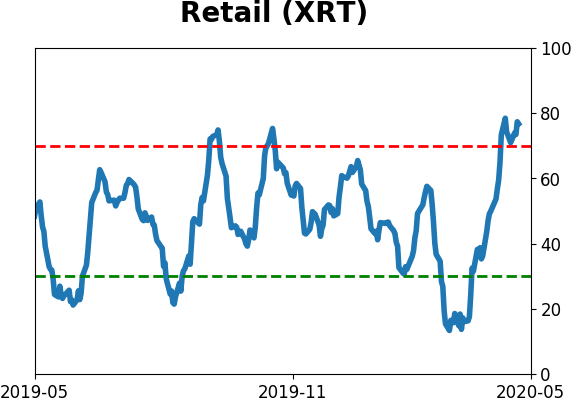
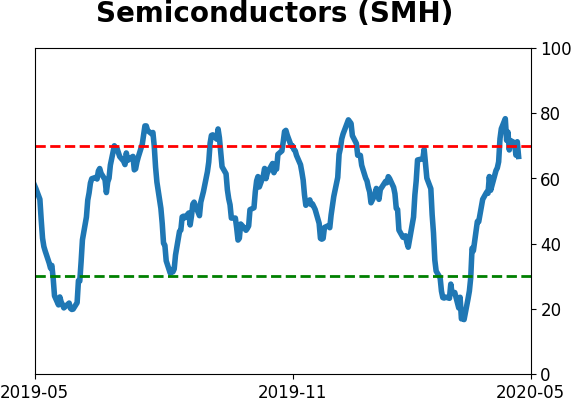
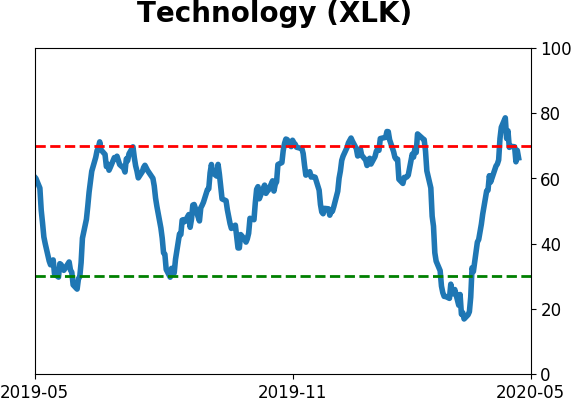
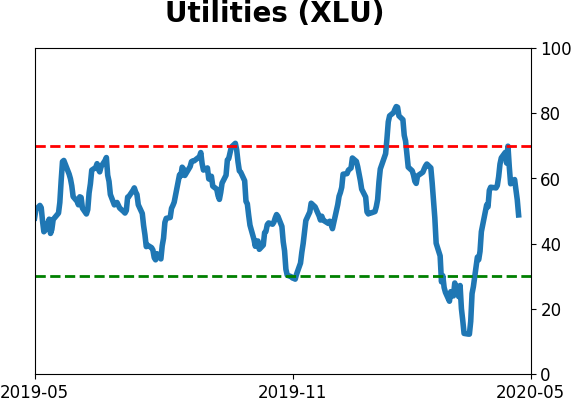
Sector ETF's - 10-Day Moving Average
|
|
|
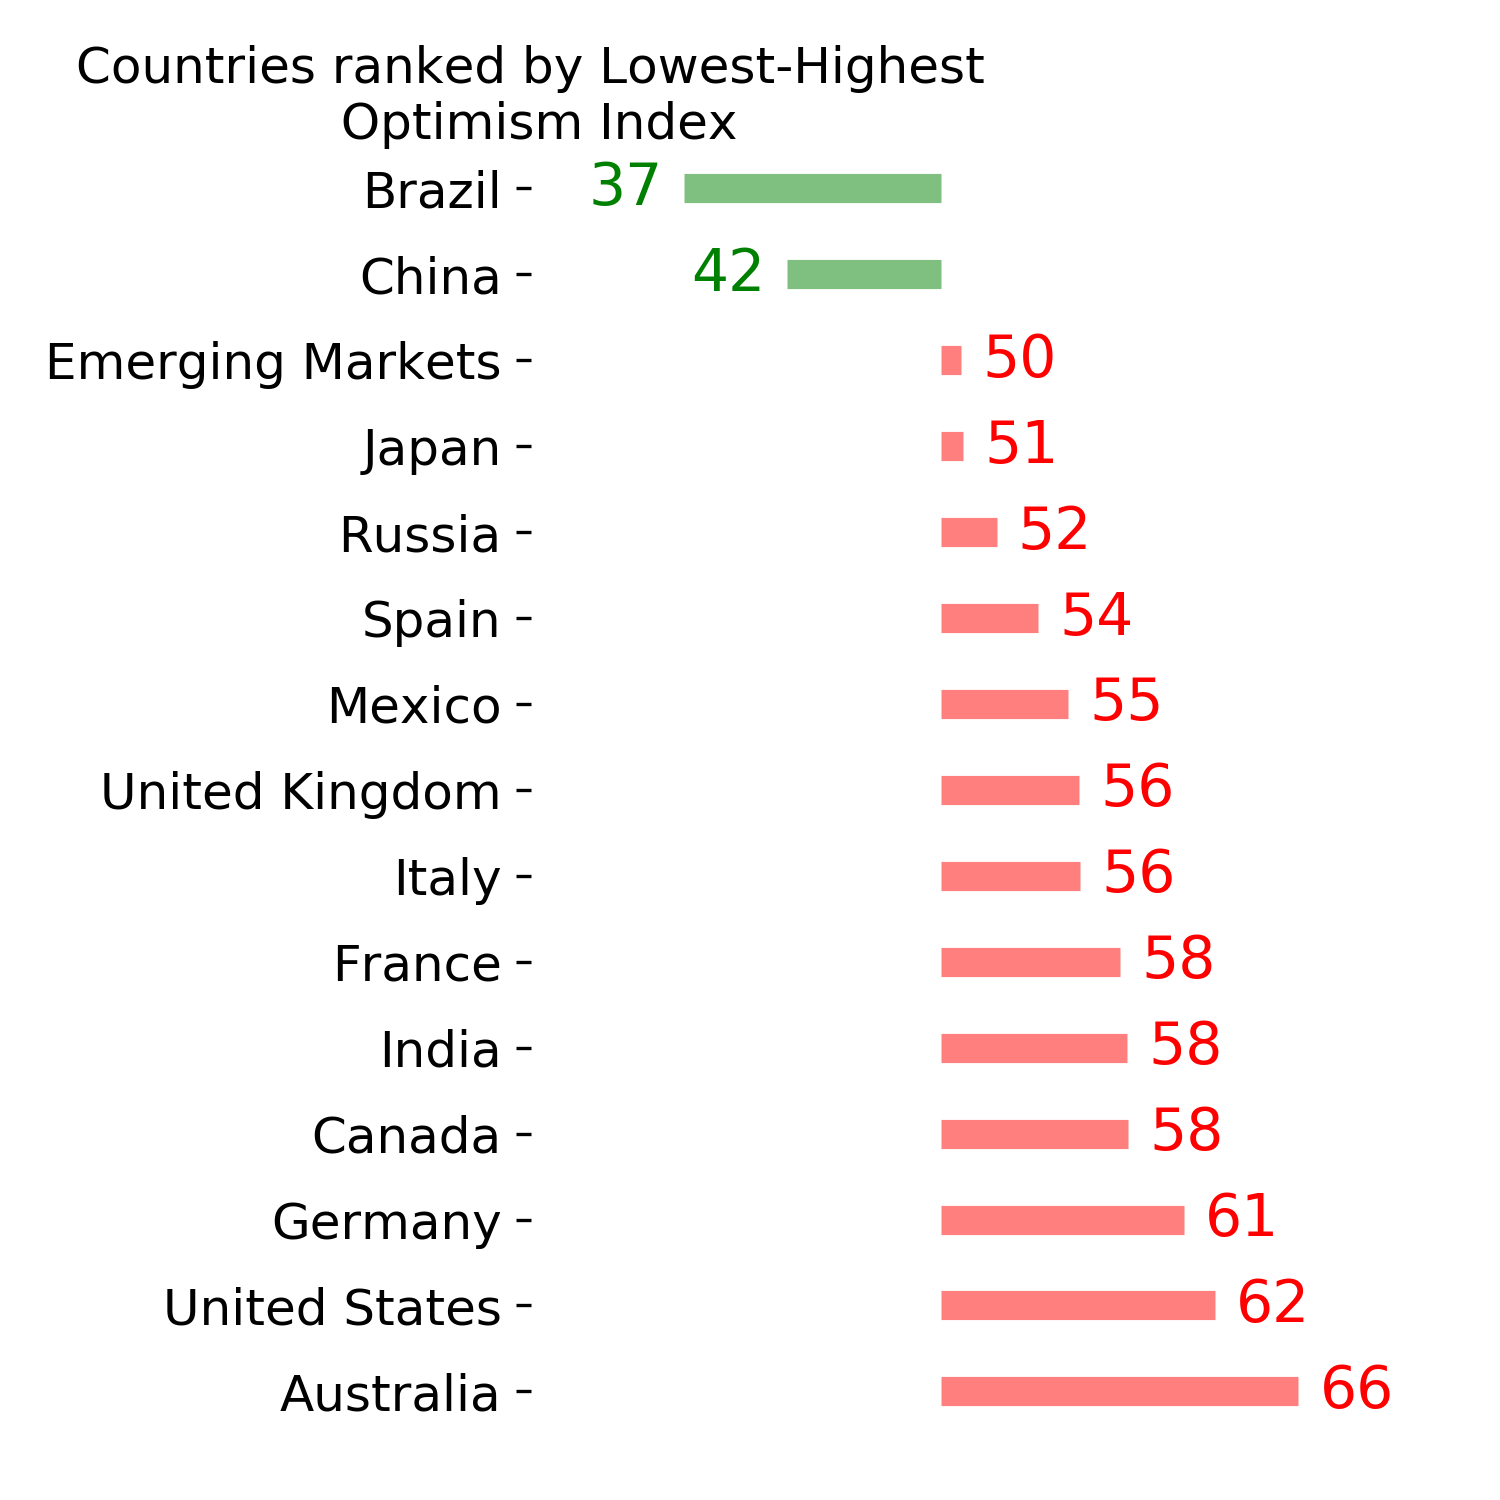
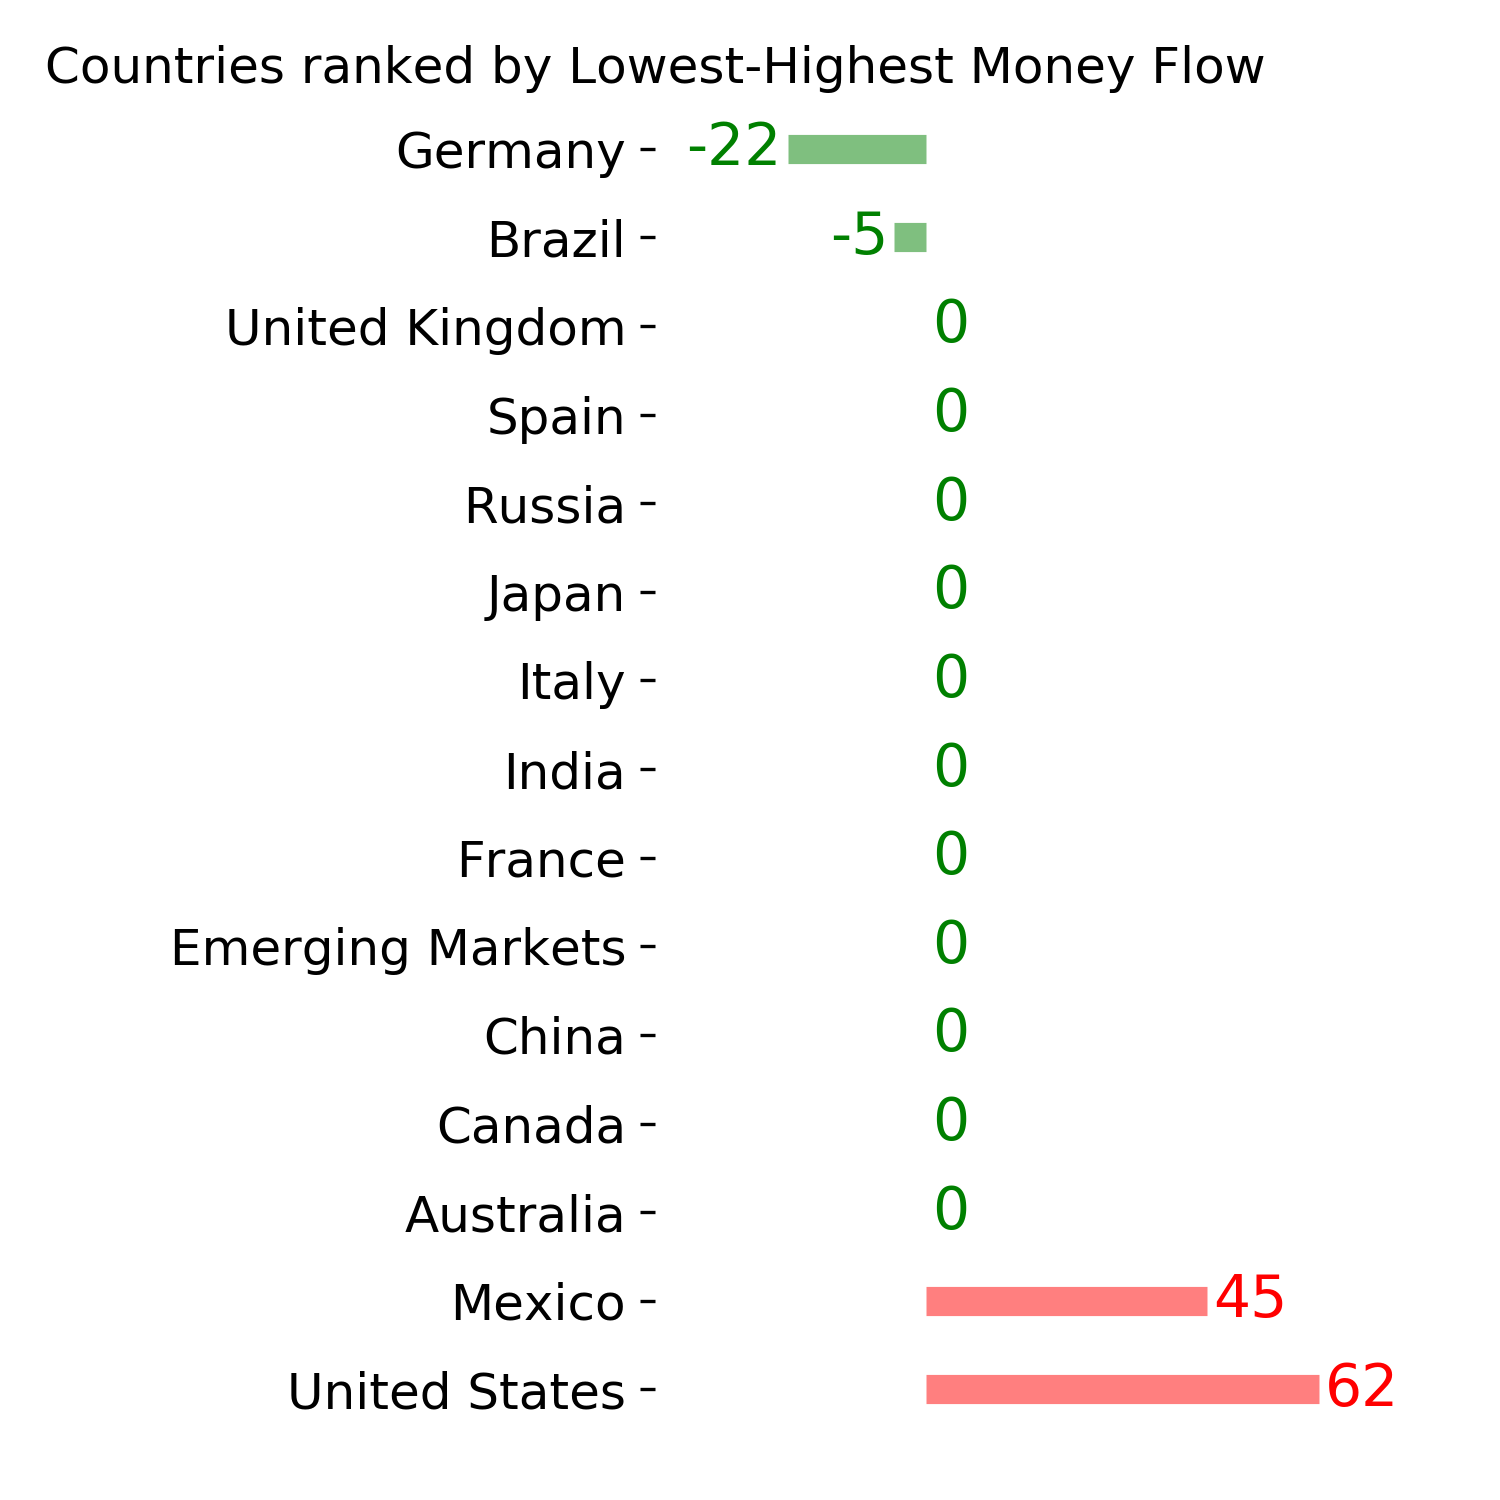
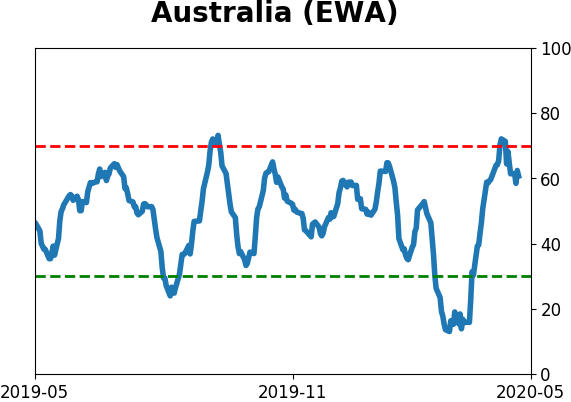
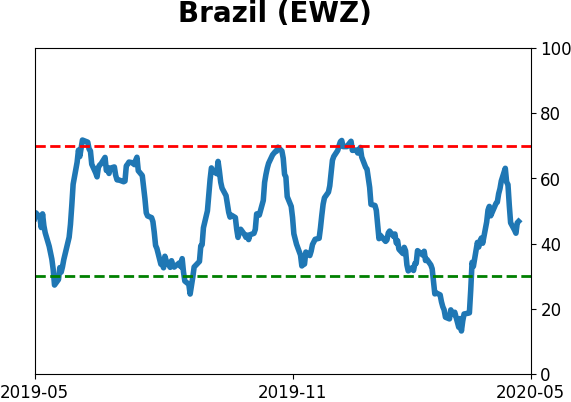
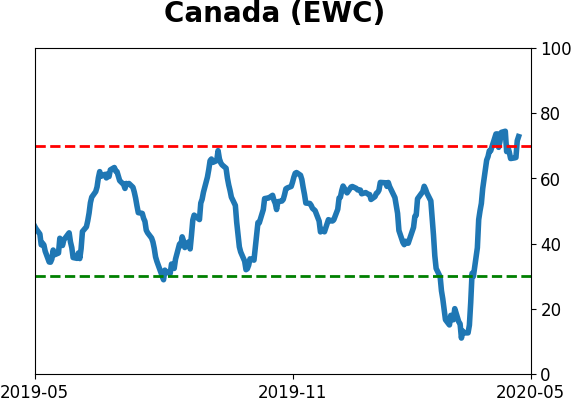
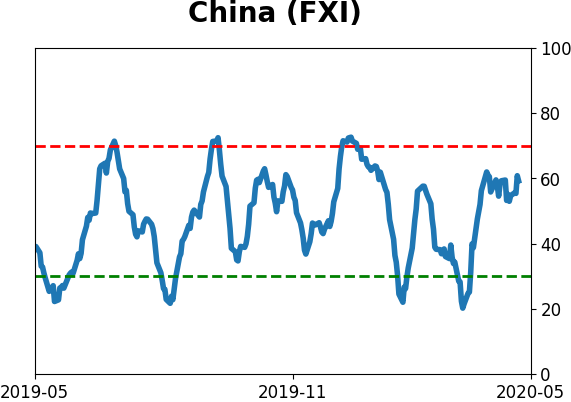
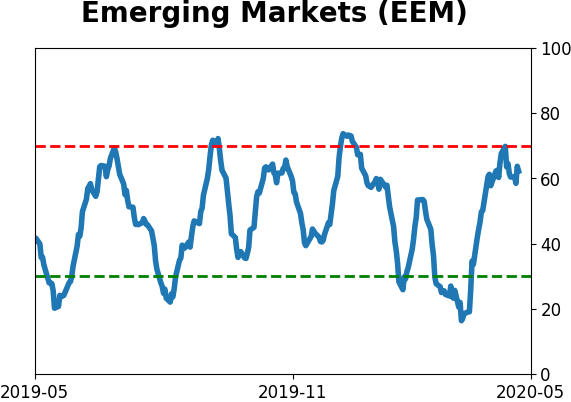
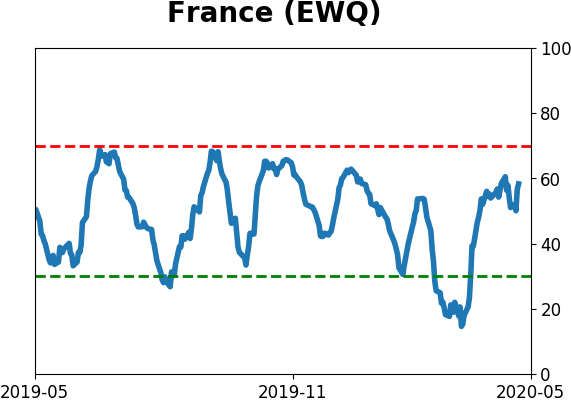
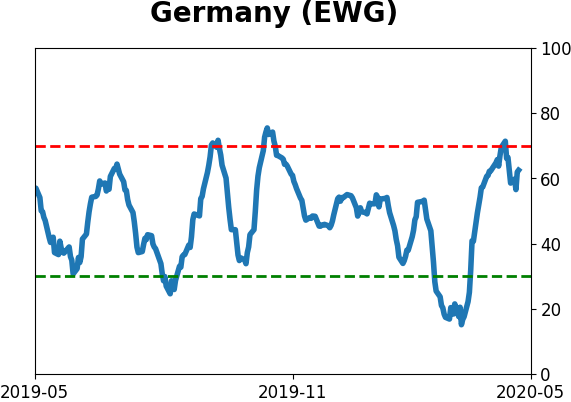
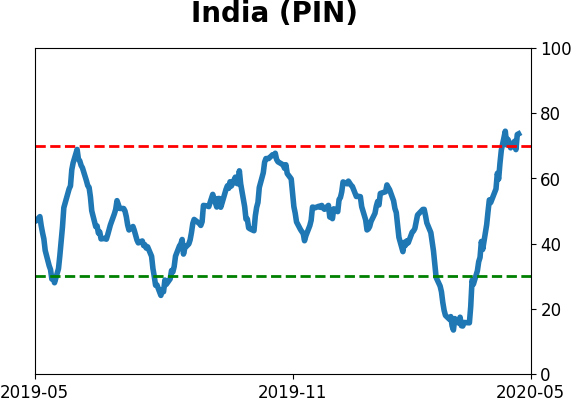
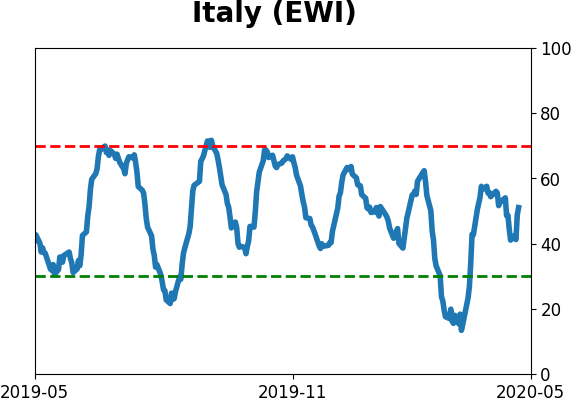
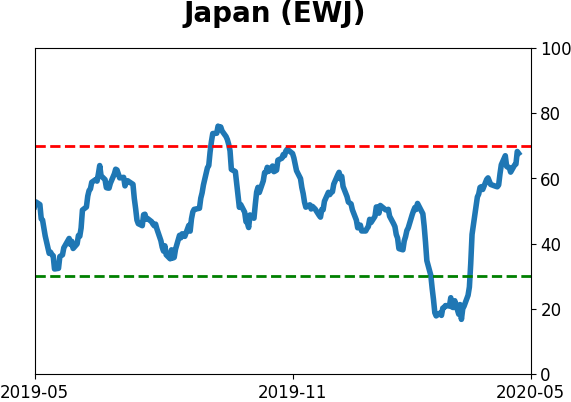
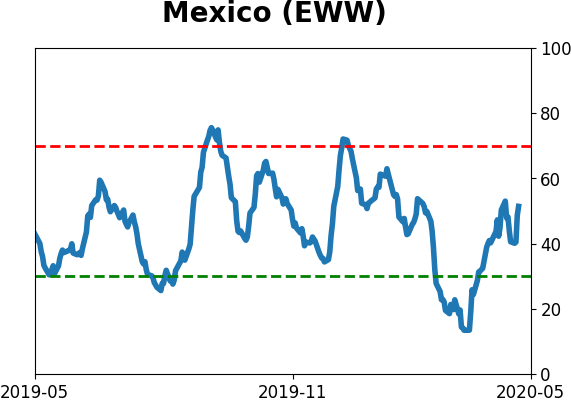
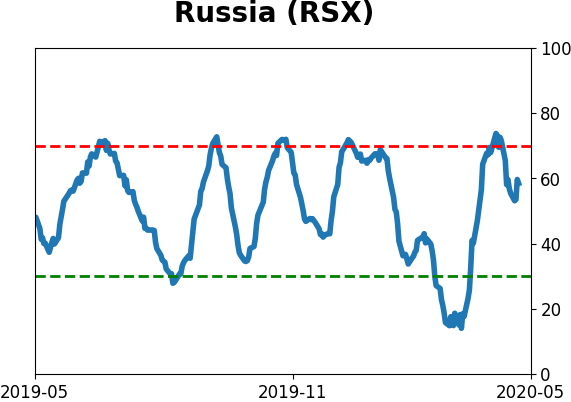
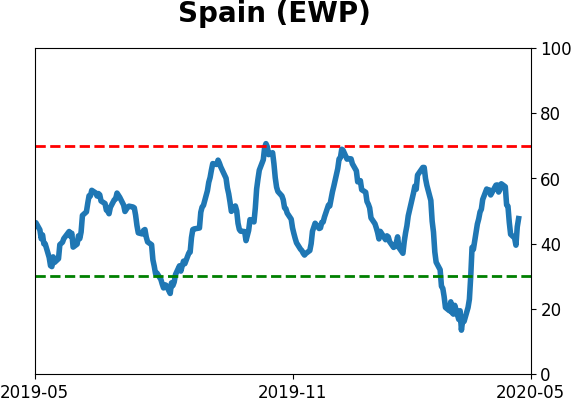
Country ETF's - 10-Day Moving Average
|
|
|
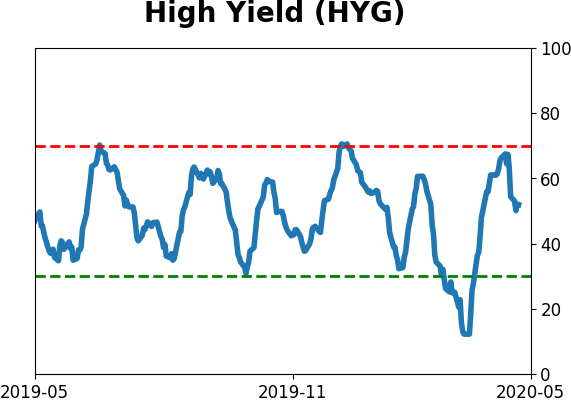
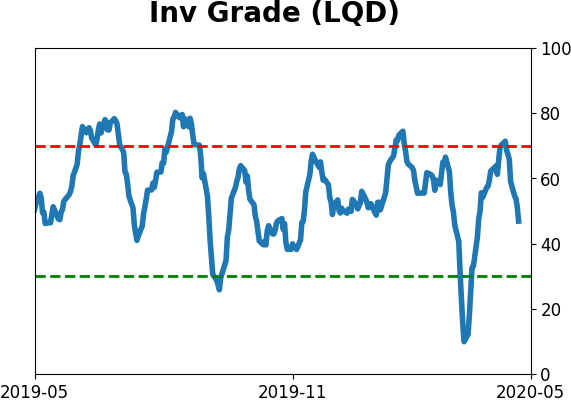
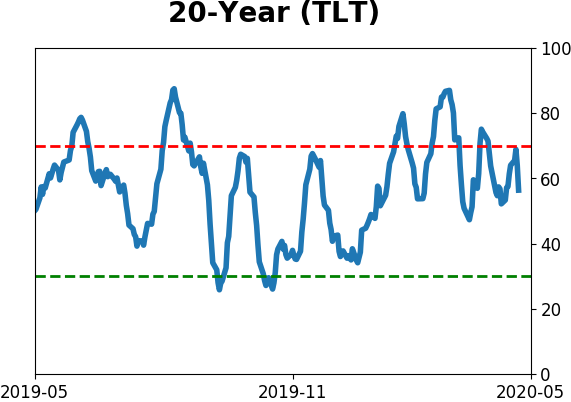
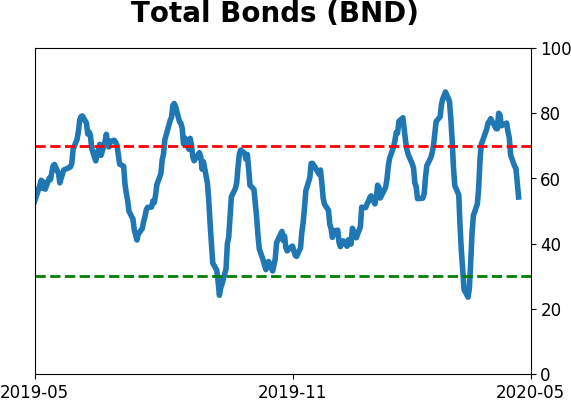
Bond ETF's - 10-Day Moving Average
|
|
|
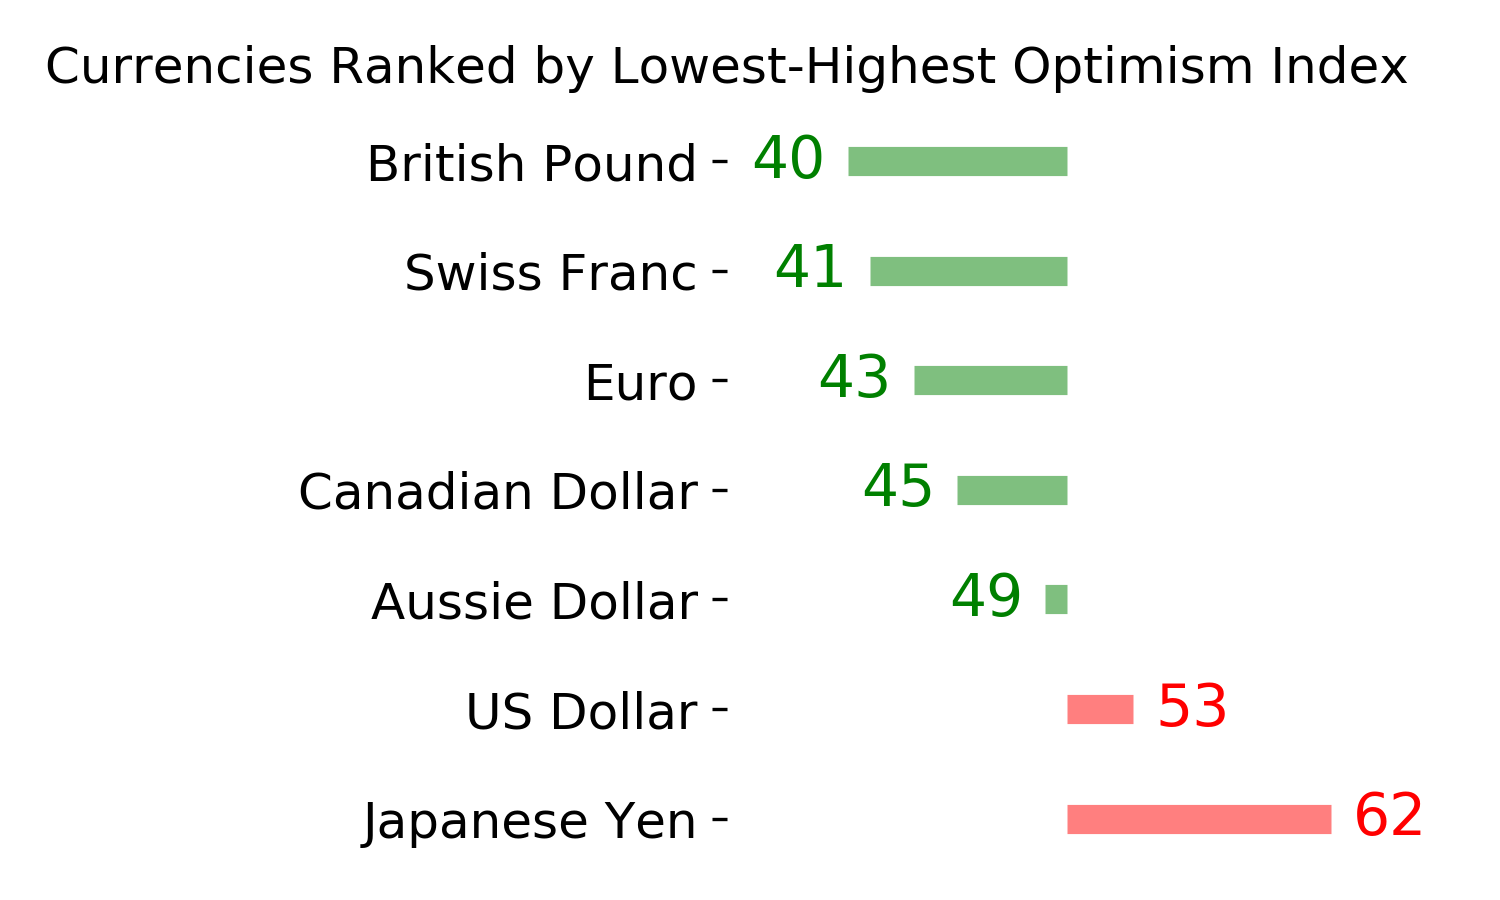
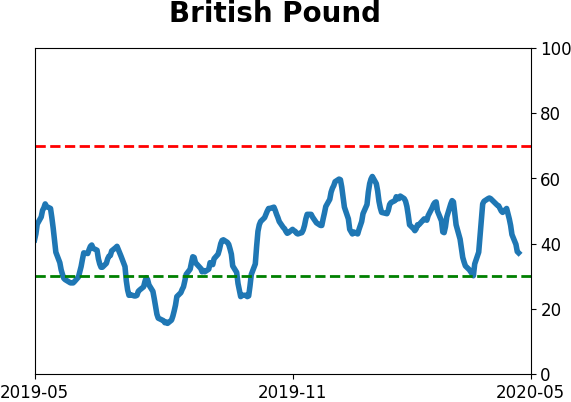
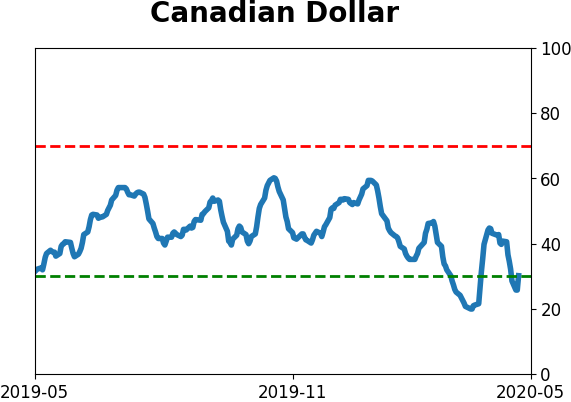
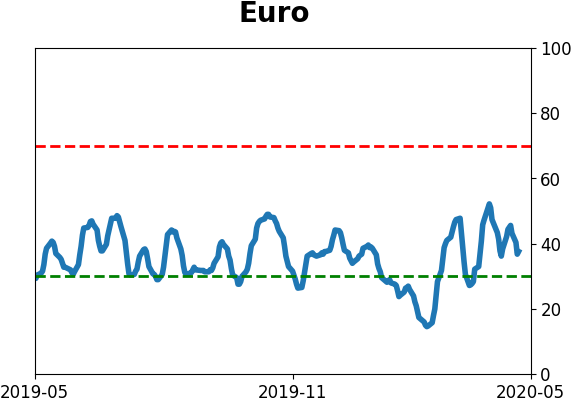
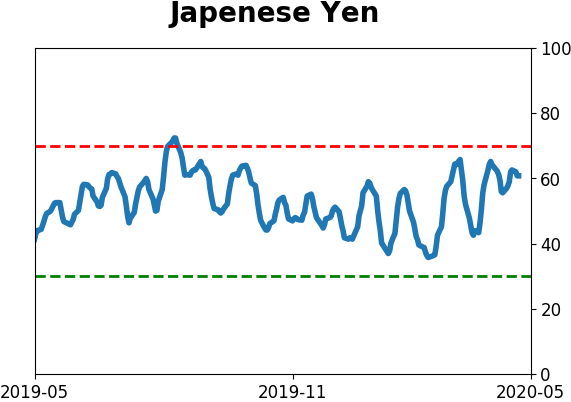
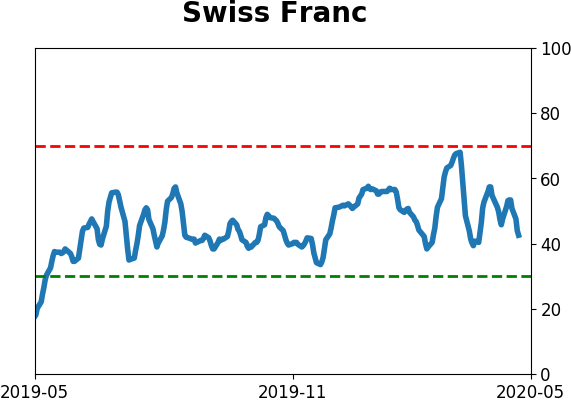
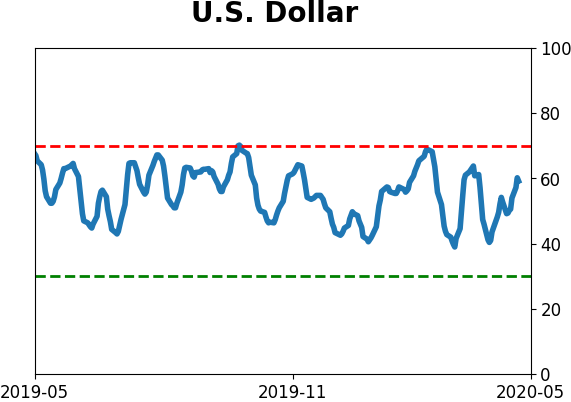
Currency ETF's - 5-Day Moving Average
|
|
|
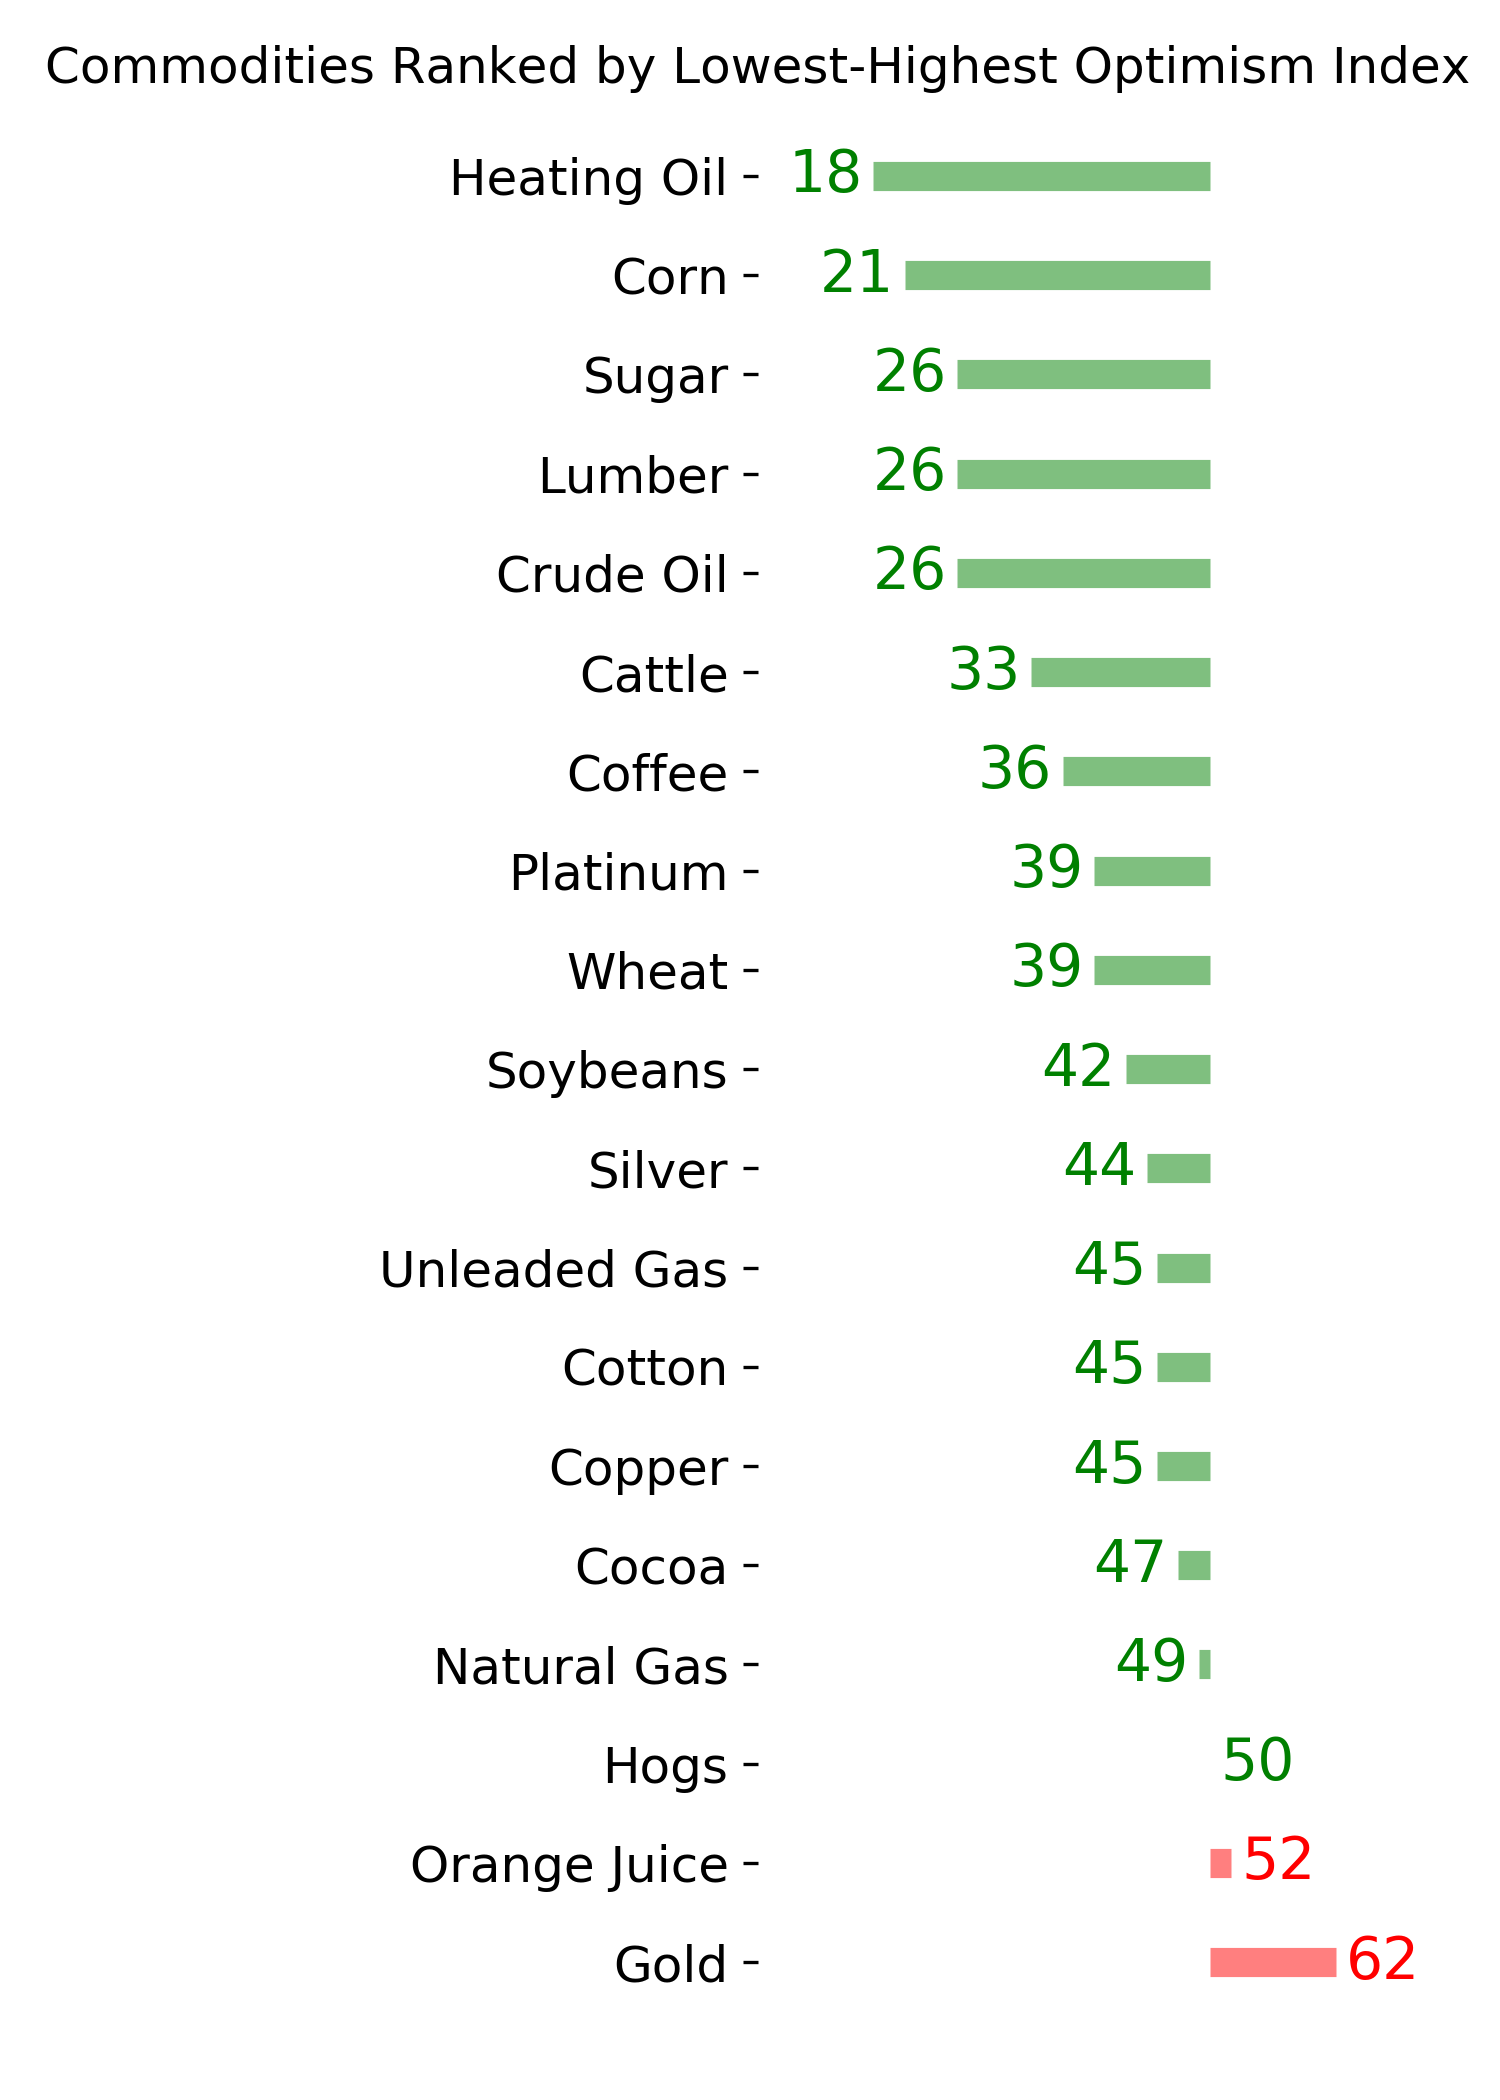
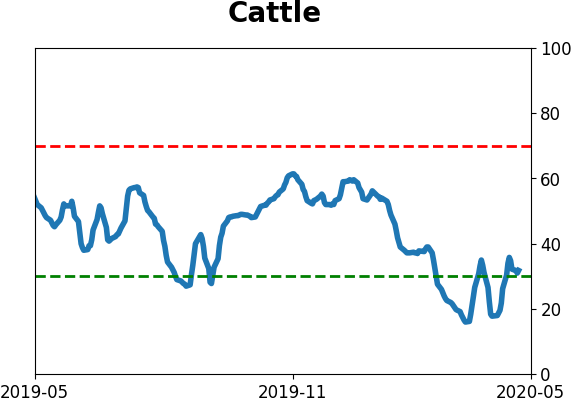
Commodity ETF's - 5-Day Moving Average
|
|