Headlines
|
|
Consumers are back and counting on rising stocks:
In April, U.S. consumers became more confident in the economy, and also the stock market. There is a high correlation between past returns and current confidence, and when consumers get this confident, future returns were below average.
Bottom Line:
See the Outlook & Allocations page for more details on these summaries STOCKS: Weak sell
The extreme speculation registered in January and February is starting to get wrung out. Internal dynamics have mostly held up, so a return to neutral sentiment conditions would improve the forward risk/reward profile substantially. We're still a ways off from that. BONDS: Weak buy
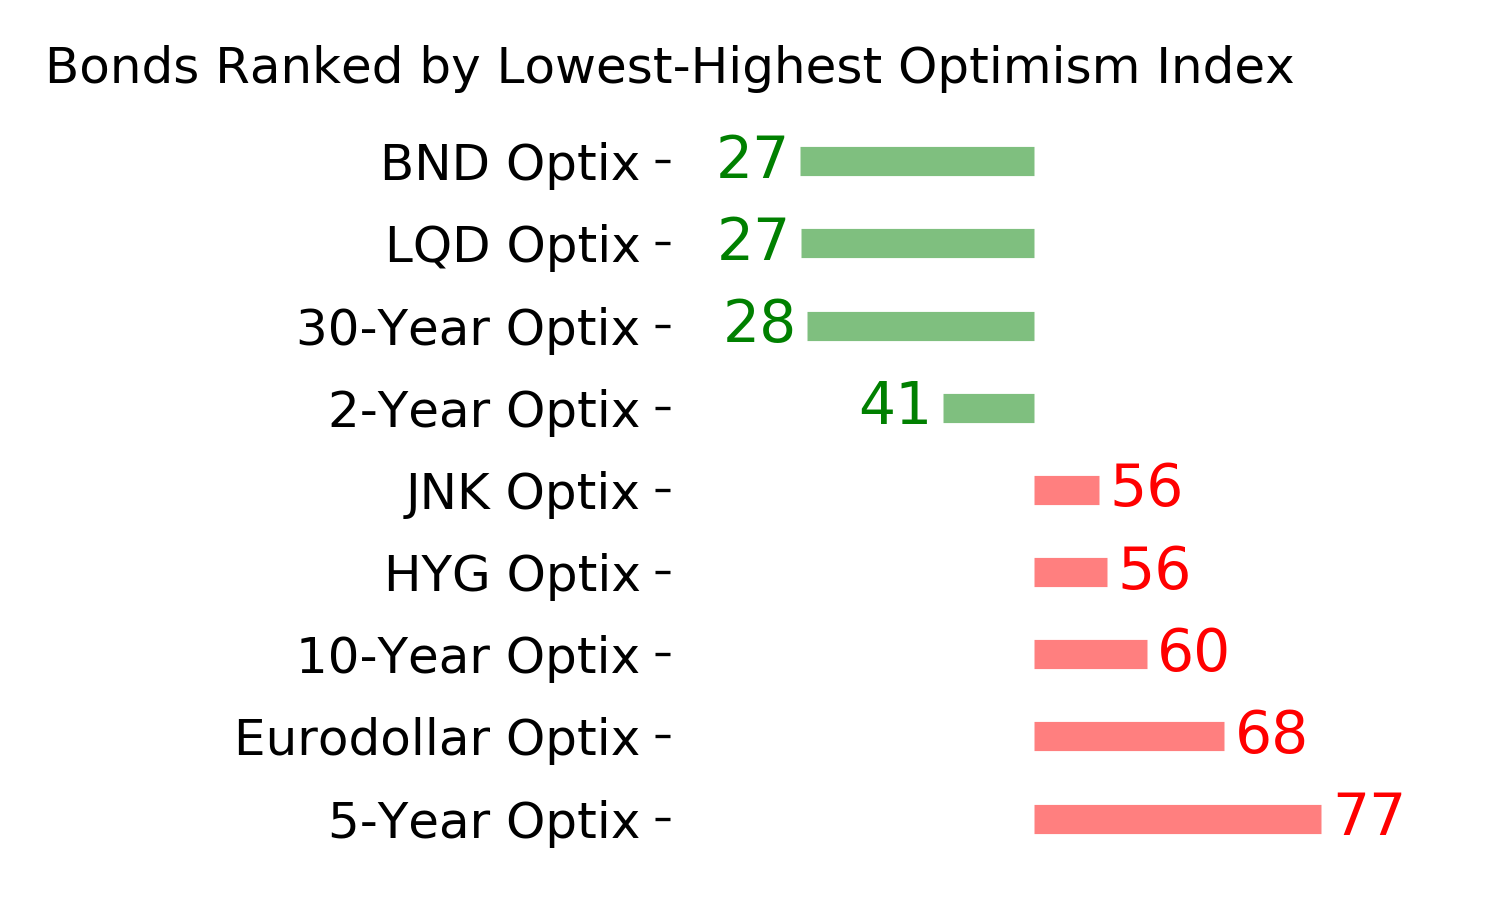
Various parts of the market have been hit in recent weeks, with mild oversold conditions. The Bond Optimism Index is now about as low as it gets during healthy bond market environments. Fixed income isn't responding well, so that needs to be monitored in case it's transitioning to a longer-term negative market environment. GOLD: Weak buy
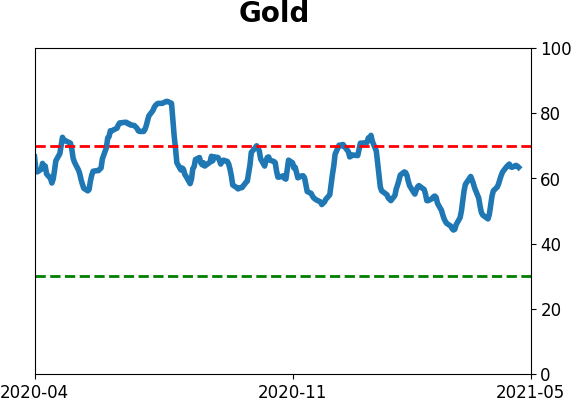
A dollar trying to rebound from a severe short position has weighed on gold and miners. The types of signals they've given in recent weeks, within the context of their recent surge, have usually resulted in higher prices over a medium- to long-term time frame. Like bonds, gold and miners aren't responding very well, and this needs to be monitored.
|
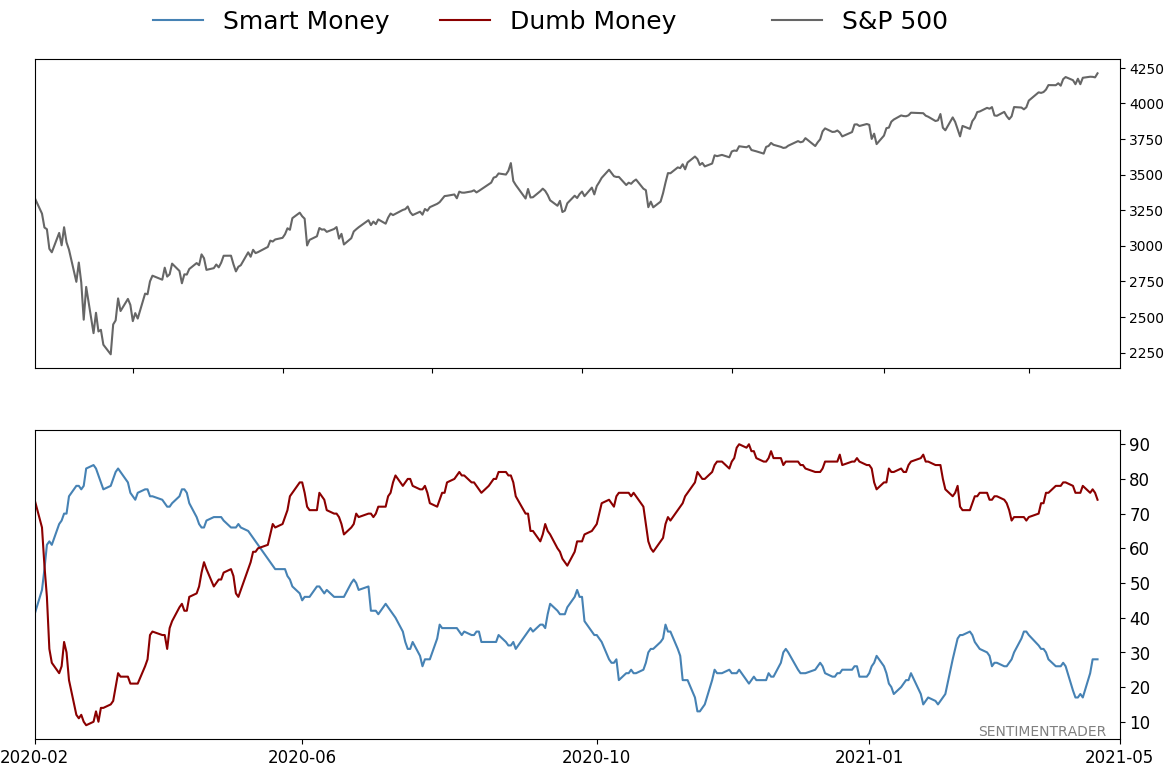
Smart / Dumb Money Confidence
|
Smart Money Confidence: 28%
Dumb Money Confidence: 74%
|
|
Risk Levels
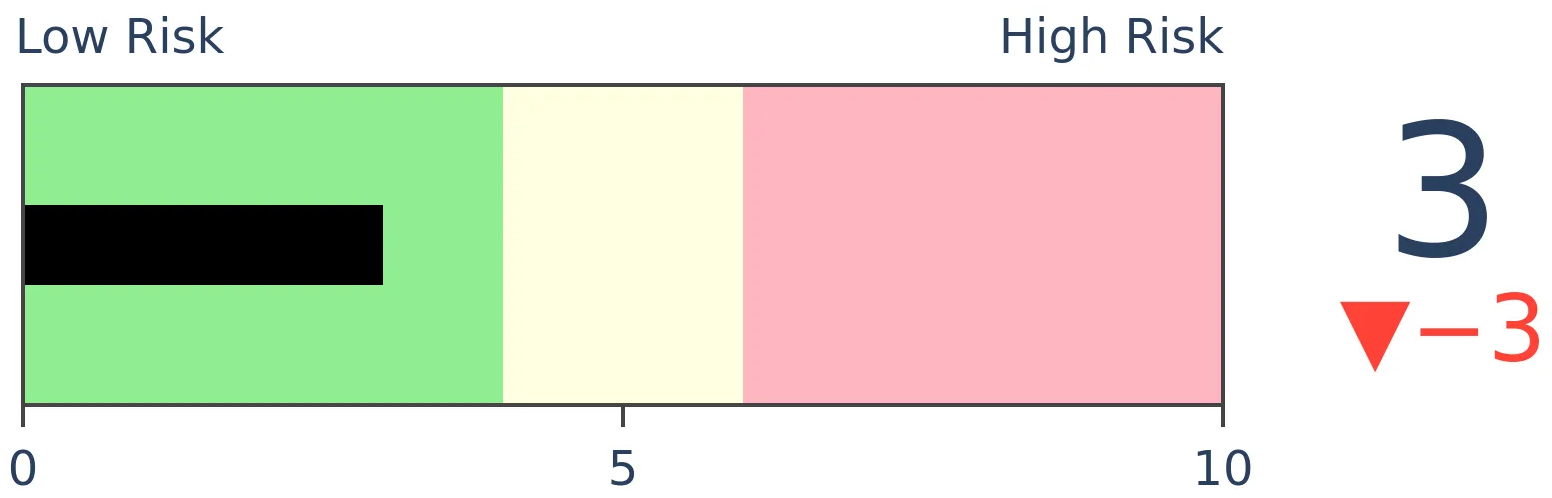
Stocks Short-Term
|
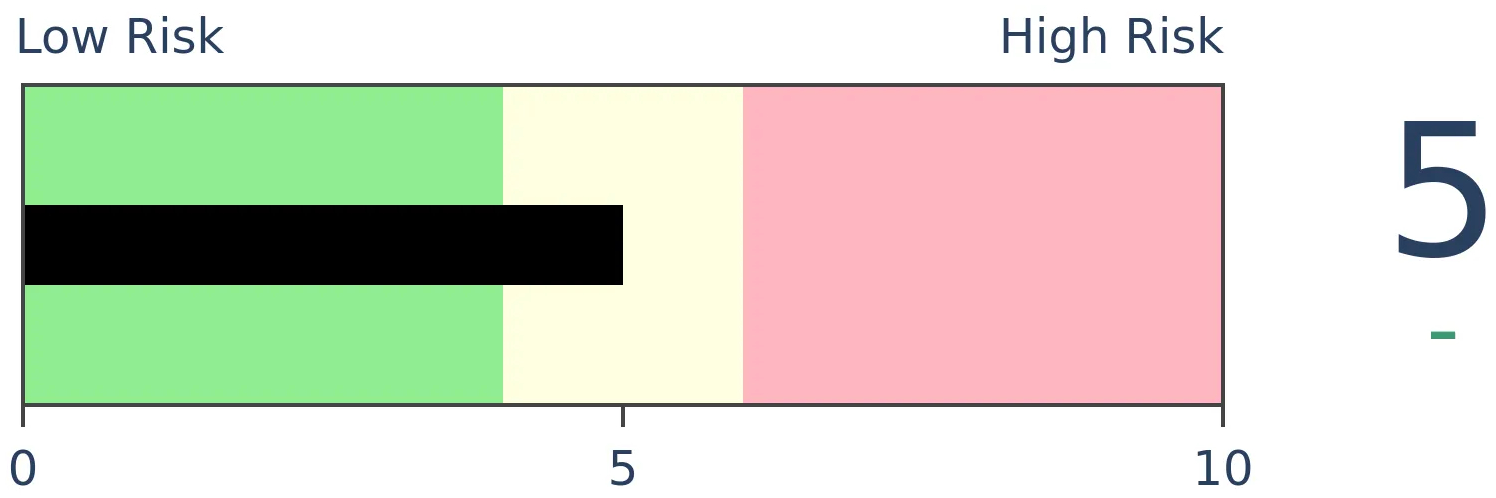
Stocks Medium-Term
|
|
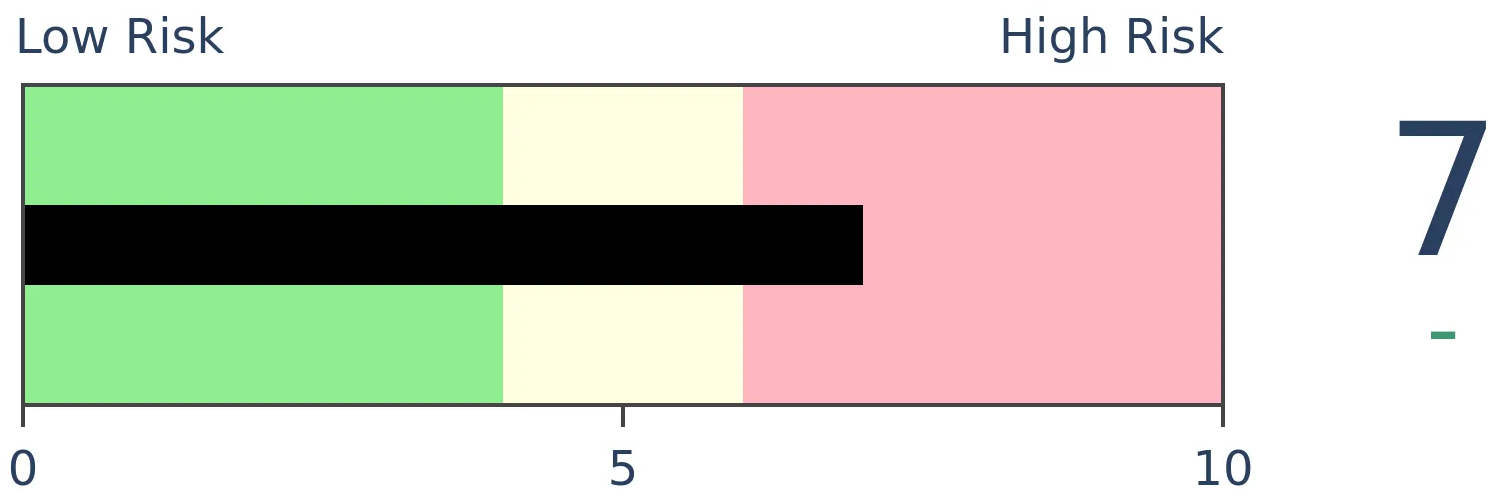
Bonds
|
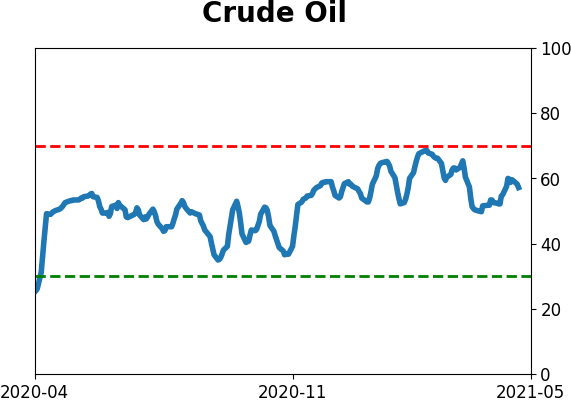
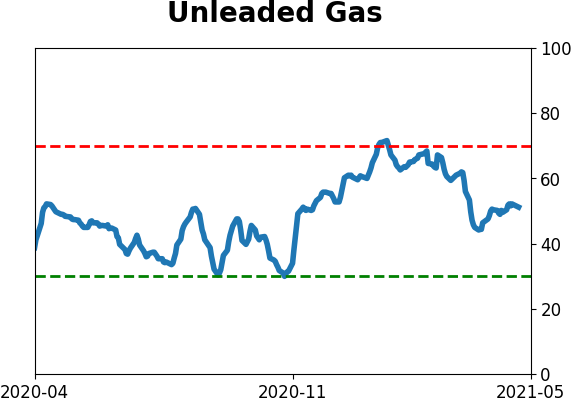
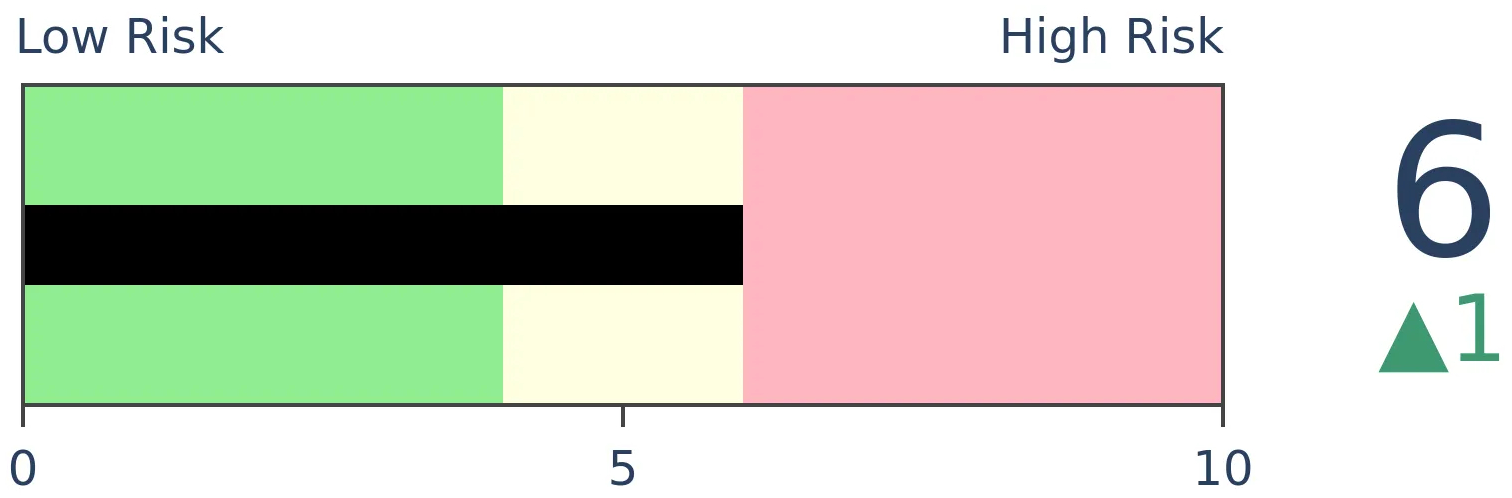
Crude Oil

|
|
Gold
|
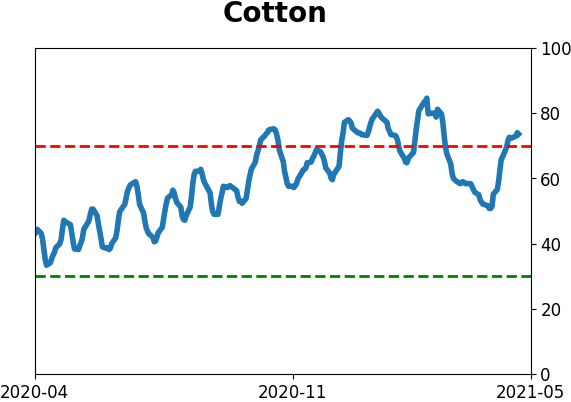
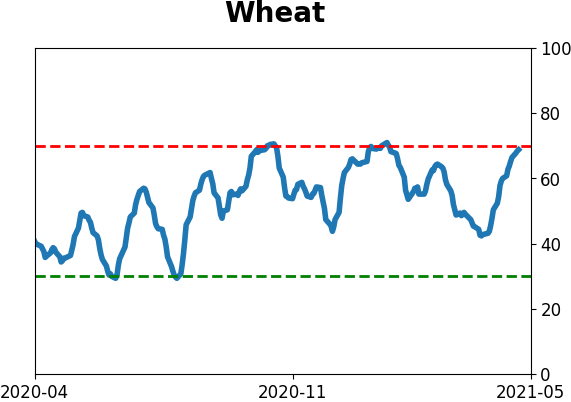
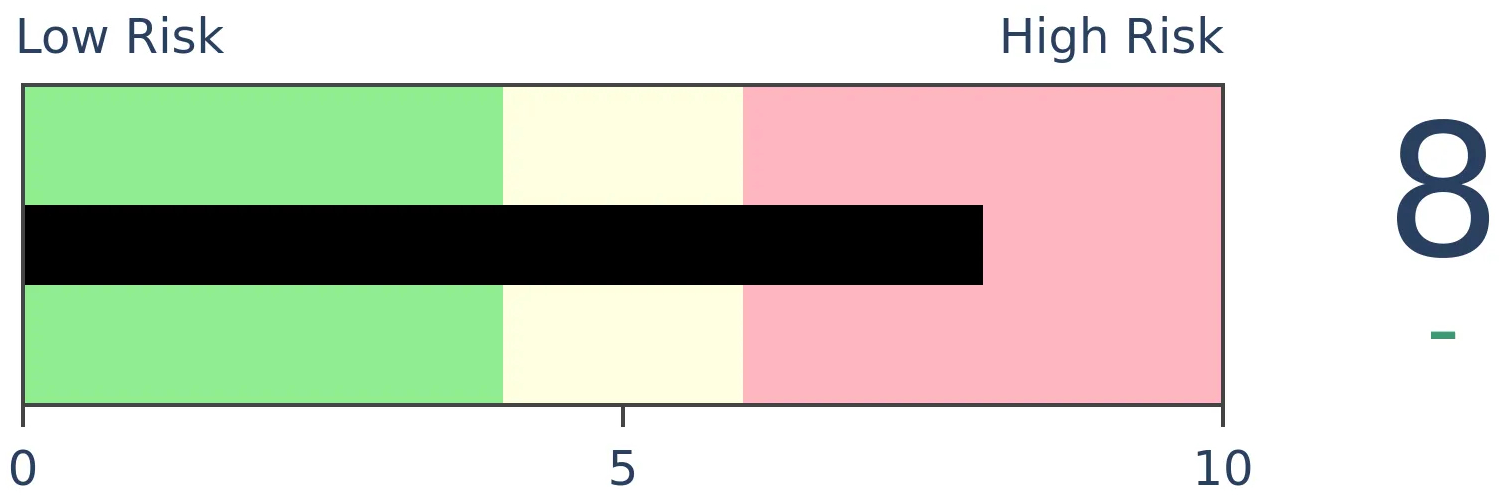
Agriculture
|
|
Research
BOTTOM LINE
In April, U.S. consumers became more confident in the economy, and also the stock market. There is a high correlation between past returns and current confidence, and when consumers get this confident, future returns were below average.
FORECAST / TIMEFRAME
None
|
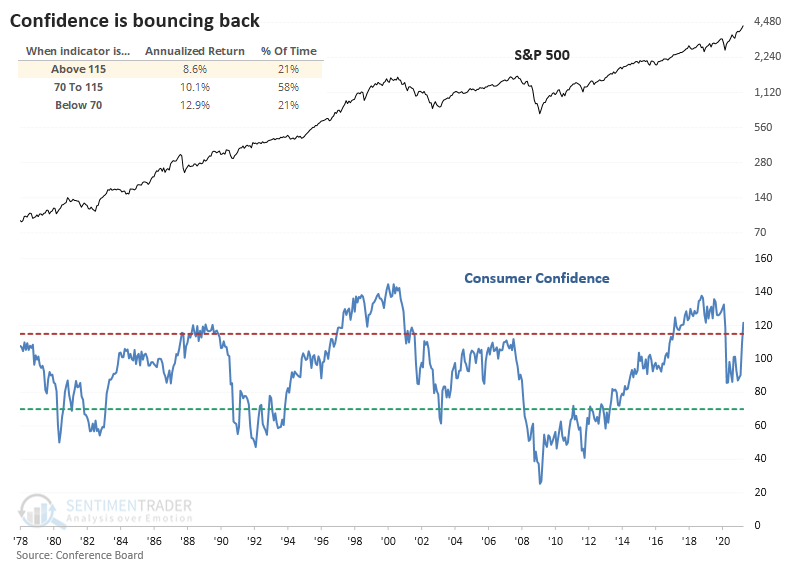
The latest survey of U.S. consumers by the Conference Board showed another massive spike in confidence. That continues a pattern; the past two months have seen confidence rise by more than 30% - this is the biggest jump in history.
Over the past 45 years, a reading above 115 has preceded an annualized return of +8.6% in the S&P 500. That's not bad, though it modestly trails when confidence was low or even neutral.
RISING STOCKS ARE A BIG REASON
Recent decades show that stocks are an increasingly important influence on confidence. So, a big part of rising confidence lately is due to a stock market that can't seem to go down.
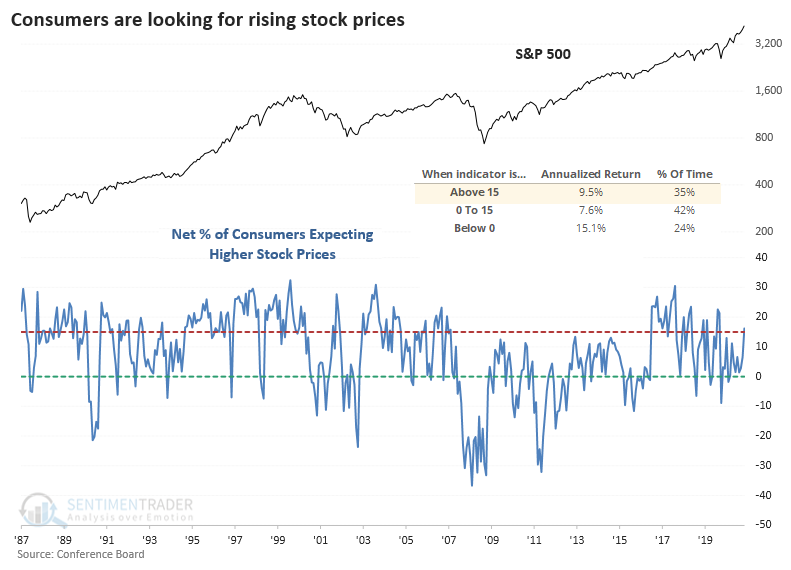
Not only has overall confidence increased, but there has been an increase in the percentage of consumers looking for even higher stock prices relative to those who think they might actually suffer the horror of declining.
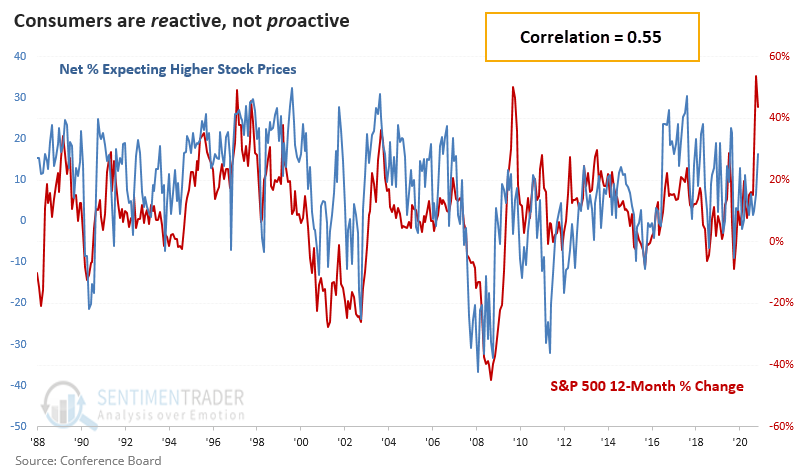
This particular survey hasn't been very effective at highlighting extremes in market sentiment, except for the downside when there is a sudden spike in those expecting stocks to drop even further. That's been a good signal to fade consumers and add to long positions.
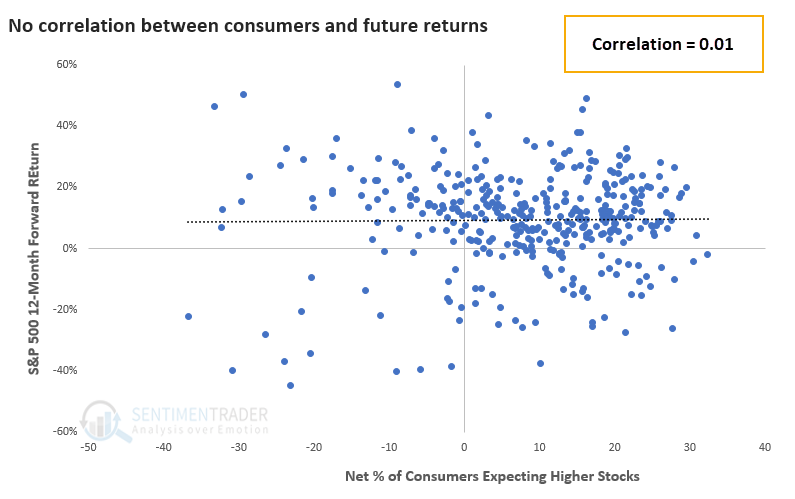
We can also see that in the scatter plot showing the net percentage of consumers expecting higher stock prices versus the S&P 500's actual 12-month forward return. There was essentially no correlation.
ANOTHER SURVEY SHOWS EVEN HIGHER CONFIDENCE
The University of Michigan does a similar survey with more granularity.
It takes some major chutzpah to be 100% confident that stocks will rally, and yet for the past two months, 13% of consumers were exactly that confident. That's just off the record of 14% of respondents who did not doubt stocks in 2019.
Over the past couple of months, a very high percentage of consumers are at least 75% confident that stocks will rally, versus a tiny percentage who are only 25% or less confident.
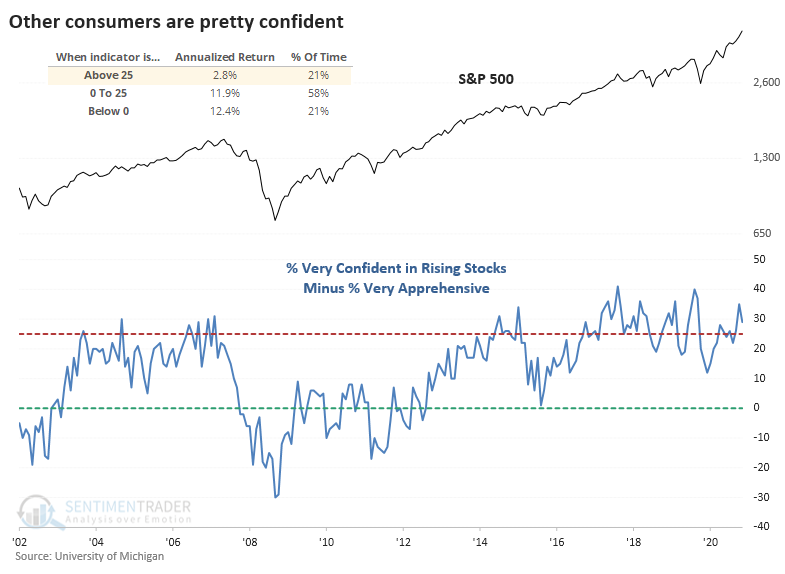
While there are only 20 years of history for this survey, the S&P's annualized return following extremes shows a solid contrary bias. When the net percentage of very confident versus very apprehensive consumers was above 25%, as it is now, the S&P showed a return of only 2.8%, versus +12.4% when there were more apprehensive than confident folks.
There isn't a strong edge in the latest consumer surveys related to the broad markets. Stocks tended to do okay after the high confidence that consumers have now, but those returns have been muted relative to other times.
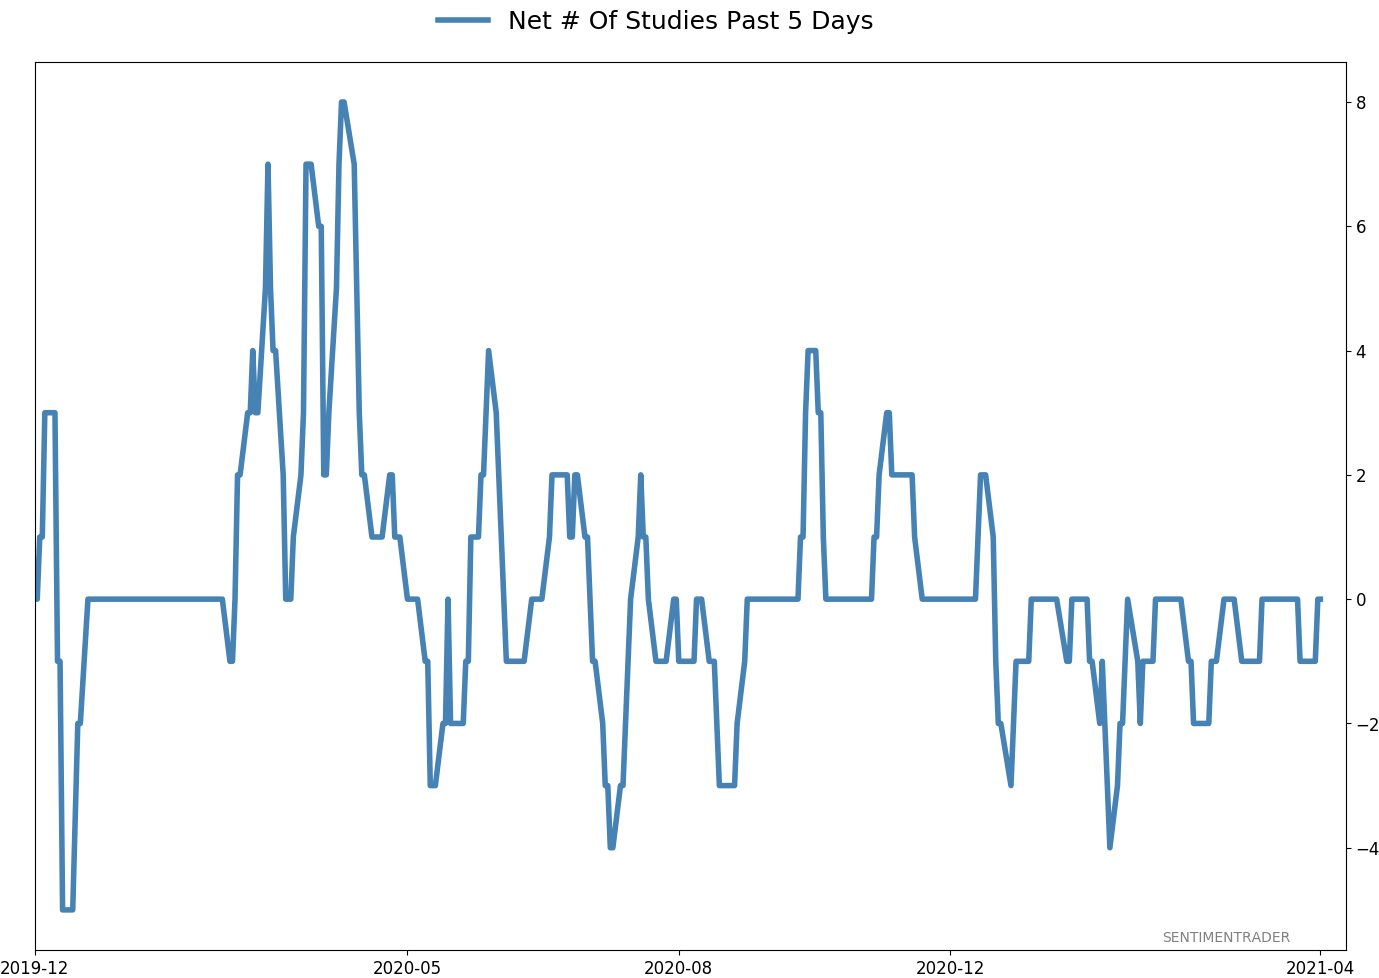
Active Studies
| Time Frame | Bullish | Bearish | | Short-Term | 0 | 0 | | Medium-Term | 0 | 11 | | Long-Term | 11 | 4 |
|
Indicators at Extremes
Portfolio
| Position | Description | Weight % | Added / Reduced | Date | | Stocks | RSP | 0.0 | Reduced 4.9% | 2021-04-22 | | Bonds | 30.0% BND, 8.8% SCHP | 37.9 | Added 15.1% | 2021-02-18 | | Commodities | GCC | 2.5 | Reduced 2.1%
| 2020-09-04 | | Precious Metals | GDX | 9.8 | Added 0.1% | 2021-02-18 | | Special Situations | 4.3% XLE, 2.2% PSCE | 6.5 | Reduced 5.6% | 2021-04-22 | | Cash | | 43.3 | | |
|
Updates (Changes made today are underlined)
I've made no adjustments for months, as the situation remained essentially stuck - energy was doing what it should, sentiment in the broader market was ridiculously stretched but with no major warning signs, and sentiment toward gold and bonds appeared overdone on the pessimistic side. Those conditions have started to reverse a bit, so I further reduced my risk. There are still no major warning signs, but I'm getting increasingly uncomfortable and would prefer to sit safely in cash and wait for better risk/reward opportunities. RETURN YTD: 7.1% 2020: 8.1%, 2019: 12.6%, 2018: 0.6%, 2017: 3.8%, 2016: 17.1%, 2015: 9.2%, 2014: 14.5%, 2013: 2.2%, 2012: 10.8%, 2011: 16.5%, 2010: 15.3%, 2009: 23.9%, 2008: 16.2%, 2007: 7.8%
|
|
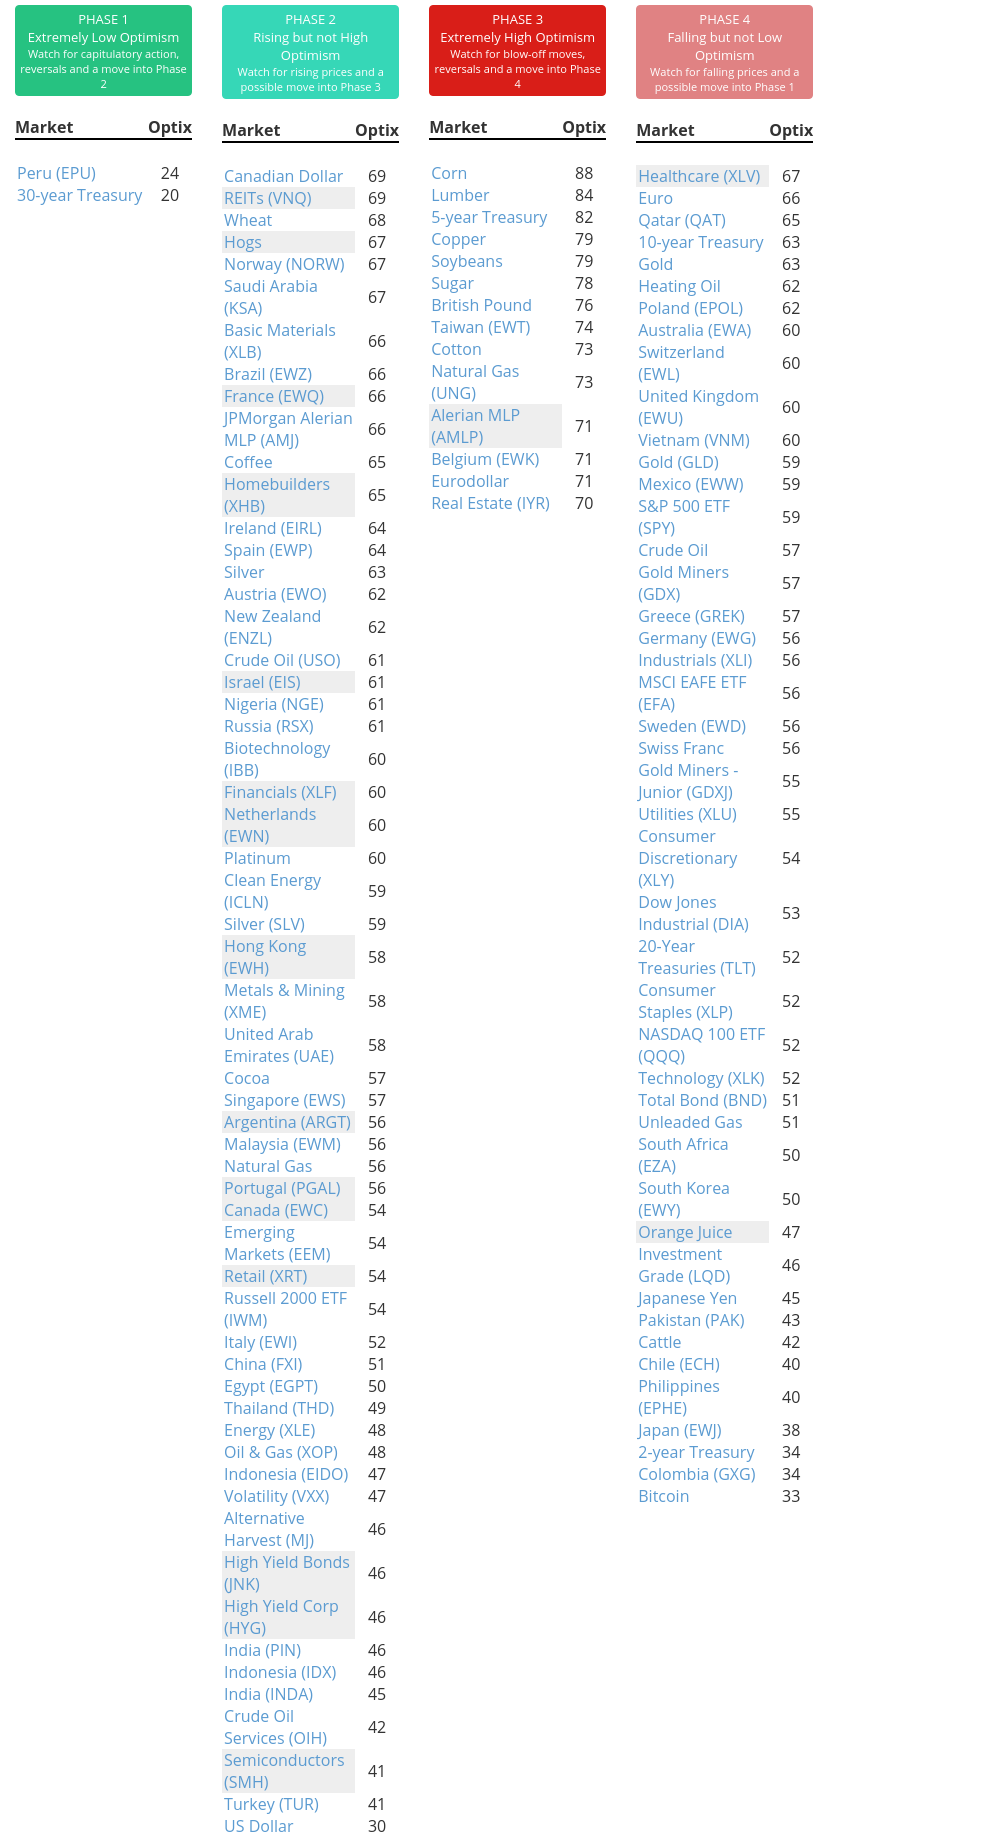
Phase Table
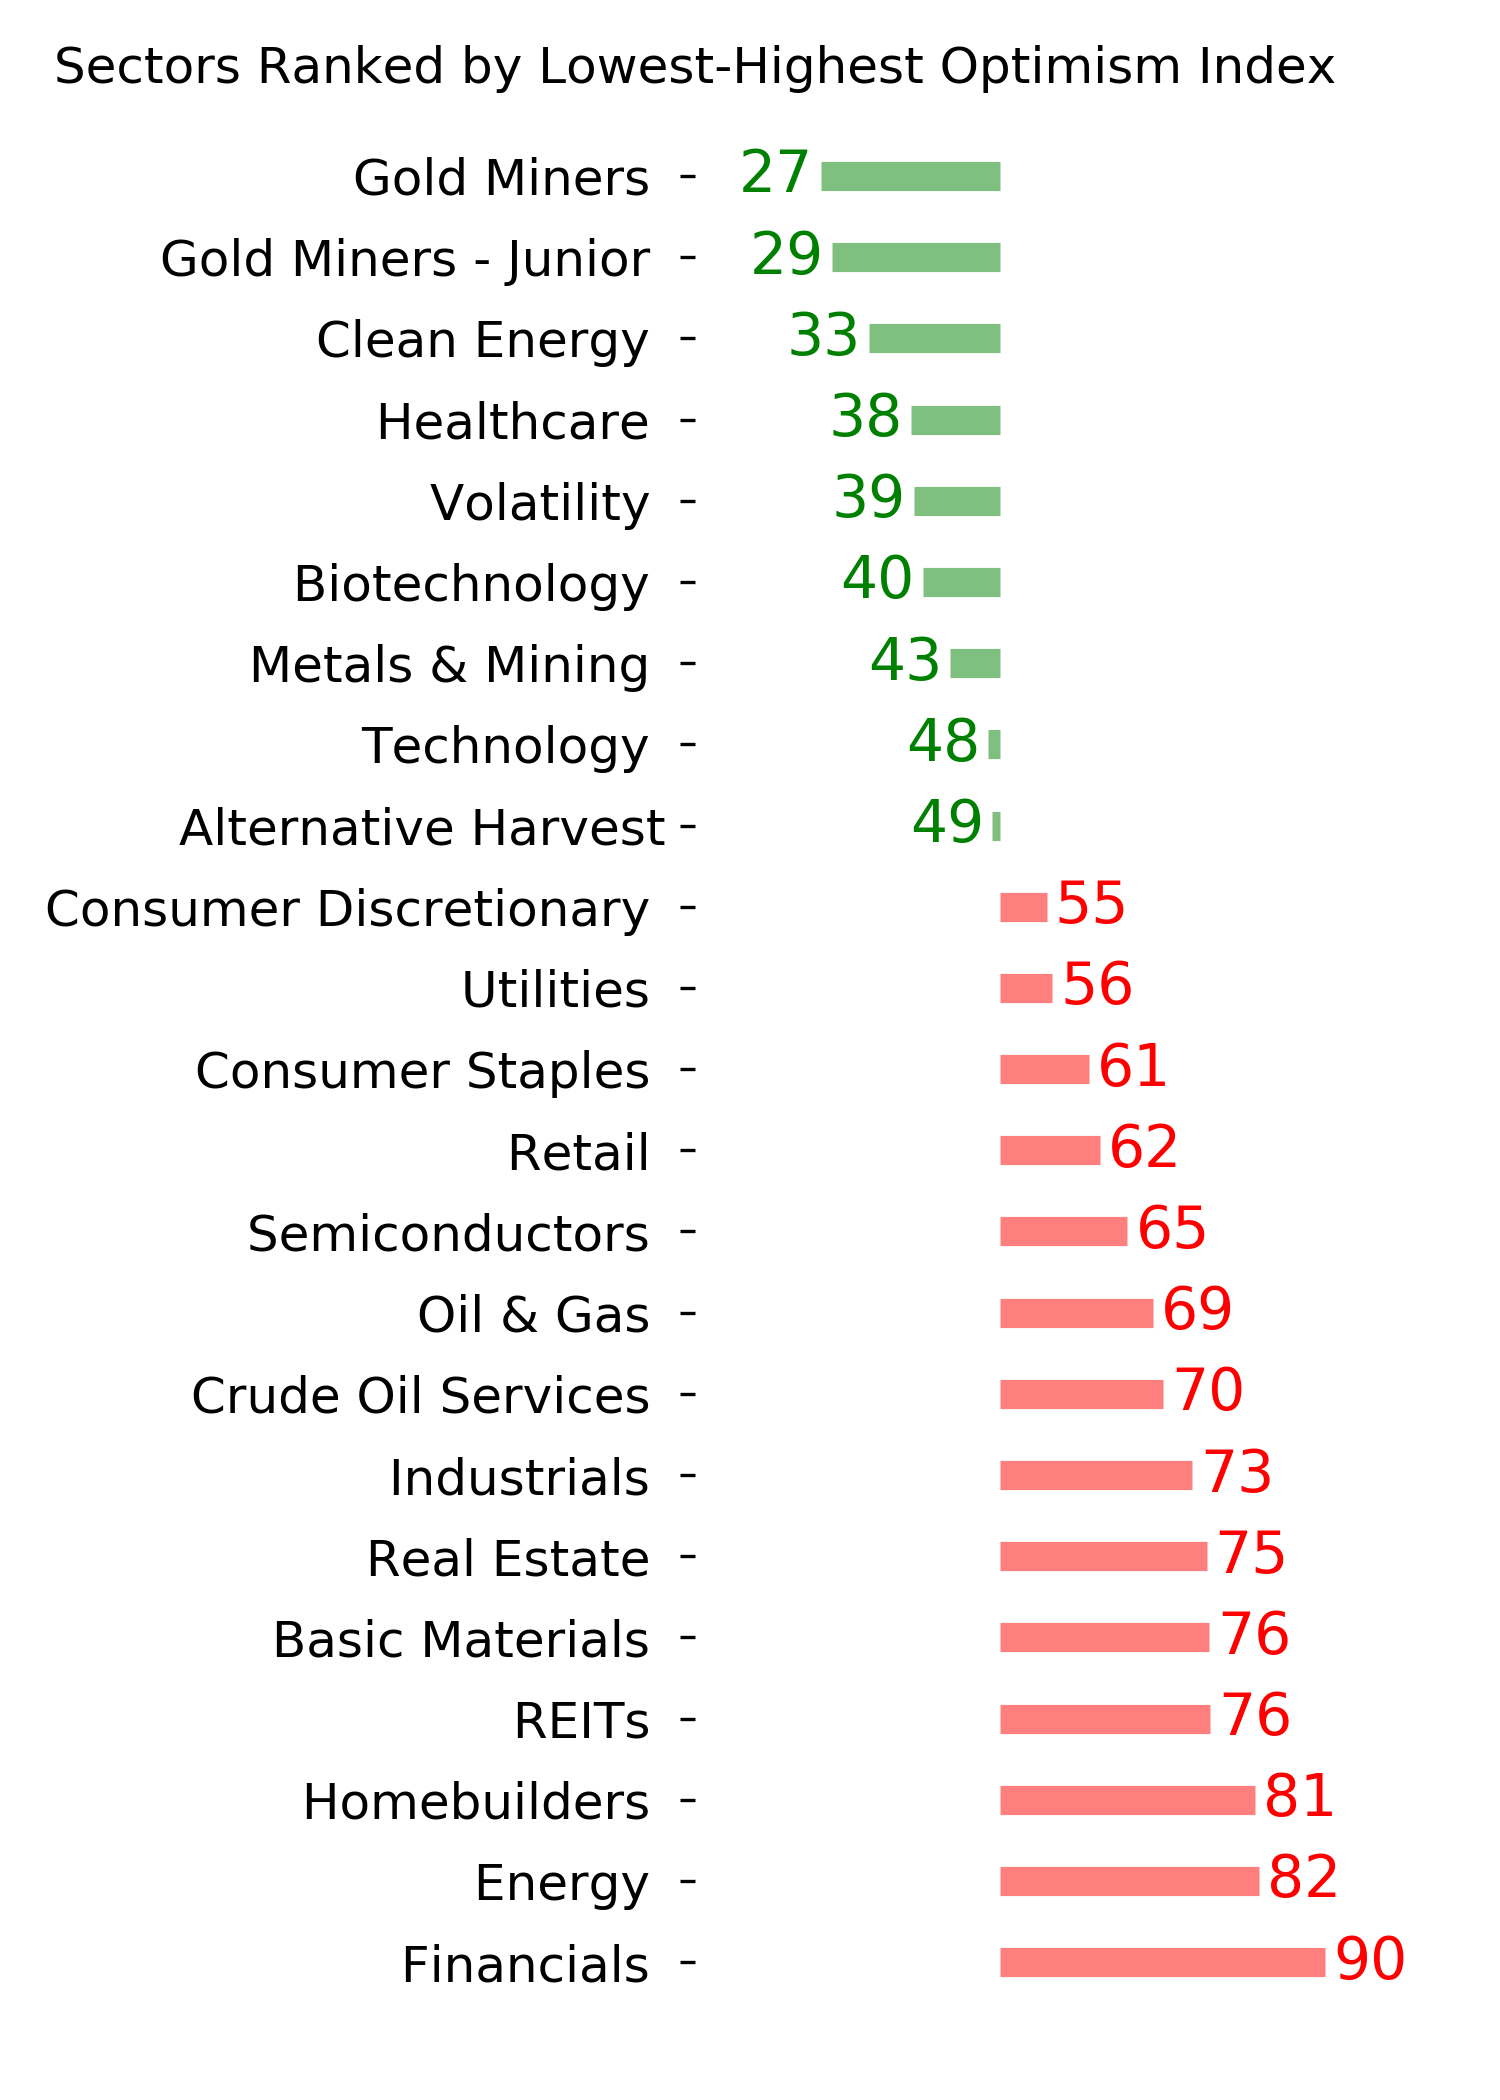
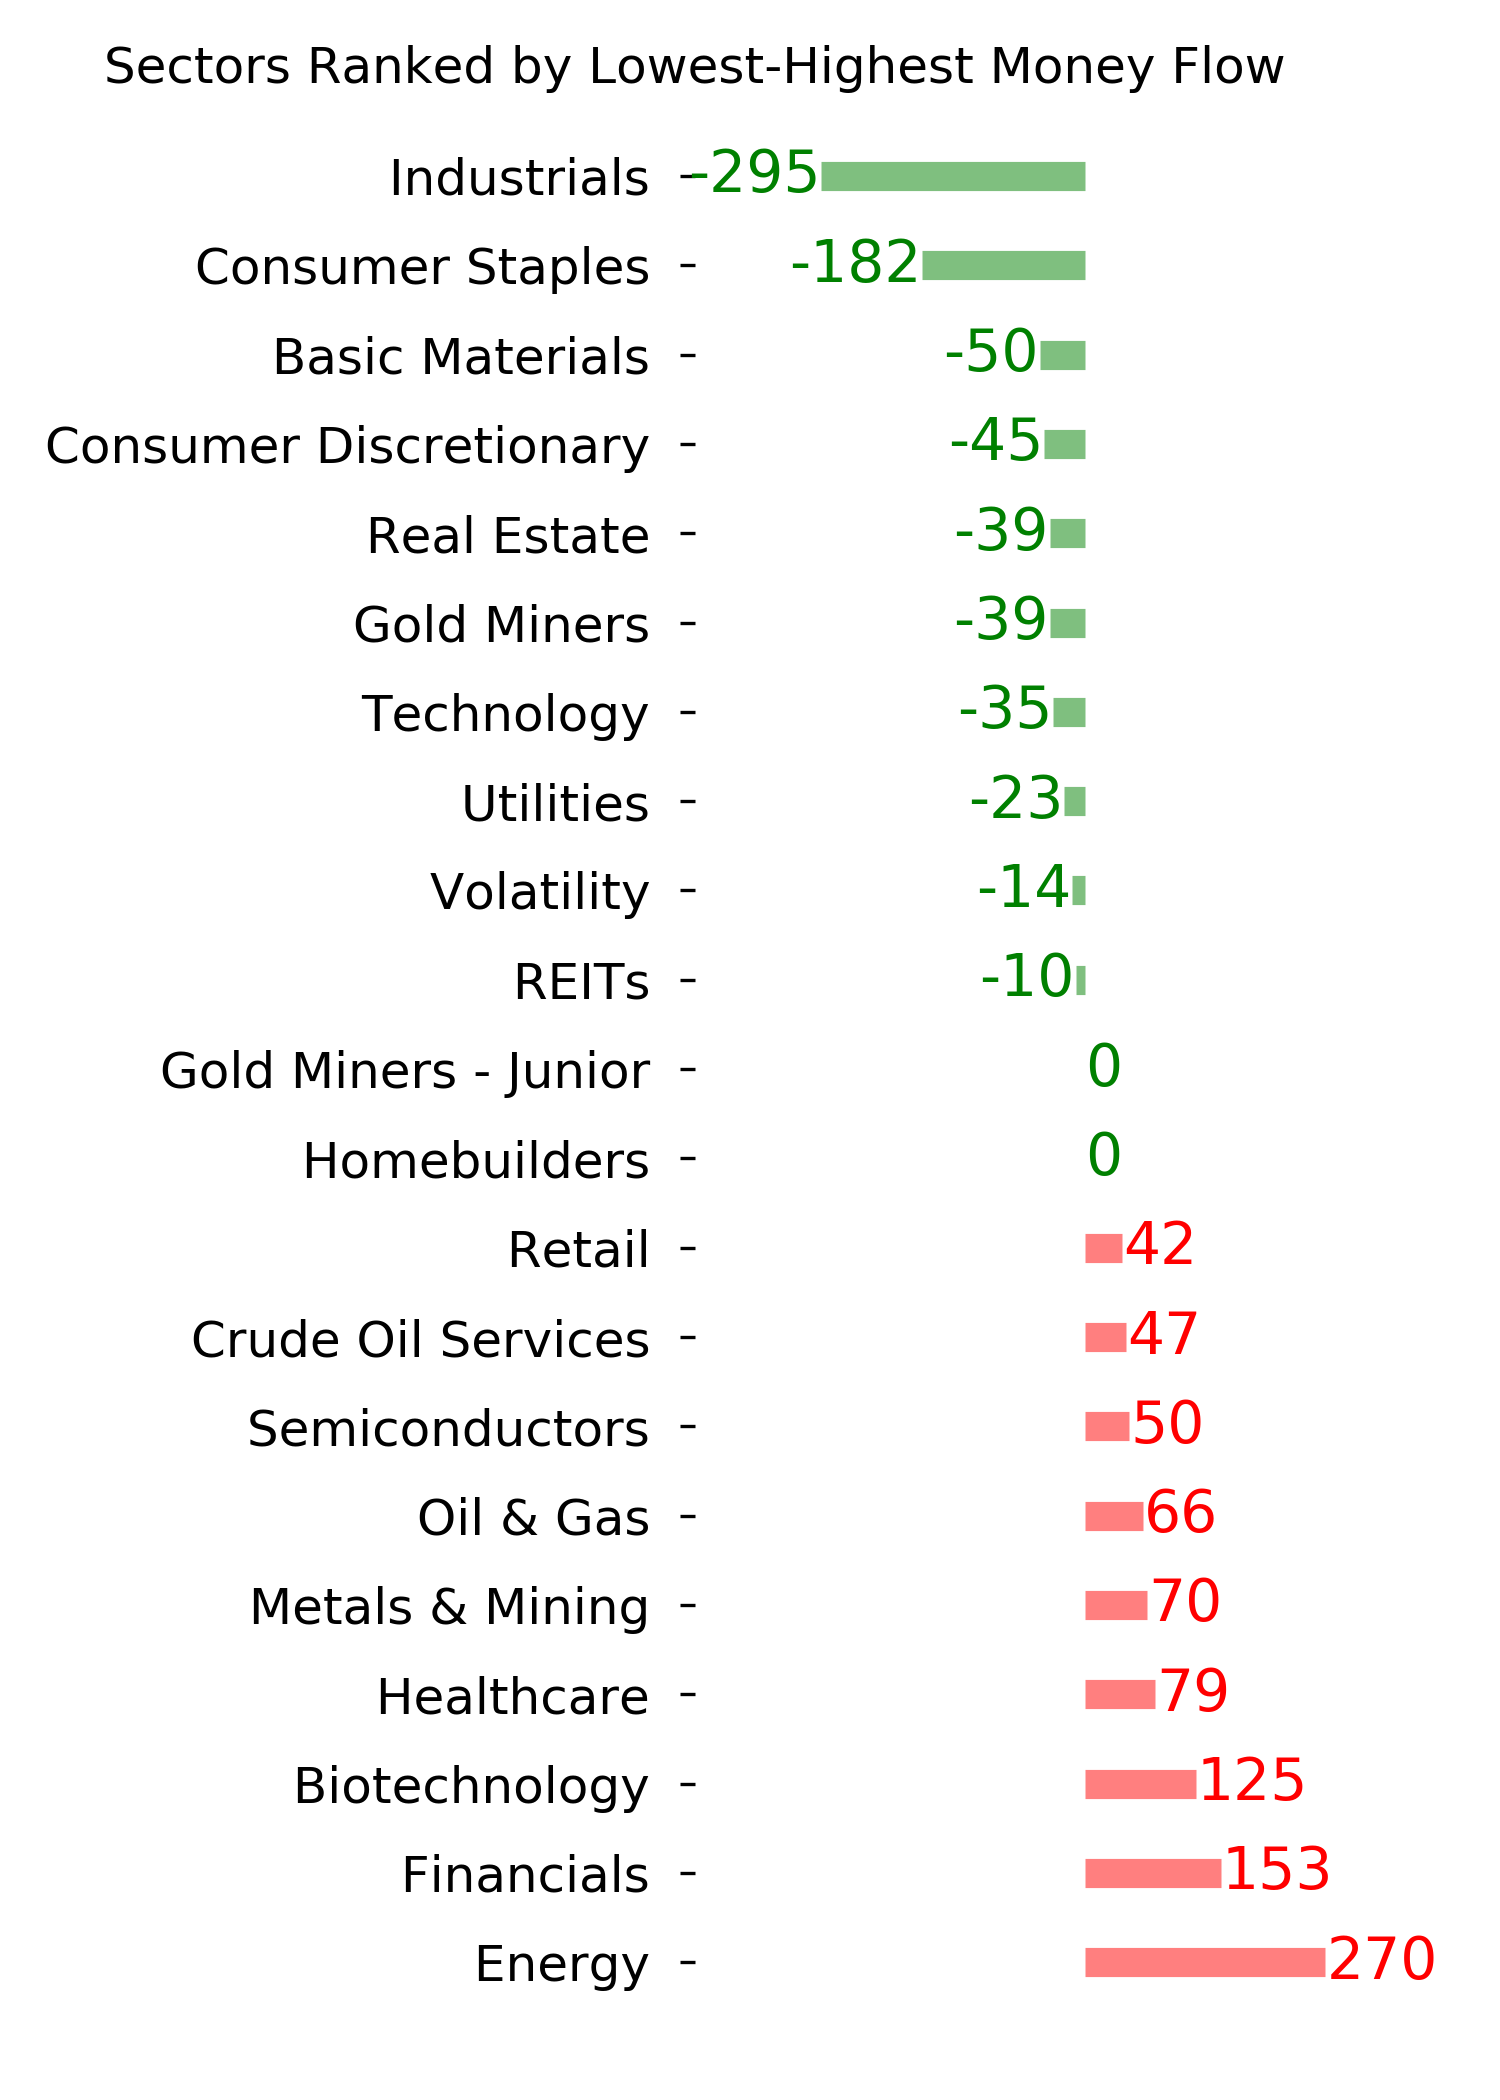
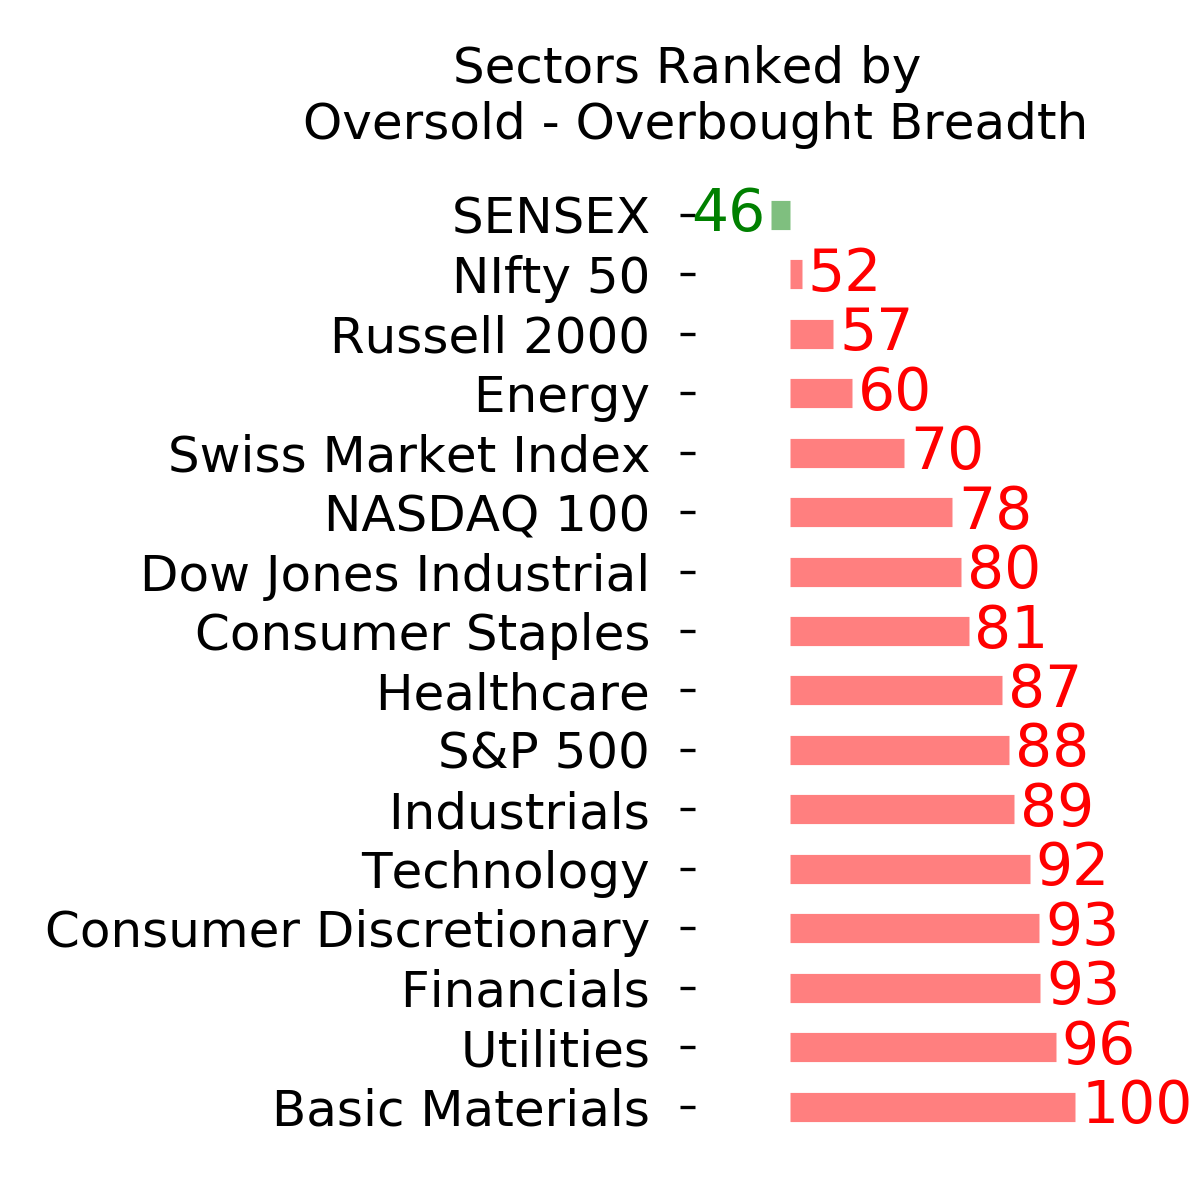
Ranks
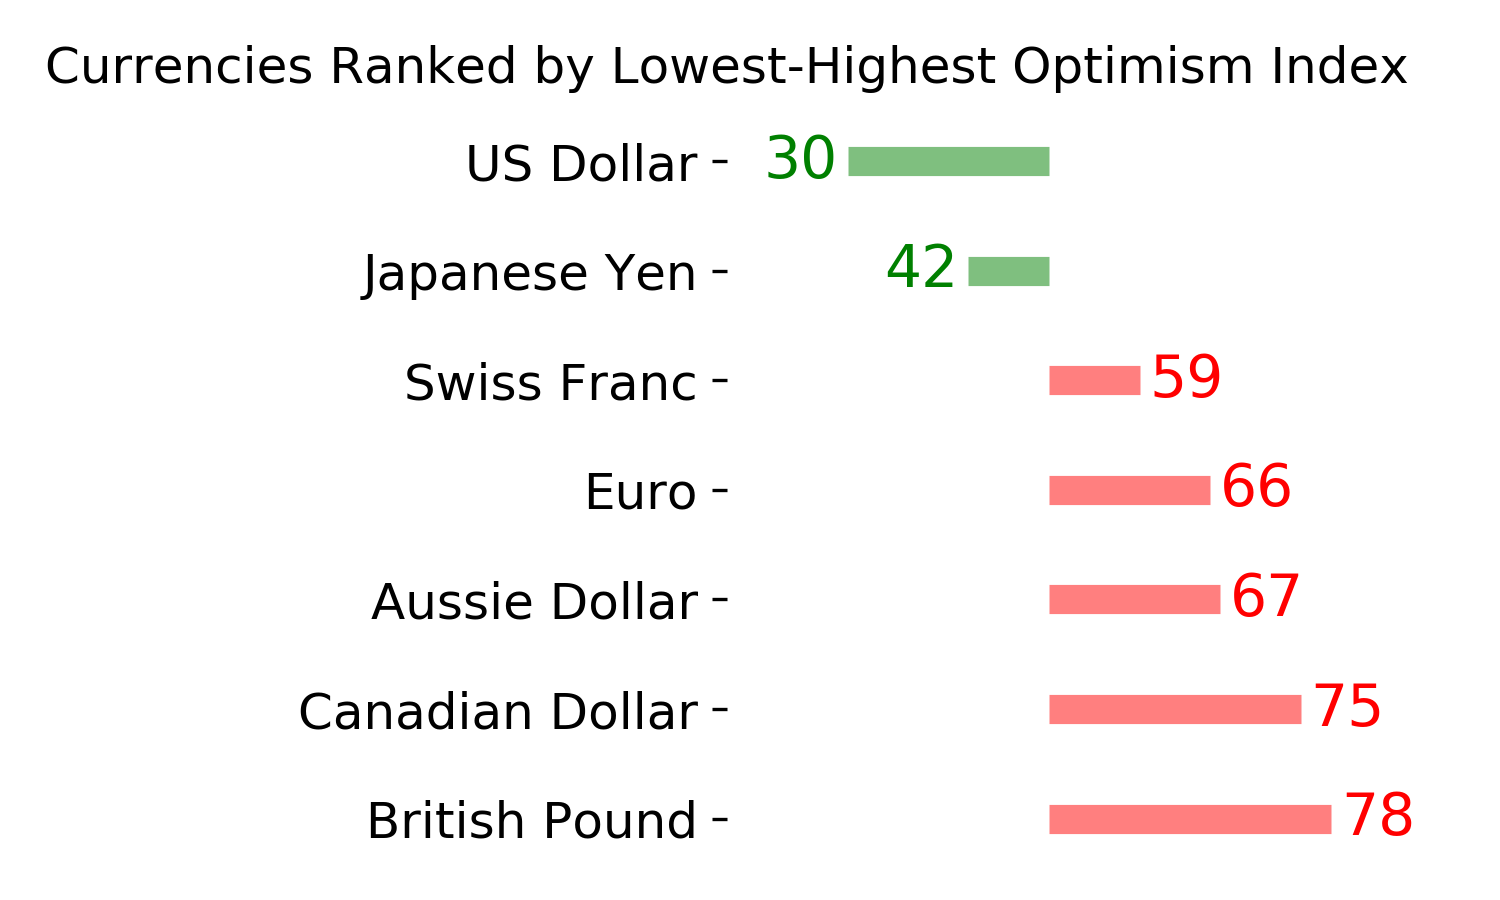
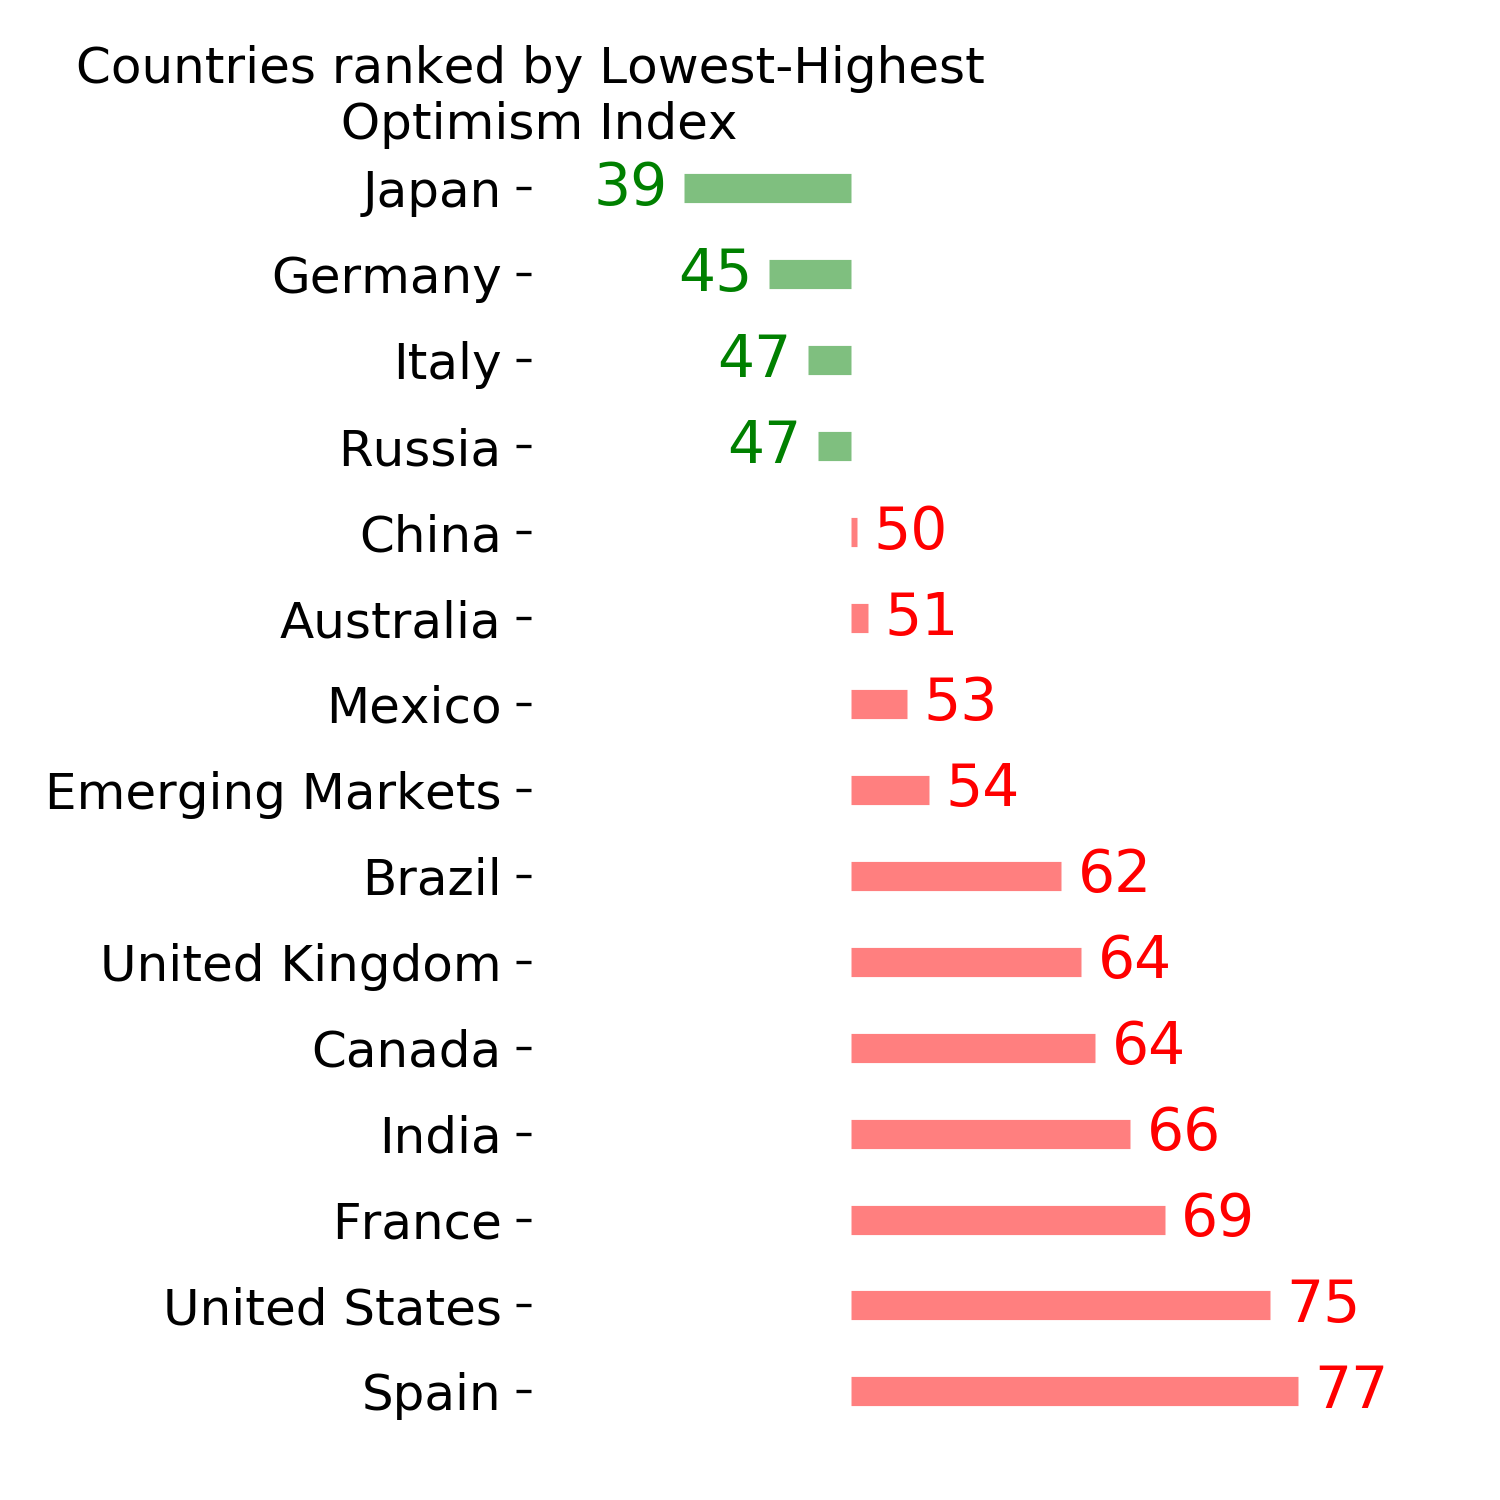
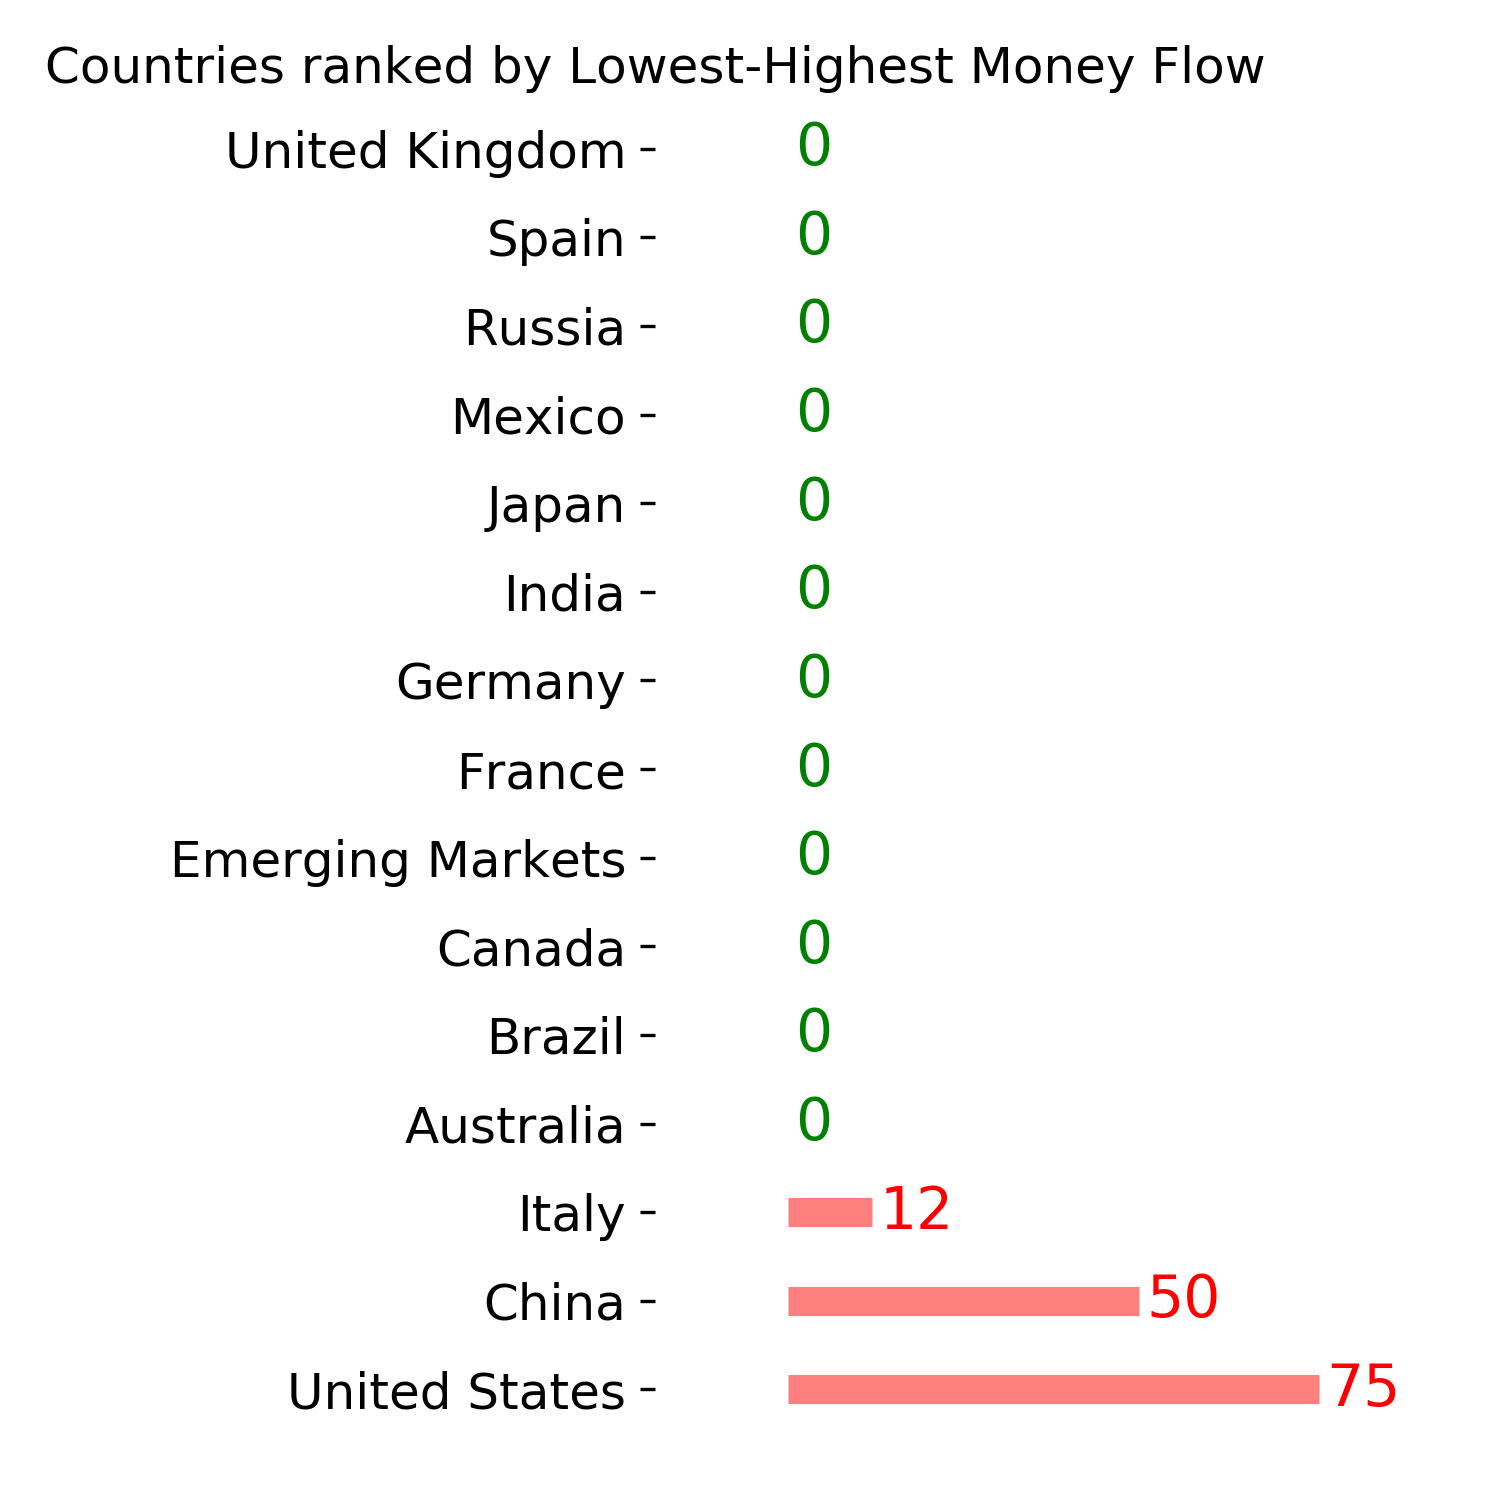
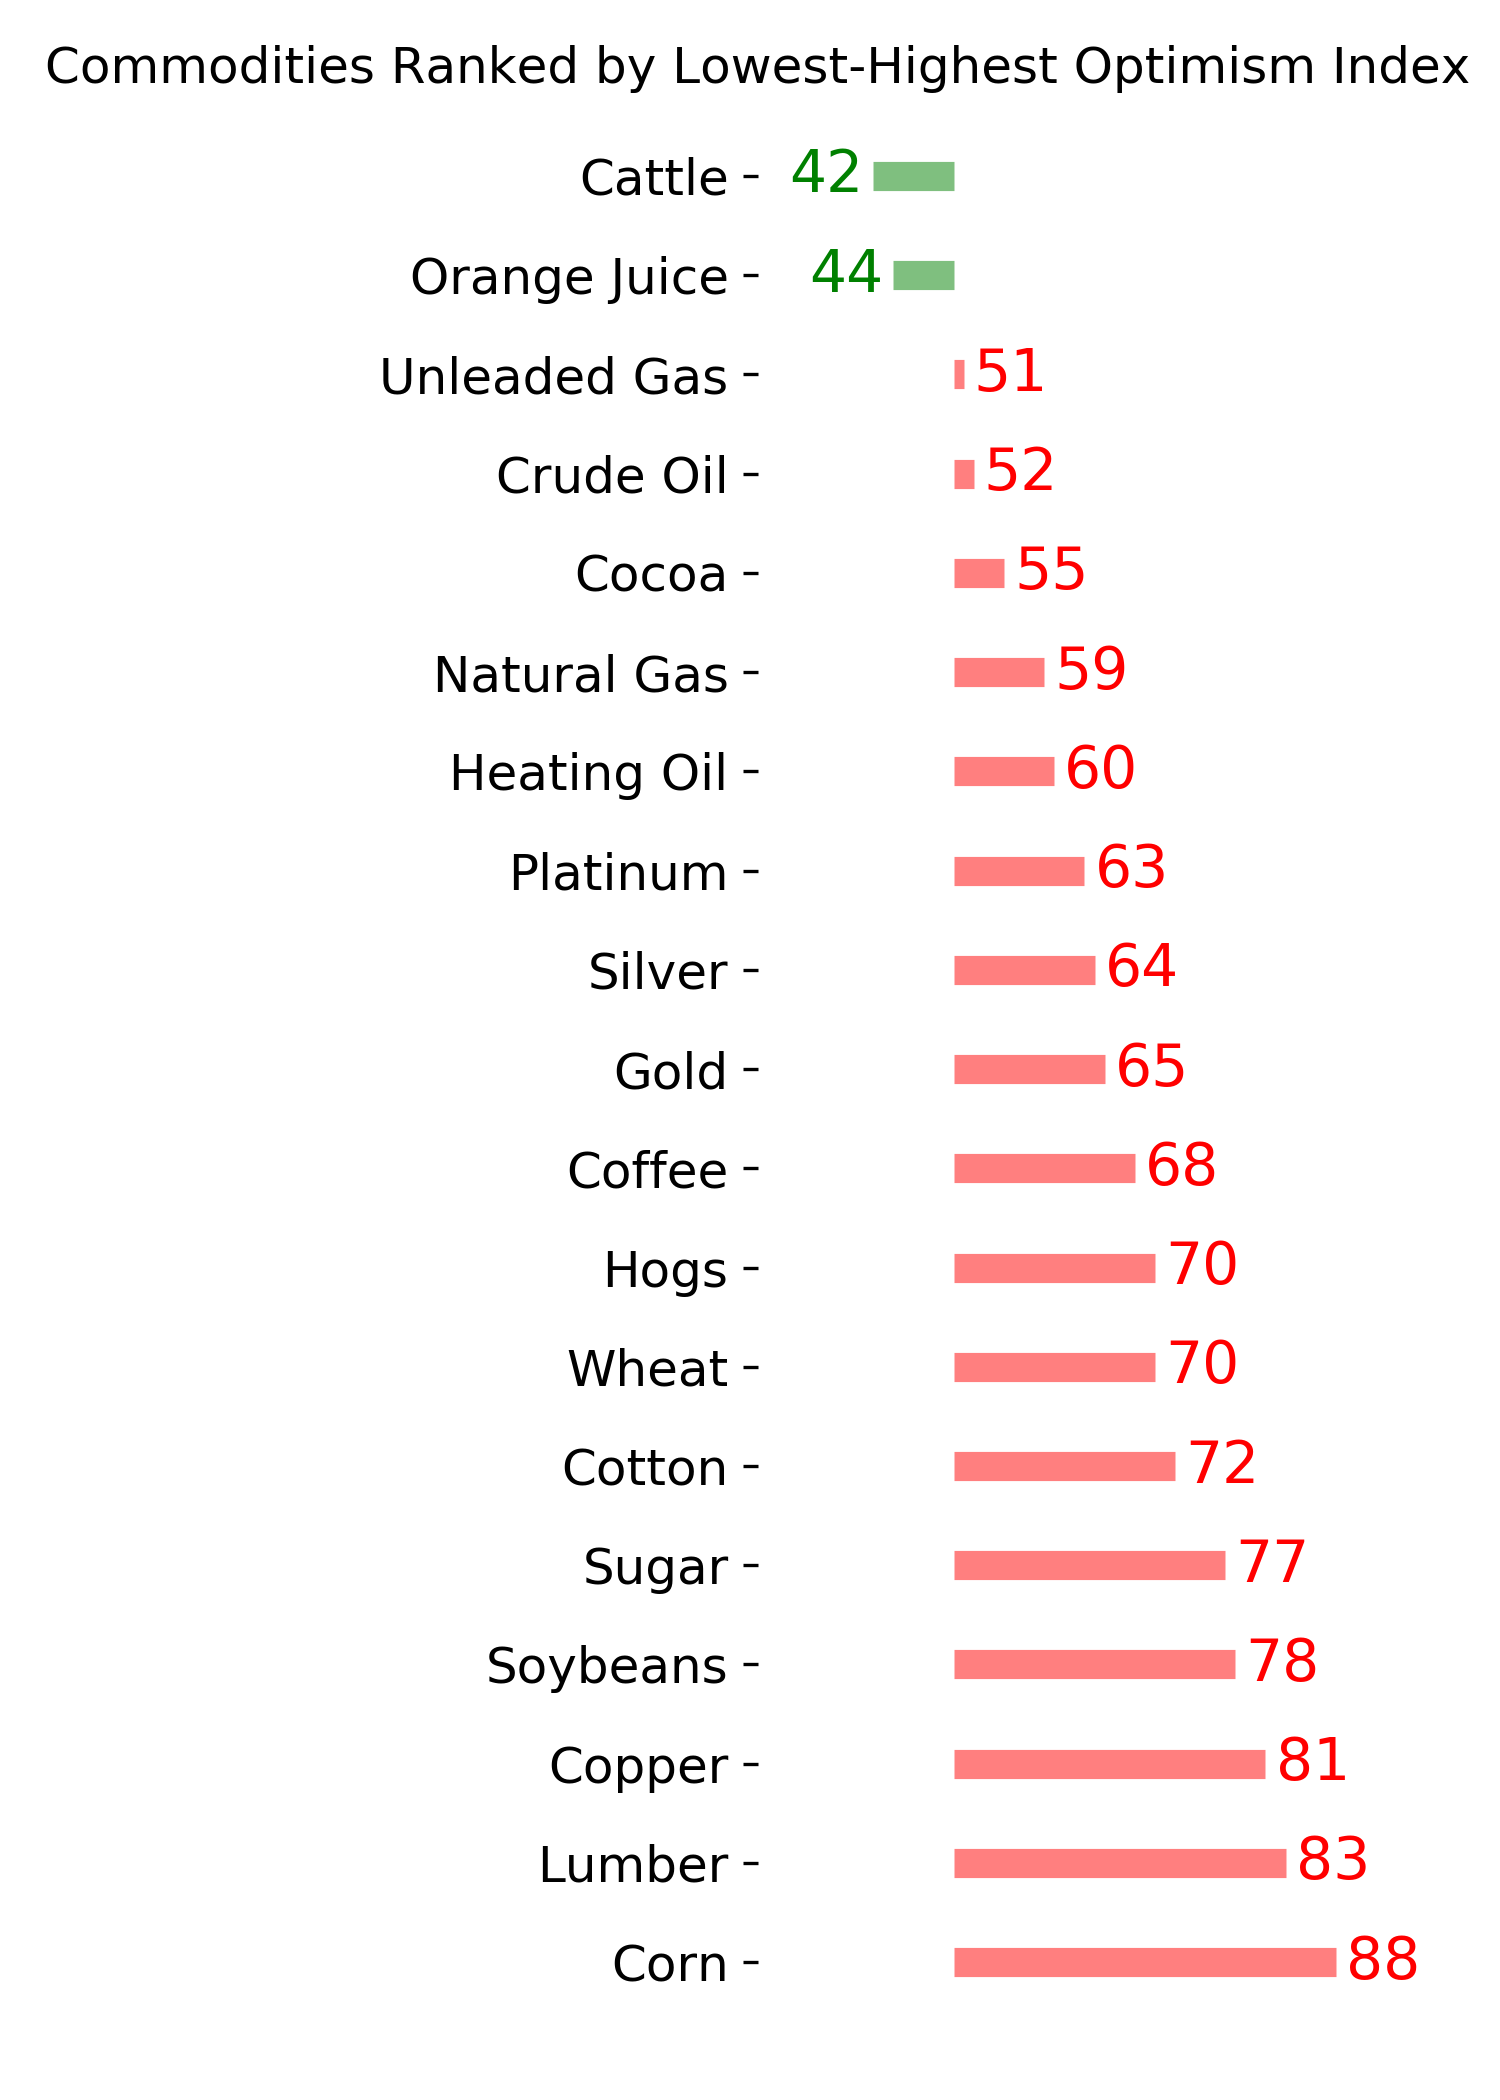
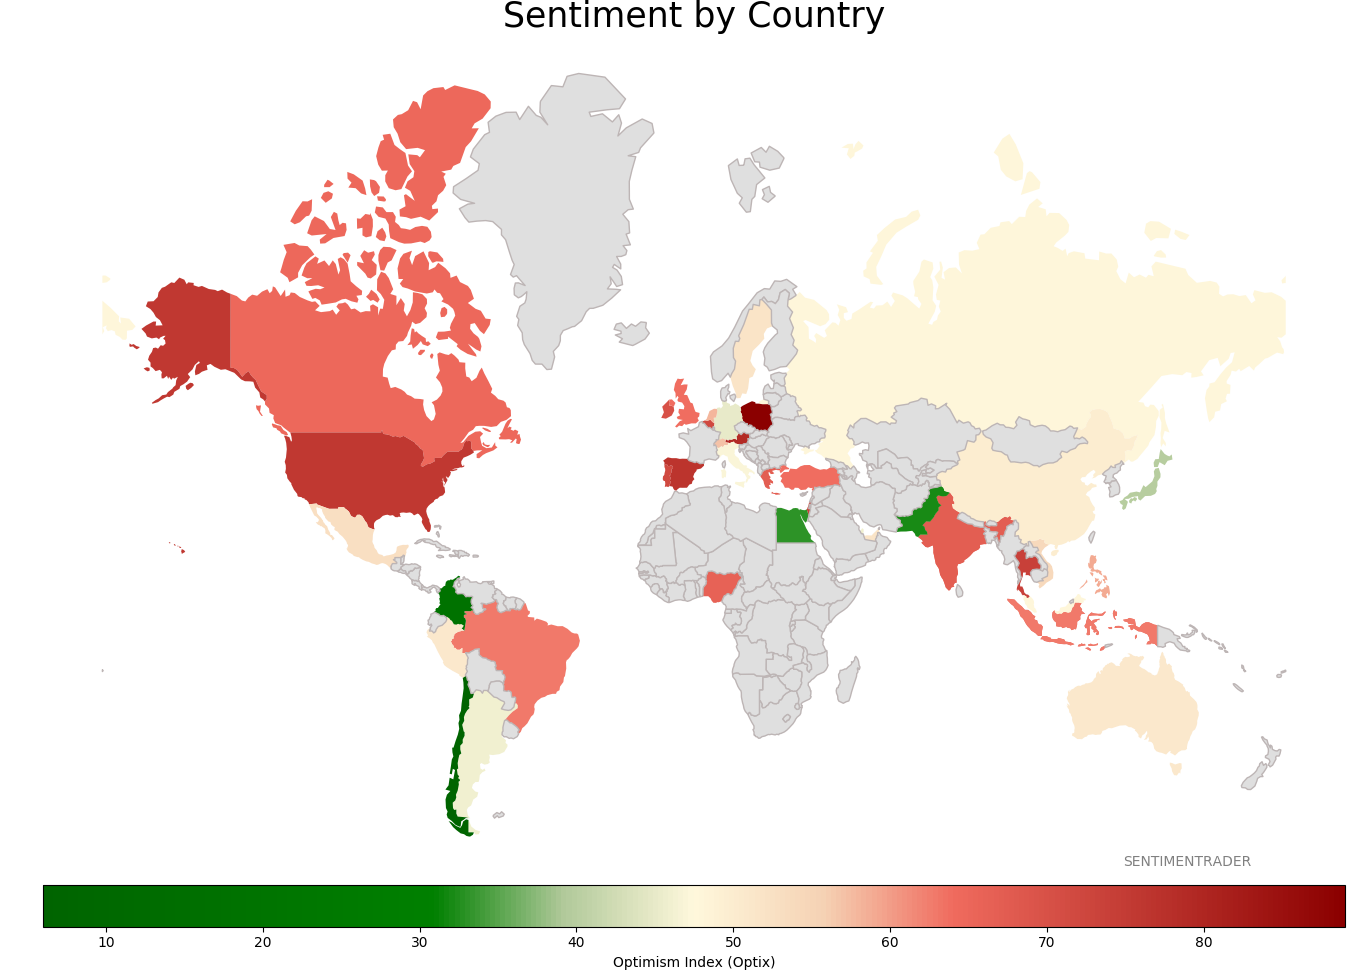
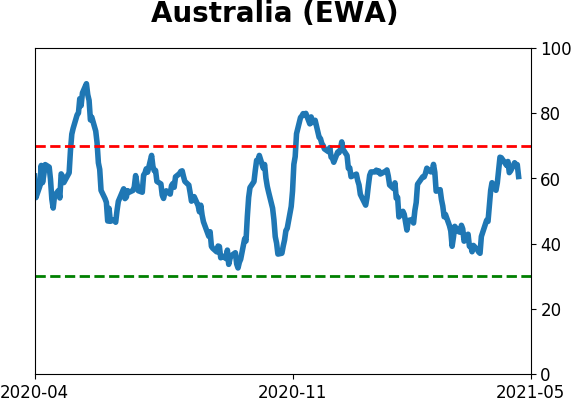
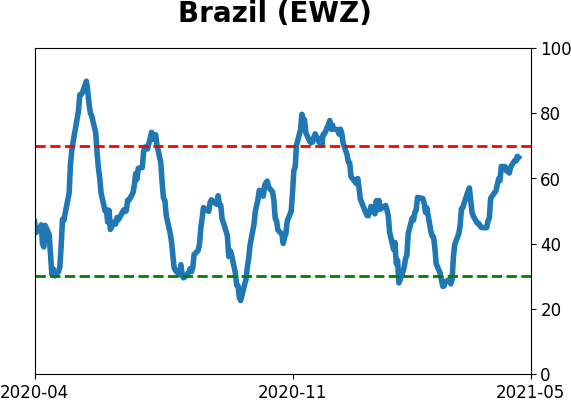
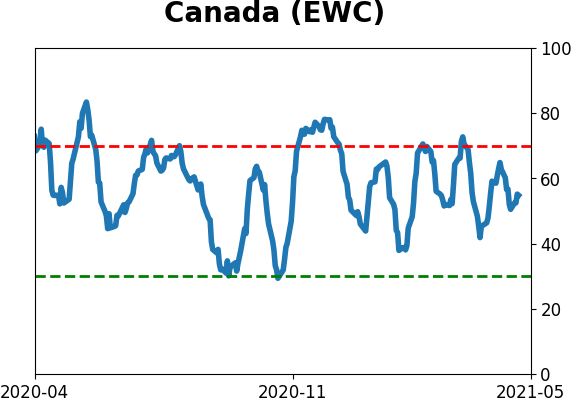
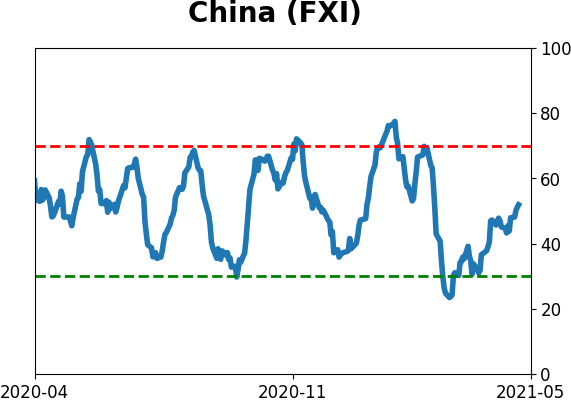
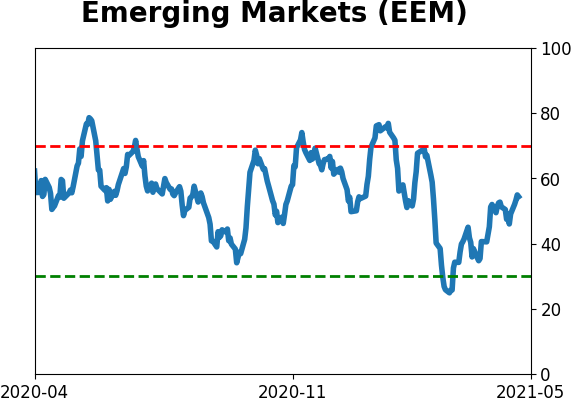
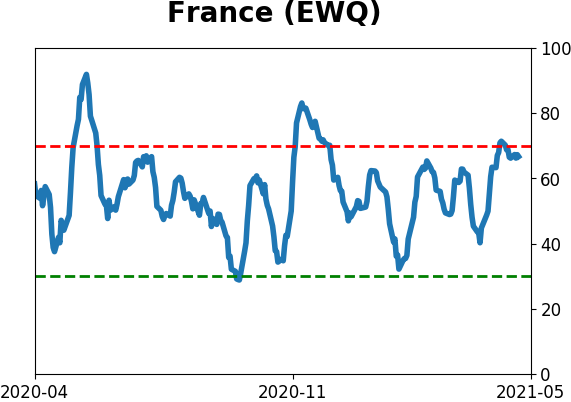
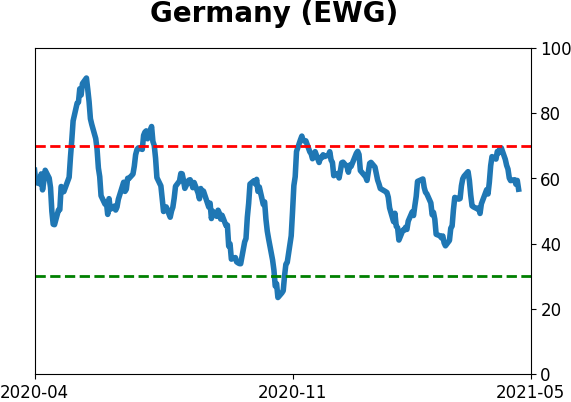
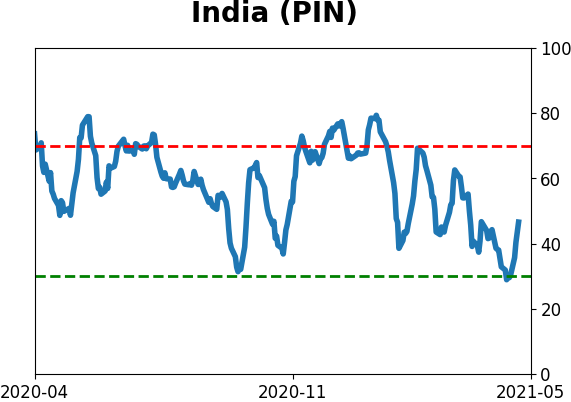
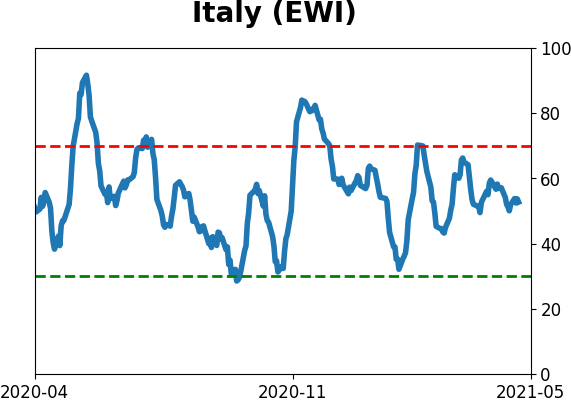
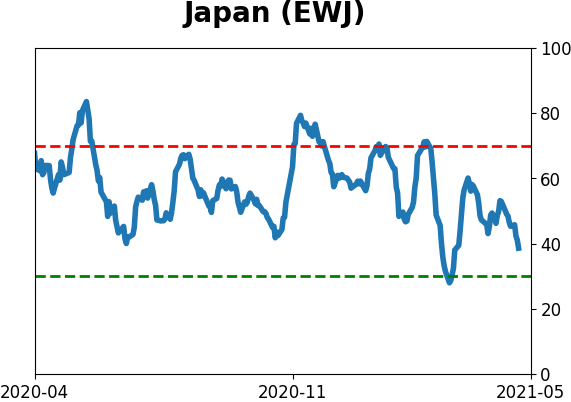
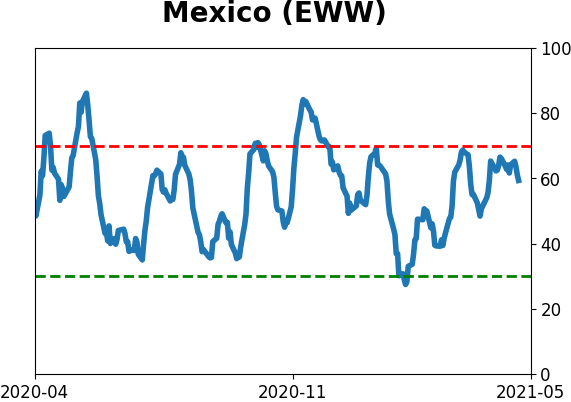
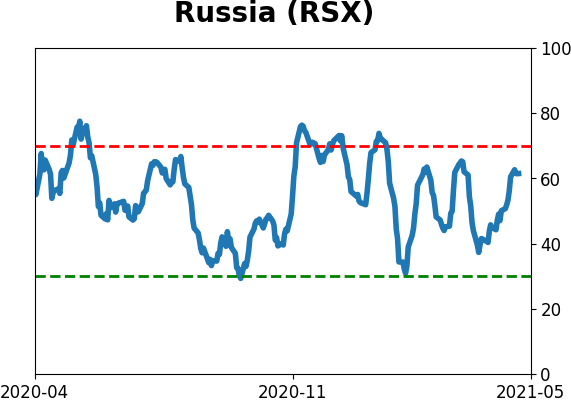
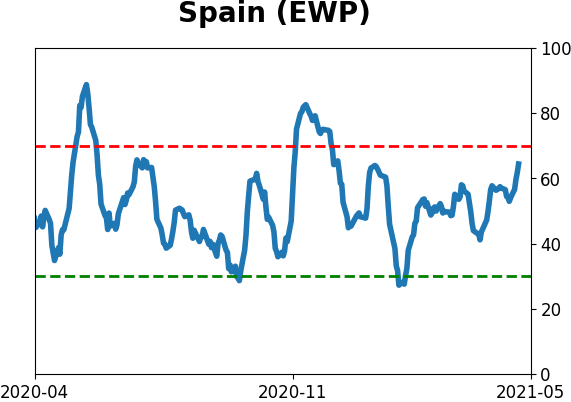
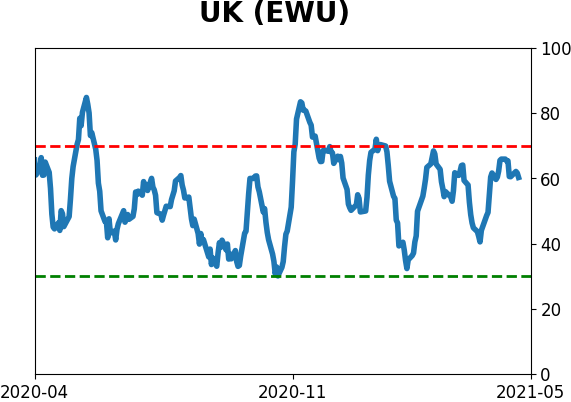
Sentiment Around The World
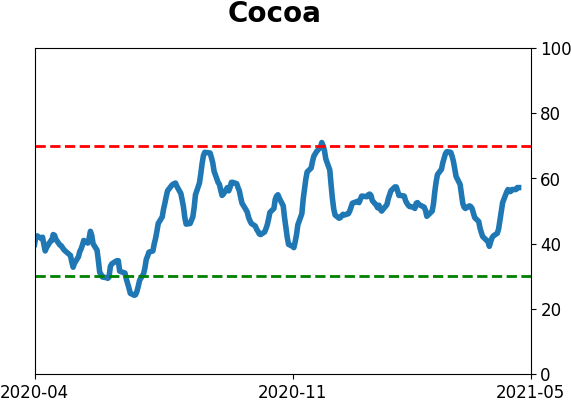
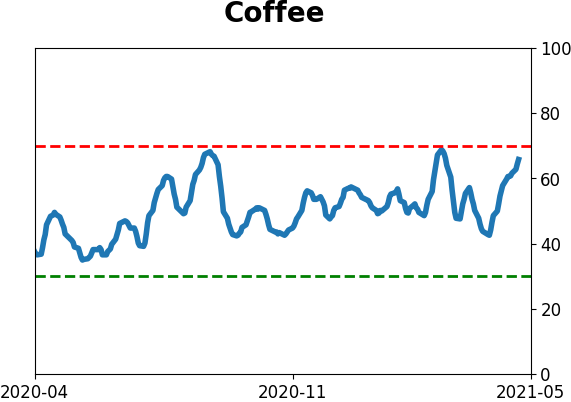
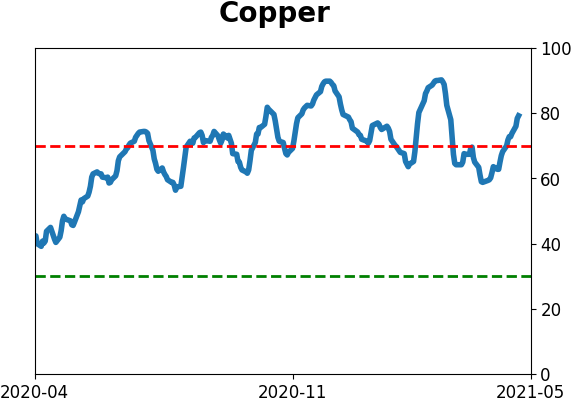
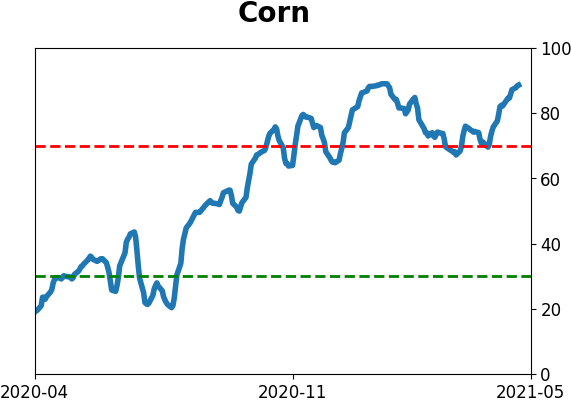
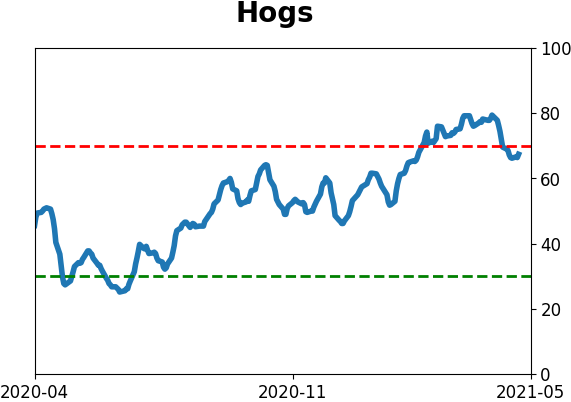
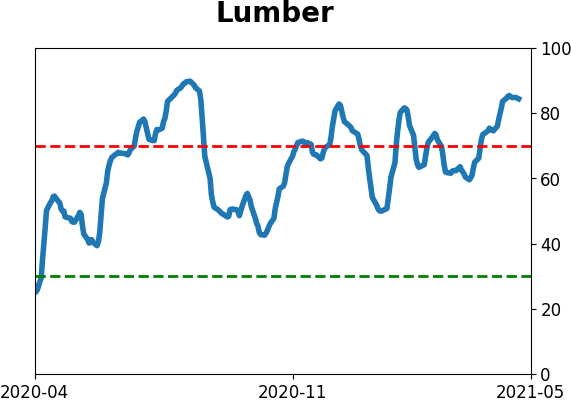
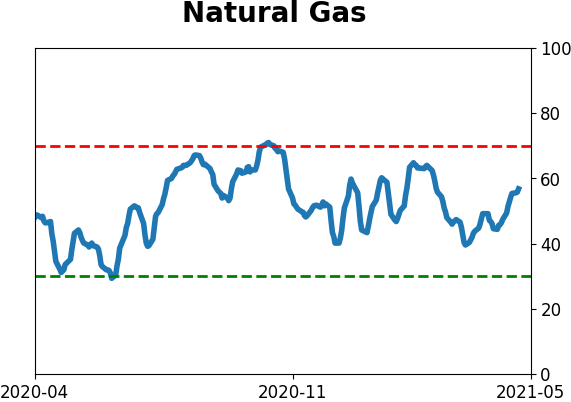
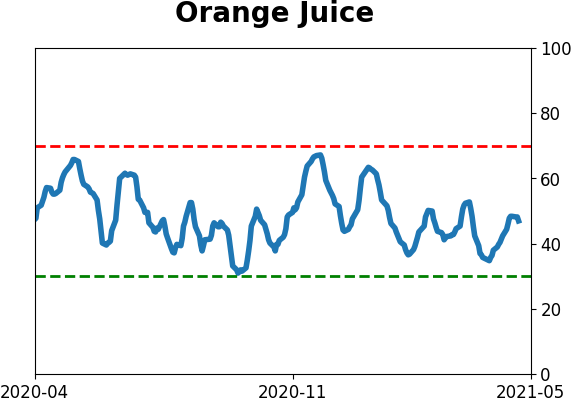
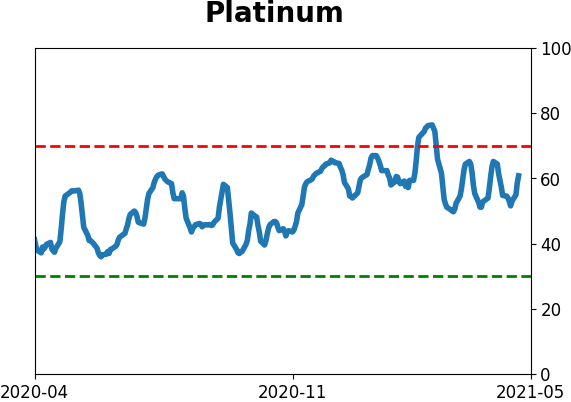
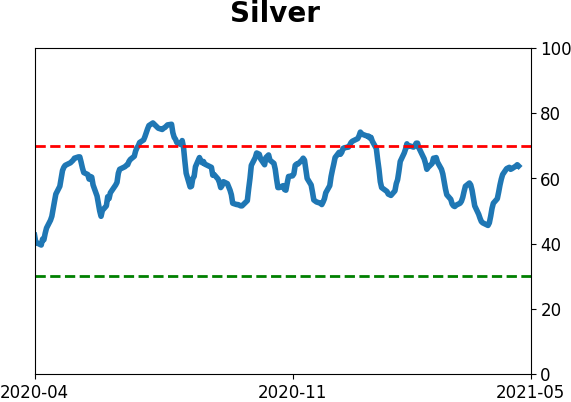
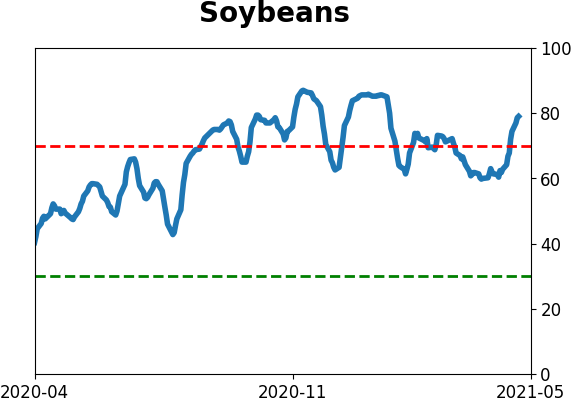
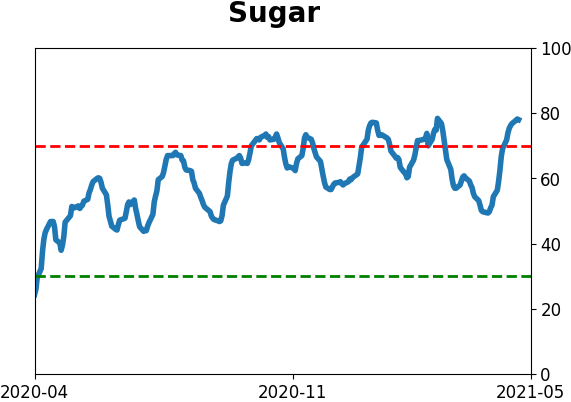
Optimism Index Thumbnails
|
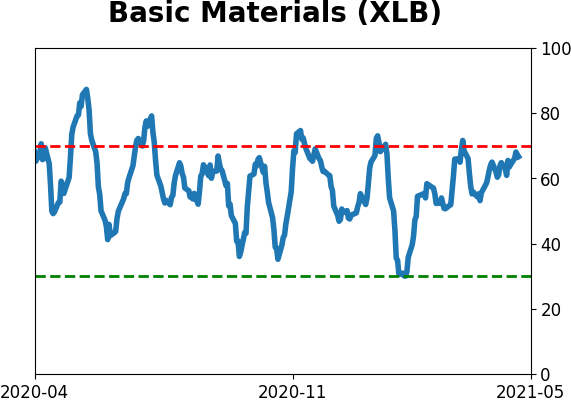
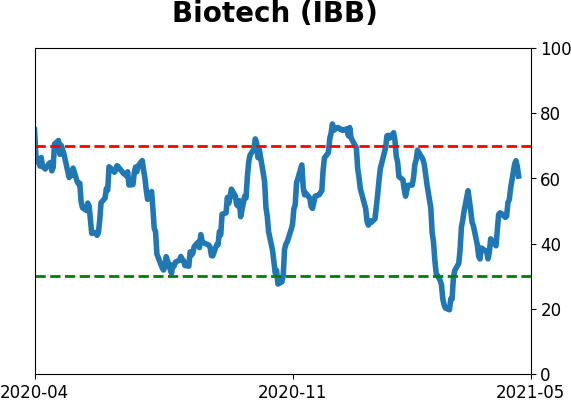
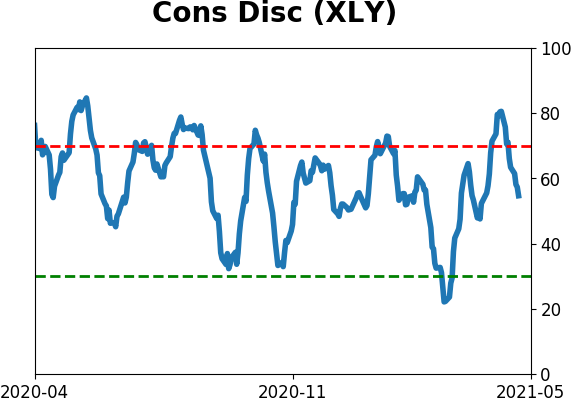
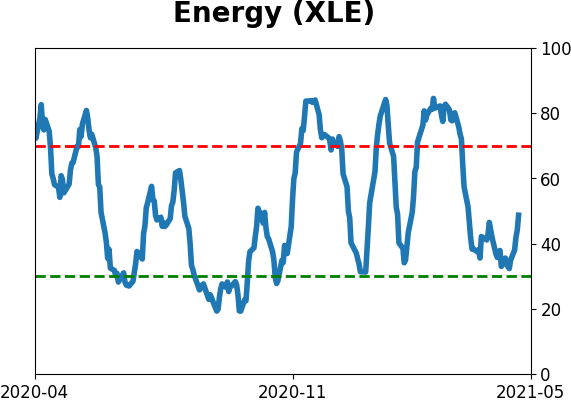
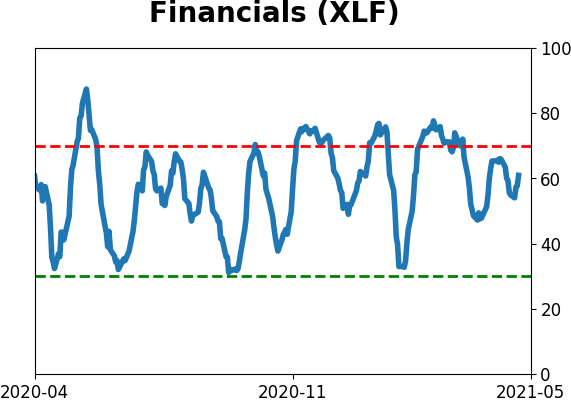
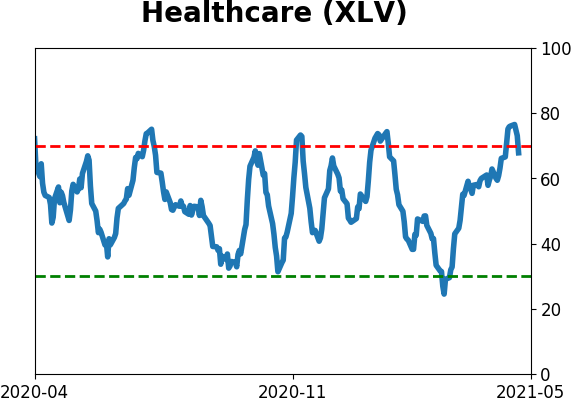
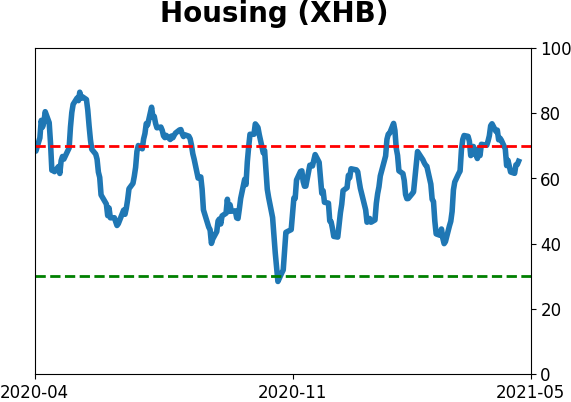
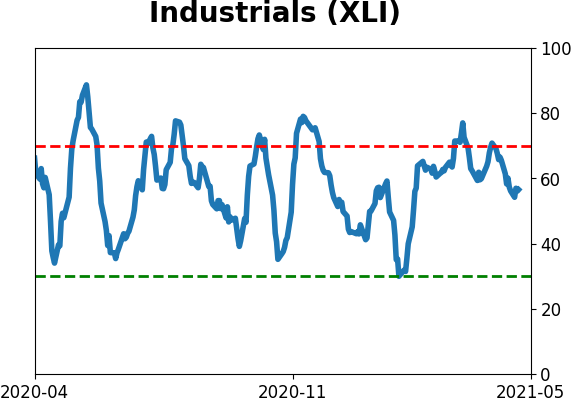
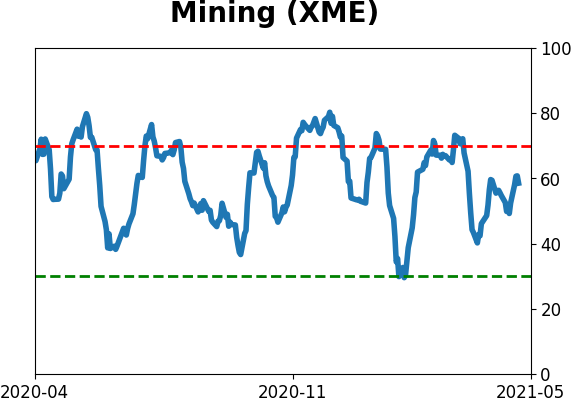
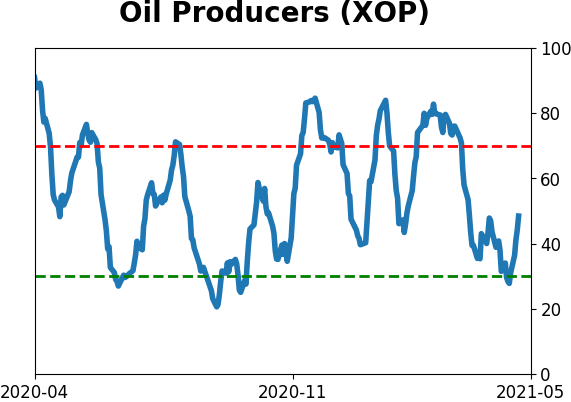
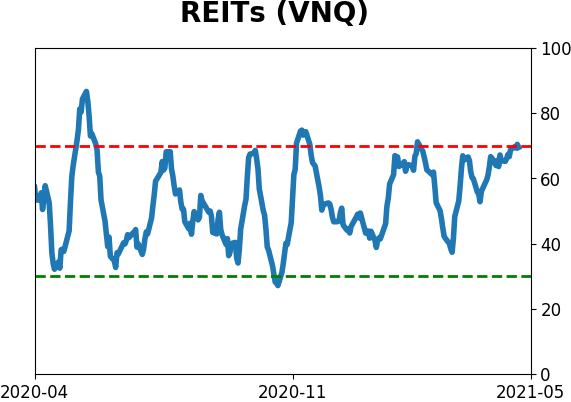
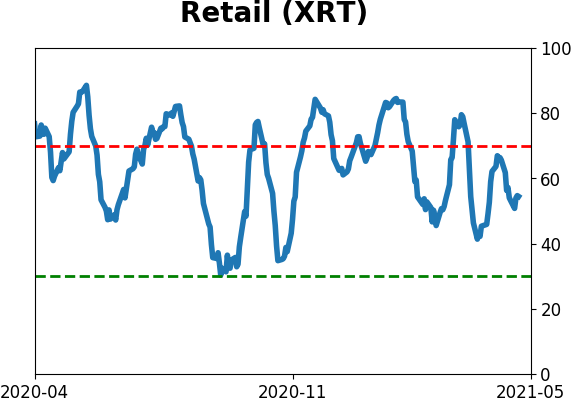
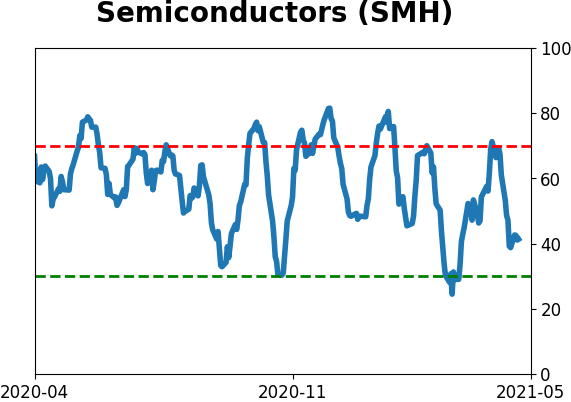
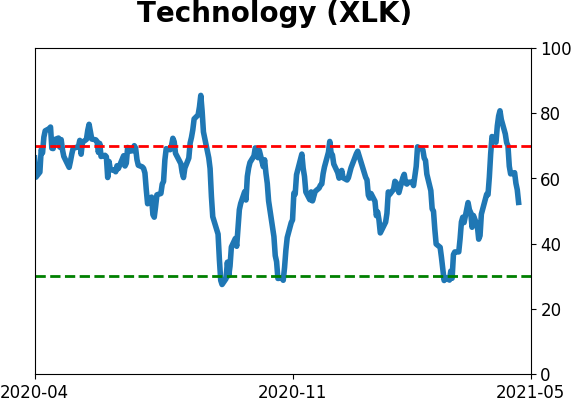
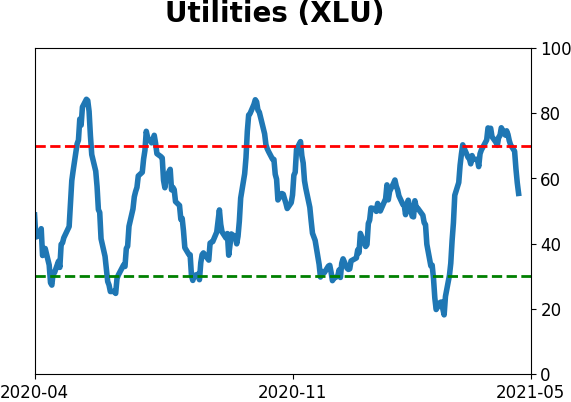
Sector ETF's - 10-Day Moving Average
|
|
|
Country ETF's - 10-Day Moving Average
|
|
|
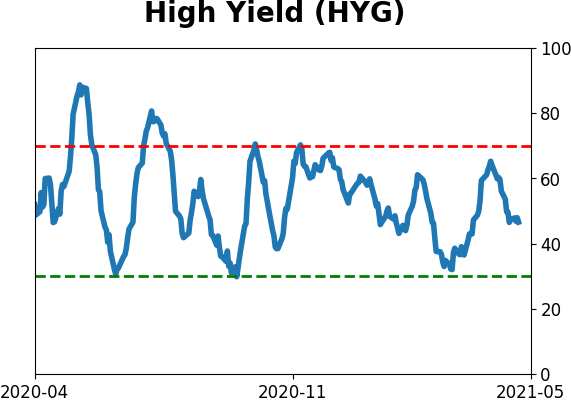
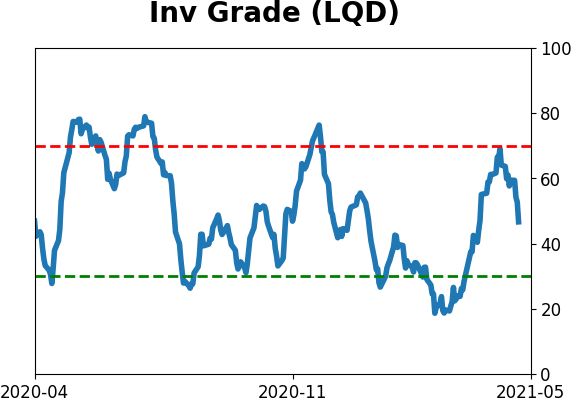
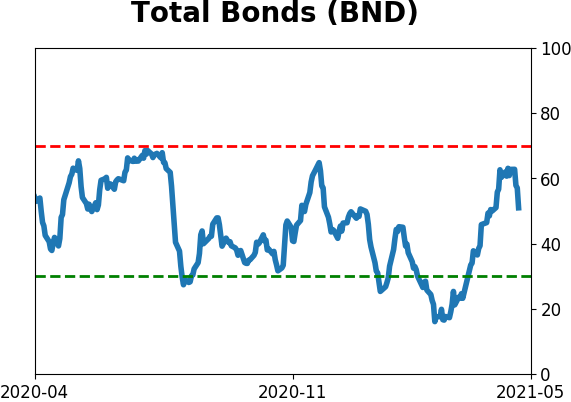
Bond ETF's - 10-Day Moving Average
|
|
|
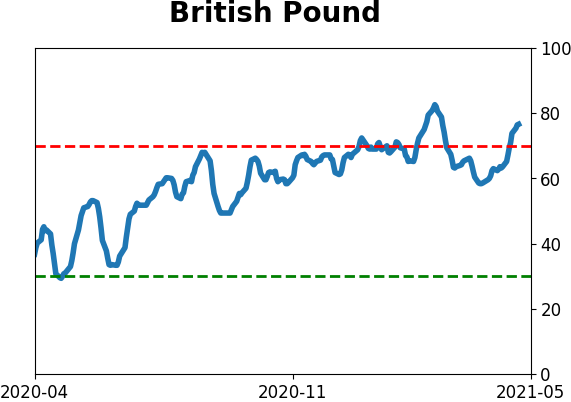
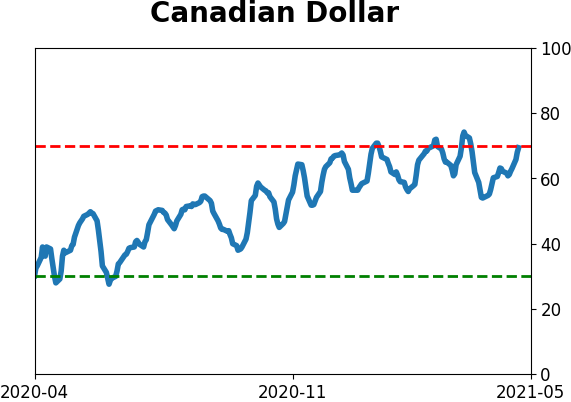
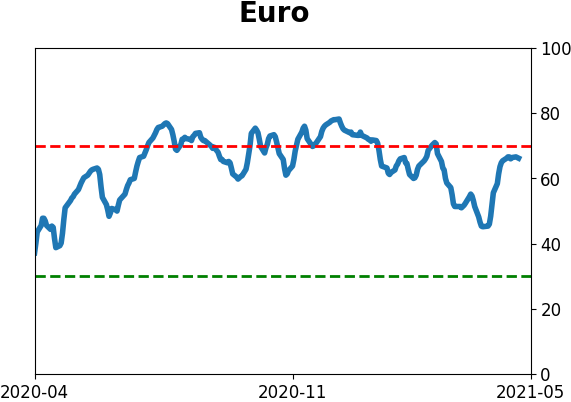
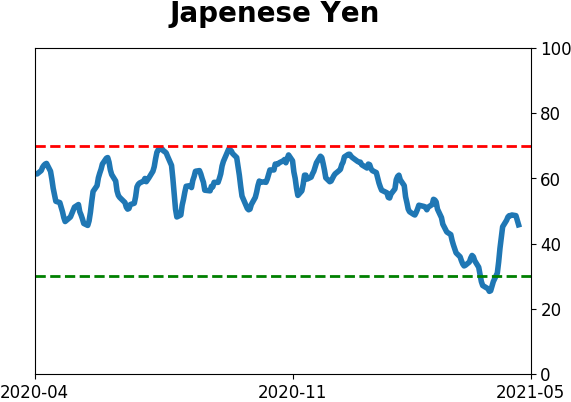
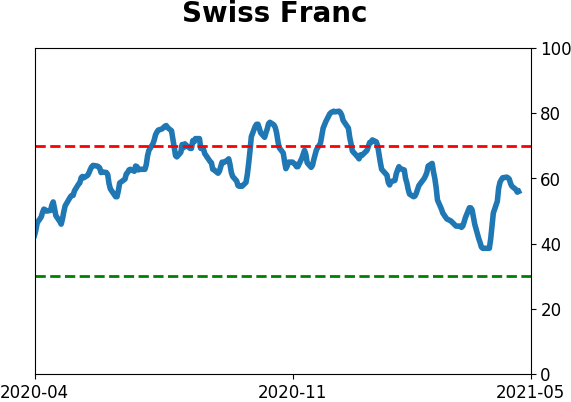
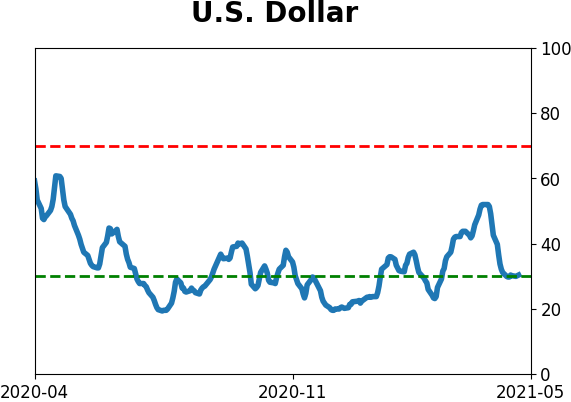
Currency ETF's - 5-Day Moving Average
|
|
|
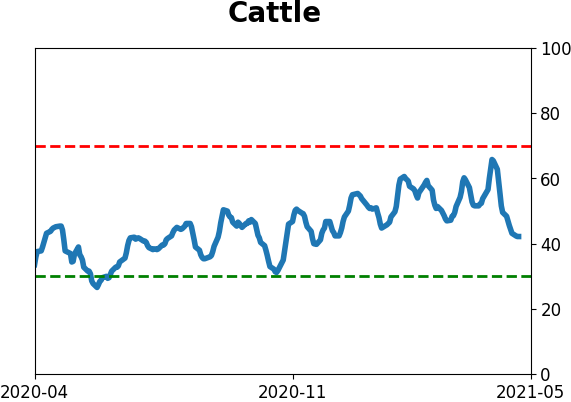
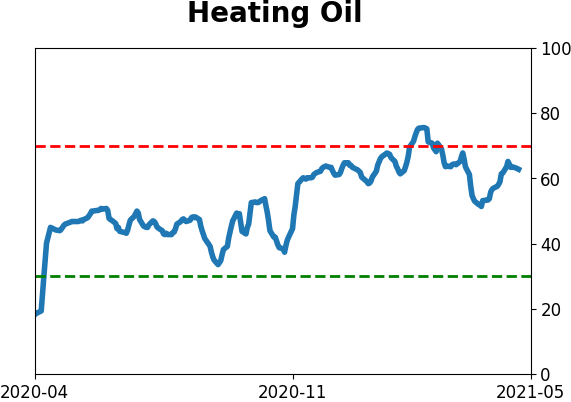
Commodity ETF's - 5-Day Moving Average
|
|