Headlines
|
|
S&P notches yet another big intraday gain:
Small-cap stocks aren't the only ones rallying. The large-cap S&P 500 index has enjoyed 6 straight sessions with at least a 1% gain at some point during the day, even if the gains fizzle by the close. These bouts of buying pressure are common during bear markets, and stocks need to hold gains to prove it's something other than that.
Small-cap stocks assert dominance:
The small-cap Russell 2000 has surged over the past week, with a near record streak of 1% daily gains. That has pushed the ratio between the Russell and the large-cap S&P 500 to a 30-day high, some relief after the ratio had been mired at a multi-year low.
Consumers negative for now, but hopeful for tomorrow:
Overall consumer confidence cratered in April, but much of that was focused on the present. Consumers' expectations about the future actually improved with the stock market. That hasn't necessarily been a bad thing. And their confidence in stocks remains subdued, despite a big rally during the month.
|
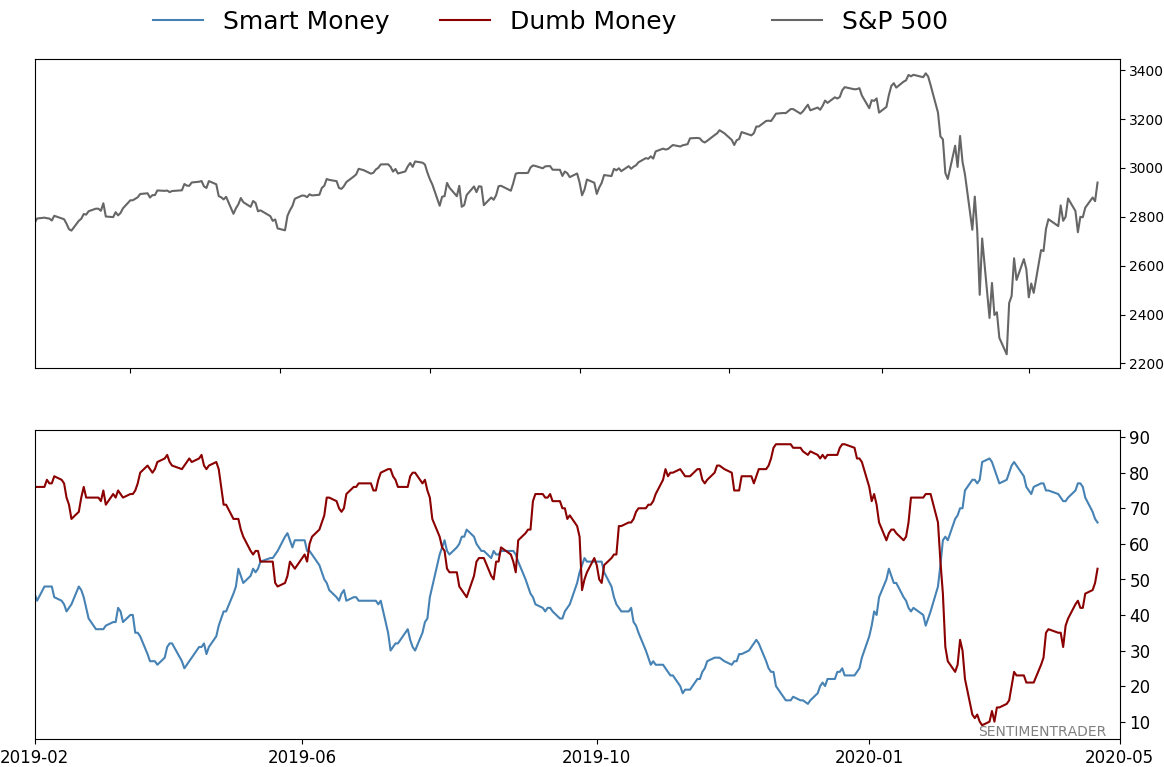
Smart / Dumb Money Confidence
|
Smart Money Confidence: 66%
Dumb Money Confidence: 53%
|
|
Risk Levels
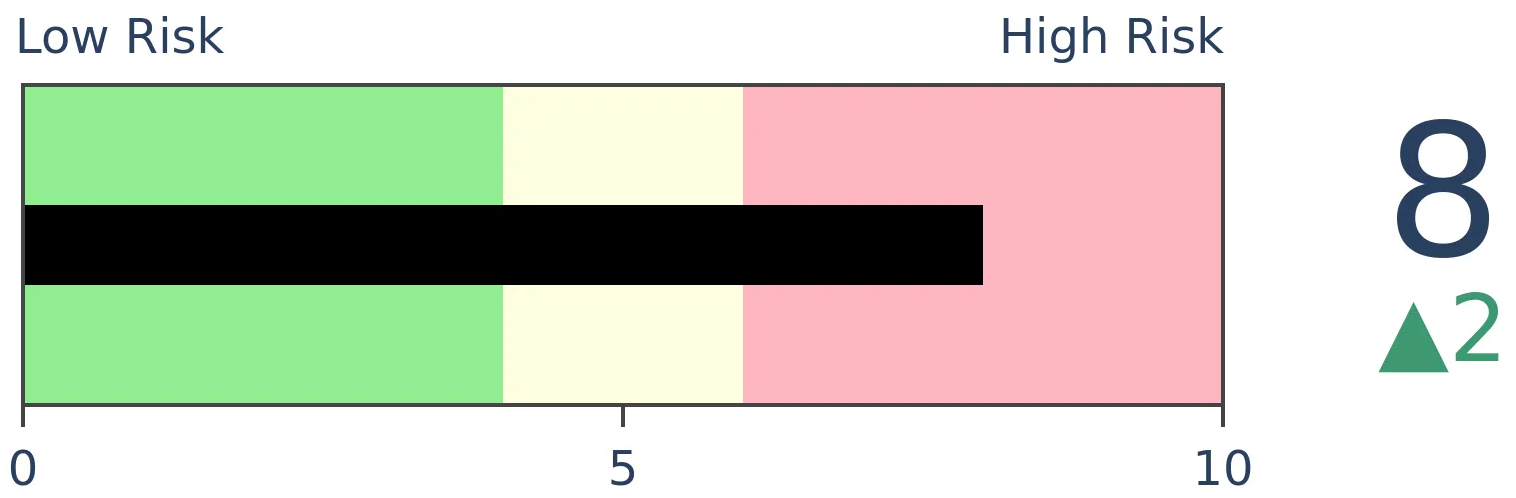
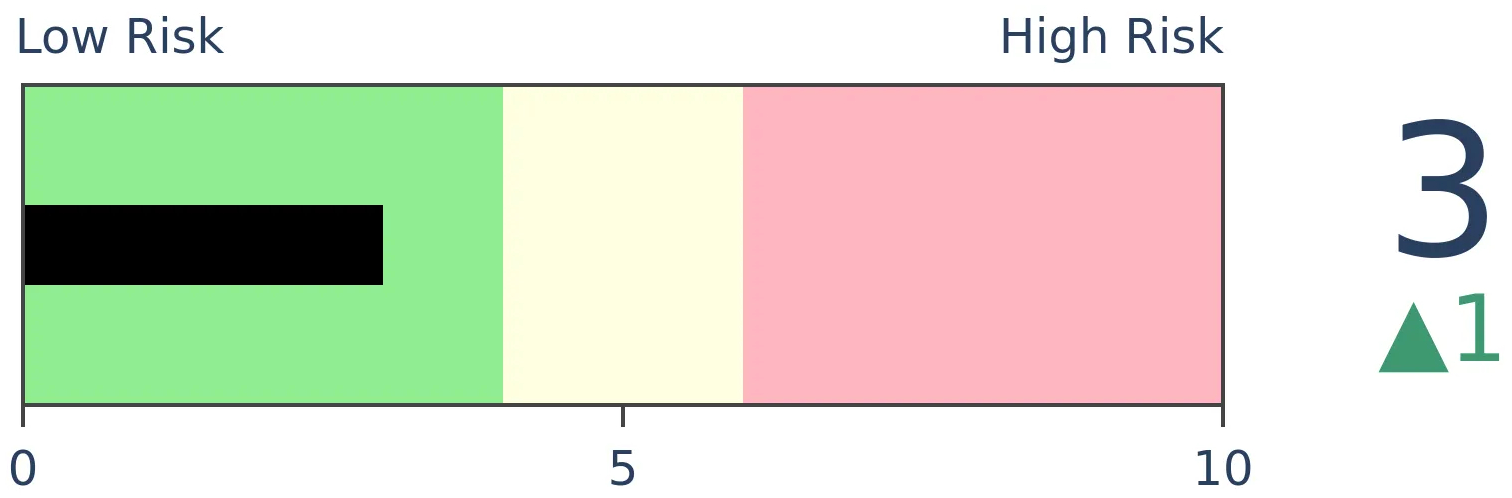
Stocks Short-Term
|
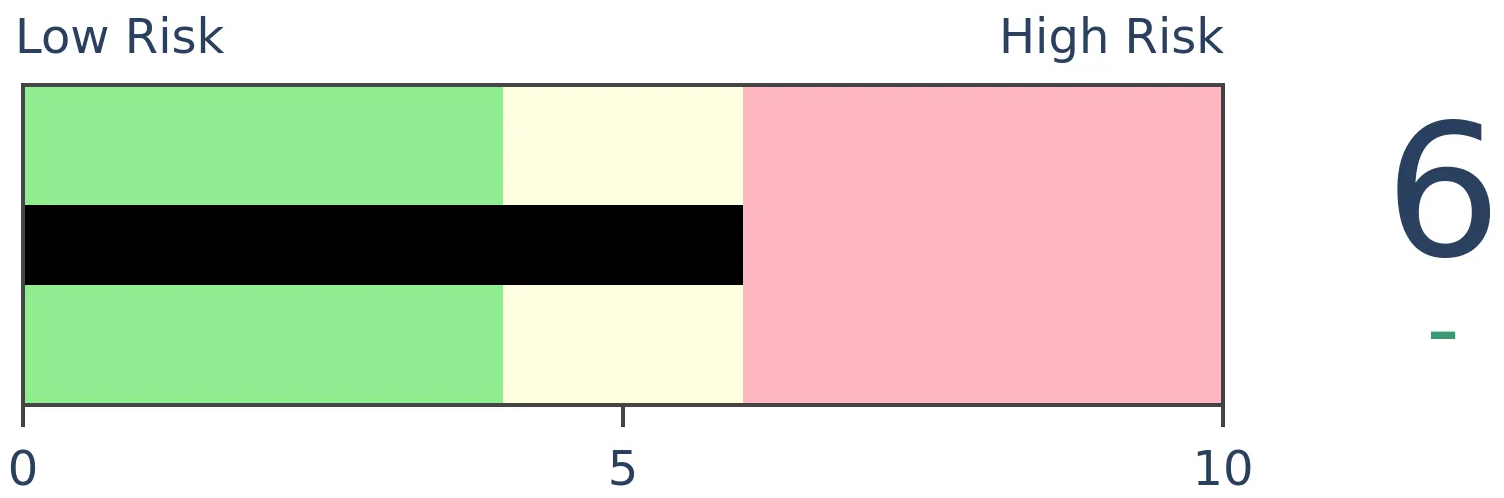
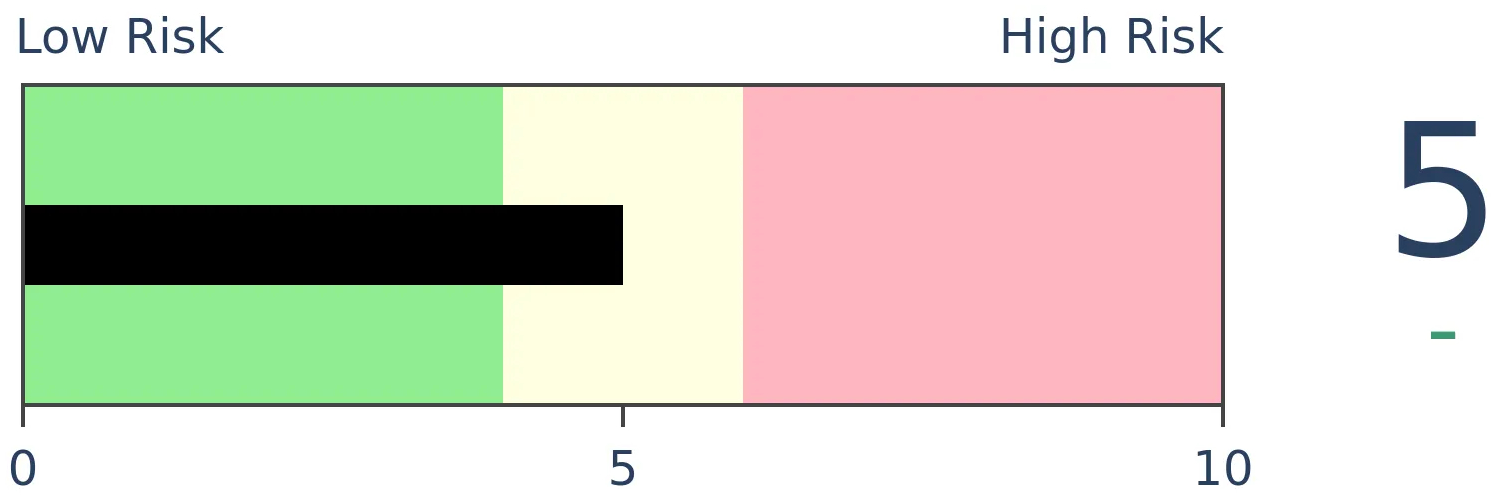
Stocks Medium-Term
|
|
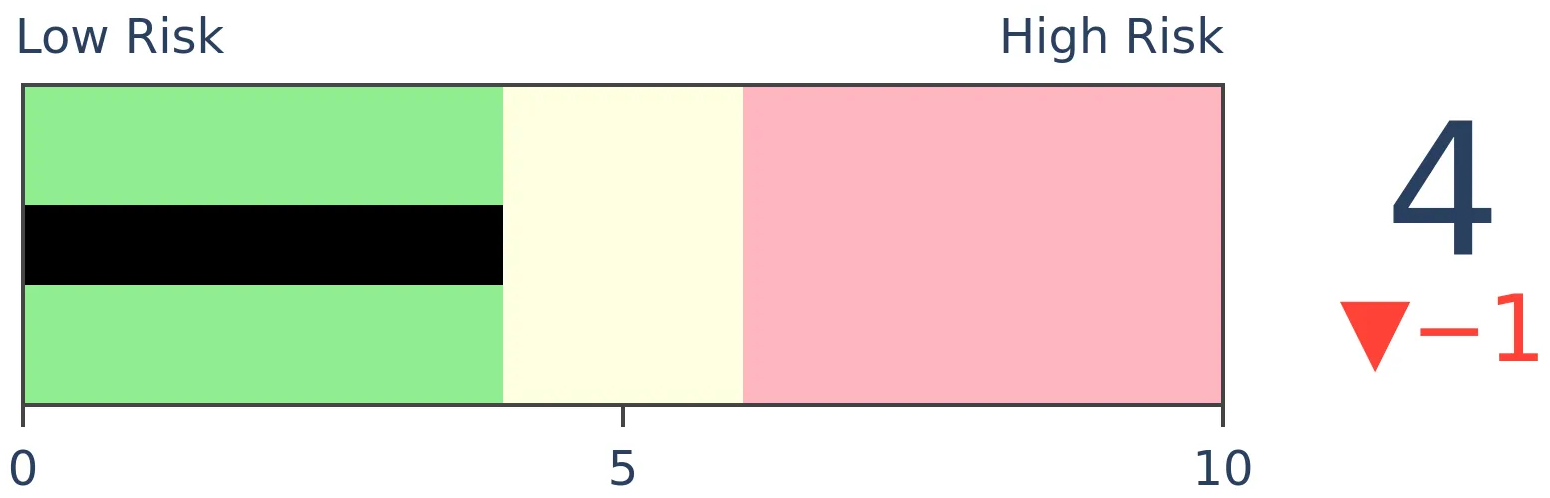
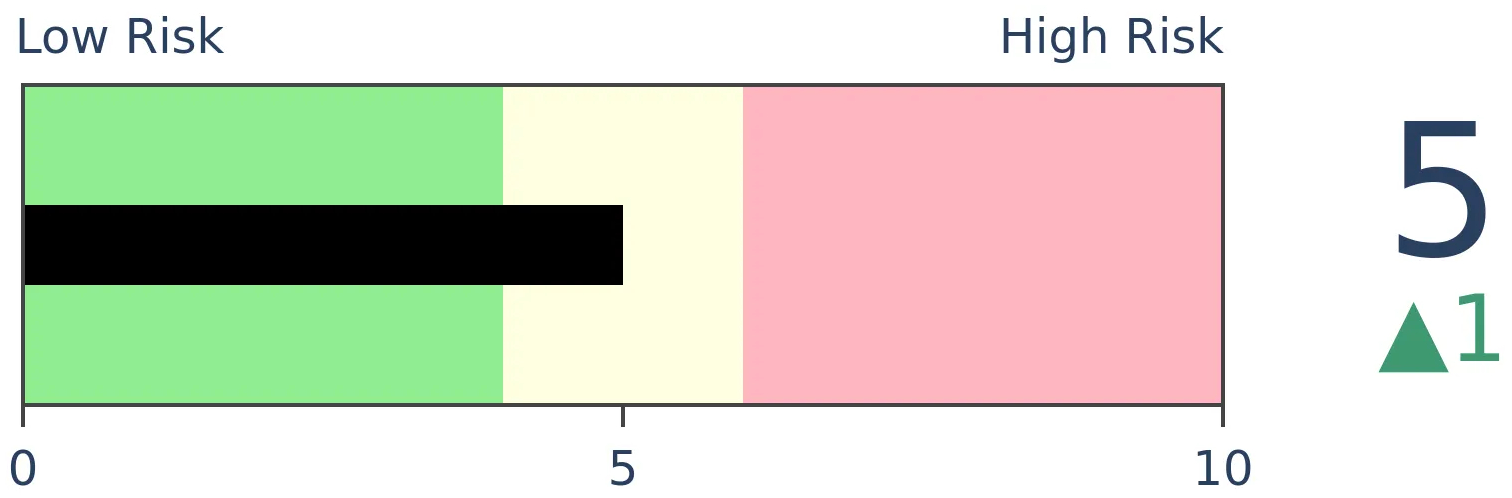
Bonds
|
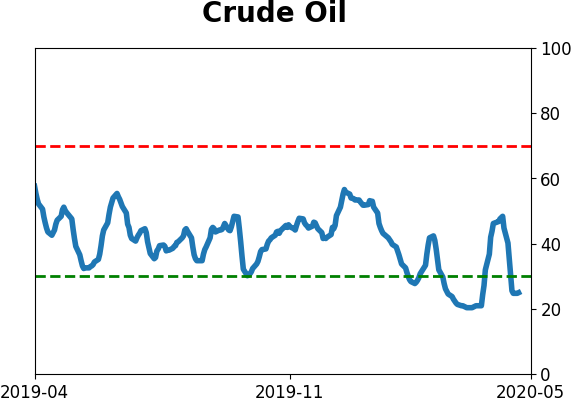
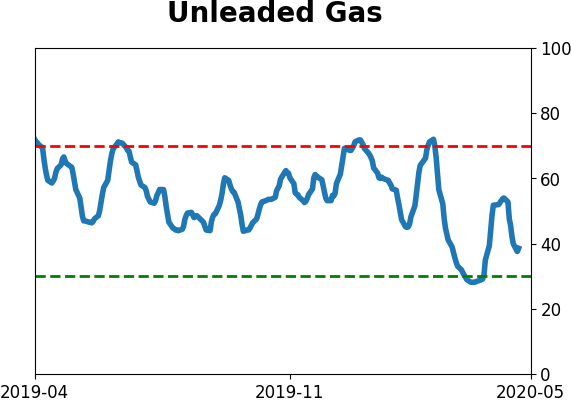
Crude Oil
|
|
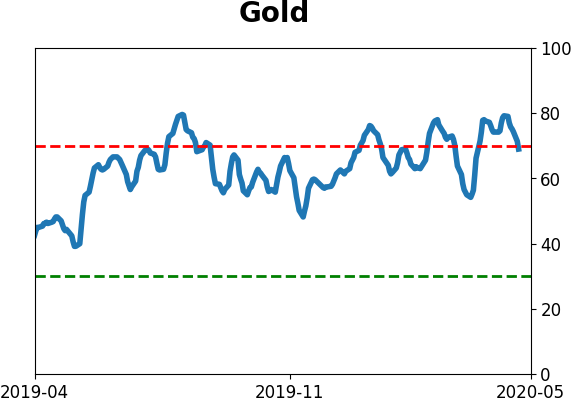
Gold
|
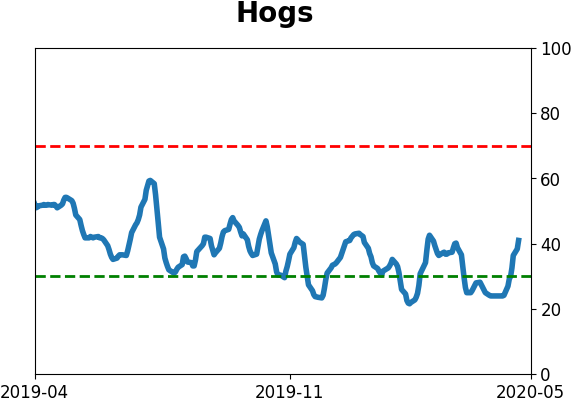
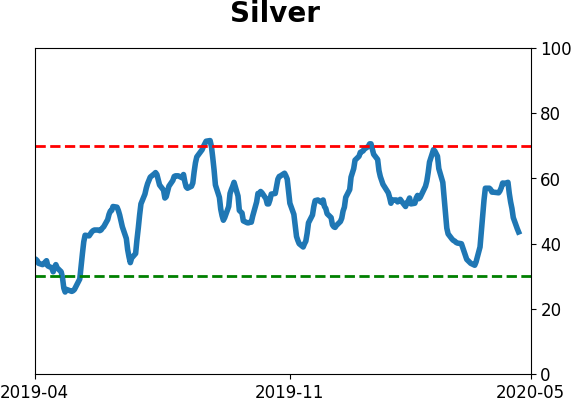
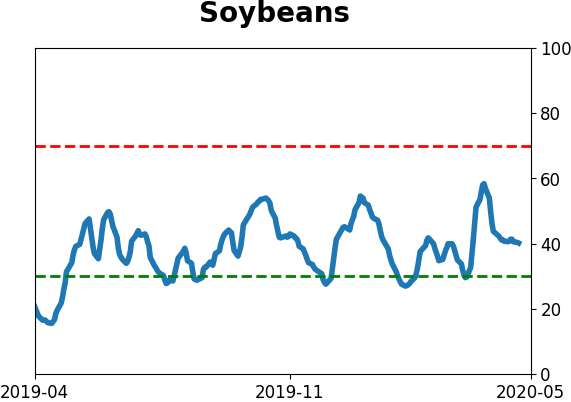
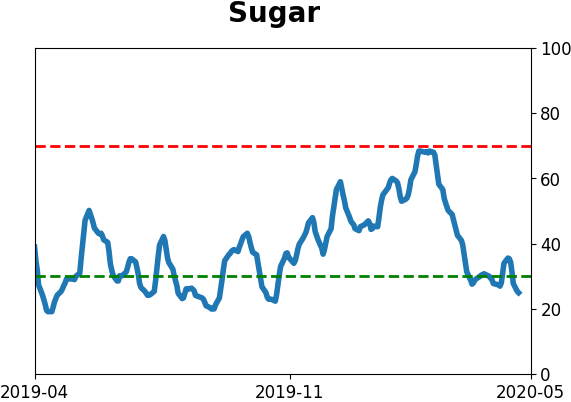
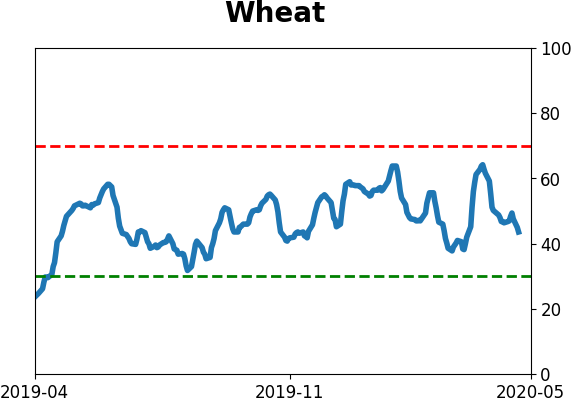
Agriculture
|
|
Research
BOTTOM LINE
Small-cap stocks aren't the only ones rallying. The large-cap S&P 500 index has enjoyed 6 straight sessions with at least a 1% gain at some point during the day, even if the gains fizzle by the close. These bouts of buying pressure are common during bear markets, and stocks need to hold gains to prove it's something other than that.
FORECAST / TIMEFRAME
SPY -- Down, Short-Term
|
Small-cap stocks have stolen the spotlight by enjoying a record run of days with more than a 1% daily gain. The broader market has rallied, as well, even if giving up some of those gains on an intraday basis.
Over the past 6 days, the S&P 500 has traded higher by at least 1% at some point during the day. That's the longest streak since 2011 and has been exceeded only a few times in the nearly 40 years. It was more common prior to the early 1980s, at least if we can rely on intraday from data back then.
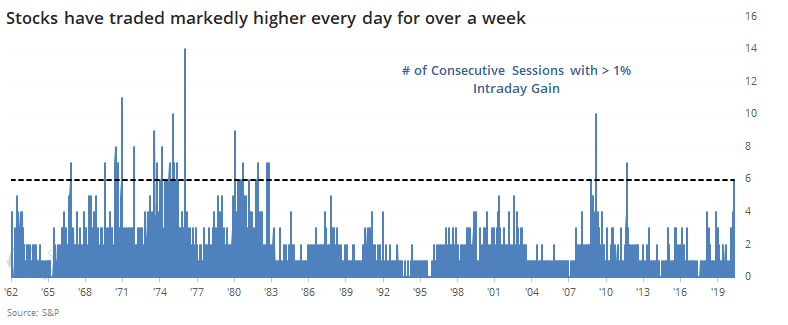
Most of these streaks occurred during downtrends when volatility was higher. If we look for any time the streak lasted 6 days while the S&P was trading below its 200-day average, then we get the following.
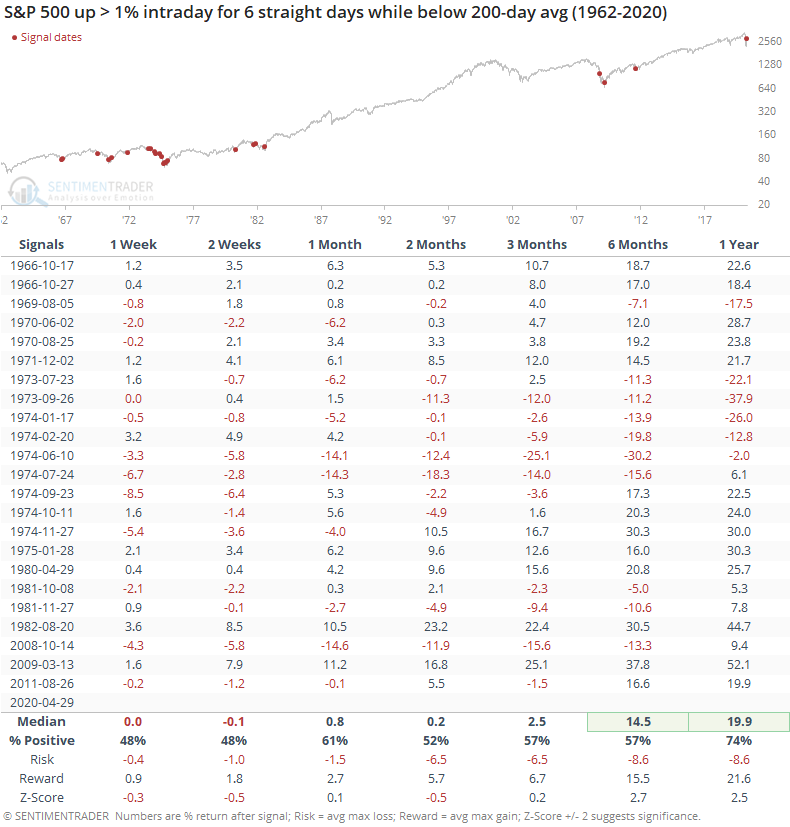
These thrusts led to some back-and-forth over the short-term as buyers took a breather. By a month later, returns turned more consistently positive and they were significantly so over the next 6-12 months. Since these instances suggest thrusts within bear markets, it makes sense that the long-term returns were above average.
Using a traded vehicle like a futures contract provides more accurate intraday data, so let's look at the same set of streaks going back to their inception in 1982.
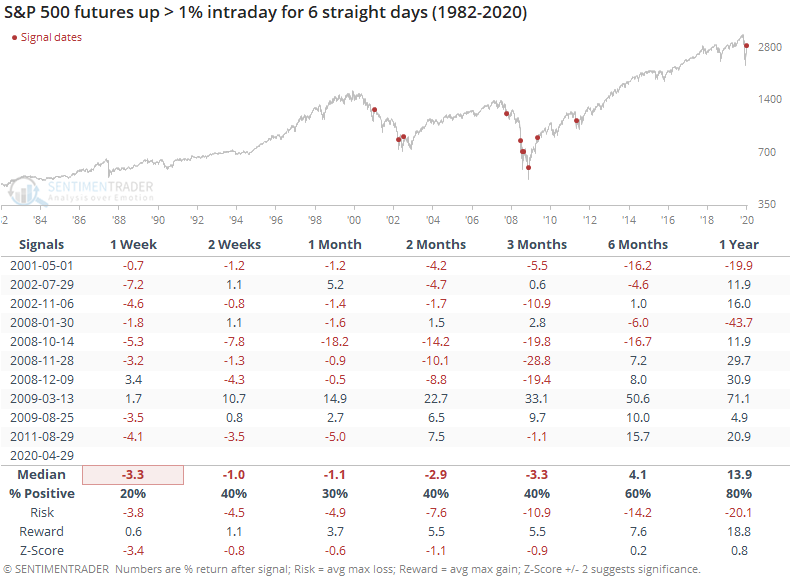
We don't need to stipulate that they were trading below the 200-day average, because all of them were. And most of them were at least a temporary head-fake. The only signal that didn't show a negative return at some point was the kick-off to the new bull market in March 2009. That was rocketed higher and just kept going.
So, if we see something similar in the coming week(s) it will give at least a little more credence to the idea that we've witnessed something other than just another bear market rally.
BOTTOM LINE
The small-cap Russell 2000 has surged over the past week, with a near record streak of 1% daily gains. That has pushed the ratio between the Russell and the large-cap S&P 500 to a 30-day high, some relief after the ratio had been mired at a multi-year low.
FORECAST / TIMEFRAME
None
|
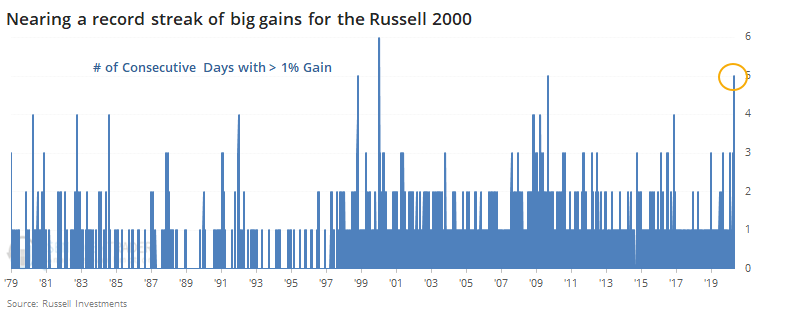
Try, try, and try again. After years of a relative struggle, small-cap stocks are trying to assert some dominance.
As of Tuesday, the Russell 2000 managed to gain more than 1% for five consecutive days, approaching a record streak of big daily returns.
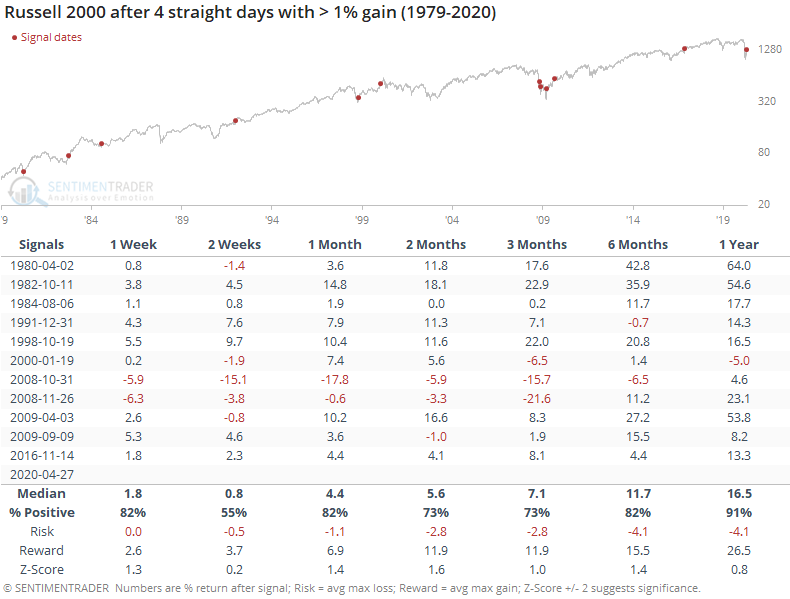
Hitting a streak of five days of 1% gains has mostly led to gains, at least based on the 3 times it's triggered before. In 1998 it was the kick-off to even more gains in the months ahead, while the latter two see-sawed between gains and losses in the months ahead.
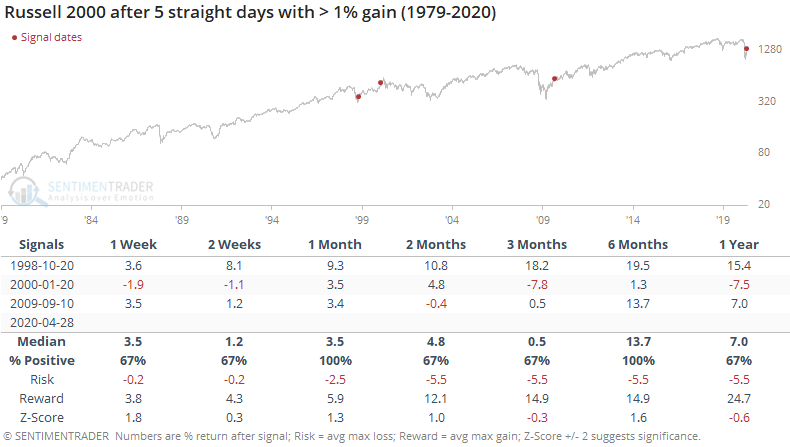
If we expand the sample size by looking for streaks of four straight days of 1% gains, then we see that returns were mostly positive, with only a single, relatively small loss over the next year.
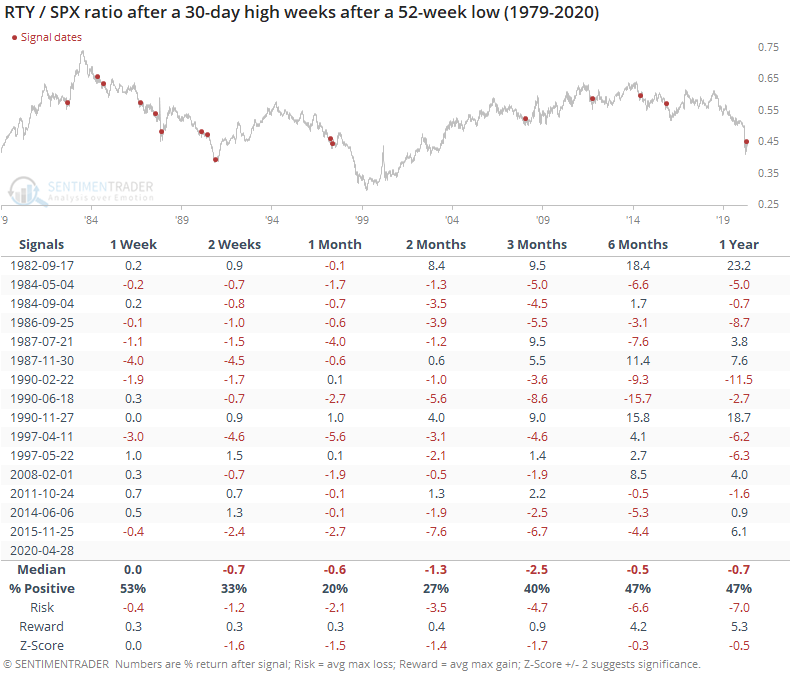
Because of this surge over the past week, the ratio of the Russell 2000 (RTY) to S&P 500 (SPX) has surged to a 30-day high, after falling to yet another multi-year low in March.
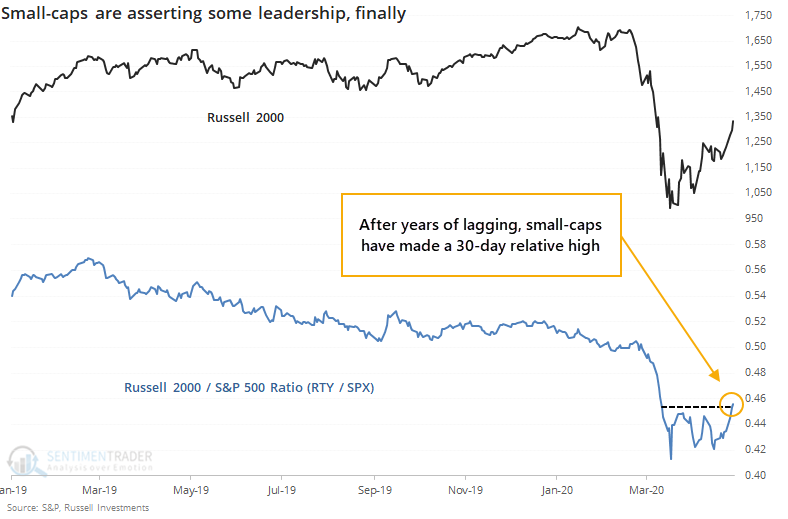
This is taken as a universally good sign, as it suggests that some of the hardest-hit companies are finding buyers. We've seen repeatedly in years past, though, that leadership in small-cap stocks is not a consistently good thing. No matter how much it might make theoretical sense, empirically the evidence is mixed at best.
Still, let's look for times when the ratio between the Russell and S&P fell to a 52-week low, then after a period of a few weeks finally hit a 30-day high (this avoids the instances when there was a quick spike that usually failed).
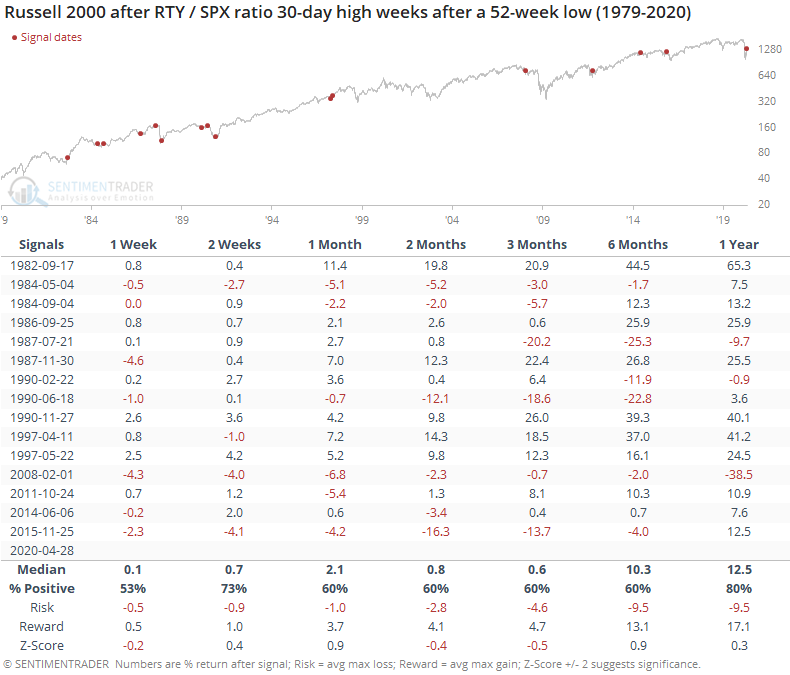
For the Russell, it was an okay sign. Returns going forward were about in line with random. Over the next 2-3 months, its median return was barely positive, and by three months later, the risk/reward was about even. Not exactly awe-inspiring.
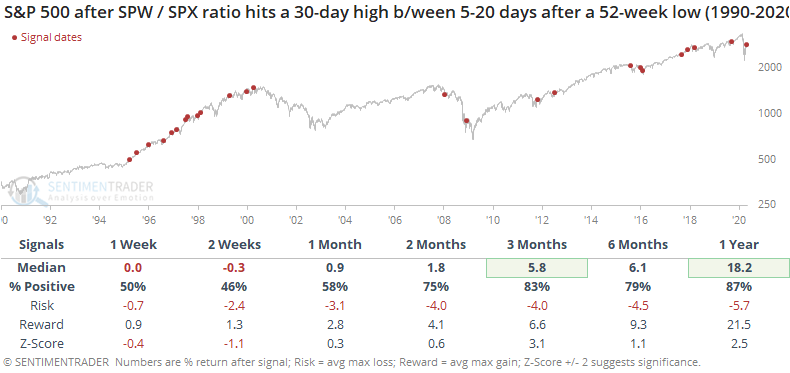
For the S&P, it was a better sign.
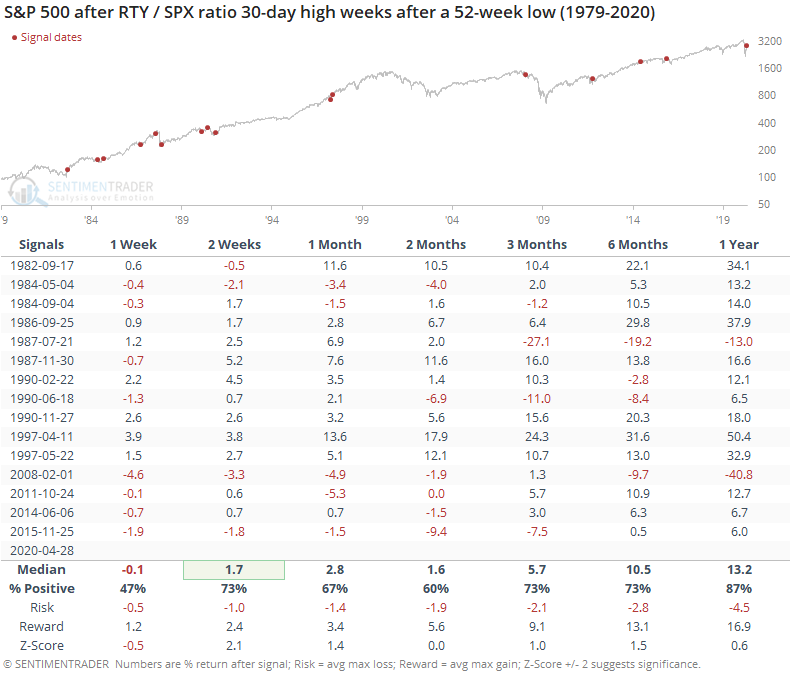
That means the ratio of the Russell to S&P usually fell.
Because of the generally negative trend in small-caps relative to large-caps in recent decades, future returns were consistently negative. Over the medium-term of 1-3 months, there was a strong bias toward the Russell under-performing the S&P after these initial recoveries.
Because the rally in recent sessions hasn't necessarily been driven by the largest stocks, the equally-weighted version of the S&P 500 (SPW) has been making new 30-day highs relative to the capitalization-weighted index (SPX). This is very similar to the pattern of the Russell to the S&P.
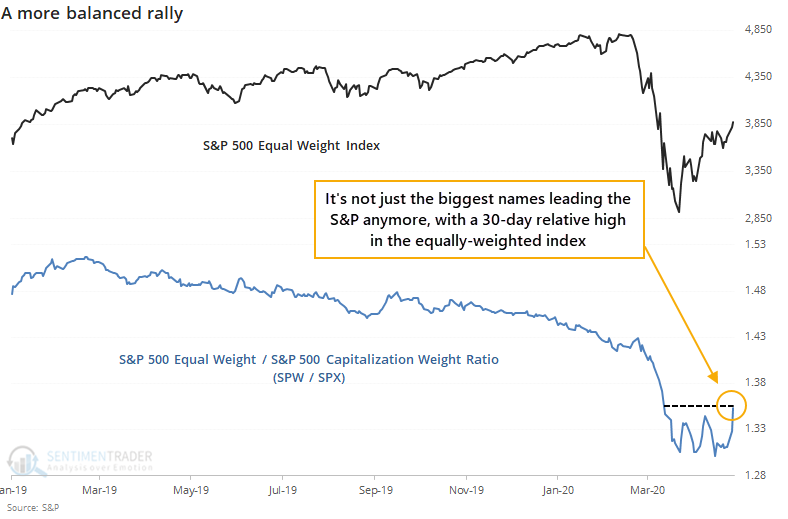
Like we saw with the RTY / SPX ratio, this was not a consistent signal that the equal-weight S&P was going to continue to out-performed the cap-weighted index that everyone follows and benchmarks.
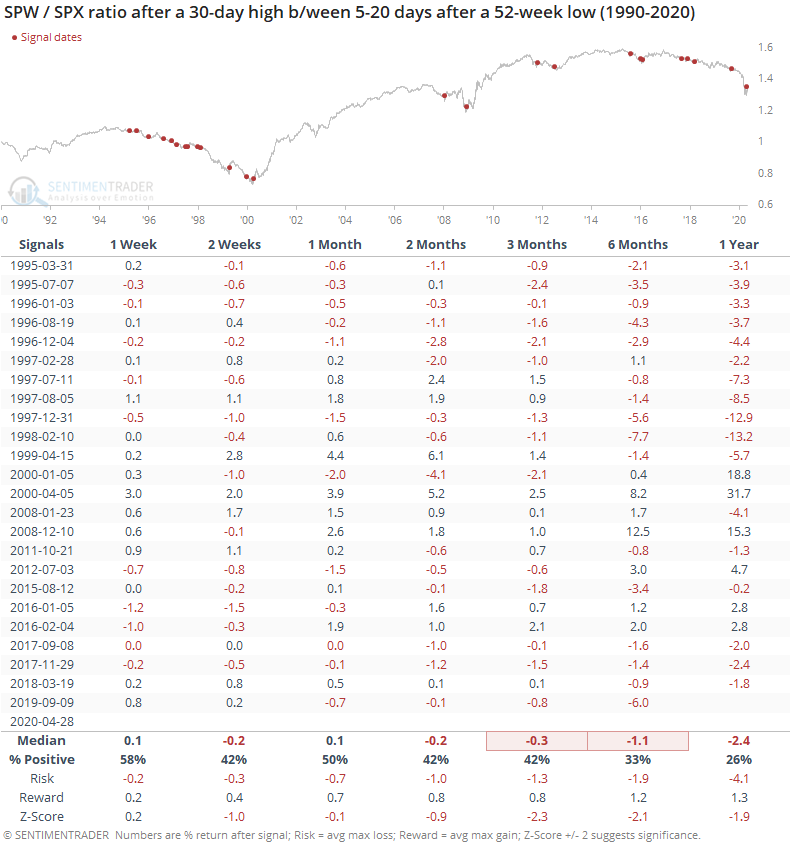
The cap-weighted index had a modest bias toward shorter-term weakness, but longer-term strength.
The equal-weighted index saw the same pattern, but its returns just weren't as strong.
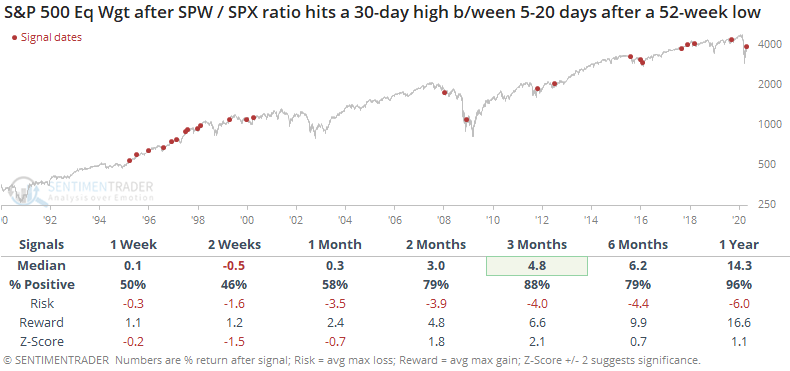
These recoveries are mostly a good sign for the broader market. For small-caps, or even just the average stock, it's less of a good sign than it is for broader, cap-weighted indexes.
BOTTOM LINE
Overall consumer confidence cratered in April, but much of that was focused on the present. Consumers' expectations about the future actually improved with the stock market. That hasn't necessarily been a bad thing. And their confidence in stocks remains subdued, despite a big rally during the month.
FORECAST / TIMEFRAME
None
|
Consumers have been greatly impacted by the economic and psychological toll from the pandemic, and the depth of the impact is showing now in monthly surveys. We saw yesterday that consumer confidence suffered one of the biggest drops ever.
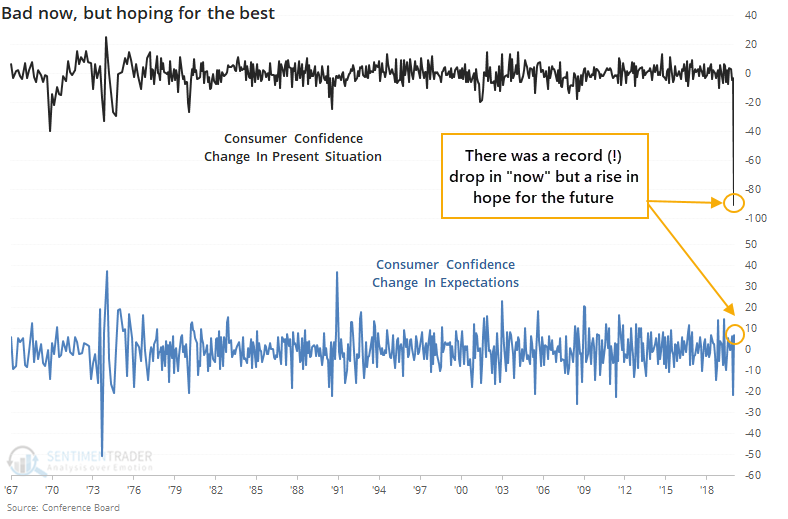
The "yeah, but" counter-argument to that drop could be that consumers only became more pessimistic about now, not the future. The Conference Board separates the survey into confidence about present conditions versus the future, and there was a massive difference between the two.
Confidence about the present dived 90 points, more than double any other month-to-month decline. Yet confidence about the future actually rose 7 points, likely helped by the rebound in stocks.
There have only been a few times when consumers' confidence in their present situation declined by more than 10 points while they became more optimistic about the future. Only one of those triggered in the past four decades.
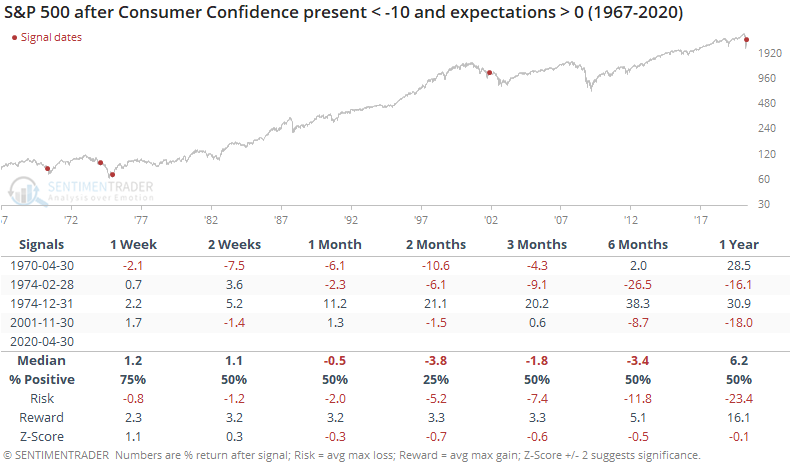
This happened at the market bottom in 1974, but otherwise was early in de-risking phases in 1970, earlier in 1974, and 2001 following the 9/11 tragedy. Because of that, future returns were terrible three times and excellent once.
Such big drops in the present situation are unusual, so we have to relax the parameters if we want to get a larger sample size. If we look for times when present conditions dropped at least 5 points while expectations for the future rose at least 5 points, then we get the following.
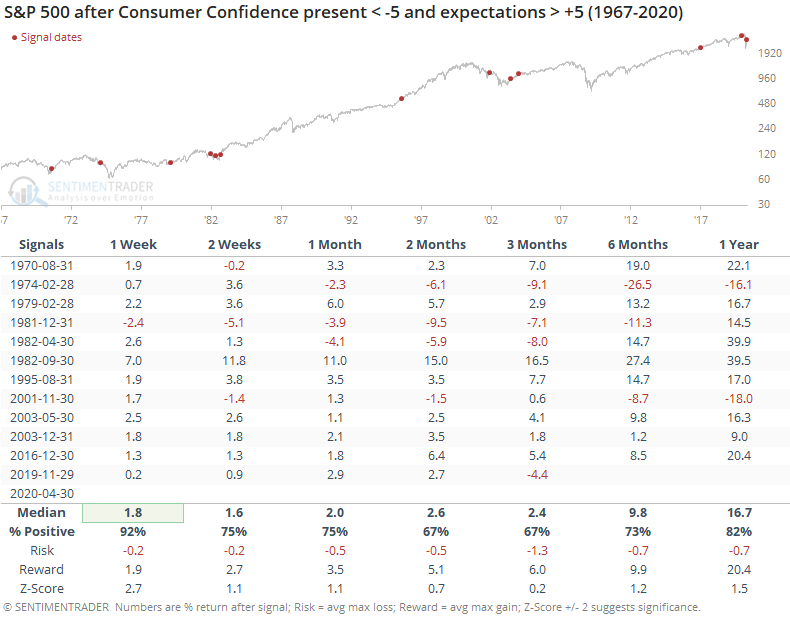
In both studies, the very short-term was good, helped by a bullish seasonal pattern at the beginning of most months. Returns after that were a little better than random, with a mix of moderate gains and losses in the months ahead.
Even though stocks rebounded more than 10% in April, maybe they hadn't rallied enough for most consumers to notice during the study period. More of them became optimistic specifically about the stock market during the month, but still, only a net 4.6% of them expect stocks to keep rallying.
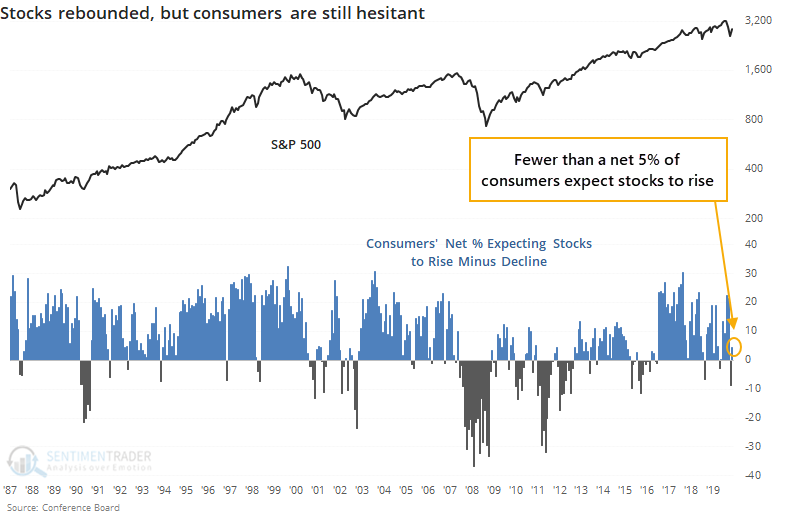
Below, we can see every month when stocks jumped at least 5%, and consumers became more optimistic, but fewer than a net 5% of them expected stocks to continue to rise.
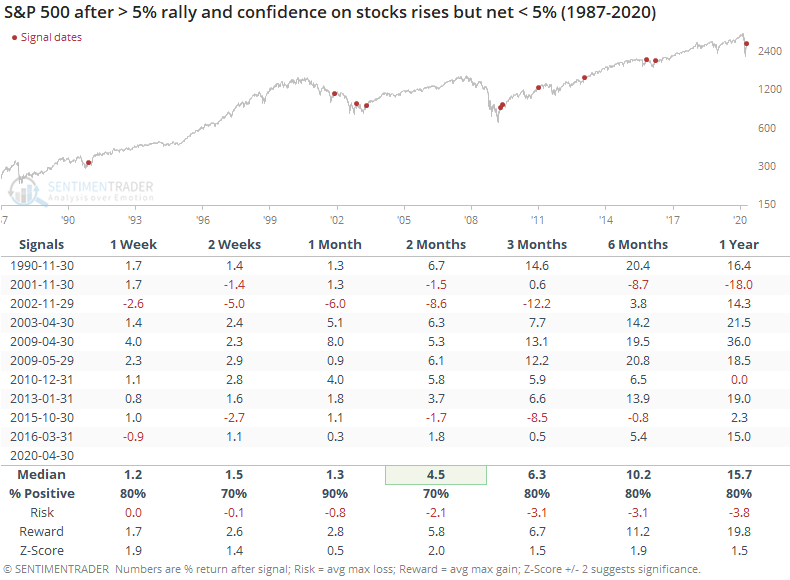
This was a mostly positive thing, and returns were better than those months when more than a net 5% of consumers expected stocks to rise (in those cases, the 2-month forward return was -0.4%). Consumers jumped the gun by becoming more optimistic in 2001, 2002, and 2015, but otherwise, stocks did okay.
It's easy to be a knee-jerk contrarian and assume that because consumers didn't completely give up about the future in April, then they're not really pessimistic and we must have further to fall in order to wring out the optimism and allow stocks to recover. It hasn't really worked that way in the past, though. The current drop in present conditions is so many standard deviations from the norm that no historical precedent can serve as a template here, but from months that look at least passingly like the present, it might be a modest shorter-term positive.
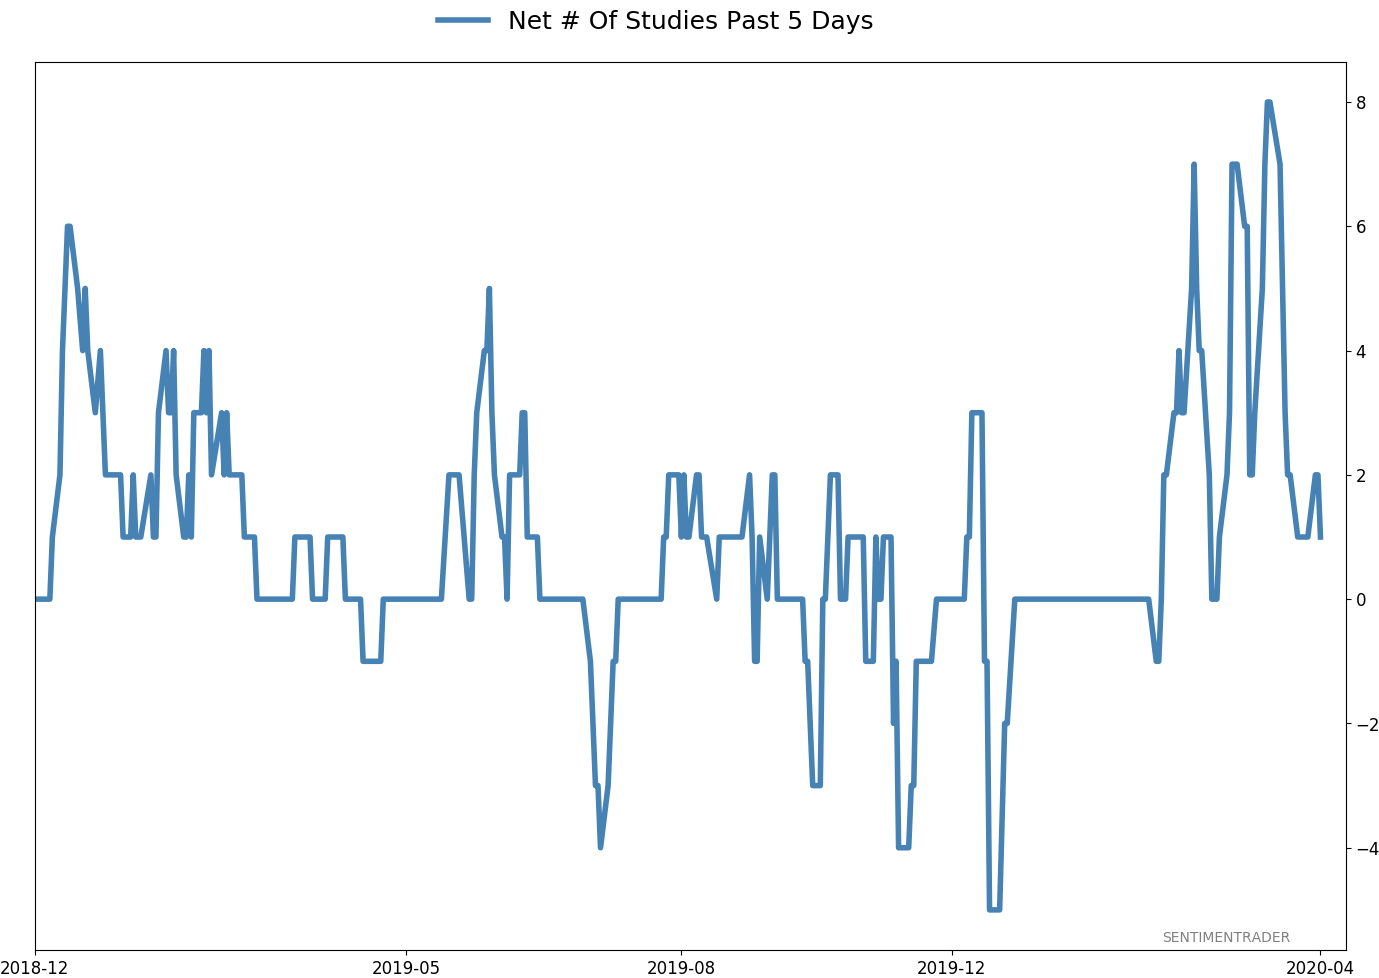
Active Studies
| Time Frame | Bullish | Bearish | | Short-Term | 0 | 6 | | Medium-Term | 12 | 0 | | Long-Term | 35 | 3 |
|
Indicators at Extremes
Portfolio
| Position | Weight % | Added / Reduced | Date | | Stocks | 49.9 | Reduced 10.3% | 2020-04-23 | | Bonds | 0.0 | Reduced 6.7% | 2020-02-28 | | Commodities | 5.1 | Added 2.4%
| 2020-02-28 | | Precious Metals | 0.0 | Reduced 3.6% | 2020-02-28 | | Special Situations | 0.0 | Reduced 31.9% | 2020-03-17 | | Cash | 45.0 | | |
|
Updates (Changes made today are underlined)
In the first months of the year, we saw manic trading activity. From big jumps in specific stocks to historic highs in retail trading activity to record highs in household confidence to almost unbelievable confidence among options traders. All of that came amid a market where the average stock couldn't keep up with their indexes. There were signs of waning momentum in stocks underlying the major averages, which started triggering technical warning signs in late January. The kinds of extremes we saw in December and January typically take months to wear away, but the type of selling in March went a long way toward getting there. When we place the kind of moves we saw into March 23 into the context of coming off an all-time high, there has been a high probability of a multi-month rebound. After stocks bottomed on the 23rd, they enjoyed a historic buying thrust and retraced a larger amount of the decline than "just a bear market rally" tends to. While other signs are mixed that panic is subsiding, those thrusts are the most encouraging sign we've seen in years. Shorter-term, there have been some warning signs popping up and our studies have stopped showing as positively skewed returns. I reduced my exposure some on Monday and a little more on Thursday and will consider further reducing it if we drop below last week's lows on SPY. Long-term suggestions from the studies remain robust, but shorter-term ones are significantly less so, and stocks still have to prove that we're in something other than a protracted, recessionary bear market.
RETURN YTD: -7.9% 2019: 12.6%, 2018: 0.6%, 2017: 3.8%, 2016: 17.1%, 2015: 9.2%, 2014: 14.5%, 2013: 2.2%, 2012: 10.8%, 2011: 16.5%, 2010: 15.3%, 2009: 23.9%, 2008: 16.2%, 2007: 7.8%
|
|
Phase Table
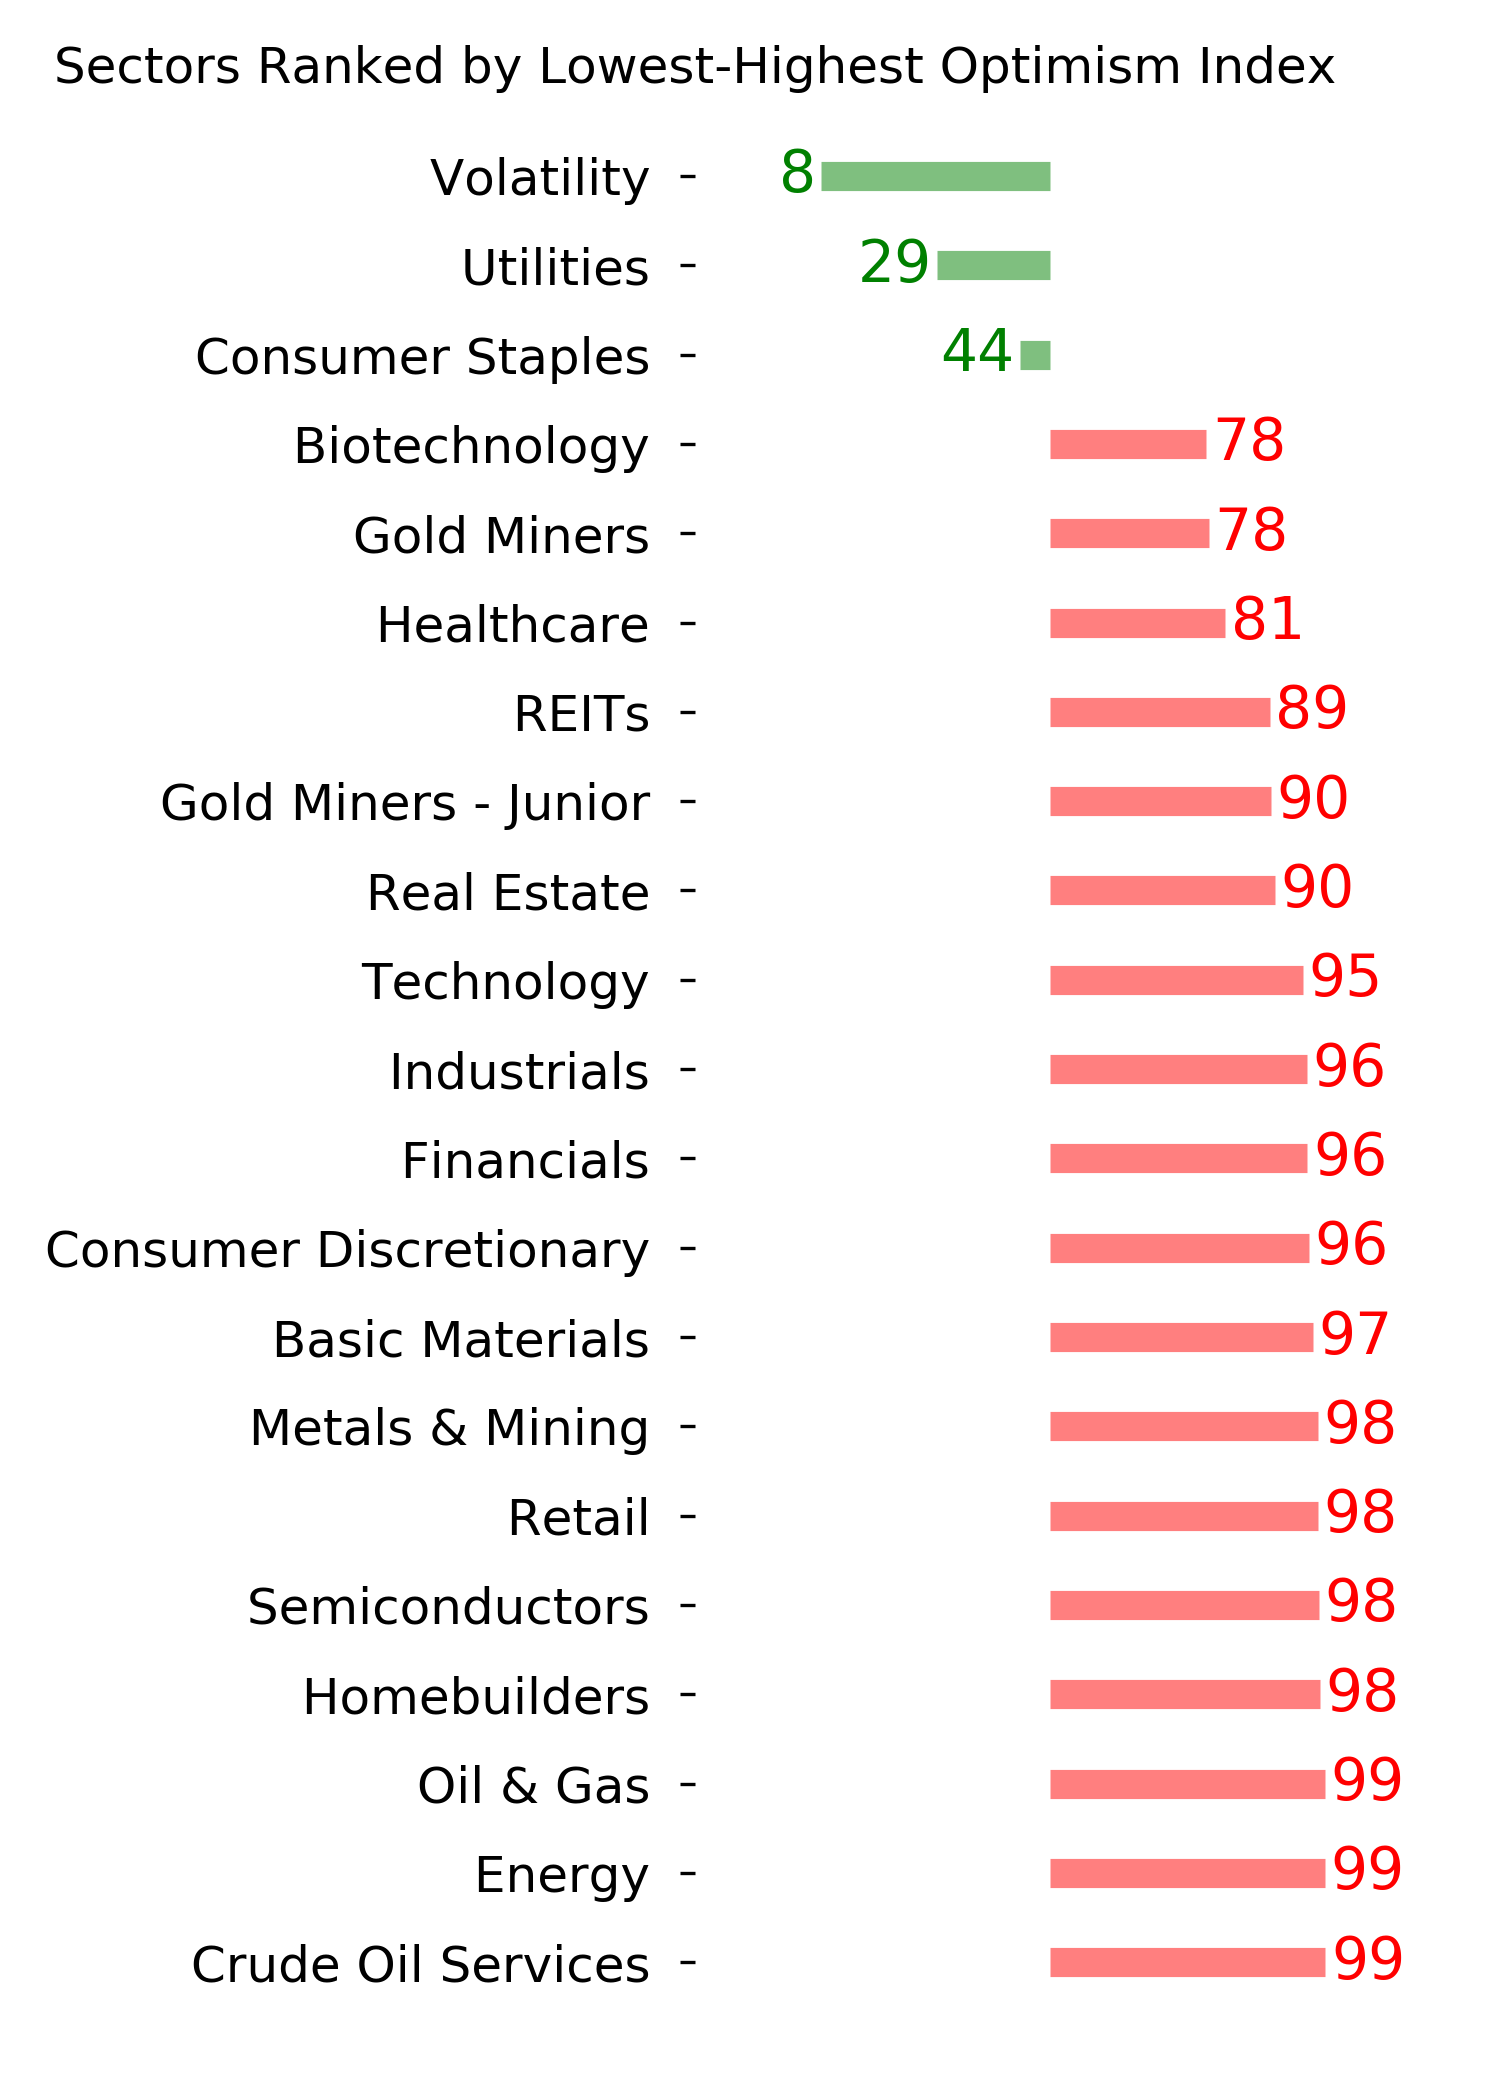
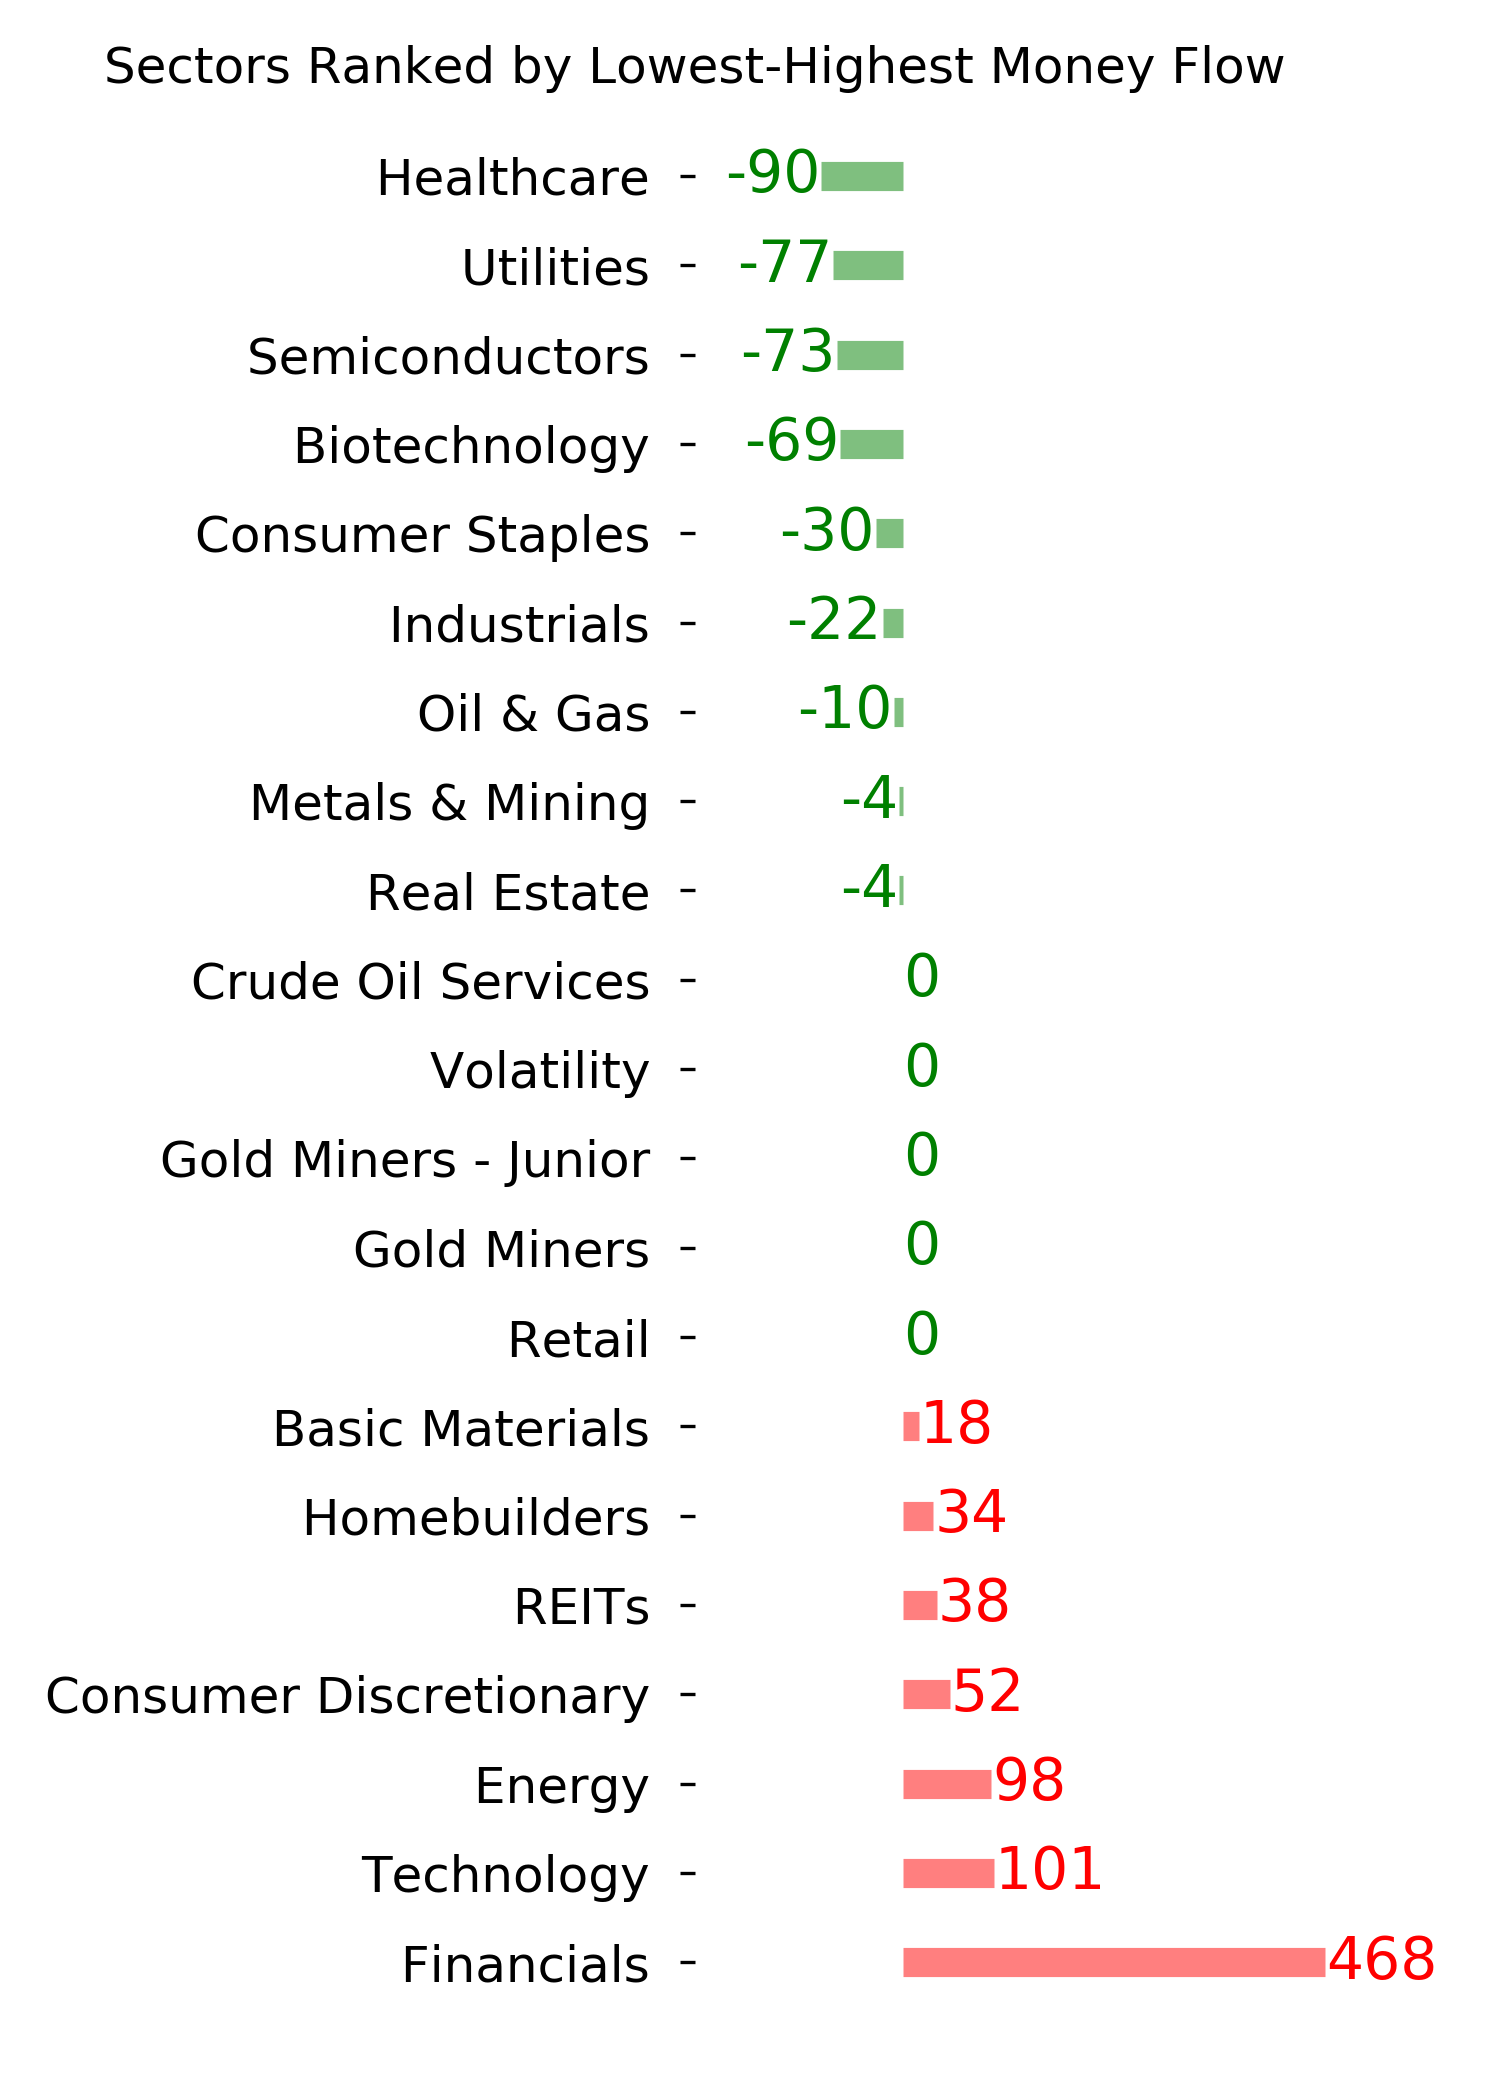
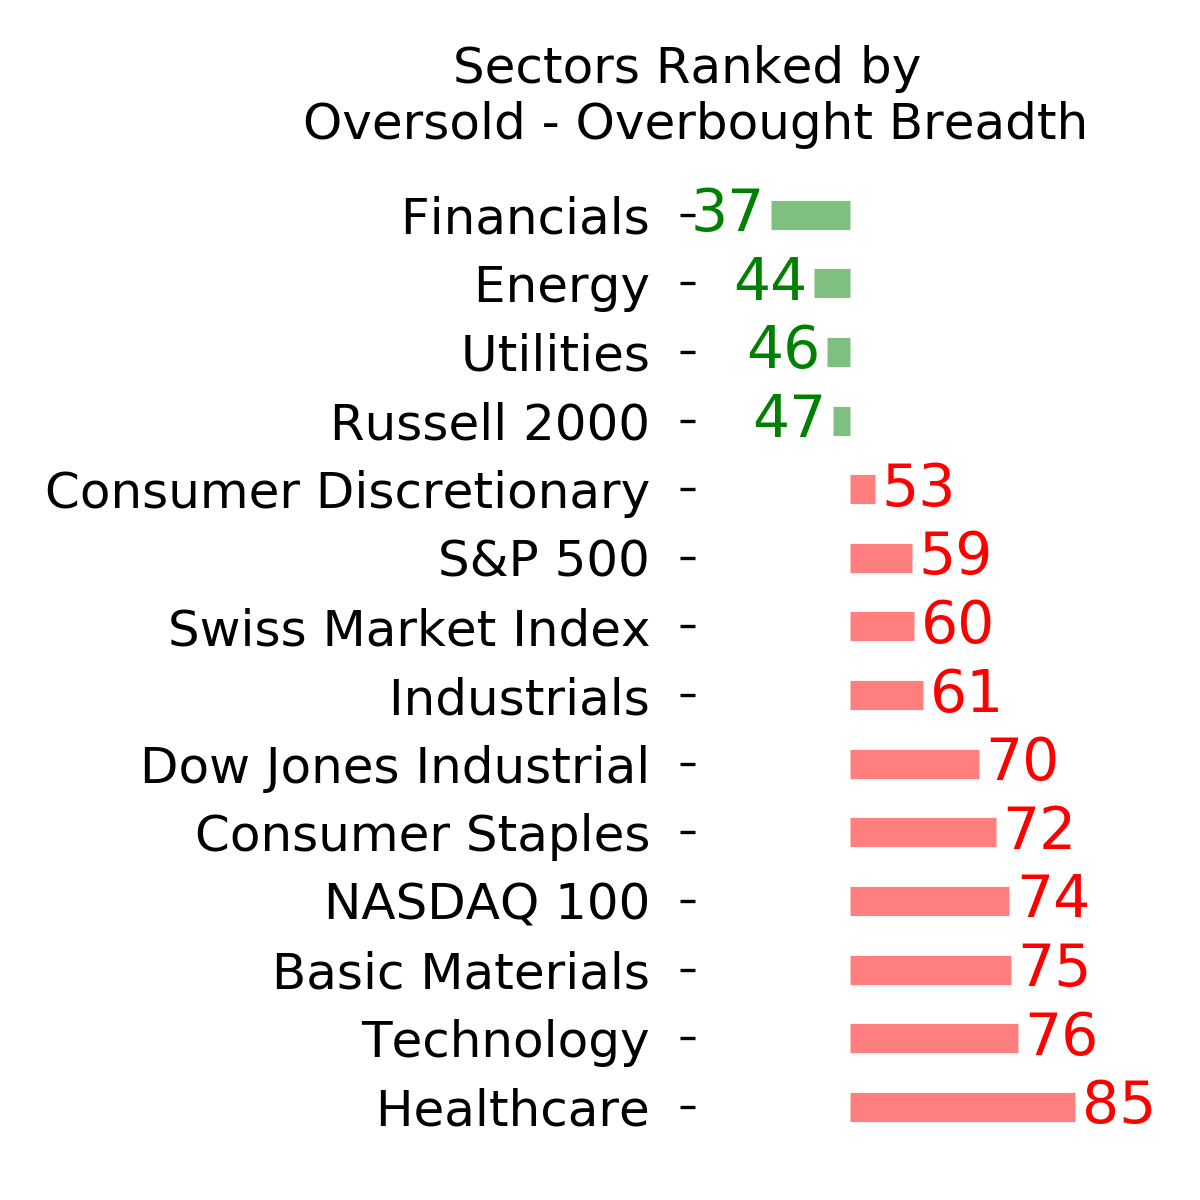
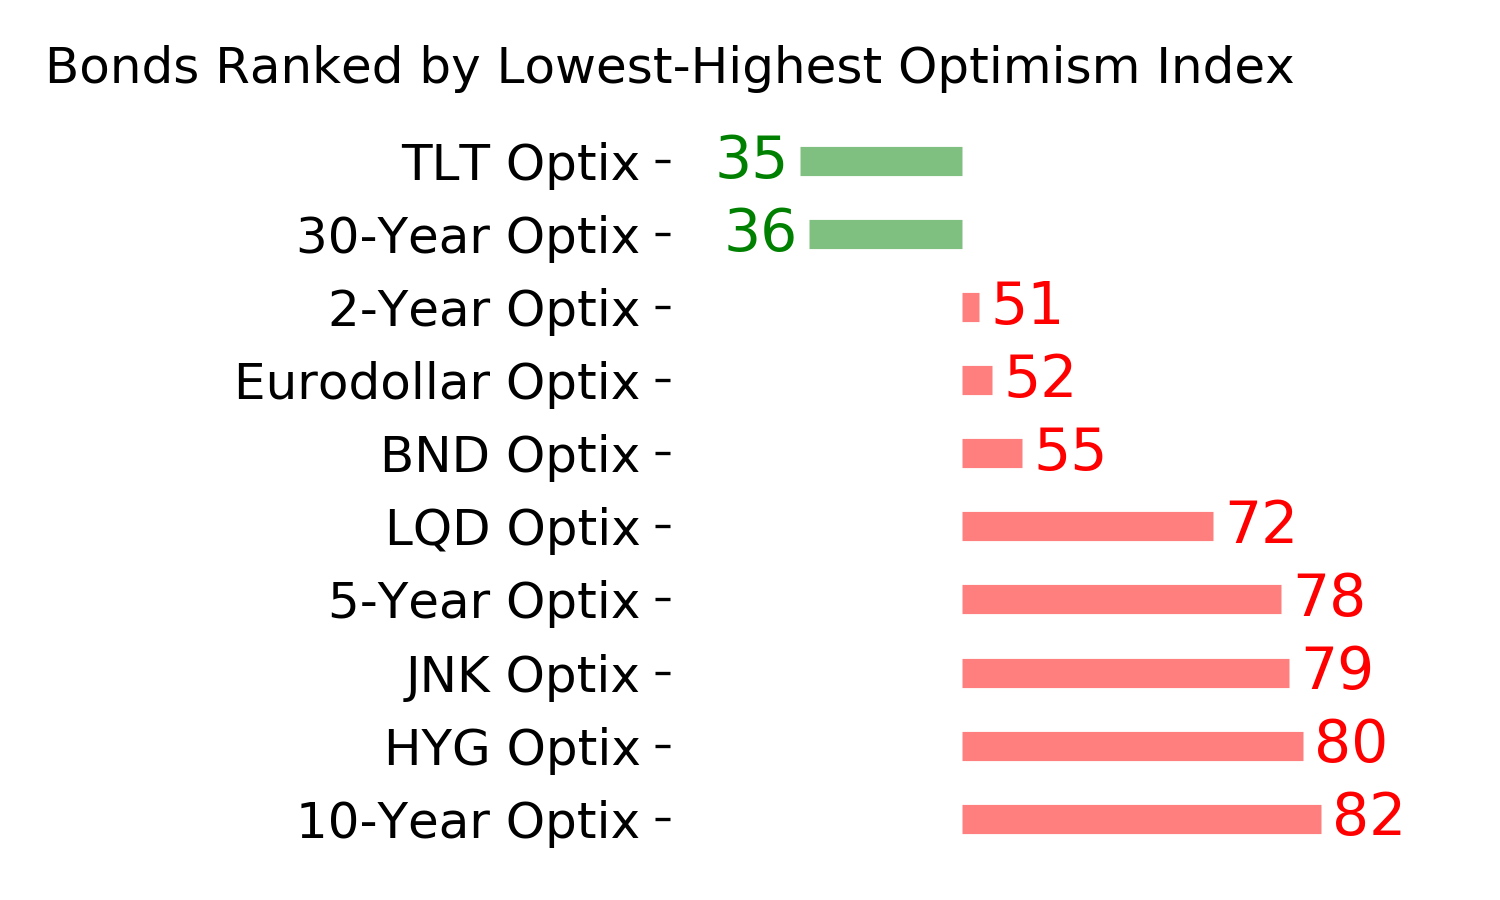
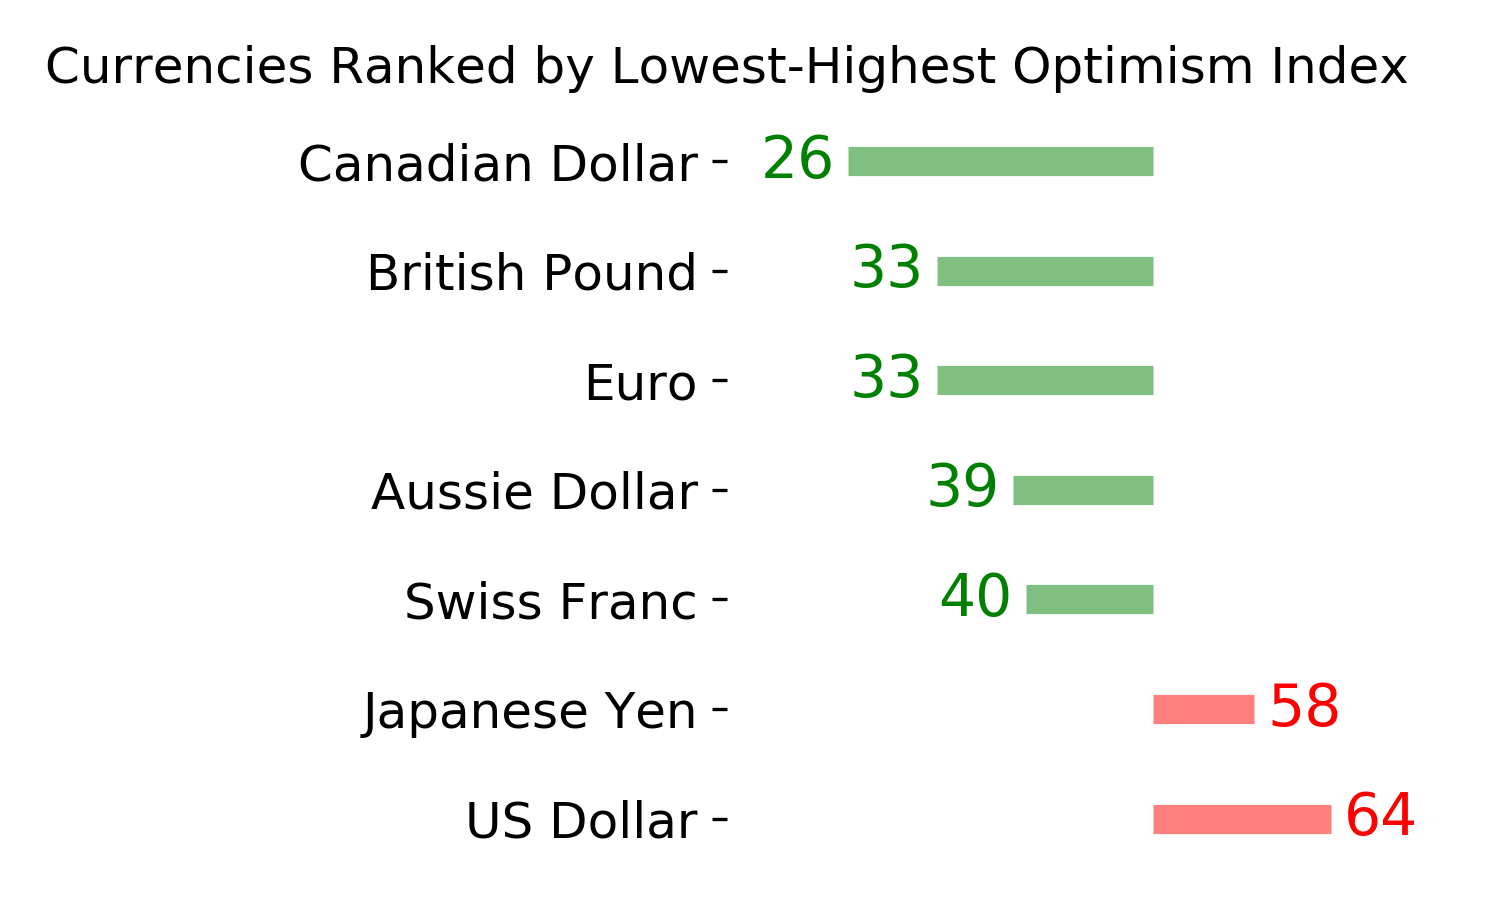
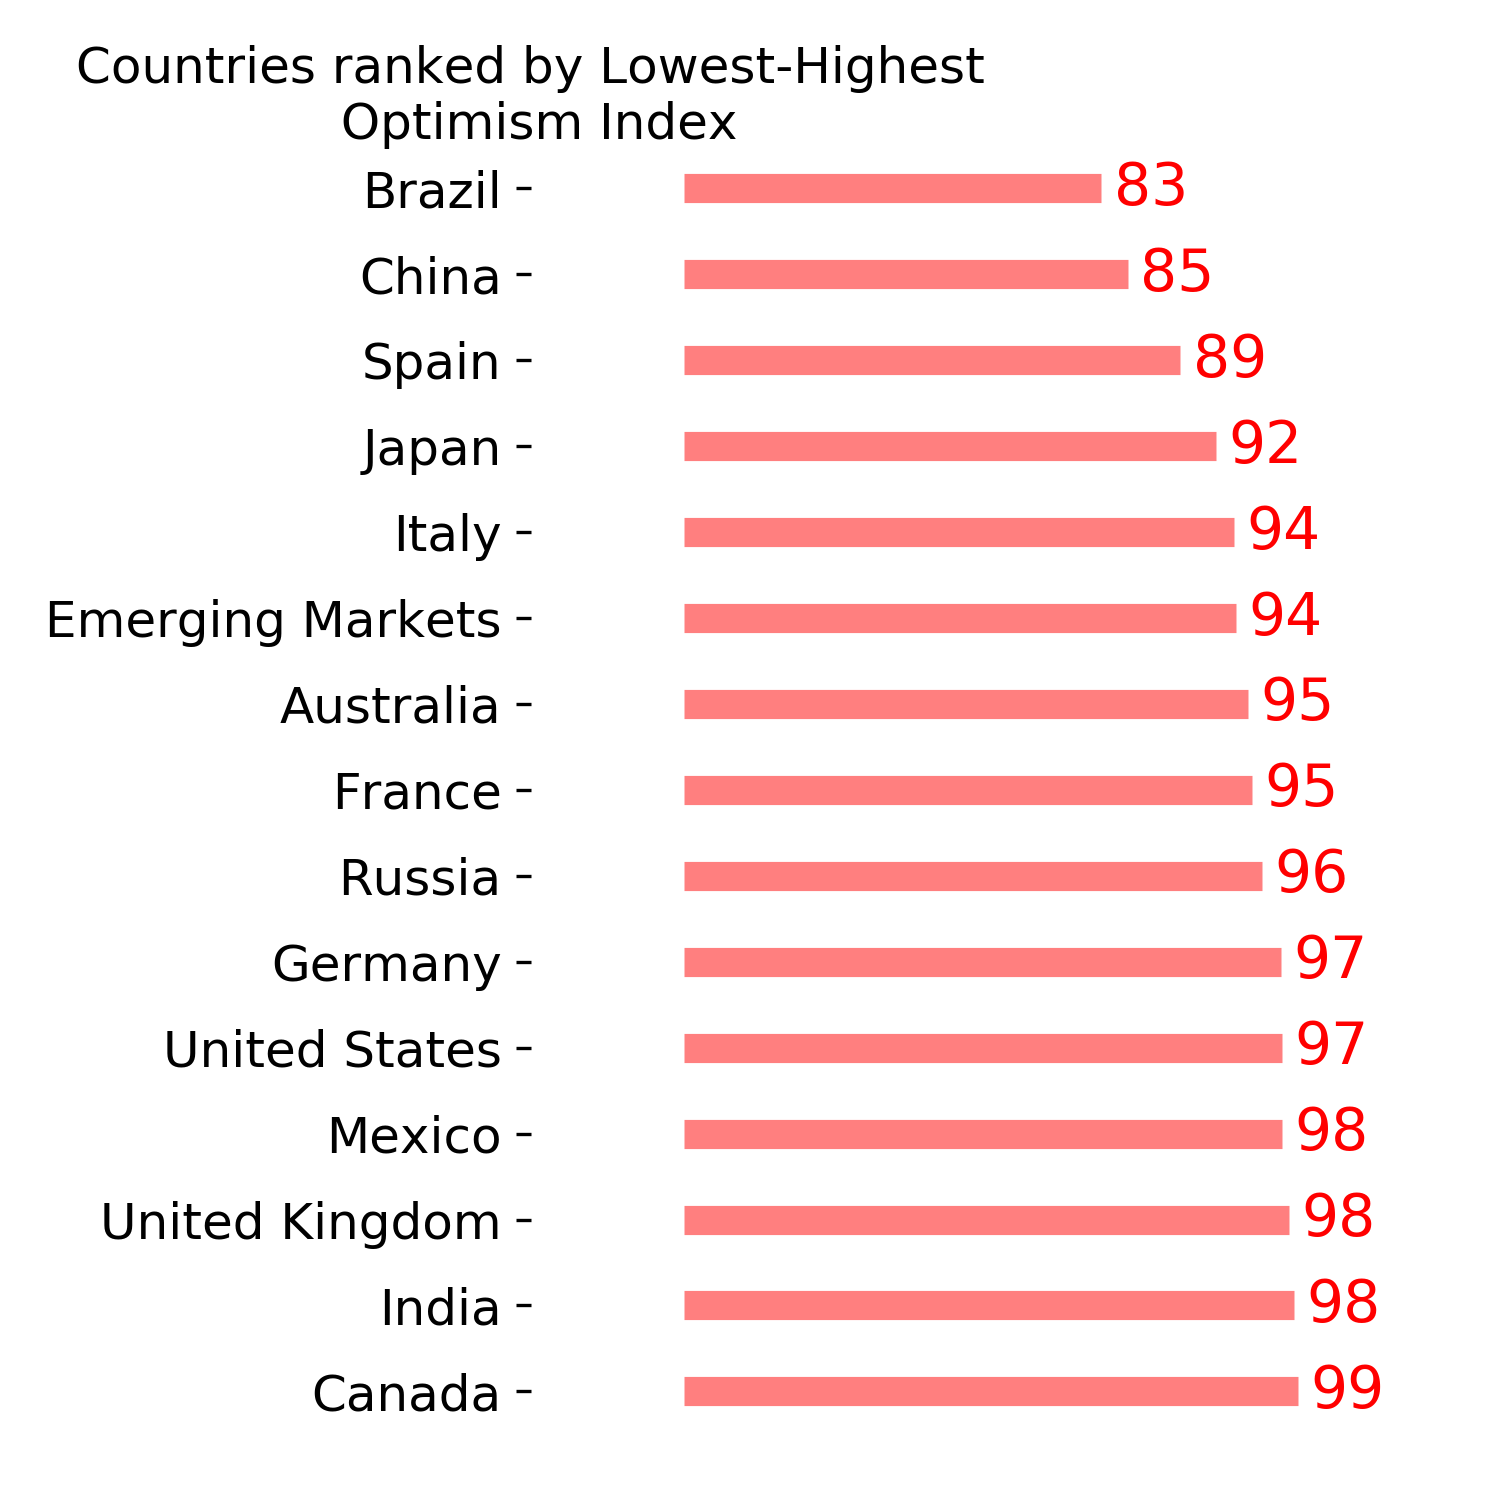
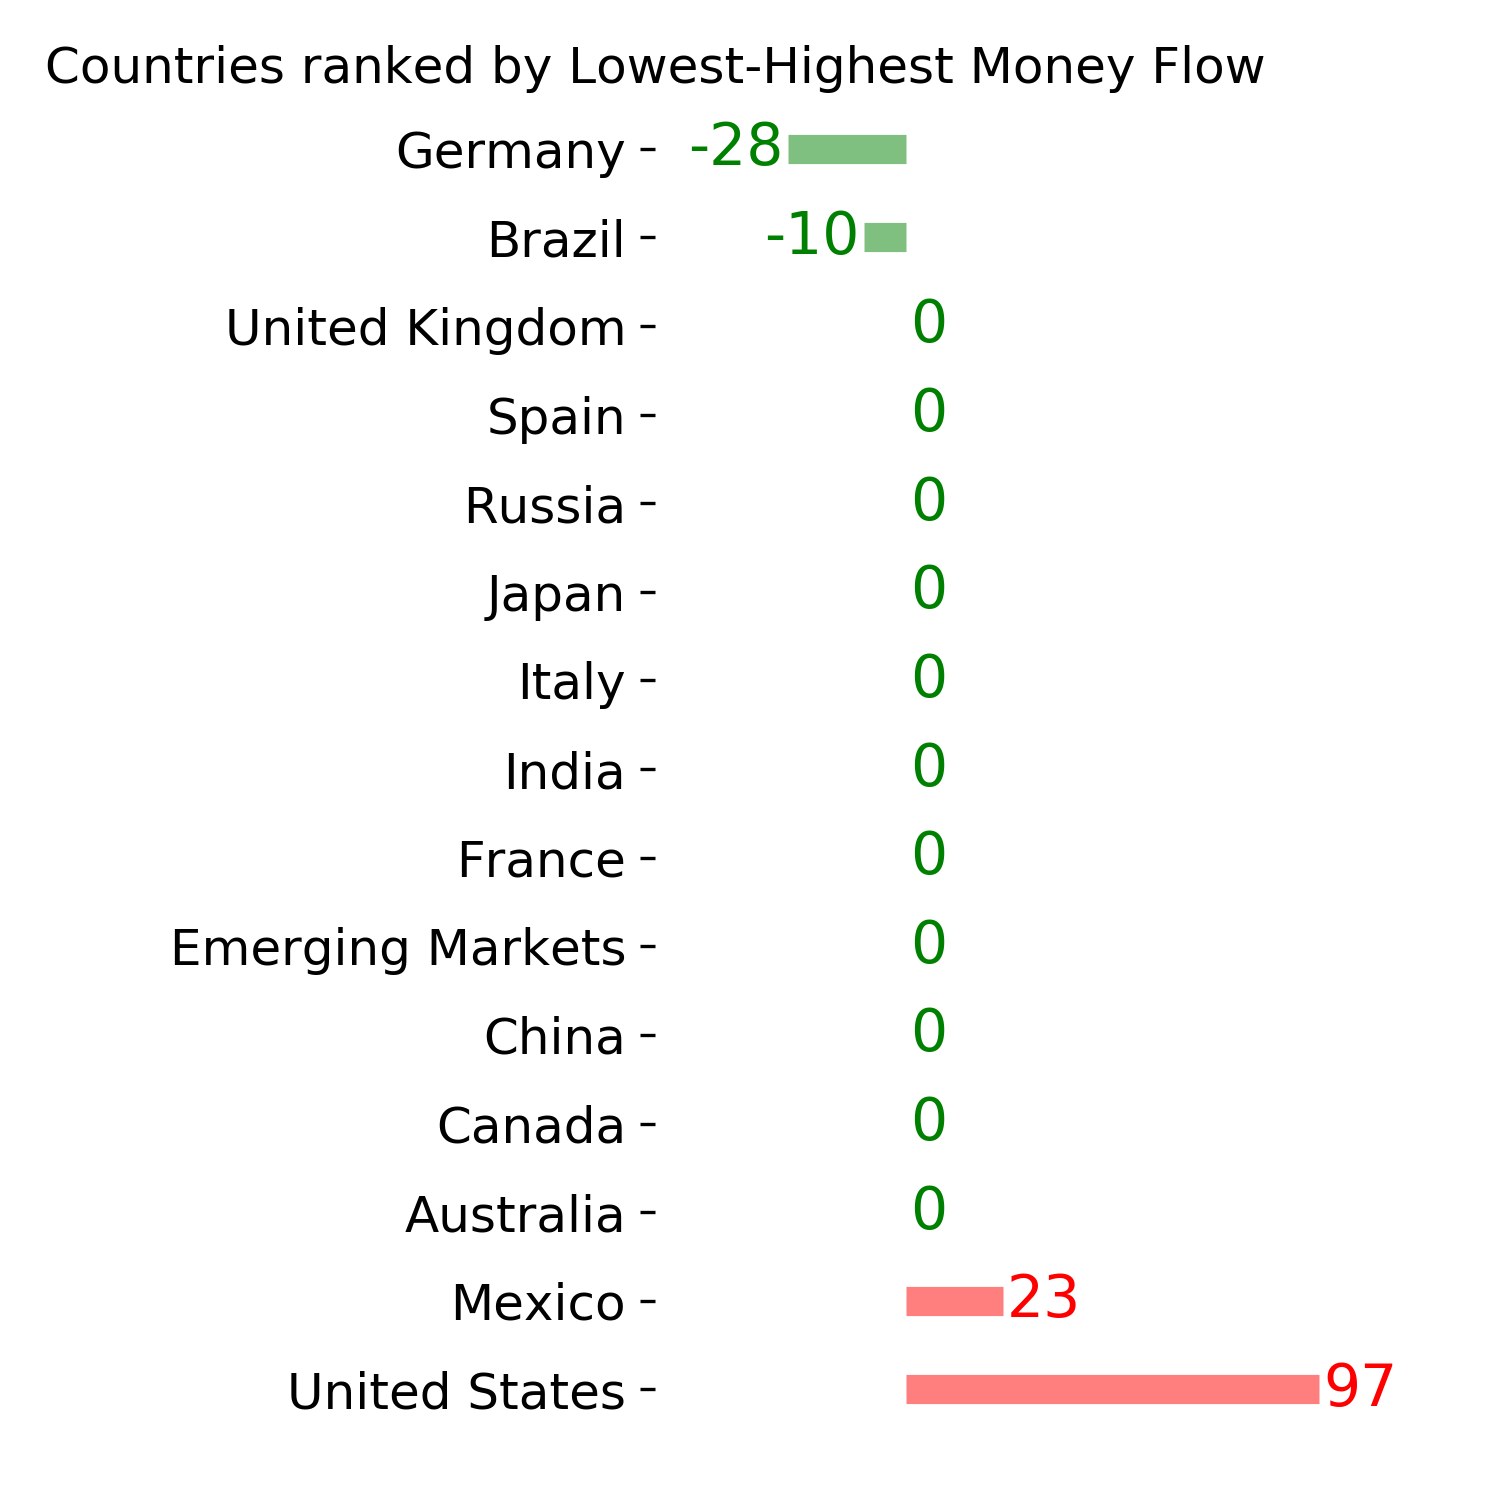
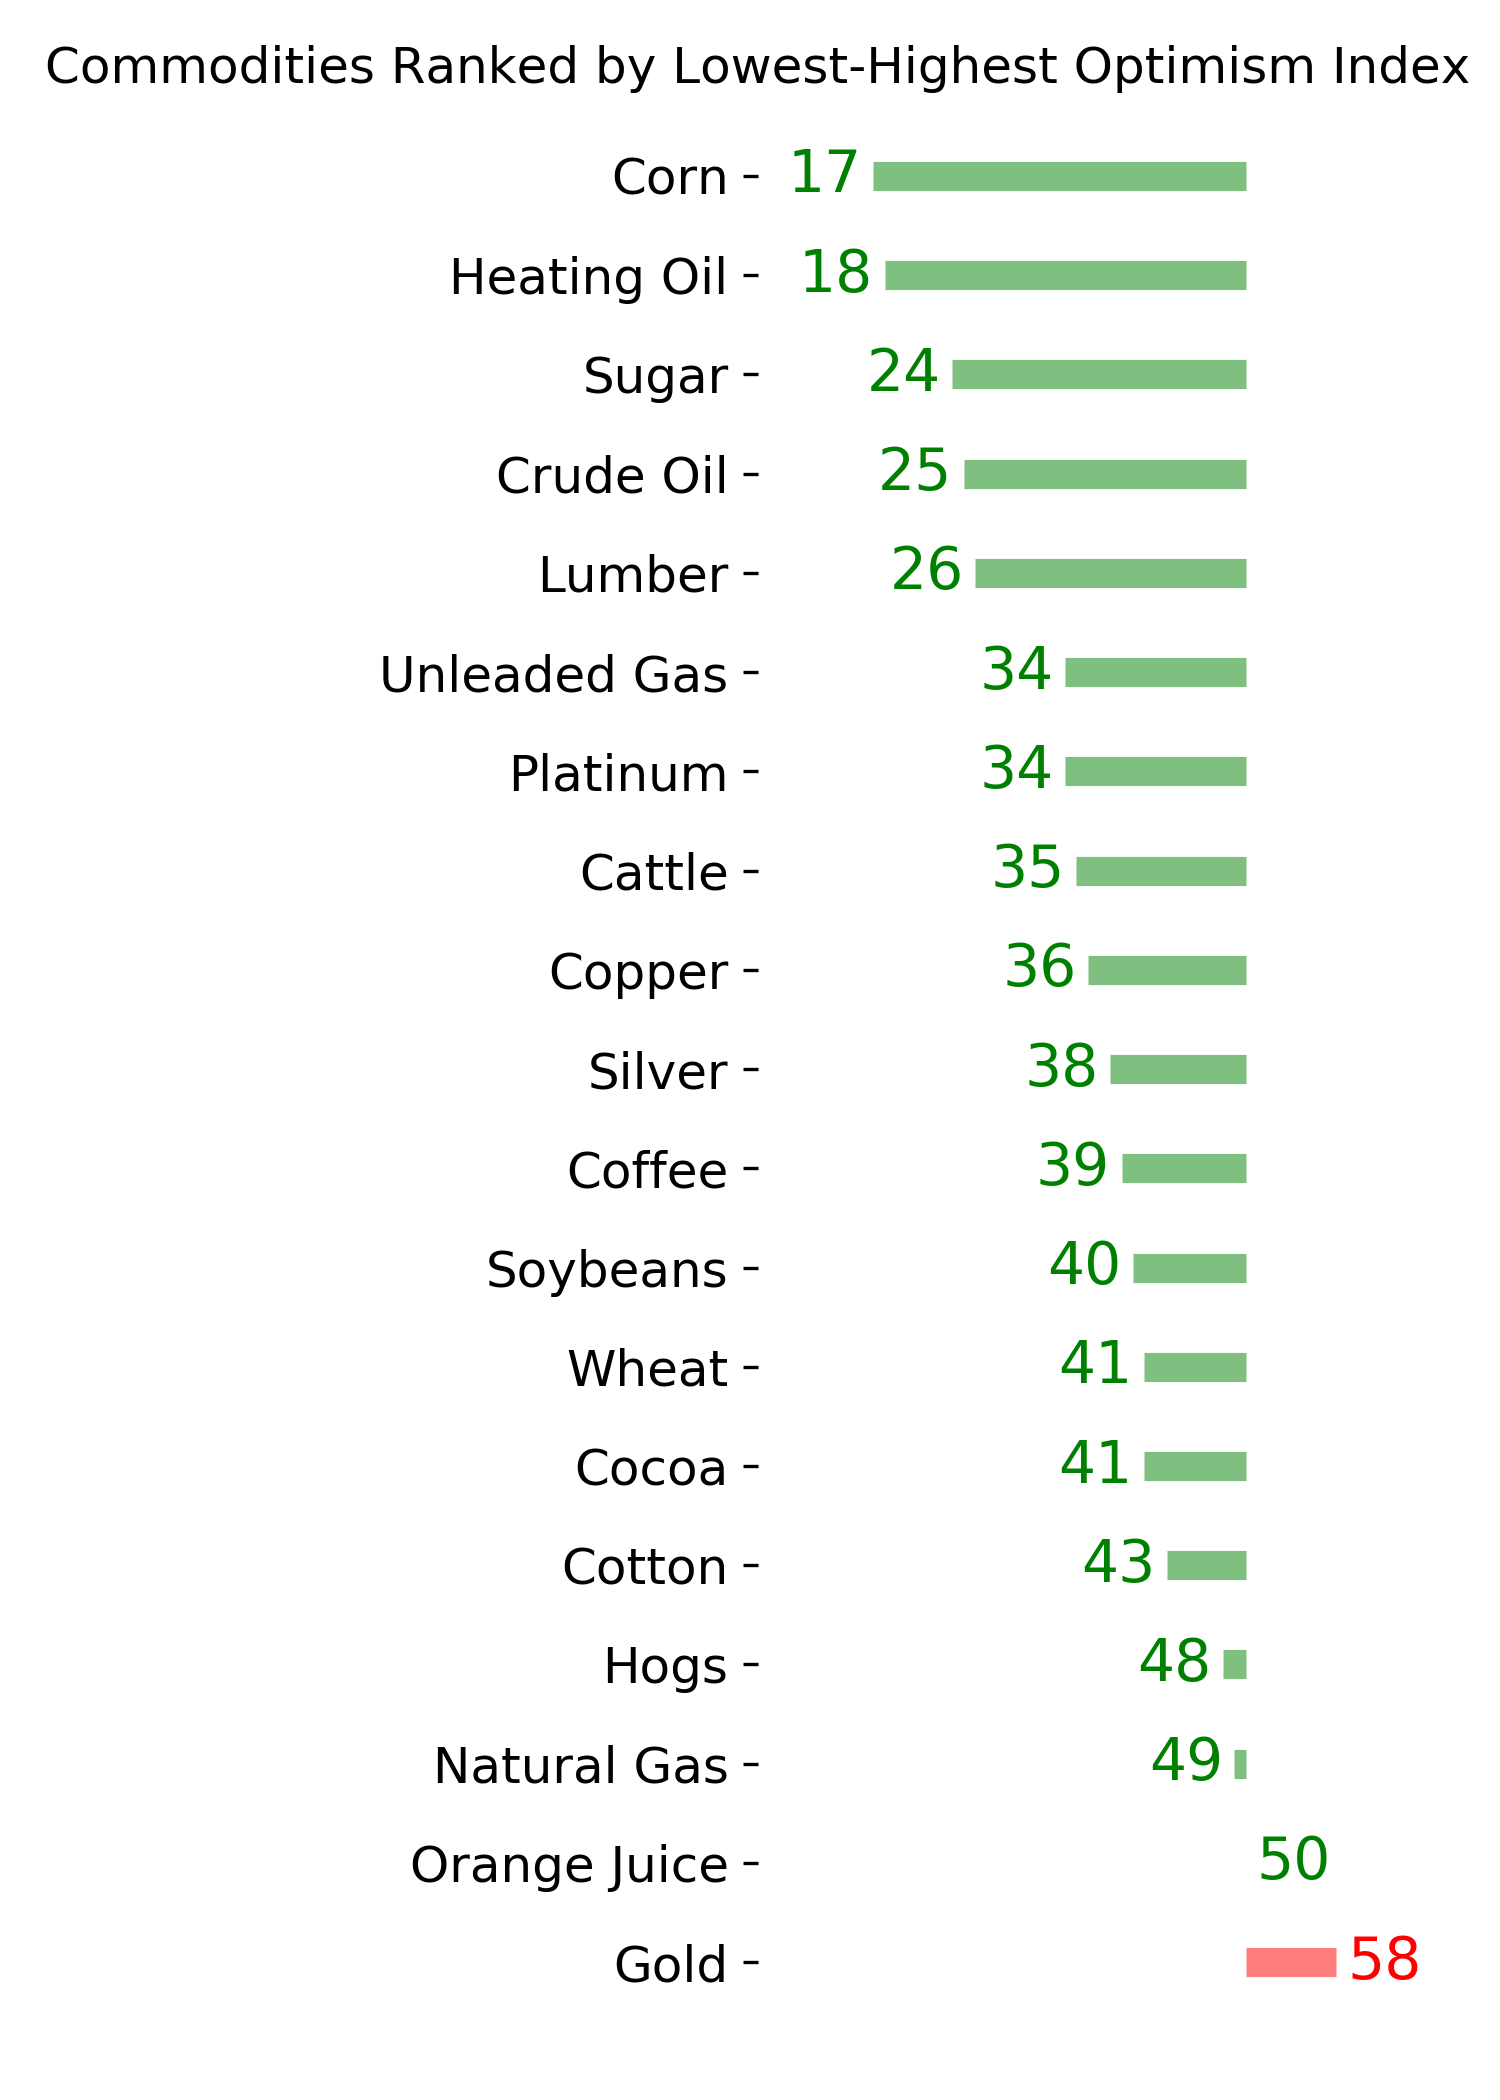
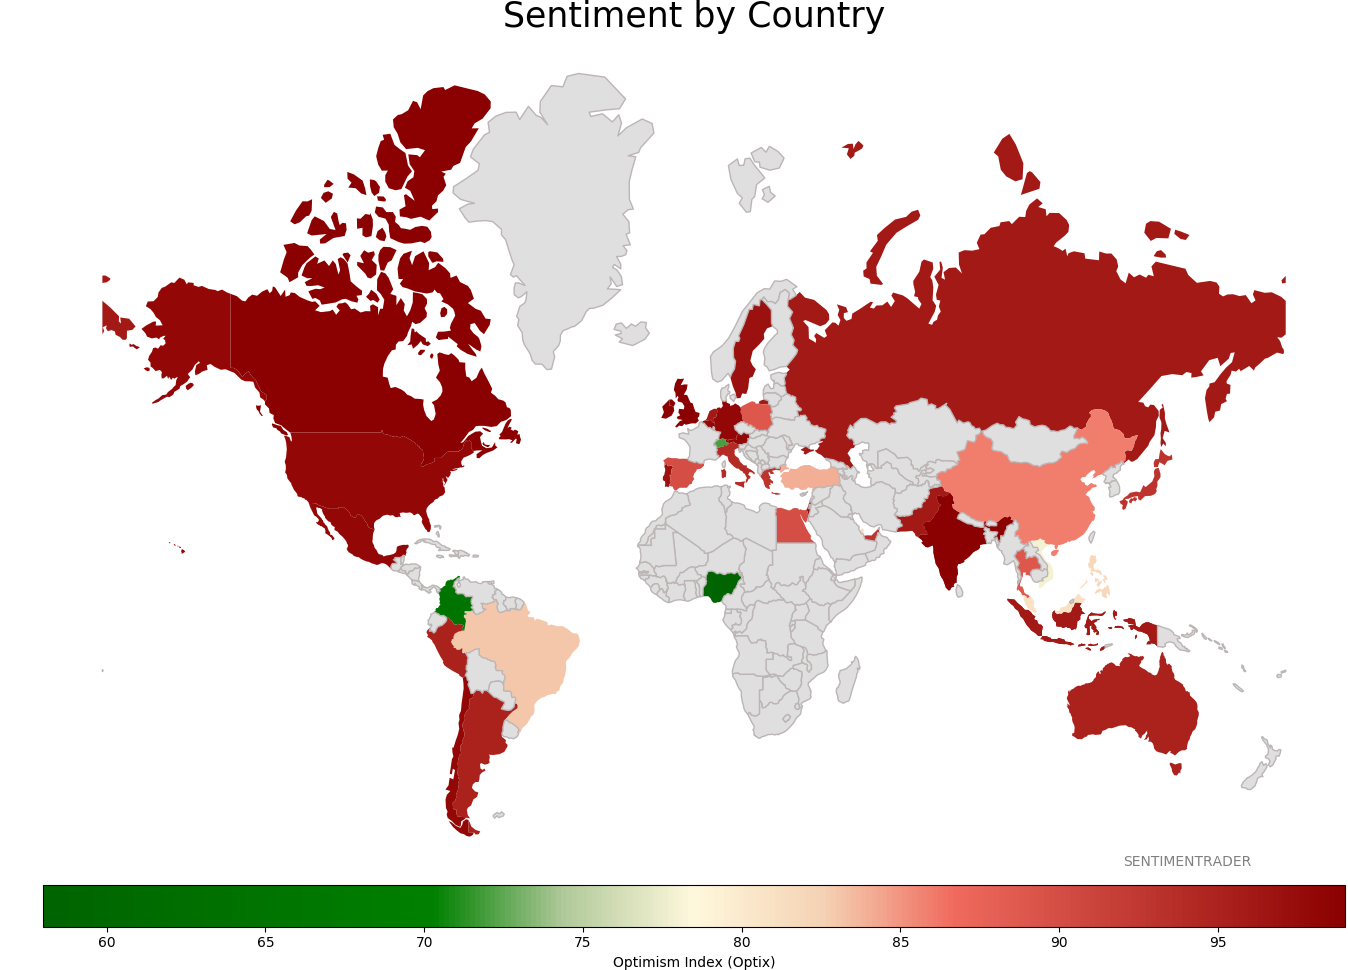
Ranks
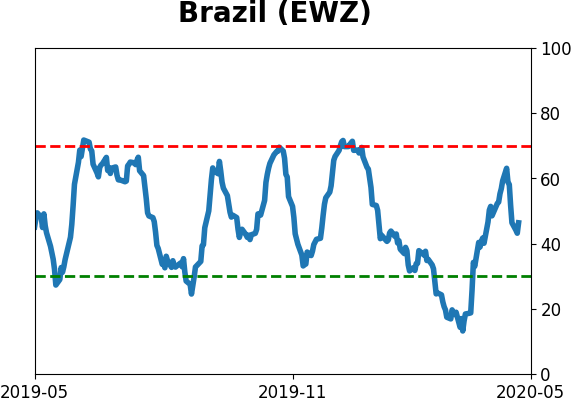
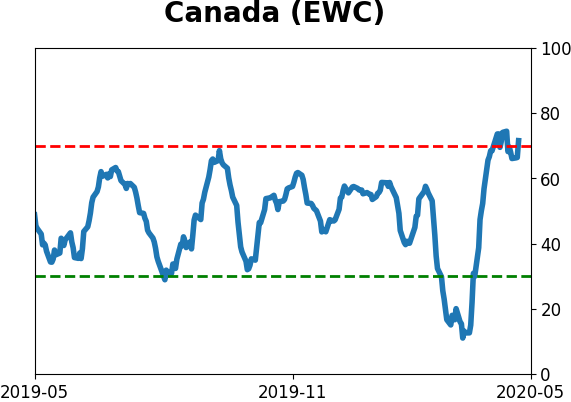
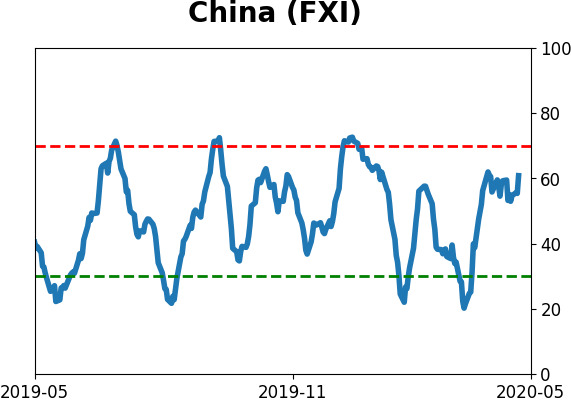
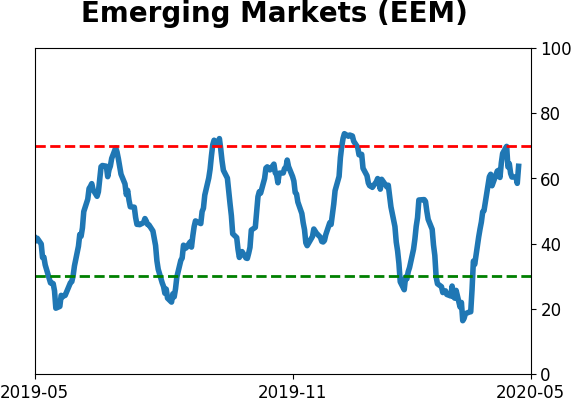
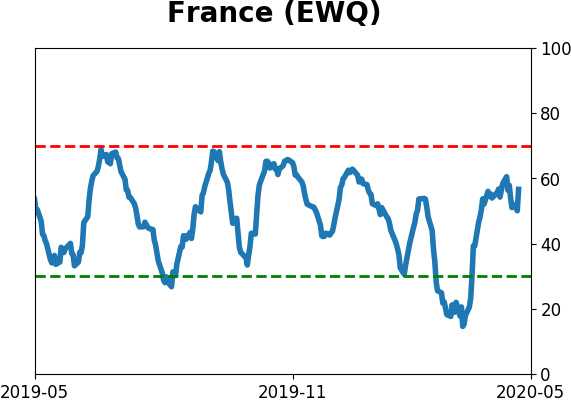
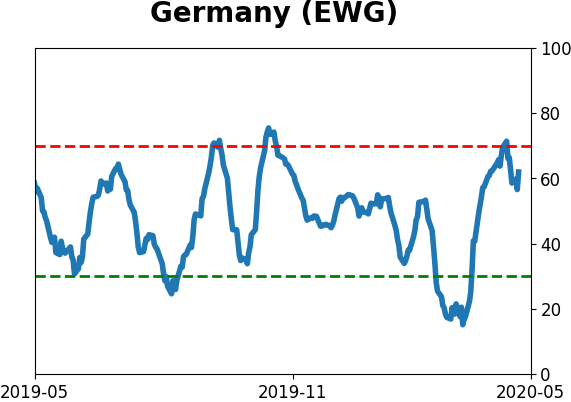
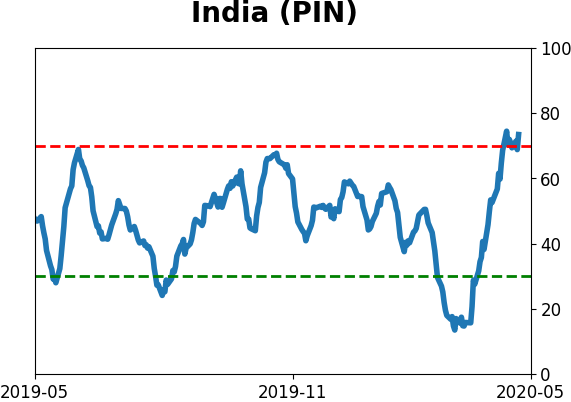
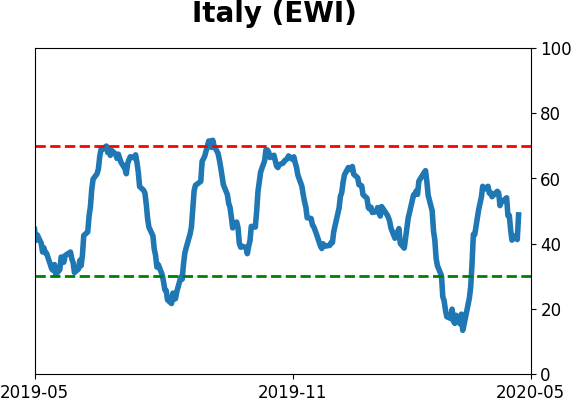
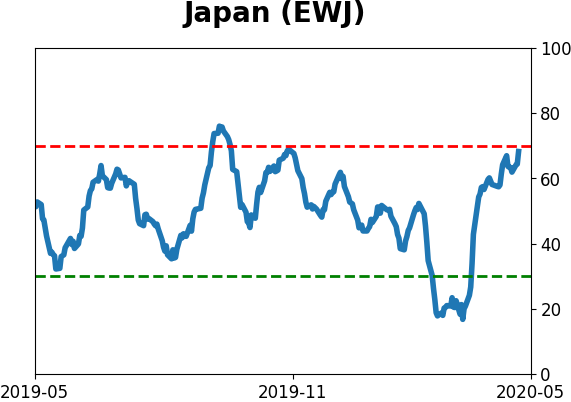
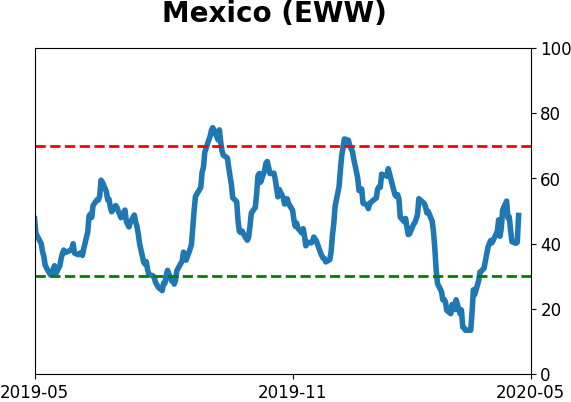
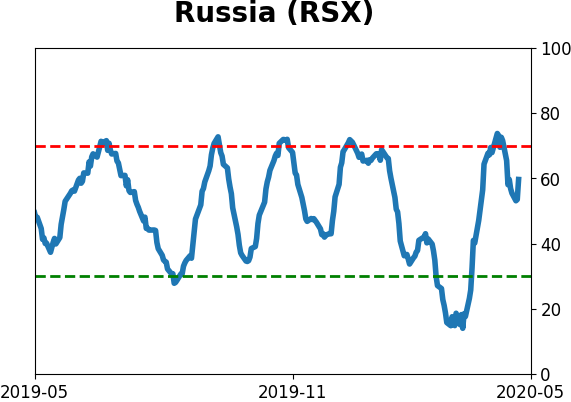
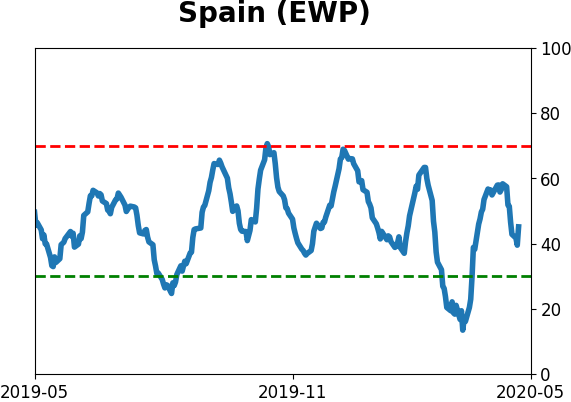
Sentiment Around The World
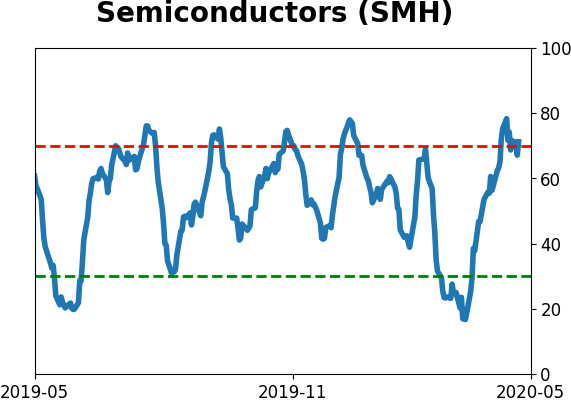
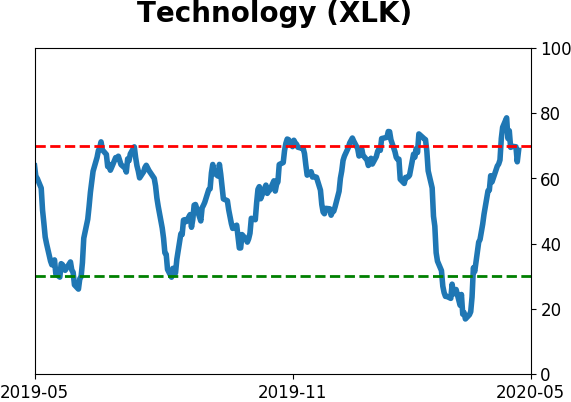
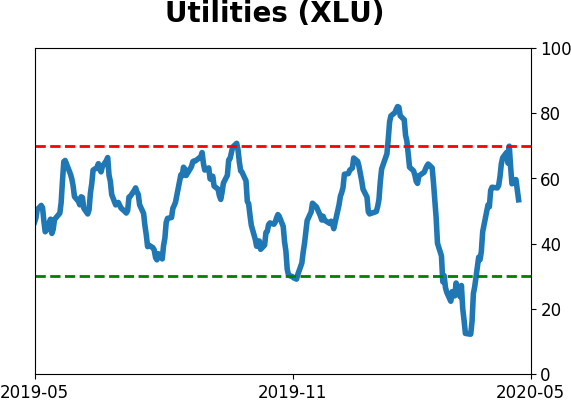
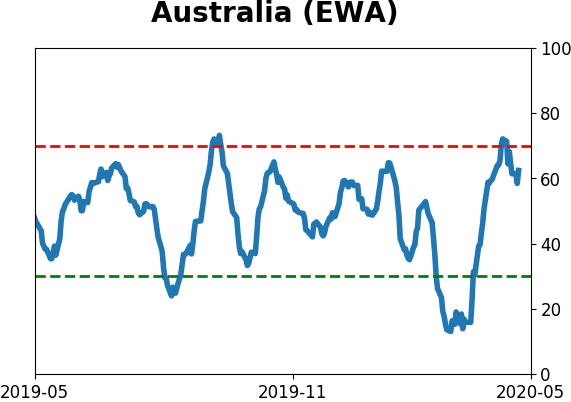
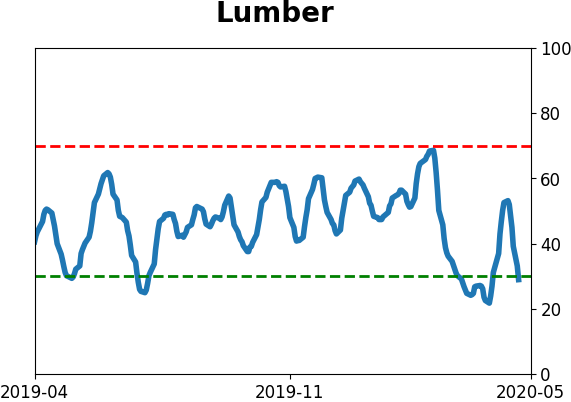
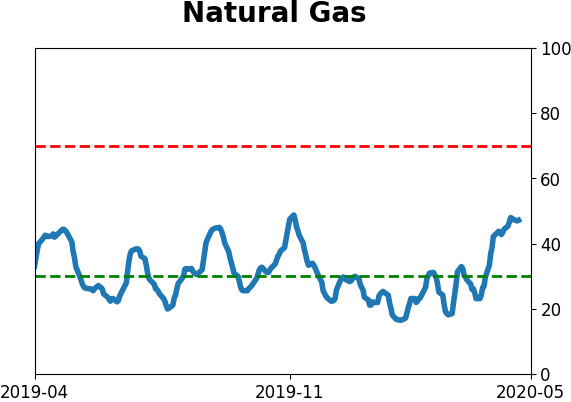
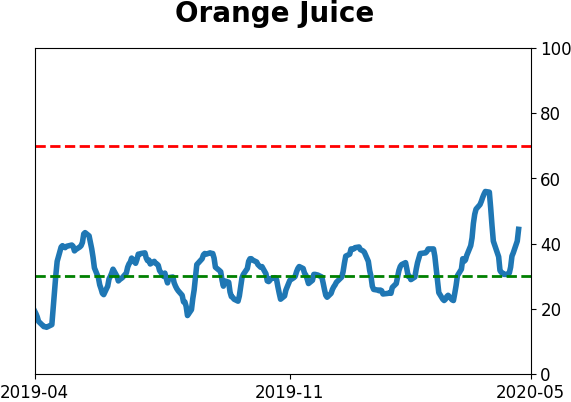
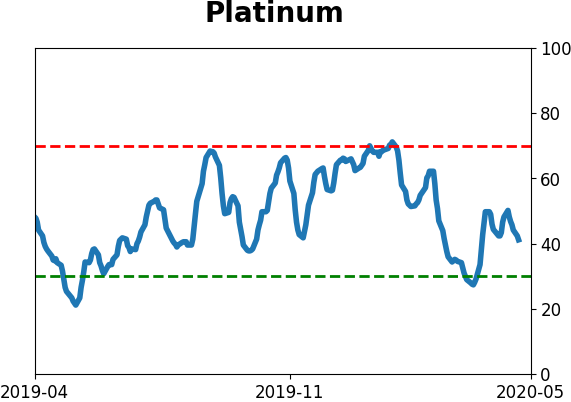
Optimism Index Thumbnails
|
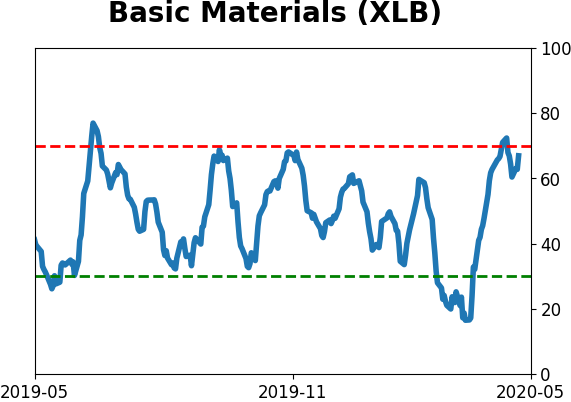
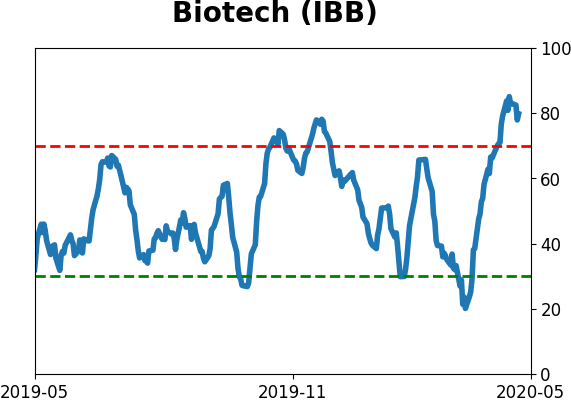
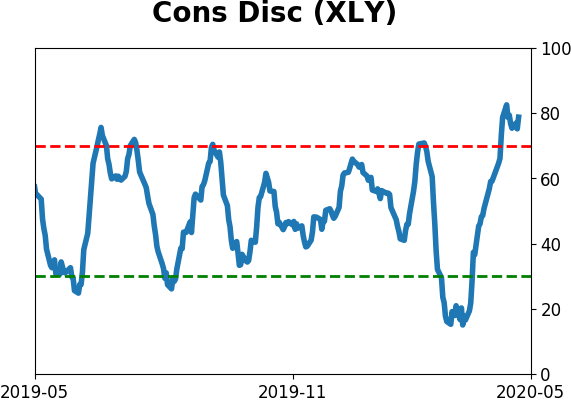
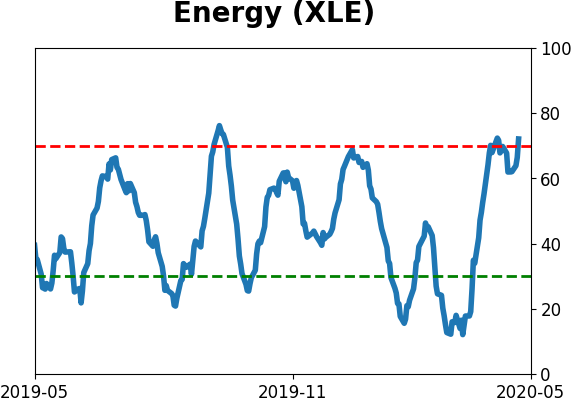
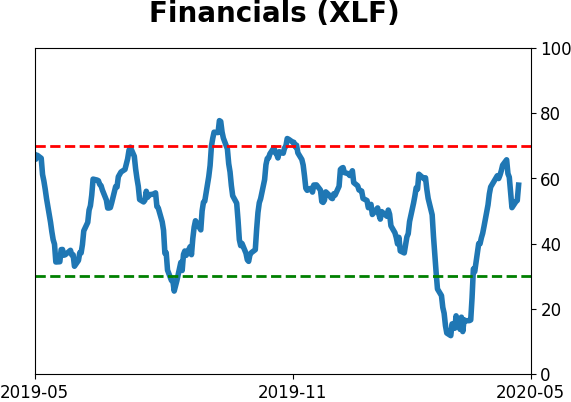
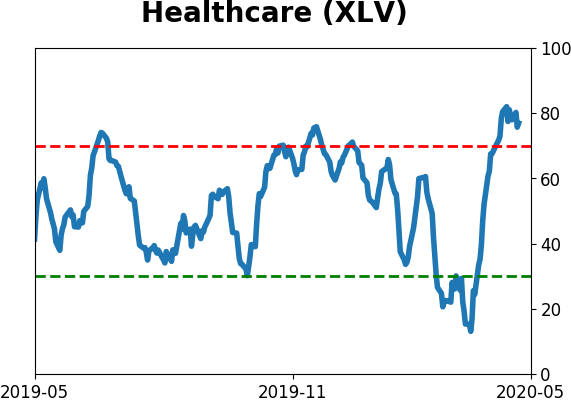
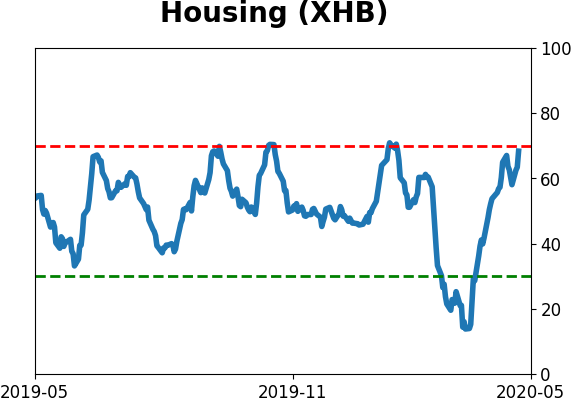
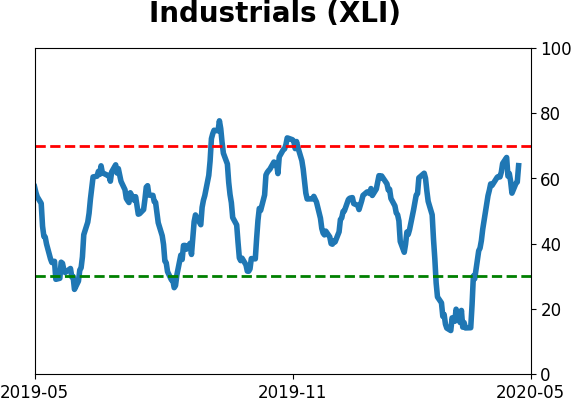
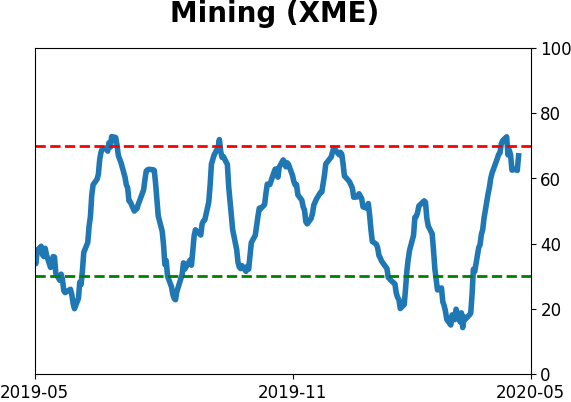
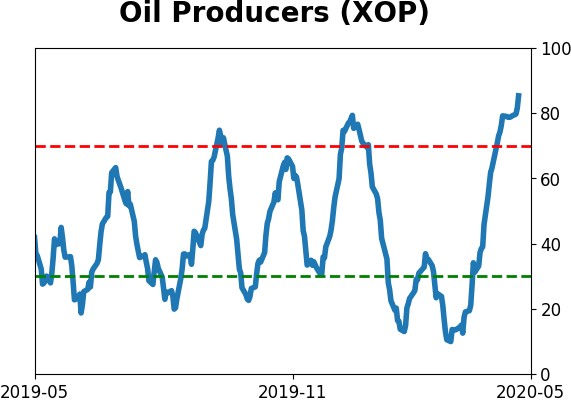
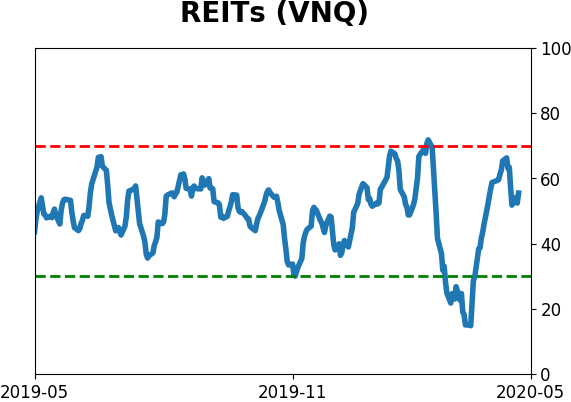
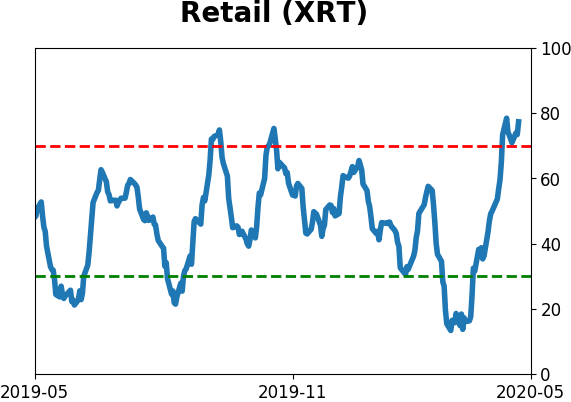
Sector ETF's - 10-Day Moving Average
|
|
|
Country ETF's - 10-Day Moving Average
|
|
|
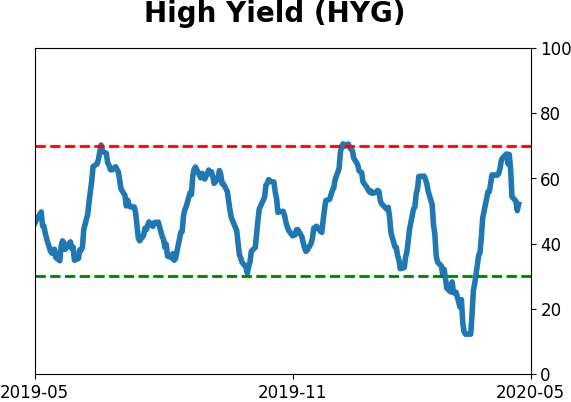
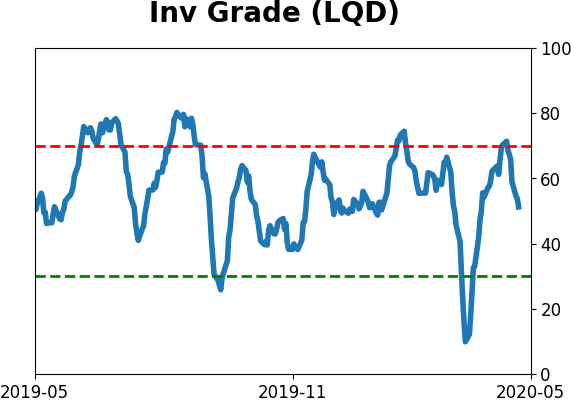
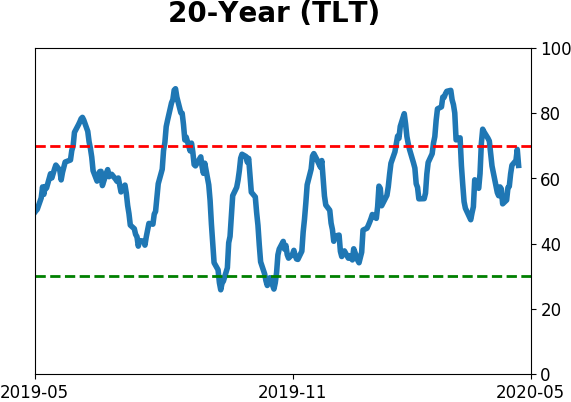
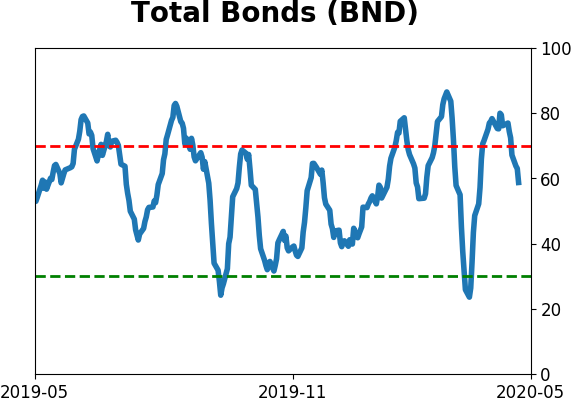
Bond ETF's - 10-Day Moving Average
|
|
|
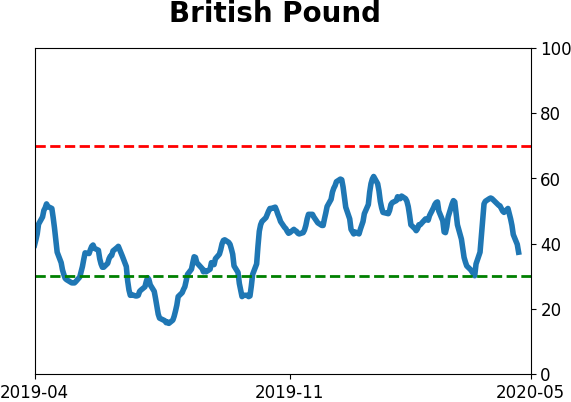
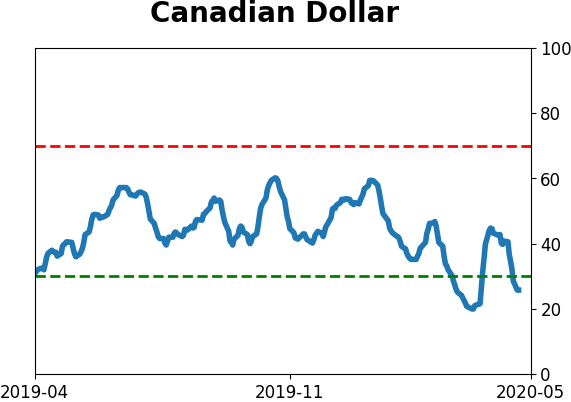
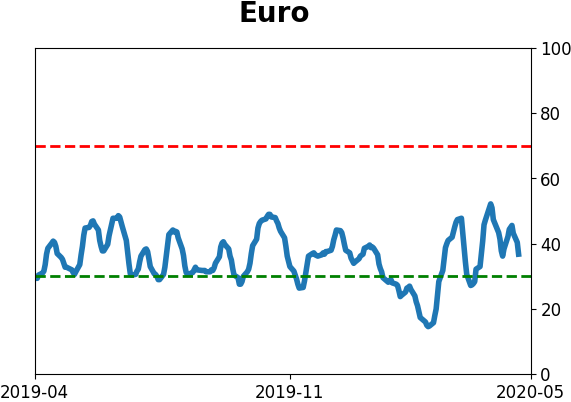
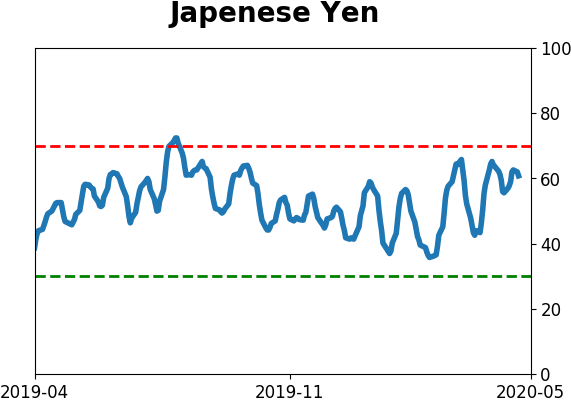
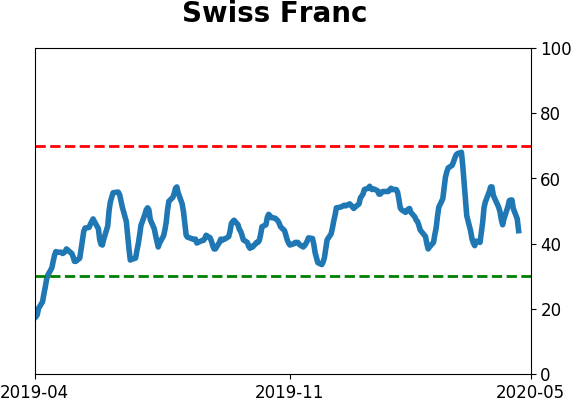
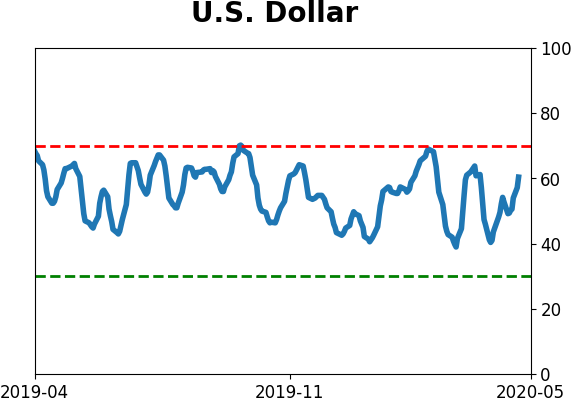
Currency ETF's - 5-Day Moving Average
|
|
|
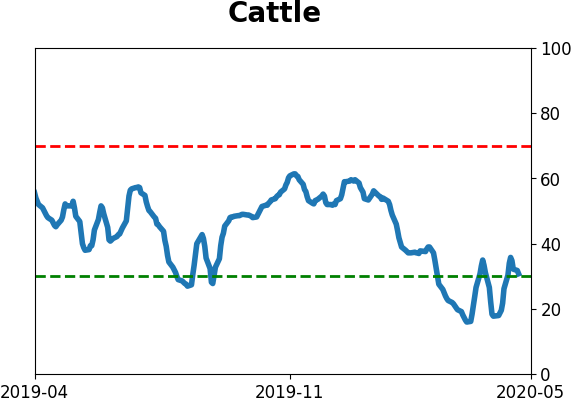
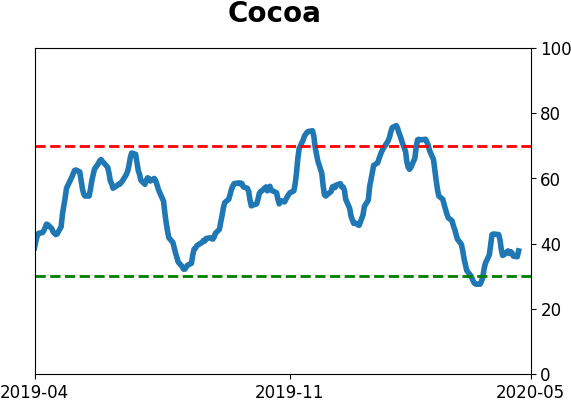
Commodity ETF's - 5-Day Moving Average
|
|