Headlines
|
|
Big Money is showing near record optimism:
The Barron's Big Money poll shows that large money managers are the 2nd most optimistic about stocks since 1999.
Bottom Line:
See the Outlook & Allocations page for more details on these summaries STOCKS: Weak sell
The extreme speculation registered in January and February is starting to get wrung out. Internal dynamics have mostly held up, so a return to neutral sentiment conditions would improve the forward risk/reward profile substantially. We're still a ways off from that. BONDS: Weak buy
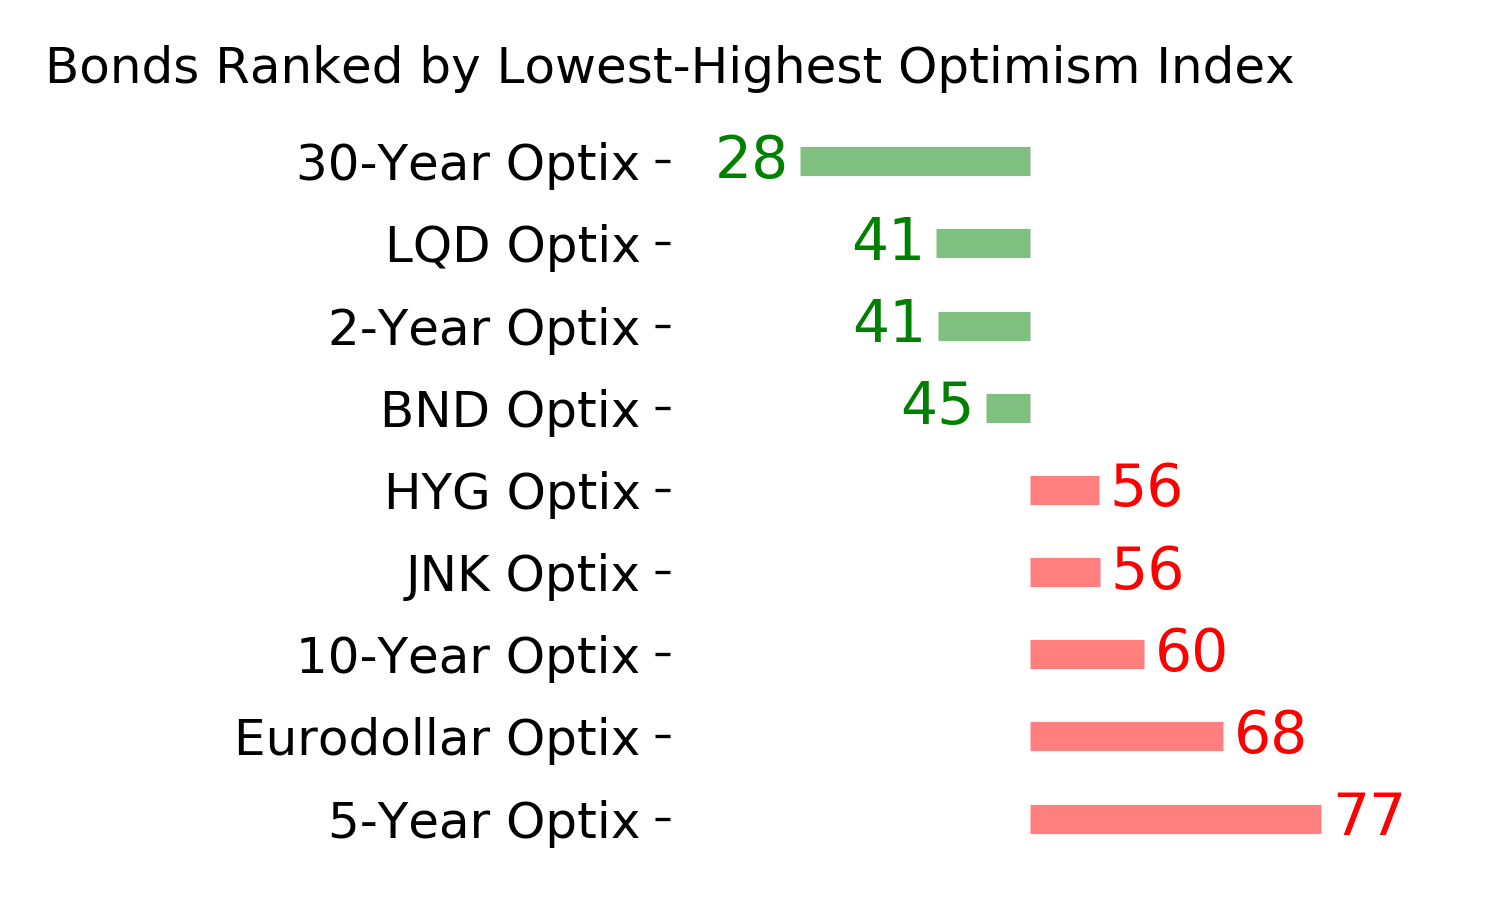
Various parts of the market have been hit in recent weeks, with mild oversold conditions. The Bond Optimism Index is now about as low as it gets during healthy bond market environments. Fixed income isn't responding well, so that needs to be monitored in case it's transitioning to a longer-term negative market environment. GOLD: Weak buy
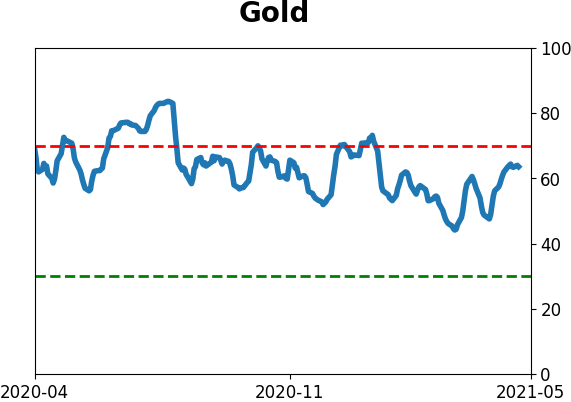
A dollar trying to rebound from a severe short position has weighed on gold and miners. The types of signals they've given in recent weeks, within the context of their recent surge, have usually resulted in higher prices over a medium- to long-term time frame. Like bonds, gold and miners aren't responding very well, and this needs to be monitored.
|
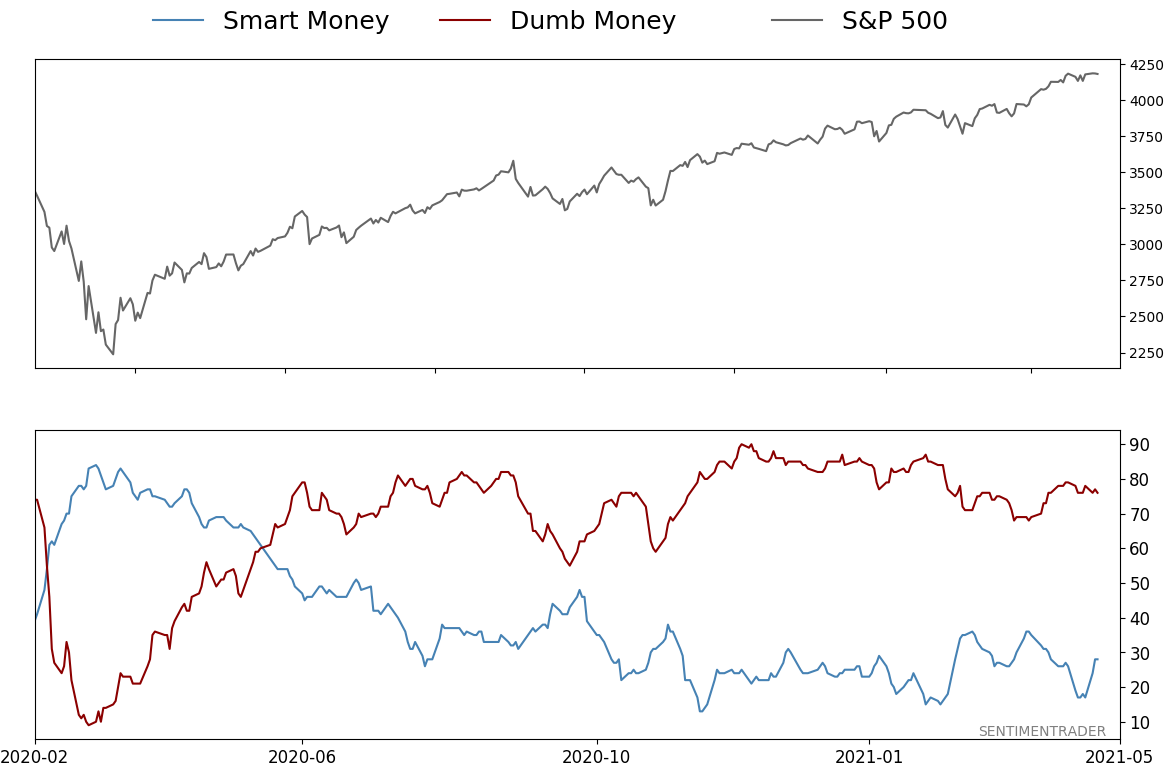
Smart / Dumb Money Confidence
|
Smart Money Confidence: 28%
Dumb Money Confidence: 76%
|
|
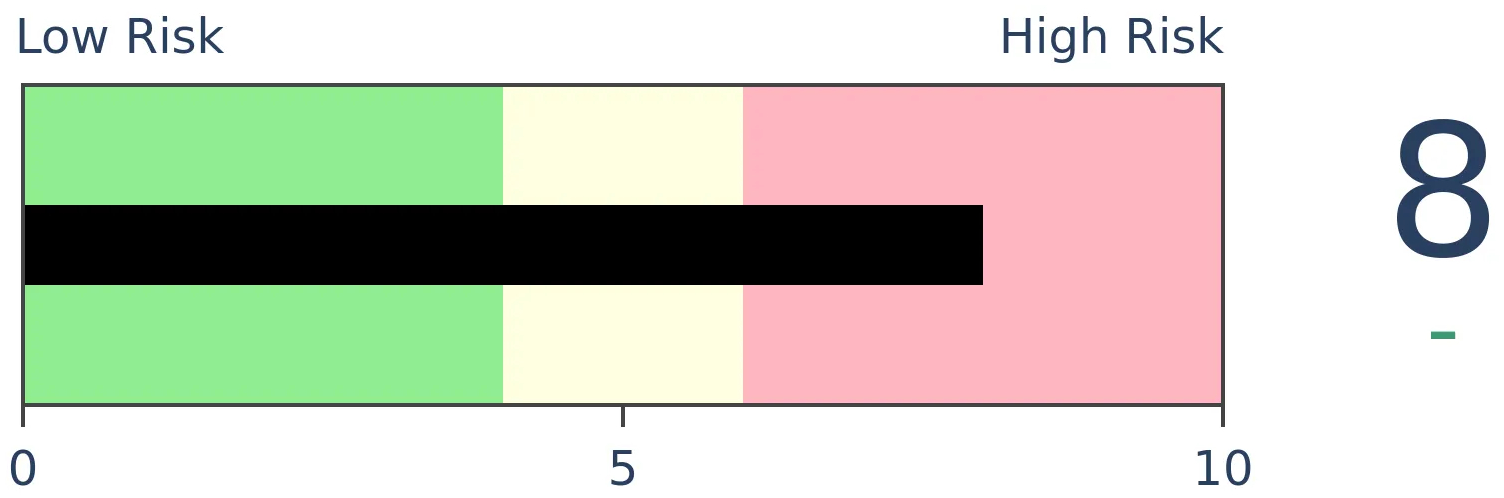
Risk Levels
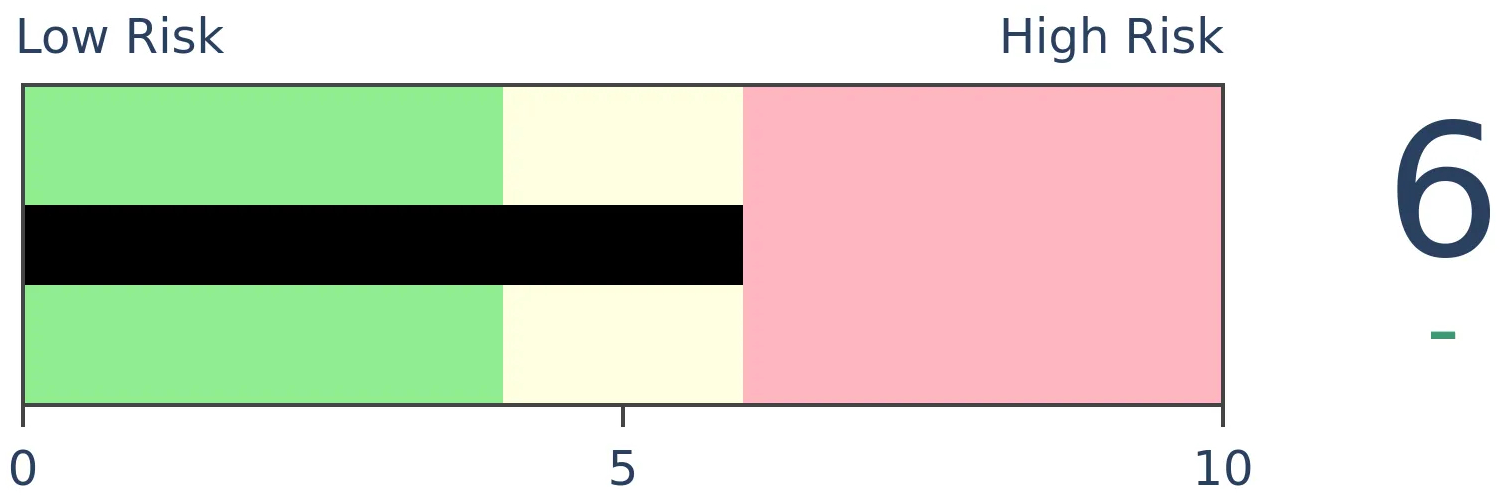
Stocks Short-Term

|
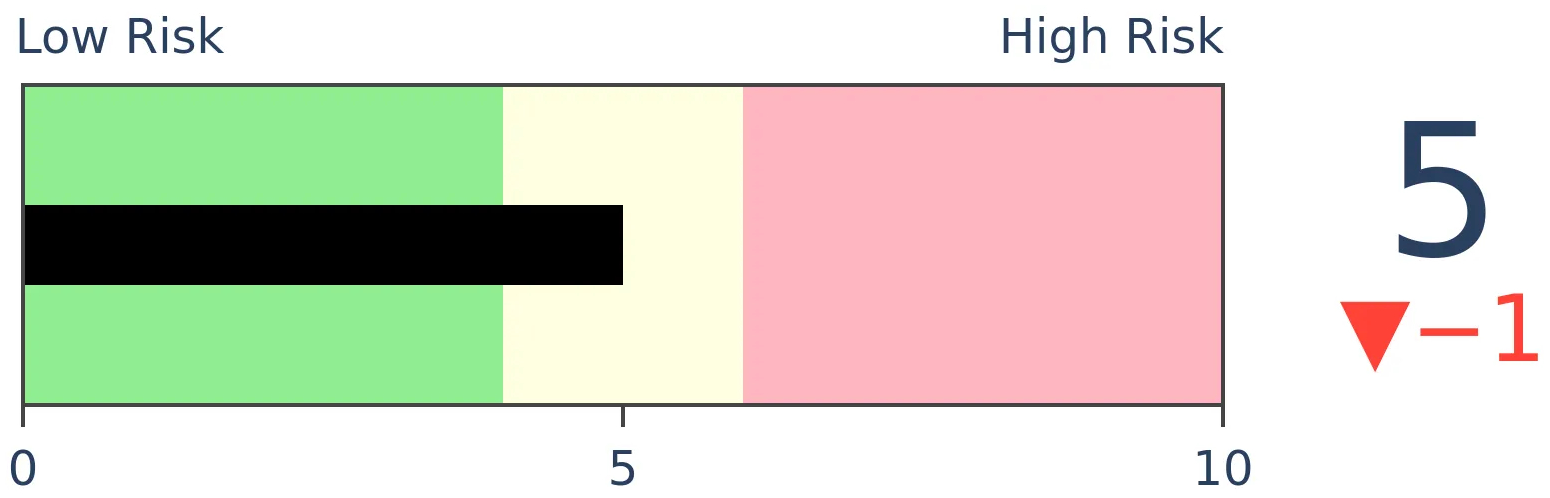
Stocks Medium-Term
|
|
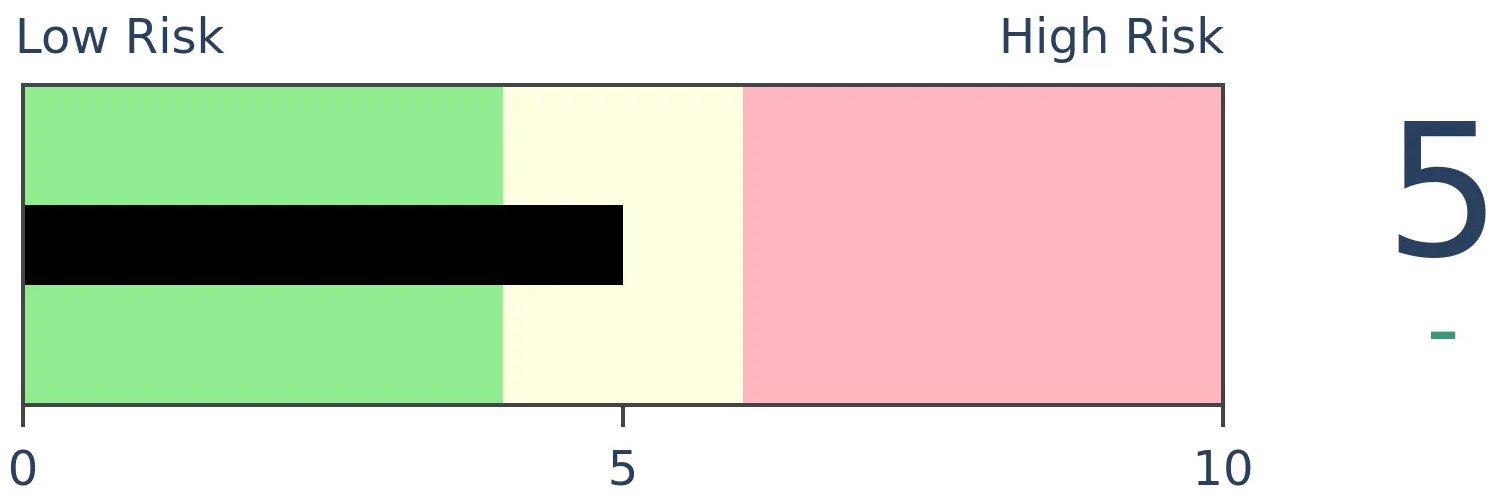
Bonds
|
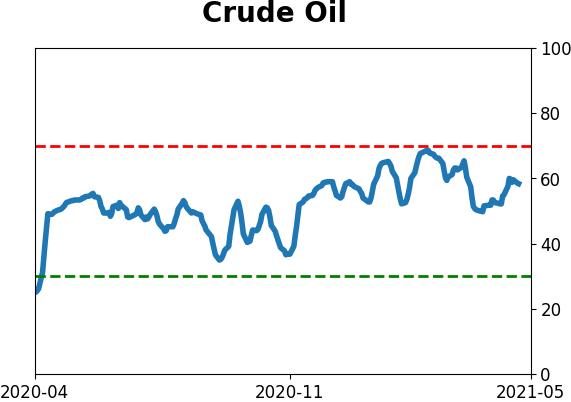
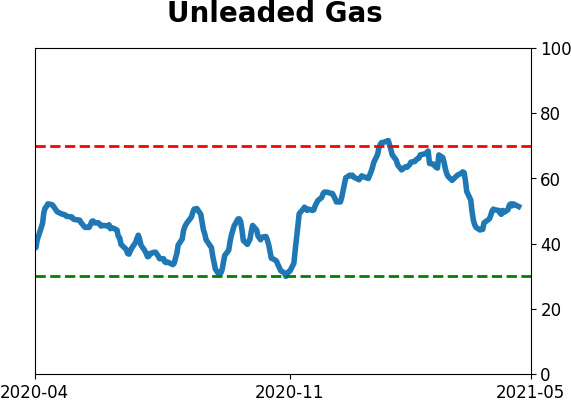
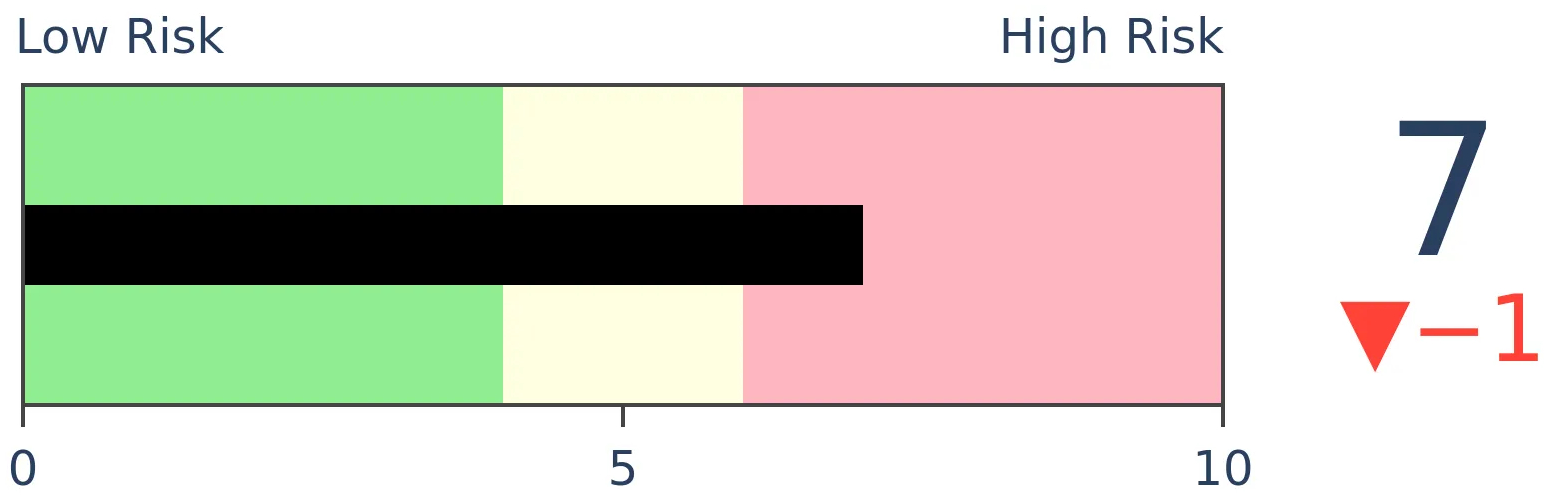
Crude Oil
|
|
Gold
|
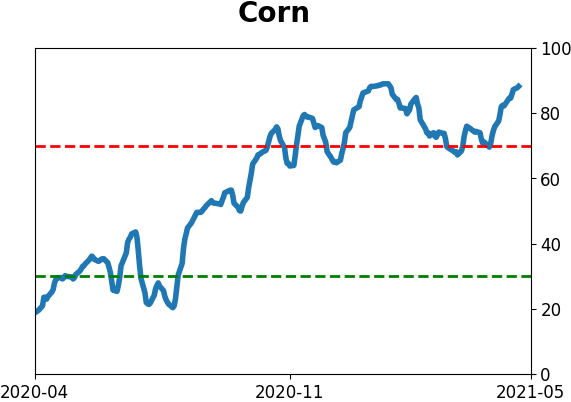
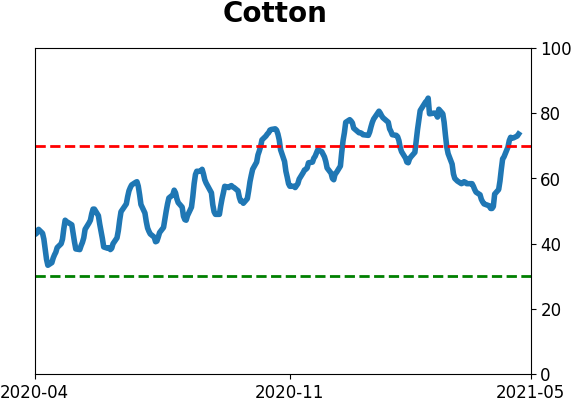
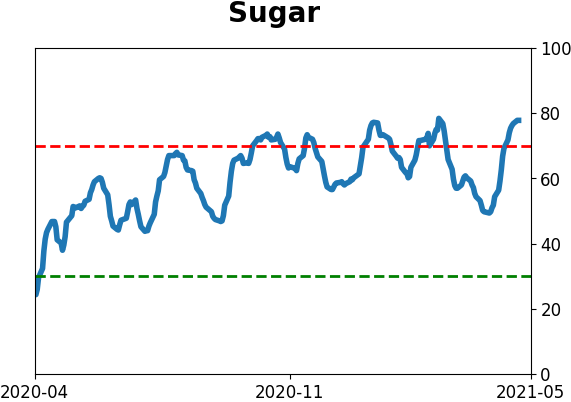
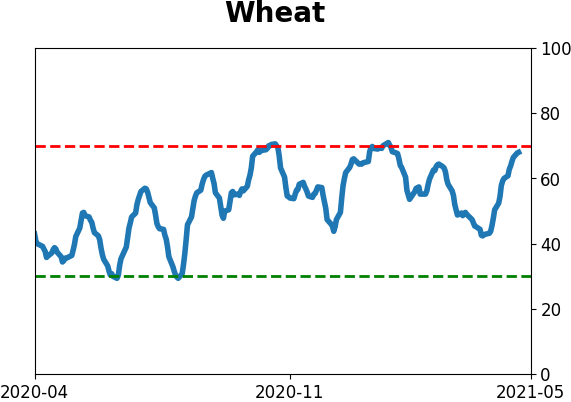
Agriculture
|
|
Research
BOTTOM LINE
The Barron's Big Money poll shows that large money managers are the 2nd most optimistic about stocks since 1999.
FORECAST / TIMEFRAME
None
|
Stocks are soaring, and the Big Money thinks they're going to keep going.
The latest semi-yearly survey of large money manager sentiment from Barron's shows a near-universal sense of optimism.
"...the nationwide rollout of Covid-19 vaccines, the persistence of ultralow interest rates, and expectations for torrid economic growth have convinced America's money managers that the stock market still has more room to rise."
NEAR-RECORD OPTIMISM
The poll of more than 150 managers, controlling hundreds of billions in assets, revealed that 67% of them think stocks will keep rising in the months ahead, while only 7% think they will fall.
That's the 3rd-highest percentage of bulls, and the 2nd-lowest percentage of bears, since 1999.
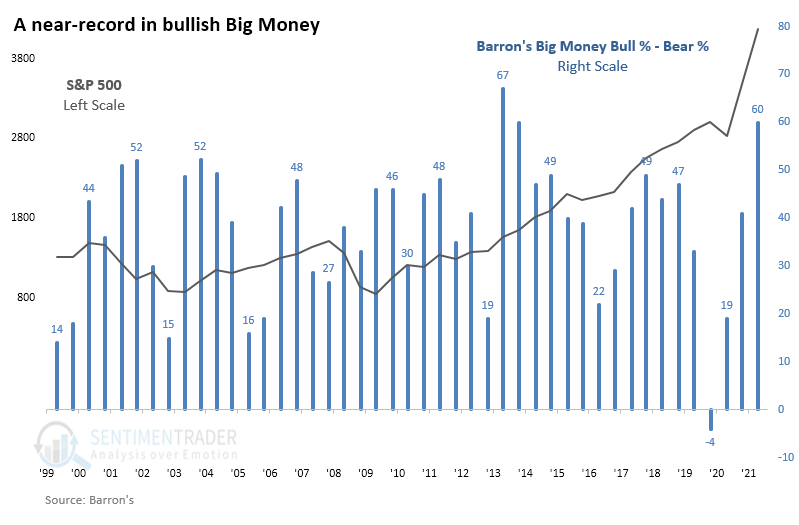
There is a positive correlation between the managers' sentiment and their prediction for stocks, which makes sense. The more bullish they say they are, the higher they think stocks will rise.
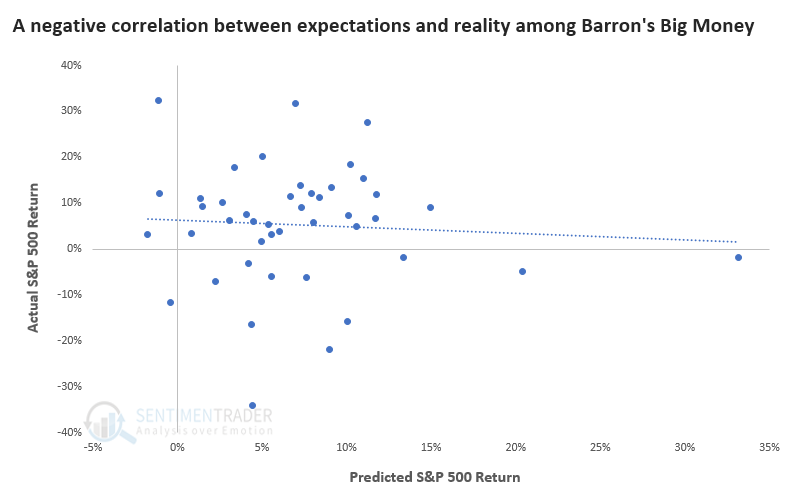
WHY IT MIGHT MATTER
Reality is often different from expectations. There is a negative correlation between these managers' expected return and the S&P's actual performance.
While it's not a strong relationship, there is a tendency for the S&P's return over the next 6 months to be lower if managers' expectations are very high and vice-versa. Out of the 4 times that Big Money thought that stocks would jump about 15% or more within 6 months, the S&P's actual return was negative 3 times.
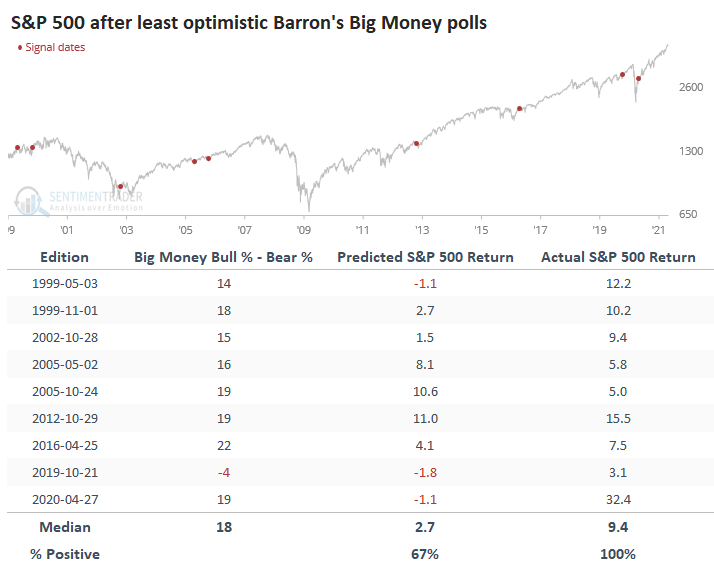
When the managers were the least optimistic, with an average spread of only 18% between the percentage of bulls and bears, they expected the S&P to return less than 3% over the next 6 months. But in reality, it returned more than 9% and was positive every time.
There was no strong contrary behavior at the opposite end of the spectrum, though, which is where we are now. When they were the most optimistic, with an average spread of more than 50% between bulls and bears, they expected the S&P to return more than 9% over the next 6 months. And, on average, it did just that.
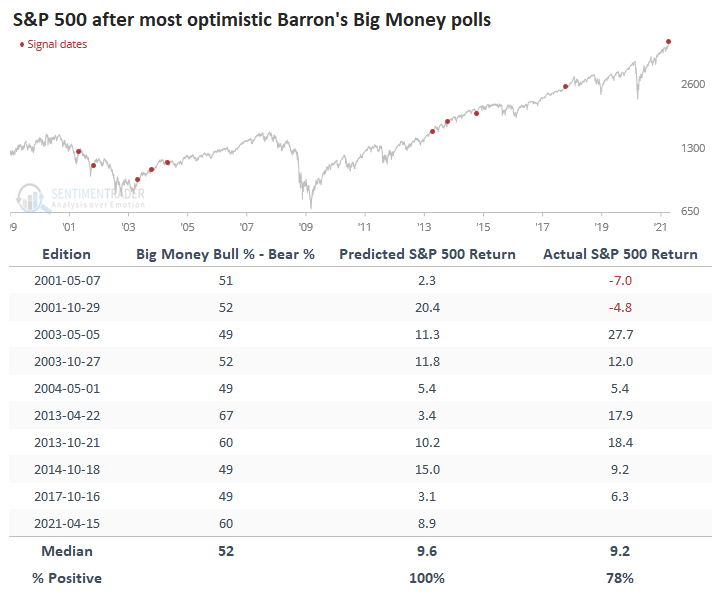
Big Money was way too early to turn confident in 2001, so their optimism was unfounded. But the other times mostly worked out in their favor. It all ended up being about average, so there was no great edge there. This poll would be telling us more if it was showing some sense of pessimism among managers that control many billions in assets.
When they've been optimistic - even wildly so - stocks didn't show a strong consistency to deflate those expectations. It might be a minor worry about the next 6 months, given that they're showing near-record optimism, but it should be nothing more than that.
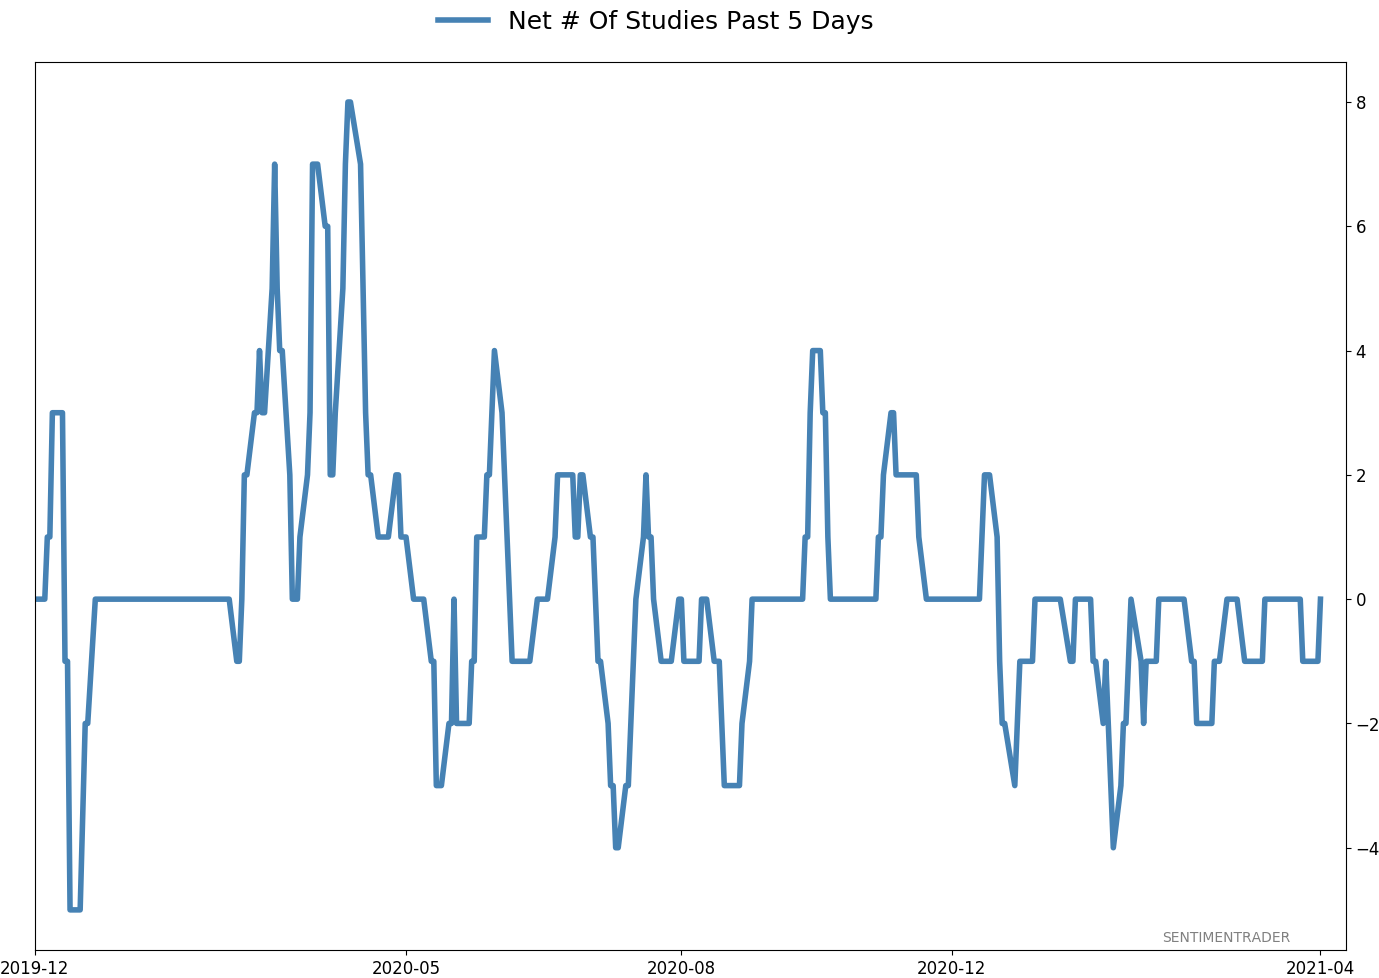
Active Studies
| Time Frame | Bullish | Bearish | | Short-Term | 0 | 0 | | Medium-Term | 0 | 11 | | Long-Term | 11 | 4 |
|
Indicators at Extremes
Portfolio
| Position | Description | Weight % | Added / Reduced | Date | | Stocks | RSP | 0.0 | Reduced 4.9% | 2021-04-22 | | Bonds | 30.0% BND, 8.8% SCHP | 37.9 | Added 15.1% | 2021-02-18 | | Commodities | GCC | 2.5 | Reduced 2.1%
| 2020-09-04 | | Precious Metals | GDX | 9.8 | Added 0.1% | 2021-02-18 | | Special Situations | 4.3% XLE, 2.2% PSCE | 6.5 | Reduced 5.6% | 2021-04-22 | | Cash | | 43.3 | | |
|
Updates (Changes made today are underlined)
I've made no adjustments for months, as the situation remained essentially stuck - energy was doing what it should, sentiment in the broader market was ridiculously stretched but with no major warning signs, and sentiment toward gold and bonds appeared overdone on the pessimistic side. Those conditions have started to reverse a bit, so I further reduced my risk. There are still no major warning signs, but I'm getting increasingly uncomfortable and would prefer to sit safely in cash and wait for better risk/reward opportunities. RETURN YTD: 7.3% 2020: 8.1%, 2019: 12.6%, 2018: 0.6%, 2017: 3.8%, 2016: 17.1%, 2015: 9.2%, 2014: 14.5%, 2013: 2.2%, 2012: 10.8%, 2011: 16.5%, 2010: 15.3%, 2009: 23.9%, 2008: 16.2%, 2007: 7.8%
|
|
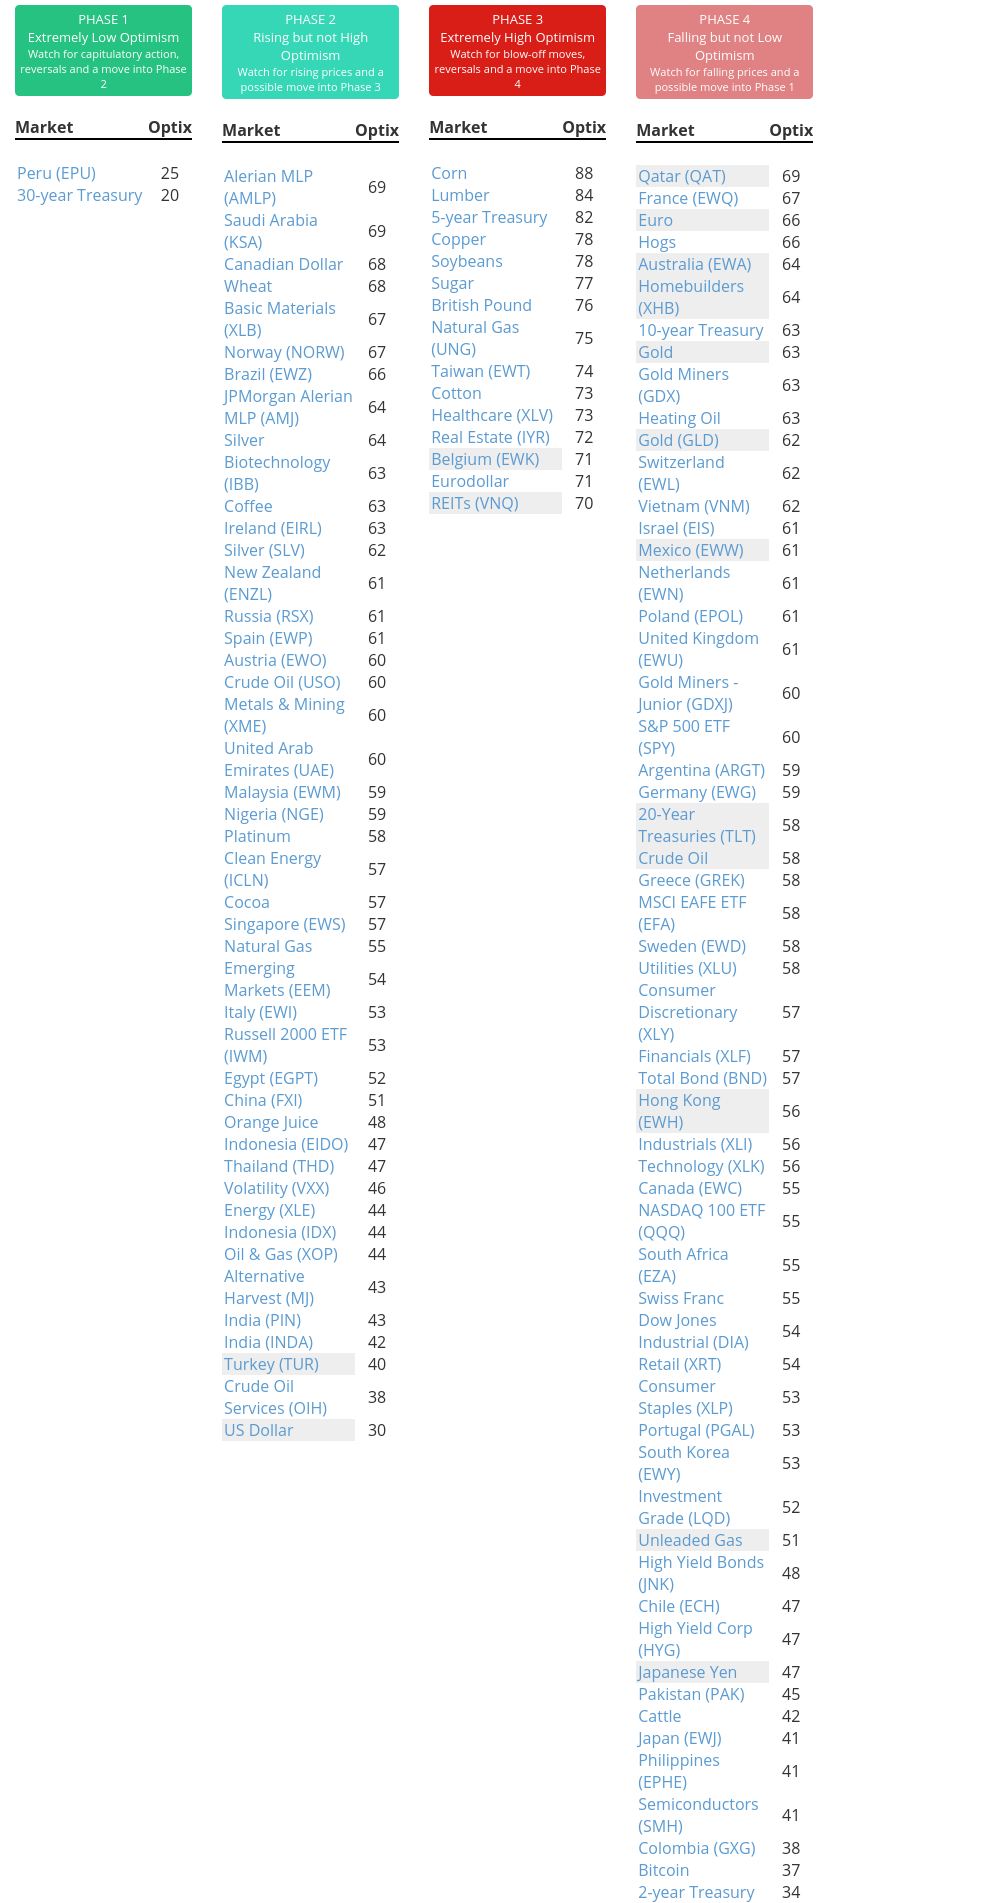
Phase Table
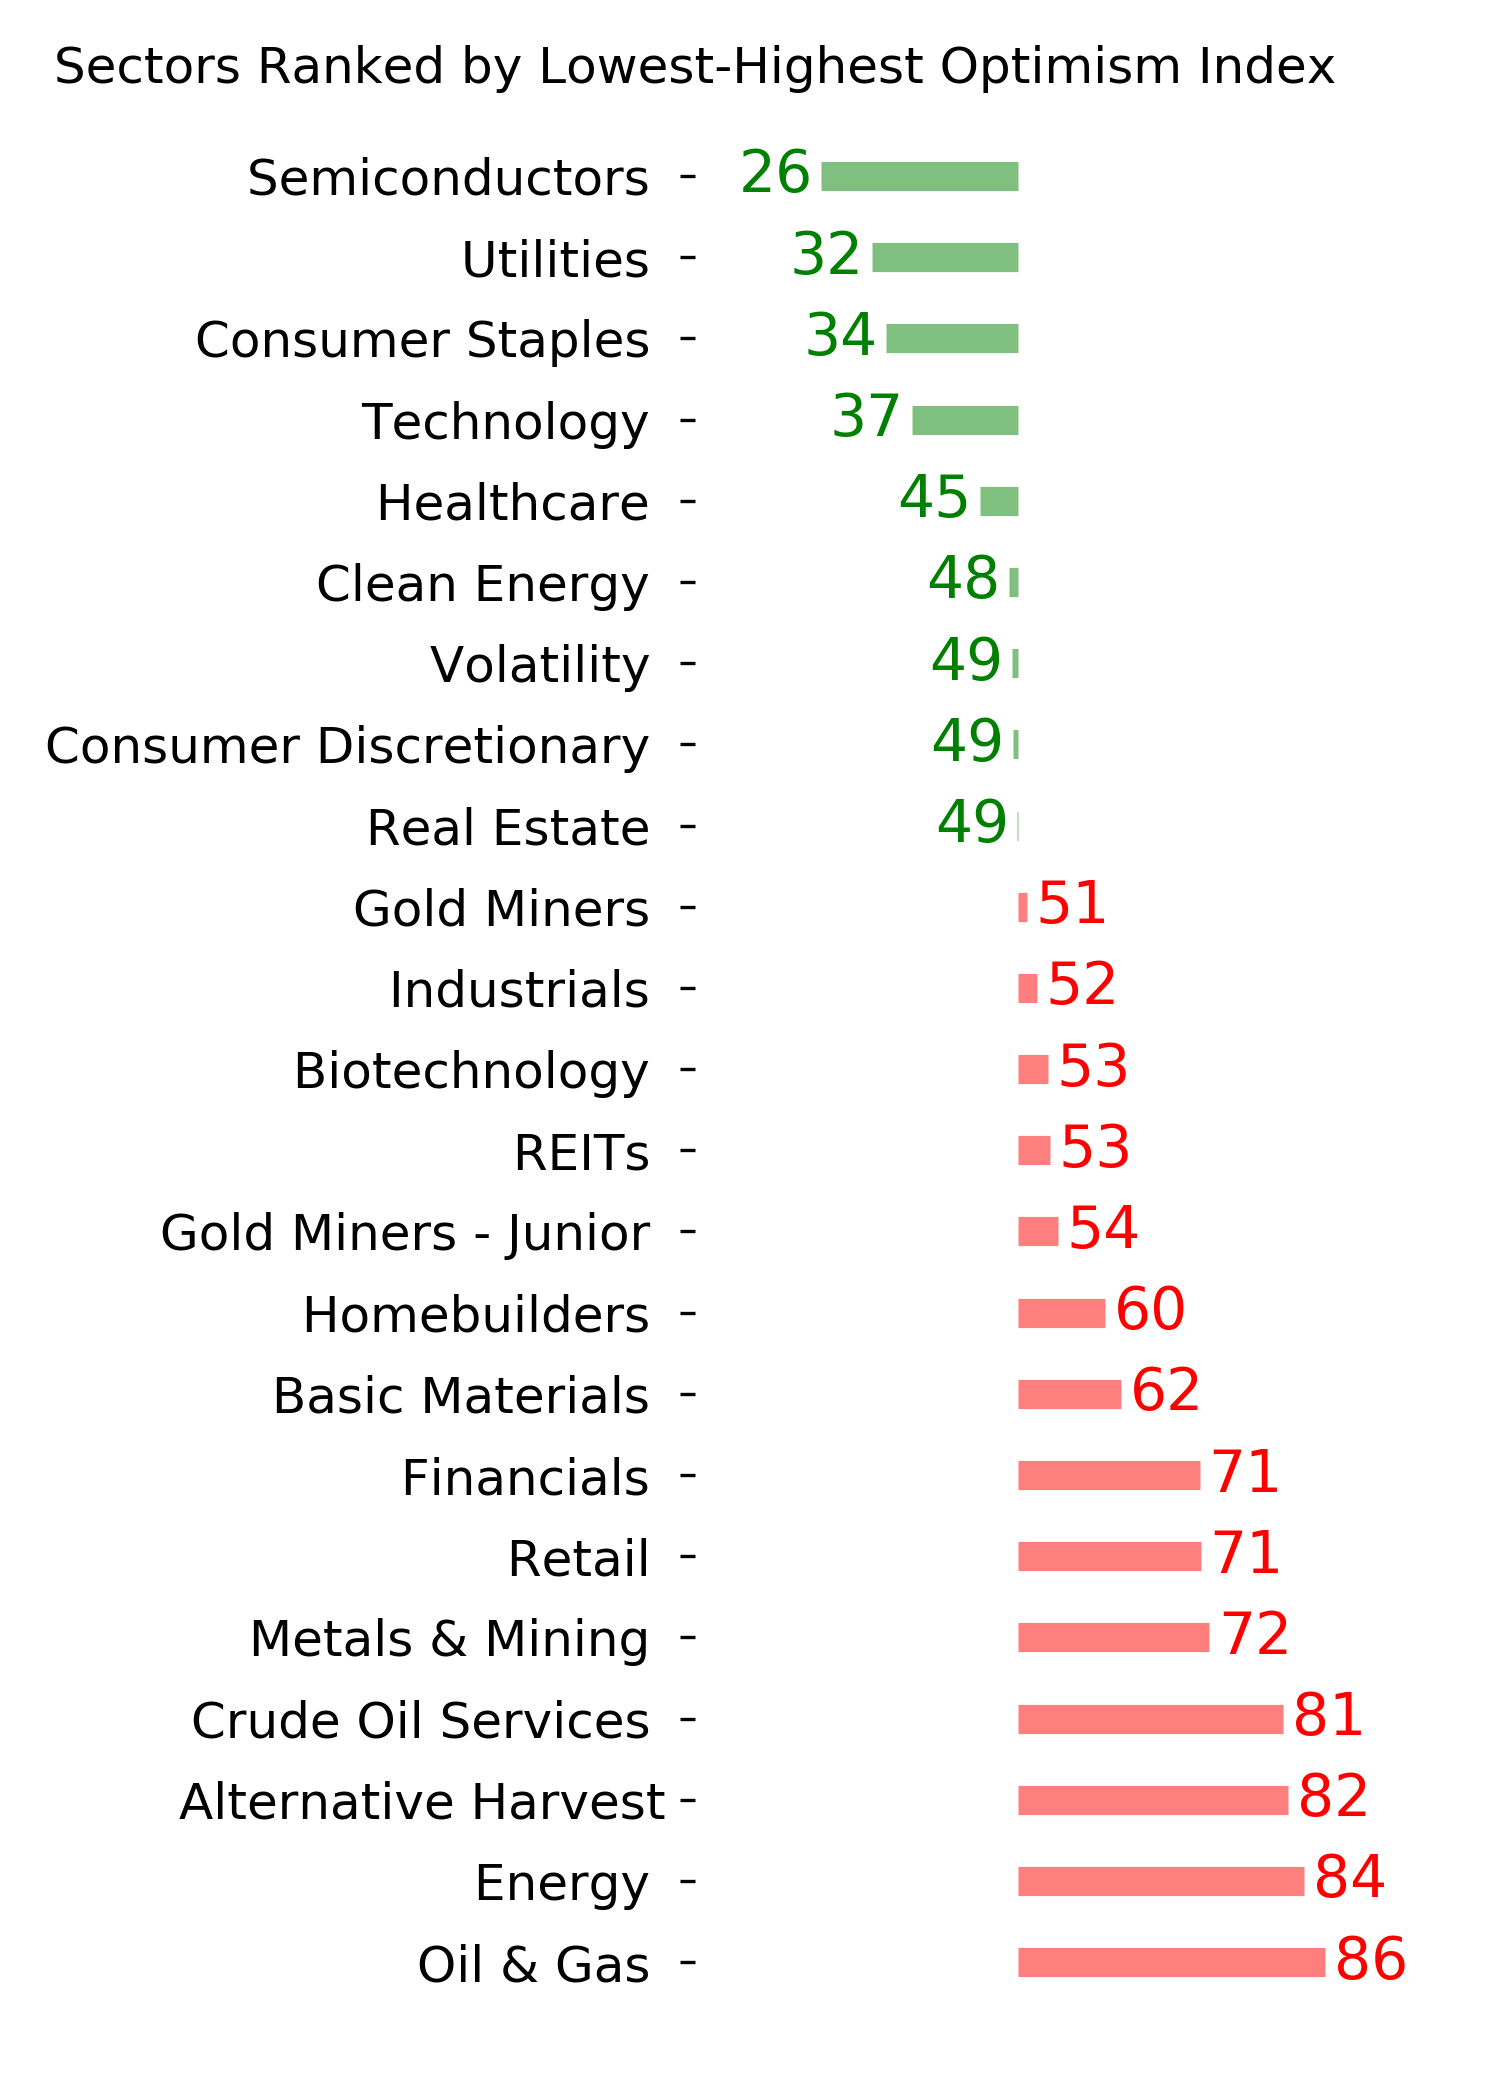
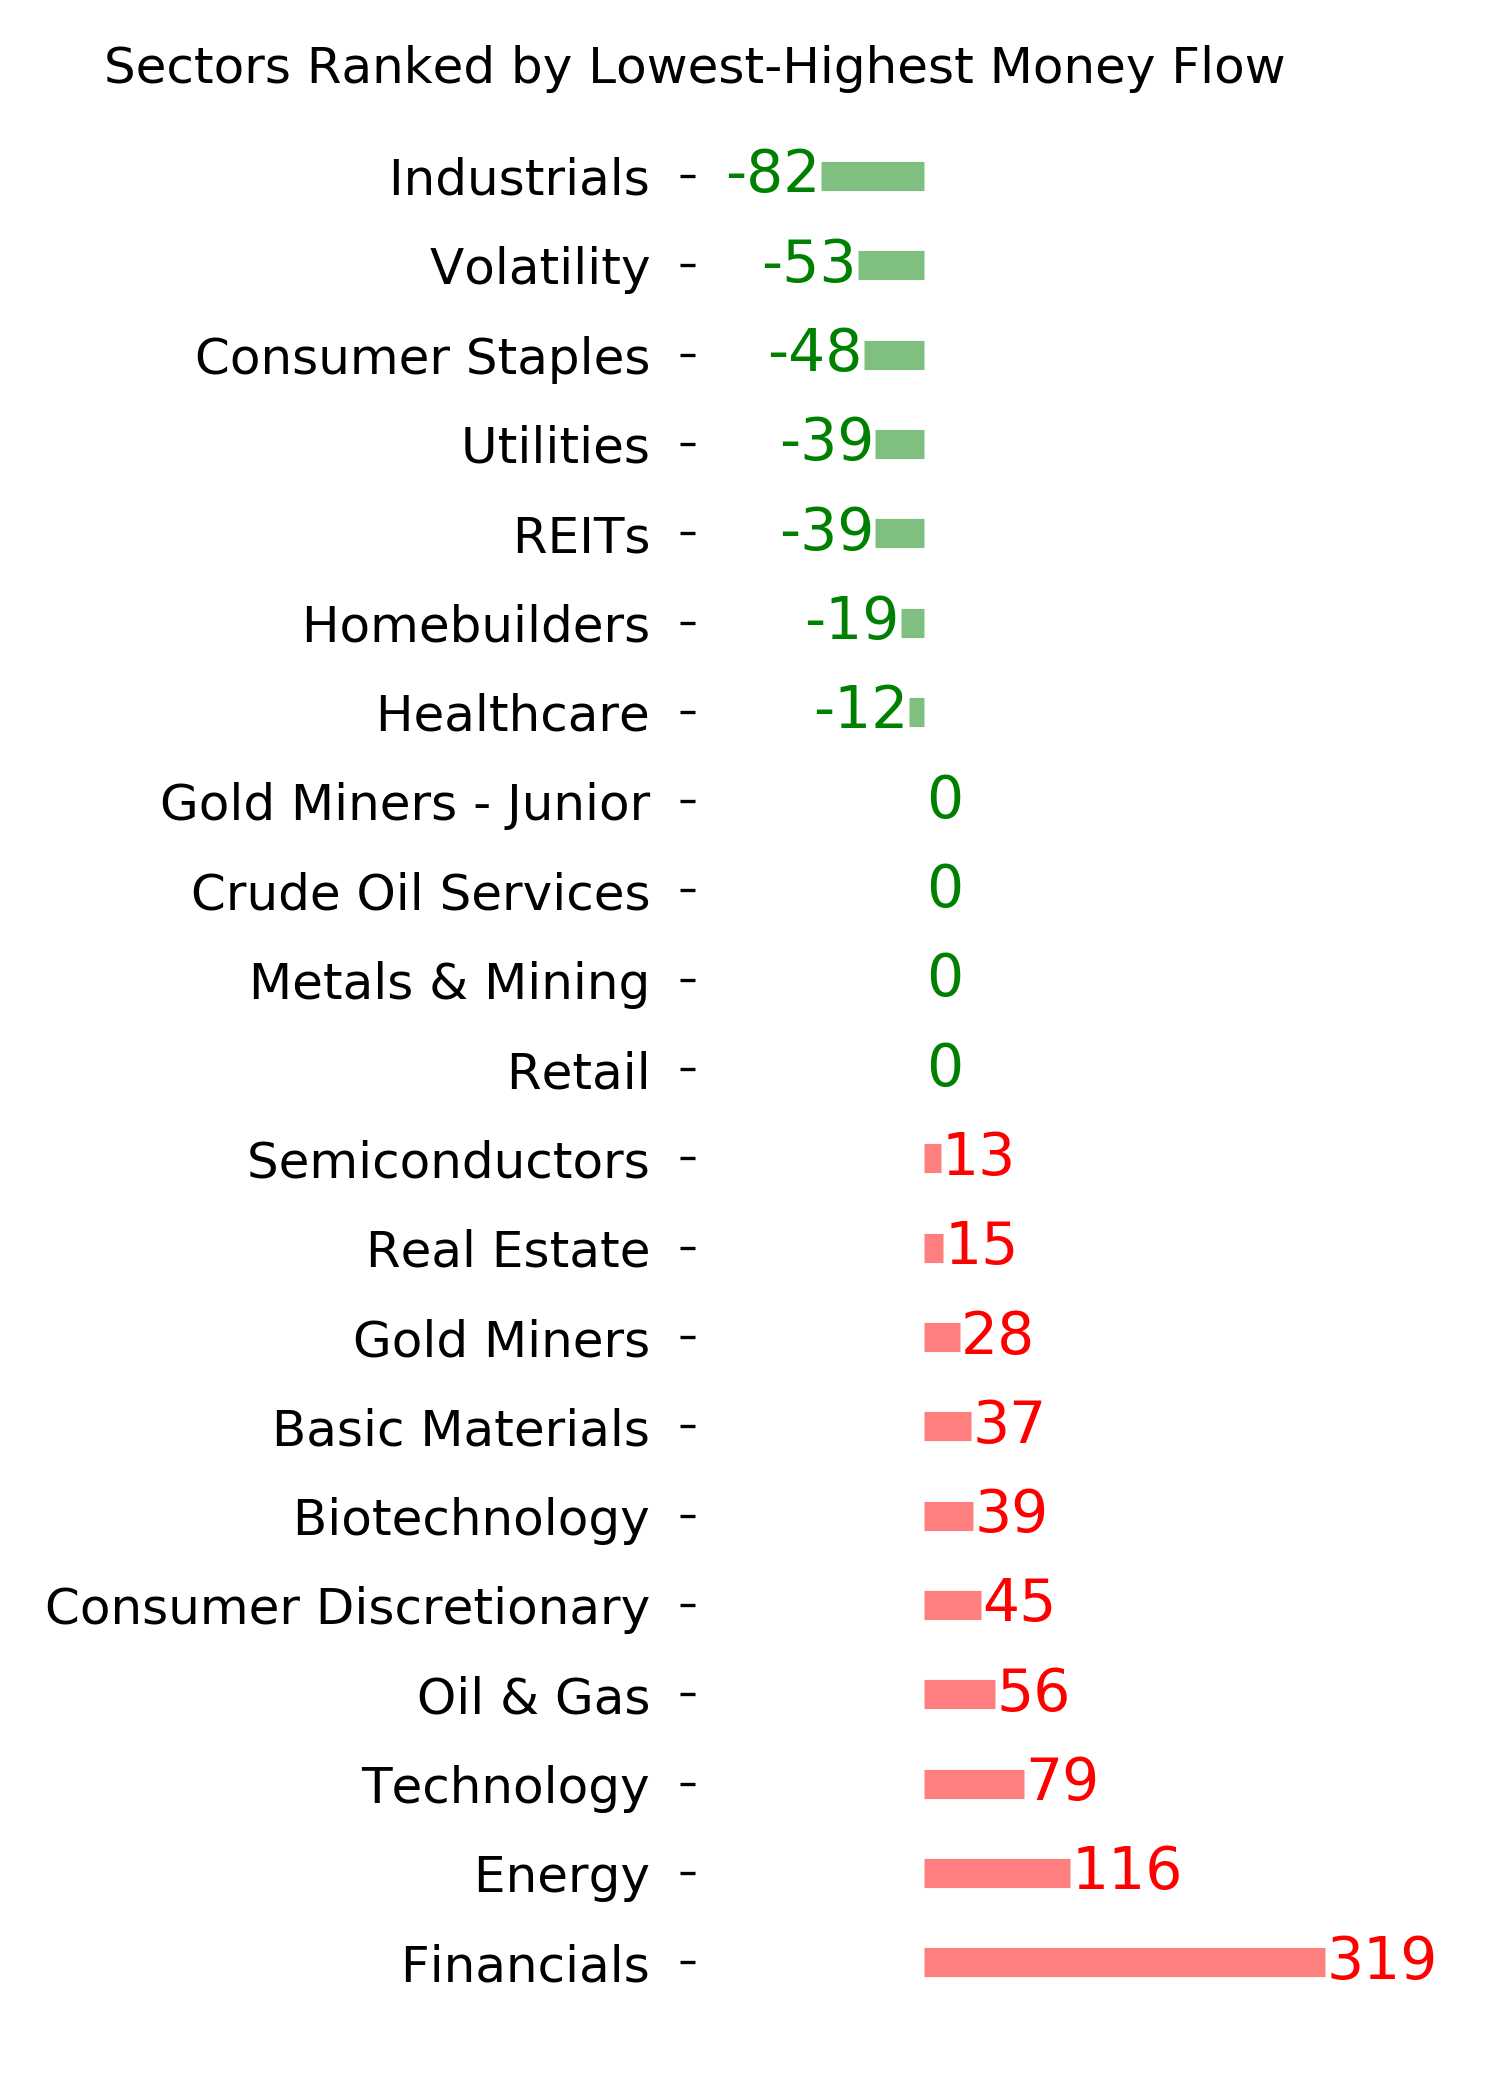
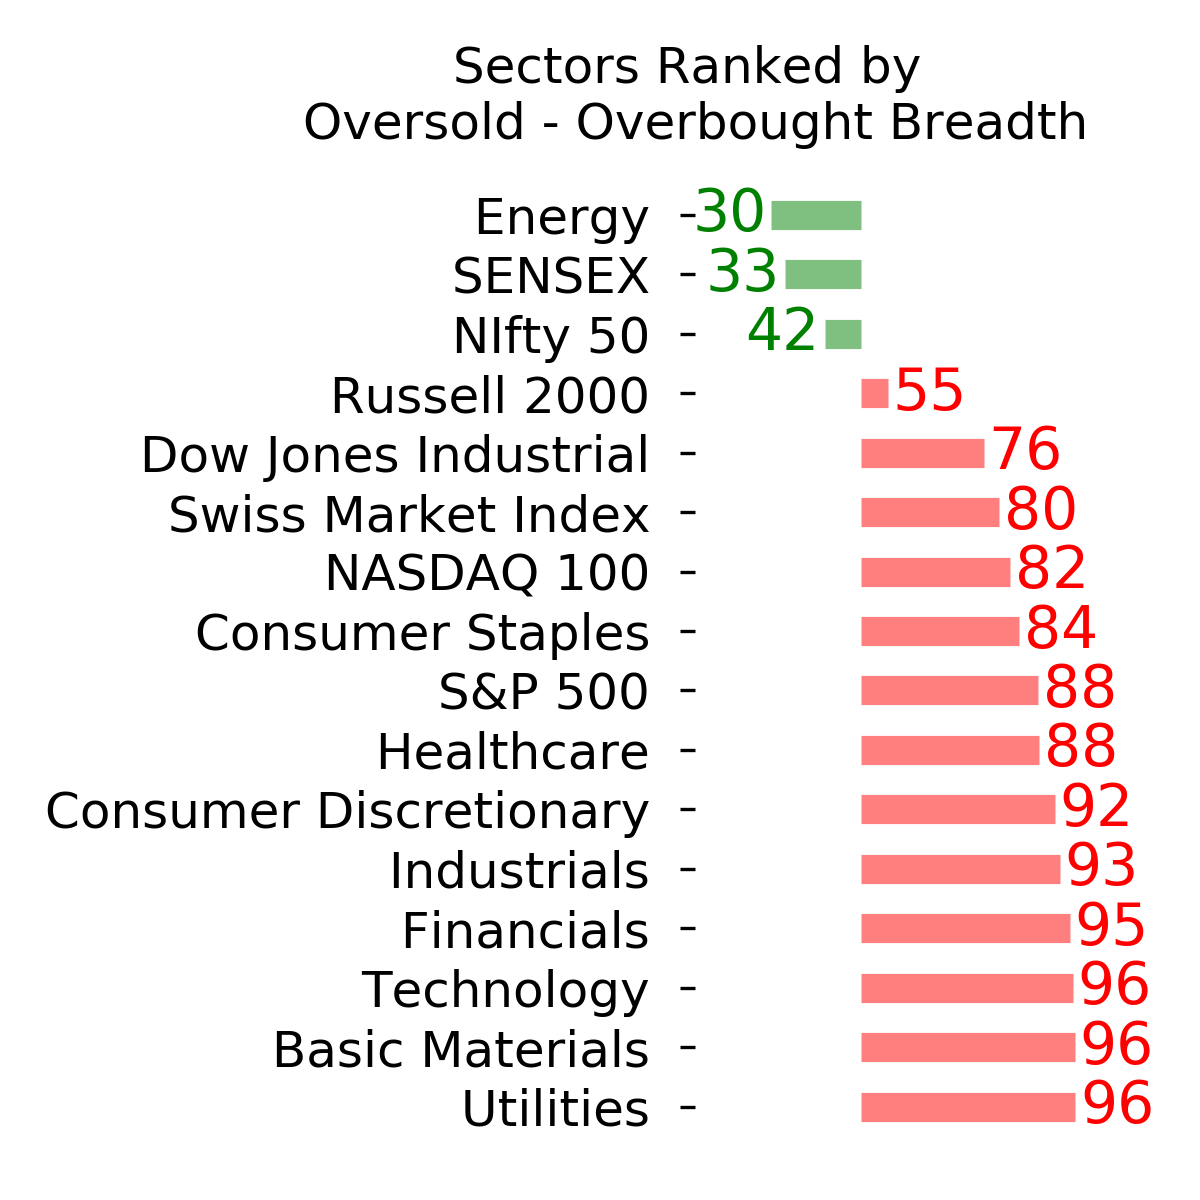
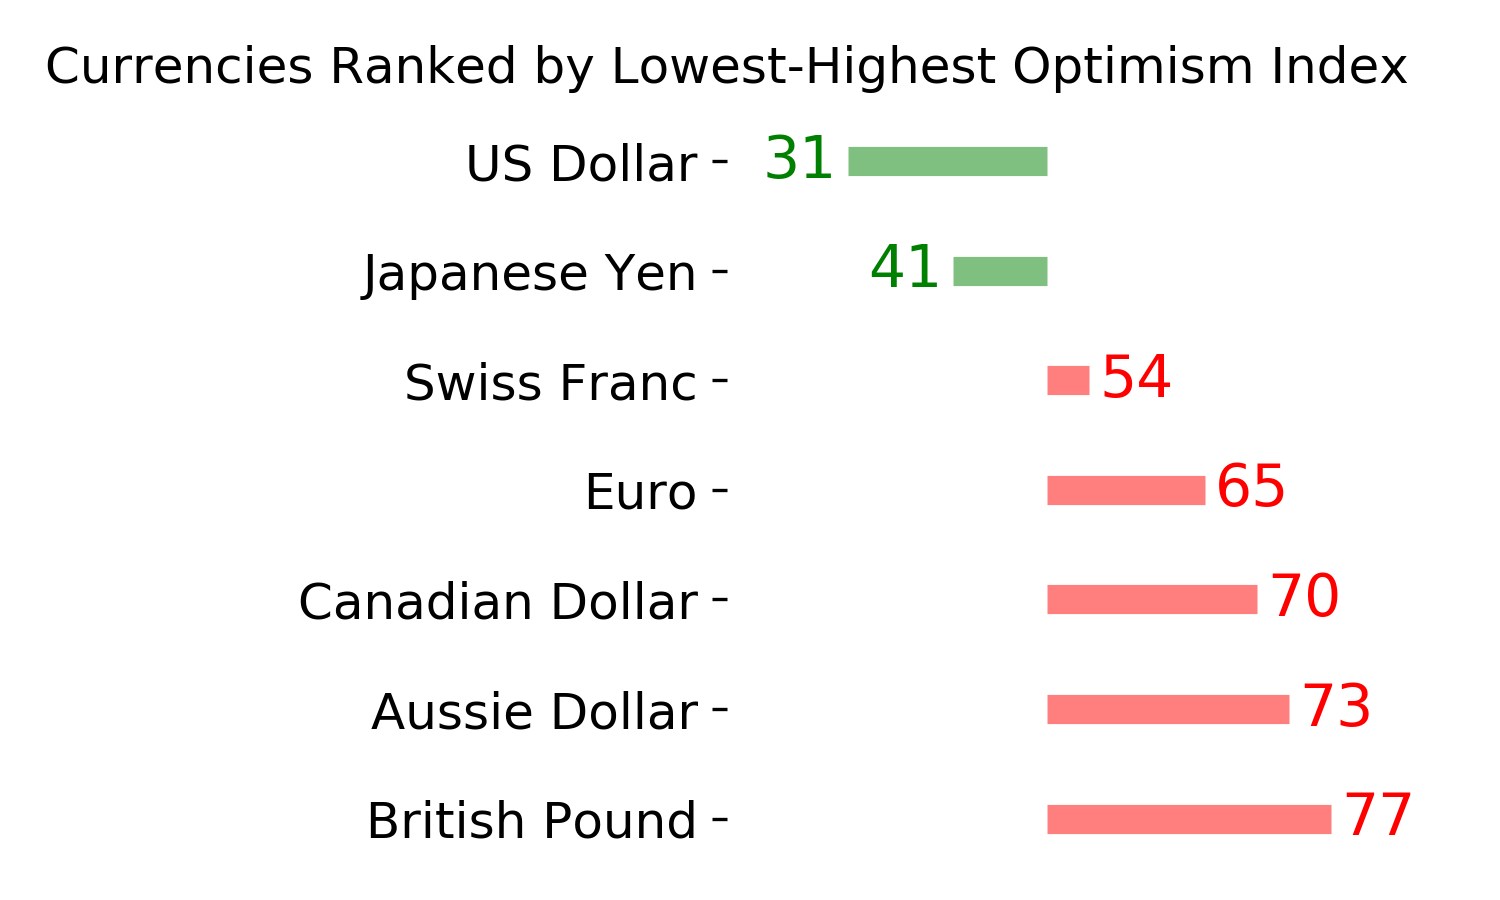
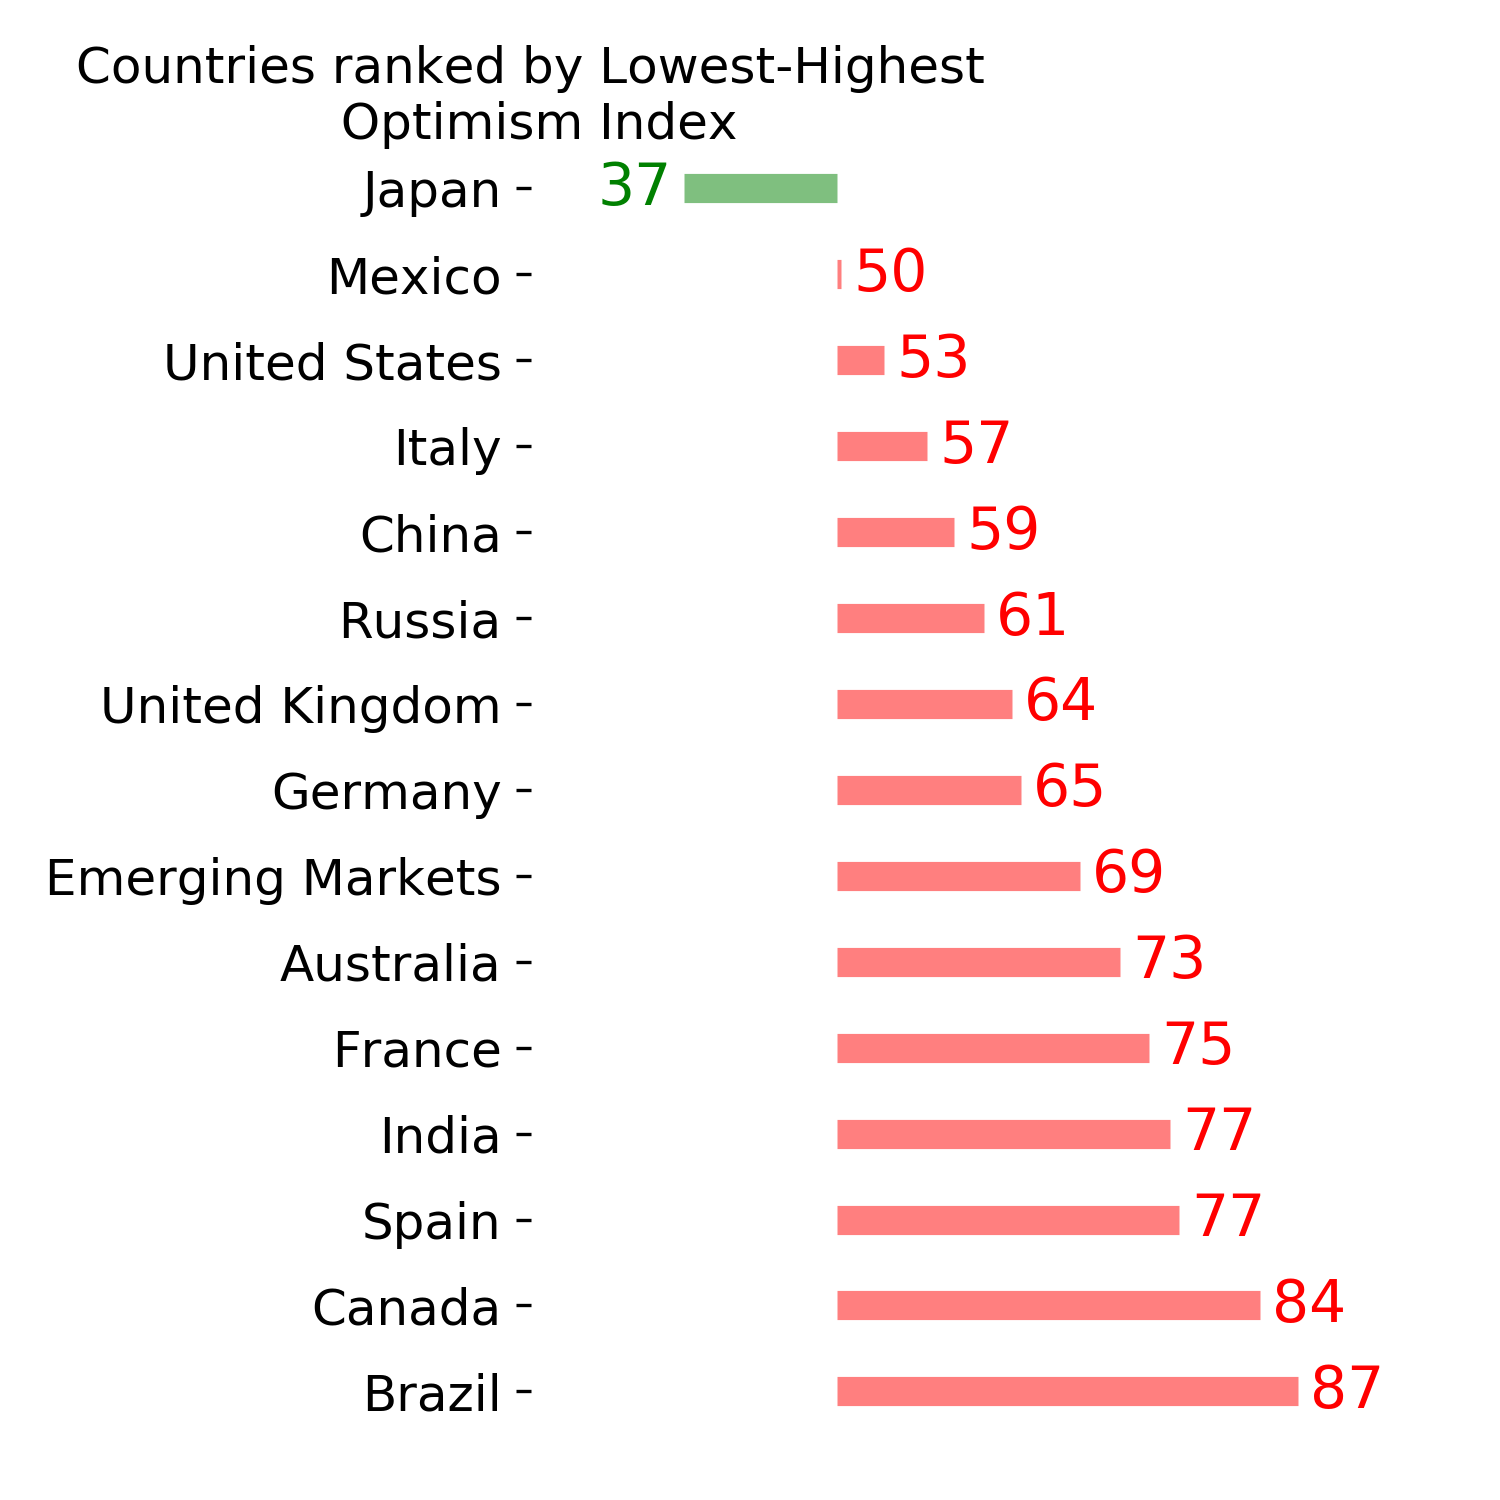
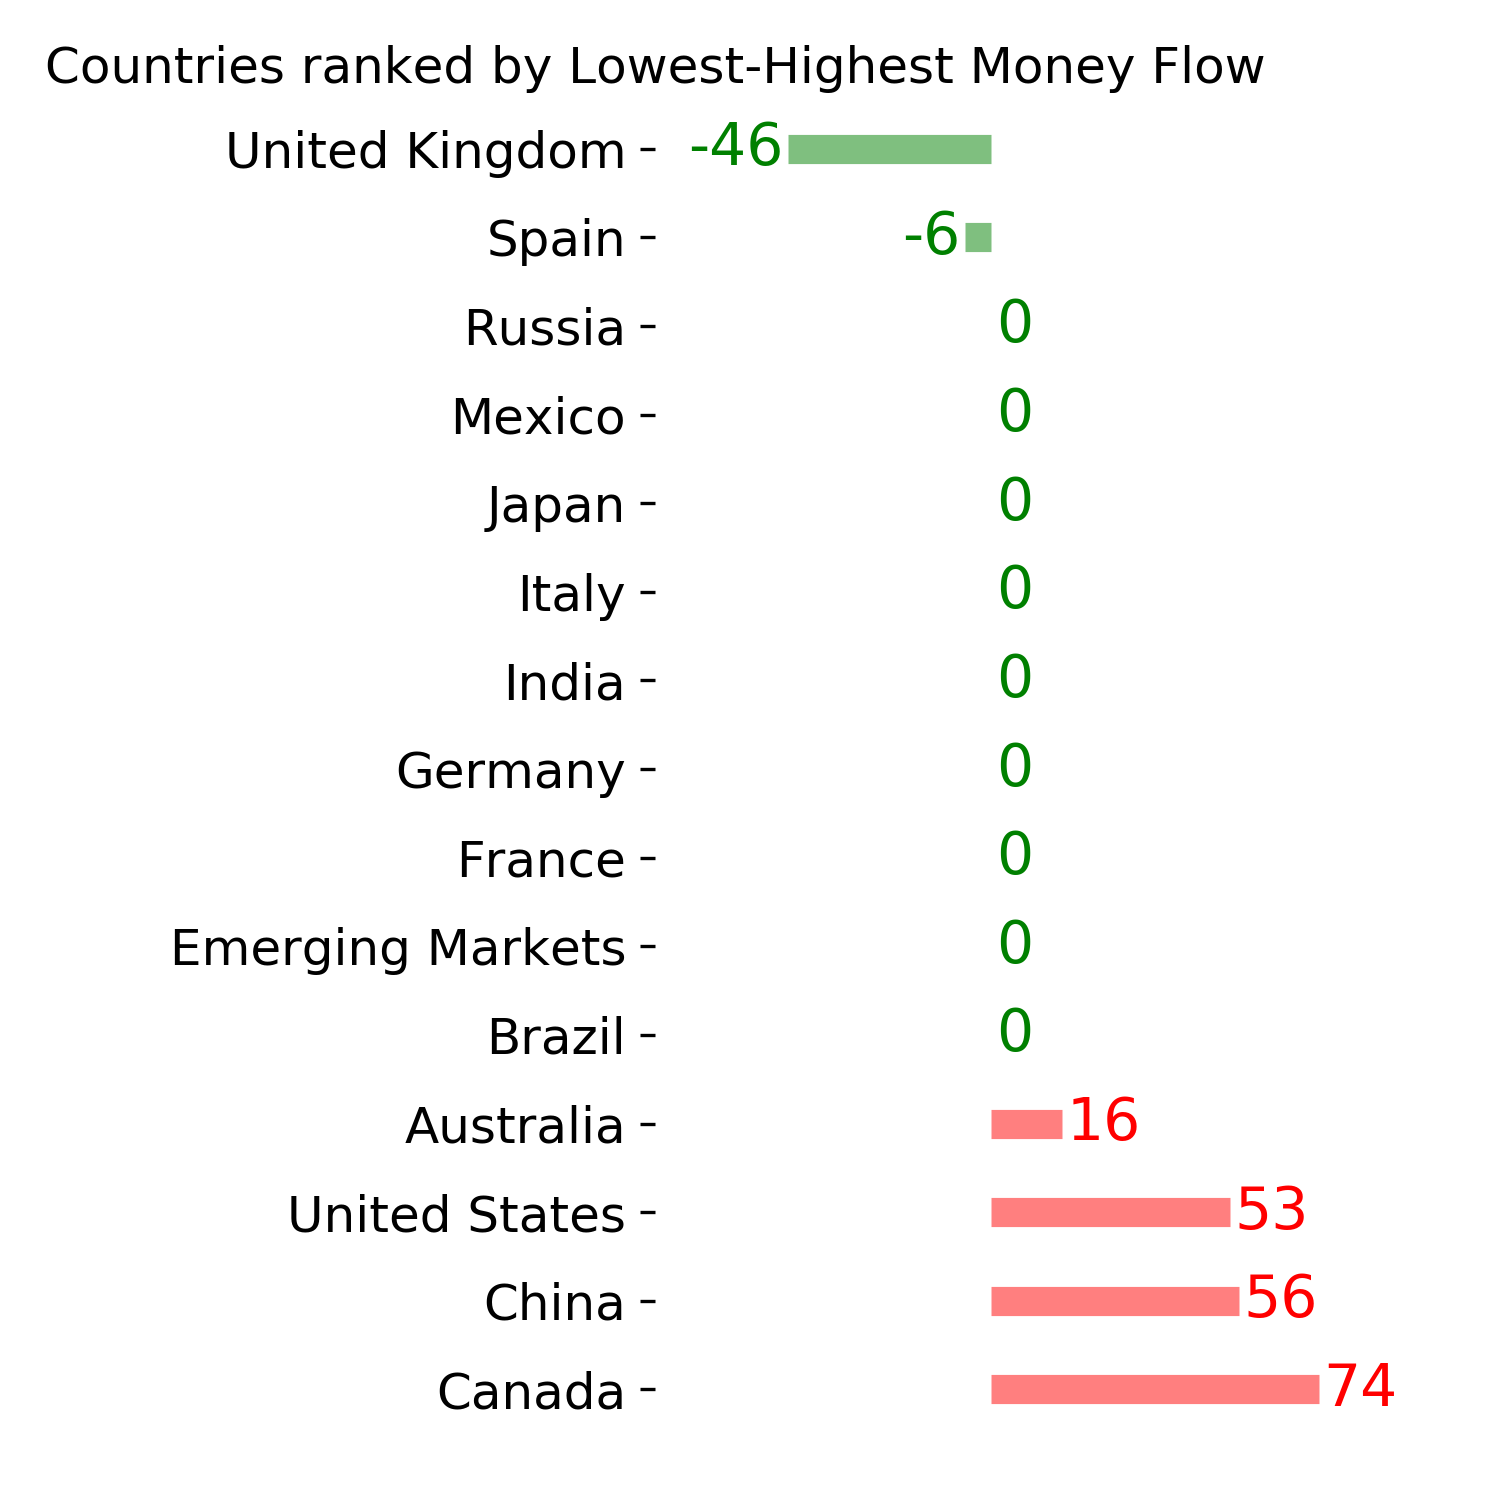
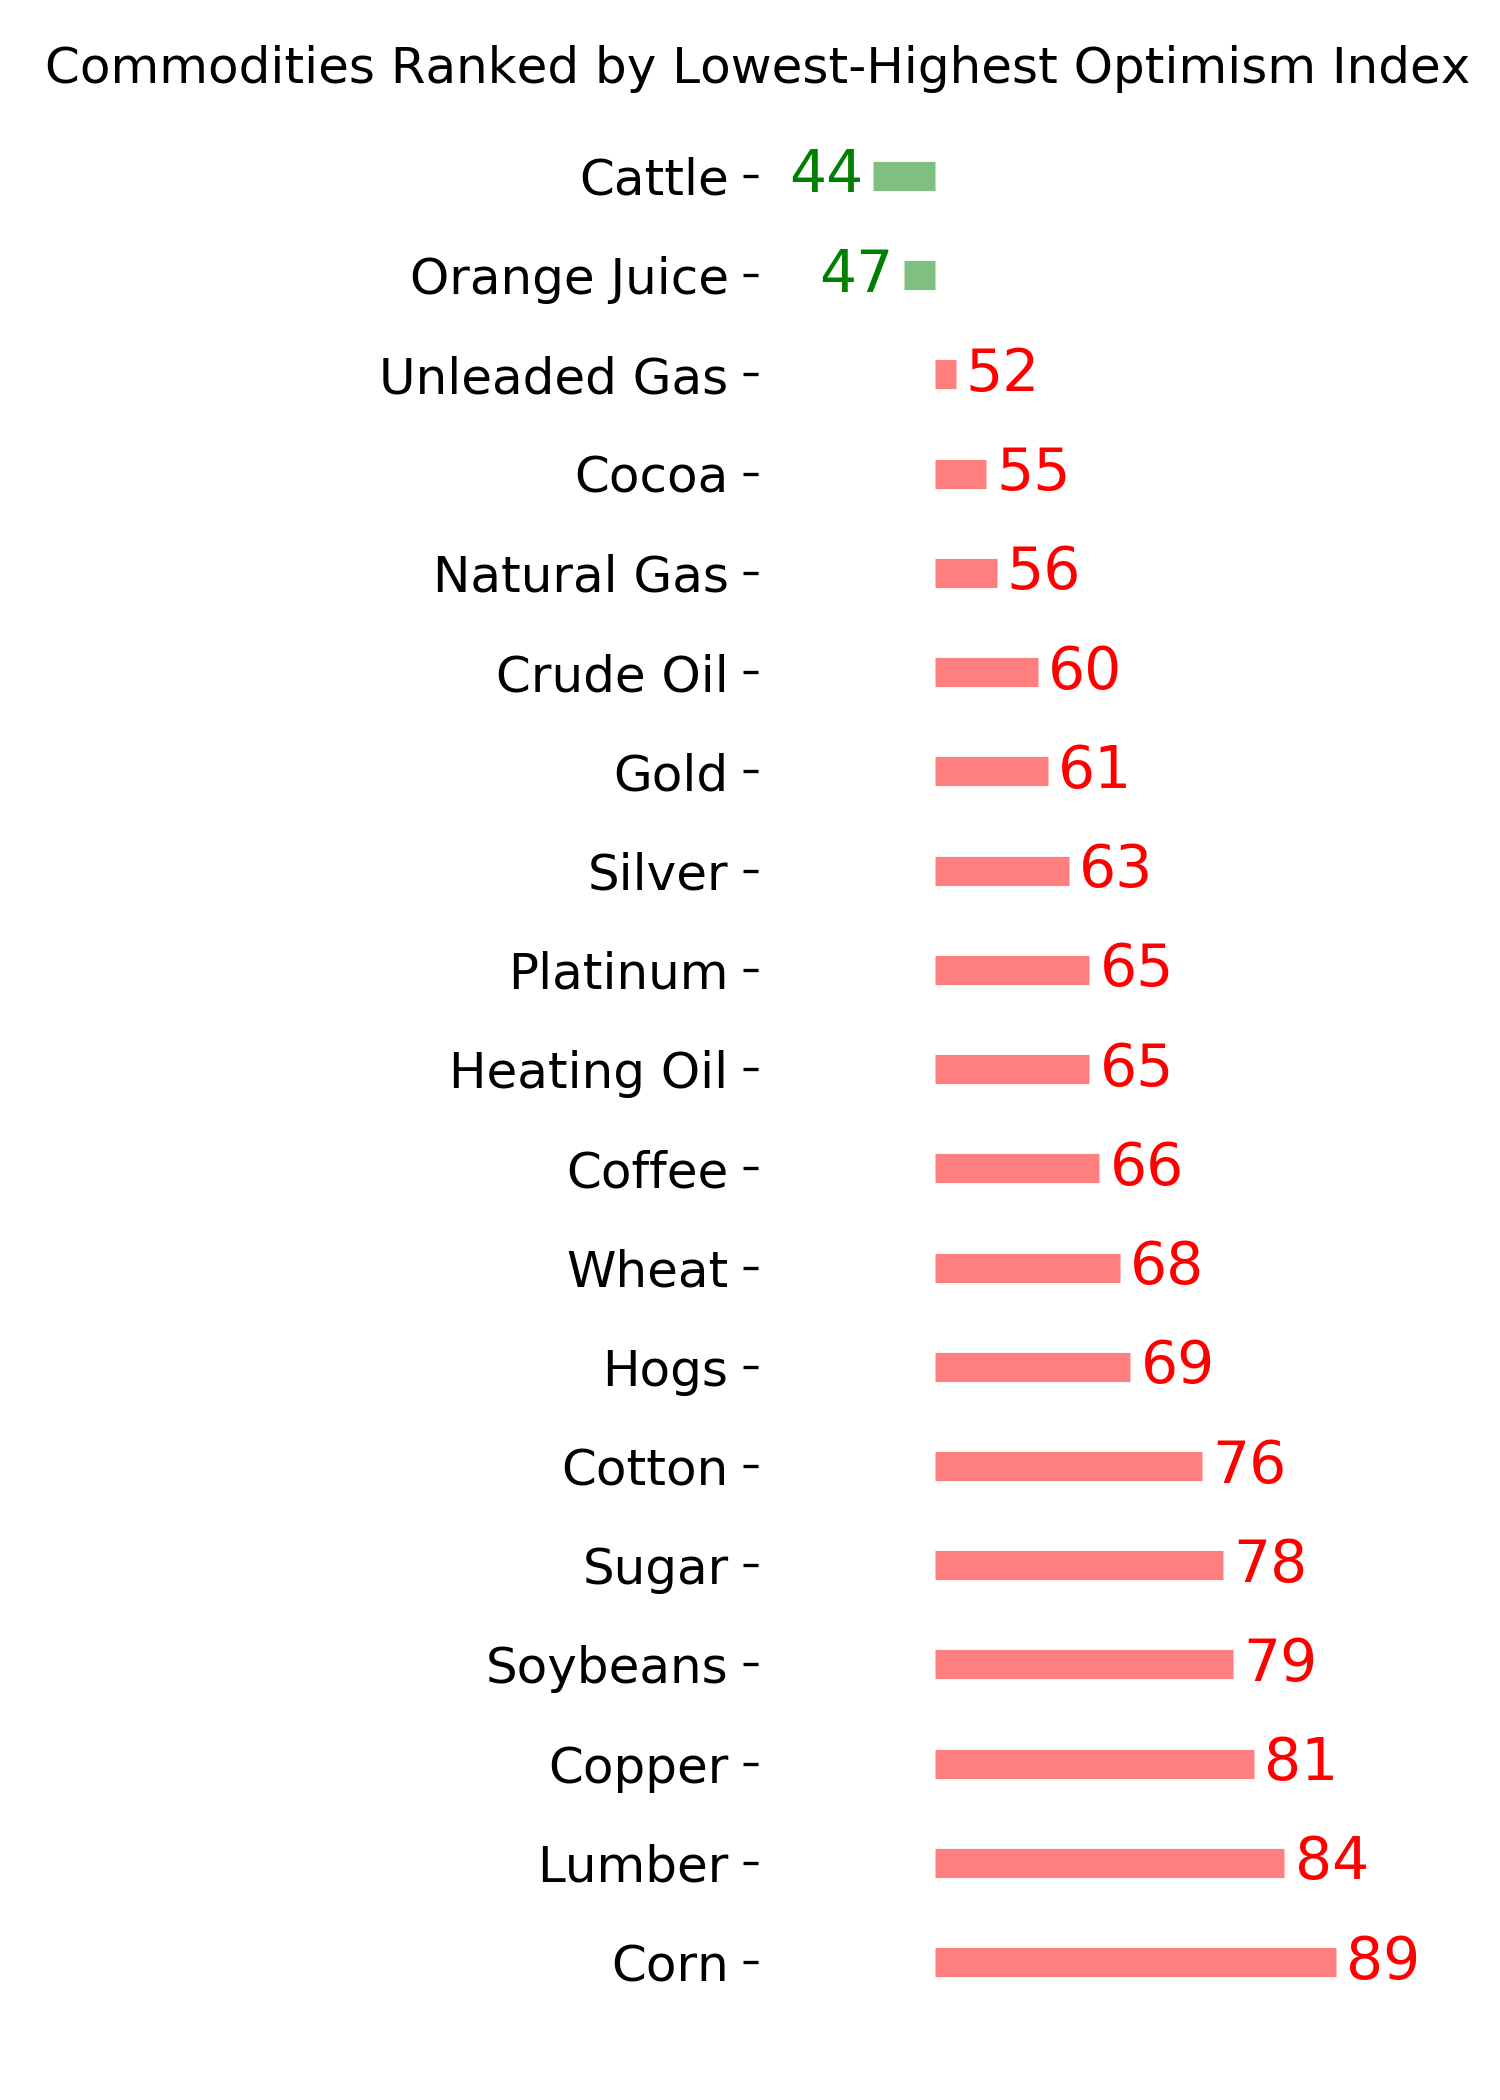
Ranks
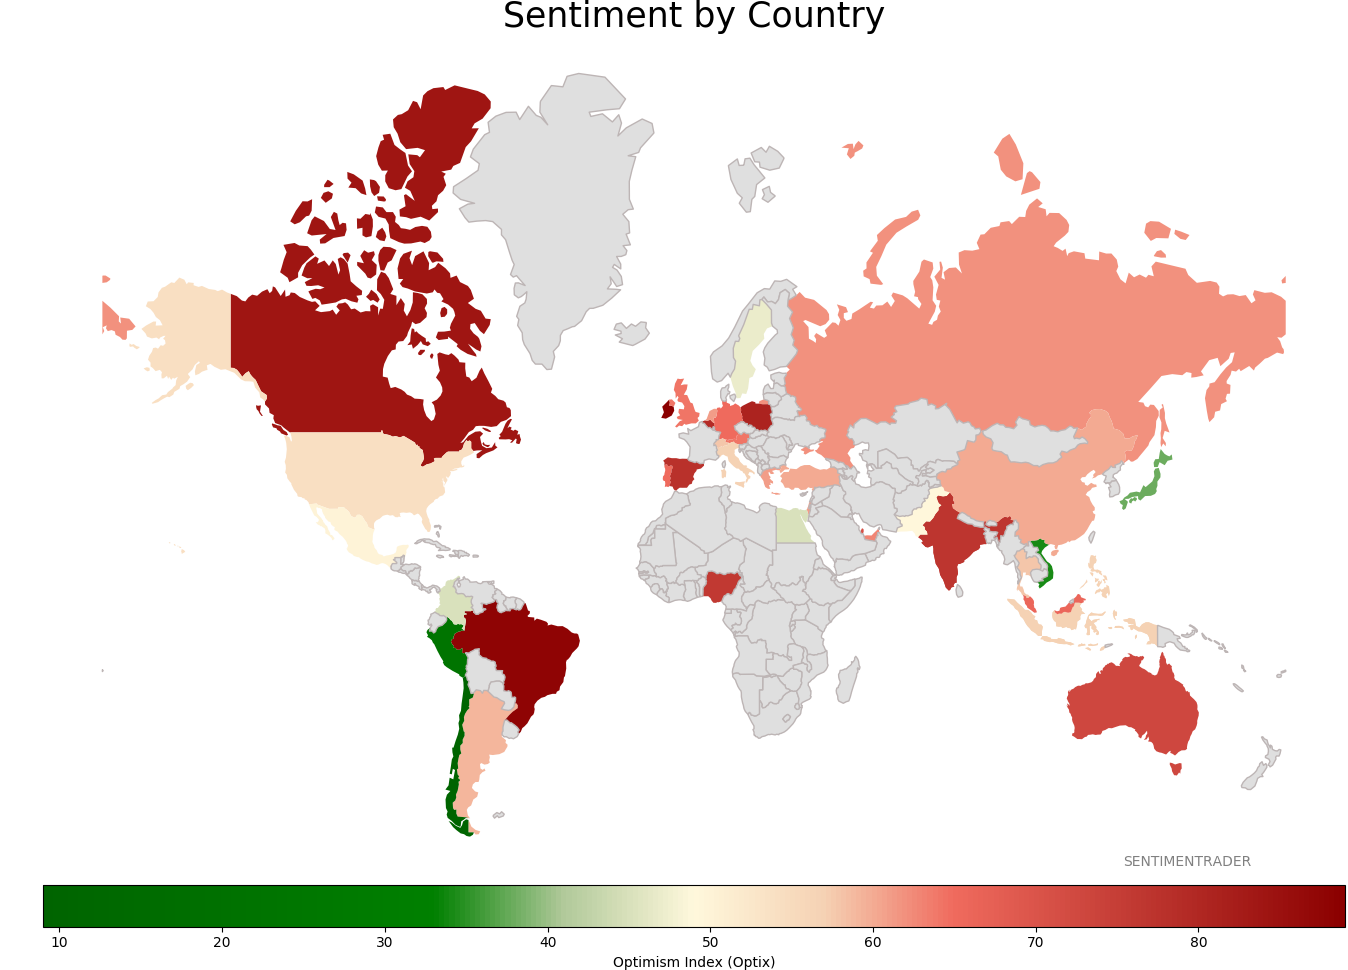
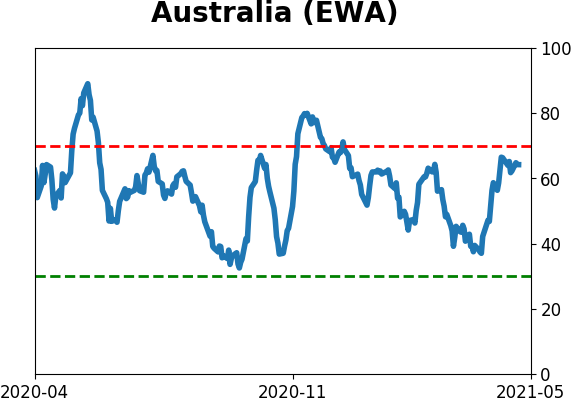
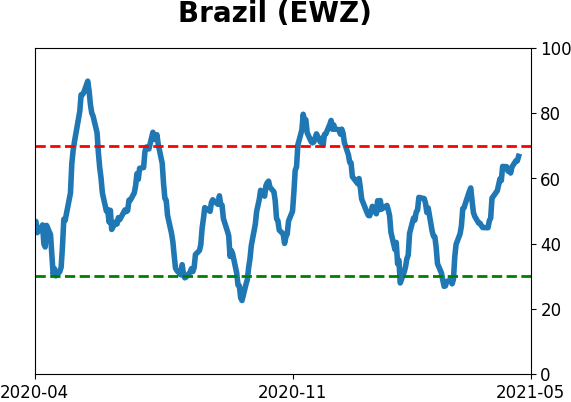
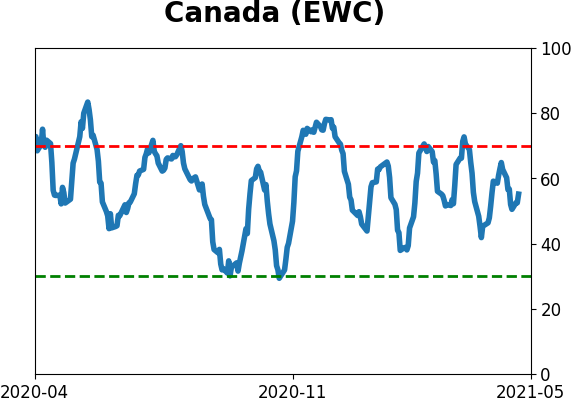
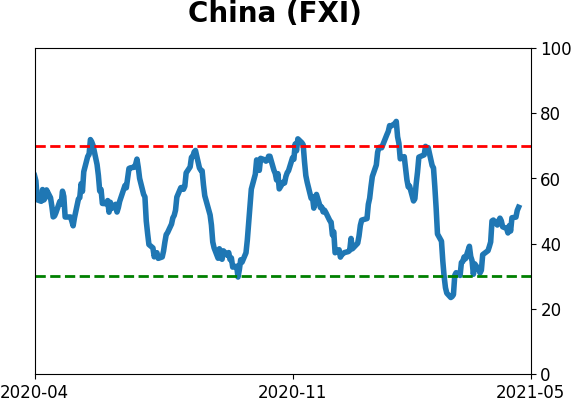
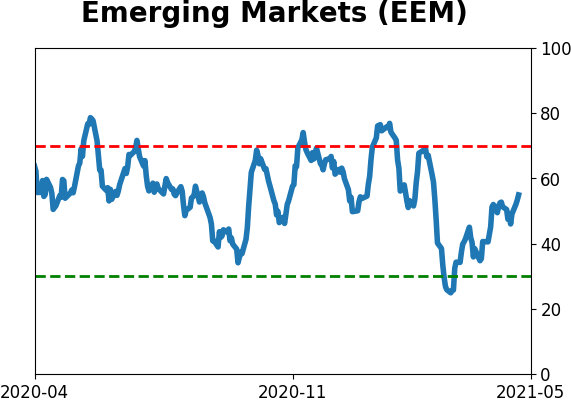
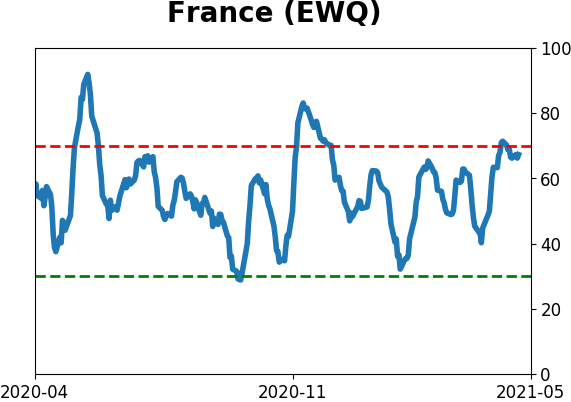
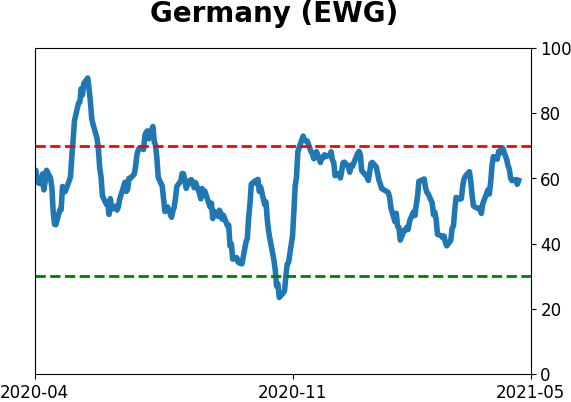
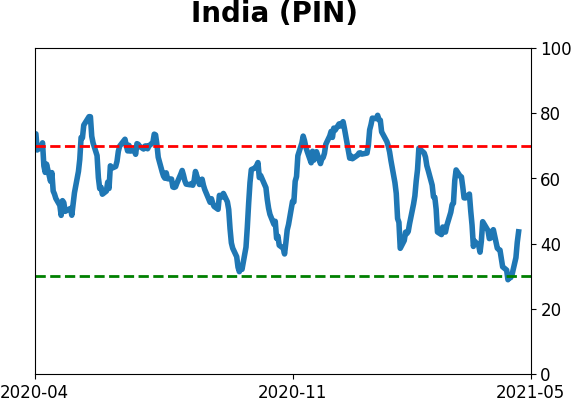
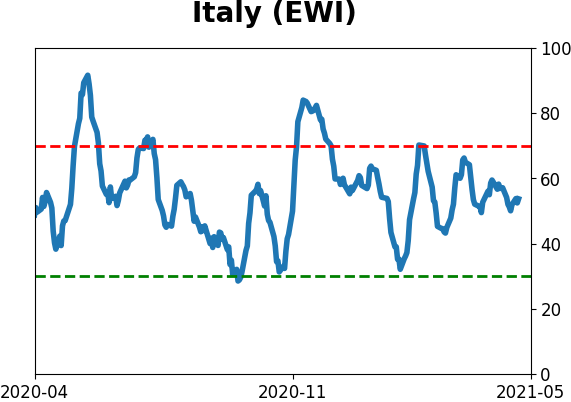
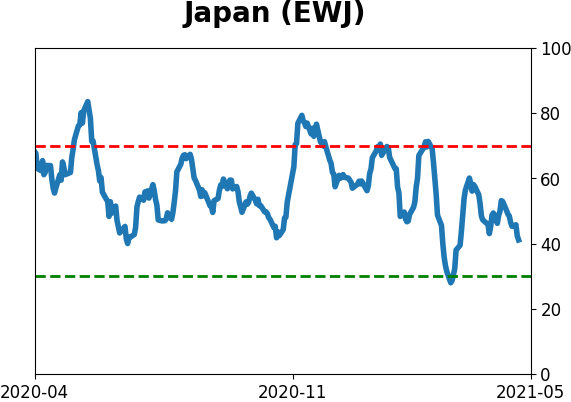
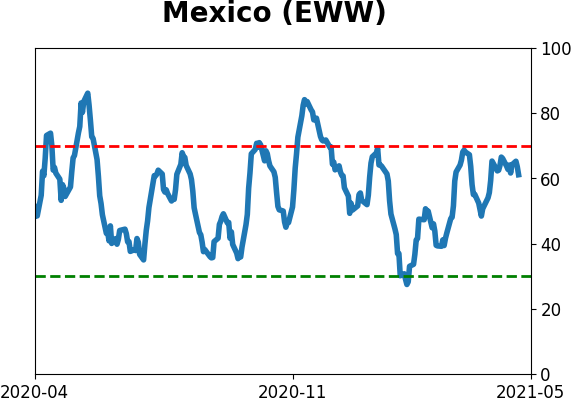
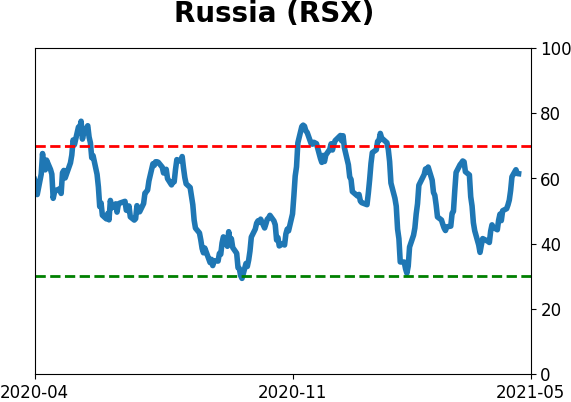
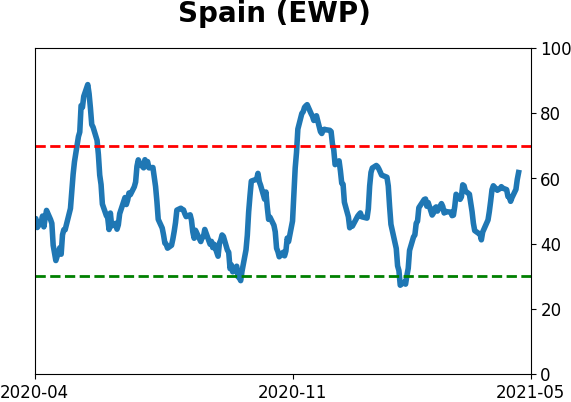
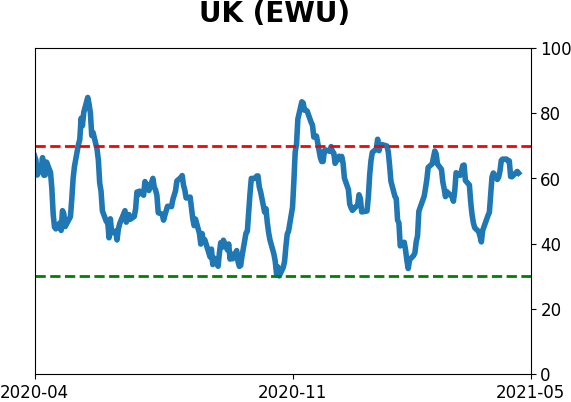
Sentiment Around The World
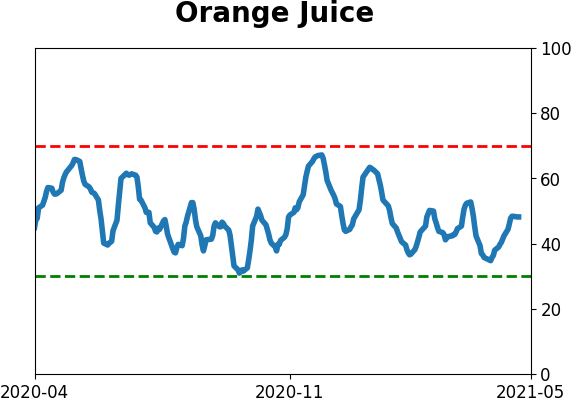
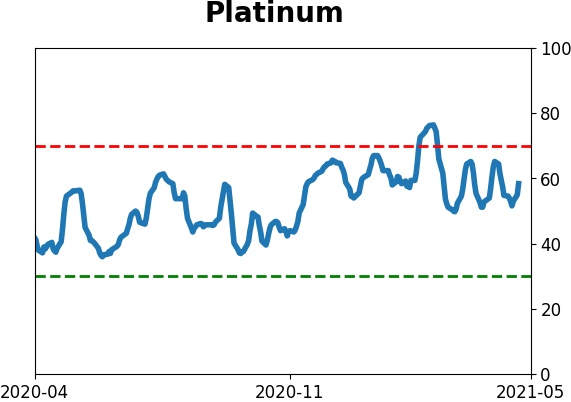
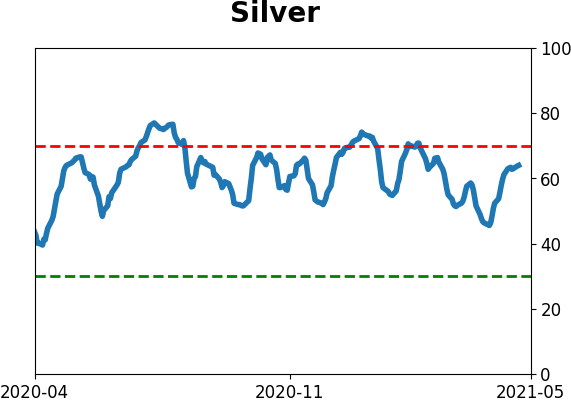
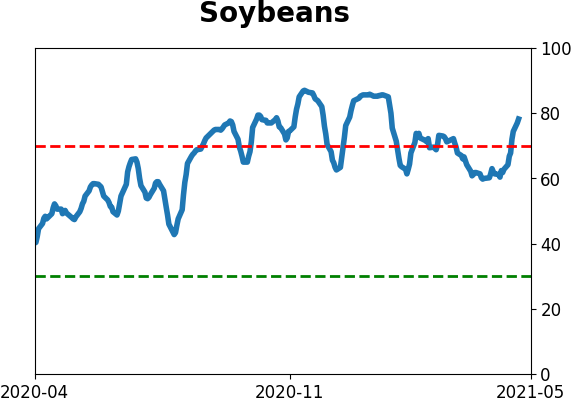
Optimism Index Thumbnails
|
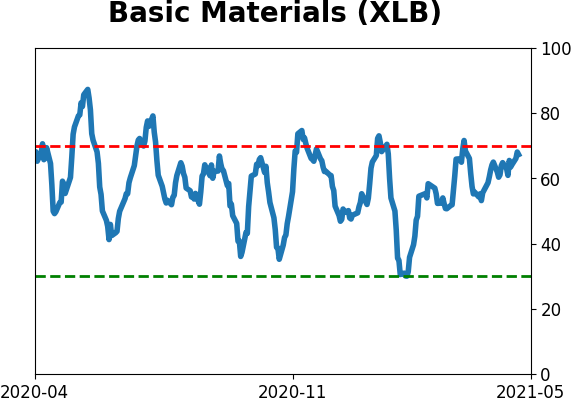
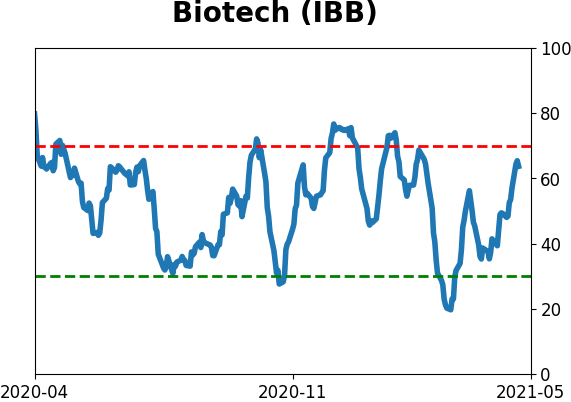
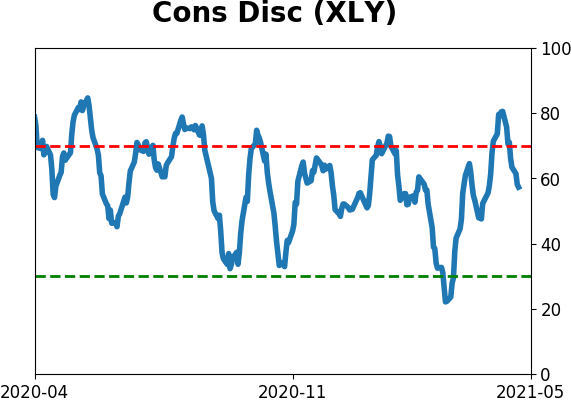
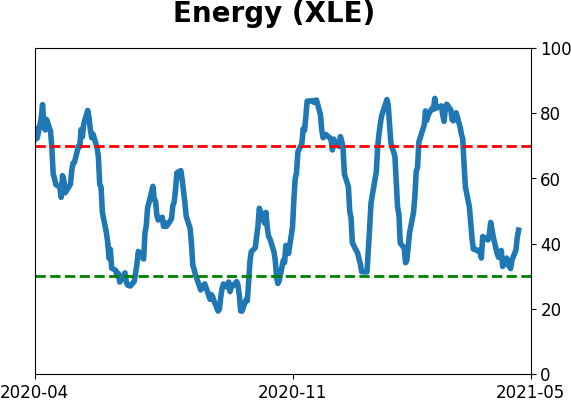
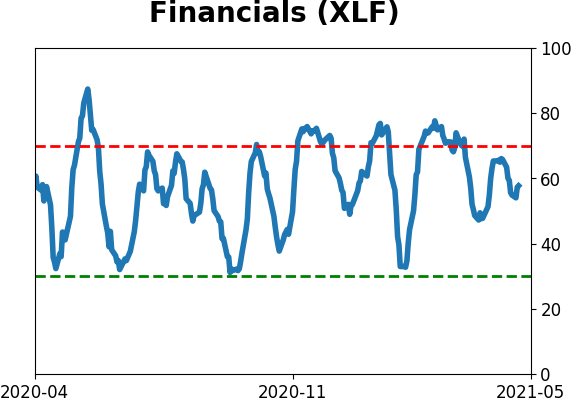
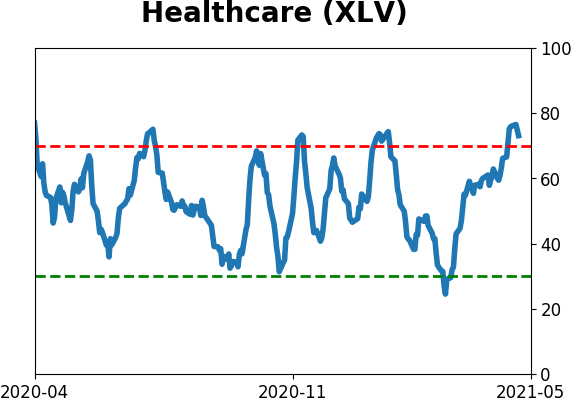
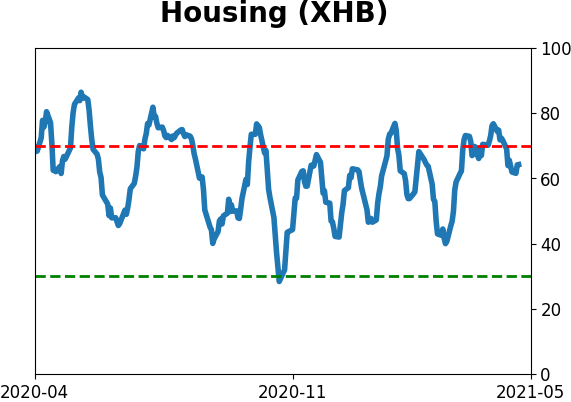
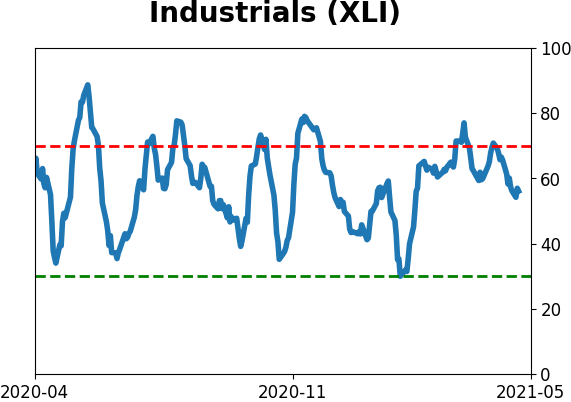
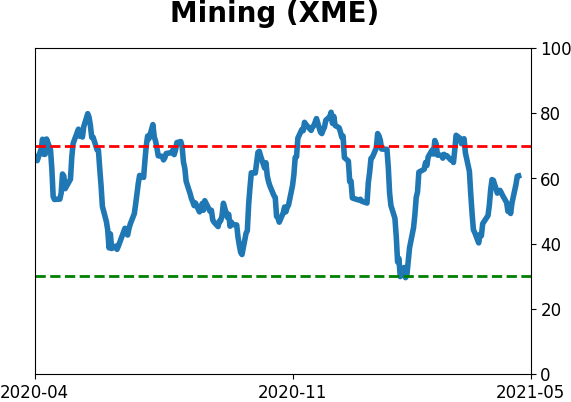
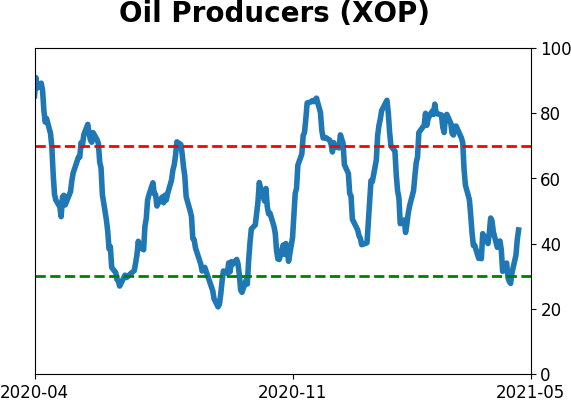
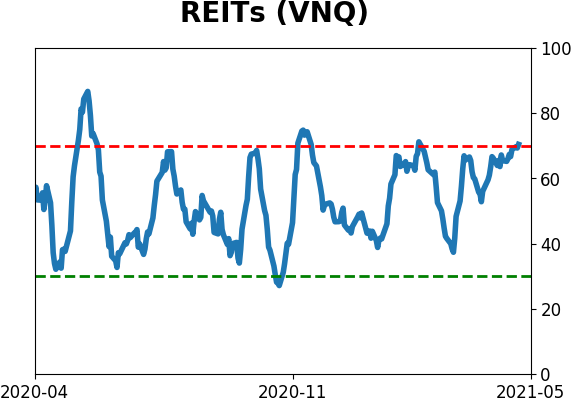
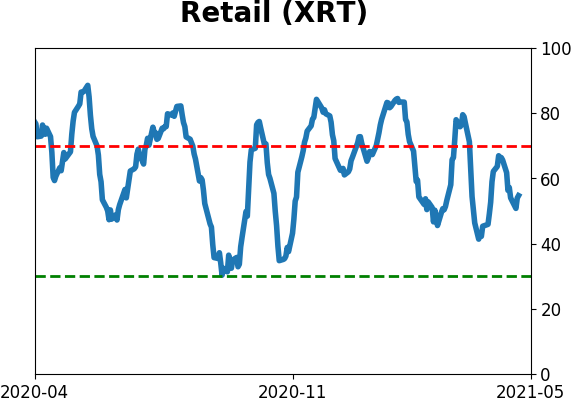
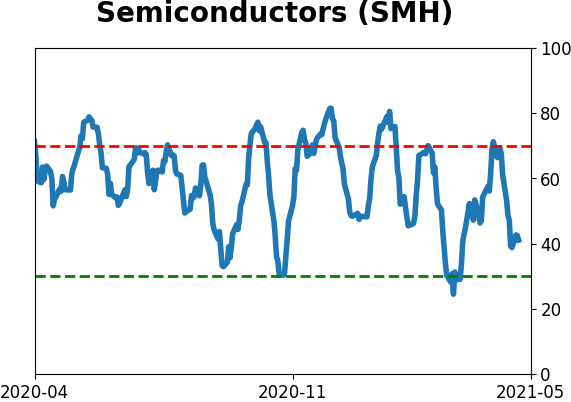
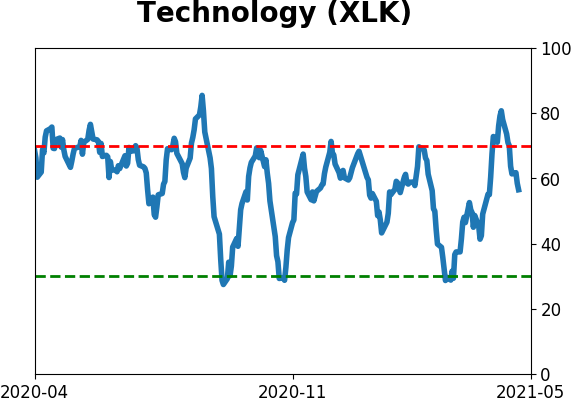
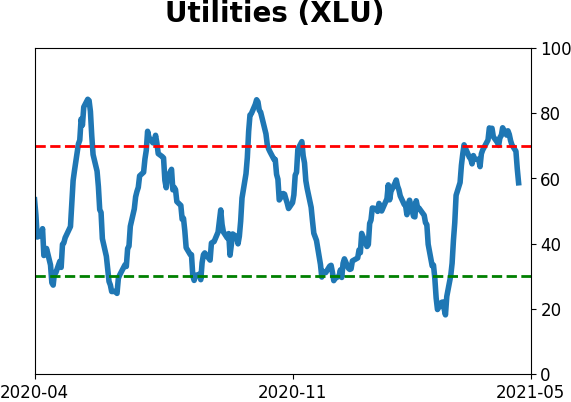
Sector ETF's - 10-Day Moving Average
|
|
|
Country ETF's - 10-Day Moving Average
|
|
|
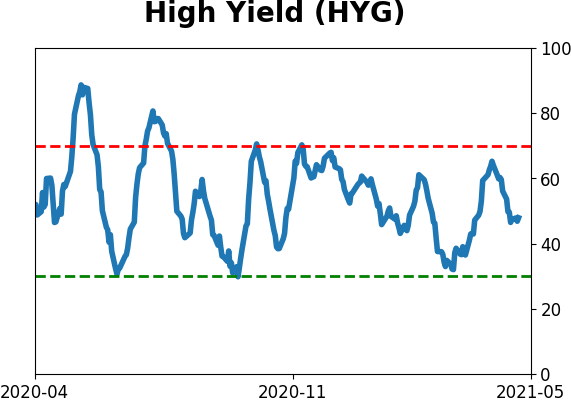
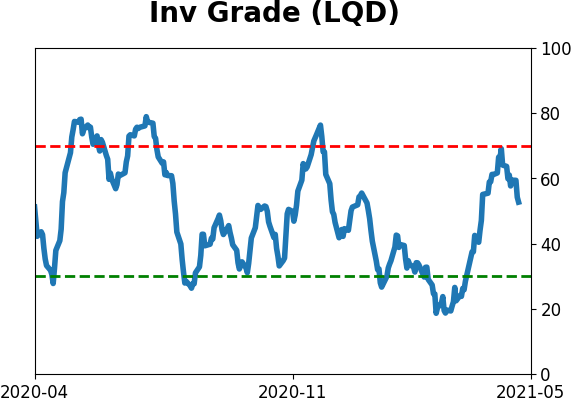
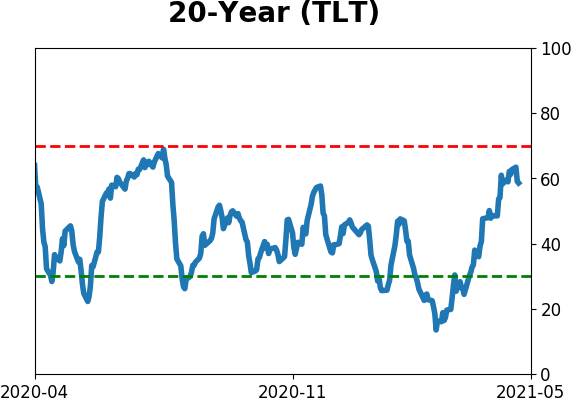
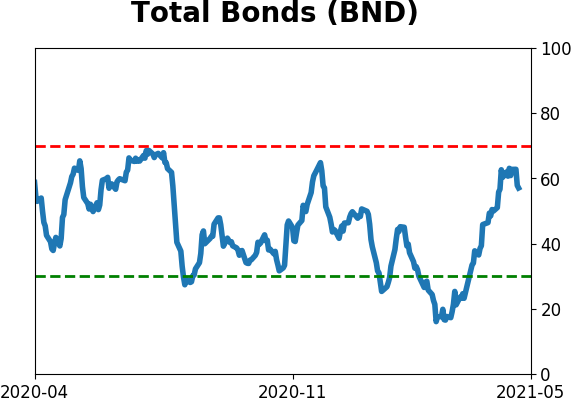
Bond ETF's - 10-Day Moving Average
|
|
|
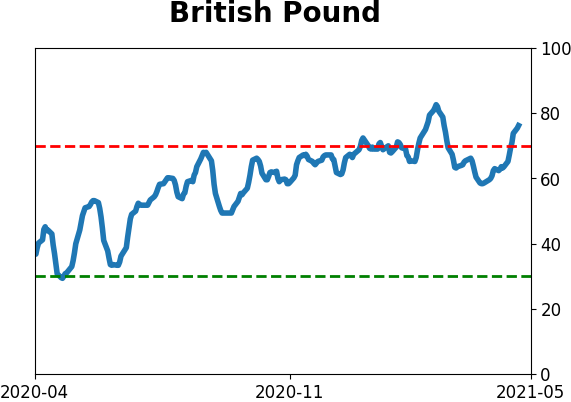
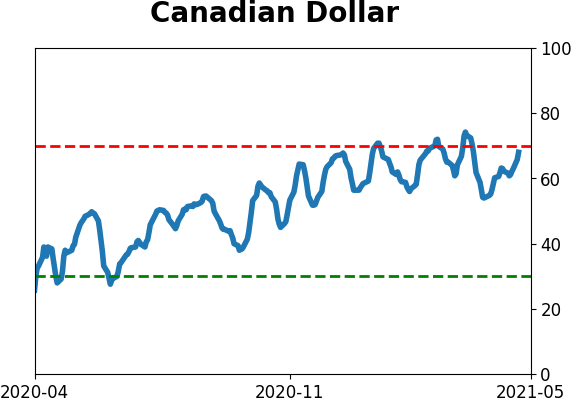
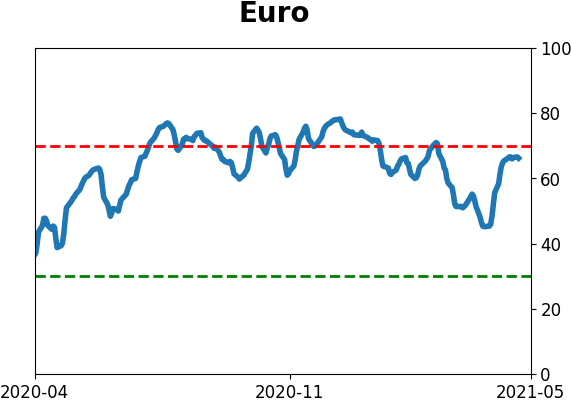
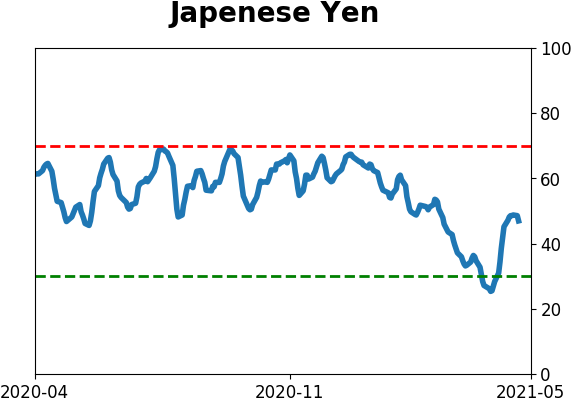
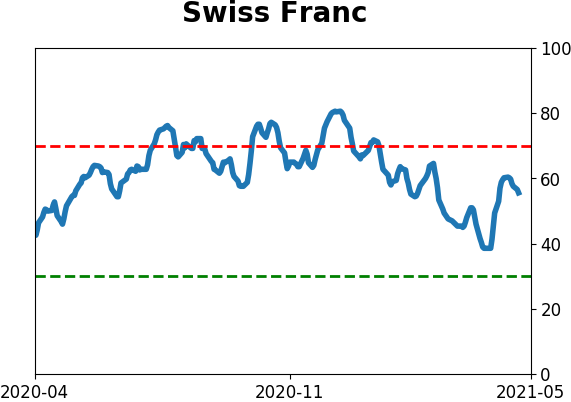
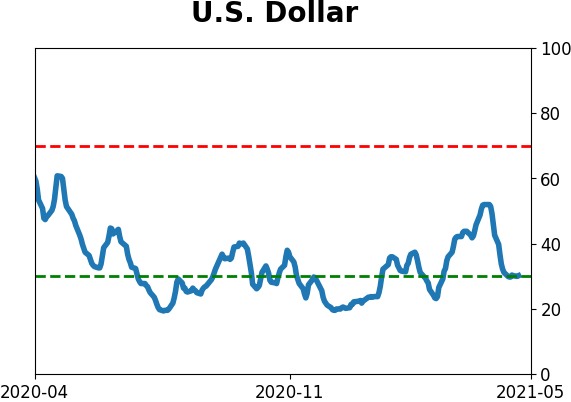
Currency ETF's - 5-Day Moving Average
|
|
|
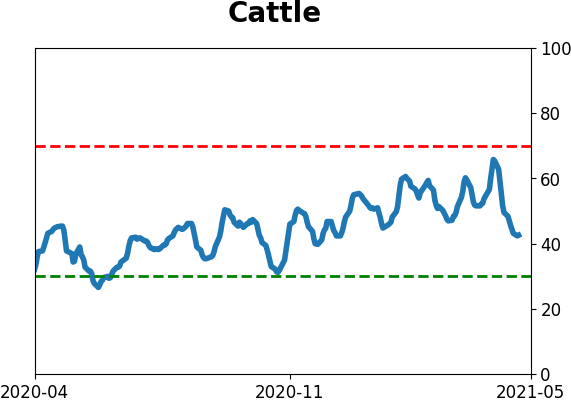
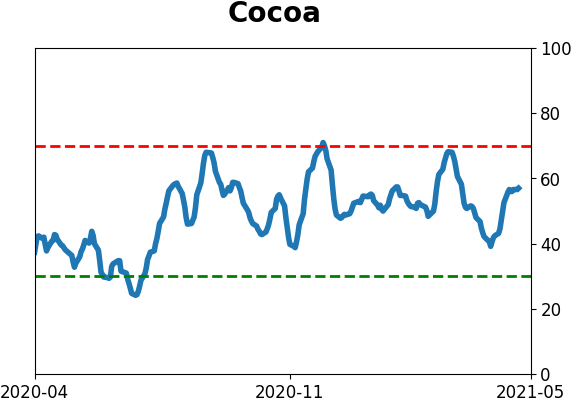
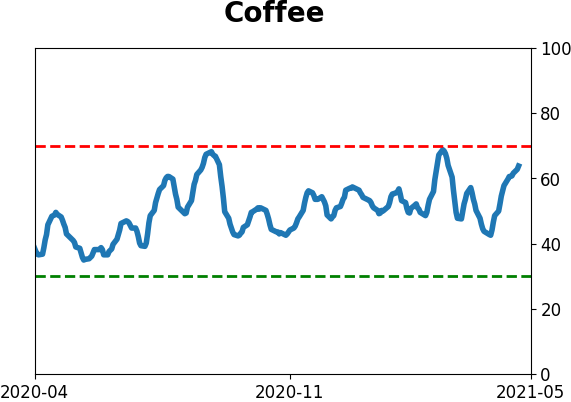
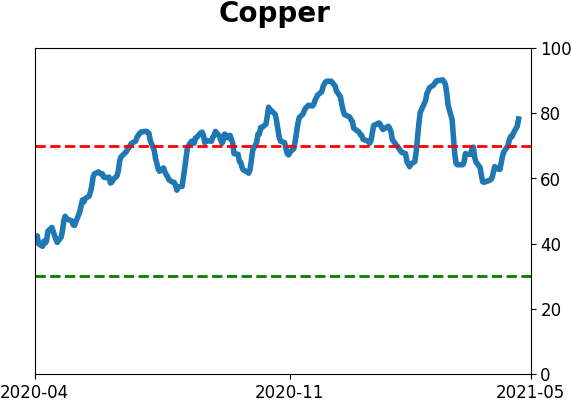
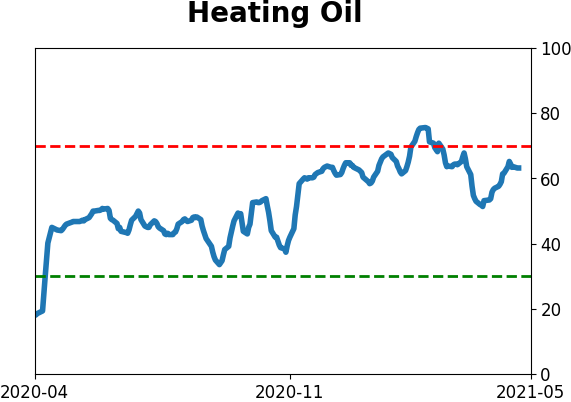
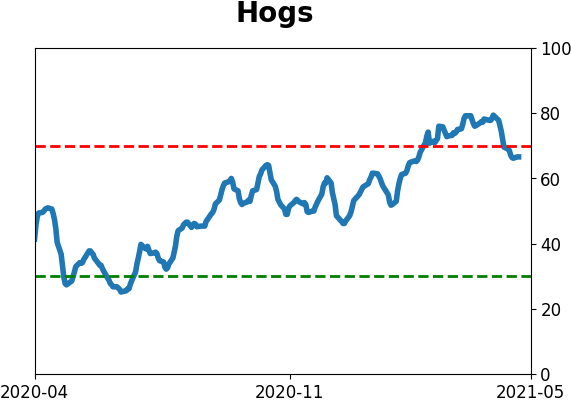
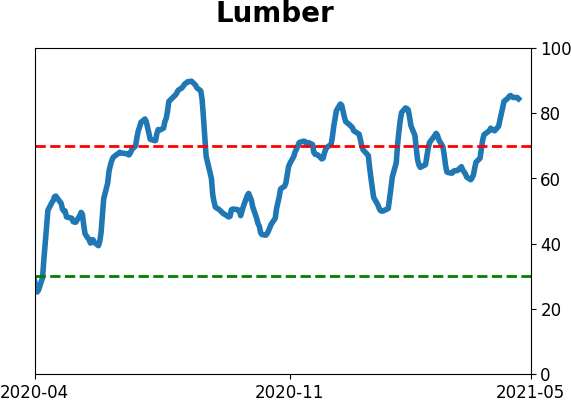
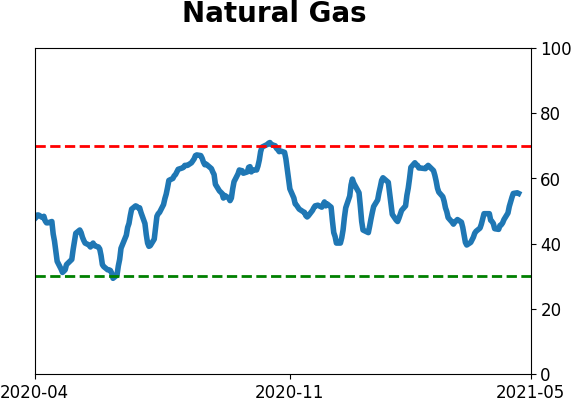
Commodity ETF's - 5-Day Moving Average
|
|