Headlines
|
|
Russell 2000 sprints ahead of other indexes:
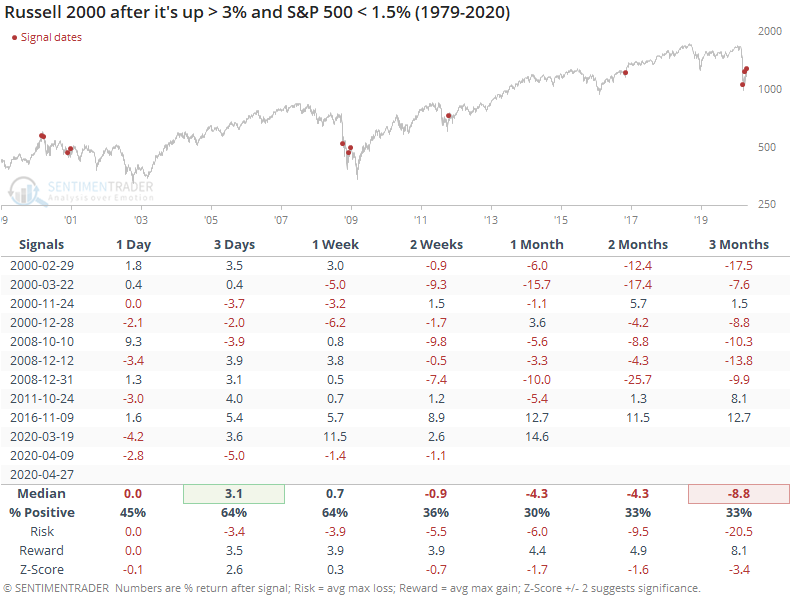
The small-cap Russell 2000 sprinted ahead of other indexes like the S&P 500 on Monday. Other times it doubled the return of the S&P in a single session, it typically fell back in the weeks ahead, especially on a relative basis.
Big money managers ease their pessimism:
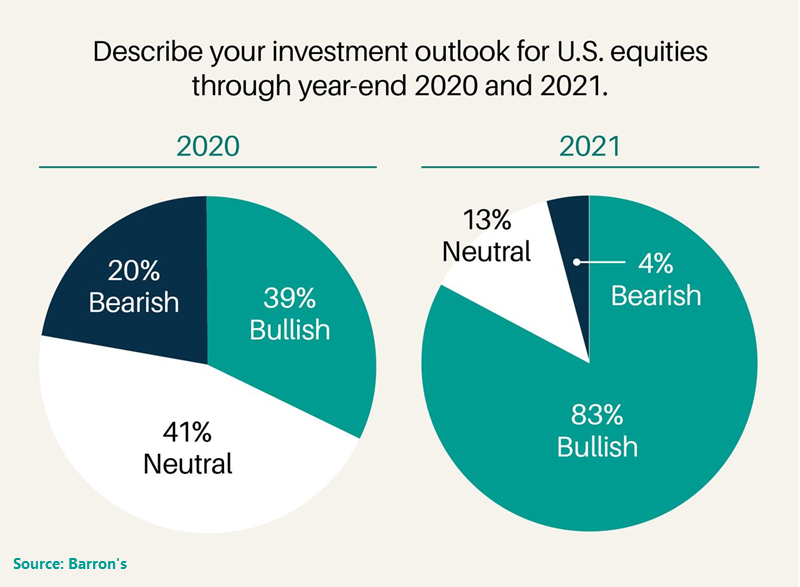
The Barron's Big Money poll shows that large money managers increased their optimism since last fall. Their overall bias remains less optimistic than usual, with fewer than two out of every three managers expecting stocks to rise through year-end.
A month after initial surge, energy stocks show record gain:
In late March, there was a surge in the energy sector. More than 95% of stocks in the sector climbed above their 10-day moving averages, while fewer than 20% of them were above their long-term 200-day averages. In the month since then, the sector climbed another 13%, the best post-surge reaction in 30 years.
Margin contraction: Margin debt, funds borrowed against the value of stock holdings, fell by more than 10% in March, while free credits (cash) rose by more than 10%. That's only happened three other times: September 1946, September 1955, and October 1987. Stocks rose from 3 to 12 months later after all three instances.
|
Smart / Dumb Money Confidence
|
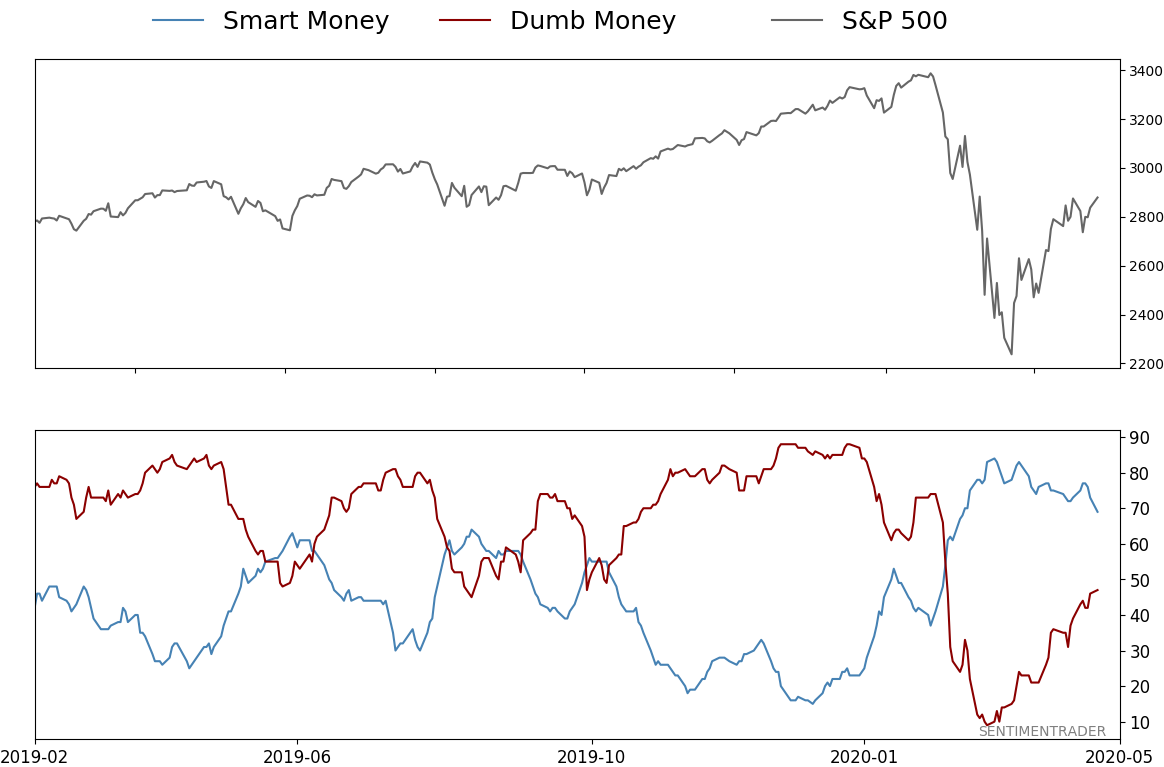
Smart Money Confidence: 69%
Dumb Money Confidence: 47%
|
|
Risk Levels
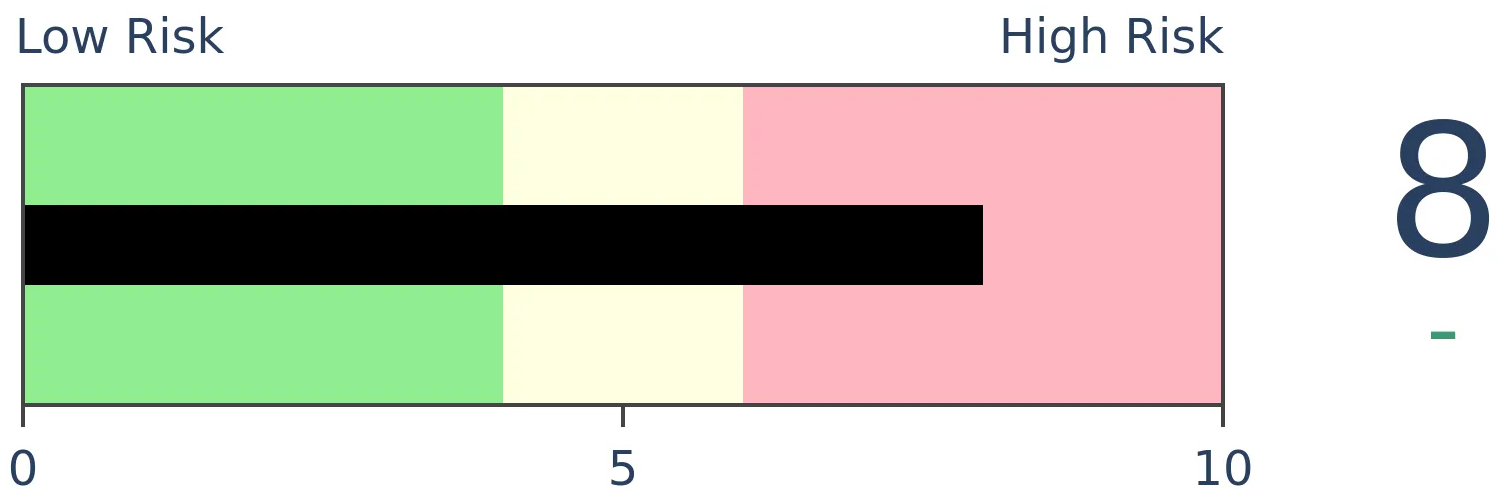
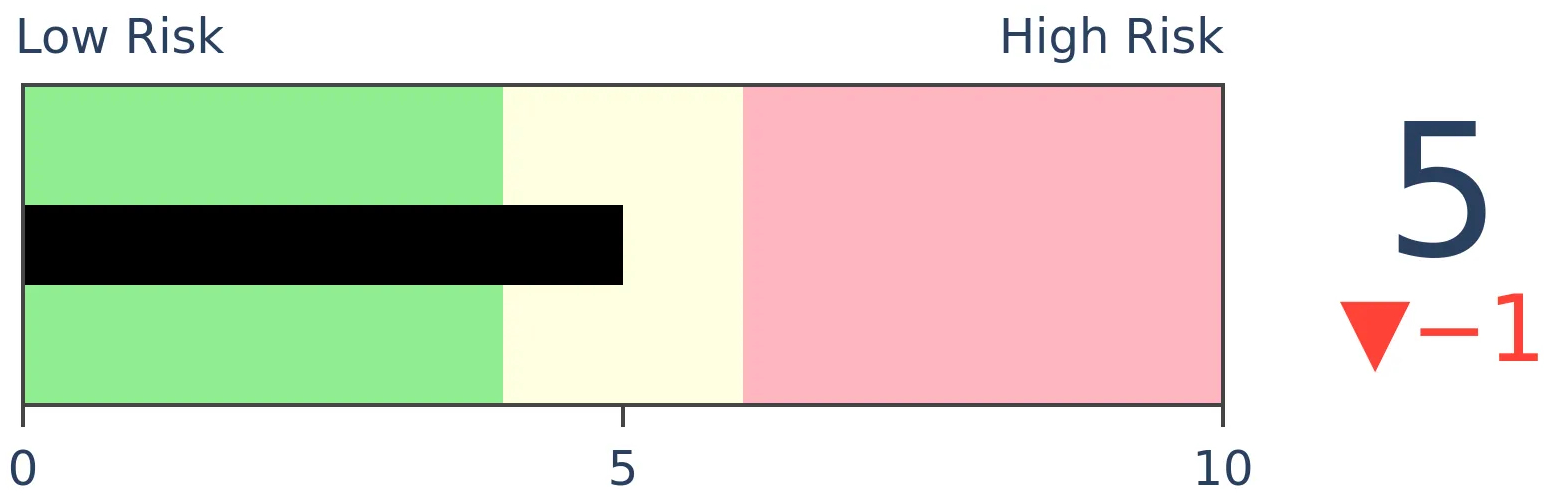
Stocks Short-Term
|
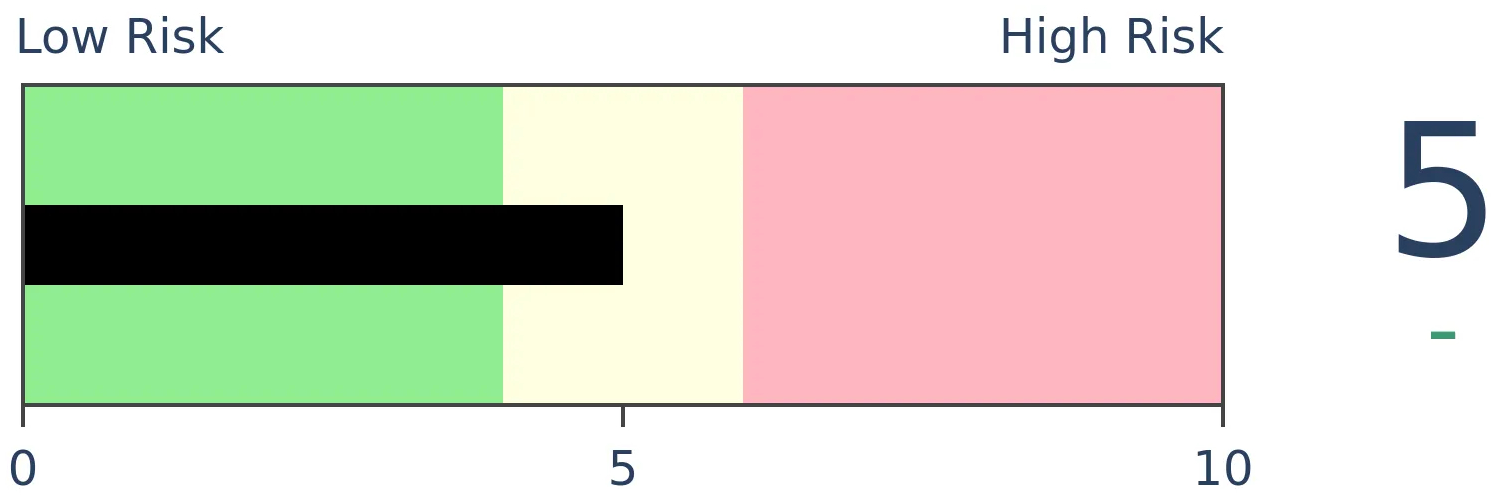
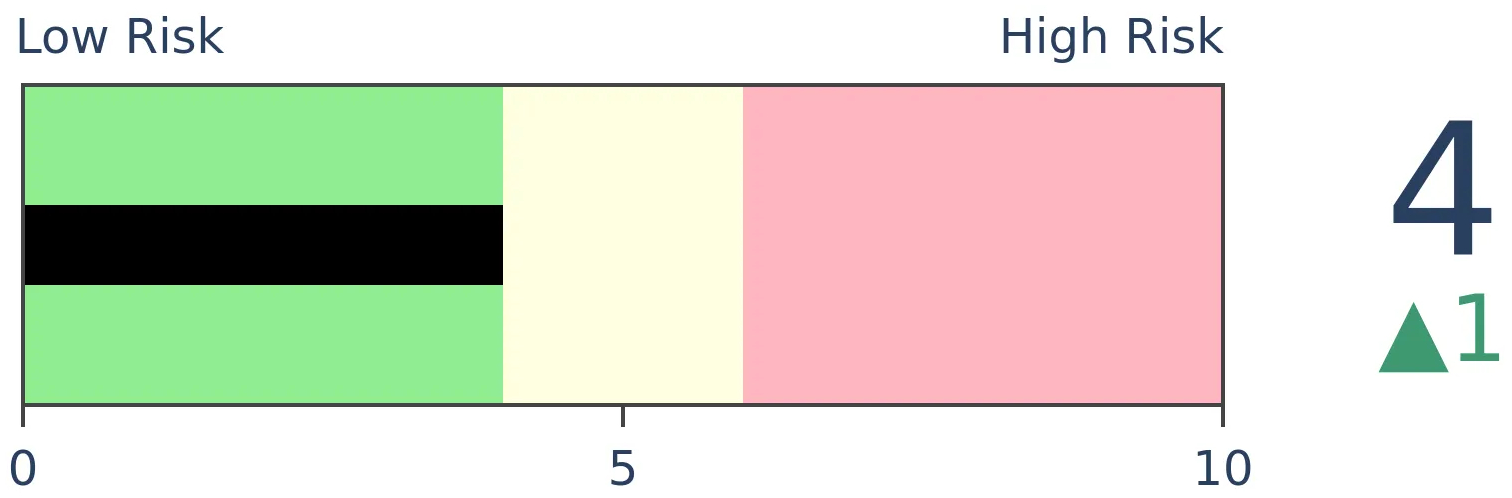
Stocks Medium-Term
|
|
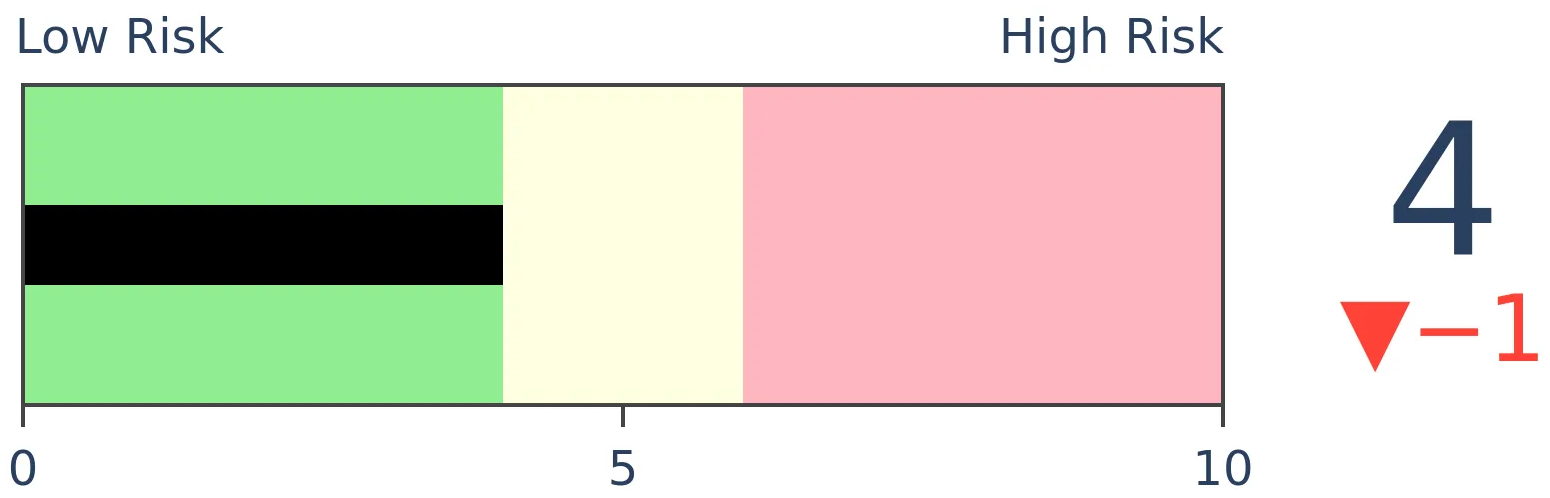
Bonds
|
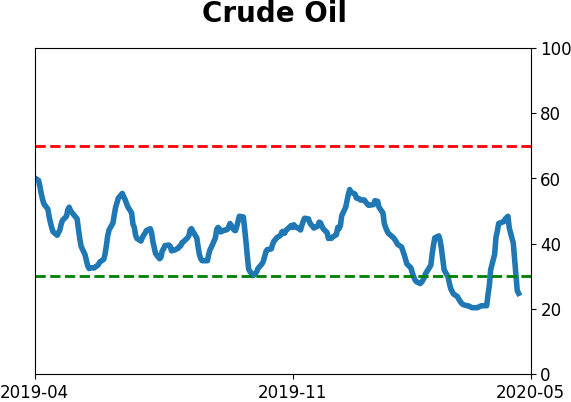
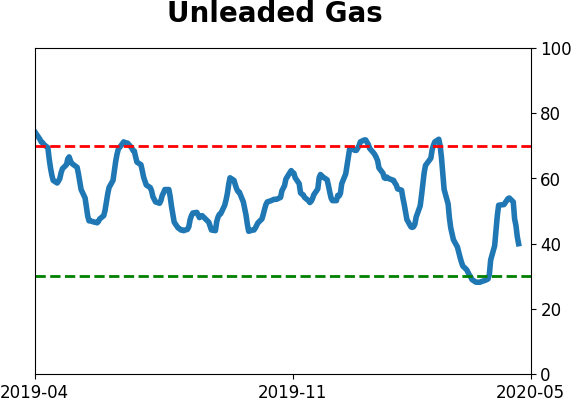
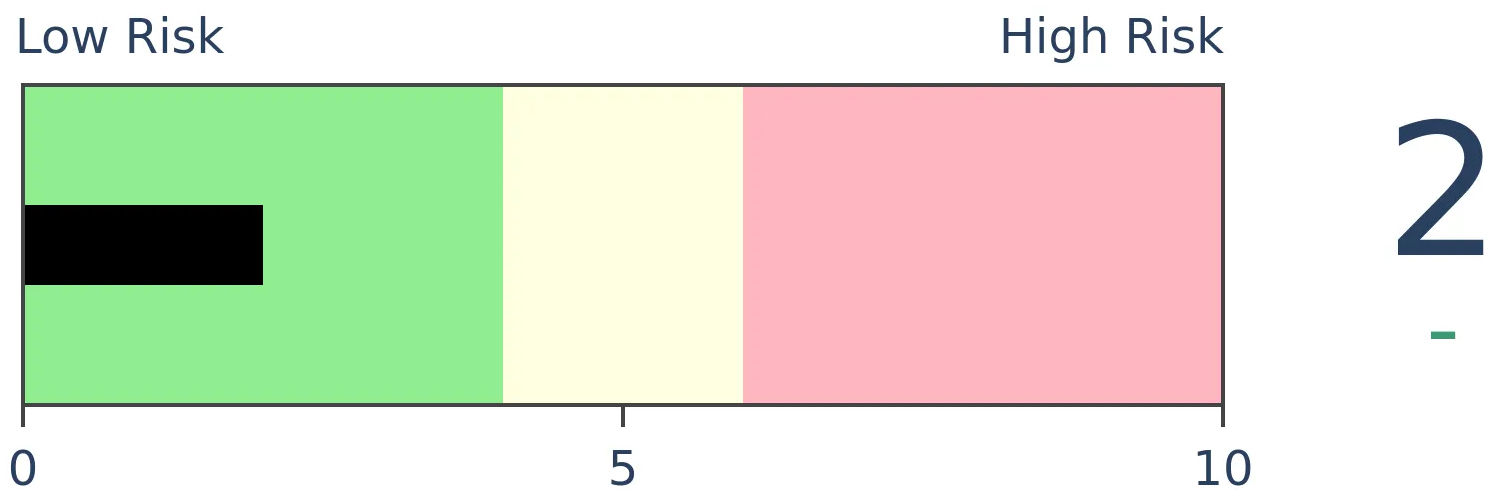
Crude Oil
|
|
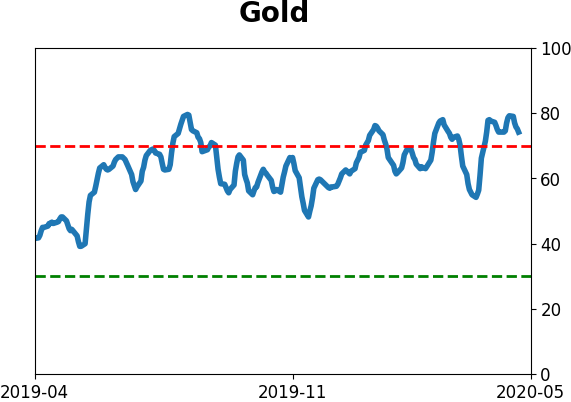
Gold
|
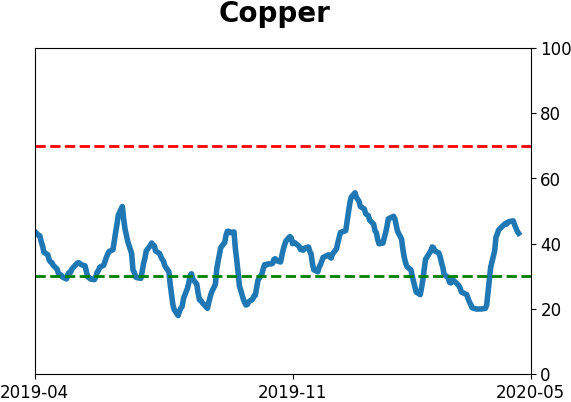
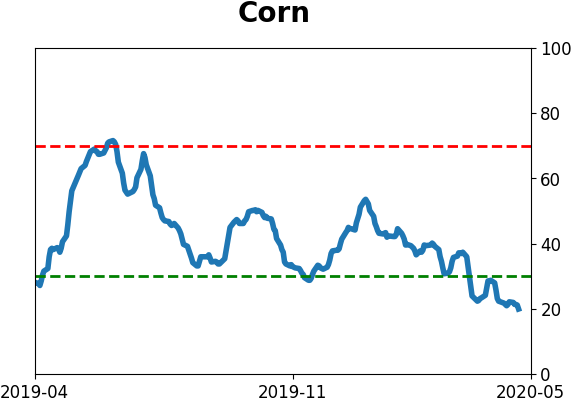
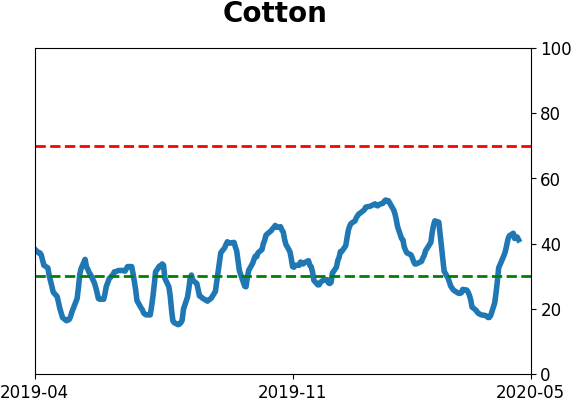
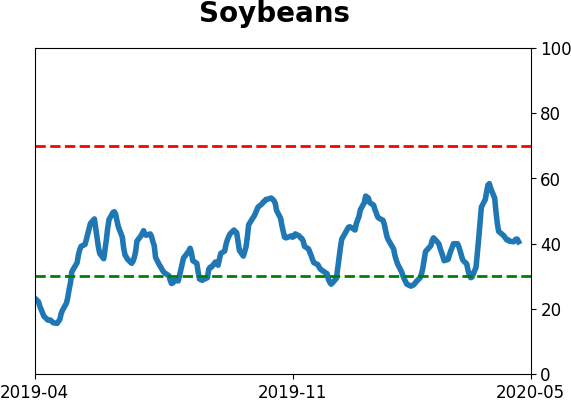
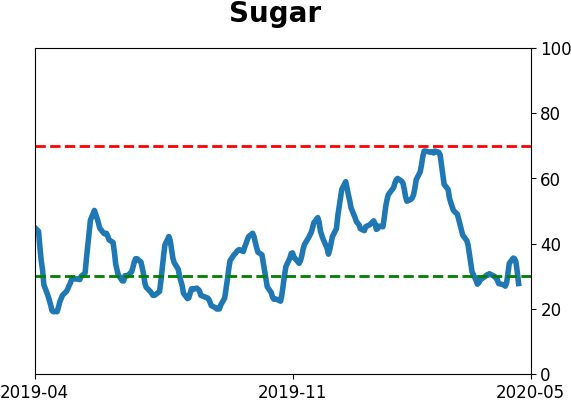
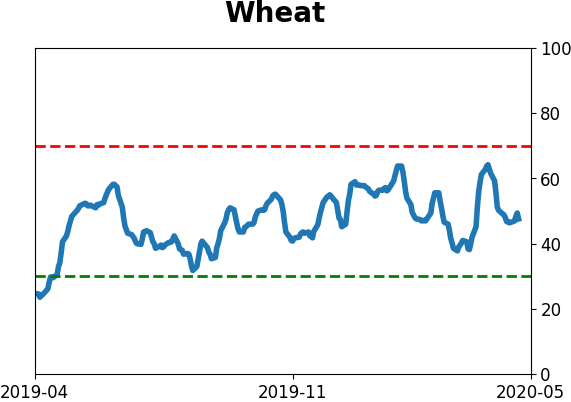
Agriculture
|
|
Research
BOTTOM LINE
The small-cap Russell 2000 sprinted ahead of other indexes like the S&P 500 on Monday. Other times it doubled the return of the S&P in a single session, it typically fell back in the weeks ahead, especially on a relative basis.
FORECAST / TIMEFRAME
None
|
It was kind of a weird day in equity land. Perhaps due to traders becoming optimistic about smaller businesses starting to open up again, the small-cap Russell 2000 soared and left other indexes far behind.
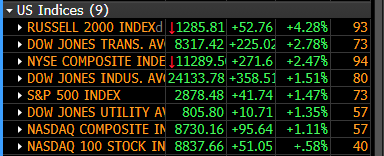
The Russell doubling the return on the S&P hasn't happened many times since 1979. All of them have triggered since the year 2000.
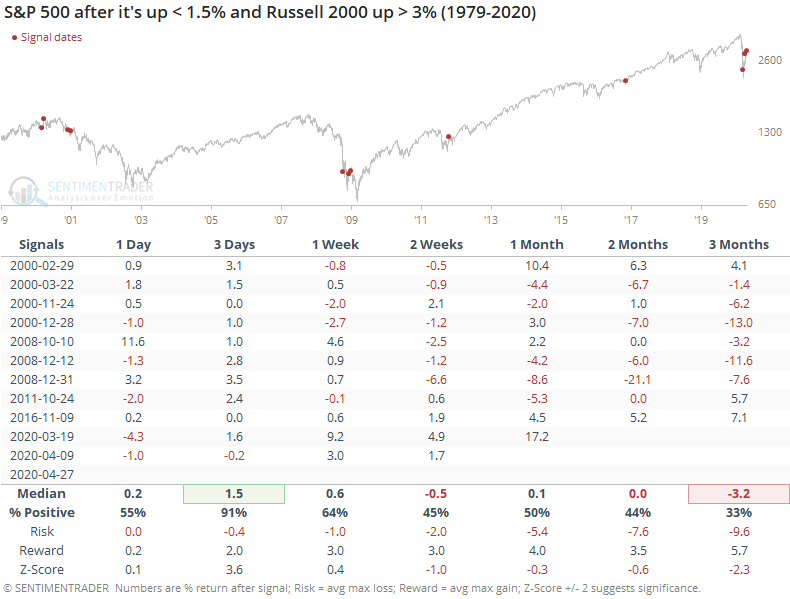
The S&P managed to rise over the next few sessions every time but once, and even that was a small loss quickly erased. But because most of them triggered in 2000 or 2008, returns after the first week were questionable.
For the Russell, returns were worse.
That means the ratio between them usually suffered.
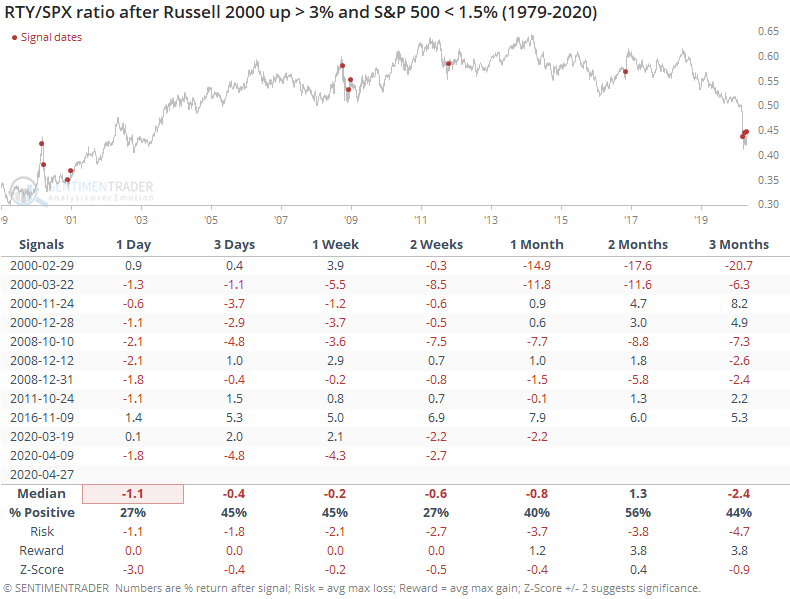
Bulls are mostly hoping that small-cap outperformance can continue. It's trying to turn up after a plunge, and it should be a good sign going forward. Historically, though, it's been tough to do so after such a big difference in returns like we saw on Monday.
BOTTOM LINE
The Barron's Big Money poll shows that large money managers increased their optimism since last fall. Their overall bias remains less optimistic than usual, with fewer than two out of every three managers expecting stocks to rise through year-end.
FORECAST / TIMEFRAME
SPY -- Up, Medium-Term
|
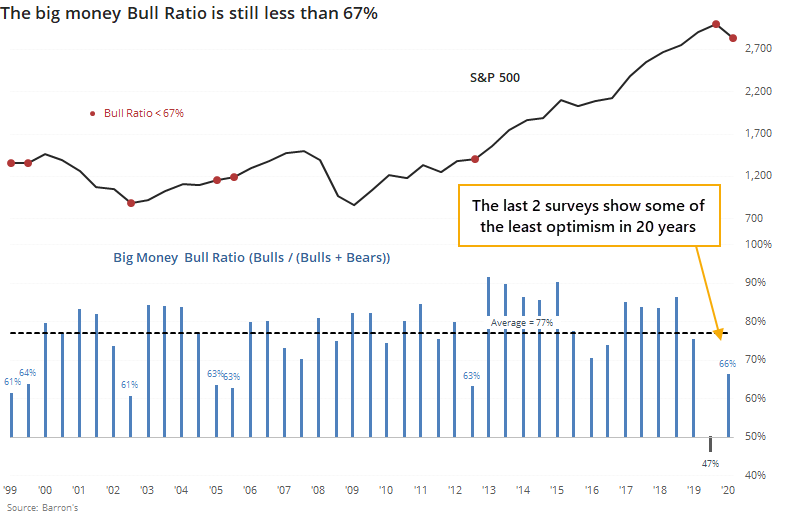
Last fall, the "big money" was not optimistic. According to the semiyearly poll of more than 100 major money managers by Barron's, never before had they been so negative on stocks.
When we looked at it in the October 28 report, it suggested a modest positive bias for stocks. Other times the big money had been relatively downbeat, stocks did well in the months ahead. Like many of these kinds of surveys, though, it wasn't a huge edge. Assuming that big money is a contrary indicator isn't that easy.
While stocks climbed for the next four months, proving the big money was way too conservative, the plunge in March perhaps justified some of that conservatism. Some of the managers took advantage of the lower prices by becoming more constructive.
Below, we can see that compared to other readings over the past two decades, these managers are still less optimistic than usual.
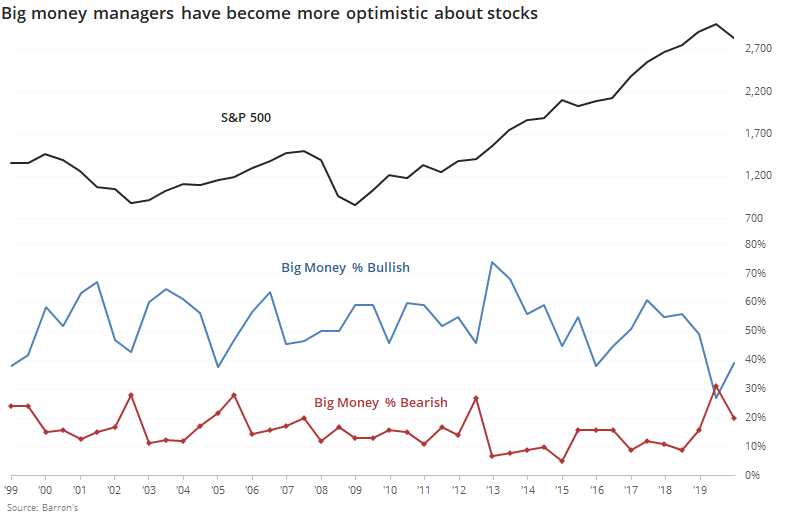
If we look at it in terms of a Bull Ratio (Bulls / Bulls + Bears)) then the current ratio of 66% means that fewer than two-thirds of the managers are optimistic. That's well below the long-term average of 77% and still ranks among the lowest in more than 20 years.
The S&P mostly rose after similarly low ratios, though technically we're still on this signal since it triggered last October. If we look at returns following any survey when the Bull Ratio was less than 67%, they were above average, with a decent risk/reward ratio over the medium-term.
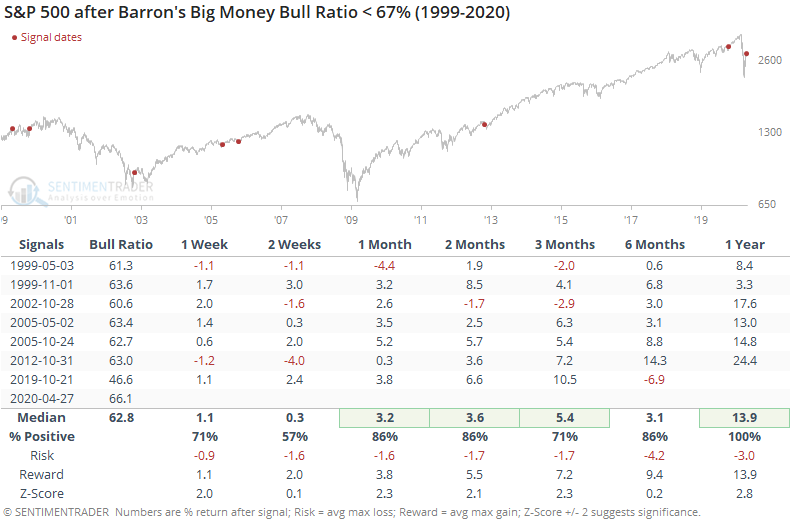
It's a small sample, but should be a small positive going forward.
BOTTOM LINE
In late March, there was a surge in the energy sector. More than 95% of stocks in the sector climbed above their 10-day moving averages, while fewer than 20% of them were above their long-term 200-day averages. In the month since then, the sector climbed another 13%, the best post-surge reaction in 30 years.
FORECAST / TIMEFRAME
XLE -- Down, Medium-Term
|
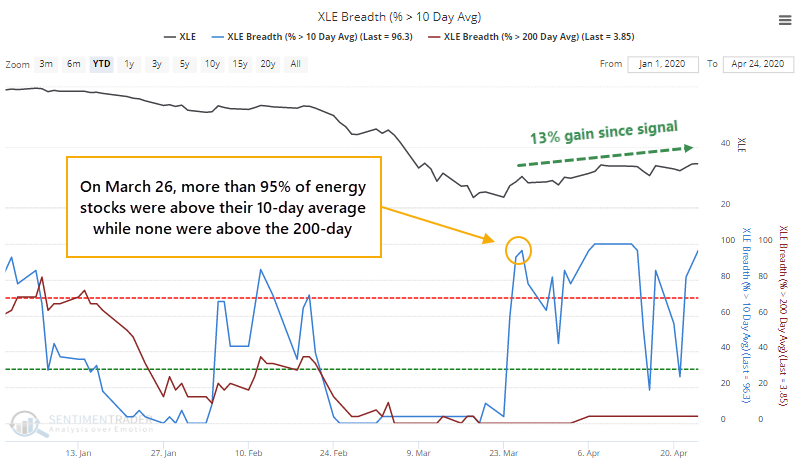
On March 26, there was enough of a surge in energy stocks that more than 95% of the ones in the S&P 500 Energy sector managed to close above their 10-day moving averages. But because of the longer-term devastation, none of them had yet managed to climb above their long-term 200-day averages.
That has signaled "dead cat bounce" more often than not in the past. Not this time - the sector climbed more than 13% in the 20 days since then and the percentage of stocks above their short-term averages popped above 95% again on Friday.
This 13% gain in the month following the initial surge is the best we've ever seen after a surge like that. Once we get to the one-month point following a jump like this, the risk/reward turned quite negative.
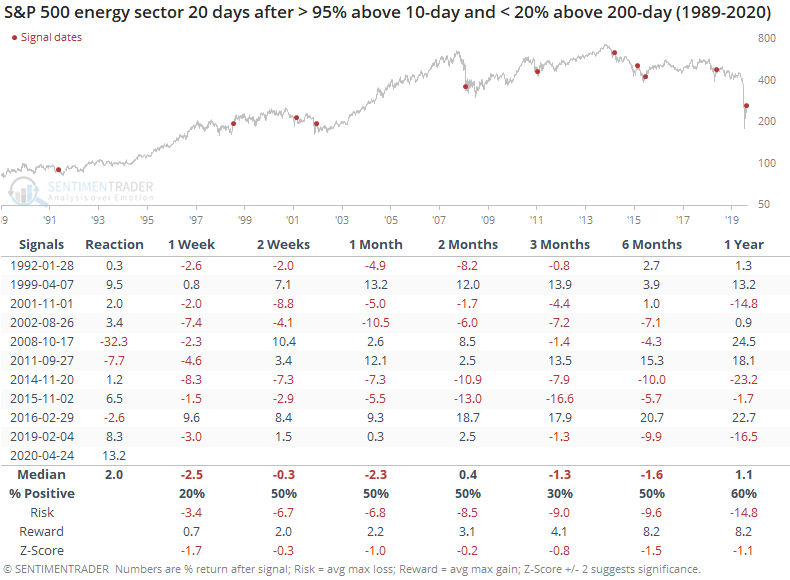
In the "Reaction" column, we see the return in the sector in the month following the initial surge (when more than 95% of stocks in the sector traded above their 10-day averages while fewer than 20% were above their 200-day averages). The current one, at 13.2%, is by far the best out of any of them.
If we filter the table to only include the best reactions, then we get the following.
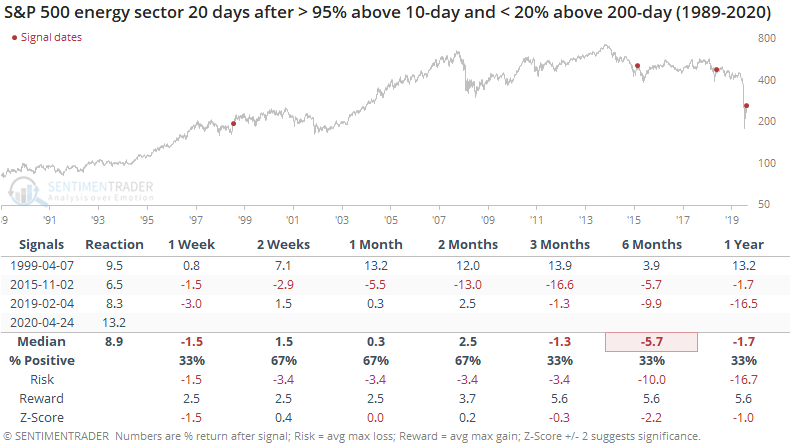
In 1999, energy stocks continued to soar over the next few weeks, then went nowhere, eventually giving back all the gains and then some as the broad market suffered from the dotcom collapse.
The last two signals both peaked almost immediately or at least enjoyed only relatively small upside in the weeks and months ahead.
If we expand the sample to include any gain of more than 1% in the month following the initial surge, then the returns were quite poor.
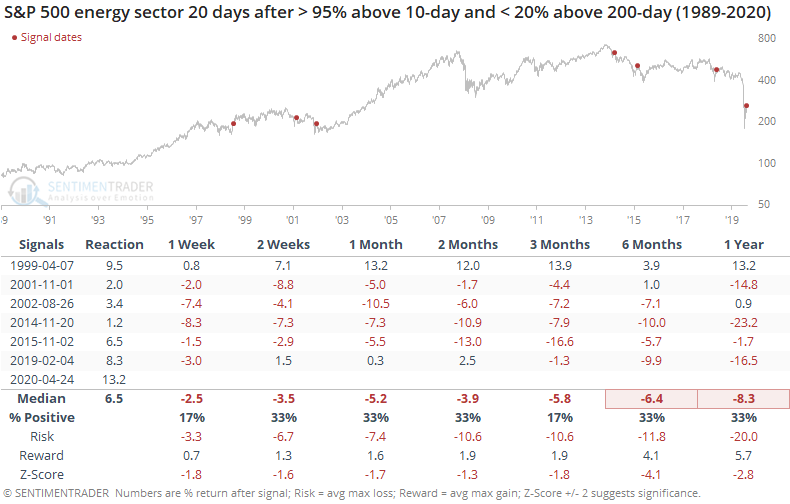
After these, the only gainer continued to be that signal from April 1999. All the others showed losses even up to three months later.
We've seen a lot of unprecedented action over the past month, especially in energy stocks. That might mean we can't rely as much on historical behavior. From what we can see, though, the upside has been limited at best when the sector showed a gain a month following its initial surge in poor markets.
Active Studies
| Time Frame | Bullish | Bearish | | Short-Term | 0 | 4 | | Medium-Term | 12 | 0 | | Long-Term | 34 | 3 |
|
Indicators at Extremes
Portfolio
| Position | Weight % | Added / Reduced | Date | | Stocks | 49.9 | Reduced 10.3% | 2020-04-23 | | Bonds | 0.0 | Reduced 6.7% | 2020-02-28 | | Commodities | 5.1 | Added 2.4%
| 2020-02-28 | | Precious Metals | 0.0 | Reduced 3.6% | 2020-02-28 | | Special Situations | 0.0 | Reduced 31.9% | 2020-03-17 | | Cash | 45.0 | | |
|
Updates (Changes made today are underlined)
In the first months of the year, we saw manic trading activity. From big jumps in specific stocks to historic highs in retail trading activity to record highs in household confidence to almost unbelievable confidence among options traders. All of that came amid a market where the average stock couldn't keep up with their indexes. There were signs of waning momentum in stocks underlying the major averages, which started triggering technical warning signs in late January. The kinds of extremes we saw in December and January typically take months to wear away, but the type of selling in March went a long way toward getting there. When we place the kind of moves we saw into March 23 into the context of coming off an all-time high, there has been a high probability of a multi-month rebound. After stocks bottomed on the 23rd, they enjoyed a historic buying thrust and retraced a larger amount of the decline than "just a bear market rally" tends to. While other signs are mixed that panic is subsiding, those thrusts are the most encouraging sign we've seen in years. Shorter-term, there have been some warning signs popping up and our studies have stopped showing as positively skewed returns. I reduced my exposure some on Monday and a little more on Thursday and will consider further reducing it if we drop below last week's lows on SPY. Long-term suggestions from the studies remain robust, but shorter-term ones are significantly less so, and stocks still have to prove that we're in something other than a protracted, recessionary bear market.
RETURN YTD: -9.3% 2019: 12.6%, 2018: 0.6%, 2017: 3.8%, 2016: 17.1%, 2015: 9.2%, 2014: 14.5%, 2013: 2.2%, 2012: 10.8%, 2011: 16.5%, 2010: 15.3%, 2009: 23.9%, 2008: 16.2%, 2007: 7.8%
|
|
Phase Table
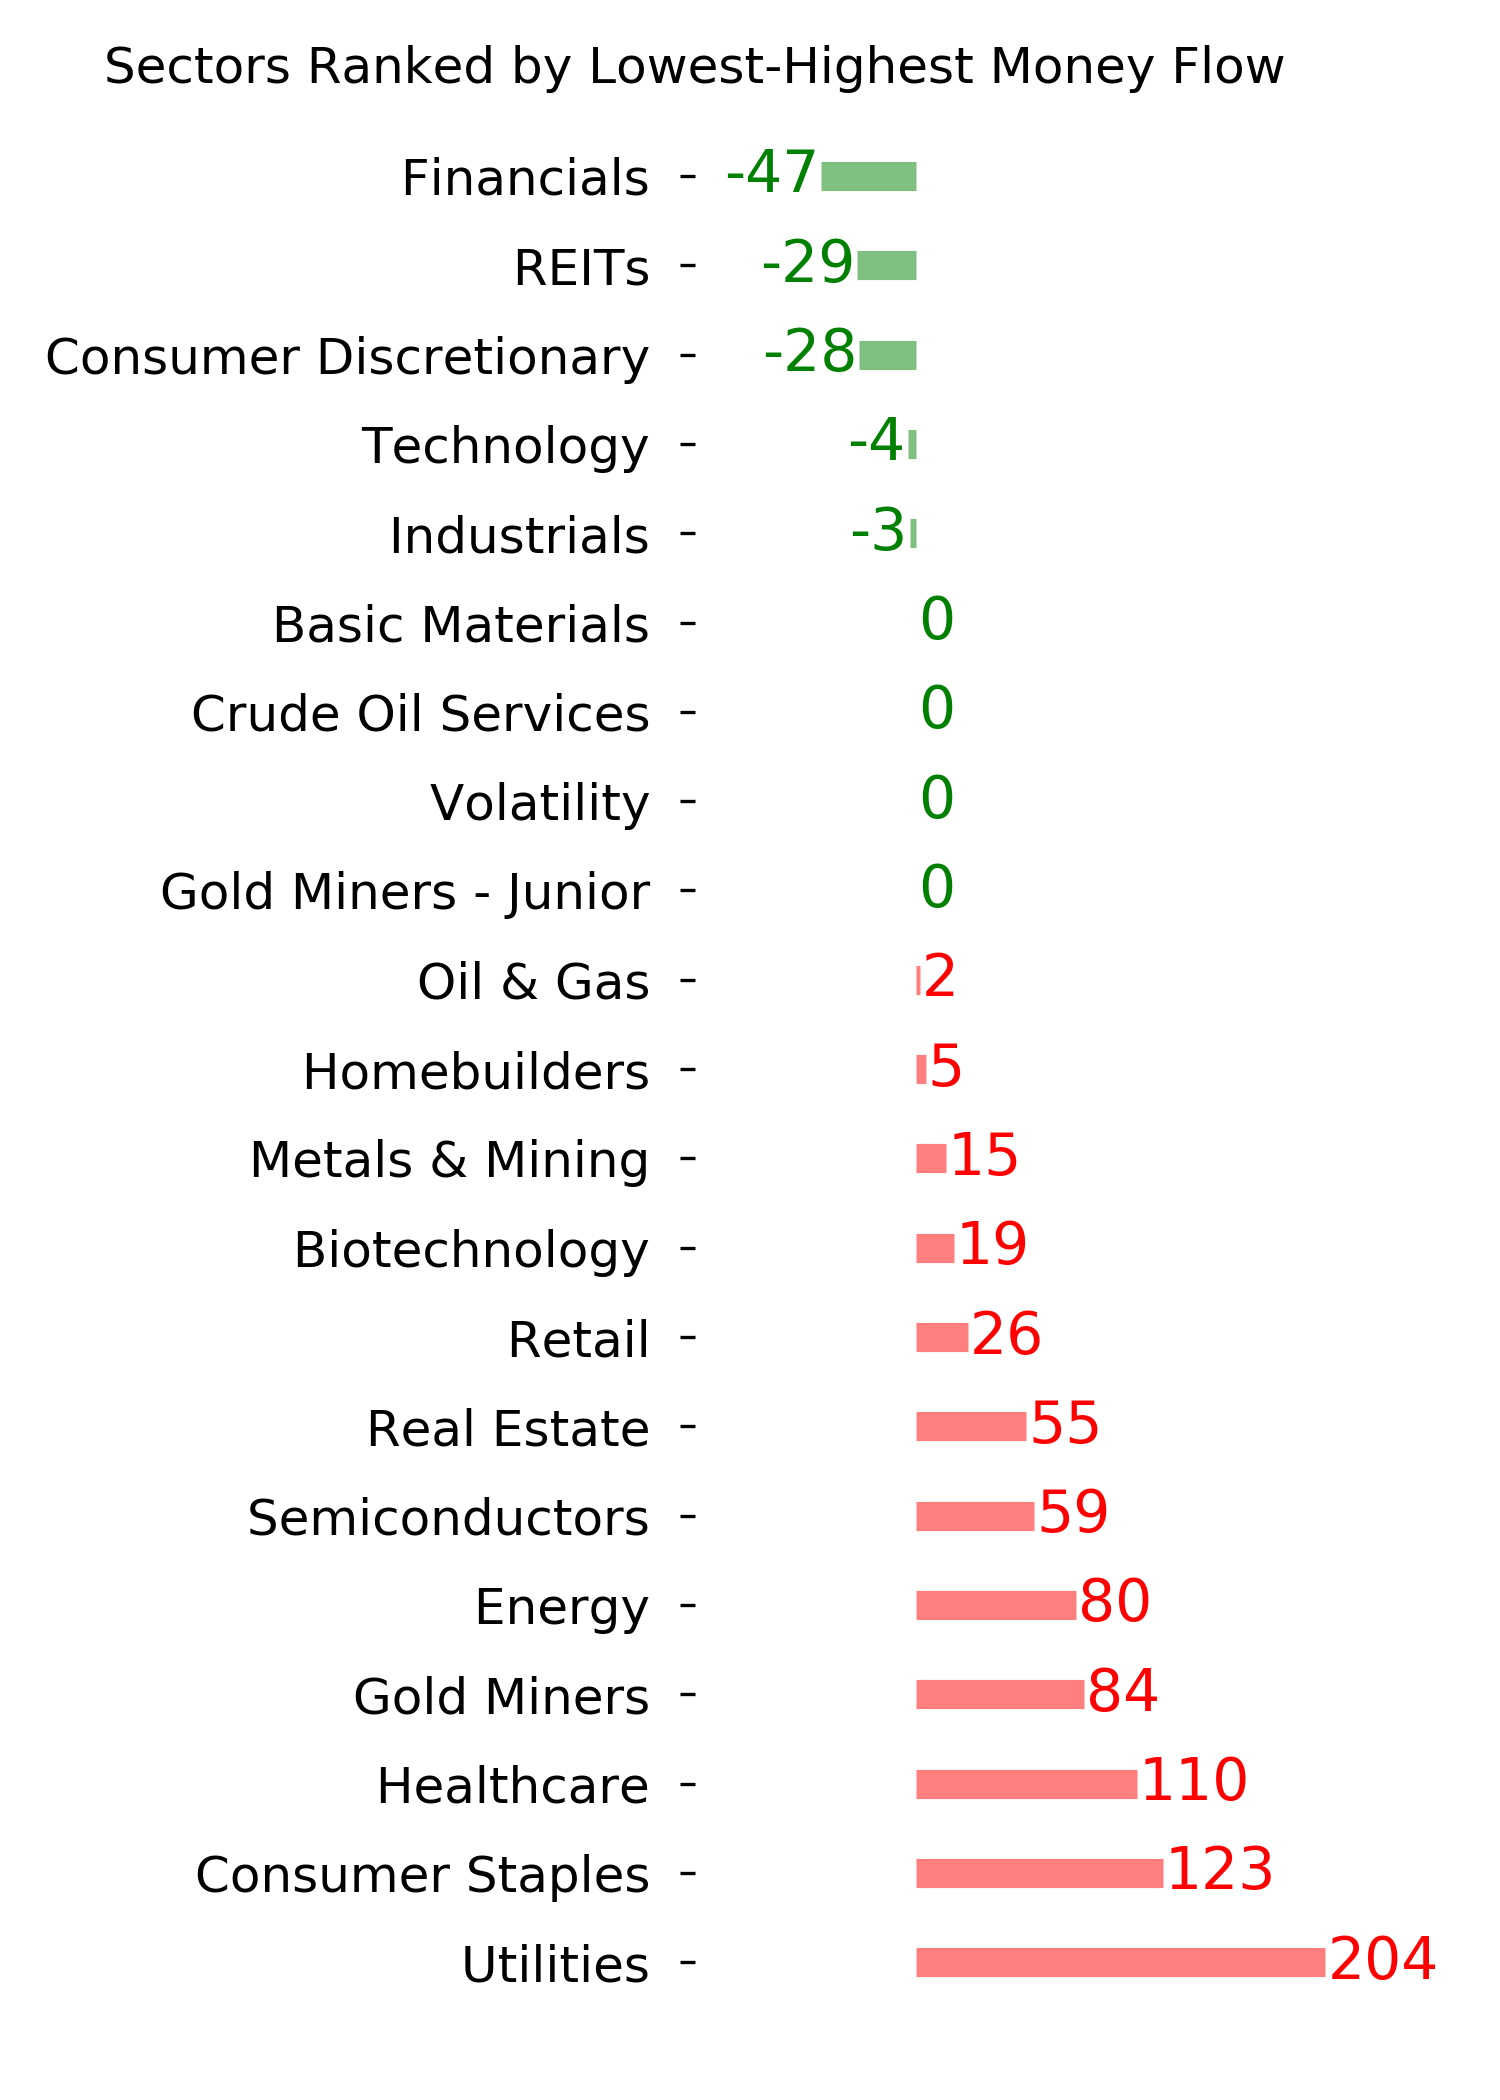
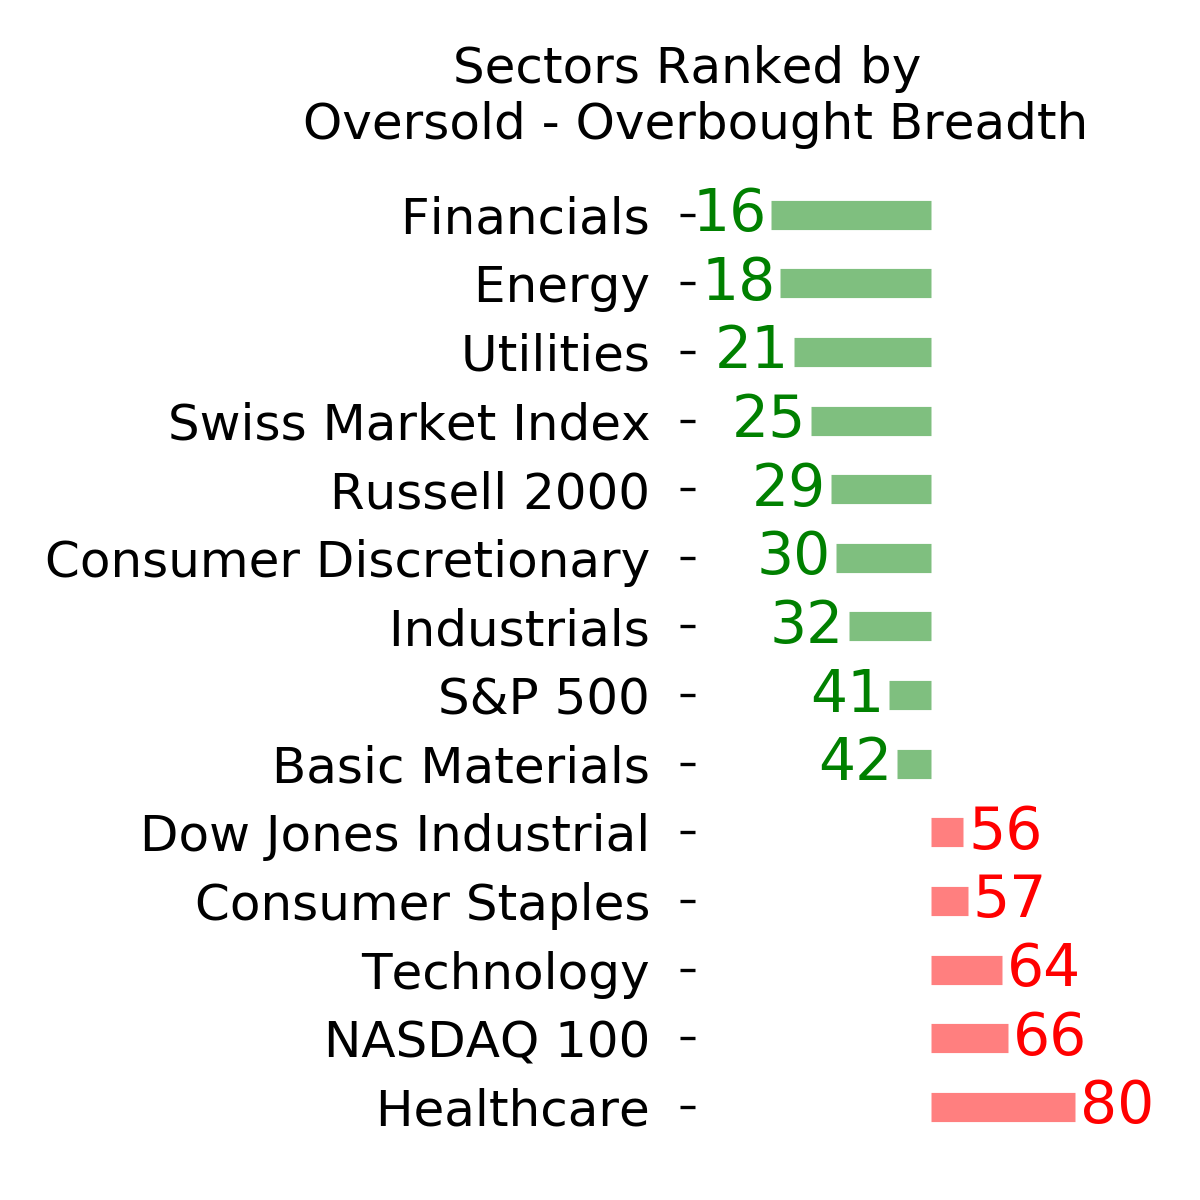
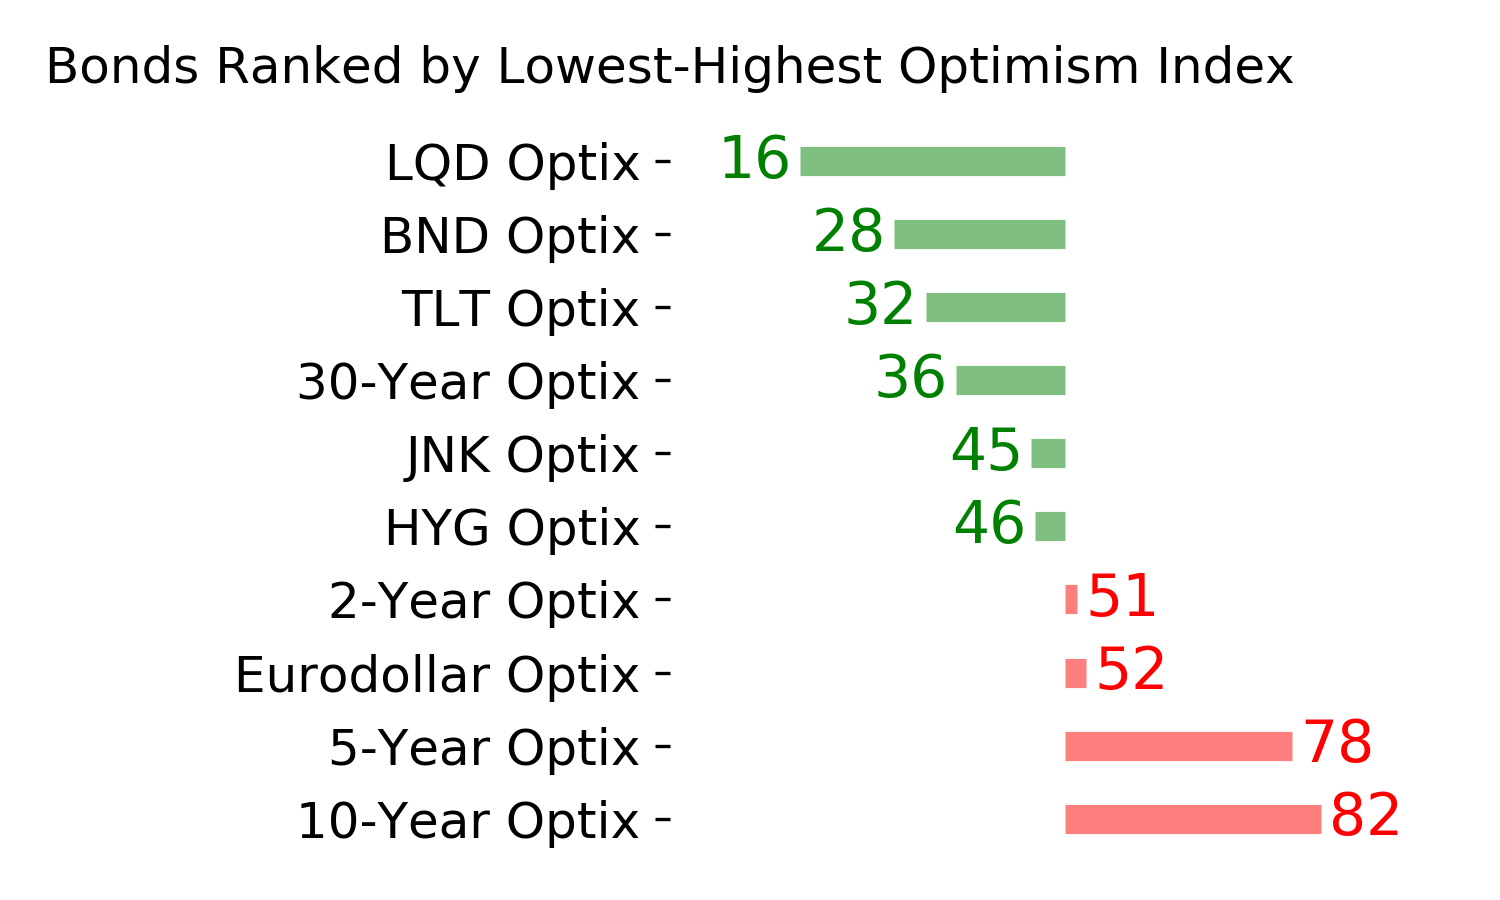
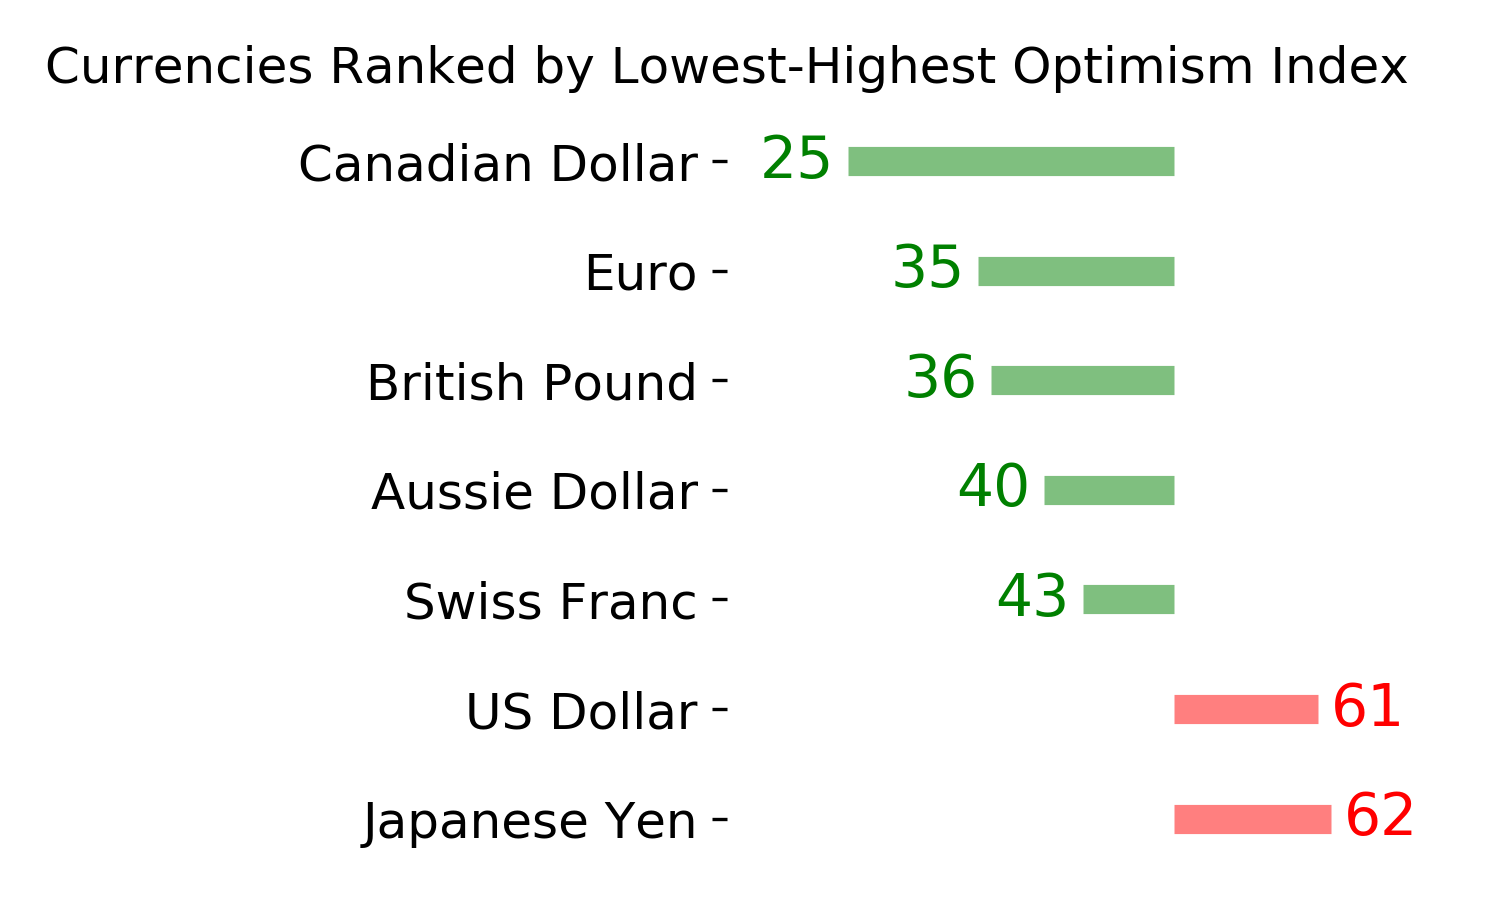
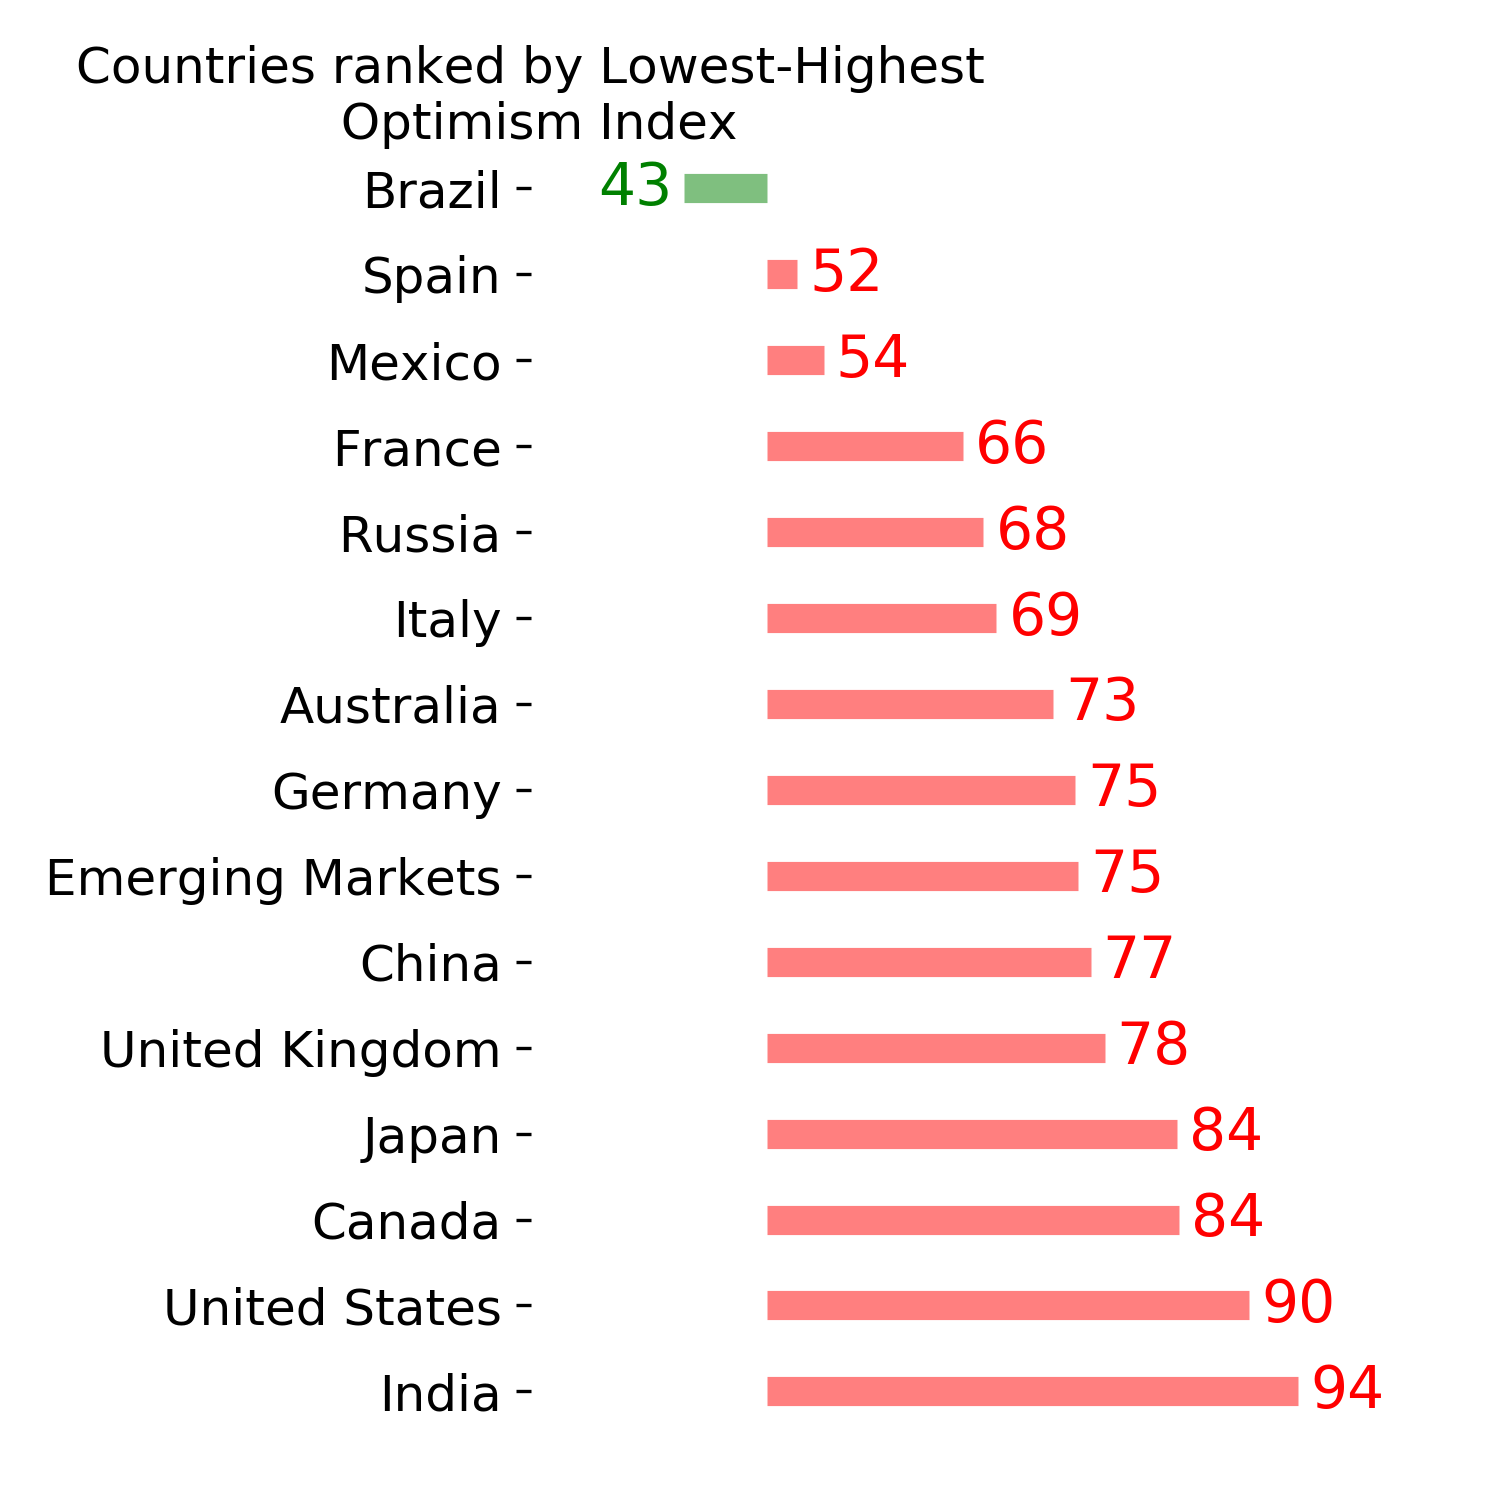
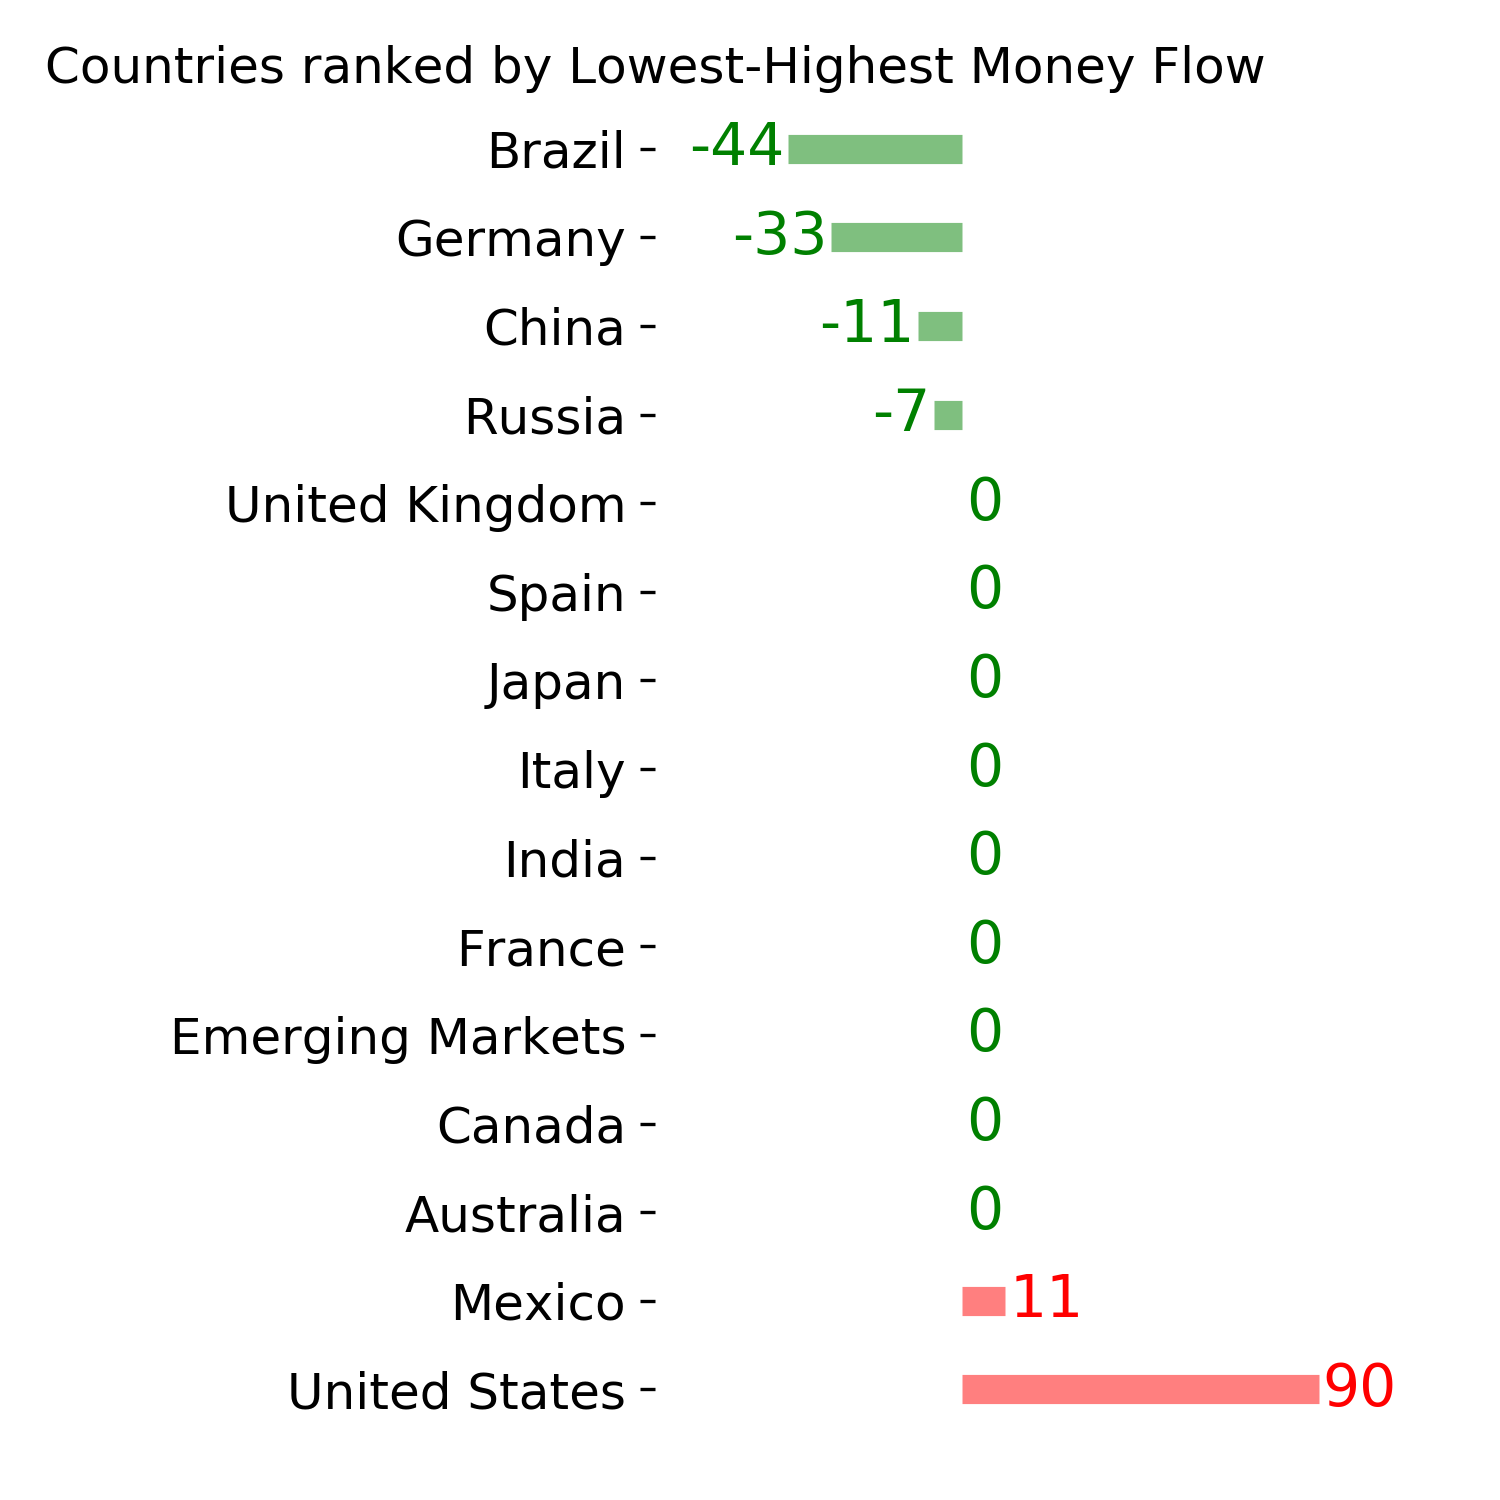
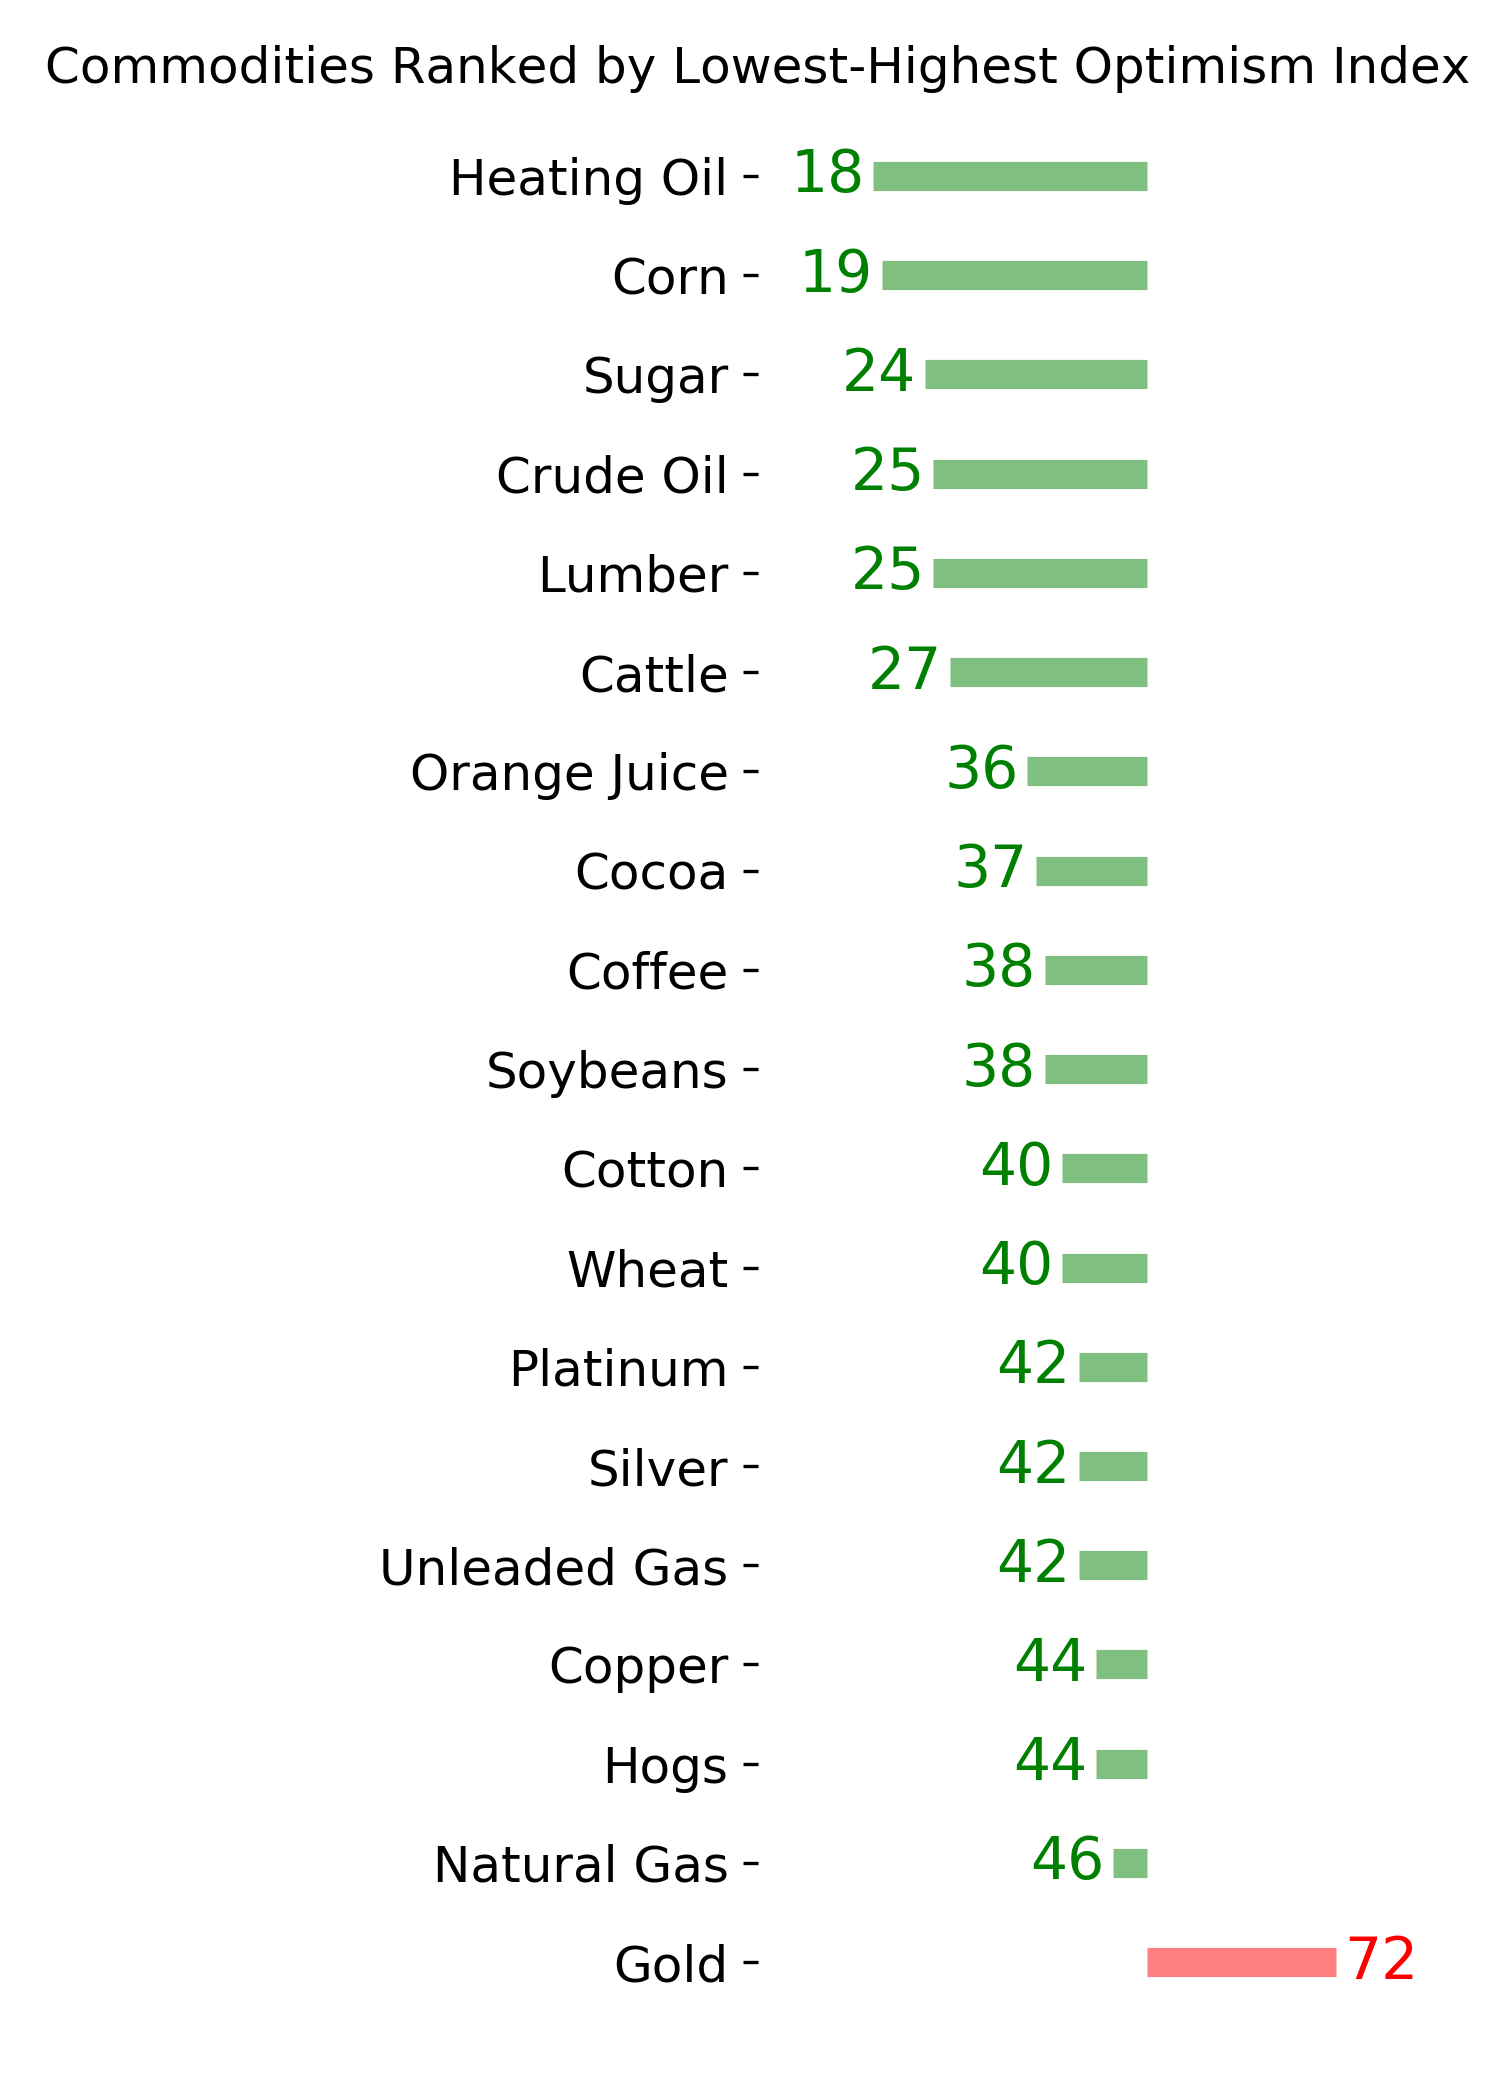
Ranks
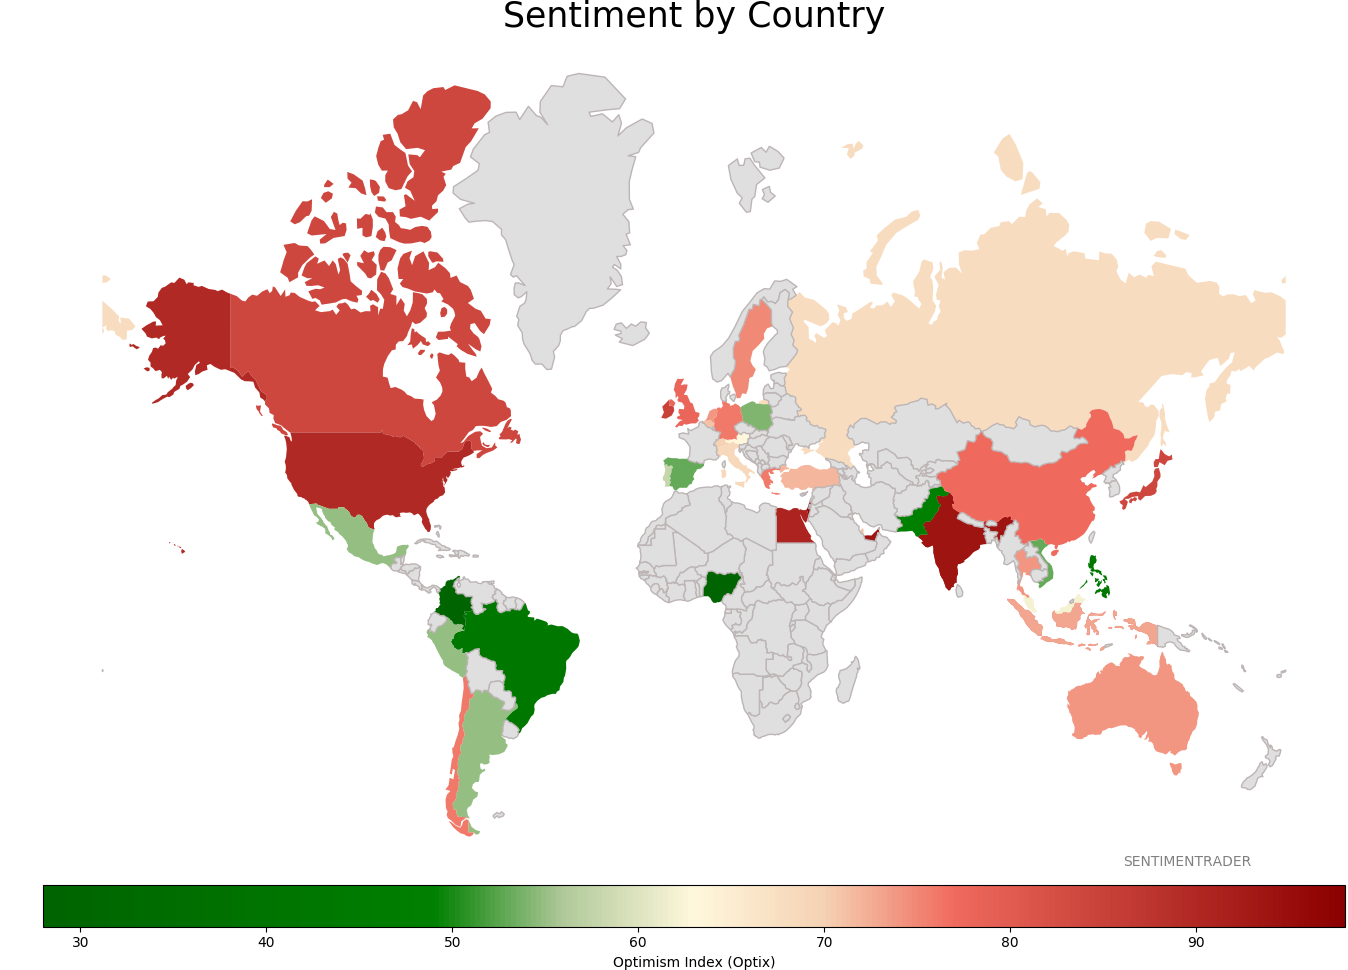
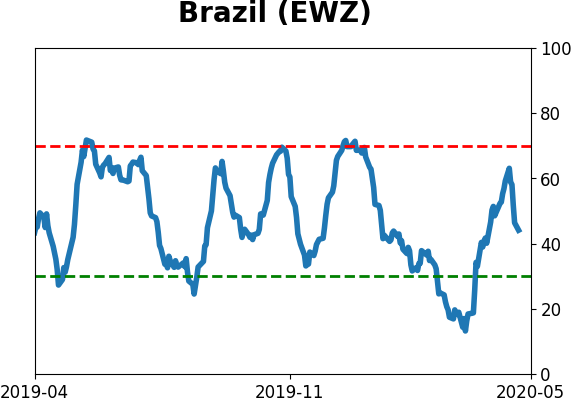
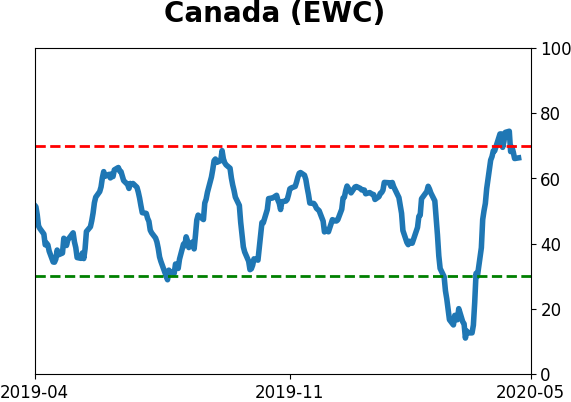
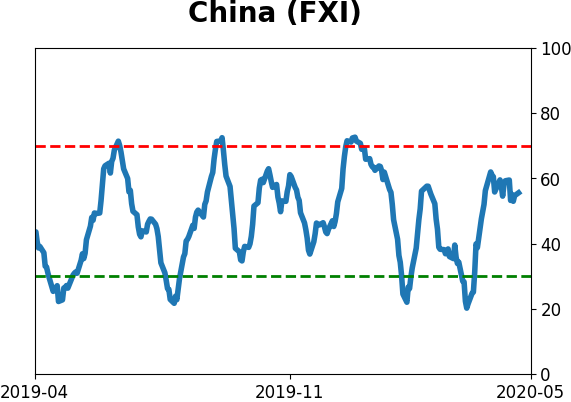
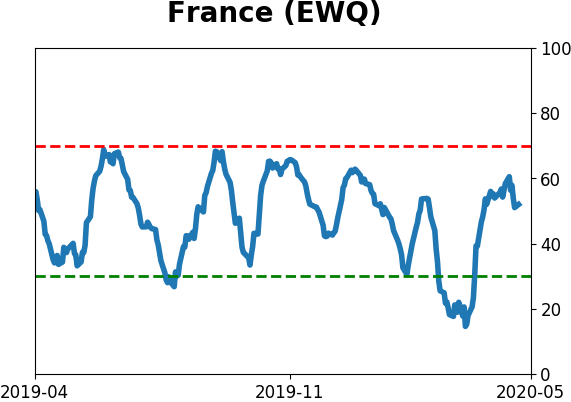
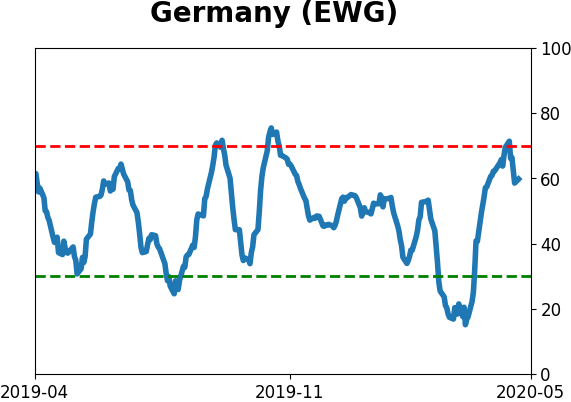
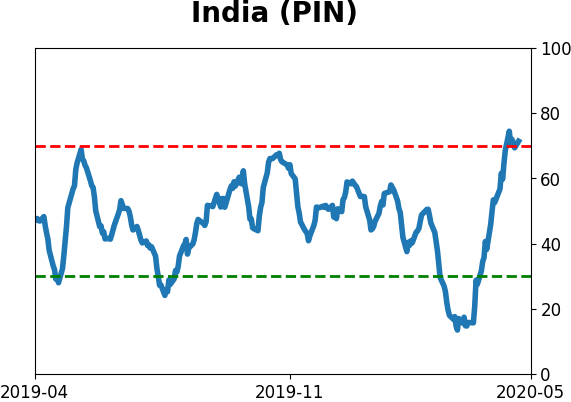
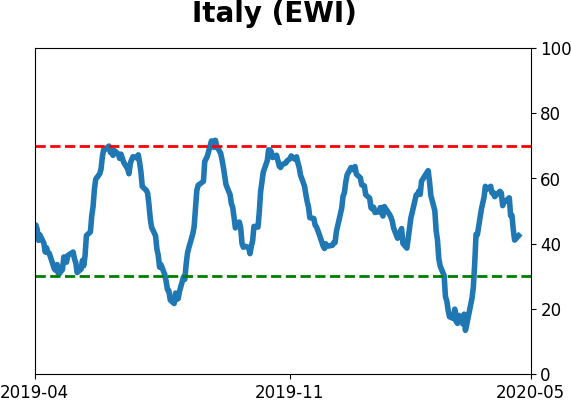
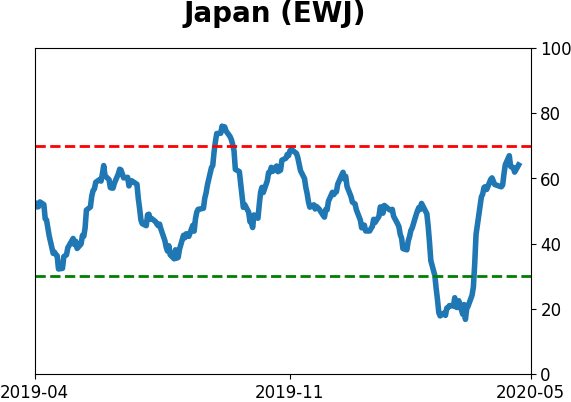
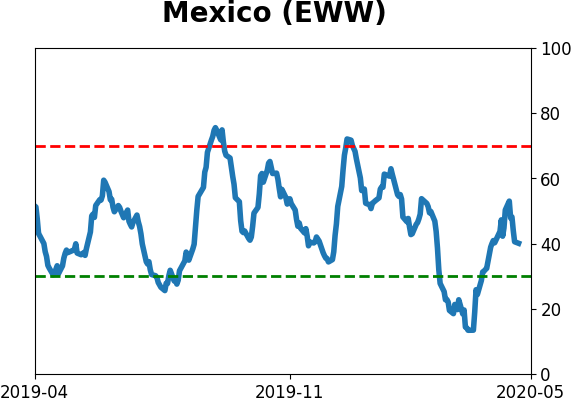
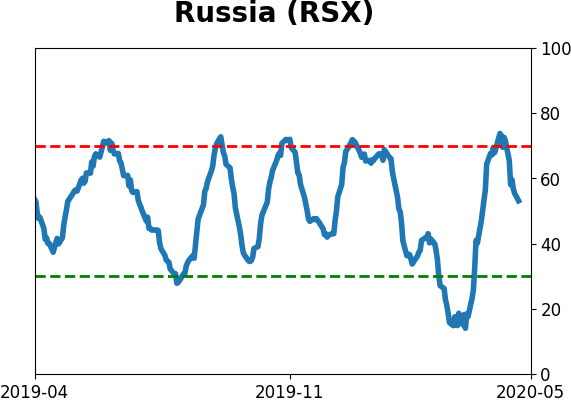
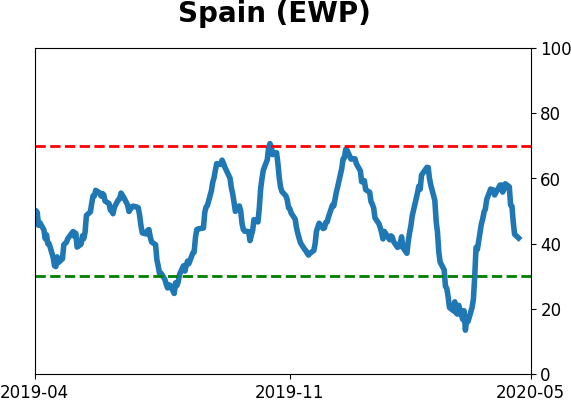
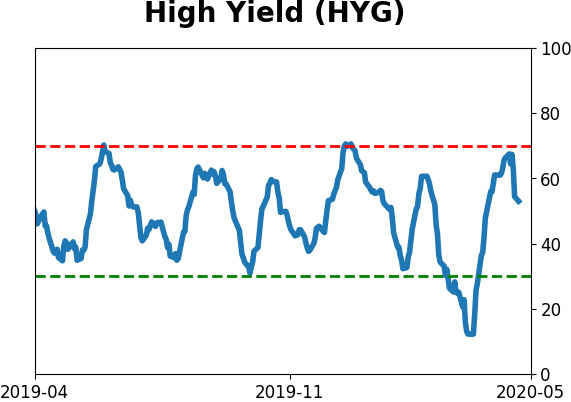
Sentiment Around The World
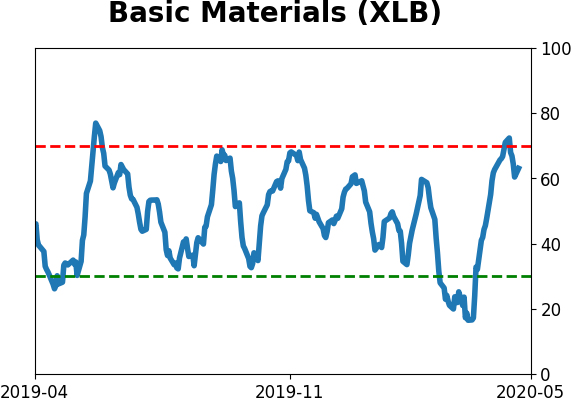
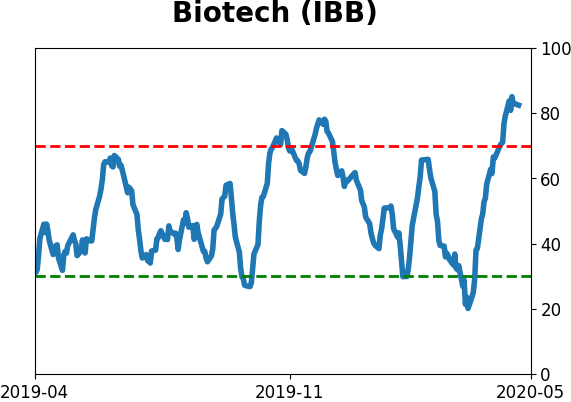
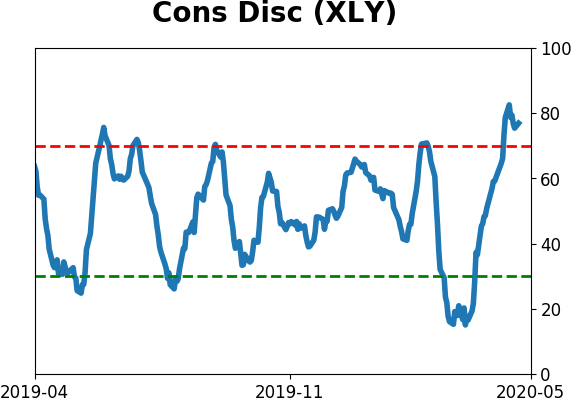
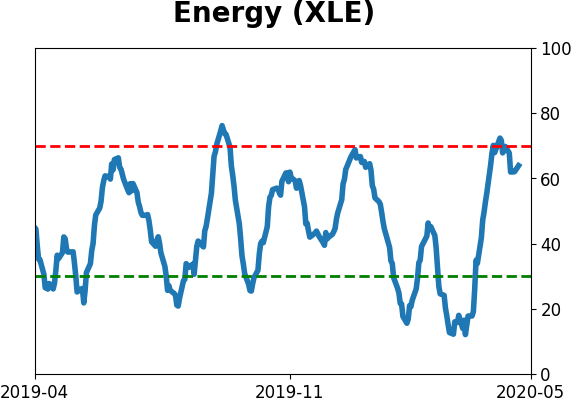
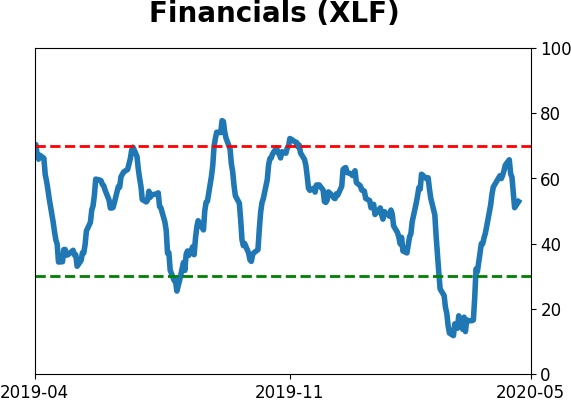
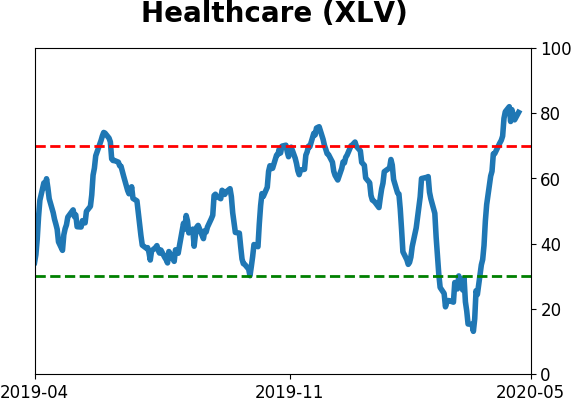
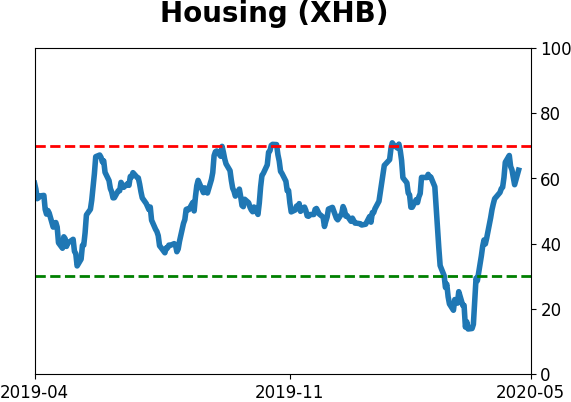
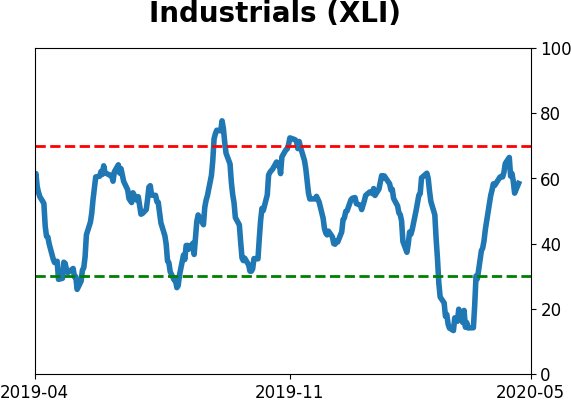
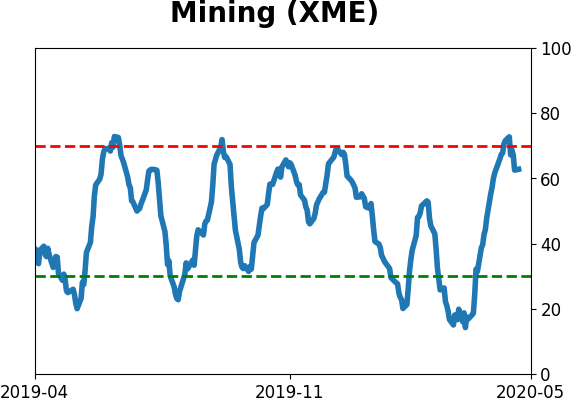
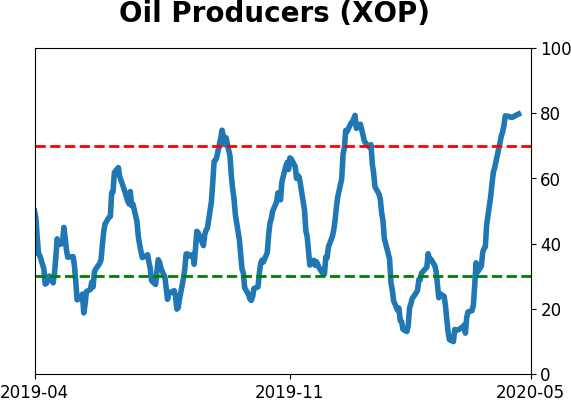
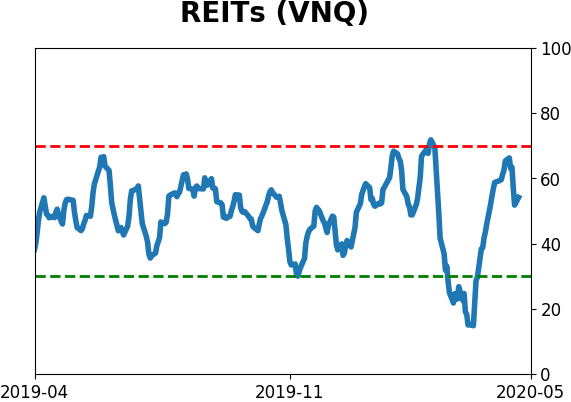
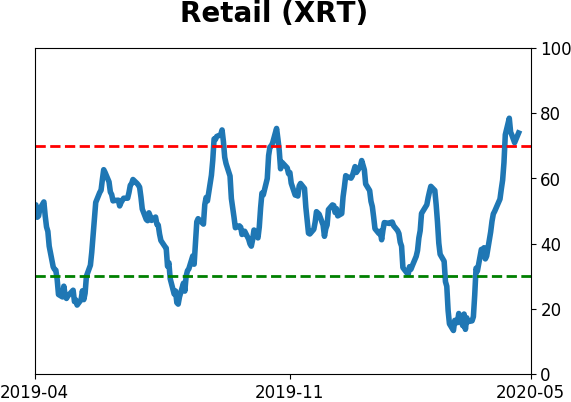
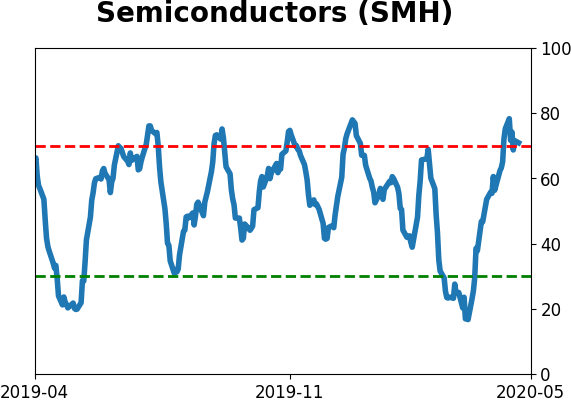
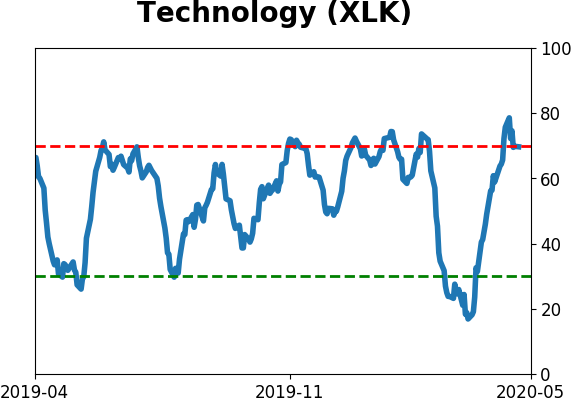
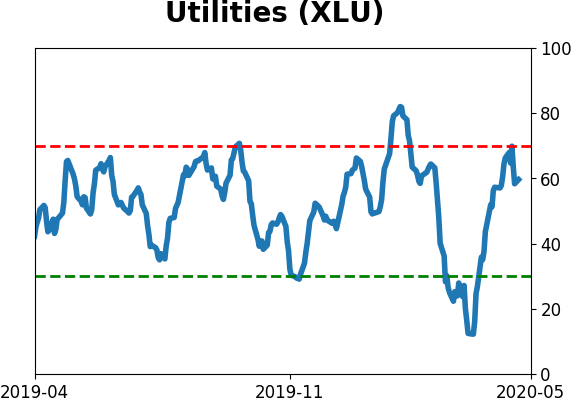
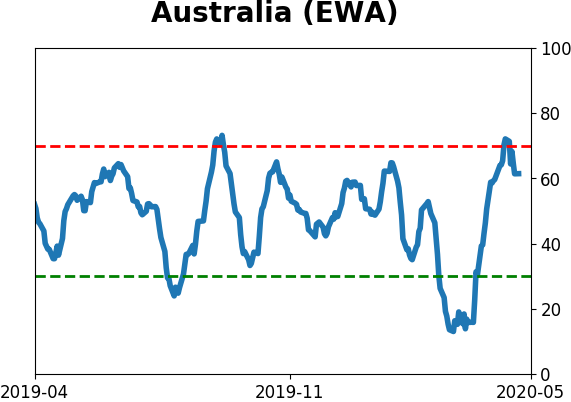
Optimism Index Thumbnails
|
Sector ETF's - 10-Day Moving Average
|
|
|
Country ETF's - 10-Day Moving Average
|
|
|
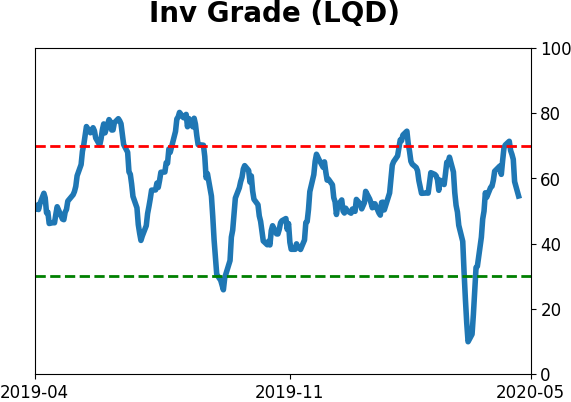
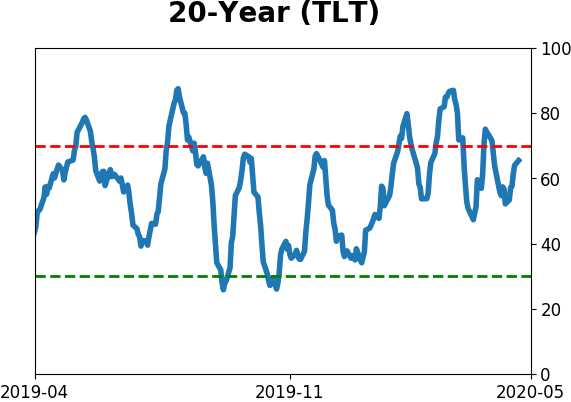
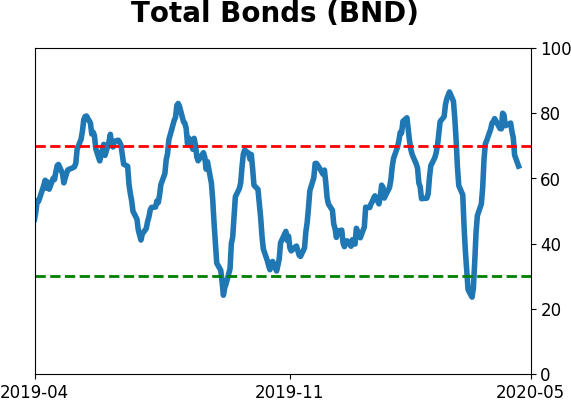
Bond ETF's - 10-Day Moving Average
|
|
|
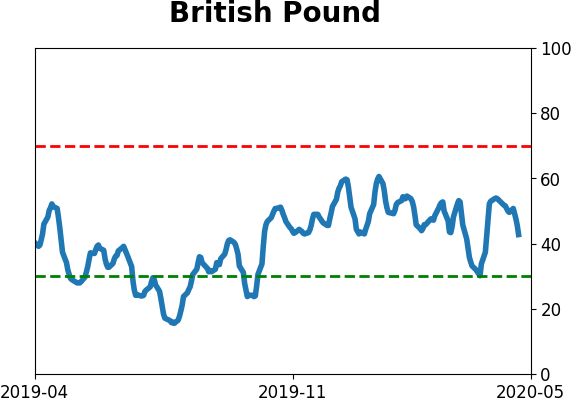
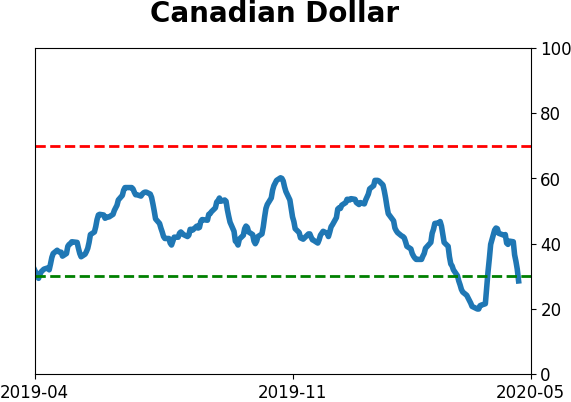
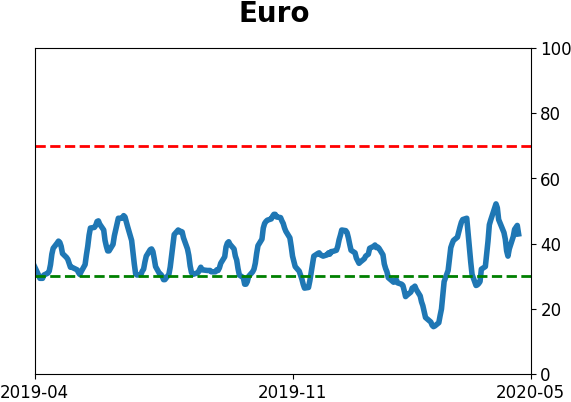
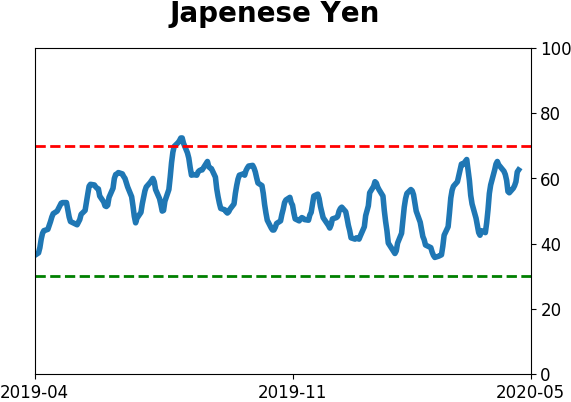
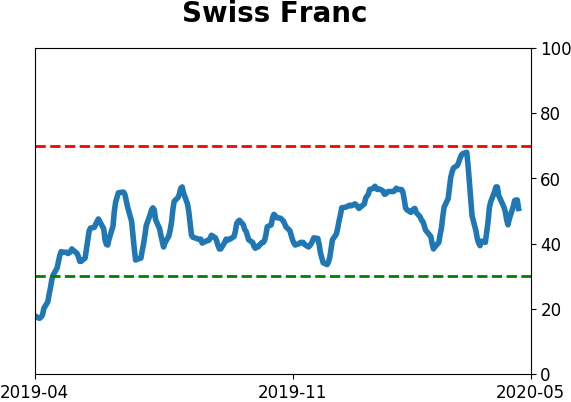
Currency ETF's - 5-Day Moving Average
|
|
|
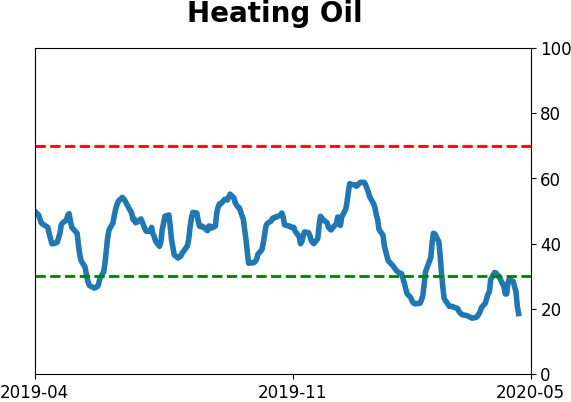
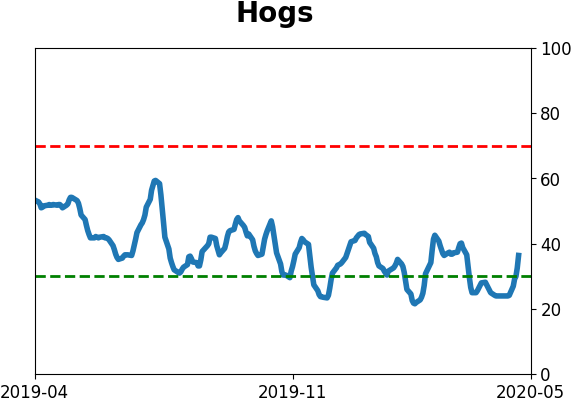
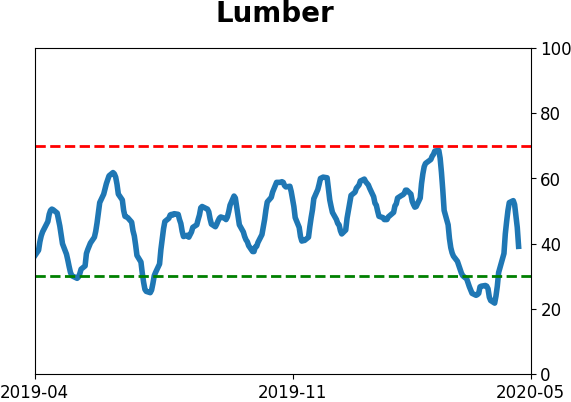
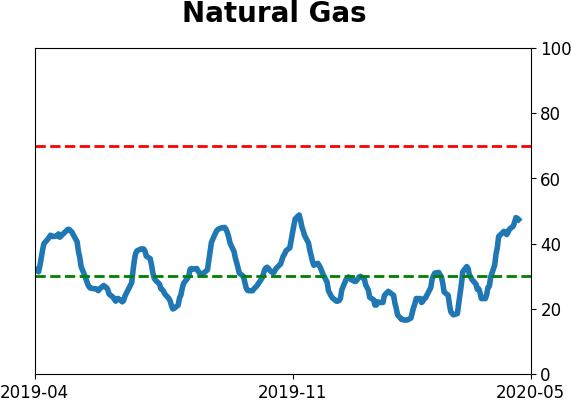
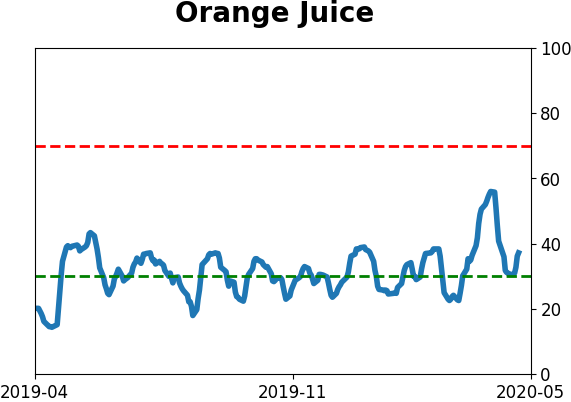
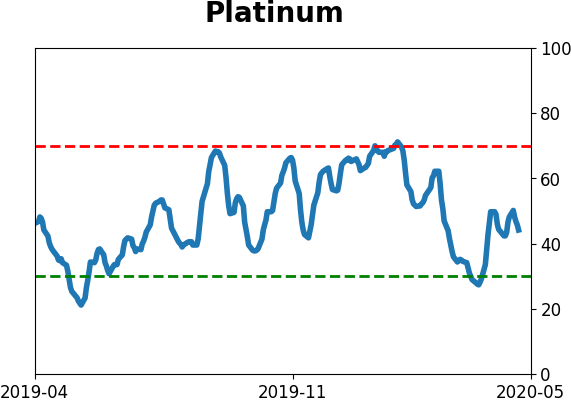
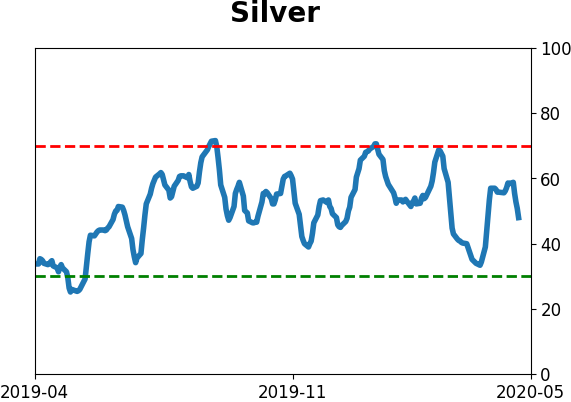
Commodity ETF's - 5-Day Moving Average
|
|