Headlines
|
|
Options traders pull back again:
Options traders have pulled back from their most speculative behavior from February. Still, it remains extreme relative to any other period in the last 20 years.
Bottom Line:
See the Outlook & Allocations page for more details on these summaries STOCKS: Weak sell
The extreme speculation registered in January and February is starting to get wrung out. Internal dynamics have mostly held up, so a return to neutral sentiment conditions would improve the forward risk/reward profile substantially. We're still a ways off from that. BONDS: Weak buy
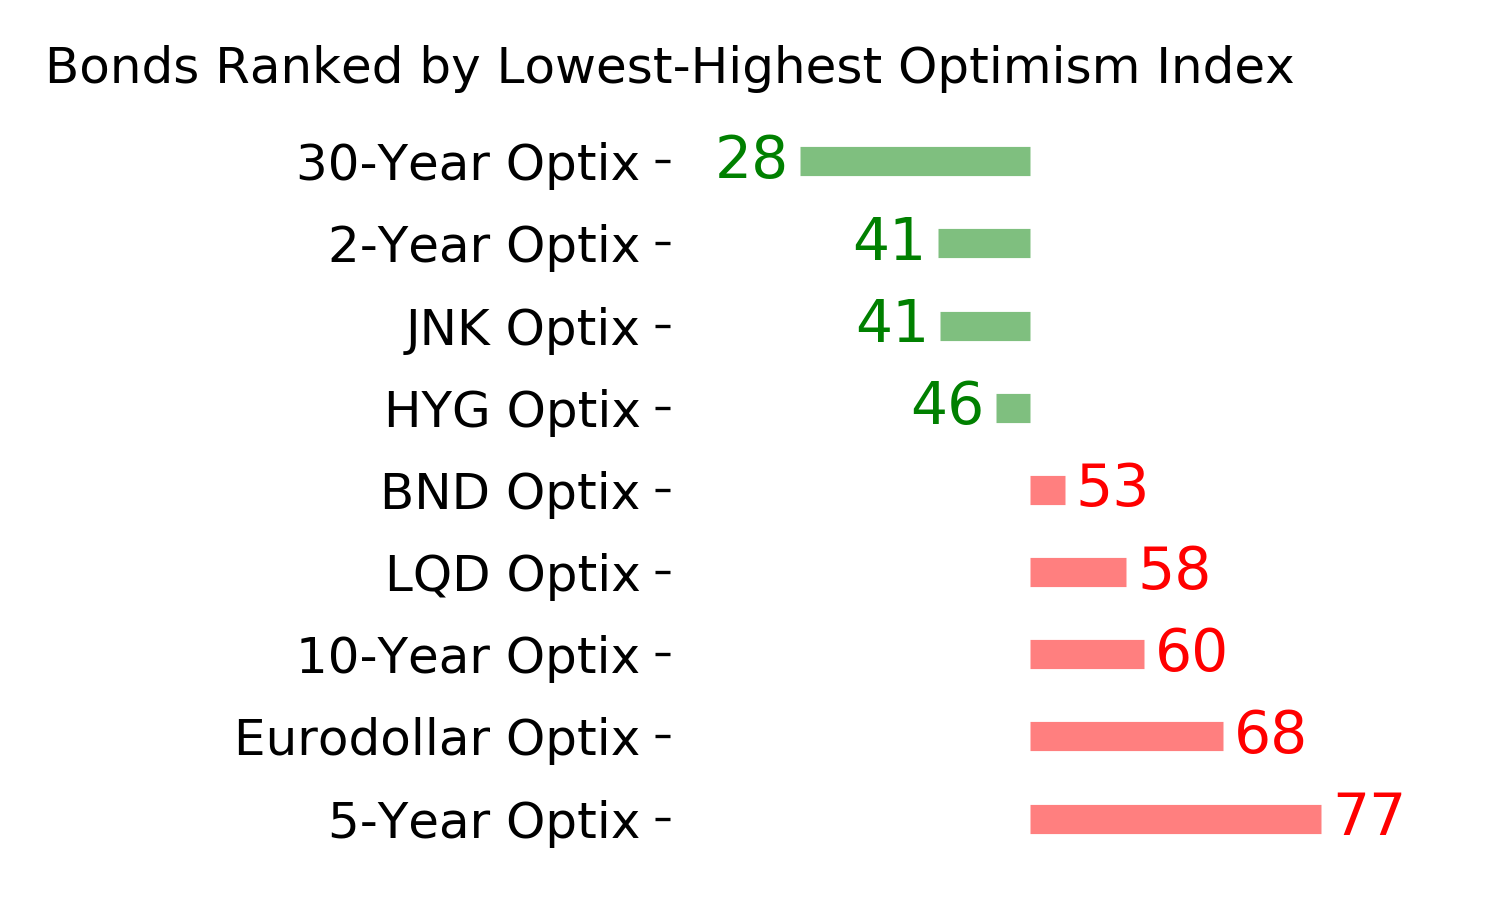
Various parts of the market have been hit in recent weeks, with mild oversold conditions. The Bond Optimism Index is now about as low as it gets during healthy bond market environments. Fixed income isn't responding well, so that needs to be monitored in case it's transitioning to a longer-term negative market environment. GOLD: Weak buy
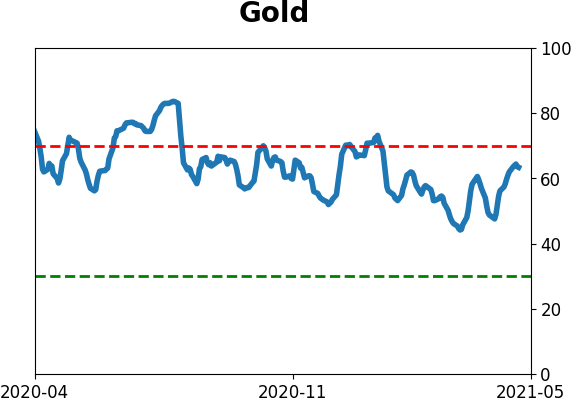
A dollar trying to rebound from a severe short position has weighed on gold and miners. The types of signals they've given in recent weeks, within the context of their recent surge, have usually resulted in higher prices over a medium- to long-term time frame. Like bonds, gold and miners aren't responding very well, and this needs to be monitored.
|
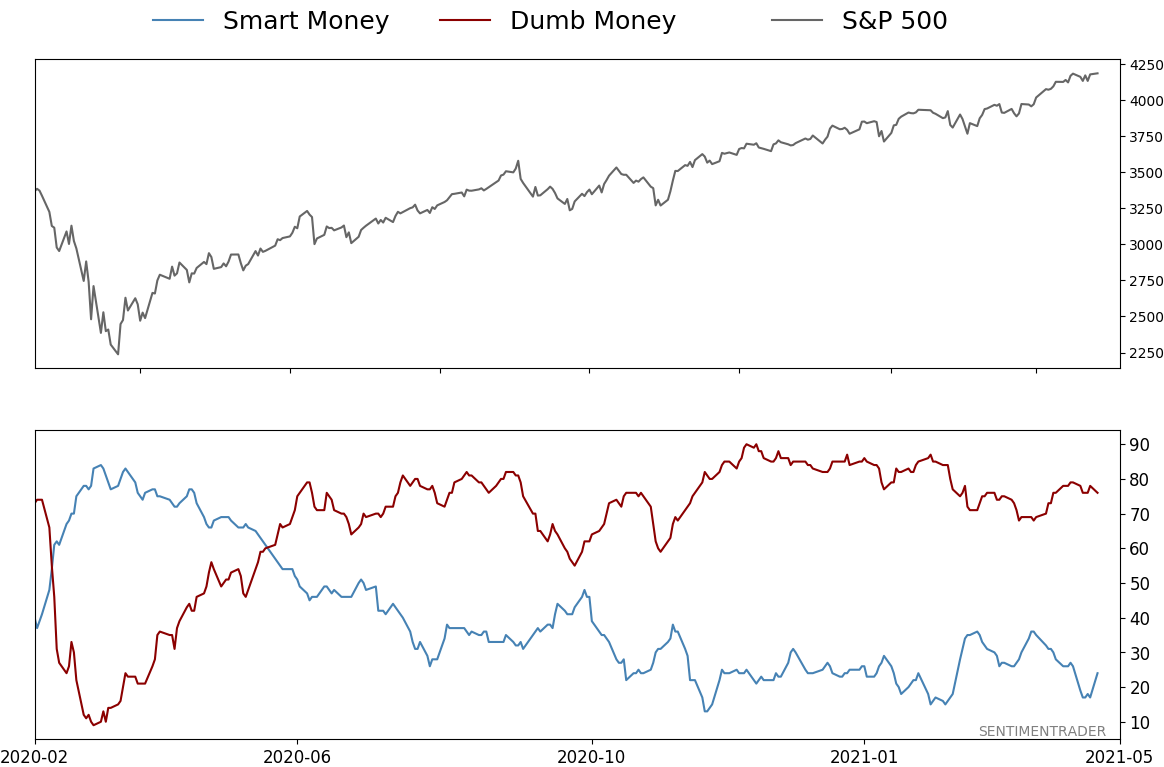
Smart / Dumb Money Confidence
|
Smart Money Confidence: 24%
Dumb Money Confidence: 76%
|
|
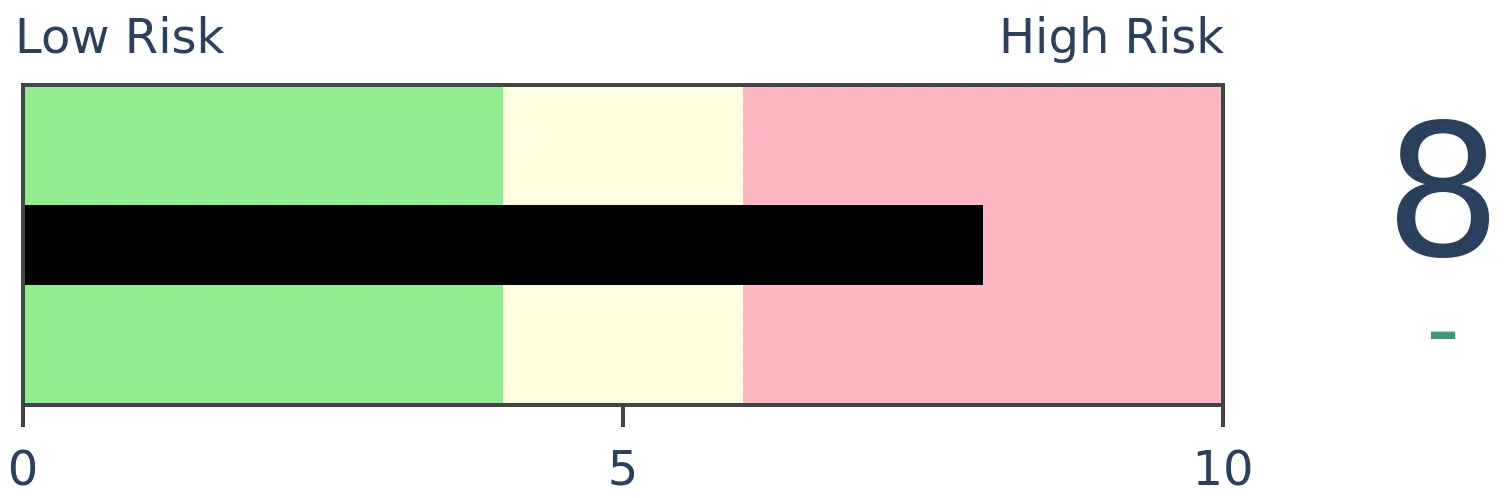
Risk Levels
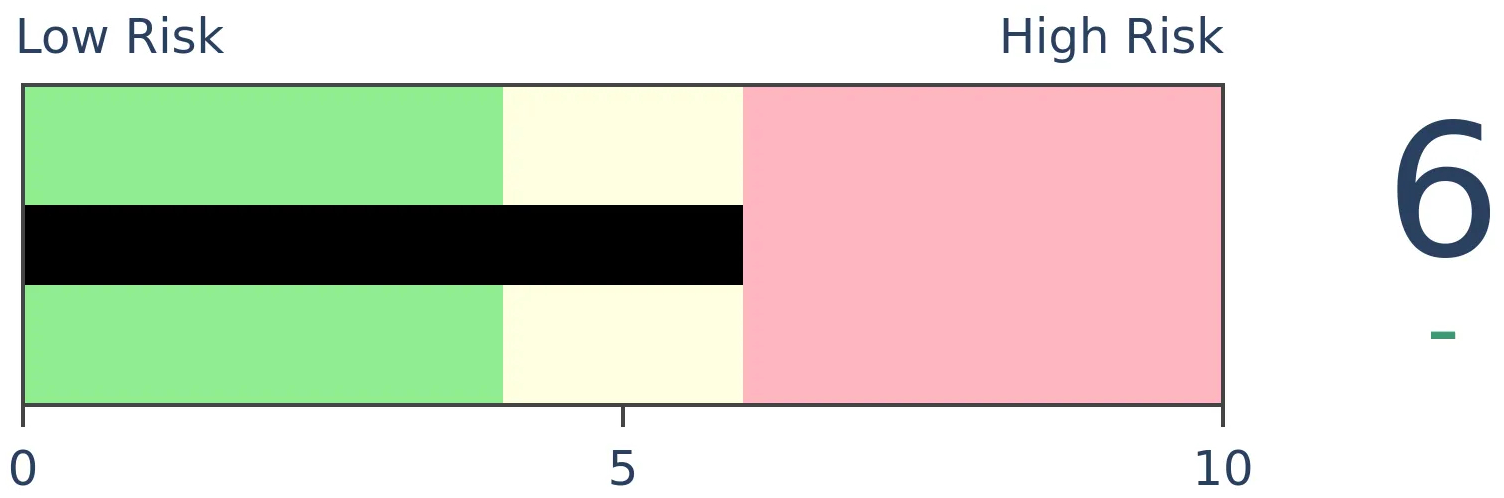
Stocks Short-Term

|
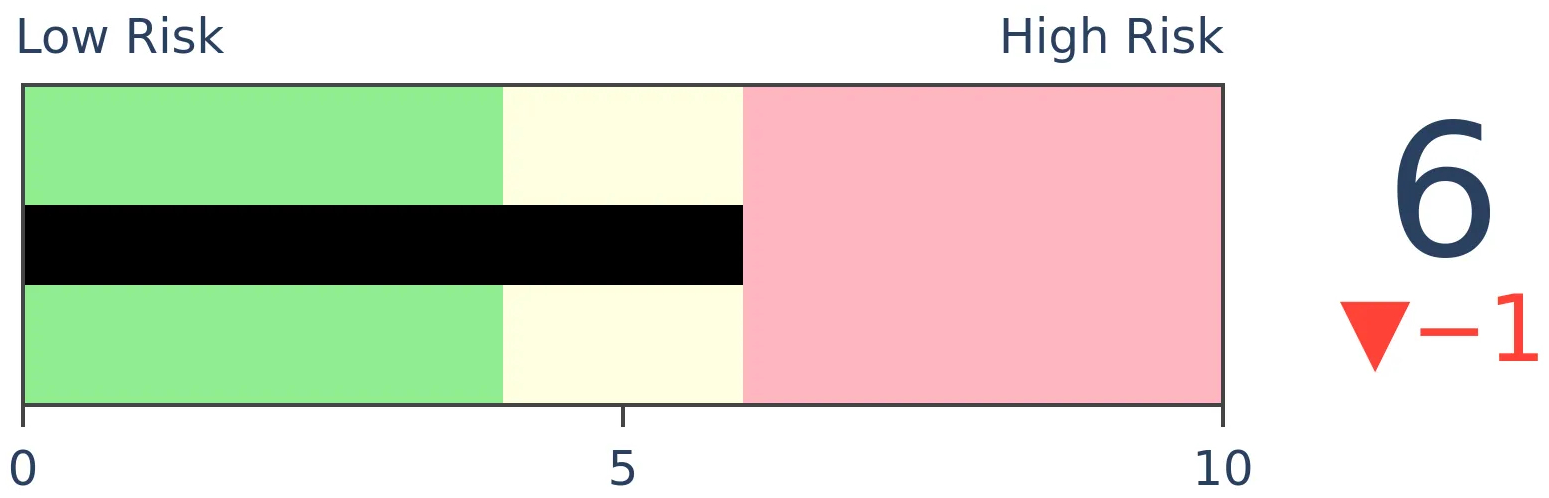
Stocks Medium-Term
|
|
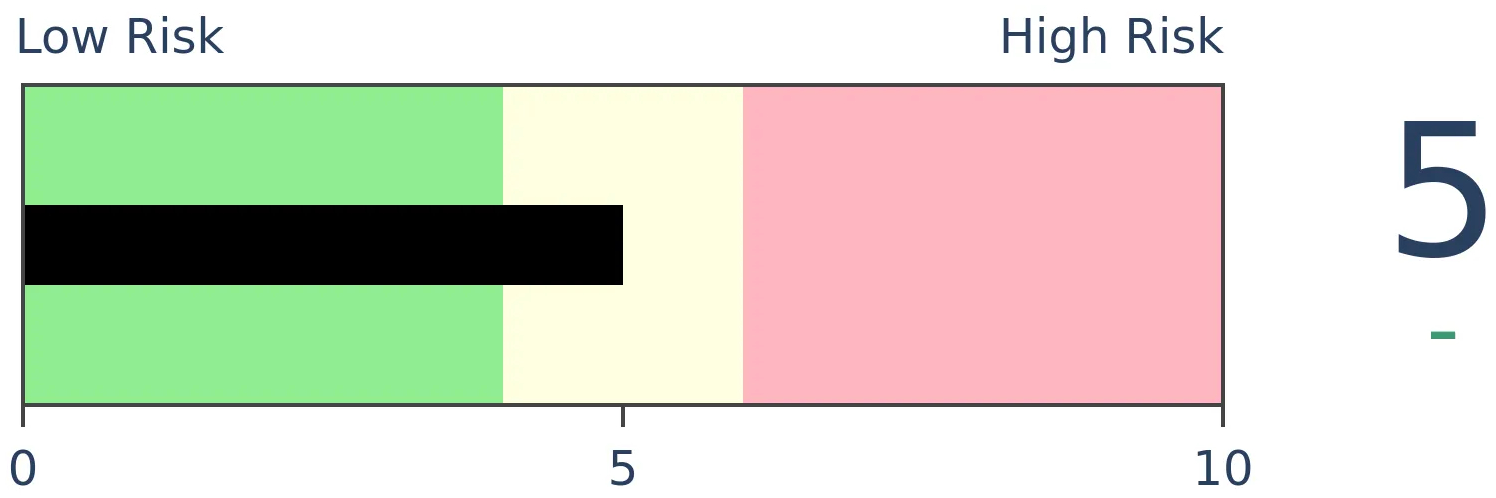
Bonds
|
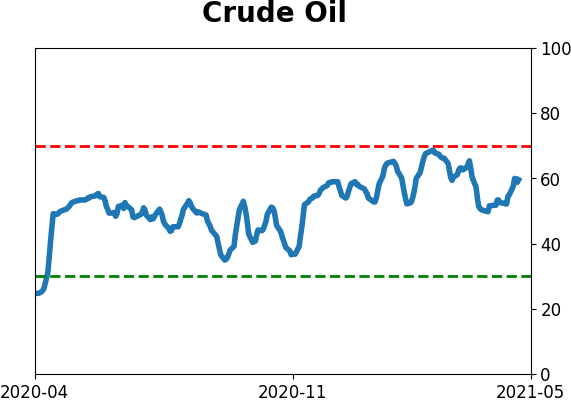
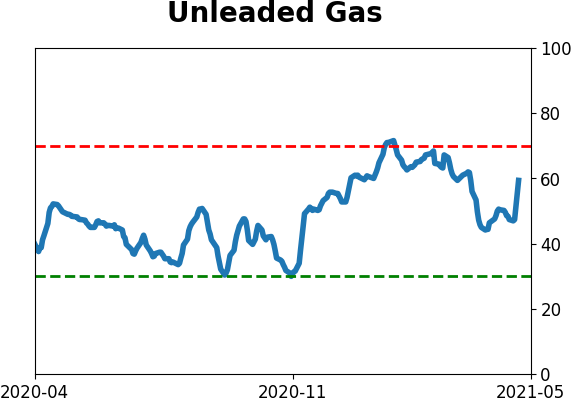
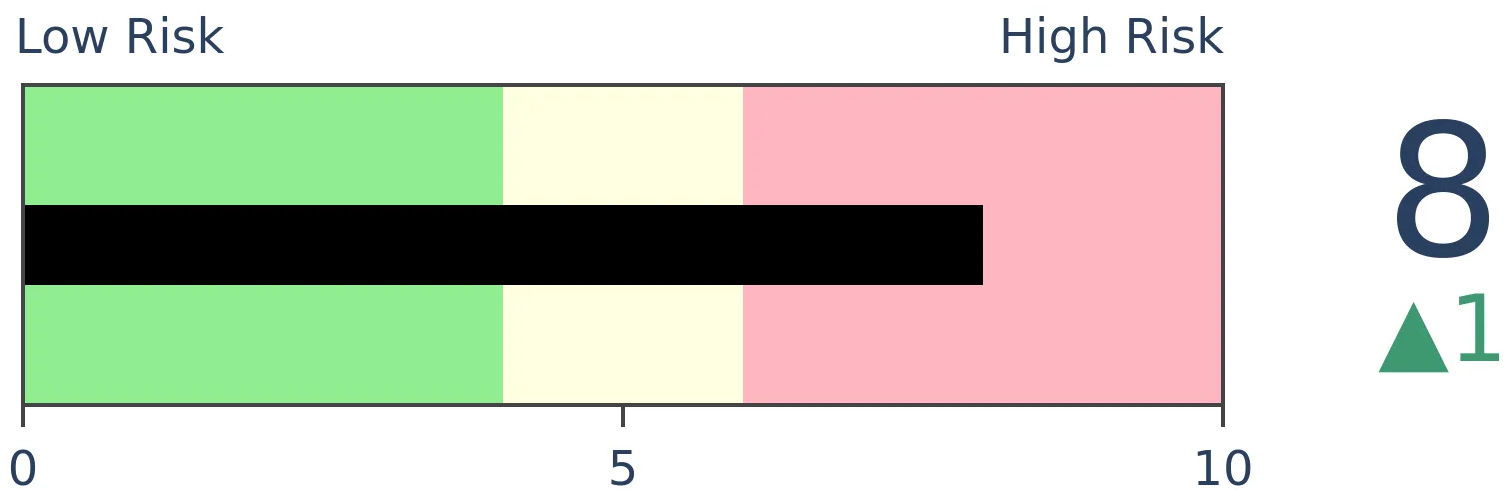
Crude Oil
|
|
Gold
|
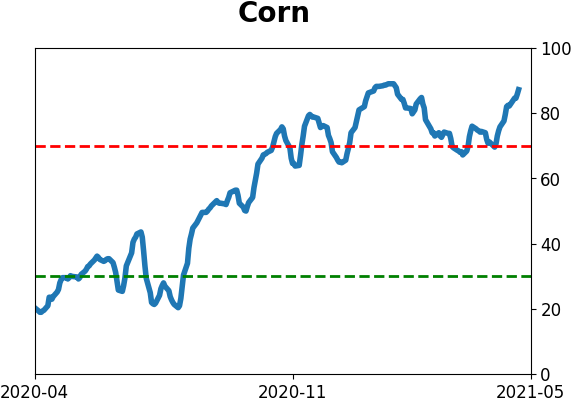
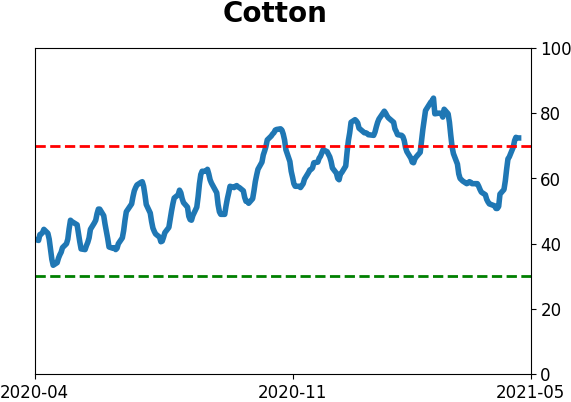
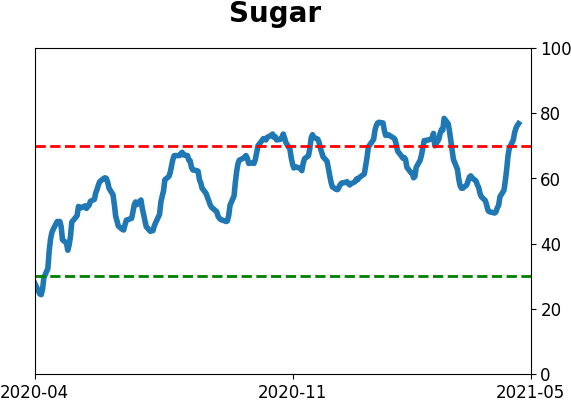
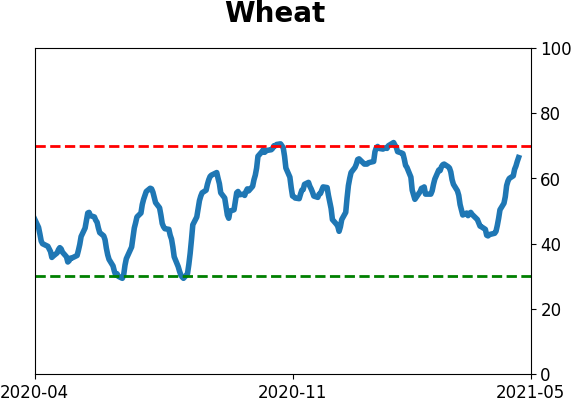
Agriculture
|
|
Research
BOTTOM LINE
Options traders have pulled back from their most speculative behavior from February. Still, it remains extreme relative to any other period in the last 20 years.
FORECAST / TIMEFRAME
None
|
The biggest story in equity markets last fall was the massive rise in speculative activity heading into late August and early September. A quick correction in some of the most targeted stocks wiped much of that away.
Then it started to pick up again in December, and by February hit new records. Again, a significant pullback in many of the highest-flying stocks helped to put a brake on some of that behavior.
SMALL TRADER ACTIVITY LAST WEEK
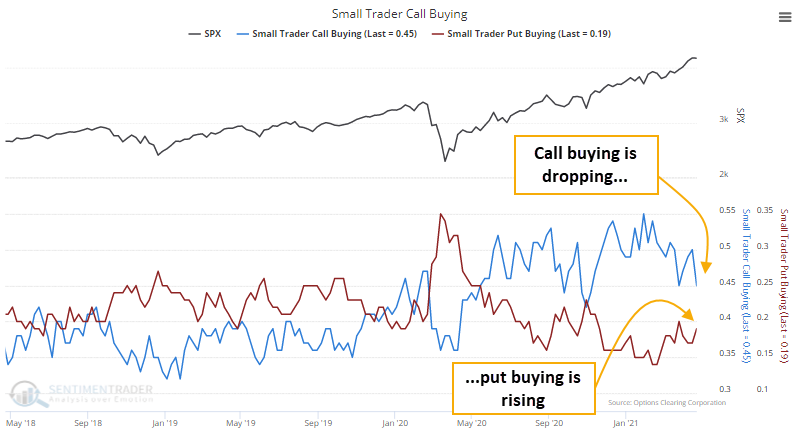
Even with some major, broader indexes once again knocking on the door of record highs, speculative behavior continues to pull back a bit. Last week, the smallest of options traders spent 45% of their overall volume on buying speculative call options to open, nearly the lowest since last November. They spent 19% of their volume buying protective puts to open, up from a low of 14% in February.
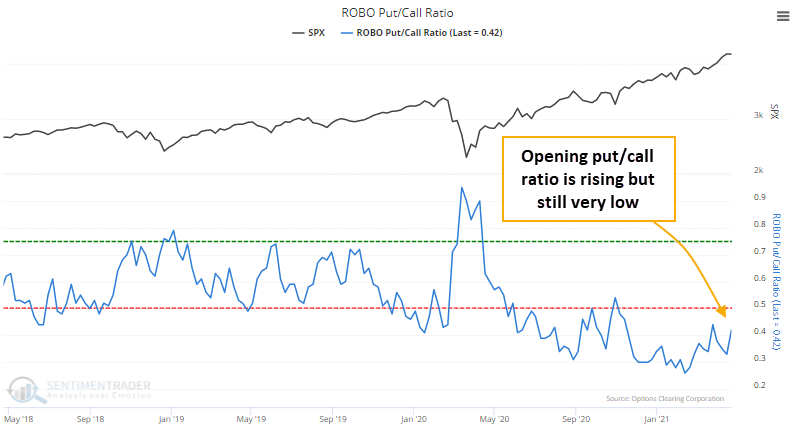
That means that the ROBO Put/Call Ratio (Retail-Only, Buy-to-Open) has increased from its lows. That's not saying a whole lot, though, since even with the rise in the ratio, it's still well below historical extremes.
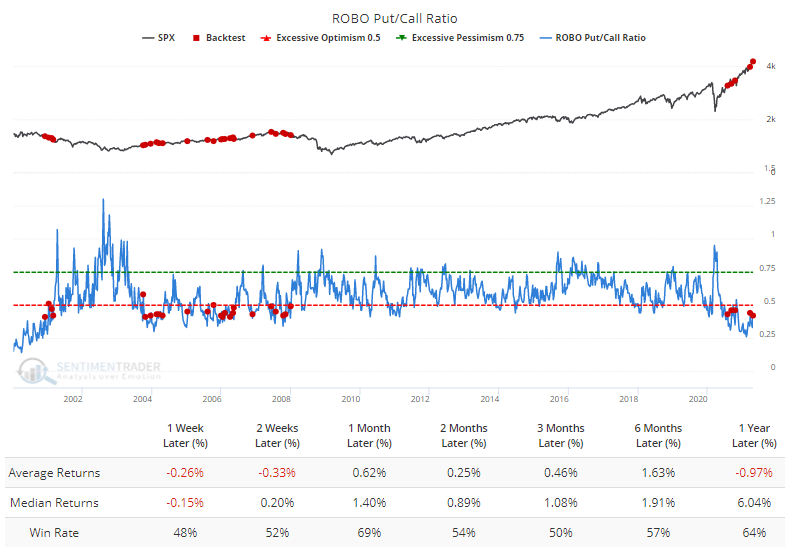
It probably seems like a good sign that traders are becoming a tiny bit more skeptical even with rising prices, though the Backtest Engine shows mediocre returns any time the ROBO Put/Call Ratio rises above 0.4. To run this test, click here and then the Run Backtest button.
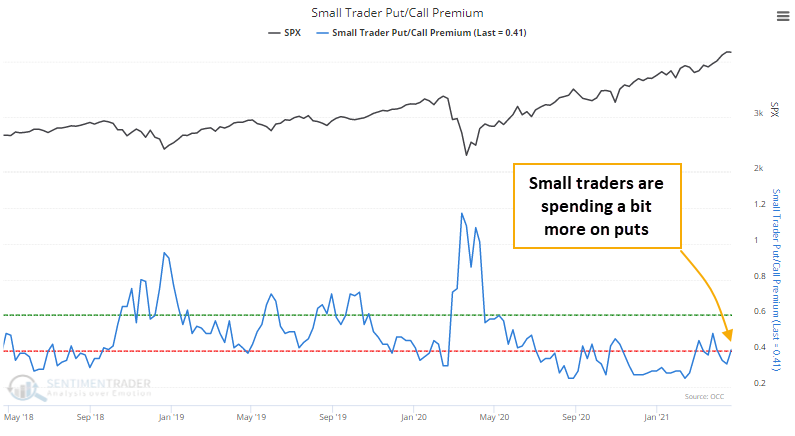
And even with relatively low implied volatility levels, the premiums they're spending on puts are rising relative to what they're spending on calls. Again, this is still very low relative to what they're historically spent.
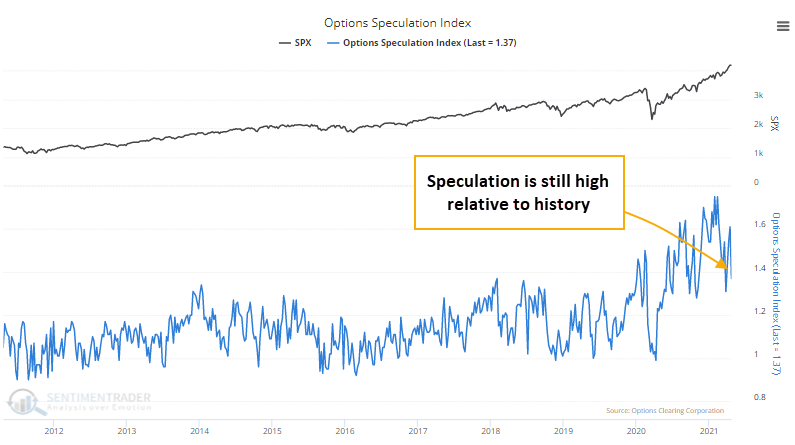
OVERALL OPTIONS ACTIVITY REMAINS HIGHLY SPECULATIVE
Large traders also reduced their call buying last week, so the overall Options Speculation Index has dropped quite a bit from the peak. In February, bullish options strategies like buying calls and selling puts accounted for 75% more volume than bearish strategies like selling calls and buying puts. Last week, that was down to "only" 37%.
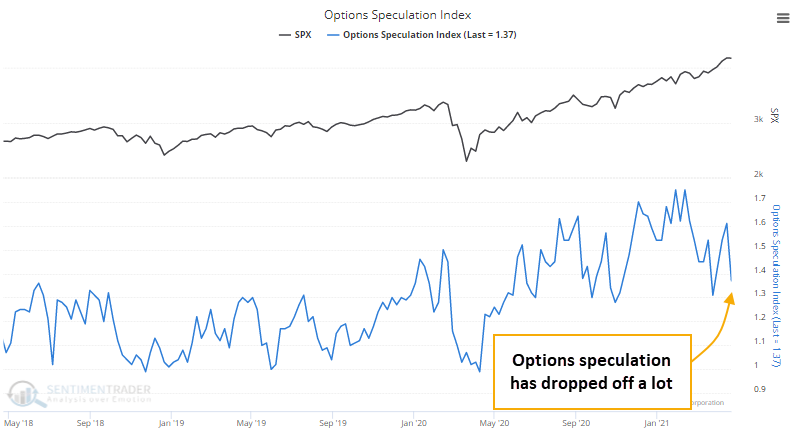
That drop is notable only to very recent history. Looking out over a period of years, the current level of speculative activity would still be above most other speculative peaks in the past 20 years.
THE TENSION REMAINS
We're still seeing a type of conflict that hasn't really happened before. Many of the measures related to thrusts, momentum, and breadth, are the types that only trigger during the first phase of a multi-year bear market recovery. But most of the sentiment-related measures have generated signals that typically only trigger near the ends of multi-year bull markets.
There have been some recent wobbles and divergences, but not enough to manifest in broad-based deterioration that would trigger some of the warning signs we watch for after investors become overly optimistic.
A typical market response to lesser conflicts has been choppy conditions in major indexes, with further gains eventually given back. That's been the outlook for a while and it continues.
Active Studies
| Time Frame | Bullish | Bearish | | Short-Term | 0 | 0 | | Medium-Term | 0 | 11 | | Long-Term | 11 | 4 |
|
Indicators at Extremes
Portfolio
| Position | Description | Weight % | Added / Reduced | Date | | Stocks | RSP | 0.0 | Reduced 4.9% | 2021-04-22 | | Bonds | 30.0% BND, 8.8% SCHP | 37.9 | Added 15.1% | 2021-02-18 | | Commodities | GCC | 2.5 | Reduced 2.1%
| 2020-09-04 | | Precious Metals | GDX | 9.8 | Added 0.1% | 2021-02-18 | | Special Situations | 4.3% XLE, 2.2% PSCE | 6.5 | Reduced 5.6% | 2021-04-22 | | Cash | | 43.3 | | |
|
Updates (Changes made today are underlined)
I've made no adjustments for months, as the situation remained essentially stuck - energy was doing what it should, sentiment in the broader market was ridiculously stretched but with no major warning signs, and sentiment toward gold and bonds appeared overdone on the pessimistic side. Those conditions have started to reverse a bit, so I further reduced my risk. There are still no major warning signs, but I'm getting increasingly uncomfortable and would prefer to sit safely in cash and wait for better risk/reward opportunities. RETURN YTD: 7.1% 2020: 8.1%, 2019: 12.6%, 2018: 0.6%, 2017: 3.8%, 2016: 17.1%, 2015: 9.2%, 2014: 14.5%, 2013: 2.2%, 2012: 10.8%, 2011: 16.5%, 2010: 15.3%, 2009: 23.9%, 2008: 16.2%, 2007: 7.8%
|
|
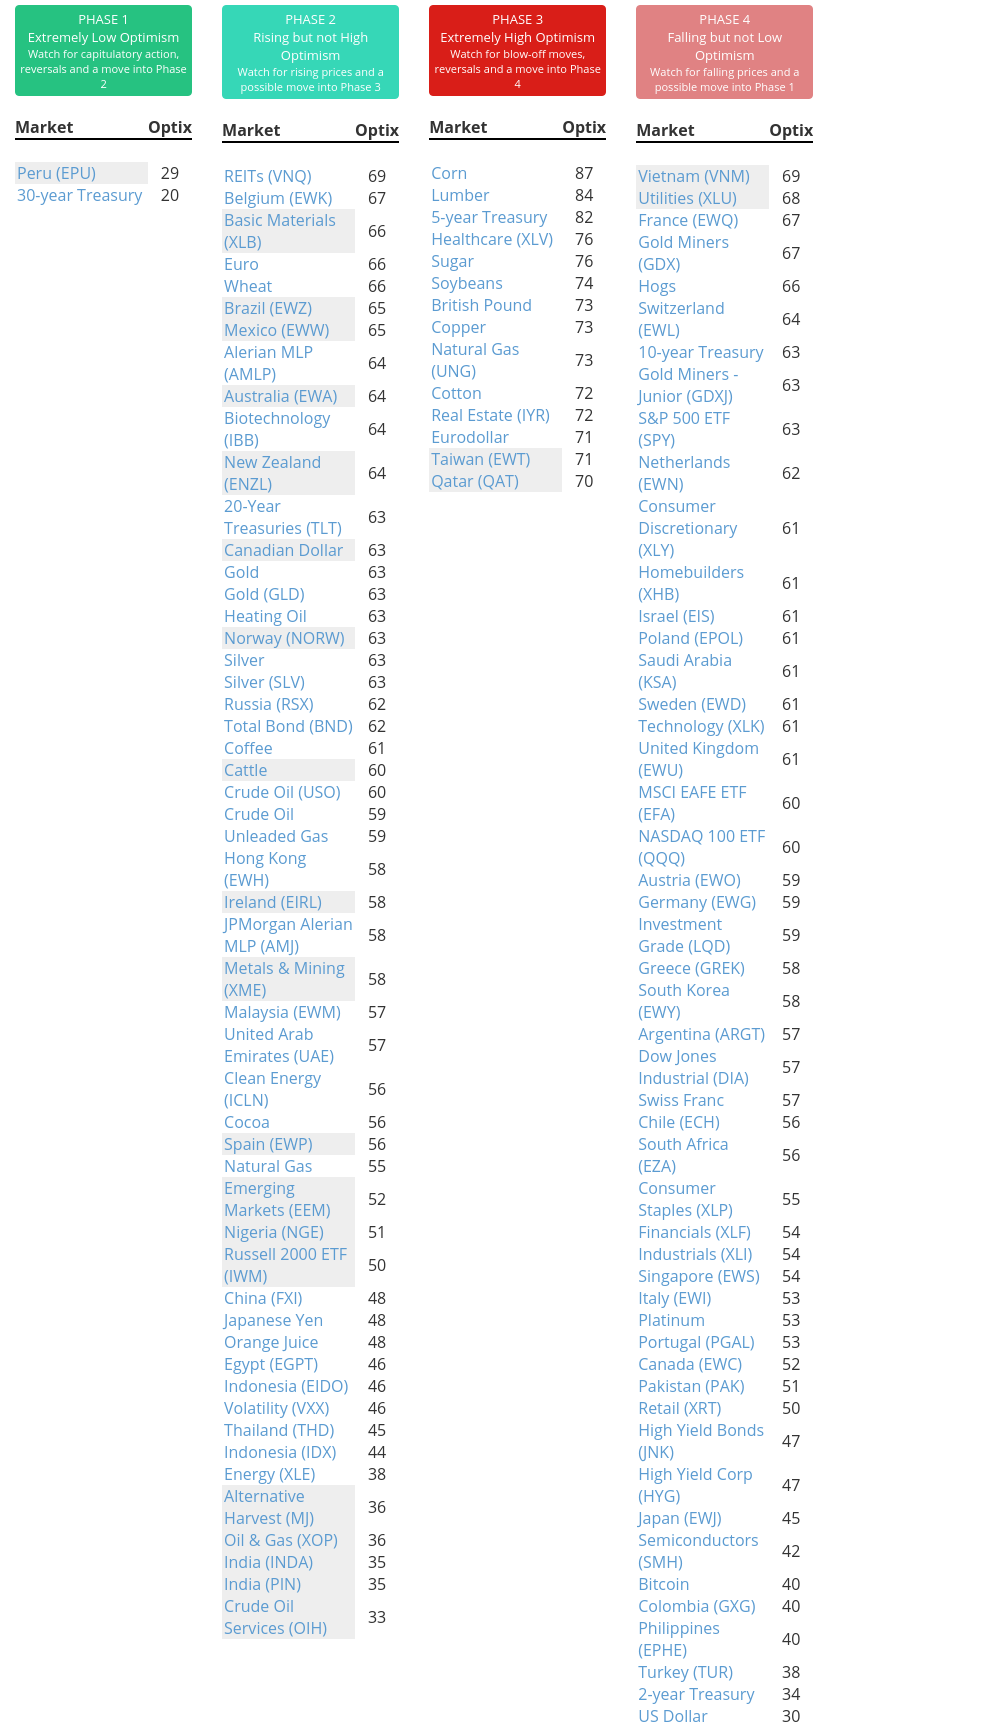
Phase Table
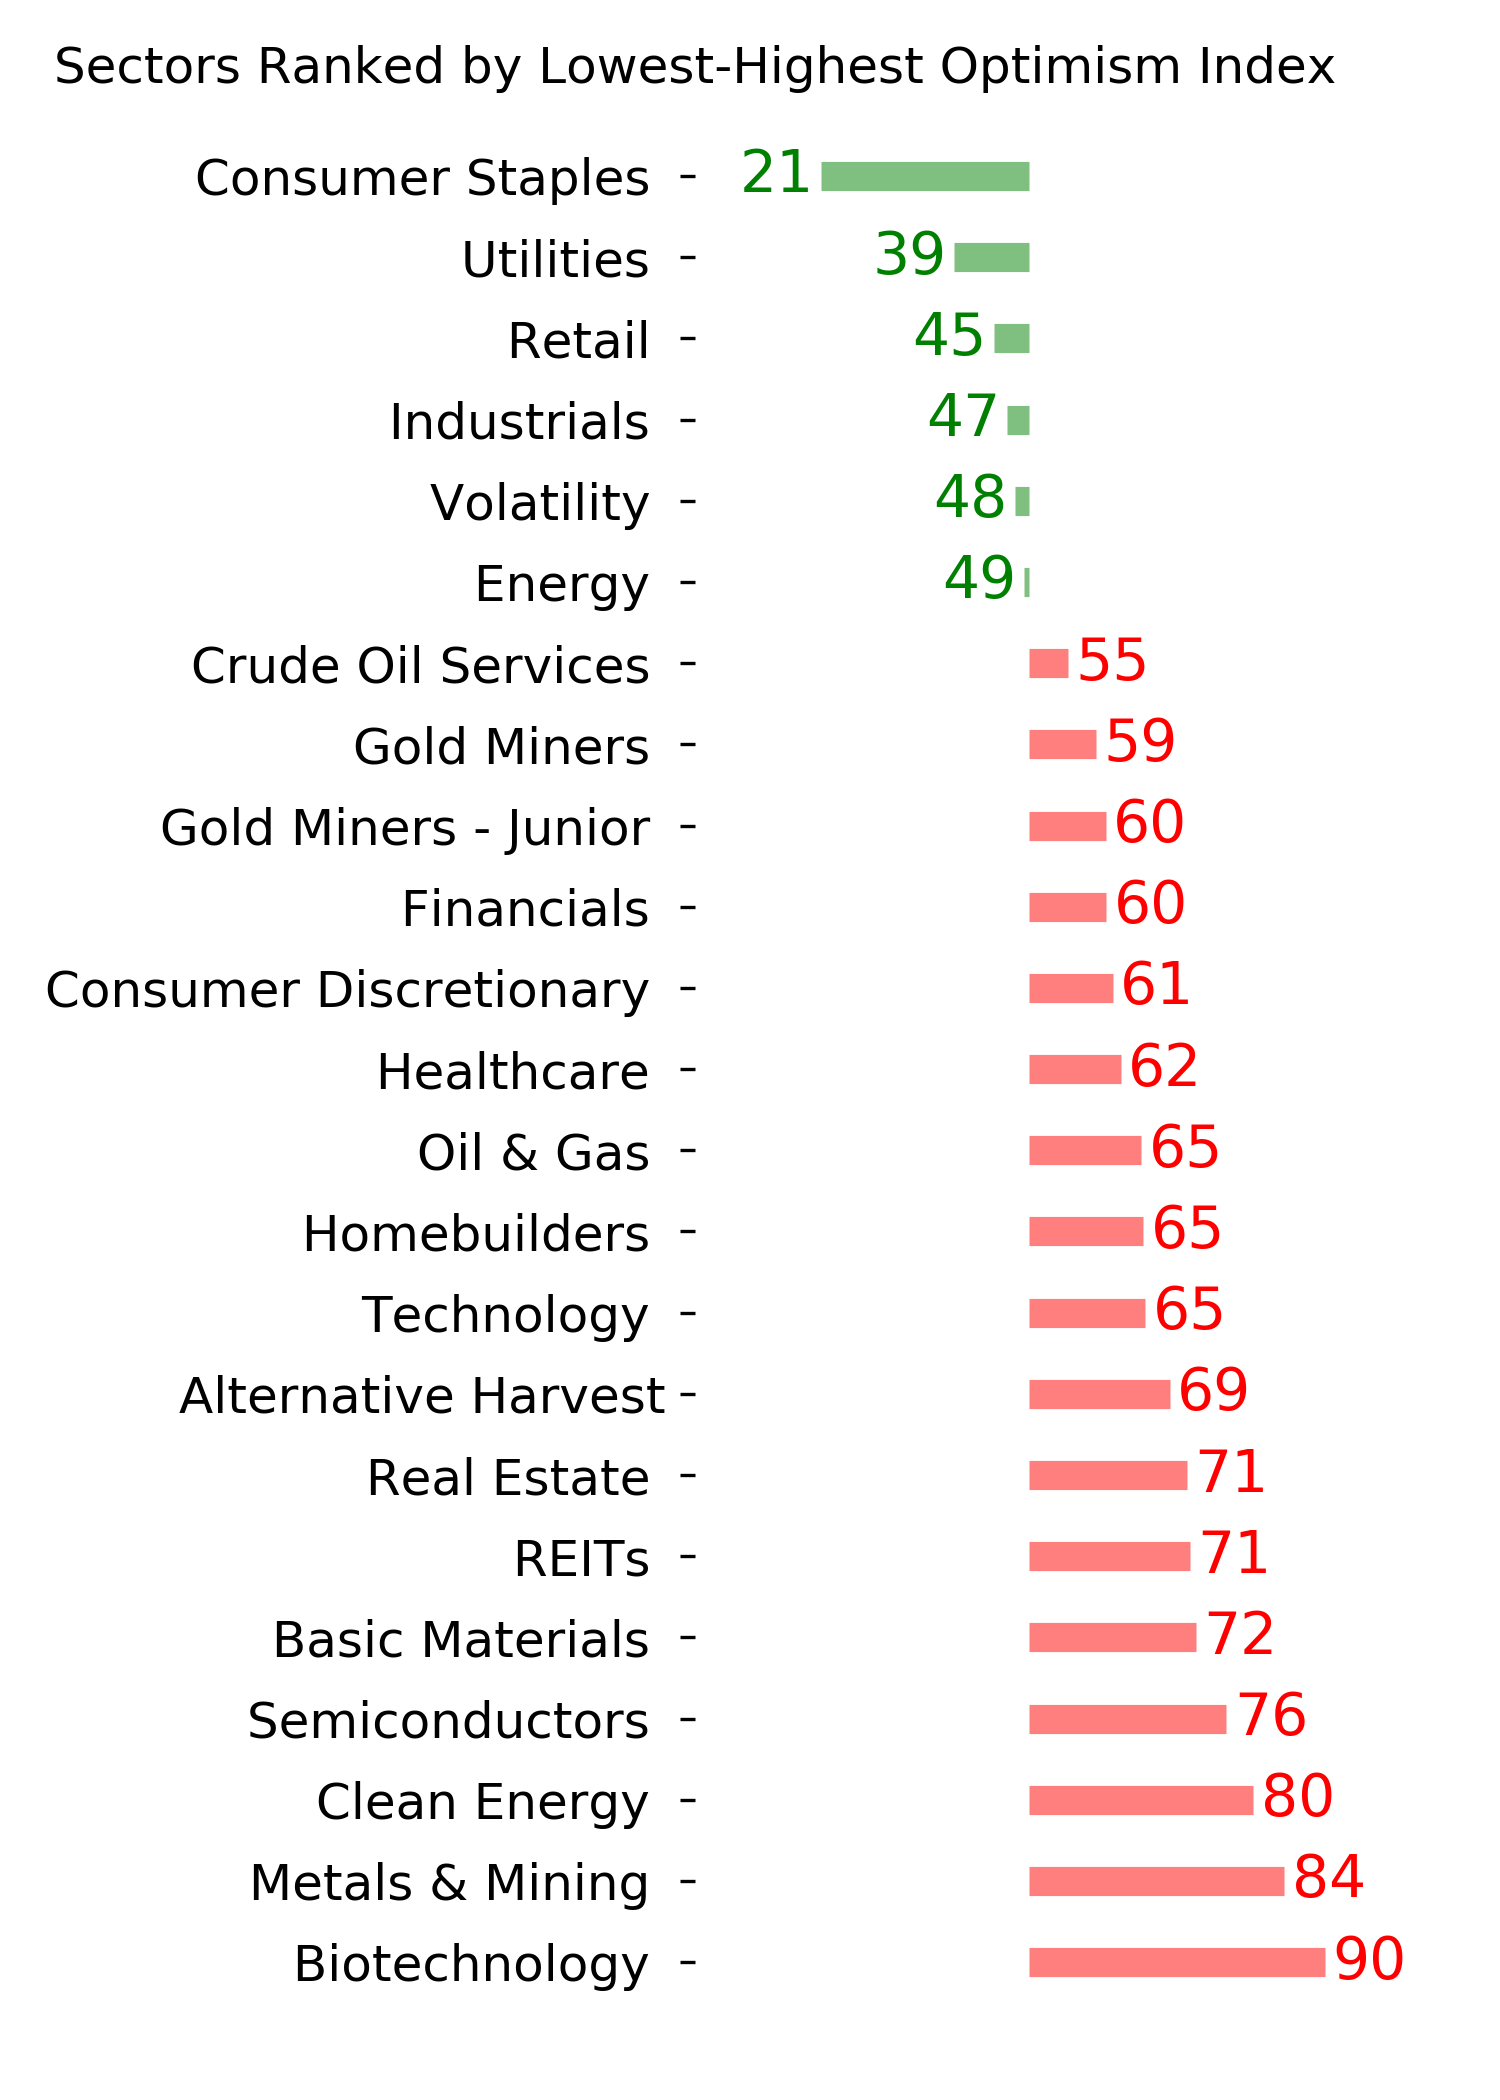
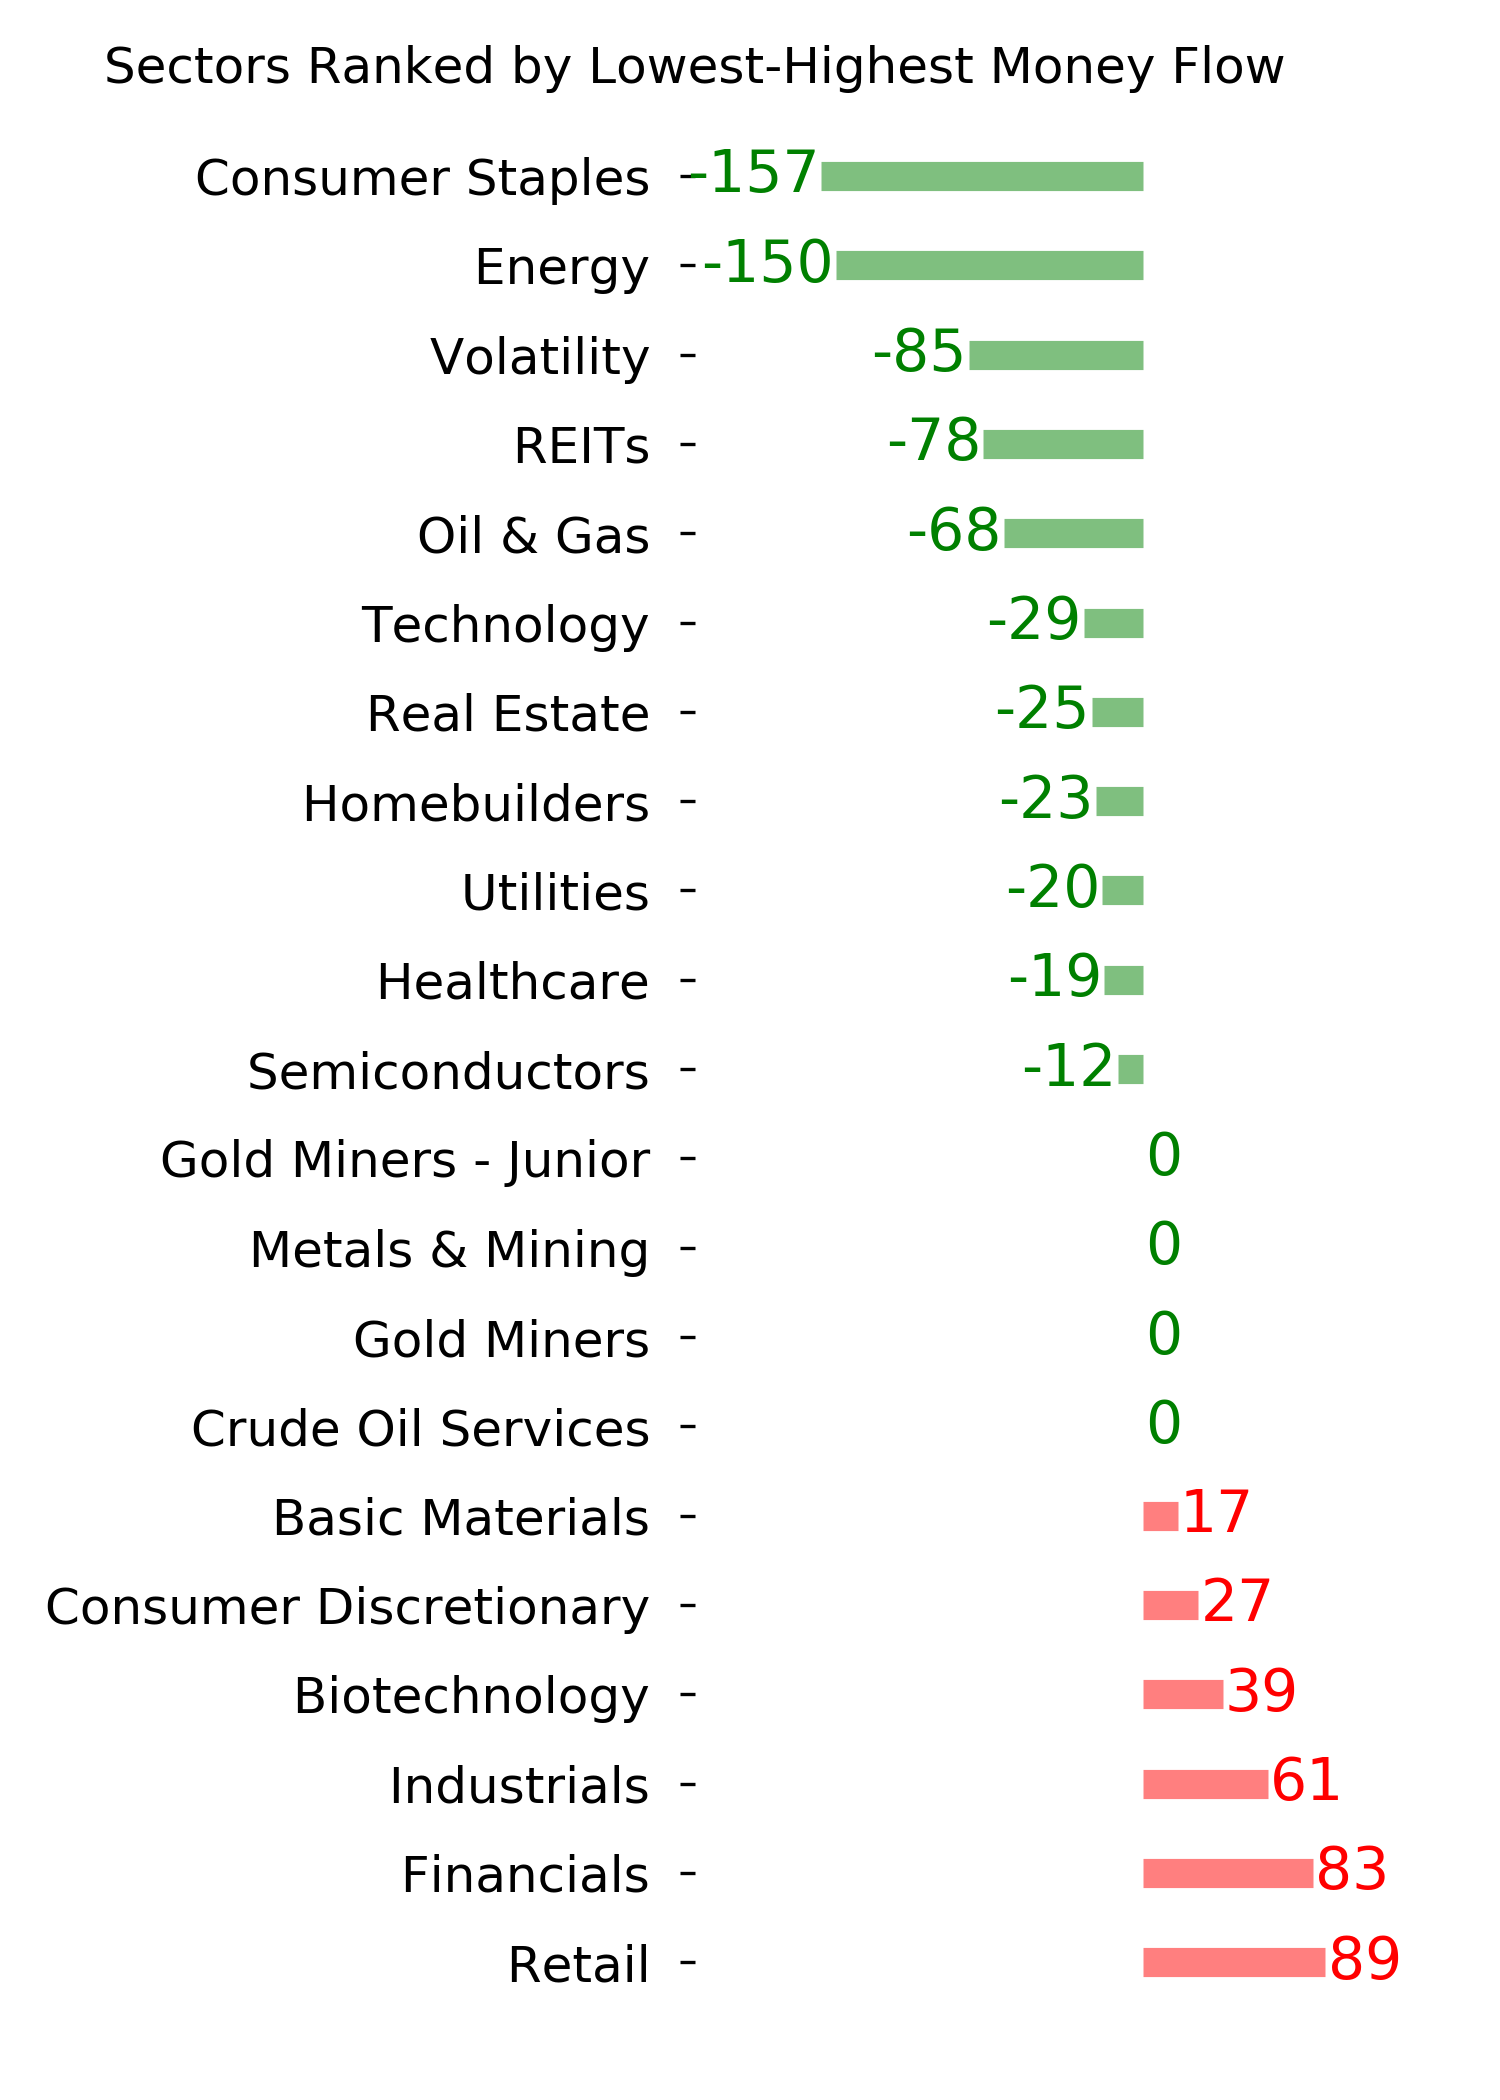
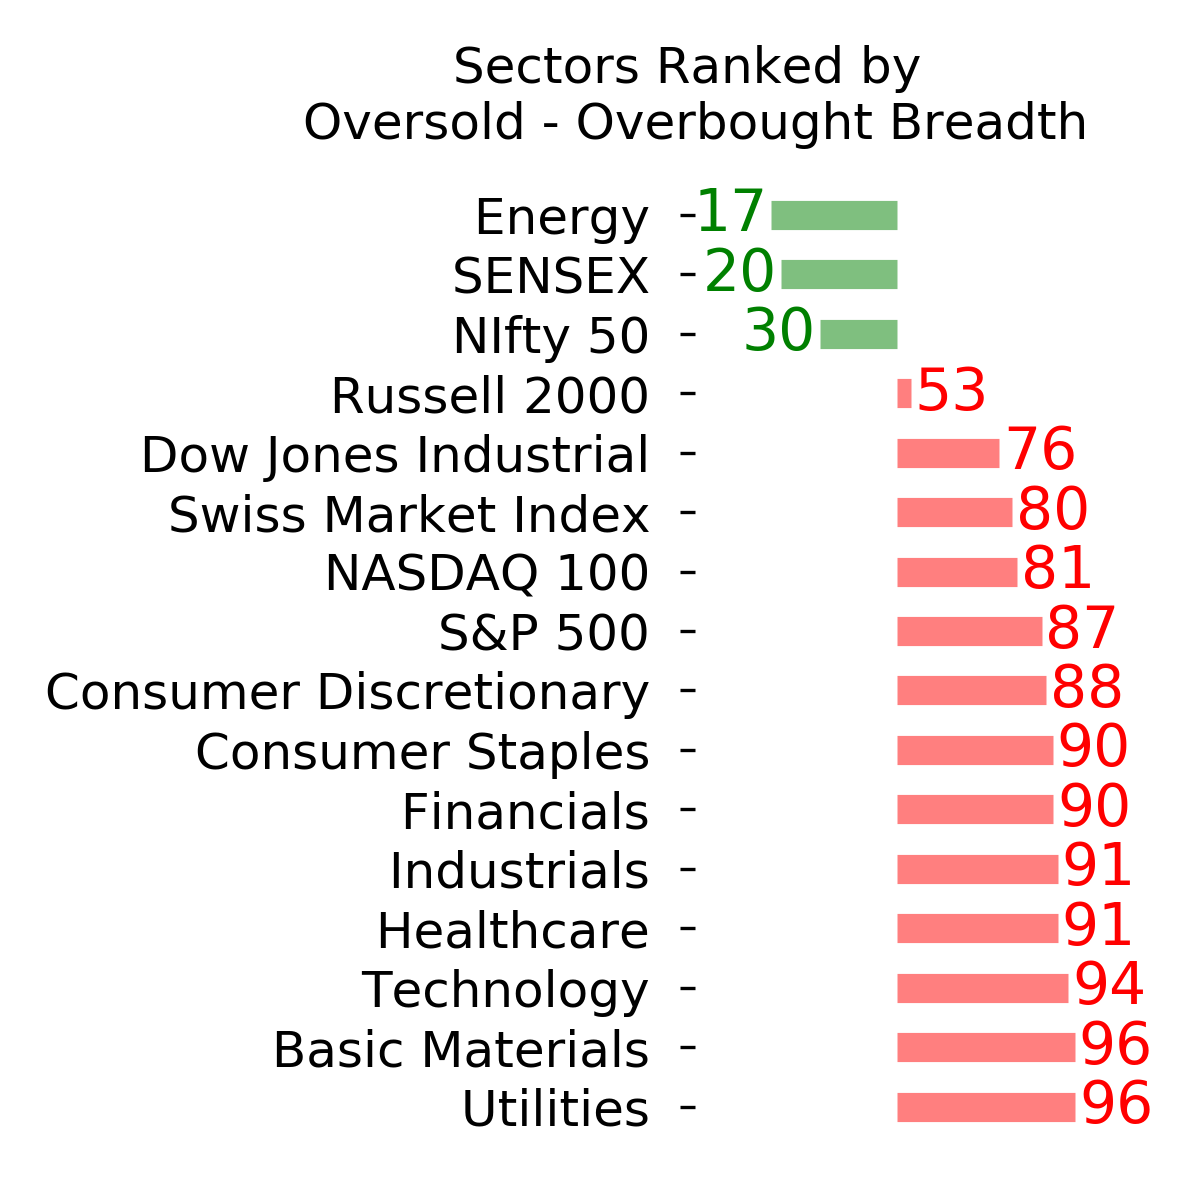
Ranks
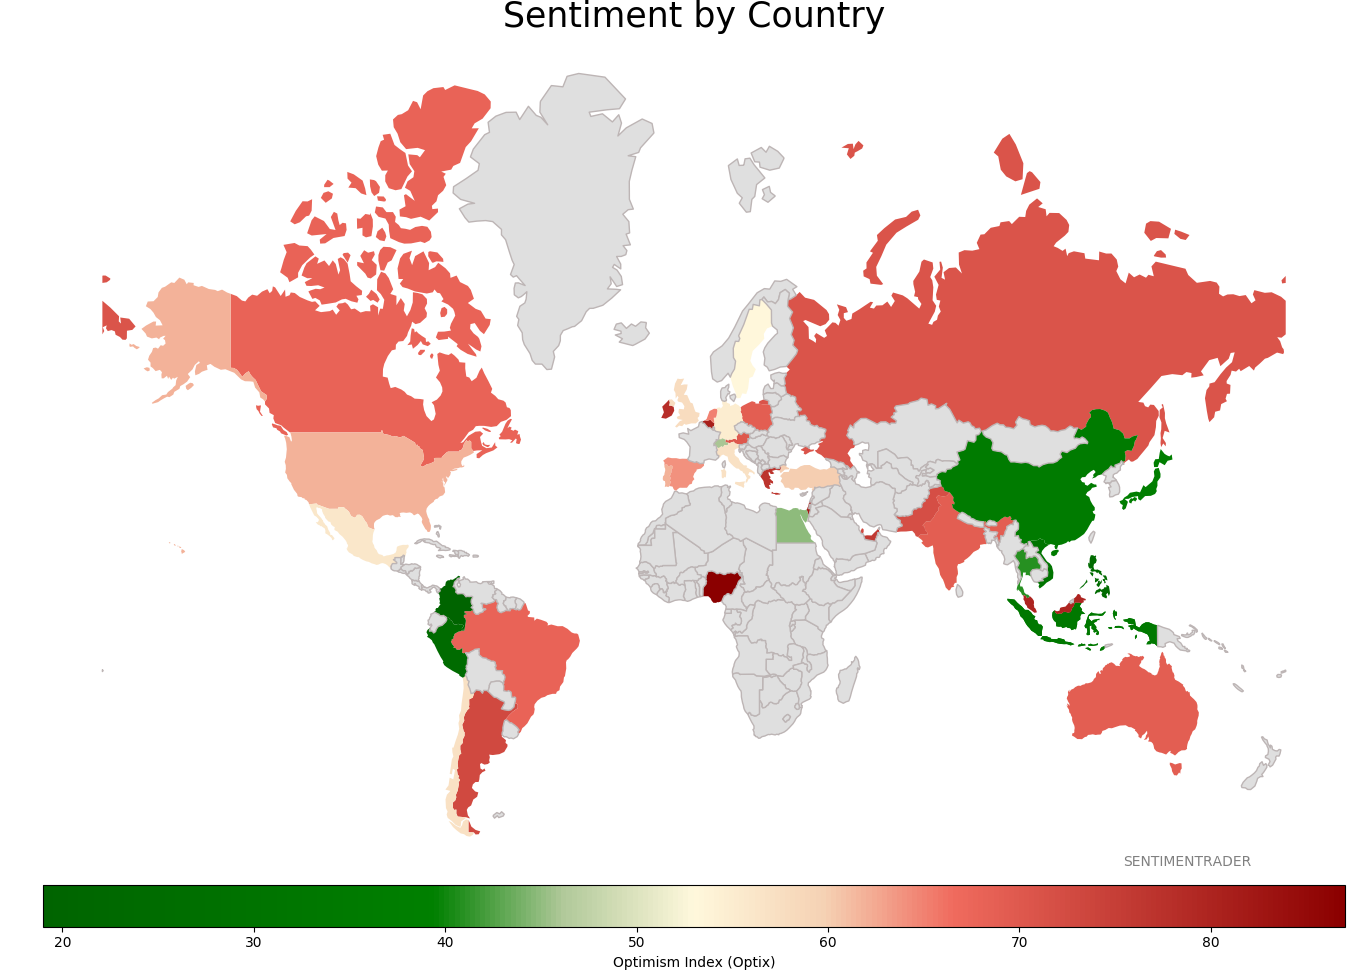
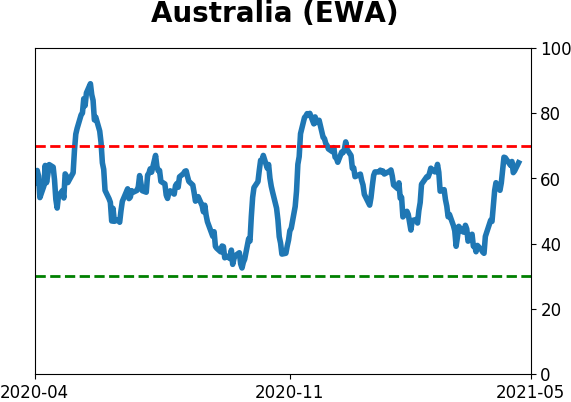
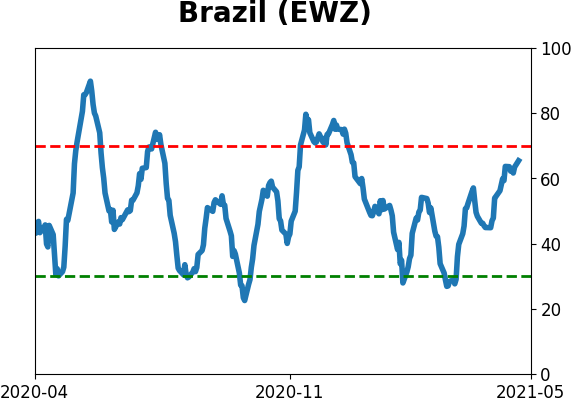
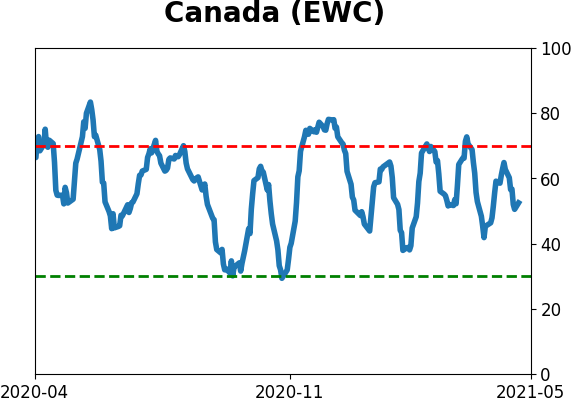
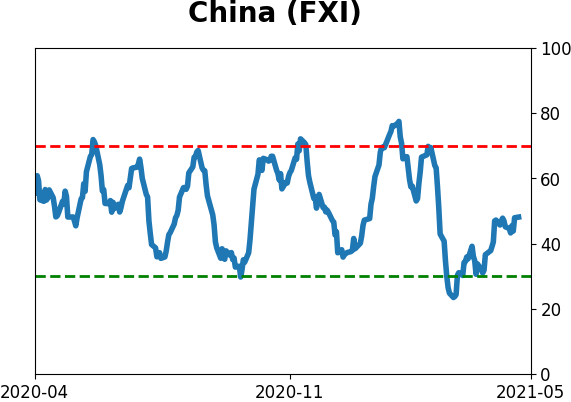
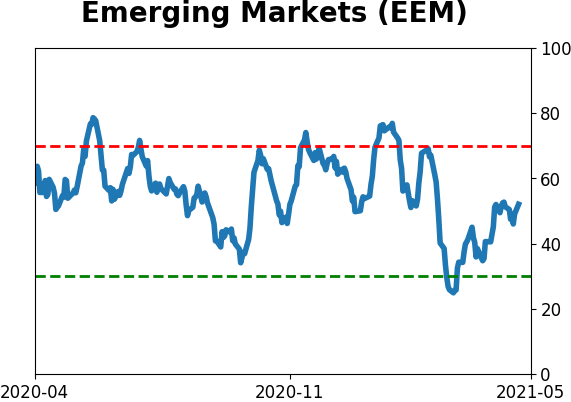
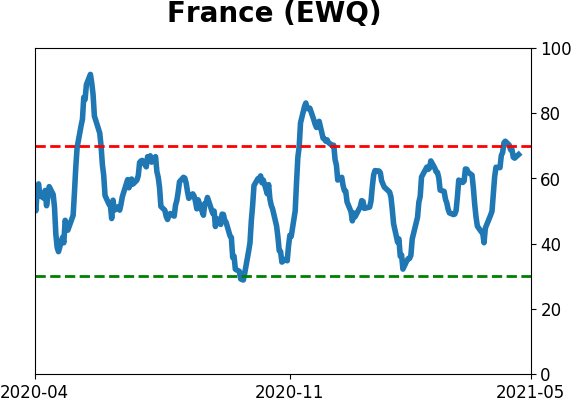
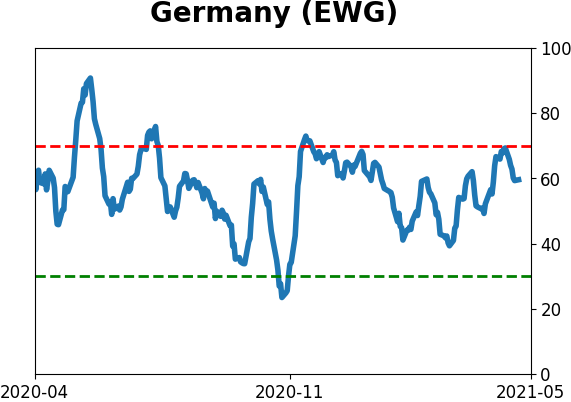
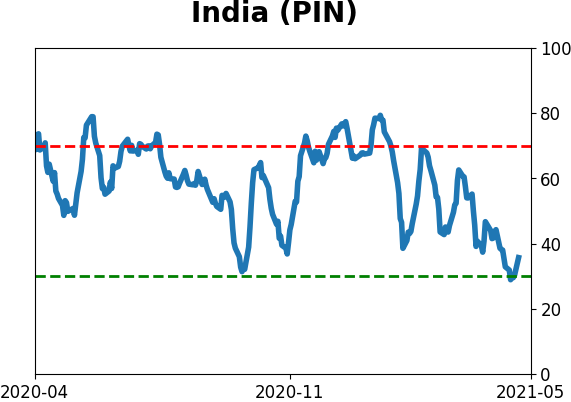
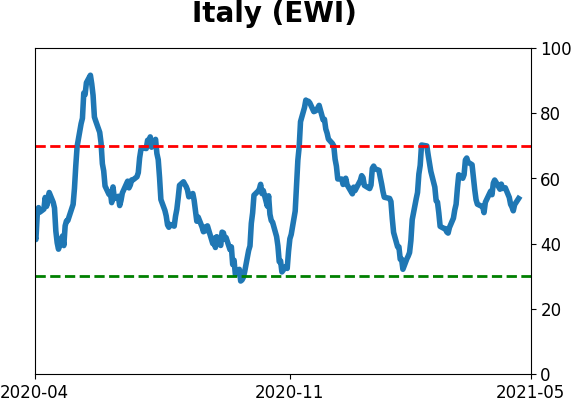
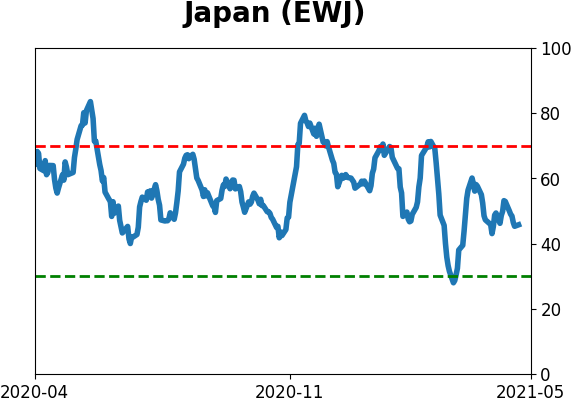
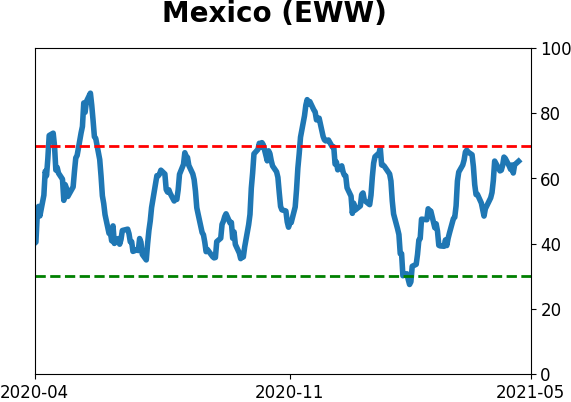
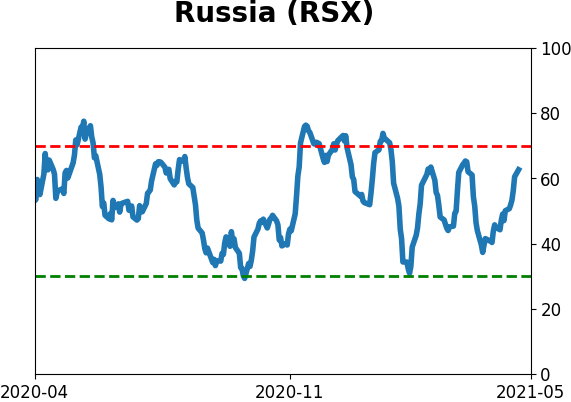
Sentiment Around The World
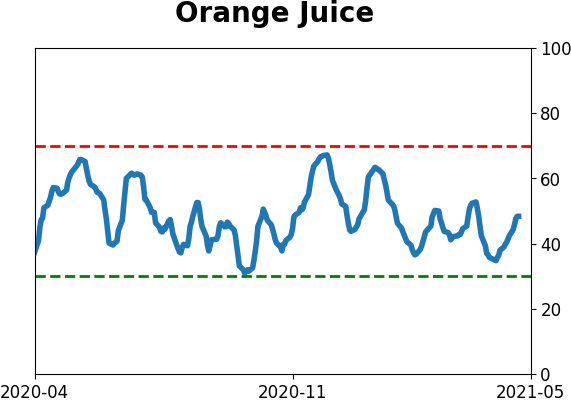
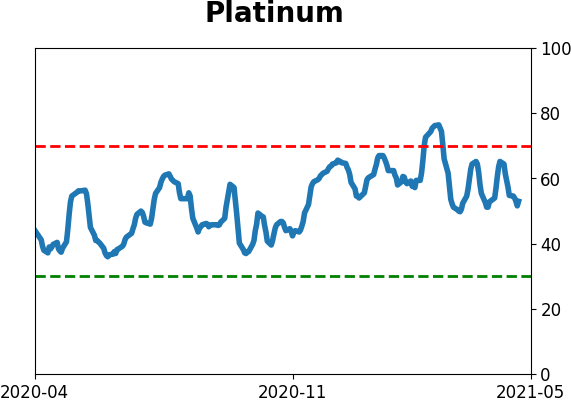
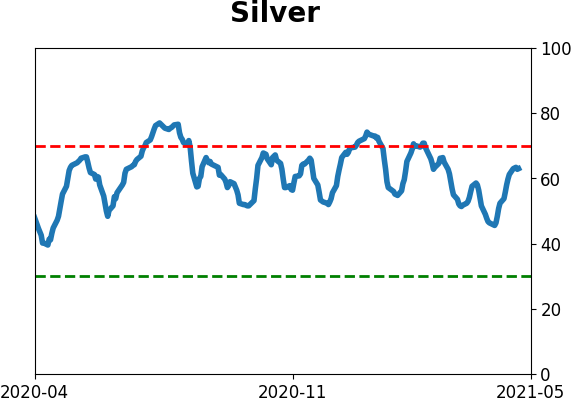
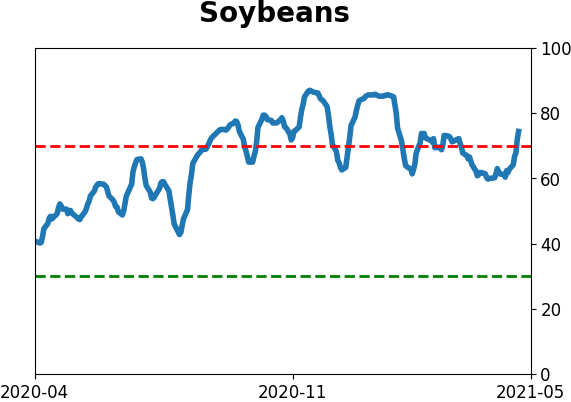
Optimism Index Thumbnails
|
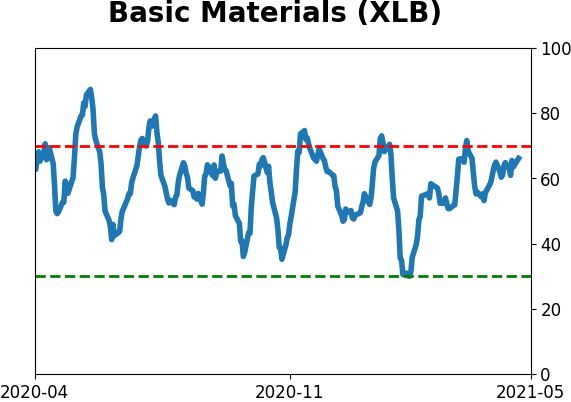
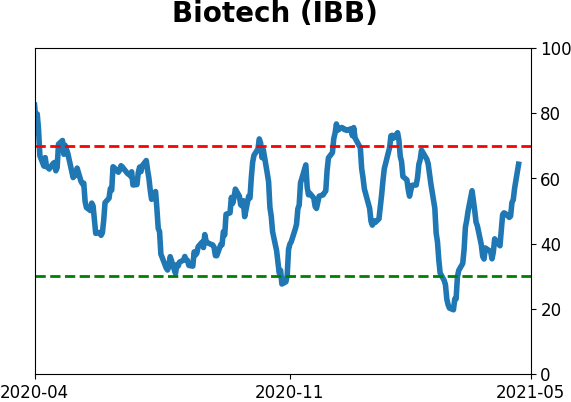
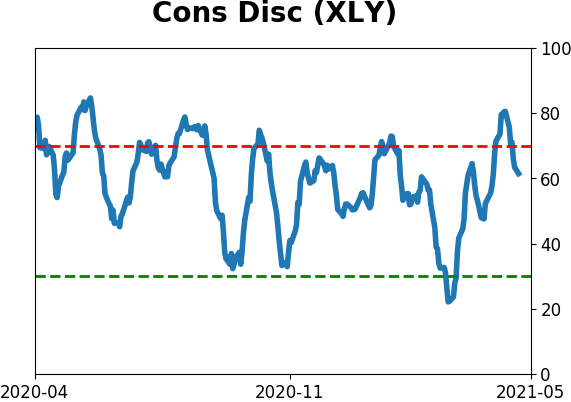
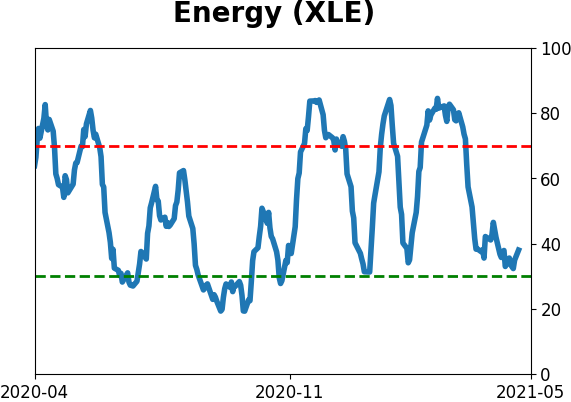
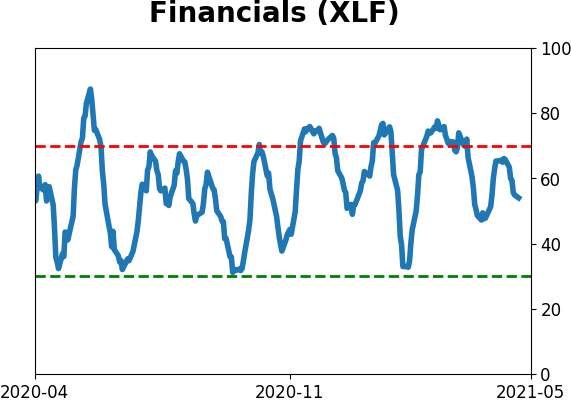
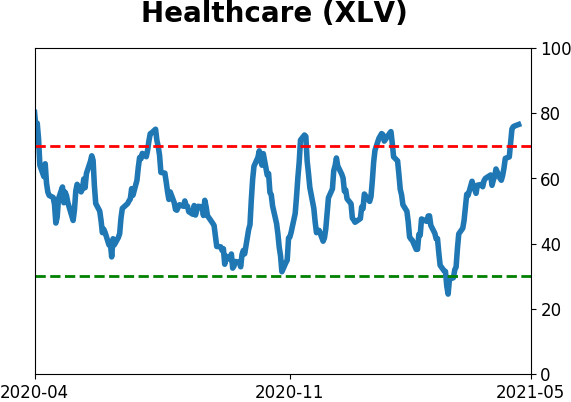
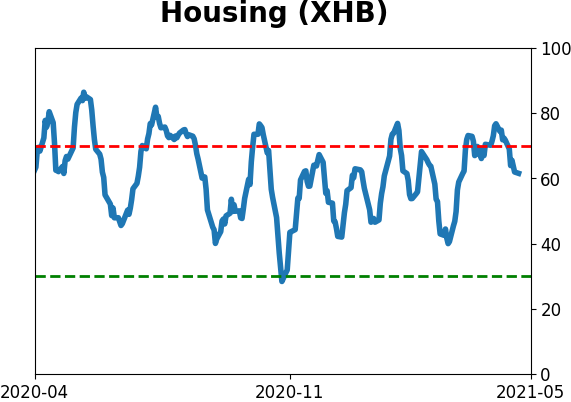
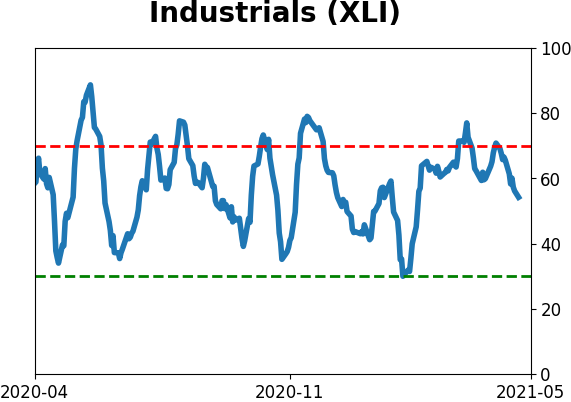
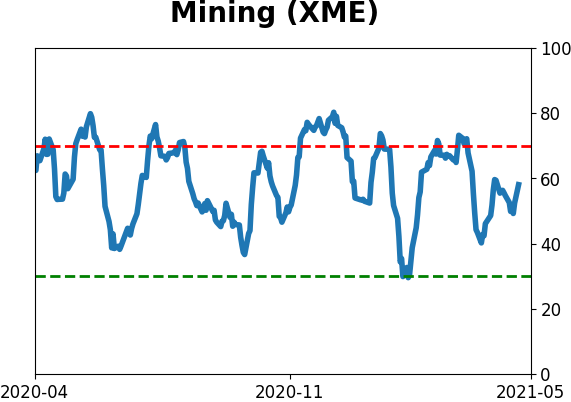
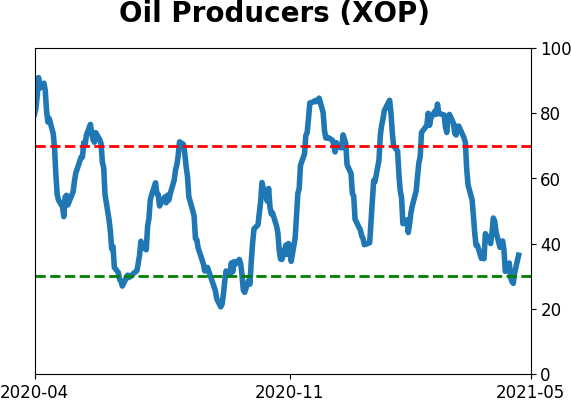
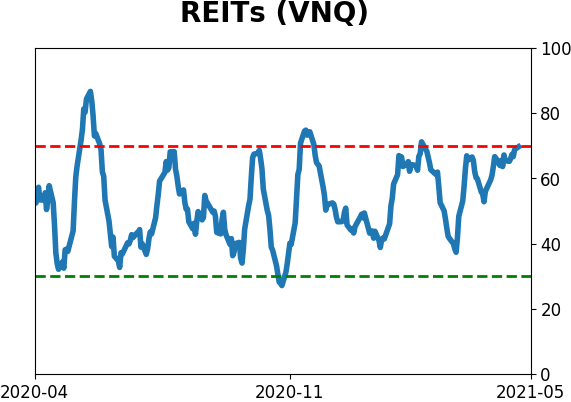
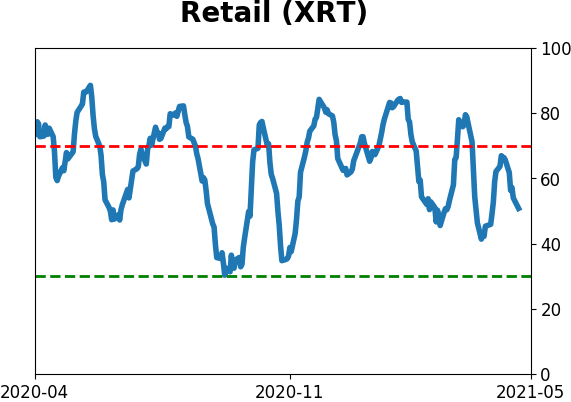
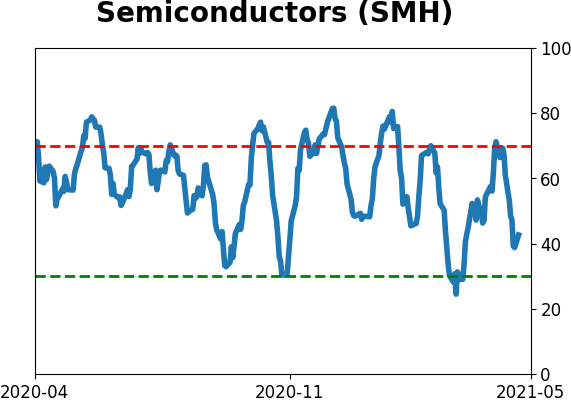
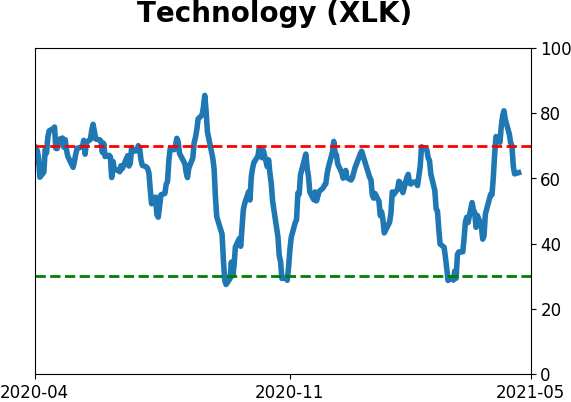
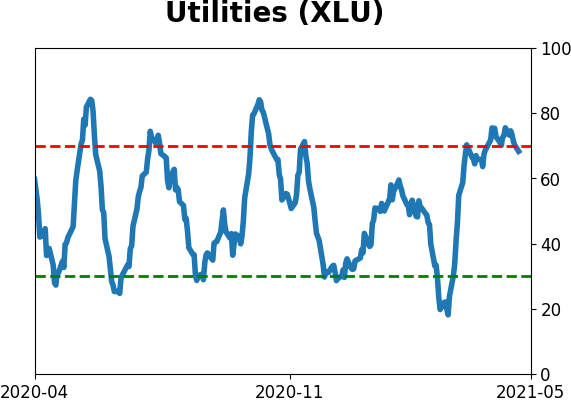
Sector ETF's - 10-Day Moving Average
|
|
|
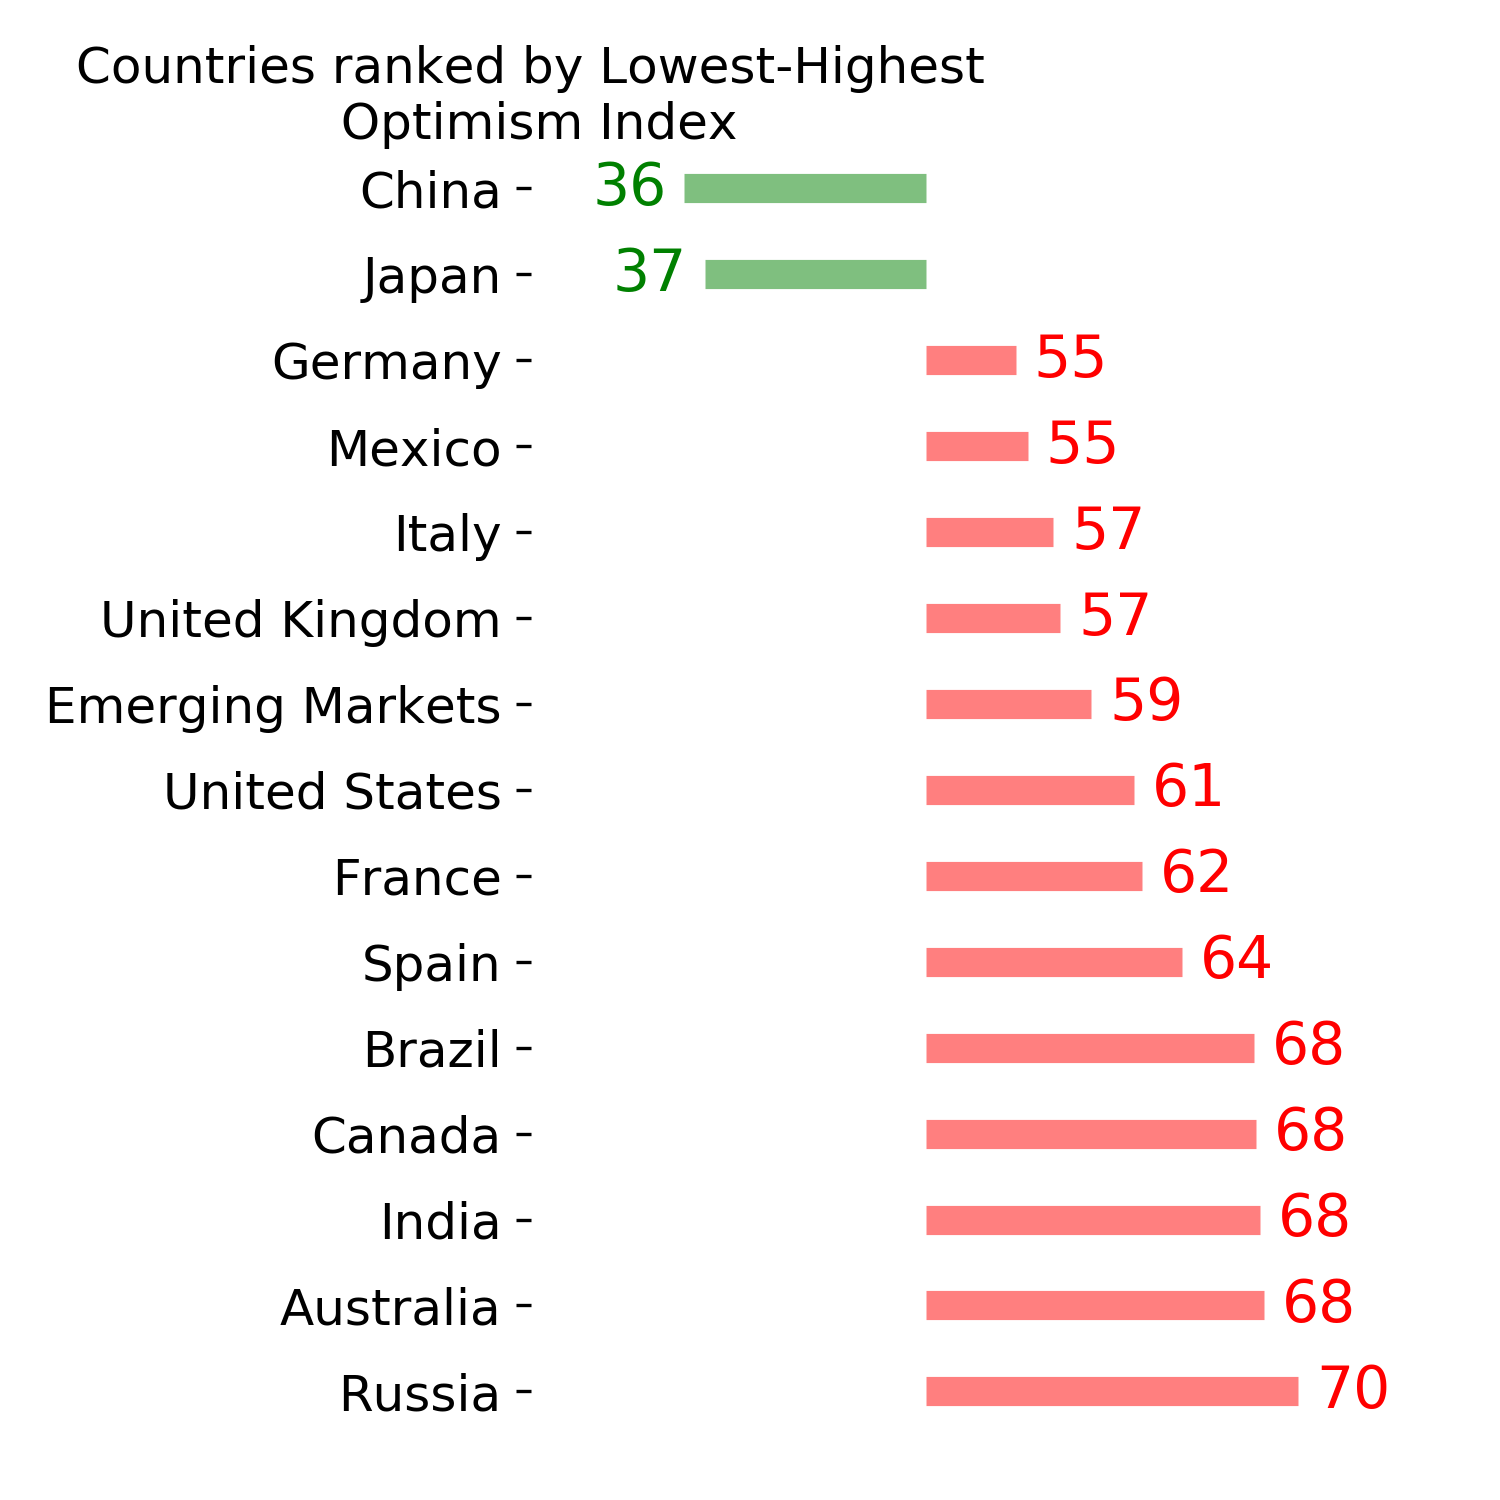
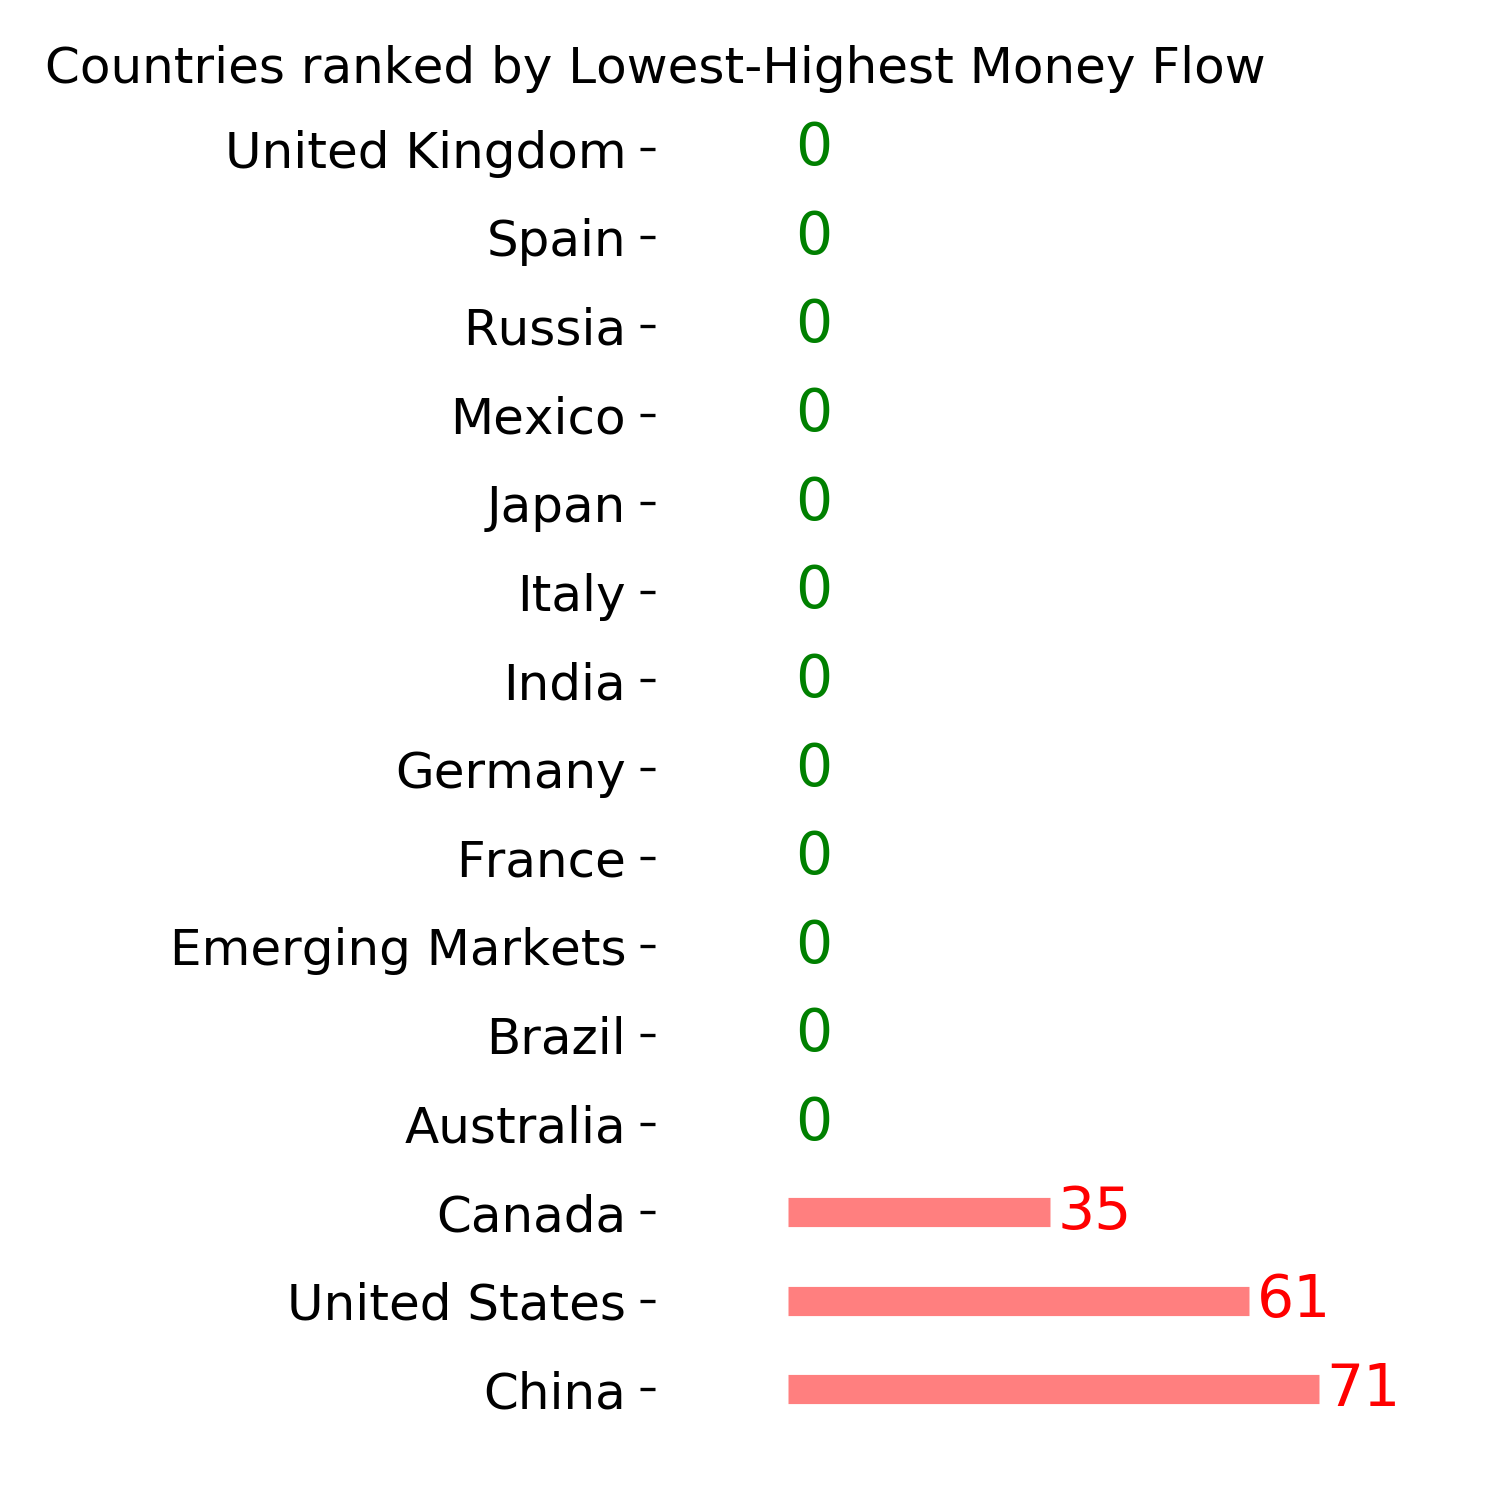
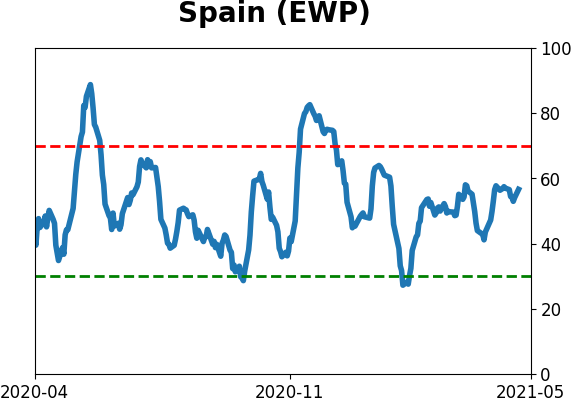
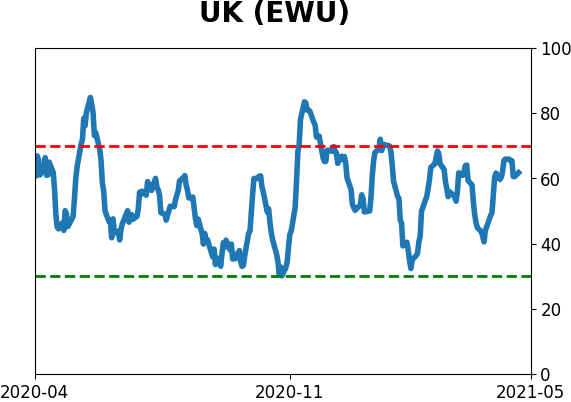
Country ETF's - 10-Day Moving Average
|
|
|
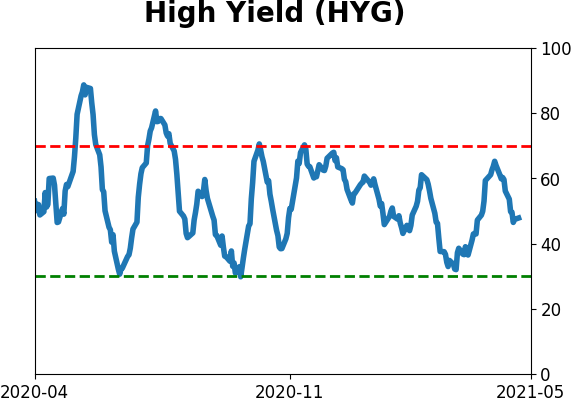
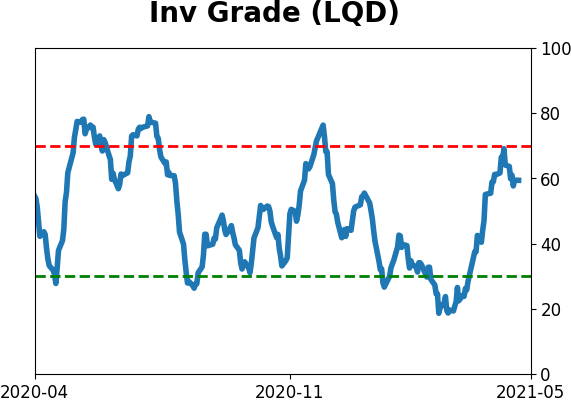
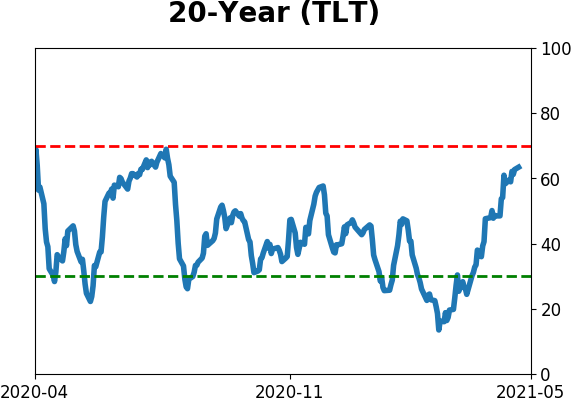
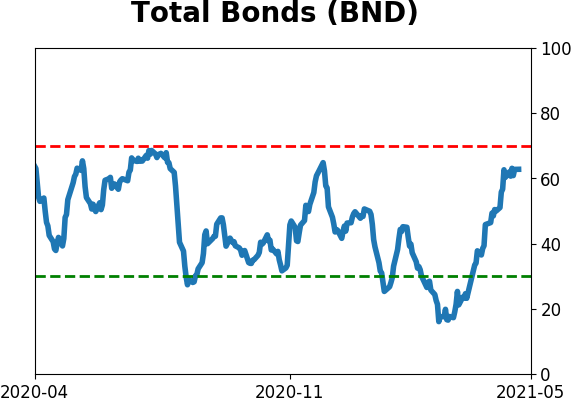
Bond ETF's - 10-Day Moving Average
|
|
|
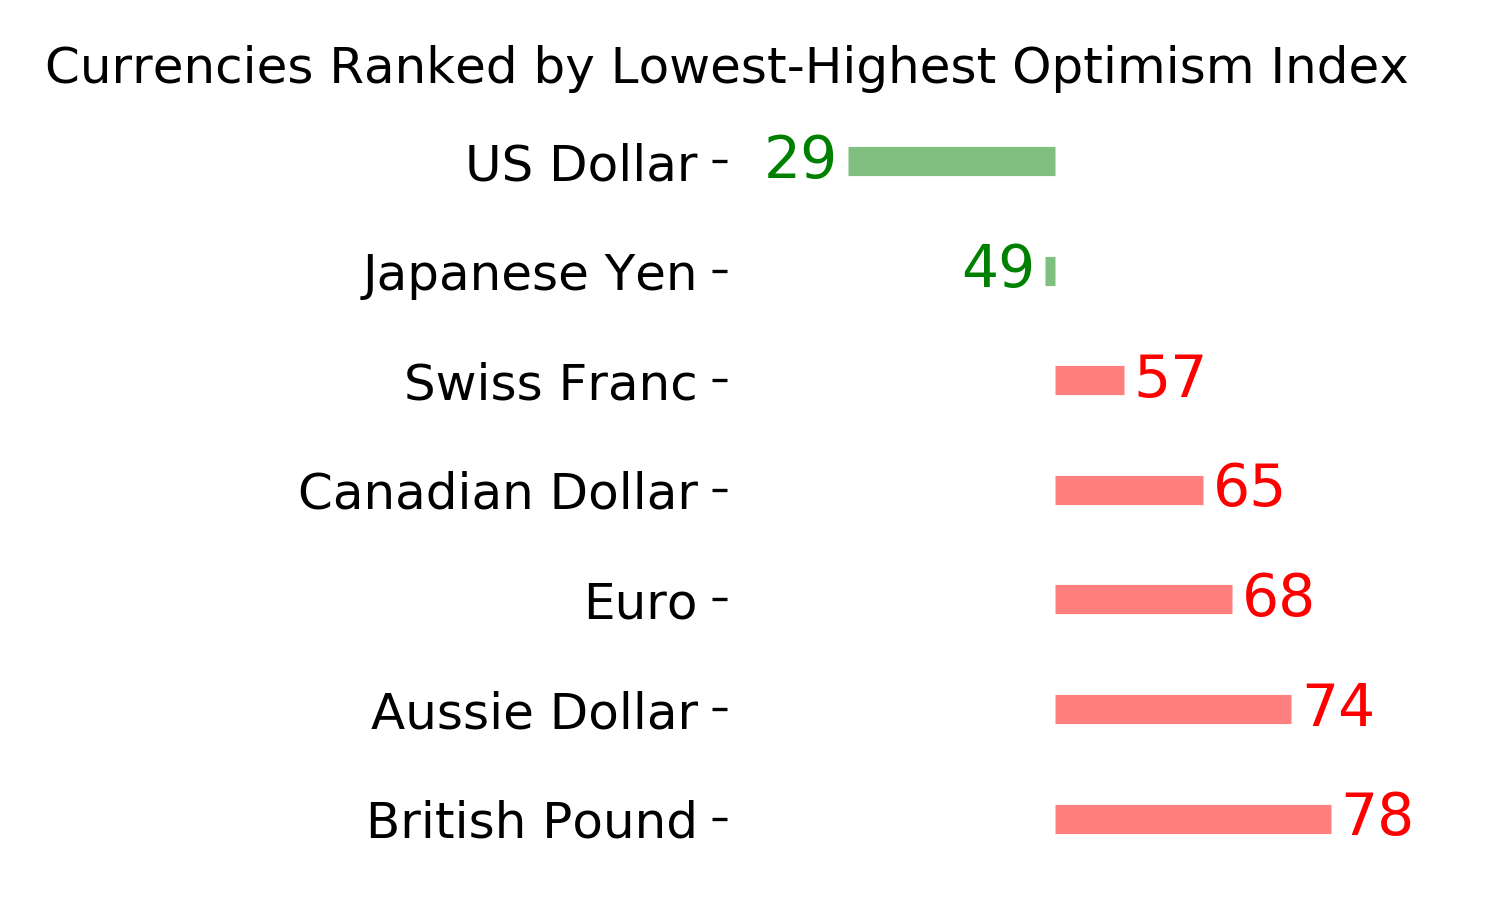
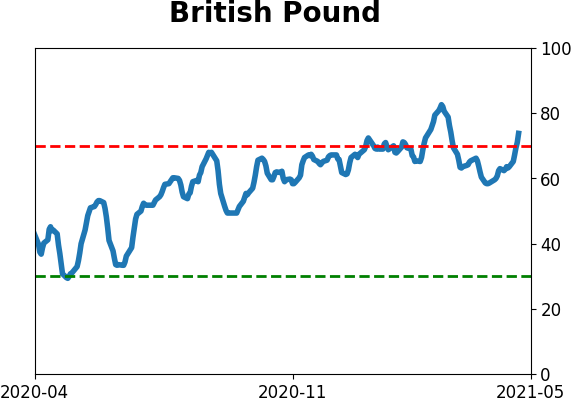
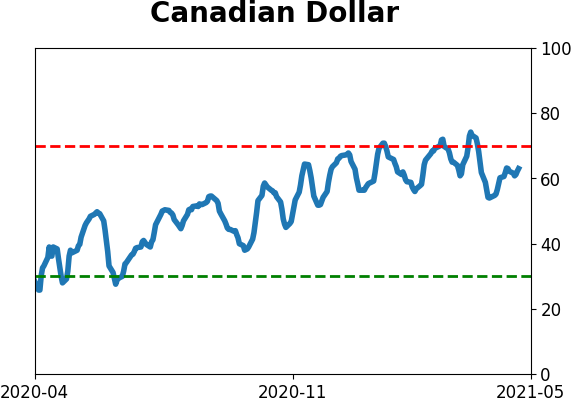
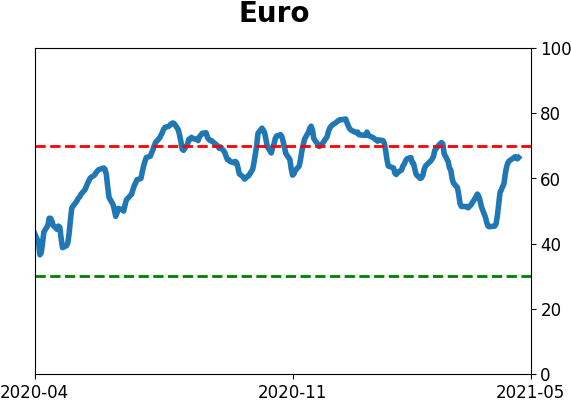
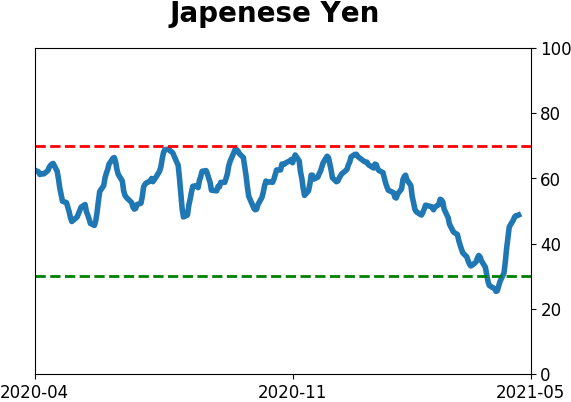
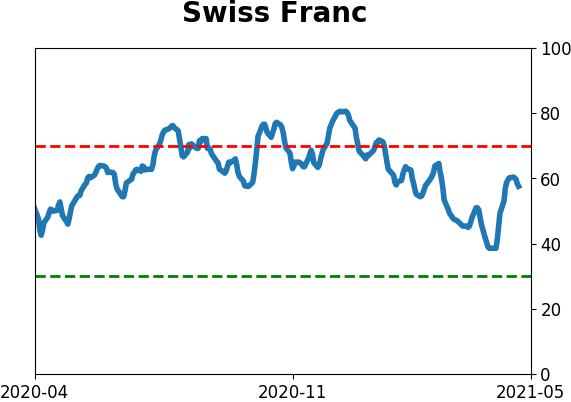
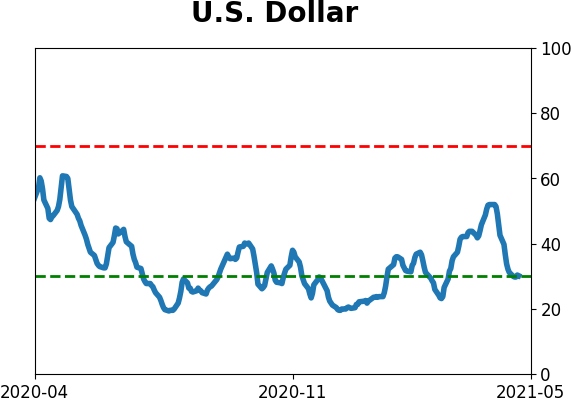
Currency ETF's - 5-Day Moving Average
|
|
|
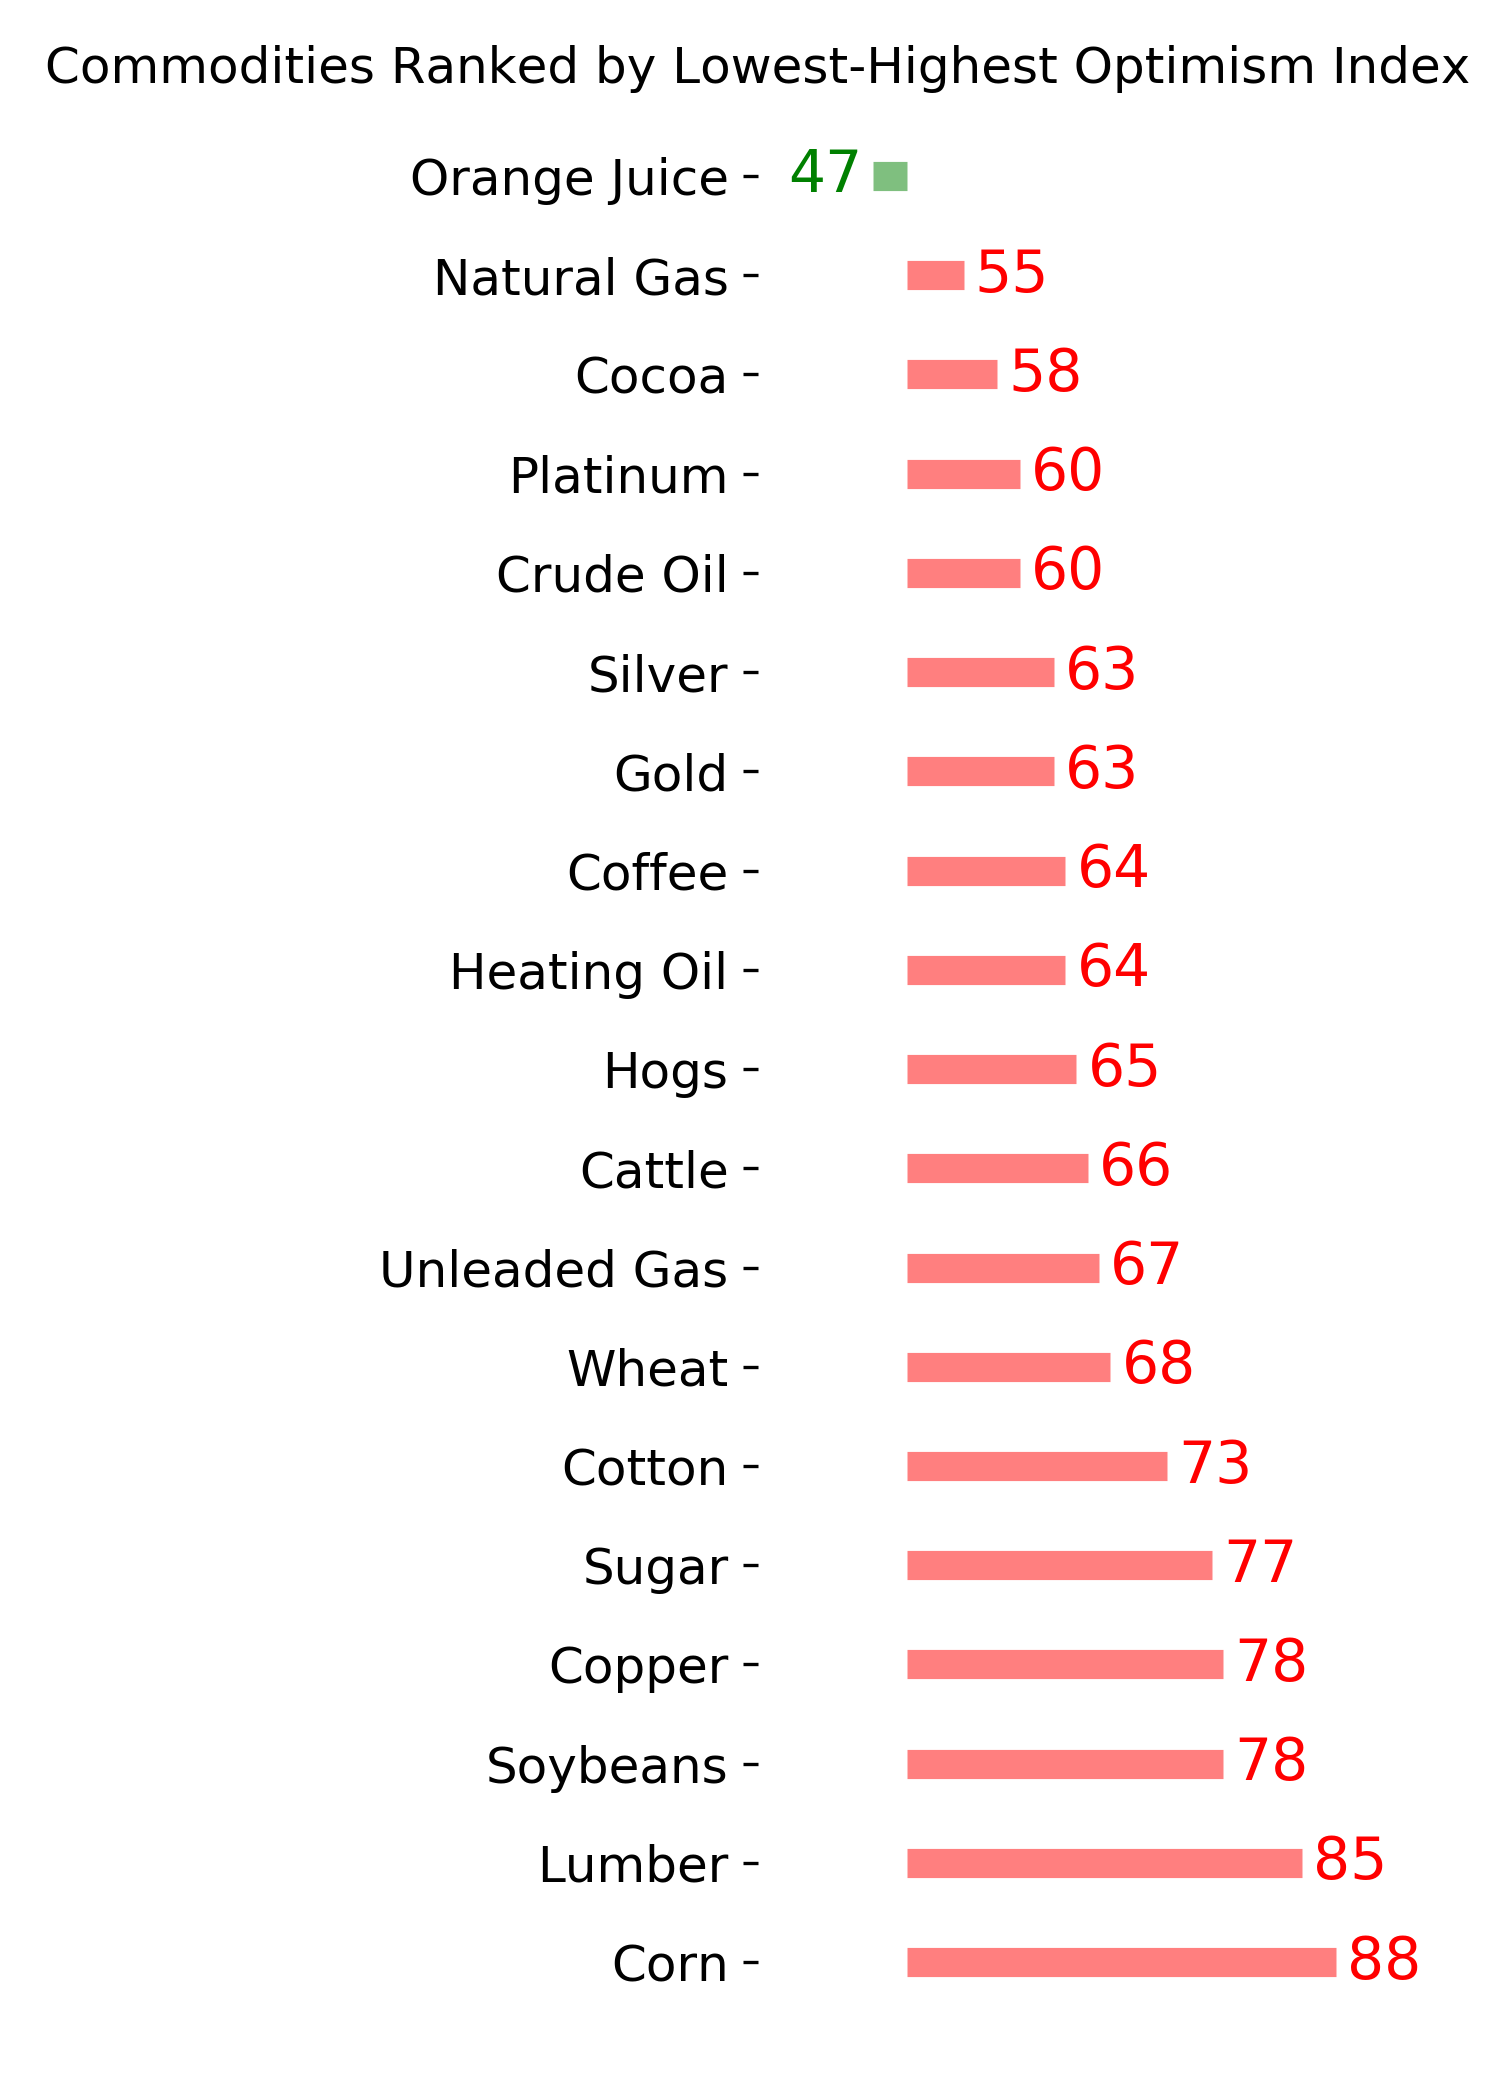
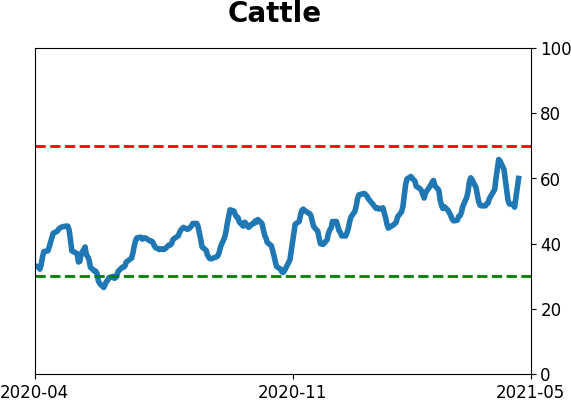
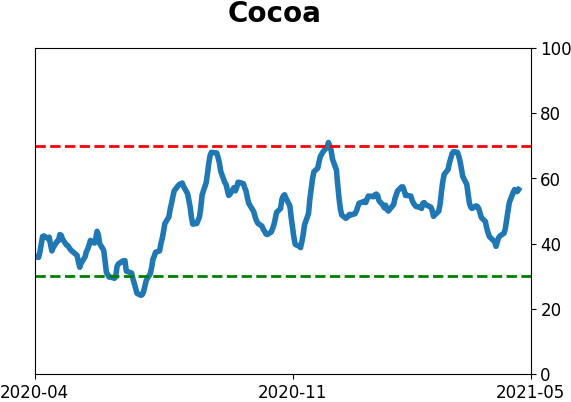
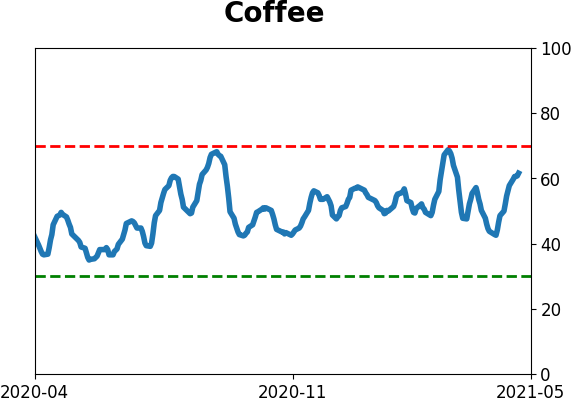
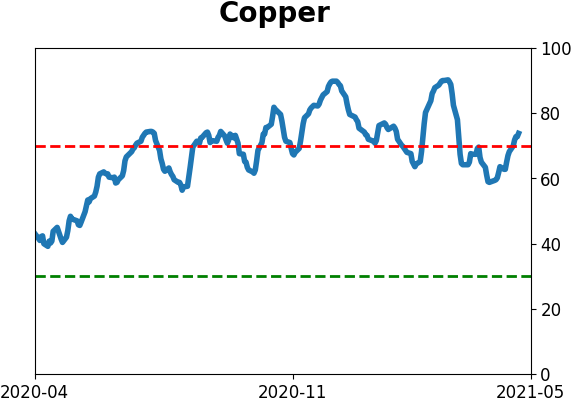
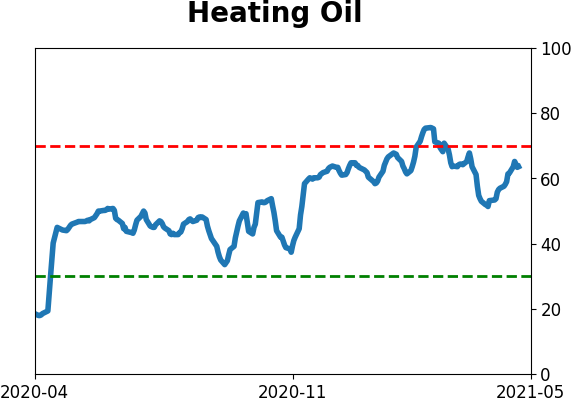
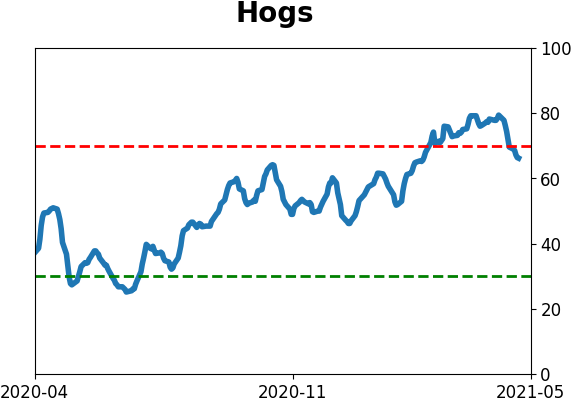
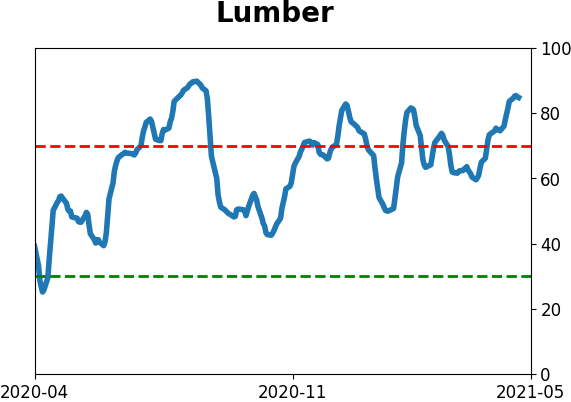
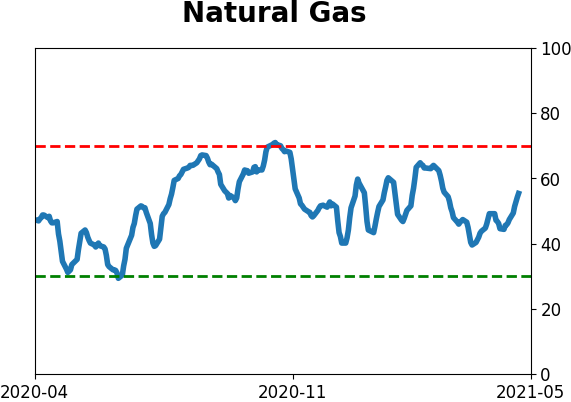
Commodity ETF's - 5-Day Moving Average
|
|